300 cities virtual experiment - casos
TRANSCRIPT
300 Cities Virtual Experiment
Jessica McGillen, Michael K. Martin, Dawn Robertson,
Neal Altman, and Kathleen M. Carley September 2009
CMU-ISR-09-123
Institute for Software Research
School of Computer Science
Carnegie Mellon University
Pittsburgh, PA 15213
Center for the Computational Analysis of Social and Organizational Systems
CASOS technical report.
This work was supported in part by the Internal Revenue Service project, under OPERA, for work in Computational
Modeling. In addition support for Construct was provided in part by Office of Naval Research (N00014-06-1-0104),
and the Air Force Office of Sponsored Research (MURI: Cultural Modeling of the Adversary, 600322) for research
in the area of dynamic network analysis. Additional support was provided by CASOS - the center for Computational
Analysis of Social and Organizational Systems at Carnegie Mellon University. The views and conclusions contained
in this document are those of the authors and should not be interpreted as representing the official policies, either
expressed or implied, of the Internal Revenue Service, the Office of Naval Research, the Air Force Office of
Sponsored Research or the U.S. government.

Keywords: IRS, Tax, Taxpayers, Multi-agent modeling, Intentional error, Inadvertent error, Paid
preparers, Virtual experiment, Construct, SmartCard
iii
Abstract
This report provides an overview of the preparations required for the virtual experiment we will
conduct for the IRS as part of the 300 cities subproject. We briefly describe the tax gap and
taxpayer issues, our revised approach, the Construct framework and the models developed for
the multi-agent simulation. Where appropriate, we provide references to other technical reports
that describe in more detail the models for intentional and inadvertent taxpayer errors, and paid
preparers. We also briefly describe how we populate Construct with agents representative of the
populations of U.S. cities by sampling from U.S. census data, deriving relevant taxpayer issues
for each agent, generating empirically reasonable social networks for each agent, and building
Construct input decks automatically. The generation of social networks based on the socio-
demographic attributes of individuals found in census data is an advance worthy of the more
detailed description found yet another technical report. We then briefly describe the design and
anticipated analysis of the 300 cities virtual experiment. We conclude with a brief reference to
the SmartCard application that will be used to deliver the results of the virtual experiment along
with socio-demographic information and taxpayer issues for each of the cities. Details of the
implementation of the SmartCard can be found in the referenced report.

iv
v
Table of Contents
1 Introduction ................................................................................................................. 1
1.1 Initial exploration of the problem ..................................................................................... 1
1.2 Current approach .............................................................................................................. 2
1.3 Pros and cons of virtual cities .......................................................................................... 2
2 The 300 Cities VE: Design .......................................................................................... 3
2.1 Framework ....................................................................................................................... 3
2.2 Agents............................................................................................................................... 3
2.2.1 Taxpayers .................................................................................................................. 3
2.2.2 Tax preparers ............................................................................................................ 9
2.2.3 IRS educational services ........................................................................................... 9
2.2.4 Non-IRS information sources ................................................................................... 9
2.3 Network structure ........................................................................................................... 10
2.3.1 Spheres of influence ................................................................................................ 10
2.3.2 Social proximity ...................................................................................................... 10
3 The 300 Cities VE: Simulation Pipeline.................................................................... 11
3.1 Overlaying social networks ............................................................................................ 11
3.2 Building the Construct input deck .................................................................................. 12
3.3 Running the virtual experiment ...................................................................................... 13
4 The 300 Cities VE: Descriptive Analysis .................................................................. 14
5 References ................................................................................................................. 20

vi
1
1 Introduction
Every year the tax gap presents a problem for the IRS on a scale of millions of dollars. While the
tax gap is complex, two important factors contributing to it are unintentional errors by taxpayers
or paid preparers, in which people lack information necessary for compliance, and intentional tax
avoidance schemes. These factors can be broken down by annual tax form line item into
problems commonly seen by the IRS, as shown in Table 1.
Table 1: Common tax issues by line item [12]
Item Line number Issue
Income from tips 7 Underreporting
File schedule C 12, 27-29, 40, 58 Underreporting
Earned income tax credit 61, 66a-b Incorrect
application
Student loan interest deduction 33 Overreporting
Capital gains/new house 9a-b, 13, SD, form
8615
Underreporting
Own/live on a farm 18, 45, SF, SJ Incorrect
application
Social Security benefits (age,
disability)
20a Underreporting
One half of self-employment tax 27 Overreporting
To boost correct filing of tax forms and close the tax gap, the IRS can implement a variety of
educational services in problem areas, including websites, help centers, and phone services, and
can choose appropriate services or bundles of services according to the needs and socio-
demographic characteristics of geographic areas (e.g., cities). Determining optimal education
strategies is difficult, however, because of the size and heterogeneity of cities and the complexity
of the involved tax issues. In addition, the effectiveness of services provided in bundles is not
necessarily additive; some combinations are synergistic, while others appear to have combined
effects that run counter to the goal of increased education. Service effectiveness depends on the
spread of new information through a population which in turn depends on a complicated web of
social connections. Consequently, a large-scale, sophisticated analysis is needed that can
accommodate taxpayers, their decisions and interactions with one another, and the dissemination
of information through communities. This report describes our efforts to forecast service
effectiveness via multi-agent simulation.
1.1 Init ial exploration of the problem
Our initial analysis of U.S. cities and the tax gap focused on a priori clustering – that is,
identifying clusters into which cities could fall based on their socio-demographic and socio-
economic characteristics deemed relevant to compliance, prior to running any simulations. The
primary purpose of this effort was to conserve computational time and resources. Identifying
canonical groups of cities would have allowed us to simulate how stylized cities that represent
distinct types of cities responded to IRS educational interventions. We could have then
extrapolated findings to new cities of interest by determining their membership in canonical
groups.
2
Our a priori clustering approach involved three stages: first, computing social distance between
cities based on demographics of population, city summary metrics, and population heterogeneity
metrics; second, performing dynamic network analysis to identify clusters; and third, validating
the clusters via simulation. Our validation operated under the expectation that responses of intra-
cluster cities would be more similar than the responses of inter-cluster cities. We obtained two
key observations from this approach. First, region is not a predictor of clusters; and second, cities
appear idiosyncratic – to such an extent that coherent clusters failed to emerge even when several
different methods for computing social distances were tried [12]. Thus, we determined that time-
saving a priori clustering was not possible, and a full-scale simulation of all 297 cities would be
needed.
1.2 Current approach
While attempting the above a priori clustering, we discovered that we could move our Construct
simulations to the TeraGrid. This capability parallelizes our simulations, enabling us to run
replications up to 3000% faster than on our in-house computers. TeraGrid capability means we
can now pursue a more thorough simulation approach than was feasible previously.
In effect, we have the opportunity to “reverse” our approach. Rather than determining a priori
clusters based on socio-demographic variables presumed to be relevant to taxpayer compliance,
we can simulate how every one of our 297 cities responds to IRS services, then cluster cities
afterward according to their responses. If this clustering yields coherent groups of cities, we can
explore the cities’ socio-demographic characteristics to gain insight into why groups of cities
responded similarly.
In summary, while our old approach attempted to cluster cities based on characteristics that we
imposed because we believed them important, our new approach – called the 300 Cities Virtual
Experiment (VE) – will simulate information diffusion and taxpayer behavior in 297 U.S. cities
on a large and highly detailed scale, cluster those cities based on similarities in their tax
responses, and identify meaningful emergent characteristics.
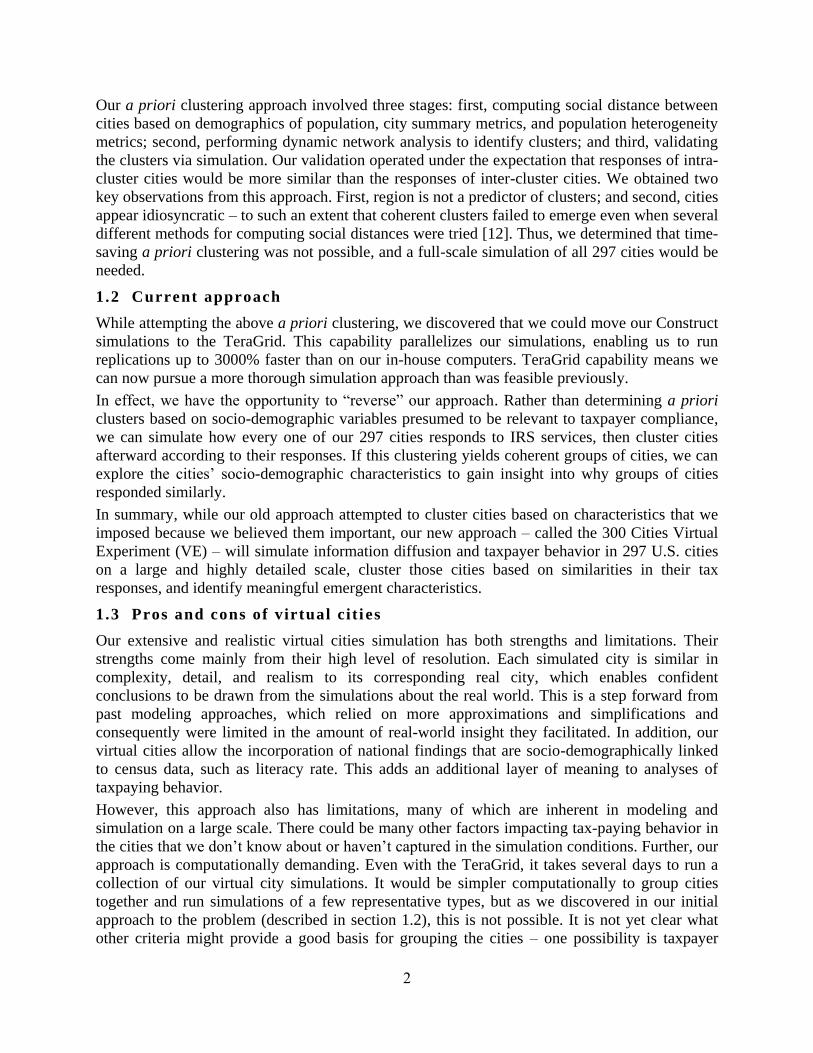
1.3 Pros and cons of virtual ci t i es
Our extensive and realistic virtual cities simulation has both strengths and limitations. Their
strengths come mainly from their high level of resolution. Each simulated city is similar in
complexity, detail, and realism to its corresponding real city, which enables confident
conclusions to be drawn from the simulations about the real world. This is a step forward from
past modeling approaches, which relied on more approximations and simplifications and
consequently were limited in the amount of real-world insight they facilitated. In addition, our
virtual cities allow the incorporation of national findings that are socio-demographically linked
to census data, such as literacy rate. This adds an additional layer of meaning to analyses of
taxpaying behavior.
However, this approach also has limitations, many of which are inherent in modeling and
simulation on a large scale. There could be many other factors impacting tax-paying behavior in
the cities that we don’t know about or haven’t captured in the simulation conditions. Further, our
approach is computationally demanding. Even with the TeraGrid, it takes several days to run a
collection of our virtual city simulations. It would be simpler computationally to group cities
together and run simulations of a few representative types, but as we discovered in our initial
approach to the problem (described in section 1.2), this is not possible. It is not yet clear what
other criteria might provide a good basis for grouping the cities – one possibility is taxpayer
3
behavior, but we have yet to determine which specific aspects of it may be important. It is
always possible that taxpayer behavior is as idiosyncratic as the a priori characteristics we
examined initially.
2 The 300 Cities VE: Design
The 300 Cities VE is an empirically and theoretically driven virtual laboratory for examining the
effect of services on taxpayer behavior at a resolution level not seen previously. In existing
agent-based simulations for studying large human communities, people are typically modeled as
reactive, or as following set behavioral algorithms that allow them to respond in a limited way to
their environment. Interactions among people are typically constrained by artificial networks that
are imposed on the system.
In reality, however, the story is much more complex. The 300 Cities VE is designed to capture
more of the complexity of real-world populations by representing people as cognitive agents
with dynamic decision processes and awareness of the behavior of others around them. It is also
designed to accurately simulate information dissemination through communities by
incorporating known sociological principles that govern peoples’ social tendencies and structure
their relationships.
2.1 Framework
Construct provides the computational framework for our simulations. Construct is a dynamic-
network multi-agent modeling tool for examining the spread of information, beliefs, and actions
across a population in an environment [3]. This powerful tool captures dynamic behaviors in
groups and populations with different organizational, cultural, and media configurations [14]. In
our simulations, the population consists of taxpayers, tax preparers, and sources of tax-related
information; the environment consists of 297 virtual cities modeled after real U.S. cities; and the
spread of information, beliefs, and actions is governed by city-specific social networks.
Construct enables us to base our simulation study in the most realistic context possible. Because
the future cannot be predicted exactly in the real world, particularly when human behavior is
involved, our 300 Cities VE is a stochastic simulation. This means that uncertain events are
represented by probabilities, and the simulation is run many times using those probabilities to
generate a rich set of potential outcomes that are based on what we know and what is possible.
We can then analyze the outcomes to gain insight into what is likely and what can be done to
influence the future positively.
2.2 Agents
Our simulation is populated by four different types of agents, or autonomous entities that move,
interact, learn new information, and respond to their changing environments. These are:
taxpayers, tax preparers, IRS educational services, and non-IRS information sources.
2.2.1 Taxpayers
In our simulation, individual taxpayers are represented by socio-demographic attributes, make
decisions according to complex sets of knowledge and beliefs, interact with each other and
exchange information, and take tax-related actions such as filing for credits and making errors on
forms.
Taxpayer attributes
4
Each taxpayer agent in the simulation is described by a set of attributes consisting of socio-
demographic and tax-related characteristics. We build these agents by using census data to:
create representative virtual cities; estimate city and taxpayer characteristics that are relevant for
IRS issues; and incorporate other national attributes, such as literacy, that might affect peoples’
access to tax-related information. In addition, we obtain from the IRS national and city
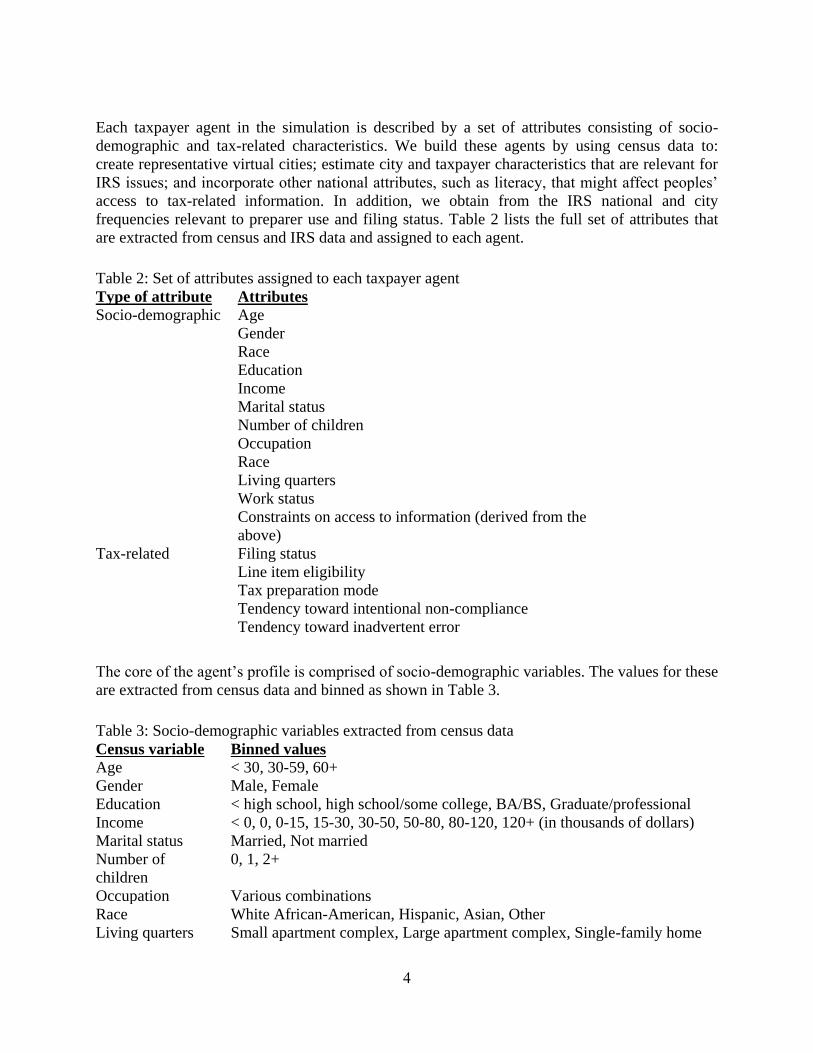
frequencies relevant to preparer use and filing status. Table 2 lists the full set of attributes that
are extracted from census and IRS data and assigned to each agent.
Table 2: Set of attributes assigned to each taxpayer agent
Type of attribute Attributes
Socio-demographic Age
Gender
Race
Education
Income
Marital status
Number of children
Occupation
Race
Living quarters
Work status
Constraints on access to information (derived from the
above)
Tax-related Filing status
Line item eligibility
Tax preparation mode
Tendency toward intentional non-compliance
Tendency toward inadvertent error
The core of the agent’s profile is comprised of socio-demographic variables. The values for these
are extracted from census data and binned as shown in Table 3.
Table 3: Socio-demographic variables extracted from census data
Census variable Binned values
Age < 30, 30-59, 60+
Gender Male, Female
Education < high school, high school/some college, BA/BS, Graduate/professional
Income < 0, 0, 0-15, 15-30, 30-50, 50-80, 80-120, 120+ (in thousands of dollars)
Marital status Married, Not married
Number of
children
0, 1, 2+
Occupation Various combinations
Race White African-American, Hispanic, Asian, Other
Living quarters Small apartment complex, Large apartment complex, Single-family home

5
Work status None, Part-time, Full-time
The agents in our virtual cities are distributed throughout these bins such that when summed
across each virtual city, the values are consistent with the census description of the appropriate
real-world metropolitan region. The attributes, their values, and the distribution of agents across
values can be adjusted depending on the focus of a particular analysis and the population of
interest.
Certain socio-demographic attributes may constrain the taxpayers’ access to tax-related
information. For example, a low income may prevent a taxpayer from using a paid preparer
when filing, or illiteracy may mean the taxpayer cannot take advantage of printed educational
resources.
In addition to a core set of socio-demographic characteristics, taxpayers have a set of tax-related
characteristics in the form of variables designed by extracting relevant information from the
census data. Together, Tables 4-6 show the logic we use to extract from the census data variables
that are useful for predicting taxpayer behavior by line item.
Table 4: Logic used to map census data to tax form line items
Tax form line item Exact mapping from census data
Has income from tips
If one of the OCCSOC5 entries shown in Table 5 is found
Files schedule C
If:
1) CLWKR = 6 or 7 and
2) INCSE > 0
Is eligible for earned income
tax credit
If:
1) INCTOT < 12550 and NRC=0 or
2) INCTOT < 33200 and NRC=1 or
3) INCTOT < 39784 and NRC=2
Is eligible for student loan
interest deduction
If EDUC > 9
Capital gains / new house
If YRMOVED=1
Owns / lives on a farm
If:
1) FNF=1 (this is a recoded variable: “Farm/NonFarm” =
{1=Farm, 0=NonFarm}) and
2) AGSALES > 0 and
3) At least one of the OCCSOC5 entries shown in Table 6 is
found

6
Is eligible for social security
benefits
If (age > 59 and INCRET > 0) or (DISABLE=1 and INCSS >
0) or (ABWORK=1 and INCSS > 0)
One-half of self employment
tax
If (CLWKR = 6 or 7) and INCSE > 0
Population density
LNDPUMA5 / POP100
Table 5: Indicators of having income from tips:
OCCSOC5
entry Description
27-2031 Dancers
27-2042 Musicians and Singers
31-9011 Massage Therapists
35-3011 Bartenders
35-3022 Counter Attendants, Cafeteria, Food Concession, and Coffee Shop
35-3031 Waiters and Waitresses
35-3041 Food Servers, Nonrestaurant
35-9011 Dining Room and Cafeteria Attendants and Bartender Helpers
35-9031 Hosts and Hostesses, Restaurant, Lounge, and Coffee Shop
37-2012 Maids and Housekeeping Cleaners
39-1011 Gaming Supervisors
39-1012 Slot Key Persons
39-3011 Gaming Dealers
39-3091 Amusement and Recreation Attendants
39-3092 Costume Attendants
39-3093 Locker Room, Coatroom, and Dressing Room Attendants
39-5011 Barbers
39-5012 Hairdressers, Hairstylists, and Cosmetologists
39-5091 Makeup Artists, Theatrical and Performance
39-5092 Manicurists and Pedicurists
39-5093 Shampooers
39-5094 Skin Care Specialists
39-6011 Baggage Porters and Bellhops
39-6012 Concierges
39-6021 Tour Guides and Escorts
39-6022 Travel Guides
39-9031 Fitness Trainers and Aerobics Instructors
39-9032 Recreation Workers
7
53-3041 Taxi Drivers and Chauffeurs
53-6021 Parking Lot Attendants
53-7111 Shuttle Car Operators
Table 6: Indicators of owning or living on a farm:
OCCSOC5
entry
Occupations likely to own a farm
45-1011 First-line supervisors/managers of farming, fishing, and forestry
workers
45-1012 Farm labor contractors
45-2021 Animal breeders
45-2041 Graders and sorters, Agricultural products
45-2091 Agricultural equipment operators
45-2092 Farmworkers and laborers: crop, nursery, and greenhouse
45-2093 Farmworkers: farm and ranch animals
In the near future, these tax-related variables will be augmented with two expanded variables.
The first of these will be preparer use. Currently, this variable has a value of either no preparer or
standard preparer, but eventually it will include other options such as unpaid, IRS-sponsored,
large corporate-based, and smaller independent preparer.
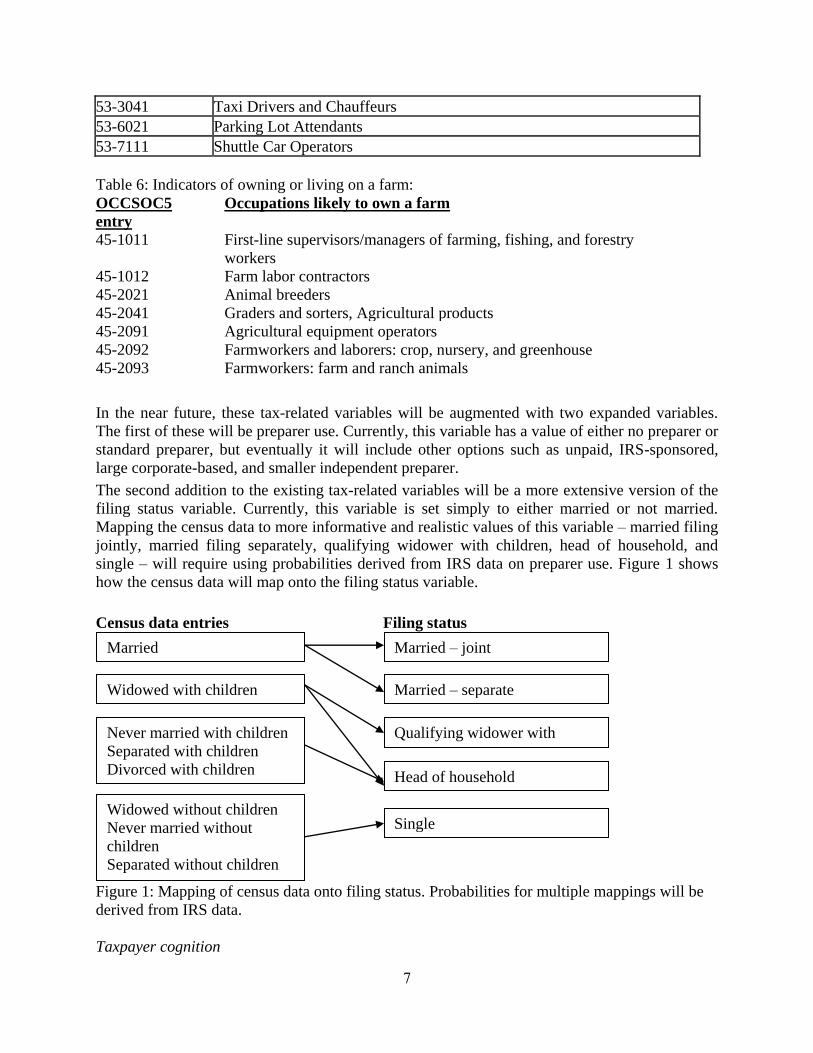
The second addition to the existing tax-related variables will be a more extensive version of the
filing status variable. Currently, this variable is set simply to either married or not married.
Mapping the census data to more informative and realistic values of this variable – married filing
jointly, married filing separately, qualifying widower with children, head of household, and
single – will require using probabilities derived from IRS data on preparer use. Figure 1 shows
how the census data will map onto the filing status variable.
Census data entries Filing status
Figure 1: Mapping of census data onto filing status. Probabilities for multiple mappings will be
derived from IRS data.
Taxpayer cognition
Married Married – joint
Married – separate Widowed with children
Never married with children
Separated with children
Divorced with children
Widowed without children
Never married without
children
Separated without children
Divorced without children
Qualifying widower with
children
Head of household
Single
8
Beyond their attributes, taxpayers possess pieces of tax-related knowledge, each of which may
be correct or incorrect, in the form of a set of facts. They also hold beliefs about whether those
facts are right or wrong – for example, they may have knowledge of a certain tax scheme but
mistakenly believe it to be legal. Taxpayers learn by interacting (i.e., exchanging facts or beliefs)
with other agents in the network (both fellow taxpayers and the three other agent types). The
information flow from taxpayer to taxpayer is bidirectional, meaning that each agent can learn
from the other during a two-agent interaction. In contrast, a specialized educational agent such as
an IRS service disseminates information to interaction partners but does not receive it.
Furthermore, agents have “transactive memory”, or knowledge (also correct or incorrect) about
which other agents know what, what they believe, and what they are doing.
Taxpayer behavior
Periodically, taxpayers take actions, guided by decision processes that closely approximate real
decision-making. These processes are complex algorithms informed by known socio-
psychological principles and human patterns. The decisions vary from simple to complex
depending on the amount of knowledge required to make them. For more detail on the decision
models and implementation in Construct, please see the technical report titled Variables,
Decisions, and Scripting in Construct [8].
Simple decisions a taxpayer makes include choosing an interaction partner at each time step and
choosing annually whether to file taxes or evade them. Taxpayers’ choices of interaction partners
are not random; rather, they are governed by social network structures, described in Section 2.3.
When taxpayers decide to file taxes, they can then make more complex decisions that may
produce different kinds of errors. Tax errors can be either inadvertent – meaning the taxpayer
lacks the knowledge necessary for compliance – or intentional. Intentional errors result when the
taxpayer’s beliefs generally support risk-taking or noncompliant behavior, and may include
avoidance schemes of considerable complexity.
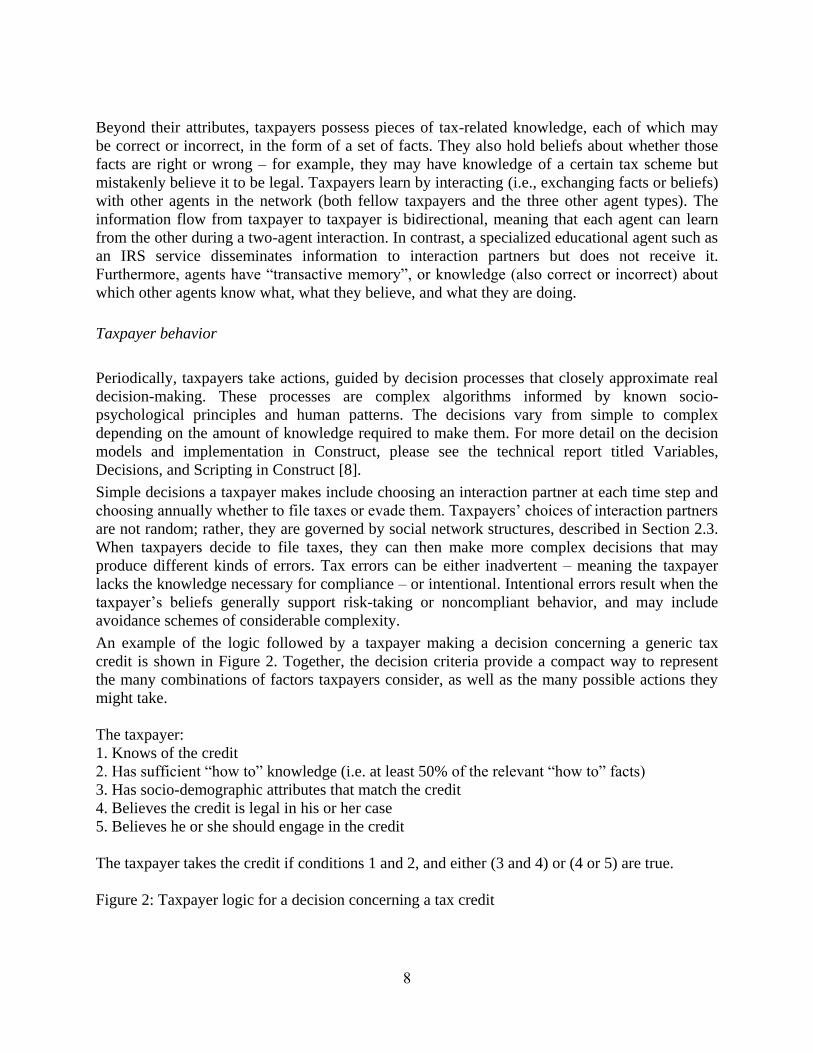
An example of the logic followed by a taxpayer making a decision concerning a generic tax
credit is shown in Figure 2. Together, the decision criteria provide a compact way to represent
the many combinations of factors taxpayers consider, as well as the many possible actions they
might take.
The taxpayer:
1. Knows of the credit
2. Has sufficient “how to” knowledge (i.e. at least 50% of the relevant “how to” facts)
3. Has socio-demographic attributes that match the credit
4. Believes the credit is legal in his or her case
5. Believes he or she should engage in the credit
The taxpayer takes the credit if conditions 1 and 2, and either (3 and 4) or (4 or 5) are true.
Figure 2: Taxpayer logic for a decision concerning a tax credit
9
For example, a taxpayer will correctly take an Earned Income Tax Credit if she knows of it and
how to claim it, her income is low enough to match the eligibility criteria, and she believes it is
legal for her (i.e. if factors 1,2, 3, and 4 are true). She will make an inadvertent error if she knows
of the credit and how to claim it and mistakenly believes she is eligible (factors 1, 2, and 4 are
true). She will make an intentional error if she knows of the credit and how to claim it and
believes she should engage in it despite knowing she is not eligible (factors 1, 2, and 5 are true).
In our 300 Cities VE, tax errors are generated by empirically-based error models that relate
socio-demographic variables to intentional and inadvertent errors for each line item (or
scheme/credit) of interest. Development of these error models is described in more detail in the
technical reports titled Inadvertent Errors [16] and Predicting Tax Evasion Using Meta-Analysis
and Imputation [7].
2.2.2 Tax preparers
Specialized agents called preparers also move through the network, helping taxpayers to file their
taxes. Depending on factors such as income, taxpayers may or may not have access to preparers.
In the absence of a preparer, taxpayers file their returns either by hand or with the aid of a
software package. Preparers are unpaid – for example, volunteers or members of an IRS help
center – or paid. Paid preparers are either commercial, including both independent “mom and
pop” organizations and larger chains, or they are individual practitioners, such as lawyer or
certified public accountants (CPAs). They also may or may not be enrolled. Additional
description of paid preparer models can be found in the technical report titled, Complex
Decisions in Construct: The Effect of Tax Preparation Agents” [18].
2.2.3 IRS educat ional services
The IRS can implement several different educational services, targeted toward either taxpayers
or preparers, to encourage tax credits and discourage non-compliance. Services aimed at
taxpayers include print ads, websites, call centers, radio spots, mailings, and information kiosks.
Services aimed at preparers include websites, call centers, mailings, and seminars. These services
also can be combined into bundles; for example, taxpayers might be provided with print ads and
a website, or a website and a radio spot, or mailings and a radio spot and an information kiosk,
and so on.
Unlike taxpayer agents, IRS services are not constrained by social networks; instead, they can
interact more freely and with more than one agent at a time. A taxpayer’s access to IRS services,
however, is constrained by literacy, web access, and newspaper readership. These factors are
based on national data and tend to differ according to socio-demographic measures, mainly age,
education, and income. Additionally, as described in Section 2.2.1.2, IRS services are one-
directional sources of information – they disseminate pieces of knowledge but do not receive
any.
2.2.4 Non-IRS information sources
Pro-credit and anti-scheme information provided by the IRS competes for dissemination with
pro-scheme information, which is spread to both agents and preparers by non-IRS sources. These
non-IRS information sources include seminars, unofficial call centers, and taxpayers who are
influential (that is, they have large social networks and are likely to spread their ideas) and have
beliefs and characteristics that support noncompliant behavior.

10
2.3 Network structure
Existing agent-based models for simulating large real-world communities have typically imposed
archetypal network structures to constrain agent interactions, effectively initializing the systems
with random networks and omitting any known drivers of social relationships. In the real world,
however, homophily – a universal tendency of individuals to associate and bond with others who
are similar – drives the formation of natural social ties; homophily structures peoples’ personal
networks so that they are homogeneous with regard to many socio-demographic, behavioral, and
intrapersonal characteristics. Homophily constrains peoples’ social worlds in a way that has
powerful implications for the information they receive, the beliefs they form, and their
interactions with each others [14]. Accordingly, our 300 Cities VE moves beyond existing agent-
based models to include the homophily phenomenon and thus provide a more thorough and
accurate representation of information dissemination through real-world communities.
In our VE, agents’ choices of interactions and information exchanges depend on three
homophily-driven factors: their spheres of influence, social proximity to each other, and
interaction logic.
2.3.1 Spheres of inf luence
Agents’ spheres of influence, or sets of social networks, limit the types of agents who are
possible interaction partners and preclude interactions between agents with absolutely nothing in
common. Social networks in the real world are hierarchical by intimacy level, and are
represented in our simulation as containing three nested networks. At the innermost level is the
confidante network, comprised of strong, trusted ties to family members and close friends.
Outside this is the general network, which consists of weaker ties to casual friends or extended
work groups. The outer level is an opportunistic network, with weak ties to acquaintances and
random contacts. For example, an IRS assistance center staff member would fall into most
peoples’ opportunistic network, while a promoter of illegal tax schemes could be anyone from a
trusted friend or advisor to a casual contact.
The size of a confidante network is a quadratic function of age. A recent study [6] suggests that
people have more strong connections when they are between the ages of 30 and 70 than when
they are either younger than 30 or older than 70. This variation, however, is seen primarily in the
number of non-kin contacts; the proportion of a confidante network made up by kin tends to stay
relatively constant through the years. Confidante networks are characterized not only by size but
also by composition, for which we turned to the General Social Survey (GSS), a source helpful
for characterizing social networks according to socio-demographics. For example, a negative
correlation has been observed between an ethnic group’s size and the tendency for its members
to select in-group friends, which indicates that networks of minorities tend to be more
heterogeneous than the networks of the majority.
2.3.2 Social proximity
Given that an interaction is possible, a decision to interact is based next on proximity, or the
measure of social similarity of the two agents involved. This similarity is assessed based on
social distance, or shared and neighboring values of socio-demographic attributes. For example,
a younger agent who did not complete high school and earns under $15,000 per year will be far
more likely to interact with another young and relatively uneducated person than with someone
who is older, completed high school, and earns a high salary.
11
Interaction logic
The third factor determining interaction partners, agents’ interaction logic, is influenced by two
forces. The first is homophily, which reflects peoples’ preferences for moving within relatively
homogeneous social worlds. The second is a desire to gain expertise to inform an attempted task.
Although homophily drives about 80% of the interactions in this simulation, during the first
quarter of the calendar year an increased weight is given to the desire for expertise to account for
an increase in information seeking by taxpayers during tax season.
3 The 300 Cities VE: Simulation Pipeline
We populate virtual cities in our simulation by drawing samples of city populations to create
representative agents. The representative population is created by expanding the 2000 Census
Bureau dataset. This dataset is originally obtained in a condensed form in which, rather than
listing socio-demographics for every individual person in a city, the Bureau collects all people
with a particular set of socio-demographics and lists that set as a single, weighted entry. In effect,
the entries are socio-demographic profiles weighted by population. To obtain a full set of
information for each city that will allow sampling for our simulation, we replicate the entries
according to their population weights so that the total number of census entries matches the total
city population. From this set of 297 full city populations, we extract random samples: we pull
3,000 people at random from each city and assign them IDs. We then assign tax-related attributes
to these sample agents based on associated socio-demographic attributes as described in section
2.2.1.
3.1 Overlaying social networks
For each agent in the 3000-agent virtual cities, the size of the agent’s social network, or the total
number of other people that the agent “knows”, is determined by age, occupation, living quarters,
and number of hours worked, with randomness introduced to accommodate varying degrees of
gregariousness seen in real populations. Each agent begins with a mean of 150 contacts and a
standard deviation of 25 contacts, and this distribution is then adjusted according to age and
employment characteristics. Middle-aged people are likely to have more contacts than the very
young or very old, so agents’ networks shrink by half their standard deviation if they fall outside
the middle-age bin. Blue-collar workers are less likely to network than white-collar workers, so
agents’ networks shrink by half their standard deviation if they are blue-collar and grow by half
their standard deviation if they are white-collar. Similarly, people who live in less dense
environments (e.g., single family homes or small apartment complexes) will have contact with
fewer people than those who live in dense environments (e.g., large apartment complexes), so
agents’ networks shrink by half their standard deviation for a small living quarters and grow by
half their standard deviation for large living quarters. Finally, because people who work longer
hours are likely to interact with more people than those who are part-time, work from home, or
are unemployed, agents’ networks increases by one standard deviation if they work 35 hours or
more per week and shrink by one standard deviation if they don’t work at all.
Because our simulated cities are subsets of real city populations, it is likely that only part of a
person’s social network will be included in the 3000-agent sample. Specifically, we estimate that
30% of a person’s social ties will lie within the sample, and 70% of the ties will lie in the
population outside the sample. These artificial boundaries are necessary because it is
12
computationally infeasible to model the complete set of social networks in an entire city.
Therefore, an agent’s maximum sample network size becomes 30% of the full network
calculated above
Within this sample network, we estimate that seven ties will be strong, while the rest will be
weak. These ties comprise the agent’s social network and are calculated according to the
principle of homophily, which states that people will tend to associate with others who are
similar to them.
To populate these allotted social ties, we follow an algorithm for each agent within each city in
which we look at each agent in relation to its alters, or all other agents in the network. On the
first pass through the sample data, the algorithm looks at each agent in turn and places its alters
in a random-ordered list. For the current agent and its alters, relevant socio-demographic
characteristics are considered in order of ascending weight, from least important to most
important in determining homophily. These characteristics in order are gender, occupation,
education, age, and race. Gender is a binary characteristic (male or female), while occupation,
education, age, and race are coded into multinomial categories. The algorithm then steps through
the alter list, and if the alter falls into exactly the same characteristic bins as the agent (and is not
the same person as the agent), and neither the agent nor the alter has reached the maximum
allowed strong ties, then a strong tie is assigned between them.
If an agent is unusual, meaning that its alloted strong ties haven’t yet been filled when the
algorithm reaches the end of its first pass through the alters, then another pass is made in which
agents as similar as possible (rather than exactly the same) are considered as strong ties. This
process uses a similarity score, or probability of a tie, determined by a metric distance between
the weighted characteristics in the same ascending order as above. Once the agent’s strong ties
are filled, for the remaining alters the algorithm assigns the available weak ties using similarity
scores and a binary random number. The more similar an alter is to the agent, the more likely a
weak tie will be assigned. This process continues until the maximum strong and weak ties are
filled for all 3000 agents in each city.
Next, the strong and weak ties are normalized so that all probabilities sum to one for each agent.
The resulting output is a 3000-by-3000 agent matrix in which each entry represents the
probability of a social tie between the row agent and the column agent. Because of
normalization, the average probability of a strong tie is roughly twice the probability of a weak
tie. These probabilities may not be symmetric; a tie in entry (1,15) in the matrix may be weaker
than the tie in entry (15,1). This possibility reflects asymmetries commonly seen in real-world
social relationships – a student-to-teacher connection, for example, may be strong because the
student views the teacher as a highly trusted source of information, while the reverse tie may be
weaker because the teacher has many other students in class and the flow of information is one-
sided. The details of our approach to overlaying social networks on samples from census data
can be found in the report titled Generating Macro-Networks Using Empirical Ego-Network
Data [17].
3.2 Building the Construct input deck
The input deck for Construct consists of two main list components for each city, plus
experimental conditions representing IRS intervention strategies. The first main list component
for each virtual city is a collection of 3000 lists containing socio-demographic and tax-related
attributes, cognitive and behavioral propensities, and access constaints for a particular agent in
that virtual city, as described in section 3.1. Each city’s second main component is a single list
13
that is a condensed version of the final normalized social network matrix from section 3.1.2.
Currently, our experimental conditions include 10 interventions, ranging from single services to
bundles of a few or several services.
These components combine to make the final input for Construct: 297 sample cities of 3,000
people, in which each person has built-in socio-demographic and tax-related characteristics,
constrained access to preparers and educational resources, and propensities toward making tax
errors as governed by error models. Overlaid social networks influence the dissemination of
information through these artificial cities, and one IRS educational intervention is assigned to
each collection of sample cities.
Because the simulation is stochastic as described in Section 2.1, the city sampling and social
network overlaying processes are repeated 30 times to allow for multiple replications. The large
number of required input decks – 297 cities x 10 IRS interventions x 30 replications – required
that we automate the process of input deck construction. Thus, the automated population of a
multi-agent model using real world data is another advance we have made relative to typical
multi-agent simulations.
3.3 Running the virtual experiment
The overall time horizon for a simulation in the 300 Cities VE is designed to represent one year,
with each time step representing one week of calendar time. At each time step, agents interact
with each other and exchange tax-related pieces of knowledge. Once per year, taxpaying agents
make tax-related decisions and take appropriate actions.
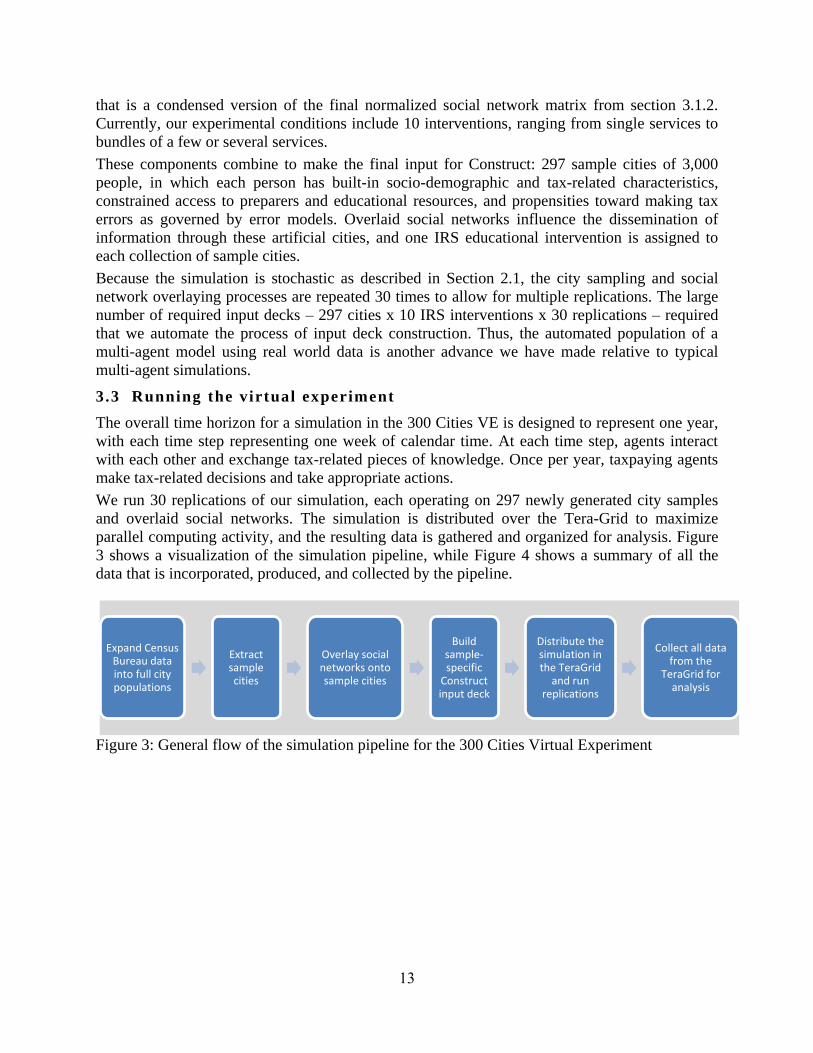
We run 30 replications of our simulation, each operating on 297 newly generated city samples
and overlaid social networks. The simulation is distributed over the Tera-Grid to maximize
parallel computing activity, and the resulting data is gathered and organized for analysis. Figure
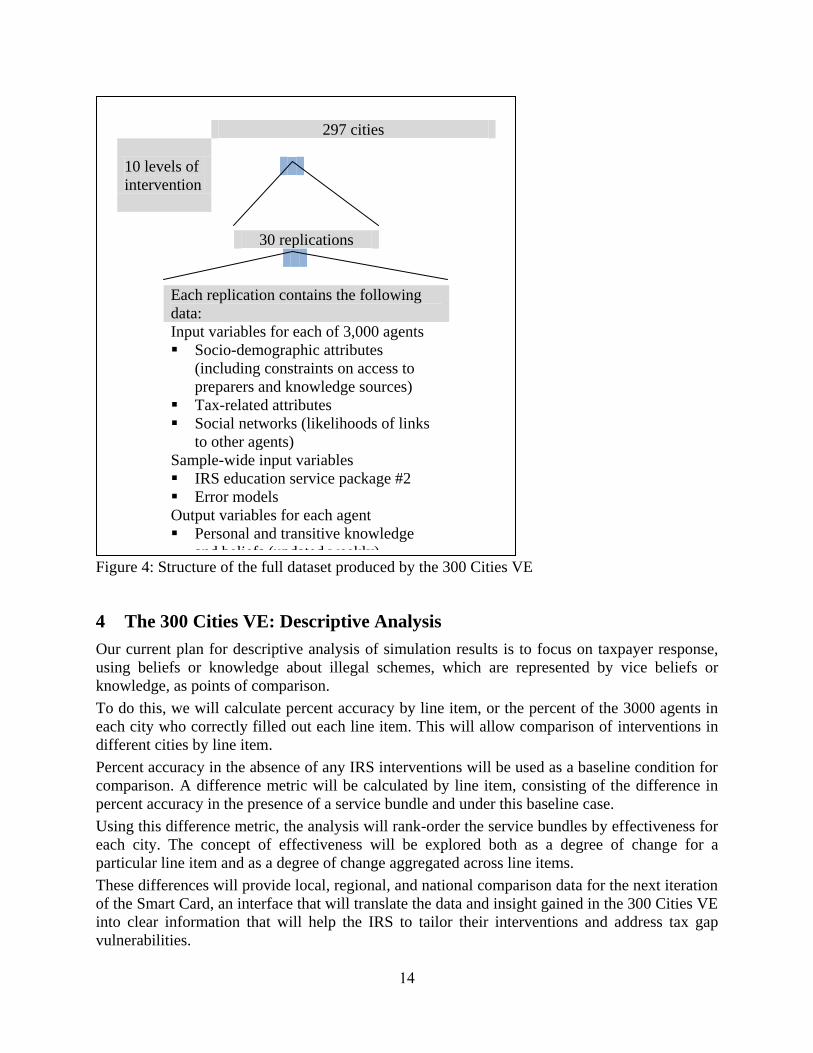
3 shows a visualization of the simulation pipeline, while Figure 4 shows a summary of all the
data that is incorporated, produced, and collected by the pipeline.
Figure 3: General flow of the simulation pipeline for the 300 Cities Virtual Experiment
Expand Census Bureau data into full city populations
Extract sample cities
Overlay social networks onto sample cities
Build sample-specific
Construct input deck
Distribute the simulation in the TeraGrid
and run replications
Collect all data from the
TeraGrid for analysis
14
Figure 4: Structure of the full dataset produced by the 300 Cities VE
4 The 300 Cities VE: Descriptive Analysis
Our current plan for descriptive analysis of simulation results is to focus on taxpayer response,
using beliefs or knowledge about illegal schemes, which are represented by vice beliefs or
knowledge, as points of comparison.
To do this, we will calculate percent accuracy by line item, or the percent of the 3000 agents in
each city who correctly filled out each line item. This will allow comparison of interventions in
different cities by line item.
Percent accuracy in the absence of any IRS interventions will be used as a baseline condition for
comparison. A difference metric will be calculated by line item, consisting of the difference in
percent accuracy in the presence of a service bundle and under this baseline case.
Using this difference metric, the analysis will rank-order the service bundles by effectiveness for
each city. The concept of effectiveness will be explored both as a degree of change for a
particular line item and as a degree of change aggregated across line items.
These differences will provide local, regional, and national comparison data for the next iteration
of the Smart Card, an interface that will translate the data and insight gained in the 300 Cities VE
into clear information that will help the IRS to tailor their interventions and address tax gap
vulnerabilities.
297 cities
10 levels of
intervention
30 replications
Each replication contains the following
data:
Input variables for each of 3,000 agents
Socio-demographic attributes
(including constraints on access to
preparers and knowledge sources)
Tax-related attributes
Social networks (likelihoods of links
to other agents)
Sample-wide input variables
IRS education service package #2
Error models
Output variables for each agent
Personal and transitive knowledge
and beliefs (updated weekly)
Tax actions by line item (annual)

15
Incorporated into the Smart Card will be demographic data for each city, simulated responses of
each city to IRS service bundles, and possibly the results of cluster analysis (if the responses of
cities to IRS interventions do indeed form coherent clusters).
The presentation of demographic data for each city, extracted from the census data in the process
of developing virtual cities, will enable direct comparison between cities as well as summaries of
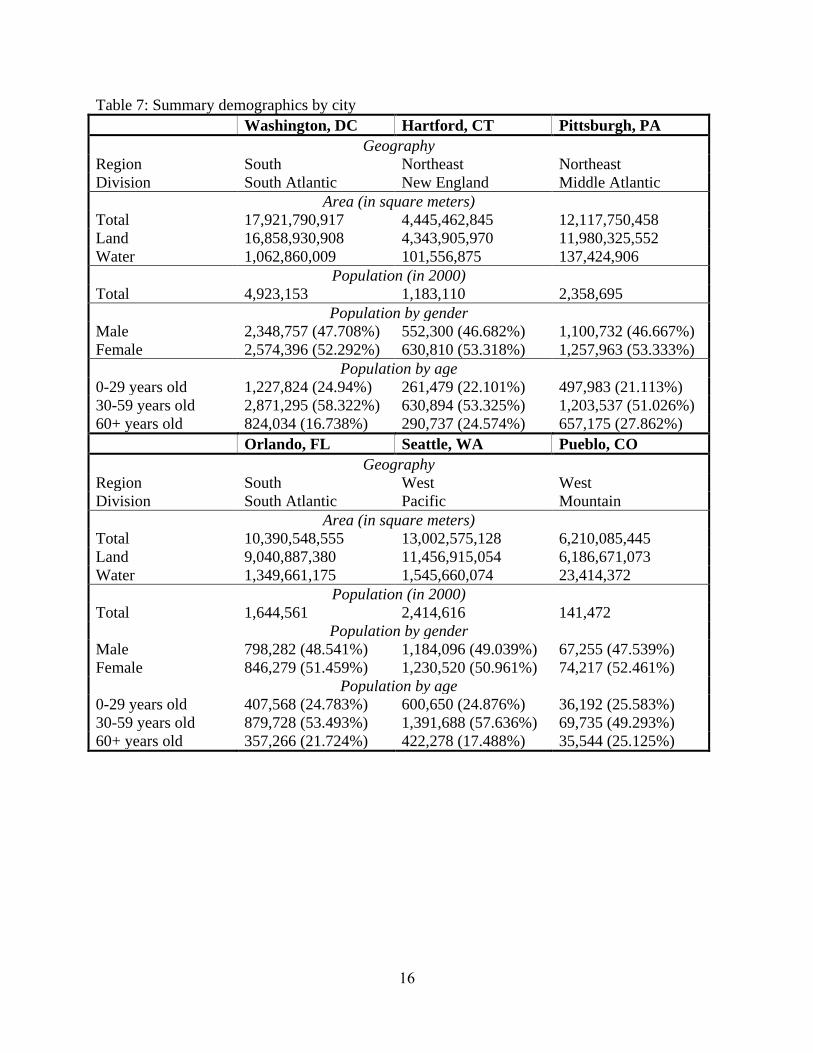
important tax issues and comparisons with national and regional averages. Tables 7-10 display
this information for a representative collection of six cities that span a range of geographic
characteristics: Washington, D.C.; Hartford, Connecticut; Pittsburgh, Pennsylvania; Orlando,
Florida; Seattle, Washington; and Pueblo, Colorado.
16
Table 7: Summary demographics by city
Washington, DC Hartford, CT Pittsburgh, PA
Geography
Region South Northeast Northeast
Division South Atlantic New England Middle Atlantic
Area (in square meters)
Total 17,921,790,917 4,445,462,845 12,117,750,458
Land 16,858,930,908 4,343,905,970 11,980,325,552
Water 1,062,860,009 101,556,875 137,424,906
Population (in 2000)
Total 4,923,153 1,183,110 2,358,695
Population by gender
Male 2,348,757 (47.708%) 552,300 (46.682%) 1,100,732 (46.667%)
Female 2,574,396 (52.292%) 630,810 (53.318%) 1,257,963 (53.333%)
Population by age
0-29 years old 1,227,824 (24.94%) 261,479 (22.101%) 497,983 (21.113%)
30-59 years old 2,871,295 (58.322%) 630,894 (53.325%) 1,203,537 (51.026%)
60+ years old 824,034 (16.738%) 290,737 (24.574%) 657,175 (27.862%)
Orlando, FL Seattle, WA Pueblo, CO
Geography
Region South West West
Division South Atlantic Pacific Mountain
Area (in square meters)
Total 10,390,548,555 13,002,575,128 6,210,085,445
Land 9,040,887,380 11,456,915,054 6,186,671,073
Water 1,349,661,175 1,545,660,074 23,414,372
Population (in 2000)
Total 1,644,561 2,414,616 141,472
Population by gender
Male 798,282 (48.541%) 1,184,096 (49.039%) 67,255 (47.539%)
Female 846,279 (51.459%) 1,230,520 (50.961%) 74,217 (52.461%)
Population by age
0-29 years old 407,568 (24.783%) 600,650 (24.876%) 36,192 (25.583%)
30-59 years old 879,728 (53.493%) 1,391,688 (57.636%) 69,735 (49.293%)
60+ years old 357,266 (21.724%) 422,278 (17.488%) 35,544 (25.125%)

17
Table 8: Potential taxpayer issues – comparison with national averages
Washington,
DC
Hartford,
CT
Pittsburgh,
PA
Main issues
New taxpayers Normal Normal Higher
Seniors Higher Normal Lower
Poverty Higher Normal Normal
New homeowners Normal Normal Higher
Low income Higher Higher Normal
Low income,
children
Higher Higher Normal
Access to information
Internet access Higher Normal Normal
Newspaper
readership
Higher Normal Higher
Illiteracy Normal Normal Lower
Linguistic isolation Normal Normal Normal
Orlando, FL Seattle, WA Pueblo, CO
Main issues
New taxpayers Normal Normal Normal
Seniors Normal Normal Normal
Poverty Normal Normal Normal
New homeowners Lower Normal Normal
Low income Normal Higher Lower
Low income,
children
Normal Higher Lower
Access to information
Internet access Normal Higher Lower
Newspaper
readership
Normal Higher Lower
Illiteracy Normal Lower Higher
Linguistic isolation Normal Normal Normal

18
Table 9: Potential tax issues by line item – comparison with national and regional averages
City Washington, DC Hartford, CT Pittsburgh, PA
Average National Regional
(South) National
Regional
(Northeast) National
Regional
(Northeast)
Tips Normal Normal Normal Normal Normal Normal
Self employed Normal Normal Normal Normal Lower Normal
EITC Lower Lower Lower Lower Normal Normal
Student loans Higher Higher Normal Normal Normal Normal
Farm Normal Normal Lower Normal Normal Normal
SS benefits Lower Lower Normal Normal Higher Higher
Capital gains Normal Normal Normal Normal Lower Lower
City Orlando, FL Seattle, WA Pueblo, CO
Average National Regional
(South) National
Regional
(West) National
Regional
(West)
Tips Higher Higher Normal Normal Normal Normal
Self employed Normal Normal Normal Normal Lower Lower
EITC Normal Normal Lower Lower Higher Normal
Student loans Normal Normal Higher Higher Normal Normal
Farm Normal Normal Normal Normal Normal Normal
SS benefits Normal Normal Normal Normal Higher Higher
Capital gains Higher Higher Normal Normal Normal Normal
Table 10: Use of paid preparers and comparison with national average
Percent of population
using preparers
Comparison with
national average
Washington, DC 50.786 Normal
Hartford, CT 54.203 Normal
Pittsburgh, PA 49.515 Lower
Orlando, FL 55.449 Normal
Seattle, WA 45.864 Lower
Pueblo, CO 60.156 Normal
In addition to descriptive city data as above, the Smart Card will contain informative output from
our virtual city simulations, and include possibly a cluster analysis that groups cities based on
their characteristic responses to IRS service bundles. The technique for this cluster analysis will
be either traditional or dynamic network, depending on the utility of the results yielded by each
approach. For more detail on the design of the Smart Card system, please see the technical report
titled Smart Card Prototype [1].
The overall flow of this IRS project – extraction of important information from census and IRS
data, Construct simulations, the 300 Cities virtual experiment, and the subsequent development
of Smart Cards, is summarized in Figure 5.

19
Figure 5: Overall flow of the IRS simulation project.
Taken together, the elements of this project will help the IRS to simulate and compare the
effectiveness of alternative intervention strategies, gain insight into taxpayer behavior, and
eventually work toward closing the tax gap.
information for
IRS decision
makers
city responses to IRS
services
city population
characteristics
taxpayer
behavior
IRS data
Census data
300 Cities
Smart Card
Construc
t

20
5 References
[1] Altman, N.A. Robertson, D., Martin, M.K., & Carley, K.M. (in preparation). “Smart Card
Prototype.” Carnegie Mellon University, School of Computer Science, Institute for Software
Research, Technical Report CMU-ISRI-[xx]-[xx].
[2] Carley, K.M. & Maxwell, D. (2006). “Understanding Taxpayer Behavior and Assessing
Potential IRS Interventions Using Multi-Agent Dynamic-Network Simulation”, Proceedings
of the 2006 Internal Revenue Service Research Conference, Washington, D.C.
[3] Carley, K.M. (1991). A theory of group stability. American Sociology Review, 56(3), 331-
354.
[4] Carley, K.M. (1995). Communication technologies and their effect on cultural homogeneity,
consensus, and the diffusion of new ideas. Sociological Perspectives, 38(4), 547-571.
[5] Catlett, C., et al. (2007). “TeraGrid: Analysis of Organization, System Architecture, and
Middleware Enabling New Types of Applications,” HPC and Grids in Action, Ed. Lucio
Grandinetti, IOS Press 'Advances in Parallel Computing' series, Amsterdam.
[6] Hill, R.A. & Dunbar, R. (2002). Social Network Size in Humans. Human Nature, 14(1), 53-
72.
[7] Lee, J.S., Hirshman, B.R., & Carley, K.M. (in preparation). “Predicting Tax Evasion Using
Meta-Analysis and Imputation.” Carnegie Mellon University, School of Computer Science,
Institute for Software Research, Technical Report CMU-ISRI-[xx]-[xx].Hirshman, B.R., Lee,
J.S., & Carley, K.M. (in preparation). “Variables, Decisions, and Scripting in Construct.”
Carnegie Mellon University, School of Computer Science, Institute for Software Research,
Technical Report CMU-ISRI-[xx]-[xx].
[9] Hirshman, B.R., Martin, M.K., Birukou, A., Bigrigg, M., & Carley, K.M. (2008). “The
Impact of Educational Interventions on Real and Stylized Cities,” Carnegie Mellon
University, School of Computer Science, Institute for Software Research, Technical Report
CMU-ISR-08-114.
[10] Hirshman, B.R., Martin, M.K., & Carley, K.M. (2008). “Modeling Information Access in
Construct,” Carnegie Mellon University, School of Computer Science, Institute for Software
Research, Technical Report CMU-ISR-08-115.
[11] Hirshman, B.R., Martin, M.K., Bigrigg, M., & Carley, K.M. (2008). “The Impact of
Educational Interventions by Socio-Demographic Attribute,” Carnegie Mellon University,
School of Computer Science, Institute for Software Research, Technical Report CMU-ISR-
08-118.
[12] Martin, M.K., Carley, K.M., & Altman, N. (2008). “300 Cities – An Exploration in
Characterizing US Cities,” Carnegie Mellon University, School of Computer Science,
Institute for Software Research, Technical Report CMU-ISR-08-122.
[13] Martin, M.K., Maxwell, D., & Carley, K. (2008). “Taxpayer Categories.” November
Kickoff PowerPoint presentation to the IRS. Carnegie Mellon University, School of
Computer Science, Institute for Software Research.
21
[14] McPherson, M., Smith-Lovin, L., & Cook, J.M. (2001). Birds of a Feather: Homophily in
Social Networks. Annual Review of Sociology, 27, 415-444.
[15] Schreiber, C. & Carley, K.M. (2004). “Construct – A Multi-agent Network Model for the
Co-evolution of Agents and Socio-cultural Environments.” Carnegie Mellon University,
School of Computer Science, Institute for Software Research, Technical Report CMU-ISRI-
04-109.
[16] Hirshman, B.R., Martin, M.K., & Carley, K.M. (in preparation). “Inadvertent Errors.”
Carnegie Mellon University, School of Computer Science, Institute for Software Research,
Technical Report CMU-ISRI-[xx]-[xx].
[17] Lee, J.S., & Carley, K.M. (in preparation). “Generating Macro-Networks Using
Empirical Ego-Network Data.” Carnegie Mellon University, School of Computer Science,
Institute for Software Research, Technical Report CMU-ISRI-[xx]-[xx].
[18] Hirshman, B.R., & Kowalchuk, M. (in preparation). “Complex Decisions in Construct:
The Effect of Tax Preparation Agents.” Carnegie Mellon University, School of Computer
Science, Institute for Software Research, Technical Report CMU-ISRI-[xx]-[xx].