3. projet de rapport semestriel - v250717 eng stu v5 · management report 6 2017 half‐year report...
TRANSCRIPT


2 2017 Half‐year report
CONTENTS
1. MANAGEMENT REPORT 5
1 GROUP’S POSITION AND HIGHLIGHTS 6 1.1 Changes in the scope of consolidation 7
1.2 Other equity investments 7
1.3 Two‐for‐one share split 7
1.4 Conversion of THE ORNANE bonds and increase in equity2 8
1.5 Treasury share transactions 8
2 HALF‐YEAR RESULTS 9 2.1 Key figures (unaudited, in € millions) 9
2.2 Overview of activity in first‐half 2017 11
2.3 Key figures by business 12
2.4 Key figures by geographical area 13
3 OUTLOOK 13 4 RISK FACTORS AND DISPUTES 13 5 RELATED PARTIES 13 6 HUMAN RESOURCES 14 7 SHARE PRICE AND OWNERSHIP STRUCTURE 14
2. CONSOLIDATED FINANCIAL STATEMENTS 16
1 CONSOLIDATED INCOME STATEMENT AND EARNINGS PER SHARE 17 2 CONSOLIDATED STATEMENT OF FINANCIAL POSITION 19 3 CONSOLIDATED STATEMENT OF CHANGES IN EQUITY 21 4 CONSOLIDATED STATEMENT OF CASH FLOWS 23 5 NOTES TO THE CONSOLIDATED FINANCIAL STATEMENTS 25
5.1 Accounting policies 25
5.2 Changes in the scope of consolidation in the first half of 2017 29
5.3 Segment reporting 30
5.4 Non‐recurring operating income and expenses 32
5.5 Net financial expense 32
5.6 Income tax 33
5.7 Basic and diluted earnings per share 33
5.8 Goodwill 34
5.9 Residual interest in leased assets 34
5.10 Current operating assets and liabilities 35
5.11 Net cash and net debt 39
5.12 Equity 40
5.13 Provisions 42
5.14 Consolidated statement of cash flows 43
5.15 Related‐party transactions 46
5.16 Subsequent events 46

3 2017 Half‐year report
STATEMENT BY THE PERSON RESPONSIBLE FOR THE HALF‐YEAR REPORT
I hereby declare that to the best of my knowledge, the financial statements for the six months ended
30 June 2017 have been prepared in accordance with applicable accounting standards and give a true
and fair view of the assets, liabilities, financial position and profit or loss of the Company and the
undertakings included in the consolidation taken as a whole, and that the half‐year management
report appended hereto gives a fair description of the material events that occurred during the first
six months of the financial year and their impact on the financial statements, and of the major
related‐party transactions, together with a description of the main risks and uncertainties for the
remaining six months of the financial year.
27 July 2017
Jean‐Louis Bouchard
Chairman of Econocom


Management report

MANAGEMENT REPORT
6 2017 Half‐year report
1 GROUP’S POSITION AND HIGHLIGHTS In the first half of 2017, Econocom Group continued its profitable growth dynamic.
Revenue came in at €1,280 million for the first six months of 2017, up 5.7% year‐on‐year, with
2.4% organic growth. This performance confirms the validity of the Group’s original positioning in
managing and financing major digital transformation projects of European leading firms. Econocom
Group also benefited from the targeted investments made in sectors with high growth potential such
as security, web and mobile applications, B2B multimedia, digital solutions charged as a fee and digital
transformation consulting.
Recurring operating profit1 totalled €58.2 million for the first six months of the year, up 9.2% on
first‐half 2016.
In view of the first‐half performance and business trends, Group Management confirms its
2017 objectives, corresponding to another year of sustained organic revenue growth (over 5%) and
double‐digit increase in recurring operating profit.
Alongside operating investments aiming particularly at building younger, more dynamic teams,
designing new products and services and upgrading production facilities, Econocom Group continued
its targeted equity investments strategy, with three acquisitions in first‐half 2017 (100% stake acquired
in LP Digital Agency and BIS and 40% stake acquired in JTRS).
The first six months of 2017 were also shaped by the following events:
• The Board of Directors appointed Robert Bouchard as Executive Director (“Administrateur Délégué”) and Group Chief Operating Officer, cementing the long‐term commitment of the Bouchard family. The Executive Committee was also enhanced by the appointment of Martine Bayens as Executive Director who is in charge of integrating, hosting, coordinating and developing the Satellites, and of Sébastien Musset in charge of Transformation and Resources for the Group. Sébastien Musset was also appointed Managing Director for France, and as such will be in charge of stepping up synergies for the Group’s largest country. Lastly, Jean‐Philippe Roesch, Non‐Executive Director, was named Chairman of the Audit Committee.
• The Company increased its capital by €183 million and reduced its net financial debt by €133 million by converting its “ORNANE” bonds. Indeed, in April, Econocom completed the early conversion of its January 2014 ORNANE bonds due in 2019.
• Two capital transactions took place further to decisions of the Shareholders’ Meeting of 16 May:
− a two‐for‐one share split;
− the refund of the issue premium in an amount of €0.10 per post‐split share, with the payment in 3d August 2017.
1 Before amortisation of intangible assets from acquisitions.

MANAGEMENT REPORT
7 2017 Half‐year report
1.1 CHANGES IN THE SCOPE OF CONSOLIDATION
As in 2016, in the first half of 2017 the Group focused on acquisitions of small and medium‐sized
companies operating in high‐potential markets. It also enhanced its international offer. The
transactions carried out concerned the following businesses:
1.1.1 SERVICES
Through its Alter Way Satellite, Econocom acquired 100% of LP Digital Agency, a specialist in digital
strategy consulting for major companies. LP Digital Agency reported revenue of €2 million in 2016.
1.1.2 PRODUCTS & SOLUTIONS
The Group acquired 100% of BIS, a Dutch multimedia solutions integrator operating and comprising
four companies (three in the Netherlands and one in Belgium). BIS employs over 220 people and
posted over €50 million in revenue in 2016.
1.2 OTHER EQUITY INVESTMENTS
Econocom Group also acquired 40% of JTRS, a UK company and preferred partner of Apple and Google
for digital education solutions in the United Kingdom. The company posted revenue of £9 million in
2016 and is accounted for by the equity method in the Group’s financial statements.
1.3 TWO‐FOR‐ONE SHARE SPLIT
The Extraordinary General Meeting of 16 May 2017 approved the Econocom Group’s two‐for‐one
share split, which is designed to improve the liquidity and accessibility of the Econocom share.
New Econocom shares have been listed on the regulated Brussels Euronext market since 2 June under
a new ISIN code (BE0974313455). The share split had no dilutive impact on Econocom Group’s existing
shareholders. As of the date of this report, the share capital comprises 245,140,430 shares compared
to 122,570,215 shares after the ORNANE bond conversion.
To simplify matters, financial information regarding earnings per share presented in this report has
been retrospectively restated to reflect the two‐for‐one share split in the prior period.

MANAGEMENT REPORT
8 2017 Half‐year report
1.4 CONVERSION OF THE ORNANE BONDS AND INCREASE IN EQUITY2
In first‐quarter 2017, Econocom redeemed on the market 2,698,900 of its ORNANE convertible bonds
maturing in 2019, representing 16.3% of the bond issue. The redemptions were backed by
2,580,020 sales of treasury shares (i.e. 5,160,040 treasury shares after the two‐for‐one share split).
On 15 March 2017, Econocom Group also activated the early redemption clause applicable to its
ORNANE bonds. Bondholders had been entitled to exercise their conversion rights up to 4 April 2017.
As was expected, the vast majority of ORNANE bondholders chose to convert their bonds into shares:
• at 15 March 2017, there were 7,671,594 ORNANE bonds outstanding, or 46.5% of the January 2014 issue;
• 99.8% (7,652,734) of these ORNANE bonds were tendered to the conversion, with each bond converted into one new share (before the share split);
• the 18,860 ORNANE bonds that remained outstanding following the conversion were redeemed in cash ahead of term on 19 May 2017 at the accreted principal amount plus accrued interest (i.e. €11.022 per ORNANE bond).
For the purposes of this transaction, Econocom Group created a total of 10,050,928 new shares
(i.e. 20,101,856 shares after the split), bringing the number of shares issued to 122,570,215
(i.e. 245,140,430 shares after the split), compared to 112,519,287 shares at 31 December 2016
(i.e. 225,038,574 shares after the split).
These operations have enabled the Company to reduce its net debt by €133 million since
1 January 2017 and to increase its equity by €183 million, including €139.4 million as a direct result of
the bond conversion, €36.3 million resulting from the sale of treasury shares backing the
ORNANE redemptions (carried out between 1 January 2017 and the date of the conversion) and
€6.7 million resulting from various impacts included in the profit for the first‐half 2017 (see page 11,
section 2.1, Note 1).
1.5 TREASURY SHARE TRANSACTIONS
The Group also continued to buy back treasury shares in the first half, with 3,408,444 (post‐split) own
shares purchased. After taking into account sales of treasury shares backing ORNANE bond
redemptions and shares awarded to management eligible for share ownership plans, Econocom Group
held 8,313,144 of its own shares at 30 June 2017, or 3.39% of the Company’s share capital (including
shares in connection with the liquidity contract).
These transactions reflect the Group’s commitment to managing dilution for its shareholders and its
confidence in its growth outlook.
2 In the interests of clarity, the number of shares is shown before and after the share split.

MANAGEMENT REPORT
9 2017 Half‐year report
2 HALF‐YEAR RESULTS
2.1 KEY FIGURES (UNAUDITED, IN € MILLIONS)
Income statement First‐half 2017
First‐half 2016
Change
REVENUE 1,280.2 1,211.6 5.7%
TECHNOLOGY MANAGEMENT & FINANCING 603.9 613.0 ‐1.5%
SERVICES 430.1 387.9 10.9%
PRODUCTS & SOLUTIONS 246.2 210.7 16.8%
RECURRING OPERATING PROFIT BEFORE AMORTISATION OF INTANGIBLE ASSETS FROM ACQUISITIONS(1)
58.2 53.3 9.2%
RECURRING OPERATING PROFIT 56.1 51.2 9.5%
NON‐RECURRING OPERATING INCOME AND EXPENSES (8.9) (1.5) N/A
OPERATING PROFIT 47.1 49.7 ‐5.2%
NET FINANCIAL EXPENSE (6.8) (7.3) 8.6%
CHANGE IN FAIR VALUE OF THE ORNANE EMBEDDED DERIVATIVE COMPONENT
4.1 (10.7) N/A
PROFIT BEFORE TAX 44.4 31.7 40.3%
INCOME TAX EXPENSE (11.3) (14.0) ‐19.0%
PROFIT (LOSS) FROM DISCONTINUED OPERATIONS ‐ ‐ ‐
SHARE OF PROFIT (LOSS) OF ASSOCIATES AND JOINT VENTURES 0.0 (0.1) N/A
PROFIT FOR THE PERIOD 33.1 17.6 88.2%
NON‐CONTROLLING INTERESTS 0.5 (0.7) N/A
PROFIT FOR THE PERIOD ATTRIBUTABLE TO OWNERS OF THE PARENT 32.6 18.3 77.6%
RECURRING PROFIT FOR THE PERIOD ATTRIBUTABLE TO OWNERS OF THE PARENT(1)
33.0 31.7 4.1%
EARNINGS PER SHARE (€)
NET EARNINGS PER SHARE 0.142 0.085 67.1%
DILUTED EARNINGS PER SHARE 0.140 0.084 66.7%
RECURRING NET EARNINGS PER SHARE(1) 0.144 0.147 ‐2.0%
Cash flow from operating activities, net cash at bank and net financial debt
First‐half 2017
First‐half 2016
Change
CASH FLOW FROM OPERATING ACTIVITIES BEFORE COST OF NET DEBT AND INCOME TAX
49.3 50.8 ‐3.0%
NET CASH AT BANK 134.2 41.2
NET FINANCIAL DEBT (204.1) (285.1)
Shareholders’ equity First‐half 2017
First‐half 2016
Change
SHAREHOLDERS’ EQUITY INCLUDING NON‐CONTROLLING INTERESTS 440.2 279.0 57.8%
Market capitalisation (in units and €) First‐half 2017
First‐half 2016
AVERAGE NUMBER OF SHARES OUTSTANDING* 228,782,655 215,418,262
TOTAL NUMBER OF SHARES AT 30 JUNE* 245,140,430 225,038,574
MANAGEMENT REPORT
10 2017 Half‐year report
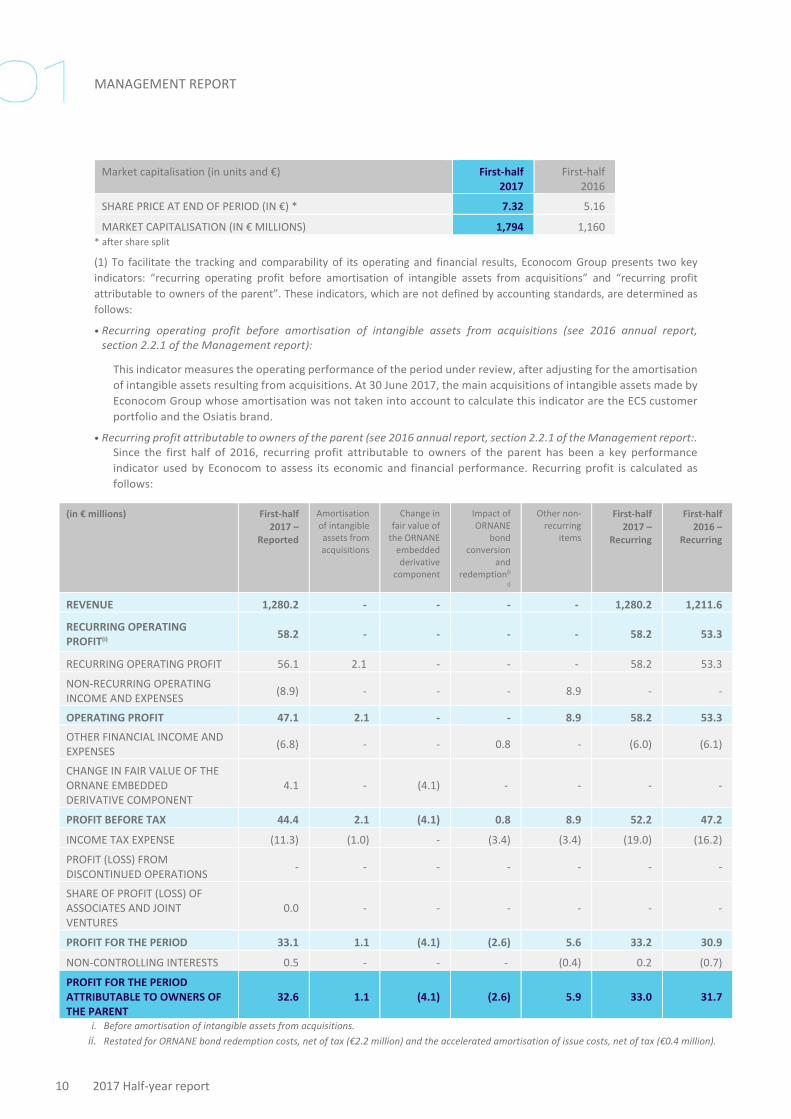
Market capitalisation (in units and €) First‐half 2017
First‐half 2016
SHARE PRICE AT END OF PERIOD (IN €) * 7.32 5.16
MARKET CAPITALISATION (IN € MILLIONS) 1,794 1,160 * after share split
(1) To facilitate the tracking and comparability of its operating and financial results, Econocom Group presents two key
indicators: “recurring operating profit before amortisation of intangible assets from acquisitions” and “recurring profit
attributable to owners of the parent”. These indicators, which are not defined by accounting standards, are determined as
follows:
• Recurring operating profit before amortisation of intangible assets from acquisitions (see 2016 annual report, section 2.2.1 of the Management report):
This indicator measures the operating performance of the period under review, after adjusting for the amortisation
of intangible assets resulting from acquisitions. At 30 June 2017, the main acquisitions of intangible assets made by
Econocom Group whose amortisation was not taken into account to calculate this indicator are the ECS customer
portfolio and the Osiatis brand.
• Recurring profit attributable to owners of the parent (see 2016 annual report, section 2.2.1 of the Management report:. Since the first half of 2016, recurring profit attributable to owners of the parent has been a key performance
indicator used by Econocom to assess its economic and financial performance. Recurring profit is calculated as
follows:
i. Before amortisation of intangible assets from acquisitions.
ii. Restated for ORNANE bond redemption costs, net of tax (€2.2 million) and the accelerated amortisation of issue costs, net of tax (€0.4 million).
(in € millions) First‐half 2017 –
Reported
Amortisation of intangible assets from acquisitions
Change in fair value of the ORNANE embedded derivative
component
Impact of ORNANE
bond conversion
and redemption(i
i)
Other non‐recurring
items
First‐half 2017 –
Recurring
First‐half 2016 –
Recurring
REVENUE 1,280.2 ‐ ‐ ‐ ‐ 1,280.2 1,211.6
RECURRING OPERATING PROFIT(i)
58.2 ‐ ‐ ‐ ‐ 58.2 53.3
RECURRING OPERATING PROFIT 56.1 2.1 ‐ ‐ ‐ 58.2 53.3
NON‐RECURRING OPERATING INCOME AND EXPENSES
(8.9) ‐ ‐ ‐ 8.9 ‐ ‐
OPERATING PROFIT 47.1 2.1 ‐ ‐ 8.9 58.2 53.3
OTHER FINANCIAL INCOME AND EXPENSES
(6.8) ‐ ‐ 0.8 ‐ (6.0) (6.1)
CHANGE IN FAIR VALUE OF THE ORNANE EMBEDDED DERIVATIVE COMPONENT
4.1 ‐ (4.1) ‐ ‐ ‐ ‐
PROFIT BEFORE TAX 44.4 2.1 (4.1) 0.8 8.9 52.2 47.2
INCOME TAX EXPENSE (11.3) (1.0) ‐ (3.4) (3.4) (19.0) (16.2)
PROFIT (LOSS) FROM DISCONTINUED OPERATIONS
‐ ‐ ‐ ‐ ‐ ‐ ‐
SHARE OF PROFIT (LOSS) OF ASSOCIATES AND JOINT VENTURES
0.0 ‐ ‐ ‐ ‐ ‐ ‐
PROFIT FOR THE PERIOD 33.1 1.1 (4.1) (2.6) 5.6 33.2 30.9
NON‐CONTROLLING INTERESTS 0.5 ‐ ‐ ‐ (0.4) 0.2 (0.7)
PROFIT FOR THE PERIOD ATTRIBUTABLE TO OWNERS OF THE PARENT
32.6 1.1 (4.1) (2.6) 5.9 33.0 31.7
MANAGEMENT REPORT
11 2017 Half‐year report
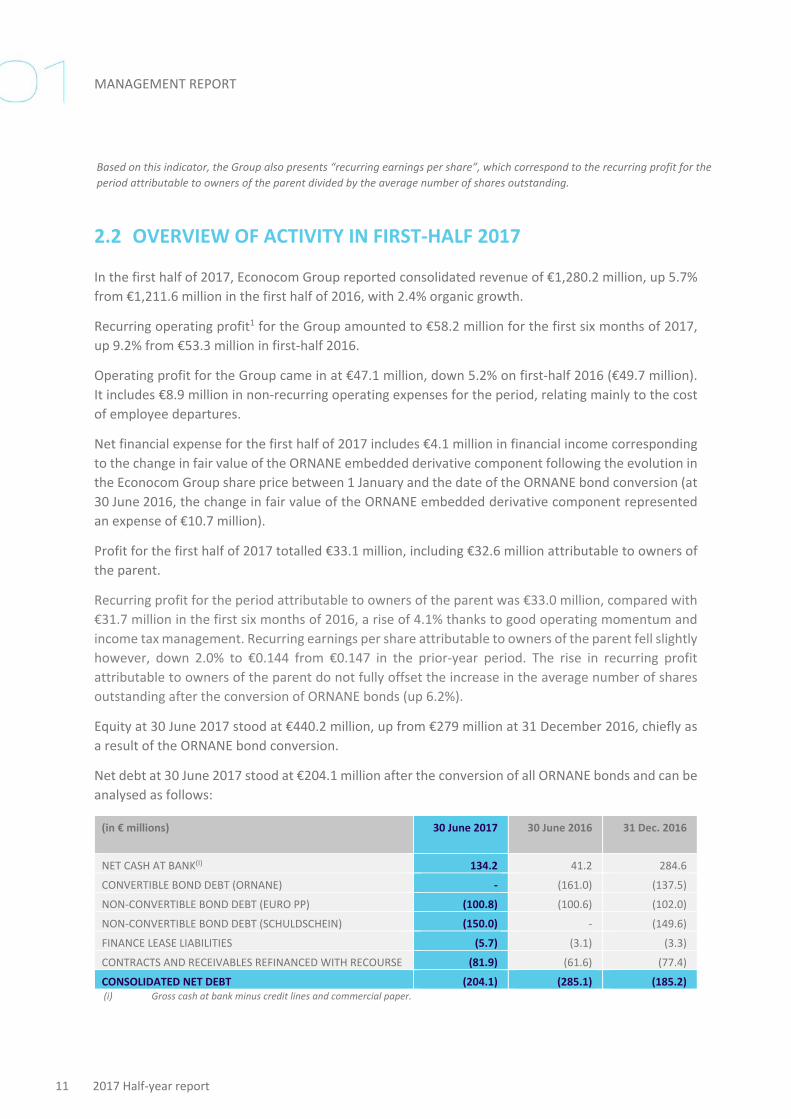
Based on this indicator, the Group also presents “recurring earnings per share”, which correspond to the recurring profit for the
period attributable to owners of the parent divided by the average number of shares outstanding.
2.2 OVERVIEW OF ACTIVITY IN FIRST‐HALF 2017
In the first half of 2017, Econocom Group reported consolidated revenue of €1,280.2 million, up 5.7%
from €1,211.6 million in the first half of 2016, with 2.4% organic growth.
Recurring operating profit1 for the Group amounted to €58.2 million for the first six months of 2017,
up 9.2% from €53.3 million in first‐half 2016.
Operating profit for the Group came in at €47.1 million, down 5.2% on first‐half 2016 (€49.7 million).
It includes €8.9 million in non‐recurring operating expenses for the period, relating mainly to the cost
of employee departures.
Net financial expense for the first half of 2017 includes €4.1 million in financial income corresponding
to the change in fair value of the ORNANE embedded derivative component following the evolution in
the Econocom Group share price between 1 January and the date of the ORNANE bond conversion (at
30 June 2016, the change in fair value of the ORNANE embedded derivative component represented
an expense of €10.7 million).
Profit for the first half of 2017 totalled €33.1 million, including €32.6 million attributable to owners of
the parent.
Recurring profit for the period attributable to owners of the parent was €33.0 million, compared with
€31.7 million in the first six months of 2016, a rise of 4.1% thanks to good operating momentum and
income tax management. Recurring earnings per share attributable to owners of the parent fell slightly
however, down 2.0% to €0.144 from €0.147 in the prior‐year period. The rise in recurring profit
attributable to owners of the parent do not fully offset the increase in the average number of shares
outstanding after the conversion of ORNANE bonds (up 6.2%).
Equity at 30 June 2017 stood at €440.2 million, up from €279 million at 31 December 2016, chiefly as
a result of the ORNANE bond conversion.
Net debt at 30 June 2017 stood at €204.1 million after the conversion of all ORNANE bonds and can be
analysed as follows:
(in € millions)
30 June 2017
30 June 2016 31 Dec. 2016
NET CASH AT BANK(I) 134.2 41.2 284.6
CONVERTIBLE BOND DEBT (ORNANE) ‐ (161.0) (137.5)
NON‐CONVERTIBLE BOND DEBT (EURO PP) (100.8) (100.6) (102.0)
NON‐CONVERTIBLE BOND DEBT (SCHULDSCHEIN) (150.0) ‐ (149.6)
FINANCE LEASE LIABILITIES (5.7) (3.1) (3.3)
CONTRACTS AND RECEIVABLES REFINANCED WITH RECOURSE (81.9) (61.6) (77.4)
CONSOLIDATED NET DEBT (204.1) (285.1) (185.2) (i) Gross cash at bank minus credit lines and commercial paper.

MANAGEMENT REPORT
12 2017 Half‐year report
Net debt at 30 June 2017 represents around 1.2 times the Group’s 12‐month EBITDA. EBITDA
corresponds to recurring operating profit adjusted for net depreciation and amortisation expense,
additions to and reversals of provisions for asset impairment and provisions for contingencies and
losses, and net impairment losses on current and non‐current assets recognised in recurring operating
profit (see definition in the 2016 annual report, section 2.2.1 of the Management report).
2.3 KEY FIGURES BY BUSINESS
Revenue and recurring operating profit1 break down as follows:
(in € millions) First‐half 2017 First‐half 2016 Total growth Like‐for‐like growth
TECHNOLOGY MANAGEMENT & FINANCING
603.9 613.0 ‐1.5% ‐1.5%
SERVICES 430.1 387.9 10.9% 4.4%
PRODUCTS & SOLUTIONS 246.2 210.7 16.8% 9.0%
REVENUE 1,280.2 1,211.6 5.7% 2.4%
(in € millions) First‐half 2017
First‐half 2016
Change First‐half 2017
recurring operating
margin
First‐half 2016
recurring operating
margin
TECHNOLOGY MANAGEMENT & FINANCING
38.1 30.7 24.2% 6.3% 5.0%
SERVICES 14.6 18.5 ‐21.1% 3.4% 4.8%
PRODUCTS & SOLUTIONS 5.5 4.1 34.4% 2.2% 2.0%
RECURRING OPERATING PROFIT(1) 58.2 53.3 9.2% 4.5% 4.4% (1) Before amortisation of intangible assets from acquisitions.
In the first half of 2017, the Technology Management & Financing (TMF) business reported revenue of
€604 million compared with €613 million in first‐half 2016, down 1.5% year‐on‐year. After a good first
quarter, the second quarter was affected by the postponement of several contracts which should
increase the revenue in the last six months of the year. TMF reported €38.1 million in recurring
operating profit1 and an operating margin of 6.3%, up from 5% in first‐half 2016. In addition to a
favourable mix of contracts during the first half, the business benefited from a rise in the resale value
of some leased assets, partly offset by prudent provisioning for certain risks. These factors accounted
for a rise of around one percentage point in the operating margin.
At 30 June 2017, the Services business posted revenue of €430 million compared with €388 million
one year earlier, a rise of 10.9%, with 4.4% organic growth. The Group was boosted by several large
multi‐year contracts signed over the past 12 months. The Satellites also delivered further
double‐digital organic growth, at 10.5%, buoyed by their positioning on fast‐growing markets and by
synergies with the Group’s historic businesses. Recurring operating profit1 for the Services business
was €14.6 million, representing 3.4% of revenue versus 4.8% of revenue in first‐half 2016.

MANAGEMENT REPORT
13 2017 Half‐year report
Products & Solutions enjoyed another six months of strong revenue growth, up 16.8% to €246 million,
including 9.0% organic growth. The business captured further market share in the public sector and
cemented its strong foothold on the growing B2B multimedia segment. BIS, which was consolidated
as from the second quarter, joined this business in the Netherlands and Belgium. Recurring operating
profit for the business was €5.5 million, with the operating margin rising to 2.2%.
2.4 KEY FIGURES BY GEOGRAPHICAL AREA
Revenue by geographical area is broken down as follows:
(in € millions) First‐half 2017
First‐half 2016 Total growth
FRANCE 675.2 641.3 5.3%
BENELUX 169.4 174.1 ‐2.7%
SOUTHERN EUROPE 292.7 228.7 28.0%
NORTHERN & EASTERN EUROPE 123.5 147.8 ‐16.4%
AMERICAS 19.4 19.7 ‐1.5%
REVENUE 1,280.2 1,211.6 5.7%
Growth varied from one geographical area to the next, with a stellar performance in Southern Europe
(up 28%) buoyed by major lease contracts, particularly in connected devices.
3 OUTLOOK In view of the first‐half performance and business trends, Group Management confirms its
2017 guidance, corresponding to another year of sustained organic revenue growth (over 5%) and
double‐digit growth in recurring operating profit.
4 RISK FACTORS AND DISPUTES The risk factors described in the 2016 annual report did not significantly change during the first half of
2017.
5 RELATED PARTIES There has been no major change in related parties since the publication of the 2016 annual report.

MANAGEMENT REPORT
14 2017 Half‐year report
6 HUMAN RESOURCES Econocom Group employed 10,356 people at 30 June 2017, compared with 10,008 at
31 December 2016. Headcount was therefore up by 3.5%, compared to revenue growth of 5.7%.
7 SHARE PRICE AND OWNERSHIP STRUCTURE The Econocom share price stood at €7.32 at 30 June 2017. The Econocom Group share (BE0974313455
– ECONB) has been listed on NYSE Euronext in Brussels since 1986 and is part of the Bel Mid and Family
Business indices.
The following changes took place in the ownership structure:
(% of rights held) 30 June 2017
31 Dec. 2016
COMPANIES CONTROLLED BY JEAN‐LOUIS BOUCHARD 36.44% 41.03%
PUBLIC SHAREHOLDERS 60.20% 54.20%
TREASURY SHARES 3.36% 4.77%
TOTAL 100.00% 100.00%
Econocom Group was notified that two shareholders other than the companies controlled by
Jean‐Louis Bouchard had exceeded the 5% share ownership threshold at 30 June 2017. The companies
are Butler Industries Benelux (and indirectly WB Finance and Mr Walter Butler), and the US company
Kabouter Management LLC.
The evolution in the shareholding of companies controlled by Jean‐Louis Bouchard was mostly
attributable to the dilutive impact of the ORNANE bond conversion.
The fall in treasury shares over the six‐month period relates to the sale of shares to be tendered to the
ORNANE bond conversion and to the exercise of stock options by management.


Consolidated financial statements

CONSOLIDATED FINANCIAL STATEMENTS
17 2017 Half‐year report
1 CONSOLIDATED INCOME STATEMENT AND EARNINGS PER SHARE
For the six‐month periods ended 30 June 2017 and 30 June 2016
(in € millions) Notes First‐half 2017
First‐half 2016
REVENUE FROM CONTINUING OPERATIONS 5.3 1,280.2 1,211.6
OPERATING EXPENSES
(1,224.1) (1,160.4)
COST OF SALES(3) ‐ (833.0) (815.4)
PERSONNEL COSTS ‐ (272.7) (253.0)
EXTERNAL EXPENSES ‐ (95.4) (84.9)
DEPRECIATION, AMORTISATION AND PROVISIONS ‐ (16.4) (2.6)
NET IMPAIRMENT LOSSES ON CURRENT AND NON‐CURRENT ASSETS ‐ (4.9) (2.4)
TAXES (OTHER THAN INCOME TAXES) ‐ (7.3) (7.6)
OTHER OPERATING INCOME AND EXPENSES(3) ‐ 4.4 3.4
FINANCIAL INCOME – OPERATING ACTIVITIES ‐ 1.2 2.1
RECURRING OPERATING PROFIT BEFORE AMORTISATION OF INTANGIBLE ASSETS FROM ACQUISITIONS(1)
5.3 58.2 53.3
RECURRING OPERATING PROFIT 56.1 51.2
NON‐RECURRING OPERATING INCOME AND EXPENSES 5.4 (8.9) (1.5)
OPERATING PROFIT ‐ 47.1 49.7
OTHER FINANCIAL INCOME AND EXPENSES 5.5 (6.8) (7.3)
CHANGE IN FAIR VALUE OF THE ORNANE EMBEDDED DERIVATIVE COMPONENT
5.5 4.1 (10.7)
PROFIT BEFORE TAX ‐ 44.4 31.7
INCOME TAX EXPENSE 5.6 (11.3) (14.0)
PROFIT FROM CONTINUING OPERATIONS ‐ 33.1 17.7
SHARE OF PROFIT (LOSS) OF ASSOCIATES AND JOINT VENTURES ‐ ‐ (0.1)
PROFIT (LOSS) FROM DISCONTINUED OPERATIONS ‐ ‐
PROFIT FOR THE PERIOD ‐ 33.1 17.6
NON‐CONTROLLING INTERESTS ‐ 0.5 (0.7)
PROFIT FOR THE PERIOD ATTRIBUTABLE TO OWNERS OF THE PARENT 32.6 18.3
RECURRING PROFIT ATTRIBUTABLE TO OWNERS OF THE PARENT(2) ‐ 33.0 31.7
(in €) Notes First‐half
2017
First‐half
2016*
BASIC EARNINGS PER SHARE 5.7 0.142 0.085
DILUTED EARNINGS PER SHARE 5.7 0.140 0.084
RECURRING EARNINGS PER SHARE(2) ‐ 0.144 0.147
* After the Econocom Group two‐for‐one share split approved by the Extraordinary General Meeting of 16 May 2017.
CONSOLIDATED FINANCIAL STATEMENTS
18 2017 Half‐year report
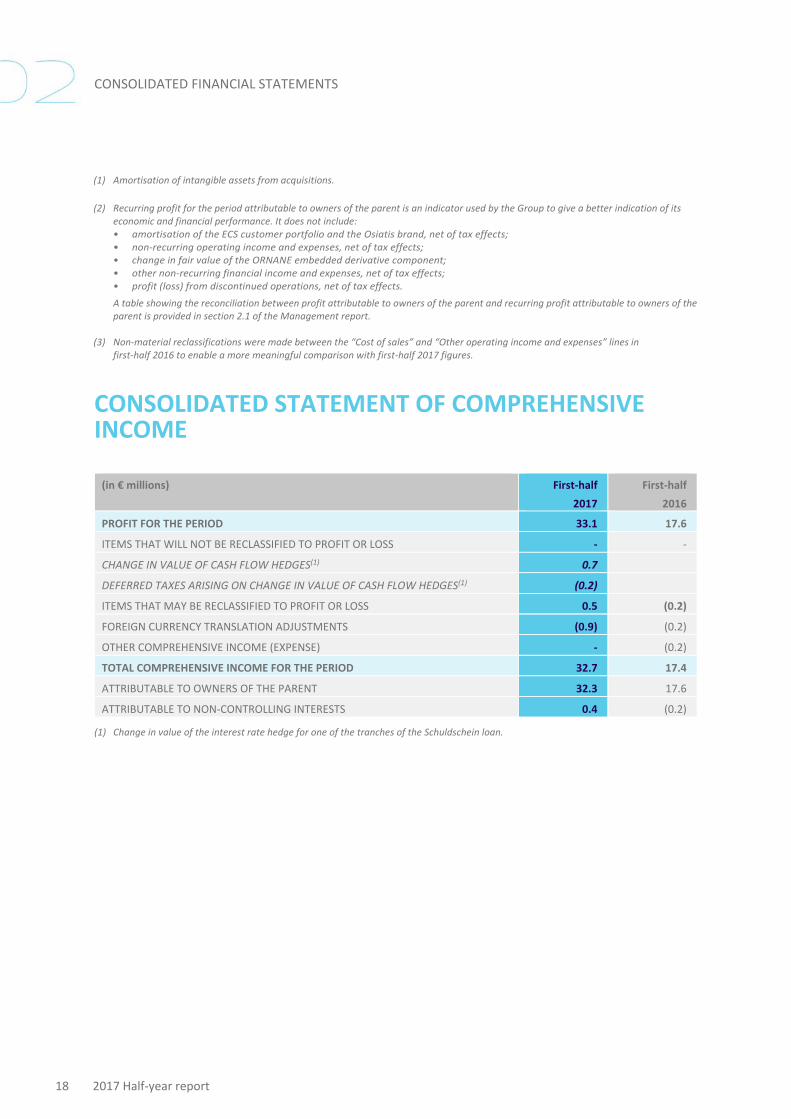
(1) Amortisation of intangible assets from acquisitions.
(2) Recurring profit for the period attributable to owners of the parent is an indicator used by the Group to give a better indication of its economic and financial performance. It does not include: • amortisation of the ECS customer portfolio and the Osiatis brand, net of tax effects; • non‐recurring operating income and expenses, net of tax effects; • change in fair value of the ORNANE embedded derivative component; • other non‐recurring financial income and expenses, net of tax effects; • profit (loss) from discontinued operations, net of tax effects.
A table showing the reconciliation between profit attributable to owners of the parent and recurring profit attributable to owners of the parent is provided in section 2.1 of the Management report.
(3) Non‐material reclassifications were made between the “Cost of sales” and “Other operating income and expenses” lines in first‐half 2016 to enable a more meaningful comparison with first‐half 2017 figures.
CONSOLIDATED STATEMENT OF COMPREHENSIVE INCOME
(in € millions) First‐half
2017
First‐half
2016
PROFIT FOR THE PERIOD 33.1 17.6
ITEMS THAT WILL NOT BE RECLASSIFIED TO PROFIT OR LOSS ‐ ‐
CHANGE IN VALUE OF CASH FLOW HEDGES(1) 0.7
DEFERRED TAXES ARISING ON CHANGE IN VALUE OF CASH FLOW HEDGES(1) (0.2)
ITEMS THAT MAY BE RECLASSIFIED TO PROFIT OR LOSS 0.5 (0.2)
FOREIGN CURRENCY TRANSLATION ADJUSTMENTS (0.9) (0.2)
OTHER COMPREHENSIVE INCOME (EXPENSE) ‐ (0.2)
TOTAL COMPREHENSIVE INCOME FOR THE PERIOD 32.7 17.4
ATTRIBUTABLE TO OWNERS OF THE PARENT 32.3 17.6
ATTRIBUTABLE TO NON‐CONTROLLING INTERESTS 0.4 (0.2)
(1) Change in value of the interest rate hedge for one of the tranches of the Schuldschein loan.

CONSOLIDATED FINANCIAL STATEMENTS
19 2017 Half‐year report
2 CONSOLIDATED STATEMENT OF FINANCIAL POSITION
Assets
(in € millions) Notes 30 June 2017 31 Dec. 2016
NON‐CURRENT ASSETS
INTANGIBLE ASSETS ‐ 71.3 67.6
GOODWILL 5.8 556.8 539.1
PROPERTY, PLANT AND EQUIPMENT ‐ 45.3 41.4
LONG‐TERM FINANCIAL ASSETS ‐ 26.6 26.7
RESIDUAL INTEREST IN LEASED ASSETS 5.9 95.0 77.4
OTHER LONG‐TERM RECEIVABLES ‐ 10.8 10.1
DEFERRED TAX ASSETS ‐ 16.4 13.9
TOTAL NON‐CURRENT ASSETS ‐ 822.2 776.2
CURRENT ASSETS
INVENTORIES 5.10 65.3 39.2
TRADE AND OTHER RECEIVABLES 5.10 925.6 882.2
RESIDUAL INTEREST IN LEASED ASSETS 5.9 30.2 29.7
CURRENT TAX ASSETS ‐ 9.1 5.6
OTHER CURRENT ASSETS
65.1 52.9
CASH AND CASH EQUIVALENTS 5.11 215.2 348.7
TOTAL CURRENT ASSETS ‐ 1,310.5 1,358.3
ASSETS HELD FOR SALE ‐ ‐
TOTAL ASSETS ‐ 2,132.7 2,134.5

CONSOLIDATED FINANCIAL STATEMENTS
20 2017 Half‐year report
Equity and liabilities
(in € millions) Notes 30 June 2017 31 Dec. 2016
SHARE CAPITAL 5.12 23.5 21.6
ADDITIONAL PAID‐IN CAPITAL AND RESERVES ‐ 317.0 140.2
PROFIT FOR THE PERIOD ATTRIBUTABLE TO OWNERS OF THE PARENT
‐ 32.6 39.6
EQUITY ATTRIBUTABLE TO OWNERS OF THE PARENT
373.1 201.4
NON‐CONTROLLING INTERESTS 5.12.4 67.1 77.6
TOTAL EQUITY 5.12 440.2 279.0
NON‐CURRENT LIABILITIES
FINANCIAL LIABILITIES 5.11 49.3 9.0
GROSS LIABILITY FOR PURCHASES OF LEASED ASSETS
54.4 52.5
BONDS 5.11 245.5 381.9
LONG‐TERM PROVISIONS 5.13 2.2 1.8
PROVISIONS FOR PENSIONS AND OTHER POST‐EMPLOYMENT BENEFIT OBLIGATIONS
5.13 44.5 43.2
OTHER NON‐CURRENT LIABILITIES
87.4 91.2
DEFERRED TAX LIABILITIES ‐ 6.4 6.3
TOTAL NON‐CURRENT LIABILITIES ‐ 489.7 585.9
CURRENT LIABILITIES
FINANCIAL LIABILITIES 5.11 119.2 135.8
GROSS LIABILITY FOR PURCHASES OF LEASED ASSETS
17.3 15.8
BONDS 5.11 5.3 7.3
SHORT‐TERM PROVISIONS 5.13 41.7 36.3
CURRENT TAX LIABILITIES ‐ 11.3 19.0
TRADE AND OTHER PAYABLES 5.10 850.6 908.0
OTHER CURRENT LIABILITIES 5.10 157.4 147.4
TOTAL CURRENT LIABILITIES ‐ 1,202.8 1,269.6
LIABILITIES RELATED TO ASSETS HELD FOR SALE ‐ ‐
TOTAL EQUITY AND LIABILITIES ‐ 2,132.7 2,134.5

CONSOLIDATED FINANCIAL STATEMENTS
21 2017 Half‐year report
3 CONSOLIDATED STATEMENT OF CHANGES IN EQUITY At 30 June 2016 and 30 June 2017
(in € millions) Number of shares
Share capital Additional paid‐in
capital(2)
Treasury shares
Consolidated reserves and
retained earnings
Other comprehensive
income (expense)
Equity attributable to owners
of the parent
Equity attributable
to non‐controlling interests
Total
BALANCE AT 1 JANUARY 2016 112,519,287 21.6 189.1 (43.1) 64.3 (3.8) 228.1 52.4 280.5
PROFIT FOR THE PERIOD ‐ ‐ ‐ ‐ 18.3 ‐ 18.3 (0.7) 17.6
OTHER COMPREHENSIVE INCOME (EXPENSE), NET OF TAX
‐ ‐ ‐ ‐ ‐ (0.7) (0.7) 0.5 (0.2)
TOTAL COMPREHENSIVE INCOME FOR FIRST‐HALF 2016
‐ ‐ ‐ ‐ 18.3 (0.7) 17.6 (0.2) 17.4
SHARE‐BASED PAYMENTS ‐ ‐ ‐ ‐ 0.4 ‐ 0.4 ‐ 0.4
REFUND OF ISSUE PREMIUMS ‐ ‐ (18.8) ‐ ‐ ‐ (18.8) ‐ (18.8)
TREASURY SHARE TRANSACTIONS ‐ ‐ ‐ 3.3 (10.8) ‐ (7.5) ‐ (7.5)
PUT AND CALL OPTIONS ON NON‐CONTROLLING INTERESTS
‐ ‐ ‐ ‐ (8.5) ‐ (8.5) ‐ (8.5)
NON‐CONTROLLING INTERESTS IN ACQUISITIONS IN THE PERIOD
‐ ‐ ‐ ‐ ‐ ‐ ‐ 7.1 7.1
OTHER TRANSACTIONS AND TRANSACTIONS WITH AN IMPACT ON NON‐CONTROLLING INTERESTS
‐ ‐ ‐ ‐ (1.0) ‐ (1.0) 1.2 0.2
BALANCE AT 30 JUNE 2016 112,519,287 21.6 170.3 (39.8) 62.7 (4.5) 210.3 60.5 270.8

CONSOLIDATED FINANCIAL STATEMENTS
22 2017 Half‐year report
(in € millions) Number of shares(1)
Share capital Additional paid‐in
capital(2)
Treasury shares
Consolidated reserves and
retained earnings
Other comprehensive
income (expense)
Equity attributable to owners
of the parent
Equity attributable
to non‐controlling interests
Total
BALANCE AT 1 JANUARY 2017 225,038,574 21.6 169.4 (50.5) 68.0 (7.1) 201.4 77.6 279.0
PROFIT FOR THE PERIOD 32.6 32.6 0.5 33.1
OTHER COMPREHENSIVE INCOME (EXPENSE), NET OF TAX
(0.3) (0.3) (0.1) (0.4)
TOTAL COMPREHENSIVE INCOME FOR FIRST‐HALF 2017
0.0 32.6 (0.3) 32.3 0.4 32.7
SHARE‐BASED PAYMENTS 0.5 0.5 0.5
REFUND OF ISSUE PREMIUMS (PAID IN AUGUST)
(24.5) 0.8 (23.7) (23.7)
ORNANE BOND CONVERSION 20,101,856 1.9 108.1 29.4 139.4 139.4
SALES OF TREASURY SHARES BACKING ORNANE BOND REDEMPTIONS
18.7 17.6 36.3 36.3
OTHER TREASURY SHARE TRANSACTIONS, NET
(19.1) (1.0) (20.1) (20.1)
PUT AND CALL OPTIONS ON NON‐CONTROLLING INTERESTS
(0.3) (0.3) (0.3)
NON‐CONTROLLING INTERESTS IN ACQUISITIONS IN THE PERIOD
0.0 0.0
OTHER TRANSACTIONS AND TRANSACTIONS WITH AN IMPACT ON NON‐CONTROLLING INTERESTS
7.3 7.3 (10.9) (3.6)
BALANCE AT 30 JUNE 2017 245,140,430 23.5 253.0 (50.9) 154.9 (7.4) 373.1 67.1 440.2
(1) After the Econocom Group two‐for‐one share split approved by the Extraordinary General Meeting of 16 May 2017.
(2) The €16.7 million difference between the issue premium in the Econocom Group statutory financial statements and the additional paid‐in capital in the IFRS consolidated financial statements is attributable to the different methods used to value Osiatis shares during the various phases completed to acquire a controlling interest in this group in 2013.

CONSOLIDATED FINANCIAL STATEMENTS
23 2017 Half‐year report
4 CONSOLIDATED STATEMENT OF CASH FLOWS For the six‐month periods ended 30 June 2017 and 30 June 2016
(in € millions) Notes First‐half 2017 First‐half 2016
PROFIT FOR THE PERIOD ‐ 33.1 17.6
ELIMINATION OF SHARE OF PROFIT (LOSS) OF ASSOCIATES AND JOINT VENTURES
5.14.1.1 ‐ 0.1
PROVISIONS, DEPRECIATION, AMORTISATION AND IMPAIRMENT 5.14.1.1 21.1 5.3
CHANGE IN FAIR VALUE OF THE ORNANE EMBEDDED DERIVATIVE COMPONENT
(4.1) 10.7
CHANGES IN RESIDUAL INTEREST IN LEASED ASSETS 5.14.1.1 (16.6) (2.8)
OTHER NON‐CASH EXPENSES (INCOME) 5.14.1.1 (1.3) (0.4)
CASH FLOWS FROM OPERATING ACTIVITIES AFTER COST OF NET DEBT AND INCOME TAX
‐ 32.2 30.5
INCOME TAX EXPENSE 5.6 11.3 14.0
COST OF NET DEBT ‐ 5.8 6.3
CASH FLOWS FROM OPERATING ACTIVITIES BEFORE COST OF NET DEBT AND INCOME TAX (A)
‐ 49.3 50.8
CHANGE IN WORKING CAPITAL (B), OF WHICH:
INVESTMENTS IN SELF‐FUNDED TMF CONTRACTS
OTHER CHANGES IN WORKING CAPITAL
5.14.1.2
(117.6)
(11.8)
(105.8)
(91.9)
(15.0)
(76.9)
TAX PAID NET OF TAX CREDITS (C) ‐ (13.8) (13.9)
NET CASH FROM (USED IN) OPERATING ACTIVITIES (A+B+C=D) 5.14.1 (82.1) (55.0)
OF WHICH CASH FLOW RELATED TO DISCONTINUED OPERATIONS ‐ ‐ ‐
ACQUISITION OF PROPERTY, PLANT AND EQUIPMENT AND INTANGIBLE ASSETS
5.14.2 (18.4) (14.5)
DISPOSAL OF PROPERTY, PLANT AND EQUIPMENT AND INTANGIBLE ASSETS
‐ 0.2 0.1
ACQUISITION OF LONG‐TERM FINANCIAL ASSETS ‐ (0.7) (1.4)
DISPOSAL OF LONG‐TERM FINANCIAL ASSETS ‐ 0.3 ‐
ACQUISITION OF COMPANIES AND BUSINESSES, NET OF CASH ACQUIRED
5.14.2 (25.9) (4.3)
DISPOSAL OF COMPANIES AND BUSINESSES, NET OF CASH SOLD ‐ ‐ ‐
NET CASH FROM (USED IN) INVESTING ACTIVITIES (E) 5.14.2 (44.5) (20.1)
OF WHICH CASH FLOW RELATED TO DISCONTINUED OPERATIONS ‐ ‐ ‐
CONSOLIDATED FINANCIAL STATEMENTS
24 2017 Half‐year report
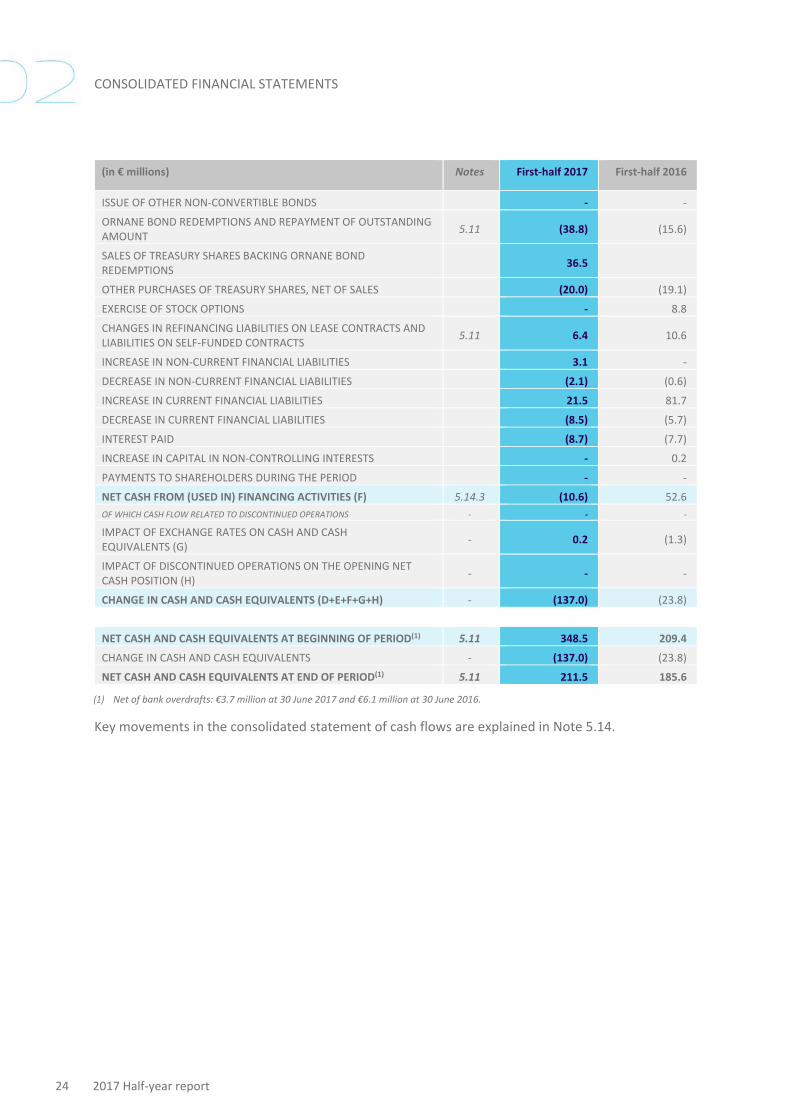
(in € millions) Notes First‐half 2017 First‐half 2016
ISSUE OF OTHER NON‐CONVERTIBLE BONDS ‐ ‐
ORNANE BOND REDEMPTIONS AND REPAYMENT OF OUTSTANDING AMOUNT
5.11 (38.8) (15.6)
SALES OF TREASURY SHARES BACKING ORNANE BOND REDEMPTIONS
36.5
OTHER PURCHASES OF TREASURY SHARES, NET OF SALES (20.0) (19.1)
EXERCISE OF STOCK OPTIONS ‐ 8.8
CHANGES IN REFINANCING LIABILITIES ON LEASE CONTRACTS AND LIABILITIES ON SELF‐FUNDED CONTRACTS
5.11 6.4 10.6
INCREASE IN NON‐CURRENT FINANCIAL LIABILITIES 3.1 ‐
DECREASE IN NON‐CURRENT FINANCIAL LIABILITIES (2.1) (0.6)
INCREASE IN CURRENT FINANCIAL LIABILITIES 21.5 81.7
DECREASE IN CURRENT FINANCIAL LIABILITIES (8.5) (5.7)
INTEREST PAID (8.7) (7.7)
INCREASE IN CAPITAL IN NON‐CONTROLLING INTERESTS ‐ 0.2
PAYMENTS TO SHAREHOLDERS DURING THE PERIOD ‐ ‐
NET CASH FROM (USED IN) FINANCING ACTIVITIES (F) 5.14.3 (10.6) 52.6
OF WHICH CASH FLOW RELATED TO DISCONTINUED OPERATIONS ‐ ‐ ‐
IMPACT OF EXCHANGE RATES ON CASH AND CASH EQUIVALENTS (G)
‐ 0.2 (1.3)
IMPACT OF DISCONTINUED OPERATIONS ON THE OPENING NET CASH POSITION (H)
‐ ‐ ‐
CHANGE IN CASH AND CASH EQUIVALENTS (D+E+F+G+H) ‐ (137.0) (23.8)
NET CASH AND CASH EQUIVALENTS AT BEGINNING OF PERIOD(1) 5.11 348.5 209.4
CHANGE IN CASH AND CASH EQUIVALENTS ‐ (137.0) (23.8)
NET CASH AND CASH EQUIVALENTS AT END OF PERIOD(1) 5.11 211.5 185.6
(1) Net of bank overdrafts: €3.7 million at 30 June 2017 and €6.1 million at 30 June 2016.
Key movements in the consolidated statement of cash flows are explained in Note 5.14.

CONSOLIDATED FINANCIAL STATEMENTS
25 2017 Half‐year report
5 NOTES TO THE CONSOLIDATED FINANCIAL STATEMENTS
5.1 ACCOUNTING POLICIES
5.1.1 STATEMENT OF COMPLIANCE AND BASIS OF PREPARATION
The condensed consolidated financial statements for the six months ended 30 June 2017 have been
prepared in accordance with IAS 34 – Interim Financial Reporting and with IFRS as adopted by the
European Union at 30 June 2017(1).
The condensed consolidated financial statements of Econocom Group include the financial statements
of Econocom Group SE and of its subsidiaries, presented in millions of euros. Amounts have been
rounded off to the nearest decimal point and in certain cases, this may result in minor discrepancies
in the totals and sub‐totals in the tables.
The condensed consolidated financial statements were approved for issue by the Board of Directors
on 27 July 2017 and have not been reviewed by the Statutory Auditors.
The interim financial statements comply with exactly the same accounting rules and policies as those
used in the financial statements for the year ended 31 December 2016, as set forth in the 2016 annual
report, except for the items described in Note 5.1.2.1 below on accounting standards mandatorily
applicable as of 1 January 2017.
The interim financial statements therefore comply with the minimum disclosure requirements of IAS
34 and consequently, should be read in conjunction with the audited consolidated financial statements
for the year ended 31 December 2016 included in the 2016 annual report.
The specific rules for preparing half‐year financial statements are as follows:
5.1.1.1 ASSESSMENT METHODS SPECIFIC TO HALF‐YEAR FINANCIAL STATEMENTS
5.1.1.1.1 Provisions for post‐employment benefits
The post‐employment benefit expense for the first half of 2017 is calculated on the basis of actuarial
assessments made at the end of the previous period. Where applicable, these assessments are
adjusted to allow for curtailments, settlements or other major non‐recurring events which took place
during the half‐year period.
5.1.1.1.2 Income tax
In the half‐year financial statements, current and deferred income tax expense is calculated by
multiplying accounting result for the period, for each tax entity, by the estimated average income tax
rate for the current year. Where applicable, this expense is adjusted for the tax impact of non‐recurring
items during the period.
(1) Available on: http://ec.europa.eu/internal_market/accounting/ias/index_en.htm.

CONSOLIDATED FINANCIAL STATEMENTS
26 2017 Half‐year report
5.1.1.1.3 Goodwill
Goodwill is tested for impairment at each year‐end using the method described in Note 9.3 to the
consolidated financial statements included in the 2016 annual report, and whenever there is an
indication that it may be impaired.
5.1.1.2 USE OF ESTIMATIONS
The preparation of Econocom Group’s condensed consolidated half‐year financial statements requires
the use of various estimates and assumptions deemed realistic or reasonable. Events or circumstances
may result in changes to these estimates or assumptions, which could affect the value of the Group’s
assets, liabilities, equity or profit.
The main accounting policies requiring the use of estimates generally concern:
• goodwill impairment;
• measurement of residual interest (Technology Management & Financing business);
• measurement of provisions.
At the date on which the Board of Directors reviewed the condensed consolidated half‐year financial
statements, it considered that the estimates best reflected all of the information that was available to
it.
5.1.2 NEW STANDARDS, AMENDMENTS AND INTERPRETATIONS
5.1.2.1 NEW STANDARDS AND INTERPRETATIONS MANDATORILY APPLICABLE FOR ACCOUNTING PERIODS BEGINNING ON OR AFTER 1 JANUARY 2107
The new standards, amendments and interpretations mandatorily applicable for accounting periods
beginning on or after 1 January 2017 did not have a material impact on the Group’s half‐year financial
statements.
5.1.2.2 STANDARDS AND INTERPRETATIONS ADOPTED BY THE IASB BUT NOT YET APPLICABLE AT 30 JUNE 2017
The Group did not early adopt any of the following standards and interpretations:
5.1.2.2.1 IFRS 9 – Financial Instruments (applicable as of 1 January 2018)
IFRS 9 modifies the classification and measurement of financial assets and introduces a new
impairment model based on expected losses. The Group is currently analysing the impacts of IFRS 9;
however, no material impacts are expected as regards the classification of financial assets and
liabilities. The impact of IFRS 9 on impairment assessments will be analysed during the second half of
2017.

CONSOLIDATED FINANCIAL STATEMENTS
27 2017 Half‐year report
5.1.2.2.2 IFRS 15 – Recognition of the revenue from Contracts with Customers (applicable as of 1
January 2018)
IFRS 15 replaces IAS 11, IAS 18 and the related IFRIC and SIC interpretations dealing with revenue
recognition, and introduces a new model of accounting for revenue.
Econocom carried out a groupwide project aiming at bringing its revenue recognition policy in line with
IFRS 15. This project covered each of the Group’s businesses (TMF, Services, and Products & Solutions)
and consisted of three main areas of work:
• selection of the main contracts and transactions representative of the Group’s current and future business: the selected contracts and transactions were then analysed in light of the five‐step model set out in IFRS 15 for identifying any changes resulting from applying the new standard;
• review and adjustment of revenue recognition processes in the Group’s information systems;
• introduction of an internal control process within the Group and organisation of training sessions involving all parties affected by the Group’s revenue recognition policy.
No material changes came to light as a result of the Group’s analyses of performance obligations and
the triggering event for revenue recognition:
• For trading activities, mainly within the Products & Solutions business, revenue continues to be recognised when the goods are delivered.
• In the Services business:
− for maintenance activities, revenue continues to be recognised on a percentage‐of‐completion basis;
− for outsourcing activities, projects continue to be split into a “build” phase and a “run” phase insofar as the deliverables are deemed to be distinct; revenue continues to be recognised on a percentage‐of‐completion basis for both phases, as and when control is transferred;
− for activities involving employees under time and materials contracts, revenue continues to be recognised on a time spent basis; for the development of applications under fixed‐price contracts, revenue continues to be accounted for on a percentage‐of‐completion basis, as and when control is transferred;
− for infrastructure installation projects, the percentage‐of‐completion method still applies insofar as the transfer of control occurs over time.
For certain fixed‐price contracts providing for a number of different service obligations, the transaction
price is to be reallocated to the different performance obligations on a case‐by‐case basis in order to
reflect the economic value of the services rendered (which may differ from their contractual value).
Besides, based on an analysis of its relationship with the end customer, Econocom considers that it
acts as agent rather than principal for certain commercial transactions in the Products & Solutions
business and, to a lesser extent, in the Services business. For example, this applies to the sales of
licences or equipment where the supplier delivers directly to the end customer. In these cases,
Econocom will recognise in revenue only the margin on its activities as agent.

CONSOLIDATED FINANCIAL STATEMENTS
28 2017 Half‐year report
The impacts of applying IFRS 15 will be set out in the notes to the consolidated financial statements
for the year ended 31 December 2017.
Econocom intends to use the retrospective method in order to ensure a meaningful comparison
between its 2017 and 2018 figures.
5.1.2.2.3 IFRS 16 – Leases (applicable as of 1 January 2019)
IFRS 16 replaces IAS 17 and the related IFRIC and SIC interpretations and introduces new rules of
accounting for leases. The Group has launched a project to prepare for the application of this new
standard.
Virtually all of Econocom’s lease transactions involving the Group as lessor relate to finance leases,
under which Econocom acts as lessor‐distributor. In such cases, no changes are expected to the
Group’s accounting policies.
Some transactions of sale and leaseback‐type will be accounted for:
‐ in accordance with IFRS 9 (to which IFRS 16 refers) when the conditions for recognising, between the
lessee and Econocom, a sale within the meaning of IFRS 15 are not met;
‐ in accordance with IFRS 16 (direct finance lease) if the transfer of the asset to Econocom by the lessee
meets the criteria set out in IFRS 15.
In both cases, Econocom will recognise a financial asset. Revenue will not be recognised at the
transaction date and financial income relating to operating activities will be recognised over the entire
lease term based on the implicit interest rate in the lease.
In the case of a sale without recourse to a refinancing institution of a sale and leaseback agreement,
the corresponding margin will be recognised at the date of sale.
The Group is currently analysing the impacts of IFRS 16, which will be disclosed at the latest in the
notes to the consolidated financial statements for the year ended 31 December 2018. At this point in
time, Econocom does not envisage early adopting IFRS 16.
As regards lessee accounting, the minimum impact on the statement of financial position (increase in
non‐current assets and financial liabilities) of the first‐time application of IFRS 16 can be seen in the
amounts shown for firm lease commitments at 31 December 2016 (see 2016 annual report, section
20.5 of the consolidated financial statements).
5.1.3 CHANGES IN ACCOUNTING POLICY
There were no changes in accounting policy in the first half of 2017.

CONSOLIDATED FINANCIAL STATEMENTS
29 2017 Half‐year report
5.2 CHANGES IN THE SCOPE OF CONSOLIDATION IN THE FIRST HALF OF 2017
5.2.1 ACQUISITIONS
In the first half of 2017, Econocom acquired a controlling interest in two companies in key sectors with
high growth potential:
• BIS: Econocom took a controlling interest in this Dutch group, acquiring 100% of its capital in April 2017.
• LP Digital Agency: Econocom took a controlling interest in this company, acquiring 100% of its capital in April 2017 through its subsidiary Alter Way.
The cost of acquiring the shares in these two companies was €22.3 million. Total goodwill recognised
for the half‐year period for these two acquisitions amounted to €17.7 million.
The revised IFRS 3 provides for a “measurement period” which ends one year after the acquisition date
and during which the Group may recognise adjustments to provisional amounts of goodwill (see
Note 9 of the consolidated financial statements in the 2016 annual report).
Econocom also acquired 40% of JTRS, a UK company specialising in the supply of IT equipment and
associated services in the education segment. Econocom has a call option on additional shares in JTRS,
which it may exercise in the future. Since Econocom Group has significant influence over this entity,
JTRS is accounted for by the equity method in its consolidated financial statements.
Cash outlays in respect of all these acquisitions totalled €22.7 million (see Note 5.14.2 below).
5.2.2 CHANGES IN OWNERSHIP INTEREST
During the first half of 2017, the Group also carried out the transactions described below:
• Helis: the Group acquired an additional 20% stake in this company, bringing its ownership interest in Helis to 65%.
• Econocom Brasil (formerly Interadapt): Econocom Group acquired the shares of the founding shareholders (representing 35.98% of its share capital), bringing its ownership interest in Econocom Brasil to 92.85%.
• Aragon: through its subsidiary Digital Dimension, Econocom exercised its commitment to buy back all Aragon shares held by non‐controlling shareholders.

CONSOLIDATED FINANCIAL STATEMENTS
30 2017 Half‐year report
5.3 SEGMENT REPORTING
The Group’s operations break down into three operating business segments:
• Technology Management & Financing (TMF)
• Services
• Products & Solutions
Revenue and segment results
Internal transactions include:
• sales of goods and services: the Group ensures that these transactions are performed at arm’s length and that it does not carry any significant internal margins. In most cases, purchased internal goods and services are in turn sold on to end clients;
• cross‐charging of overheads and personnel costs;
• cross‐charging of financial expenses.
The Group’s segment profits correspond to “Recurring operating profit from ordinary activities”. This
segment indicator, used for the application of IFRS 8, is used by management to monitor the
performance of operating activities and allocate resources.
It corresponds to operating profit before non‐recurring operating income and expenses and the
amortisation of intangible assets from acquisitions (ECS customer portfolio and Osiatis brand).

CONSOLIDATED FINANCIAL STATEMENTS
31 2017 Half‐year report
5.3.1 REPORTING BY OPERATING BUSINESS SEGMENT
The following table presents the contribution of each operating business segment to the Group’s
financial statements (in € millions):
Technology Management & Financing
Services Products & Solutions
Total
First‐half 2017
REVENUE
REVENUE FROM EXTERNAL CLIENTS 603.9 430.1 246.2 1,280.2
INTERNAL REVENUE 8.3 38.7 46.2 93.2
TOTAL – REVENUE FROM OPERATING SEGMENTS 612.2 468.8 292.4 1,373.4
RECURRING OPERATING PROFIT FROM ACTIVITIES(1) 38.1 14.6 5.5 58.2
AMORTISATION OF THE ECS CUSTOMER PORTFOLIO AND THE OSIATIS BRAND
(1.0) (1.1) ‐ (2.1)
RECURRING OPERATING PROFIT FROM ACTIVITIES 37.1 13.5 5.5 56.1
First‐half 2016
REVENUE
REVENUE FROM EXTERNAL CLIENTS 613.0 387.9 210.7 1,211.6
INTERNAL REVENUE 5.1 30.3 32.5 67.9
TOTAL – REVENUE FROM OPERATING SEGMENTS 618.1 418.2 243.2 1,279.5
RECURRING OPERATING PROFIT FROM ACTIVITIES(1) 30.7 18.5 4.1 53.3
AMORTISATION OF THE ECS CUSTOMER PORTFOLIO AND THE OSIATIS BRAND
(1.0) (1.1) ‐ (2.1)
RECURRING OPERATING PROFIT FROM ACTIVITIES 29.7 17.4 4.1 51.2
(1) Before amortisation of intangible assets from acquisitions
5.3.2 BREAKDOWN OF REVENUE BY GEOGRAPHICAL AREA
(in € millions) First‐half 2017 First‐half 2016 Change
FRANCE 675.2 641.3 5.3%
BENELUX 169.4 174.1 ‐2.7%
SOUTHERN EUROPE(1) 292.7 228.7 28.0%
NORTHERN & EASTERN EUROPE 123.5 147.8 ‐16.4%
AMERICAS 19.4 19.7 ‐1.5%
TOTAL 1,280.2 1,211.6 5.7%
(1) Including transactions in Morocco.

CONSOLIDATED FINANCIAL STATEMENTS
32 2017 Half‐year report
5.4 NON‐RECURRING OPERATING INCOME AND EXPENSES
(in € millions) First‐half 2017 First‐half 2016
REORGANISATION COSTS (9.9) (1.3)
ACQUISITION COSTS (1.0) (0.3)
NON‐RECURRING OPERATING EXPENSES (10.9) (1.6)
OTHER OPERATING INCOME 2.0 0.1
NON‐RECURRING OPERATING INCOME 2.0 0.1
TOTAL (8.9) (1.5)
In first‐half 2017, reorganisation costs net of provision reversals amounted to €9.9 million and mainly
concerned the Services business in France. Non‐recurring operating income primarily relates to
remeasurements of acquisition‐related liabilities (€1.9 million).
In the first half of 2016, reorganisation costs net of provision reversals amounted to €1.3 million and
mainly concerned the Services business in France.
5.5 NET FINANCIAL EXPENSE
(in € millions) First‐half 2017 First‐half 2016
FINANCIAL INCOME 0.3 0.3
FINANCIAL EXPENSES
ORNANE BOND REDEMPTION COSTS (0.3) (1.3)
ACCELERATED AMORTISATION OF BOND ISSUE COSTS (0.5)
INTEREST EXPENSE ON BONDS (3.6) (3.8)
INTEREST COST OF RETIREMENT BENEFITS AND OTHER POST‐EMPLOYMENT BENEFITS
(0.3) (0.3)
OTHER FINANCIAL EXPENSES (2.4) (2.2)
FINANCIAL EXPENSES (7.1) (7.6)
OTHER FINANCIAL INCOME AND EXPENSES (6.8) (7.3)
CHANGE IN FAIR VALUE OF THE ORNANE EMBEDDED DERIVATIVE COMPONENT
4.1 (10.7)
NET FINANCIAL EXPENSE (2.7) (18.0)
In the first half of 2017, the non‐recurring items include changes in the fair value of the
ORNANE embedded derivative component, representing an income of €4.1 million. In addition, the
redemption by Econocom of 2,698,900 ORNANE bonds generated an expense (before the
corresponding tax saving) of €0.3 million and the early conversion of 10,050,928 of ORNANE bonds
resulted in a €0.5 million expense relating to the accelerated amortisation of the issue cost.
In the first half of 2016, non‐recurring items comprised changes in the fair value of the
ORNANE embedded derivative component for ‐€10.7 million and an expense of €1.3 million (before
the corresponding tax saving) relating to the cost of redeeming 1,265,000 ORNANE bonds.
CONSOLIDATED FINANCIAL STATEMENTS
33 2017 Half‐year report
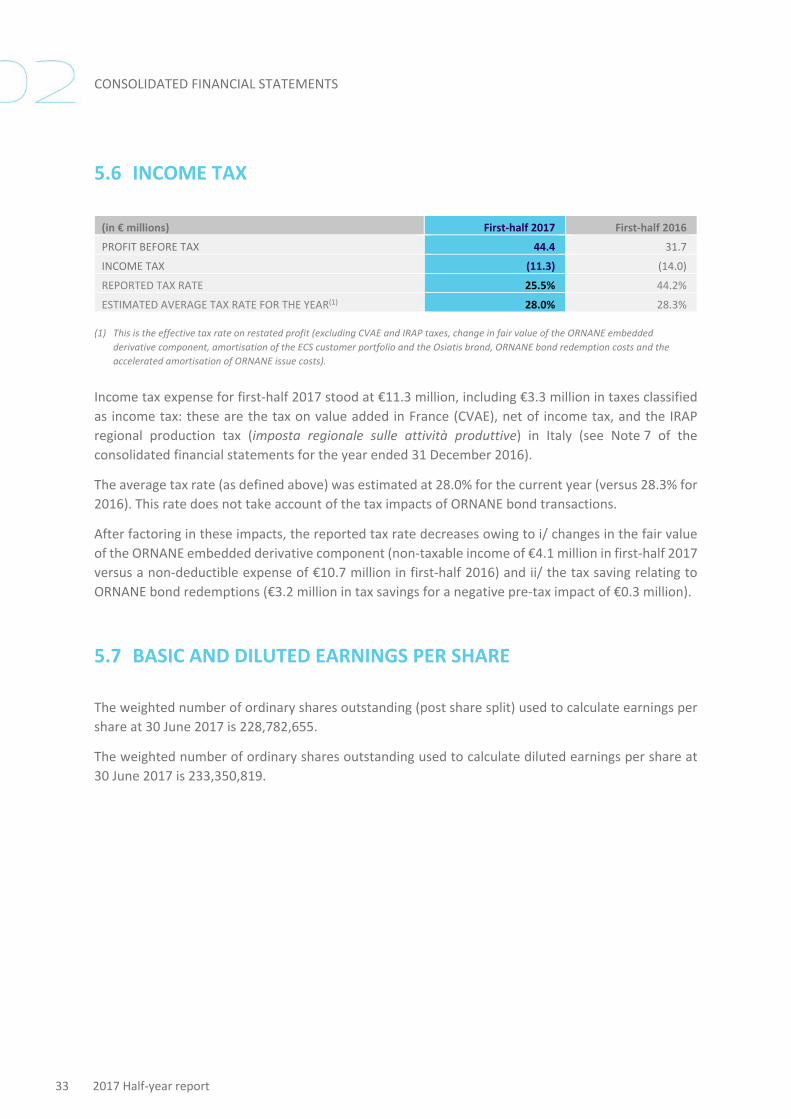
5.6 INCOME TAX
(in € millions) First‐half 2017 First‐half 2016
PROFIT BEFORE TAX 44.4 31.7
INCOME TAX (11.3) (14.0)
REPORTED TAX RATE 25.5% 44.2%
ESTIMATED AVERAGE TAX RATE FOR THE YEAR(1) 28.0% 28.3%
(1) This is the effective tax rate on restated profit (excluding CVAE and IRAP taxes, change in fair value of the ORNANE embedded
derivative component, amortisation of the ECS customer portfolio and the Osiatis brand, ORNANE bond redemption costs and the
accelerated amortisation of ORNANE issue costs).
Income tax expense for first‐half 2017 stood at €11.3 million, including €3.3 million in taxes classified
as income tax: these are the tax on value added in France (CVAE), net of income tax, and the IRAP
regional production tax (imposta regionale sulle attività produttive) in Italy (see Note 7 of the
consolidated financial statements for the year ended 31 December 2016).
The average tax rate (as defined above) was estimated at 28.0% for the current year (versus 28.3% for
2016). This rate does not take account of the tax impacts of ORNANE bond transactions.
After factoring in these impacts, the reported tax rate decreases owing to i/ changes in the fair value
of the ORNANE embedded derivative component (non‐taxable income of €4.1 million in first‐half 2017
versus a non‐deductible expense of €10.7 million in first‐half 2016) and ii/ the tax saving relating to
ORNANE bond redemptions (€3.2 million in tax savings for a negative pre‐tax impact of €0.3 million).
5.7 BASIC AND DILUTED EARNINGS PER SHARE
The weighted number of ordinary shares outstanding (post share split) used to calculate earnings per
share at 30 June 2017 is 228,782,655.
The weighted number of ordinary shares outstanding used to calculate diluted earnings per share at
30 June 2017 is 233,350,819.

CONSOLIDATED FINANCIAL STATEMENTS
34 2017 Half‐year report
5.8 GOODWILL
For the purposes of impairment testing, goodwill is allocated to cash generating units (CGUs):
Regarding the Group’s acquisitions in first‐half 2017, LP Digital Agency was included within the Services
CGU and BIS within the Products & Solutions CGU. Other changes correspond to adjustments to
goodwill for companies acquired in 2016 (€0.5 million).
The Group did not identify any evidence that an impairment test should be performed.
5.9 RESIDUAL INTEREST IN LEASED ASSETS
Residual interest in leased assets reflects the market value of the assets concerned.
(in € millions) 30 June 2017 31 Dec. 2016
RESIDUAL INTEREST IN LEASED ASSETS –
NON‐CURRENT PORTION
95.0 77.4
RESIDUAL INTEREST IN LEASED ASSETS –
CURRENT PORTION
30.2 29.7
TOTAL 125.2 107.1
The Group regularly revises its estimates of the residual interest in leased assets using a statistical
method based on its experience of second‐hand markets. These revisions, which in the current period
mainly concerned IT assets leased under Technology Refresh Option (TRO) contracts, along with the
recognition of residual interest in other leases, resulted in a residual value of €125.2 million at
30 June 2017 for a portfolio of leased assets representing €5,509 million (purchase price of leased
assets). The Group’s residual interest in leased assets therefore stood at 2.3% of the purchase price of
assets in its portfolio at end‐June (versus 2.0% at end‐December 2016).
(in € millions) Technology Management &
Financing
Services Products & Solutions
Total
GOODWILL AT 1 JANUARY 2017 114.6 405.7 18.8 539.1
ACQUISITIONS ‐ 2.5 15.2 17.7
DISPOSALS ‐ ‐ ‐ ‐
OTHER CHANGES ‐ 0.5 ‐ 0.5
FOREIGN CURRENCY TRANSLATION ADJUSTMENTS
‐ (0.5) ‐ (0.5)
IMPAIRMENT ‐ ‐ ‐ ‐
GOODWILL AT 30 JUNE 2017 114.6 408.2 34.0 556.8
OF WHICH GROSS AMOUNT 561.1
OF WHICH ACCUMULATED IMPAIRMENT
(4.3)
CONSOLIDATED FINANCIAL STATEMENTS
35 2017 Half‐year report
Changes in the Group’s residual interest in IT assets leased under TRO contracts account for the main
part of the net increase in this item between 31 December 2016 and 30 June 2017. As most TRO
contracts are renewed every six months (with existing contracts therefore renewed in the first half),
the expected impact of applying these new residual interest estimates on second‐half profit is not
considered material.
Residual interest in leased assets concerns IT assets and industrial assets amounting to €120.8 million
and €4.4 million, respectively, at end‐June 2017 (€103.4 million and €3.7 million, respectively, at
end‐December 2016).
5.10 CURRENT OPERATING ASSETS AND LIABILITIES
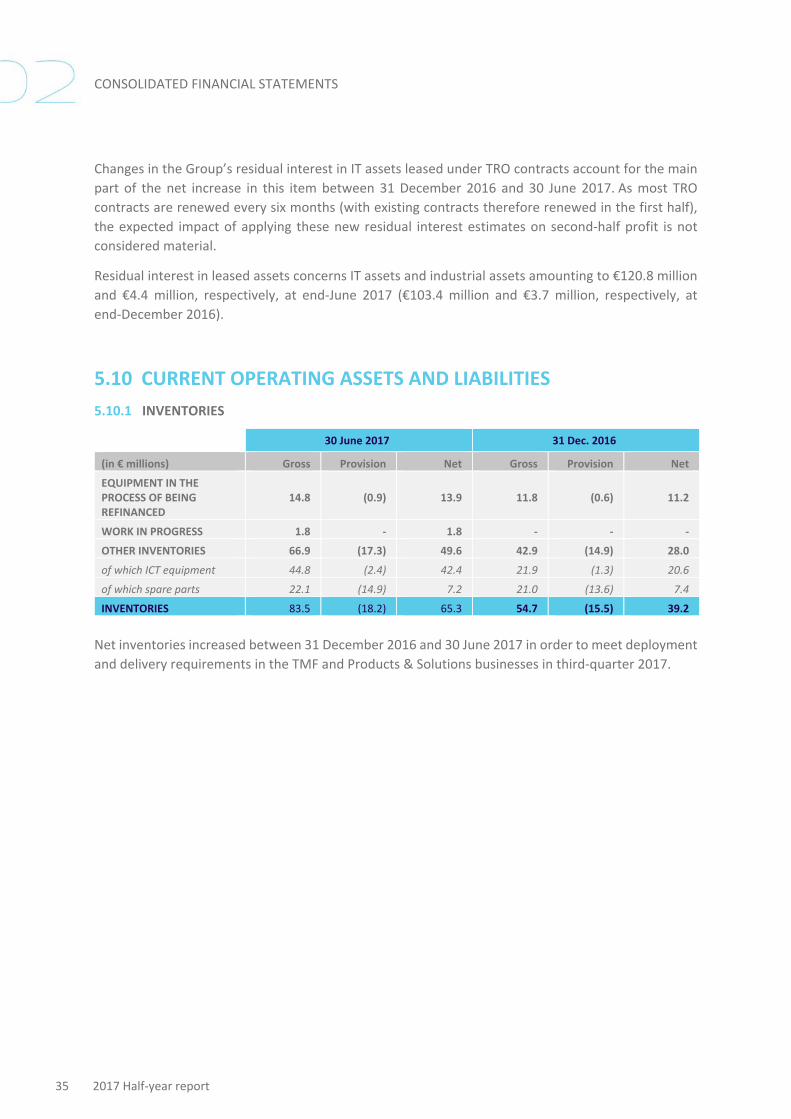
5.10.1 INVENTORIES
30 June 2017 31 Dec. 2016
(in € millions) Gross Provision Net Gross Provision Net
EQUIPMENT IN THE PROCESS OF BEING REFINANCED
14.8 (0.9) 13.9 11.8 (0.6) 11.2
WORK IN PROGRESS 1.8 ‐ 1.8 ‐ ‐ ‐
OTHER INVENTORIES 66.9 (17.3) 49.6 42.9 (14.9) 28.0
of which ICT equipment 44.8 (2.4) 42.4 21.9 (1.3) 20.6
of which spare parts 22.1 (14.9) 7.2 21.0 (13.6) 7.4
INVENTORIES 83.5 (18.2) 65.3 54.7 (15.5) 39.2
Net inventories increased between 31 December 2016 and 30 June 2017 in order to meet deployment
and delivery requirements in the TMF and Products & Solutions businesses in third‐quarter 2017.

CONSOLIDATED FINANCIAL STATEMENTS
36 2017 Half‐year report
5.10.2 TRADE AND OTHER RECEIVABLES
30 June 2017 31 Dec. 2016
(in € millions) Gross Impair. Net Gross Impair. Net
TRADE RECEIVABLES 905.3 (49.0) 856.3 849.5 (47.4) 802.1
OTHER RECEIVABLES 75.6 (6.3) 69.3 84.7 (4.6) 80.1
TRADE AND OTHER RECEIVABLES
980.9 (55.3) 925.6 934.2 (52.0) 882.2
The decrease in other receivables chiefly concerns short‐term guarantee deposits related to factored
receivables.
Changes in trade receivables are broken down below by business:
30 June 2017 31 Dec. 2016
(in € millions) Receivables invoiced,
net
Lease payments
outstanding
Revenue accruals
Total
Receivables invoiced,
net(1)
Lease payments
outstanding(1)
Revenue accruals
Total
TECHNOLOGY MANAGEMENT & FINANCING
221.2 384.1 7.1 612.4 255.9 331.5 8.3 595.7
Trade receivables refinanced or in the process of being refinanced
55.5 384.1 ‐ 439.6 96.1 331.5 ‐ 427.6
User trade receivables (lease payments outstanding refinanced but invoiced by Econocom)
165.7 ‐ 7.1 172.8 159.8 ‐ 8.3 168.1
SERVICES 82.4 ‐ 88.0 170.4 106.7 ‐ 58.1 164.8
PRODUCTS & SOLUTIONS
53.7 ‐ 19.8 73.5 30.3 ‐ 11.3 41.6
TOTAL 357.3 384.1 114.9 856.3 392.9 331.5 77.7 802.1
(1) After reclassification of impairment within lease payments outstanding at 31 December 2016.
The rise in trade receivables reflects the impact of changes in the scope of consolidation (particularly in the Products & Solutions business following the acquisition of BIS) and usual seasonal impacts on invoicing.

CONSOLIDATED FINANCIAL STATEMENTS
37 2017 Half‐year report
Breakdown of trade receivables by type of client and by due date:
(in € millions)
Carrying amount
Receivables not past due
Breakdown by due date
Total past due
receivables
< 60 days 60‐90 days > 90 days
REFINANCING INSTITUTIONS 55.5 29.3 26.2 24.6 0.3 1.3
OTHER RECEIVABLES 849.8 695.4 154.4 56.2 14.0 84.2
IMPAIRMENT OF DOUBTFUL RECEIVABLES
(49.0) (13.8) (35.2) (0.1) ‐ (35.1)
TRADE AND OTHER RECEIVABLES, NET
856.3 710.9 145.4 80.7 14.3 50.4
Refinancing institutions correspond to financial institutions that are subsidiaries of banks. Other receivables correspond to the Group’s end clients, mainly companies and public‐sector bodies in the eurozone. Impairment losses on doubtful receivables include impairment of disputed receivables, impairment of past due receivables and provisions for lease receivables that are self‐financed or refinanced with recourse.
5.10.3 TRADE AND OTHER PAYABLES AND OTHER CURRENT LIABILITIES
The decrease in trade and other payables can be analysed as follows:
(in € millions) 30 June 2017 31 Dec. 2016
TRADE PAYABLES 638.1 635.6
OTHER PAYABLES 212.4 272.4
TRADE AND OTHER PAYABLES 850.6 908.0
The decrease in other payables results primarily from the elimination of the ORNANE embedded
derivative liability following the conversion of ORNANE bonds:
(in € millions) 30 June 2017 31 Dec. 2016
ACCRUED TAXES AND PERSONNEL COSTS 182.3 220.2
REFUND OF THE PREMIUM DUE* TO SHAREHOLDERS 24.3 0.6
ORNANE EMBEDDED DERIVATIVE COMPONENT ‐ 45.4
CUSTOMER PREPAYMENTS AND OTHER PAYABLES 5.8 6.2
OTHER PAYABLES 212.4 272.4
* In August 2017.

CONSOLIDATED FINANCIAL STATEMENTS
38 2017 Half‐year report
Other current liabilities can be analysed as follows:
(in € millions) 30 June 2017 31 Dec. 2016
ACQUISITION‐RELATED LIABILITIES – CURRENT PORTION 3.8 4.6
DEFERRED INCOME 142.0 136.4
OTHER LIABILITIES 11.6 6.4
OTHER CURRENT LIABILITIES 157.4 147.4

CONSOLIDATED FINANCIAL STATEMENTS
39 2017 Half‐year report
5.11 NET CASH AND NET DEBT
(in € millions) 31 Dec. 2016 Monetary flows
Newly consolidated companies
Amortised cost of debt
Exchange rate impact
Impact of ORNANE
bond conversion
30 June 2017
CASH AND CASH EQUIVALENTS*
348.7 (137.2) 3.5 0.2 215.2
BANK OVERDRAFTS (0.2) (3.4) (0.1) (3.7)
CASH AND CASH EQUIVALENTS NET OF BANK OVERDRAFTS (1)
348.5 (140.6) 3.4 0.2 211.5
BANK DEBT AND COMMERCIAL PAPER
(63.9) (13.6) 0.1 (77.4)
NET CASH AT BANK 284.6 (154.2) 3.4 0.3 134.2
CONVERTIBLE BOND DEBT (ORNANE)
(137.5) 31.0 (2) (1.7) 108.2 (2) ‐
NON‐CONVERTIBLE BOND DEBT (EURO PP)
(102.0) 2.6 (3) (1.4) (100.8)
NON‐CONVERTIBLE BOND DEBT (SCHULDSCHEIN)
(149.6) 1.1 (3) (1.5) (150.0)
LEASE CONTRACTS WITH RECOURSE
(65.9) (6.4) (72.3)
FACTORING LIABILITIES WITH RECOURSE
(8.6) 2.0 (6.6)
OTHER LIABILITIES WITH RECOURSE
(2.9) (2.9)
FINANCE LEASE LIABILITIES
(3.3) (2.4) (5.7)
SUB‐TOTAL (469.8) 27.8 (4.6) 108.2 (338.3)
NET DEBT (185.2) (126.4) 3.4 (4.6) 0.3 108.2 (204.1)
* Positive gross cash.
(1) The €137 million decrease in net cash and cash equivalents as presented in the statement of cash flows reflects the sum of monetary
outflows totalling €140.6 million, cash inflows from newly consolidated companies totalling €3.4 million and translation losses
totalling €0.2 million.
(2) ORNANE: the monetary flow relates mainly to the €2.0 million coupon payment and to the portion of debt eliminated following the
redemption of ORNANE bonds by Econocom in an amount of €28.9 million. The coupon paid is shown within “Interest paid” in the
consolidated statement of cash flows. Total disbursements made to redeem ORNANE bonds at 30 June 2017 amount to €38.8 million
and reflect the decrease in the debt shown on this line (€28.9 million), as well as part of the decrease in the ORNANE embedded
derivative component (€9.6 million – see Note 5.10.3). The conversion of 10,050,928 ORNANE bonds during the period also led to a
decrease of €108.2 million in debt.
(3) Monetary flows relating to non‐convertible bond debt (Euro PP and Schuldschein) reflect coupon payments during the first half. The
bond coupons paid are shown within “Interest paid” in the consolidated statement of cash flows.
Based on an equity of €440.2 billion at 30 June 2017, gearing (net debt as a percentage of equity) came
out at 46.4% (66.3% at 31 December 2016 and 105.3% at 30 June 2016).

CONSOLIDATED FINANCIAL STATEMENTS
40 2017 Half‐year report
5.12 EQUITY
5.12.1 SHARE CAPITAL OF ECONOCOM GROUP SE
NUMBER OF SHARES VALUE (IN € MILLIONS)
Total (1)
Treasury shares (1) (2)
Outstanding Share capital Additional
paid‐in capital Treasury shares
At 31 December 2016 225,038,574 10,796,728 214,241,846 21.6 169.4 (50.5)
Sale of treasury shares backing ORNANE bond redemptions ‐ (5,160,040) 5,160,040 ‐ ‐ 18.7
Purchases of treasury shares, net of sales ‐ 2,816,456 (2,816,456) ‐ ‐ (20.1)
Exercise of options and award of free shares ‐ (140,000) 140,000 ‐ ‐ 1.0
Increase in capital and issue premium following the ORNANE bond conversion
20,101,856 ‐ 20,101,856 1.9 108.1 ‐
Refund of issue premium ‐ ‐
‐ (24.5) ‐
At 30 June 2017 245,140,430 8,313,144 236,827,286 23.5 253.0 (50.9) (1) To simplify, the number of shares is presented for the entire period after the Econocom Group share split approved by the Extraordinary
General Meeting of 16 May 2017.
(2) Including at end‐June 2017, 8,228,164 shares held in treasury and 84,980 shares held in connection with the liquidity contract (after the
two‐for‐one share split).
5.12.2 STOCK OPTION PLANS
Stock subscription and purchase options have been granted to some of the Group’s employees and
management personnel for an agreed unit price. Details of these plans are provided below (with the
two‐for‐one share split, the number of shares by option has been multiplied by two but the number of
options granted remains the same):
Stock option plans 2013 2014 (1) 2015 (1) 2016 (1) TOTAL
NUMBER OF OPTIONS OUTSTANDING AT 31 DEC. 2016
875,000 2,015,000 360,000 105,000 3,355,000
OPTIONS GRANTED DURING THE PERIOD
‐ ‐ ‐ ‐ ‐
OPTIONS EXERCISED IN THE PERIOD ‐ ‐ ‐ ‐ ‐
OPTIONS LAPSED OR FORFEITED ‐ (151,562) (2,500) ‐ (154,062)
OPTIONS OUTSTANDING AT 30 JUNE 2017
875,000 1,863,438 357,500 105,000 3,200,938
RIGHTS GRANTED IN NUMBER OF SHARES (COMPARABLE) AT 31 DEC. 2016
1,750,000 3,726,876 715,000 210,000 6,401,876
RIGHTS GRANTED IN NUMBER OF SHARES (COMPARABLE) AT 30 JUNE 2017
1,750,000 3,726,876 715,000 210,000 6,401,876
OPTION EXERCISE PRICE (IN €) 5.96 5.52 7.70 11.30
SHARE PRICE (IN €) 2.98 2.76 3.85 5.65
AVERAGE SHARE PRICE AT THE EXERCISE DATE
‐ ‐ ‐ ‐
EXPIRY DATE Dec. 2018 Dec. 2019 Dec. 2020 Dec. 2021

CONSOLIDATED FINANCIAL STATEMENTS
41 2017 Half‐year report
(1) In December 2014, the Compensation Committee approved a plan to issue 2,500,000 stock subscription rights, 2,075,000 of which were issued in 2014, 360,000 in 2015 and 105,000 in 2016. The formula adopted will allow Econocom Group to issue new shares upon exercise of these options.
5.12.3 FREE SHARE PLAN
The General Shareholders’ Meeting of 17 May 2016 authorised Econocom’s Board of Directors to grant
2,250,000 (post‐split) existing shares free of charge, representing 1.0% of Econocom’s share capital.
Vesting of the shares may be contingent on the achievement of individual and/or collective, internal
and/or external objectives. Pursuant to this authorisation, Econocom’s Board of Directors’ meeting of
19 May 2016 awarded 440,000 free shares to a senior executive. At 30 June 2017, 300,000 shares
remained to be exercised after the exercise of 140,000 shares in the first tranche, with 20,000 shares
carried over to the following tranches. The numbers of shares mentioned above are post‐split.
After the two‐for‐one share split Number of shares Transfer of ownership
TRANCHE 2 160,000 May 2018
TRANCHE 3 140,000 May 2019
TOTAL 300,000
Each tranche is subject to the executive remaining with the Group until the end of the vesting period,
and to performance and stock market conditions.
5.12.4 CHANGE IN NON‐CONTROLLING INTERESTS
(in € millions)
AT 31 DECEMBER 2016 77.6
SHARE OF COMPREHENSIVE INCOME ATTRIBUTABLE TO NON‐CONTROLLING INTERESTS 0.4
RECLASSIFICATION BETWEEN OWNERS OF THE PARENT AND NON‐CONTROLLING INTERESTS:
IMPACT OF ACQUISITION OF ADDITIONAL SHARES IN ECONOCOM BRASIL (1) (2.4)
IMPACT OF ACQUISITION OF ADDITIONAL SHARES IN HELIS (1) (6.5)
IMPACT OF ACQUISITION OF ADDITIONAL SHARES IN ARAGON (EXERCISE OF
THE COMMITMENT TO BUY BACK SHARES – MINORITY PUTS)
(2.0)
AT 30 JUNE 2017 67.1
(1) As neither of these transactions gave rise to acquisition‐related liabilities, the purchase of additional shares led to an additional €3 million negative impact on equity attributable to owners.

CONSOLIDATED FINANCIAL STATEMENTS
42 2017 Half‐year report
5.13 PROVISIONS
(in € millions) 31 Dec. 2016
Changes in scope of consoli‐dation(1)
Additions Reversals (surplus
provisions)
Reversals (utilised
provisions)
Other and exchange
differences
30 June 2017
REORGANISATION AND EMPLOYEE‐RELATED RISKS
11.8 0.2 2.9 (0.2) (3.7) (0.1) 10.9
TAX, LEGAL AND COMMERCIAL RISKS
13.5 1.8 6.6 (1.2) (0.3) (0.1) 20.3
DEFERRED COMMISSIONS
1.0 ‐ 0.1 ‐ ‐ ‐ 1.1
OTHER RISKS 11.8 0.4 0.2 (0.4) (0.5) ‐ 11.6
TOTAL 38.1 2.4 9.8 (1.8) (4.5) (0.2) 43.9
BREAKDOWN OF PROVISIONS BETWEEN SHORT‐TERM AND LONG‐TERM PORTIONS SHOWN IN THE STATEMENT OF FINANCIAL POSITION
NON‐CURRENT PORTION 1.8 ‐ 0.3 ‐ (0.2) 0.3 2.2
CURRENT PORTION 36.3 2.4 9.5 (1.8) (4.3) (0.5) 41.7
BREAKDOWN OF MOVEMENTS IN PROVISIONS BETWEEN RECURRING AND NON‐RECURRING ITEMS
RECURRING ITEMS (7.5) 1.7 1.9
NON‐RECURRING ITEMS (2.3) 0.1 2.6
(1) Provisions for contingencies carried in the opening statements of financial position of LP Digital Agency and BIS (companies acquired in the period) are taken into account in this “Changes in scope of consolidation” column.
The €5.8 million net increase in provisions is primarily attributable to the increase in provisions for legal and commercial risks.
The impact on first‐half 2017 profit of the provisions additions (net of the reversals of not utilised provisions) is €8 million.

CONSOLIDATED FINANCIAL STATEMENTS
43 2017 Half‐year report
5.14 CONSOLIDATED STATEMENT OF CASH FLOWS
(in € millions) Notes First‐half 2017
First‐half 2016
TOTAL PROFIT FOR THE PERIOD ‐ 33.1 17.6
CASH FLOWS FROM OPERATING ACTIVITIES BEFORE COST OF NET DEBT AND INCOME TAX
‐ 49.3 50.8
CHANGE IN WORKING CAPITAL (1) 5.14.1.2 (117.6) (91.9)
TAX PAID NET OF TAX CREDITS ‐ (13.8) (13.9)
NET CASH FROM (USED IN) OPERATING ACTIVITIES 5.14.1 (82.1) (55.0)
NET CASH FROM (USED IN) INVESTING ACTIVITIES 5.14.2 (44.5) (20.1)
NET CASH FROM (USED IN) FINANCING ACTIVITIES 5.14.3 (10.6) 52.6
IMPACT OF EXCHANGE RATES ON CASH AND CASH EQUIVALENTS ‐ 0.2 (1.3)
CHANGE IN NET CASH AND CASH EQUIVALENTS ‐ (137.0) (23.8)
NET CASH AND CASH EQUIVALENTS AT BEGINNING OF PERIOD ‐ 348.5 209.4
NET CASH AND CASH EQUIVALENTS AT END OF PERIOD (2) ‐ 211.5 185.6
(1) Including €11.8 million in respect of investments in TMF contracts.
(2) Net of short‐term bank overdrafts: €3.7 million at 30 June 2017 and €6.1 million at 30 June 2016.
5.14.1 NET CASH FROM (USED IN) OPERATING ACTIVITIES
Net cash used in operating activities totalled €82.1 million in first‐half 2017 and €55.0 million in
first‐half 2016.
The increase reflects:
• a slight decrease in cash flows from operating activities which came out at €49.3 million in first‐half 2017 versus €50.8 million for the same period one year earlier;
• a more significant increase in working capital in first‐half 2017 (€117.6 million) compared to first‐half 2016 (€91.9 million); this includes €11.8 million in investments in the TMF business;
• income tax paid net of tax credits which remained stable versus first‐half 2016 at €13.8 million.

CONSOLIDATED FINANCIAL STATEMENTS
44 2017 Half‐year report
5.14.1.1 OTHER NON‐CASH EXPENSES (INCOME)
(in € millions) Notes First‐half 2017
First‐half 2016
ELIMINATION OF SHARE OF PROFIT (LOSS) OF ASSOCIATES AND JOINT VENTURES
‐ ‐ 0.1
DEPRECIATION/AMORTISATION OF PROPERTY, PLANT AND EQUIPMENT AND INTANGIBLE ASSETS
12.5 10.6
NET ADDITIONS TO (REVERSALS OF) PROVISIONS 5.13 3.5 (8.3)
CHANGE IN PROVISIONS FOR PENSIONS AND OTHER POST‐EMPLOYMENT BENEFIT OBLIGATIONS
1.3 1.4
INVENTORY IMPAIRMENT (REVERSALS)
1.9 (2.0)
IMPAIRMENT OF TRADE RECEIVABLES AND OTHER CURRENT ASSETS
1.9 3.6
LOSSES (GAINS) ON DISPOSALS OF PROPERTY, PLANT AND EQUIPMENT AND INTANGIBLE ASSETS
‐ ‐ ‐
TOTAL PROVISIONS, DEPRECIATION, AMORTISATION AND IMPAIRMENT ‐ 21.1 5.3
CHANGE IN FAIR VALUE OF THE ORNANE EMBEDDED DERIVATIVE COMPONENT ‐ (4.1) 10.7
CHANGE IN RESIDUAL INTEREST IN LEASED ASSETS (1)
(16.6) (2.8)
COST OF DISCOUNTING RESIDUAL INTEREST IN LEASED ASSETS AND GROSS LIABILITY FOR PURCHASES OF LEASED ASSETS (2)
‐ (0.4) (1.0)
GAINS AND LOSSES ON REMEASUREMENT TO FAIR VALUE (3) ‐ (1.9)
SHARE‐BASED PAYMENT EXPENSE ‐ 0.7 0.6
IMPACT OF SOLD OPERATIONS AND CHANGES IN CONSOLIDATION METHOD ‐ 0.3 ‐
OTHER NON‐CASH EXPENSES (INCOME) ‐ (1.3) (0.4)
NON‐CASH EXPENSES (INCOME) ‐ (0.9) 12.9
(1) Changes in the residual interest in leased assets takes into account the impact of discounting in prior periods. The €1.7 million impact
of discounting for the period was eliminated in the “Other non‐cash expenses (income)” item.
(2) Reflects the impact in the period of discounting the residual interest in leased assets (negative €1.7 million) and the liability for
purchases of leased assets (positive €1.3 million).
(3) Change in value of acquisition‐related liabilities over the period.

CONSOLIDATED FINANCIAL STATEMENTS
45 2017 Half‐year report
5.14.1.2 CHANGE IN WORKING CAPITAL
The increase in working capital can be analysed as follows:
(in € millions) 31 Dec. 2016
Change in working capital in first‐half
2017
Total other changes (1)
30 June 2017
Change in working capital in
first‐half 2016
OTHER LONG‐TERM RECEIVABLES, GROSS
10.1 (0.5) 1.2 10.8 2.1
INVENTORIES, GROSS 54.7 22.2 6.6 83.5 16.4
TRADE RECEIVABLES, GROSS 849.5 34.6 21.2 905.3 37.7
OTHER RECEIVABLES, GROSS 84.7 0.4 (9.5) 75.6 (14.2)
RESIDUAL INTEREST IN LEASED ASSETS 107.1 ‐ 18.1 125.2 ‐
CURRENT TAX ASSETS (2) 5.6 ‐ 3.5 9.1 ‐
OTHER CURRENT ASSETS 52.9 11.2 1.0 65.1 (3.4)
INVENTORIES AND OPERATING RECEIVABLES
1,164.6 67.9 42.1 1,274.6 38.6
OTHER NON‐CURRENT LIABILITIES (91.2) ‐ 3.8 (87.4) (2.7)
TRADE PAYABLES (635.6) 16.9 (19.5) (638.2) 4.4
OTHER PAYABLES (272.4) 27.2 32.8 (212.4) 37.7
CURRENT TAX LIABILITIES (2) (19.0) ‐ 7.7 (11.3) ‐
OTHER CURRENT LIABILITIES (147.4) 7.8 (17.8) (157.4) 16.4
GROSS LIABILITY FOR PURCHASES OF LEASED ASSETS (3)
(68.3) (2.2) (1.2) (71.7) (2.5)
TRADE AND OTHER OPERATING PAYABLES
(1,233.9) 49.7 5.8 (1,178.4) 53.3
TOTAL CHANGE IN WORKING CAPITAL ‐ 117.6 ‐ ‐ 91.9
(1) Mainly corresponding to changes in the scope of consolidation and in fair value, and to foreign currency translation adjustments.
(2) Monetary flows are shown on the “Tax paid net of tax credits” line in the consolidated statement of cash flows.
(3) Corresponding to changes in residual financial values of leased assets excluding the currency effect and discounting in the period.
5.14.2 BREAKDOWN OF NET CASH FROM (USED IN) IN INVESTING ACTIVITIES
Net cash used in investing activities totalled €44.5 million, primarily reflecting:
• cash outflows of €25.9 million (net of €3.5 million in cash acquired) following:
‐ the acquisition during the period of controlling interests in BIS and LP Digital Agency and of shares in JTRS, representing a total amount of €19.2 million net of cash acquired,
‐ acquisitions of additional interests for €3.2 million,
‐ earn‐out payments and deferred liabilities arising on acquisitions carried out in prior periods for €3.5 million;
• investments in property, plant and equipment and intangible assets for €18.4 million, mainly in the Group’s infrastructure and IT projects.

CONSOLIDATED FINANCIAL STATEMENTS
46 2017 Half‐year report
5.14.3 BREAKDOWN OF NET CASH FROM (USED IN) IN FINANCING ACTIVITIES
Net cash used in financing activities amounted to €10.6 million, mainly reflecting:
• cash outflows of €38.8 million relating to the redemption of 2,698 million ORNANE convertible bonds in the first quarter;
• net cash inflows of €20 million following the issue of commercial paper;
• net cash inflows of €16.5 million relating to treasury share transactions (including a net cash inflow from the sale of treasury shares amounting to €36.5 million in connection with ORNANE bond transactions);
• interest payments totalling €8.7 million in first‐half 2017 (including coupon payments on ORNANE convertible bonds, the Schuldschein loan and Euro PP).
5.15 RELATED‐PARTY TRANSACTIONS
Transactions between the parent company and its subsidiaries, which are related parties, are
eliminated on consolidation and are not presented in this note. The related‐party transactions
primarily concern the main transactions carried out with the Chairman of the Board of Directors, its
Vice‐Chairman, the Chief Executive Officers and the Executive Directors, or with companies controlled
by the Group or over which it exercises significant influence.
The conditions underlying compensation payable to the Group’s corporate officers are approved by
the Board of Directors acting on recommendations put forward by the Compensation Committee.
There have been no major changes in this caption since the disclosures presented in Note 22.1 to the
2016 consolidated financial statements.
No material changes occurred in first‐half 2017 as regards the other related‐party transactions set out
in Note 22.2 to the 2016 consolidated financial statements.
5.16 SUBSEQUENT EVENTS
None.

CONSOLIDATED FINANCIAL STATEMENTS
47 2017 Half‐year report