3 examppyles of reliability testing - · pdf file3 examppyles of reliability testing dan...
TRANSCRIPT

WOPR 11 Experience Report – Intuit – Oct. 24 ‘08WOPR 11 Experience Report Intuit Oct. 24 08
3 Examples of Reliability p yTesting
Dan Downing, VP Testing Services
MENTORA GROUPMENTORA GROUP
www.mentora.com

# 1 – Component Failover Testing
• Application:– Donor Management system for a national non-profit– W2K, SQL Server, vbscript
• Reliability issue:– Major load-related outage experienced in prior peak season where donation
transactions were lost; suspected component failure (web? Db?)transactions were lost; suspected component failure (web? Db?)• Solution:
– Add redundant firewall, web/app server, hot-standby DB server• Testing focus:• Testing focus:
– Test fail-over of components– Measure recovery time and quantify failed transactions, especially lost donations
• Result:Result:– Showed that redundant components took up current workload quickly, minimizing
failed transactions, lost donations

Bandwidth throughput and error rates under load asprimary firewall & load balancer are failed
Load Balancer
Load Balancer Fail Over: Throughput not affected
p y
Load Balancer Turned Off to simulate Production Down
Firewall Fail Over: Bandwidth drops and
ThroughputRunning Users
drops and recovers
Errors
Color Graph Graph's Min. Graph's Ave. Graph's Max.
Throughput 0.0 2343400 4879640
Running Vusers 0.0 146 375
E S d 0 0 0 233 2 078Errors per Second 0.0 0.233 2.078

Bandwidth, error rate and web/db cpu under load asprimary DB server is failed
Failed Over Database Running
U
p y
Users
Throughput
Bandwidth drops for 20 seconds
Web Server CPU Increases
Errors Increase for 2 minutes
Web Server CPU Increases for 2 minutes
Color Measurement Graph's Min. Graph's Ave. Graph's Max.
Throughput 1580 822128 1167149
Run 0 63 176
Error 0 0.048 1.313Error 0 0.048 1.313
% Processor Time (Processor _Total):69.48.142.164 0.066 15 74
% Processor Time (Processor _Total):69.48.142.165 0.0 15 68

# 2 – Endurance test to replicate dropped user sessions under loadsessions under load• Application:
– Malpractice insurance case management system– COM & ASP.NET, W2K3, SQL Server 2005
• Reliability issue:– User session state dropped and users sent back to login page duringUser session state dropped and users sent back to login page during
peak usage period, losing transactional updates in the middle of complex workflows
• Testing focus:g– Replicate peak load based on statistical analysis of peak-period web logs– Run log over 24-hour period while monitoring throughput and system
resources• Resolution:
– Used event log to ID .NET framework critical update that triggered the outage; removed it, retested, and pushed into production
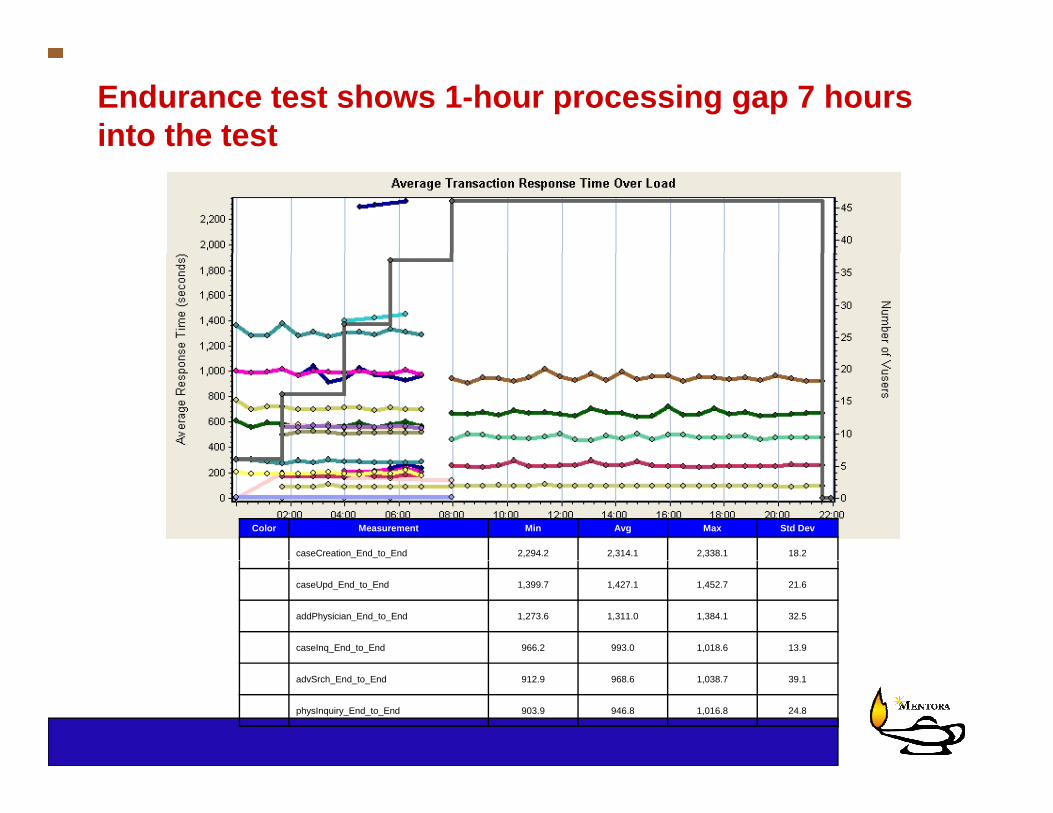
Endurance test shows 1-hour processing gap 7 hours into the test
Color Measurement Min Avg Max Std Dev
caseCreation_End_to_End 2,294.2 2,314.1 2,338.1 18.2
caseUpd_End_to_End 1,399.7 1,427.1 1,452.7 21.6
addPhysician_End_to_End 1,273.6 1,311.0 1,384.1 32.5
caseInq_End_to_End 966.2 993.0 1,018.6 13.9
advSrch_End_to_End 912.9 968.6 1,038.7 39.1
physInquiry_End_to_End 903.9 946.8 1,016.8 24.8

Bandwidth drops to zero outage point, recovering only slightly thereafterg y
Color Measurement Min Avg Max
Throughput (Bytes/Sec) 3,476 10,743 29,450
Throughput (Mbps) 0.03 0.09 0.24
Load (vusers) 0 46

System resource monitors shows web server CPU falling to zero at outage point (orange line)g g p ( g )
Color Measurement Min. Ave. Max. Serve IP
% Disk Time (PhysicalDisk _Total) 0.7 8.5 117.1 10.130.39.10
% Processor Time (Processor _Total) 1.013 2.4 15.4 10.130.39.10
Available MBytes (Memory) 669 804 959 10.130.39.10
Avg. Disk Queue Length (PhysicalDisk _Total) 0.02 0.17 2.3 10.130.39.10
Lock Wait Time (ms) (MSSQL$RMFPROD|Locks _Total) 0.0 0.5 18.6 10.130.39.10
Number of Deadlocks/sec (MSSQL$RMFPROD|Locks Total) 0.0 0.0 0.002 10.130.39.10Number of Deadlocks/sec (MSSQL$RMFPROD|Locks _Total) 0.0 0.0 0.002 10.130.39.10
SQL Compilations/sec (MSSQL$RMFPROD|SQL Statistics) 0.0 0.7 3.1 10.130.39.10
SQL Re-Compilations/sec (MSSQL$RMFPROD|SQL Statistics) 0.0 0.09 0.4 10.130.39.10
Load (vusers) 0 46

# 3 – JVM Heap Utilization Analysis
• Application:– National B2B retailer-supplier messaging system– Complex Java, Oracle, WebSphere MQ; Windows, AIX, mainframe– Re-architecture and redevelopment of middleware tier using JFS IDE
• Reliability issue:e ab ty ssue– Severe user performance degradation under increasing load
• Testing focus:– Monitor jvm heap utilization as is load increased (using Jconsole)– Monitor jvm heap utilization as is load increased (using Jconsole)
• Resolution:– Uncovered and reduced JFS (Java Server Faces) default “Viewstate
queue depth” to eliminate heap space depletion which was triggeringqueue depth to eliminate heap space depletion which was triggering cpu-grabbing garbage collection “sweeps”

JVM heap space profile shows sharp GC sweeps of decreasing “depth”as load ramps, until 1 GB heap is depleteddepleted

JVM heap space profile showing steady-state heap usage between 200 and 300 MB on all app servers after fix appliedapplied