295introduction to lidar - gis courses · espm4295/5295 11-oct-16 1 introduction to lidar our goals...
TRANSCRIPT
ESPM4295/5295 11-Oct-16
1
IntroductiontoLiDAROurgoalsherearetointroduceyoutoLiDARdata,toshowyouhowtodownloaditforanareaofinterest,andtobetterunderstandthedataandusesthroughsomesimplemanipulations.Inourprojectwe’llbecalculatingbuildingandtreeheightsforyourprojectarea.ThestateonMinnesotahasflownLiDARfortheentirestate.DatamaybeinteractivelydownloadedviatheMNDNRMNTopoviewer(http://dnr.state.mn.us/maps/mntopo/index.html),orforlargerareasviatheMNGEOftpsite(ftp://ftp.lmic.state.mn.us/pub/data/elevation/lidar/).RasterDEMs,hillshades,contours,andthe“raw”dataor“pointcloud”datamaybedownloaded,inESRIgeodatabasesorincommonlysupportedformats. WewilldownloadLiDARdataandderivedlayersandpreparethemforinclusioninourCampusGIS.Wewillfirstworkwiththeprocessedlayers,andlatertherawdata,primarilyforbuildingheights.SincethedataareverydetailedweoftenneedtomergetogetherseveraltilestoobtainthecompleteSt.PaulCampus. ThisiscommonwhenworkingwithLiDAR. Thedataissodetailedthat16tilesofLiDAR datafitwithinatypicalUSGS1:24,000scaletopomap.Ourindividualstudyareasaresmall,soweshouldn’thavethatproblemhere.OpentheMnTOPOwebsite,andfamiliarizeyourselfwiththetoolsneartheupperright.Usethedefaultdisplayandthezoombuttonintheupperleft,andclick-hold-dragtopan,togettheapproximateCampusareadisplayed.Youmayselectdifferentbasemapswithoneofthetoolsintheupperright,theimagebasemapisperhapsmostuseful.Youmayalsoturnoffthecontoursviathestackedlayersicon.Usethedownloaddatatool(diskdrivewitharrowicon,inthetoolbarrow,upper/left),specifyapolygonthatiscenteredonyourindividualprojectarea,butabout1.5todoubletheheightandwidthyouneedtoincludeyourentirearea.Downloadthe
• 1mdem,• 1mhillshade• therawlidarpointclouddata(thesewillbe.lasor.laz(acompressedform)
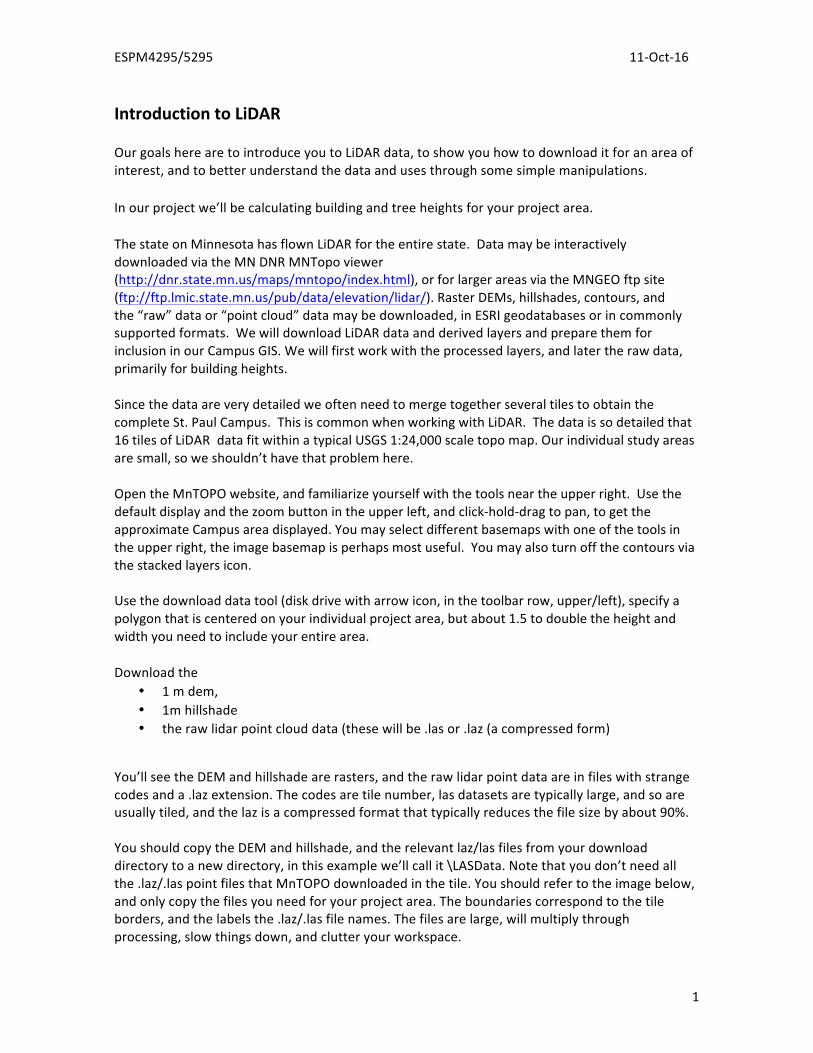
You’llseetheDEMandhillshadearerasters,andtherawlidarpointdataareinfileswithstrangecodesanda.lazextension.Thecodesaretilenumber,lasdatasetsaretypicallylarge,andsoareusuallytiled,andthelazisacompressedformatthattypicallyreducesthefilesizebyabout90%.YoushouldcopytheDEMandhillshade,andtherelevantlaz/lasfilesfromyourdownloaddirectorytoanewdirectory,inthisexamplewe’llcallit\LASData.Notethatyoudon’tneedallthe.laz/.laspointfilesthatMnTOPOdownloadedinthetile.Youshouldrefertotheimagebelow,andonlycopythefilesyouneedforyourprojectarea.Theboundariescorrespondtothetileborders,andthelabelsthe.laz/.lasfilenames.Thefilesarelarge,willmultiplythroughprocessing,slowthingsdown,andclutteryourworkspace.
ESPM4295/5295 11-Oct-16
2
DisplaytheDEMandhillshadesurfaces.Thesearelargelyfromanautomatedprocessthatfirsttriestoidentifythe“bareearth,”orgroundonlyreturns,andthenbuildaDEMandahillshade.Noticetheoddshapes,sometimesliketriangles,onthehillshadesurfacewithinthebuildingfootprints.Theseareartifactsoflidardataprocessing.Thealgorithmshaveahardtimeidentifyingthegroundnearbuildingsperfectly,sothereareoftentriangularshapesonornearbuildings.Youalsoseearoughnessandoccasionalsmallbumpsovergrassorforestareas,thesearealsoartifactsoftheprocessing.
AlsonoticetheDEMrastersareinUTM15NAD83(1986).YouwillneedtotransformthemtoCORS96ifyouwishtoavoidthewarningsaboutdatumconflictswhendisplayedwithyourotherprojectdata.
YoucandoallthefollowingstepsinArcGIS,wewillbeusingLASTools,awidely-used,generalpurposelidarprocessingtoolboxthatismuchfasterthanprocessinginArc,andquiteflexible.TheUMNhasasitelicenceforLASTools,sowe’llbeusingitforthissmallexercise.
Beforewestartprocessing,youshouldcopytheLASToolssoftwaretothedirectorycontainingyourdata.TheLASToolsexecutablefilesareonthelabdriveunder4295W\LASTools\bindirectoryYoushouldcopythelas2las.exeandlas2shp.exefromthe\bindirectorytoyourlasdatadirectory(\LASDatainourexample)andthe_README.txtfilesalso,ifyouwishtoreadalltheoptionsavailable.Ifyouusedthesetoolsfrequently,thenwe’daddthe\bintothepath,soprogramswouldlookthereautomatically,butforlabmanagementpurposes,wehaven’tdonethat.Youshouldalsomaketwosub-directorieswithinyour\LasDatadirectory,onenamedbuildings,andonenamedtallveg,intowhichwe’llbesubsettingthelasdata.
ESPM4295/5295 11-Oct-16
3
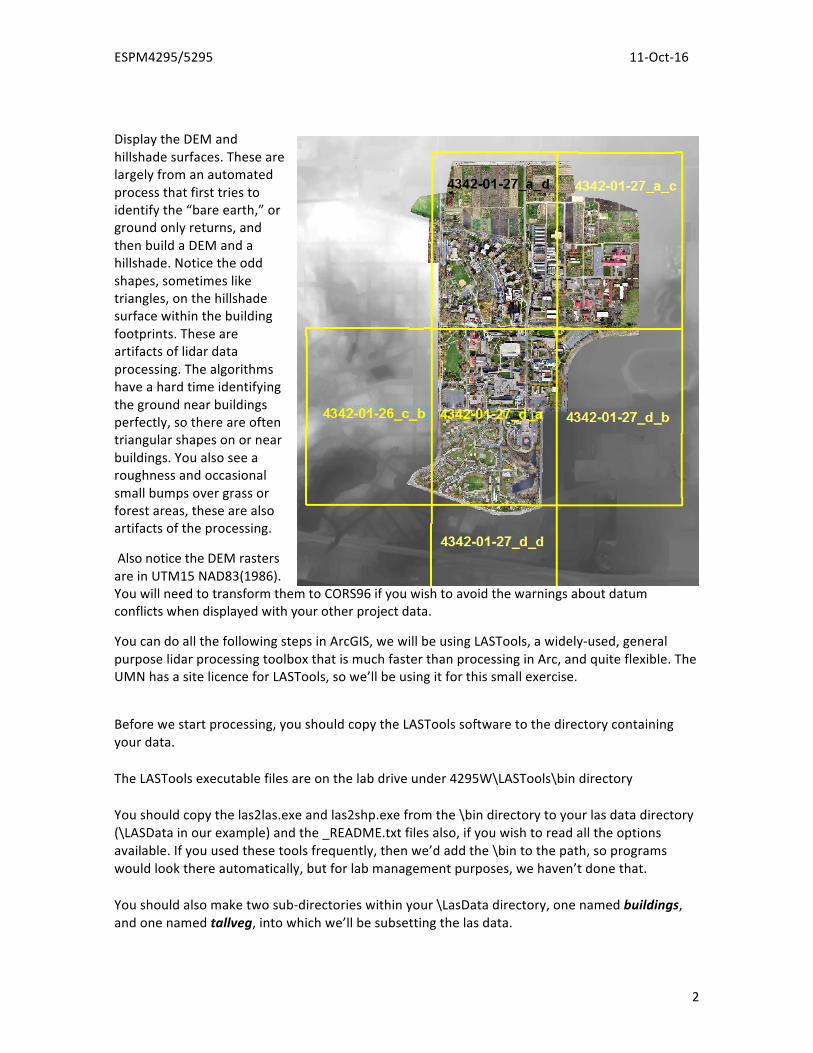
Whenyou’redone,yourdirectoryshouldlooksomethinglikethiswindowbelow.
Younoticewehavethelazfiles,theexecutabletoolslas2lasandlas2shp,theReadmefiles,andthebuildingsandtallvegdirectories.I’vealsoconvertedcopiesofthe.lazto.lasfiles.Youdon’tneedto,butnoticethe.lazfilesaremuchsmallerthanthe.las.Becauselidardataareoftensolarge,thereisusuallyatradeoffbetweensavingspaceandprocessingspeed.We’reworkingwithasmallarea,soitdoesn’tmuchmatter,butinmanyrealprojectsitdoes.YoushouldknowafewmorethingsaboutLiDARdata.Remember,theseLiDARarefrompulsesoflightsentdownfromaplane,thenreflectedbackfromatarget.Precisegeometryallowsoperatorstodeterminethex,y,andzcoordinatestowithinafewinchesofeachobjectthatreflectsbackapulse.Therecanbemanyreturnsmeasuredfromeachpulse,althoughwe’remostofteninterestedinthefirstreturns,tomeasureobjectheights,andthelastreturns,tomeasuregroundelevation.Thedataareprocessedbeforethey’redelivered,andthecollectingorganizationusuallyappliesalgorithmstotrytodetectgroundhits(notalllastreturnsarefromtheground),objectheights(notallfirstreturnsarefromthetopsofobjects),andtoprovideotherinformationabouteachdatapoint.Mosttimeseachreturnpointcontainsinformationonthereturnnumber(first,last,orinbetween),thefeatureclassification(2=ground,4=mid-heightvegetation,5=highvegetation,6=building,9=water,0=unclassified),aswellasthescanangle,thestrengthofthereturnsignal,andotherinformationaboutthepoint.LASTools,andmostotherlidarprocessingtools,allowustoaccessthesedata.
ESPM4295/5295 11-Oct-16
4
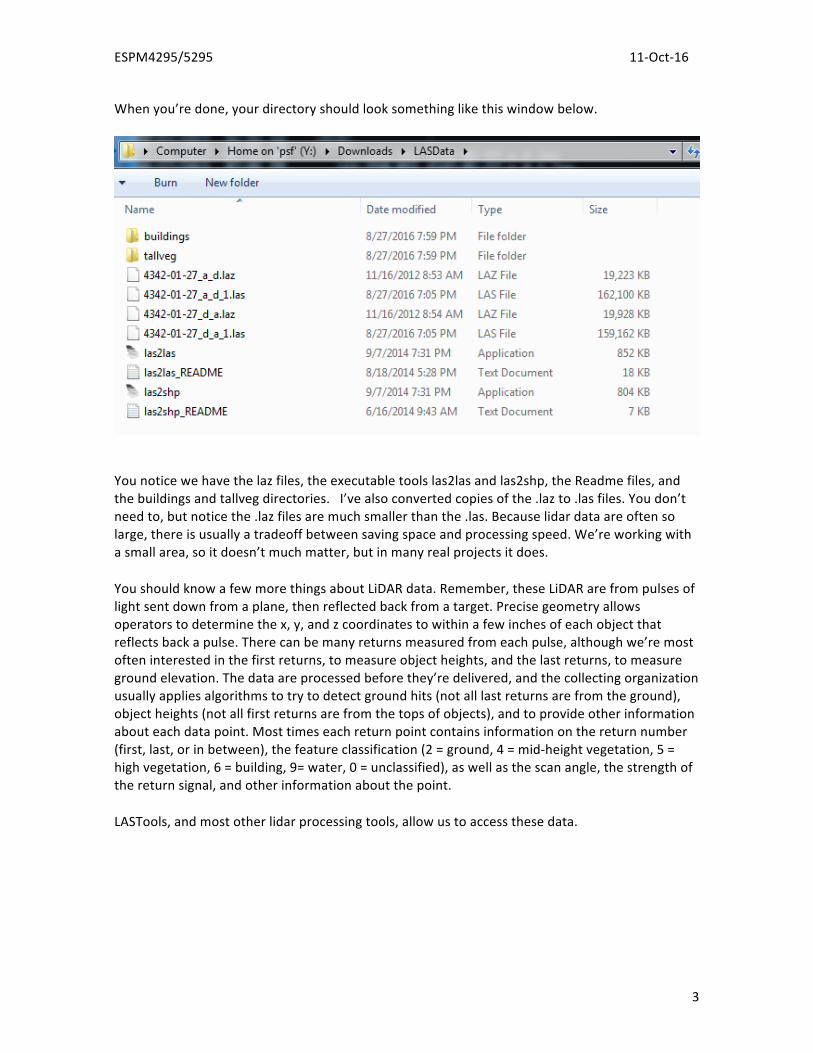
We’llusethecommandprompttorunLAStools.ThecommandpromptisfoundviatheWindowsStartbutton(pinkarrow,right),thenintheAccessoriesfolder–>CommandPrompt(greenarrowandcircled,atright)Thiswillopenasmallwindowthatonlyallowsonlytextentry(seebelow).
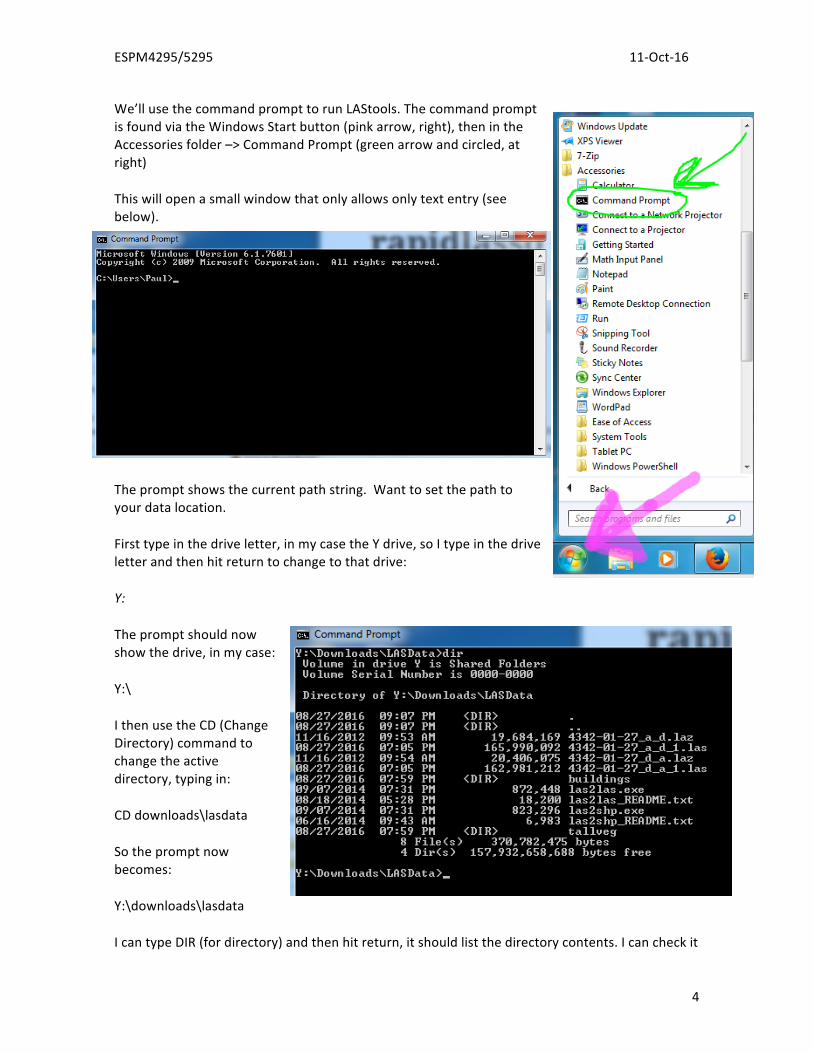
Thepromptshowsthecurrentpathstring.Wanttosetthepathtoyourdatalocation.Firsttypeinthedriveletter,inmycasetheYdrive,soItypeinthedriveletterandthenhitreturntochangetothatdrive:Y:Thepromptshouldnowshowthedrive,inmycase:Y:\IthenusetheCD(ChangeDirectory)commandtochangetheactivedirectory,typingin:CDdownloads\lasdataSothepromptnowbecomes:Y:\downloads\lasdataIcantypeDIR(fordirectory)andthenhitreturn,itshouldlistthedirectorycontents.Icancheckit
ESPM4295/5295 11-Oct-16
5
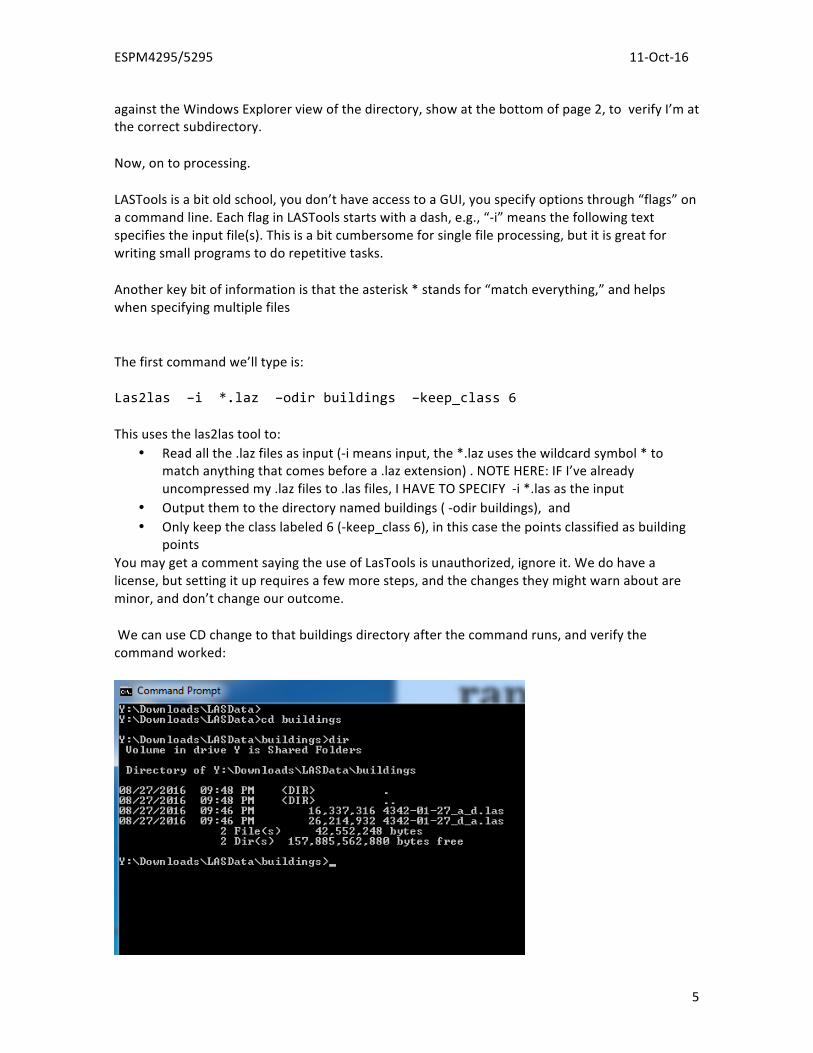
againsttheWindowsExplorerviewofthedirectory,showatthebottomofpage2,toverifyI’matthecorrectsubdirectory.Now,ontoprocessing.LASToolsisabitoldschool,youdon’thaveaccesstoaGUI,youspecifyoptionsthrough“flags”onacommandline.EachflaginLASToolsstartswithadash,e.g.,“-i”meansthefollowingtextspecifiestheinputfile(s).Thisisabitcumbersomeforsinglefileprocessing,butitisgreatforwritingsmallprogramstodorepetitivetasks.Anotherkeybitofinformationisthattheasterisk*standsfor“matcheverything,”andhelpswhenspecifyingmultiplefilesThefirstcommandwe’lltypeis:Las2las–i*.laz–odirbuildings–keep_class6Thisusesthelas2lastoolto:
• Readallthe.lazfilesasinput(-imeansinput,the*.lazusesthewildcardsymbol*tomatchanythingthatcomesbeforea.lazextension).NOTEHERE:IFI’vealreadyuncompressedmy.lazfilesto.lasfiles,IHAVETOSPECIFY-i*.lasastheinput
• Outputthemtothedirectorynamedbuildings(-odirbuildings),and• Onlykeeptheclasslabeled6(-keep_class6),inthiscasethepointsclassifiedasbuilding
pointsYoumaygetacommentsayingtheuseofLasToolsisunauthorized,ignoreit.Wedohavealicense,butsettingituprequiresafewmoresteps,andthechangestheymightwarnaboutareminor,anddon’tchangeouroutcome.WecanuseCDchangetothatbuildingsdirectoryafterthecommandruns,andverifythecommandworked:
ESPM4295/5295 11-Oct-16
6
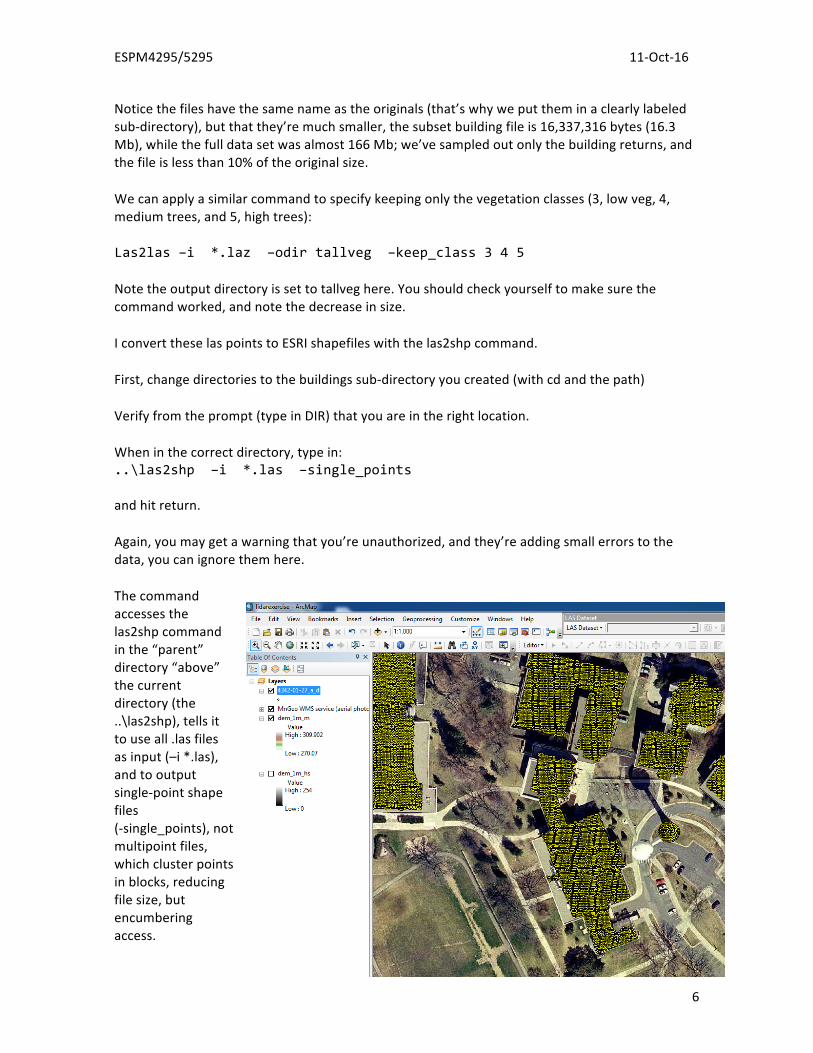
Noticethefileshavethesamenameastheoriginals(that’swhyweputtheminaclearlylabeledsub-directory),butthatthey’remuchsmaller,thesubsetbuildingfileis16,337,316bytes(16.3Mb),whilethefulldatasetwasalmost166Mb;we’vesampledoutonlythebuildingreturns,andthefileislessthan10%oftheoriginalsize.Wecanapplyasimilarcommandtospecifykeepingonlythevegetationclasses(3,lowveg,4,mediumtrees,and5,hightrees):Las2las–i*.laz–odirtallveg–keep_class345Notetheoutputdirectoryissettotallveghere.Youshouldcheckyourselftomakesurethecommandworked,andnotethedecreaseinsize.IconverttheselaspointstoESRIshapefileswiththelas2shpcommand.First,changedirectoriestothebuildingssub-directoryyoucreated(withcdandthepath)Verifyfromtheprompt(typeinDIR)thatyouareintherightlocation.Wheninthecorrectdirectory,typein:..\las2shp–i*.las–single_pointsandhitreturn.Again,youmaygetawarningthatyou’reunauthorized,andthey’readdingsmallerrorstothedata,youcanignorethemhere.Thecommandaccessesthelas2shpcommandinthe“parent”directory“above”thecurrentdirectory(the..\las2shp),tellsittouseall.lasfilesasinput(–i*.las),andtooutputsingle-pointshapefiles(-single_points),notmultipointfiles,whichclusterpointsinblocks,reducingfilesize,butencumberingaccess.

ESPM4295/5295 11-Oct-16
7
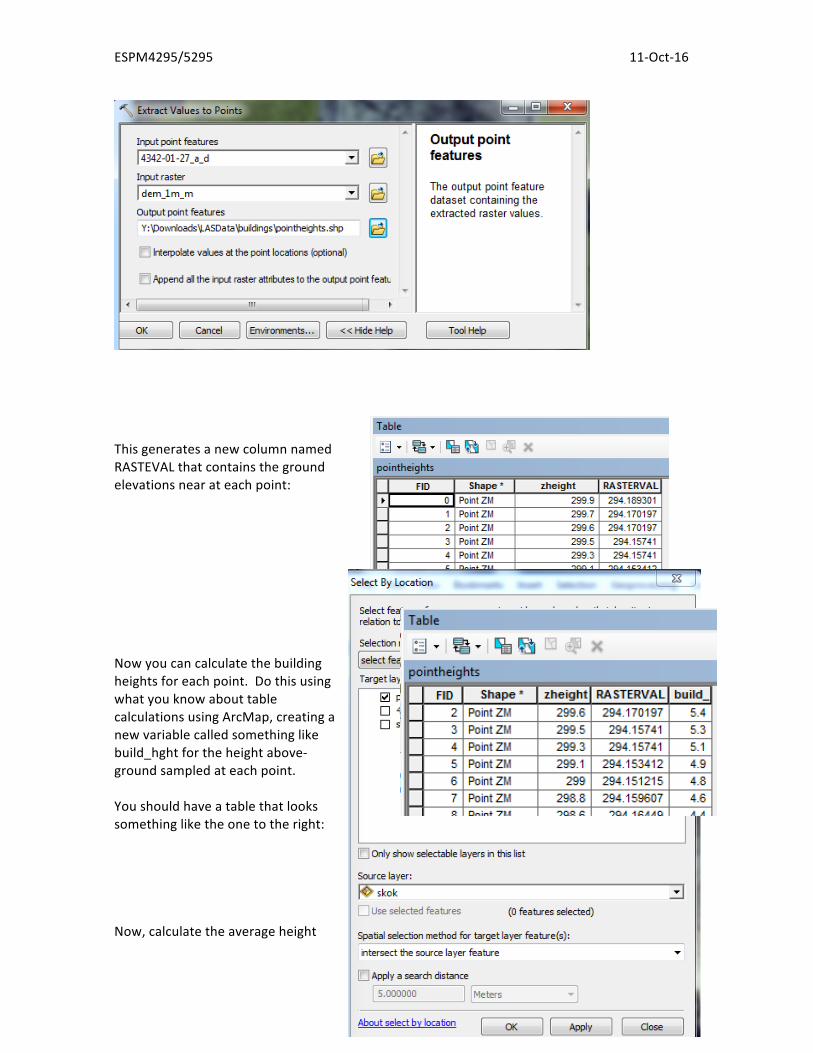
Verifytheabovecommandworked,firstbylookinginthebuildingsdirectoryandcheckingthatshapefile(s)appeared,andthenbydisplayingthedatainanArcMapview:Youcanseethepoints,hereinyellow,moreorlessmatchthebuildinglocations.Theslightmismatchisbecauseofbuildingleanintheaerialphotographs.Youmightrememberthatorthophotoscorrectalllocationsasiftheywereontheground,andthetopsofbuildingsaren’t.Thus,thetopsgetdisplaced,usuallyoutwardfromtheimagingcenterrelativetothecameraposition.That’swhyskyscrapersseemtoleaninmost“vertical”orthophotos.Nowweshouldlookatheights.Openthetableforyourpointshapefile,andaddanewfieldnamedzHeight,doubleorfloat,precision12,scale1(itmaytakeawhile).Whenitisdone,calculatethezvalue(remember,rightclickoncolumn,calculategeometry,z-coordinateofpoint.Again,thismaytakeawhile,therearemanypoints).Whentheprocessisfinished,usetheidentifybuttontoqueryafewbuildingheights.Remember,thevaluesareinmeters.Dothesevaluesmakesense?Arethebuildingsover200meters(650ft)tall?Whydoyouthinkyou’regettingthesevalues?TheZvaluerepresentstheorthometricheightofthetopofthebuilding.Thisistheheightrelativetoourstandardsurface,nearsealevel,andnotrelativetothelocalgroundsurface.Weneedtosubtractthelocalgroundsurfacefromthebuildingzvaluetogetbuildingheight.Onewayistoquerytherasterbeloweachpoint,andaddittothetablerecordforeachpoint.WecanthensubtracttheDEMheightfromthezHeight,andgetabuildingheight.TheExtractValuestoPointstool,foundatArcToolbox->SpatialAnalystTools->Extractiondoesjustthis.Specifyingtheinputandoutputswillqueryeachcellbeloweachpoint,andaddacolumntothenewdatalayerspecified.Thismaytakequitealongtime,sobepatient.
ESPM4295/5295 11-Oct-16
8
ThisgeneratesanewcolumnnamedRASTEVALthatcontainsthegroundelevationsnearateachpoint:Nowyoucancalculatethebuildingheightsforeachpoint.DothisusingwhatyouknowabouttablecalculationsusingArcMap,creatinganewvariablecalledsomethinglikebuild_hghtfortheheightabove-groundsampledateachpoint.Youshouldhaveatablethatlookssomethingliketheonetotheright:Now,calculatetheaverageheight
ESPM4295/5295 11-Oct-16
9
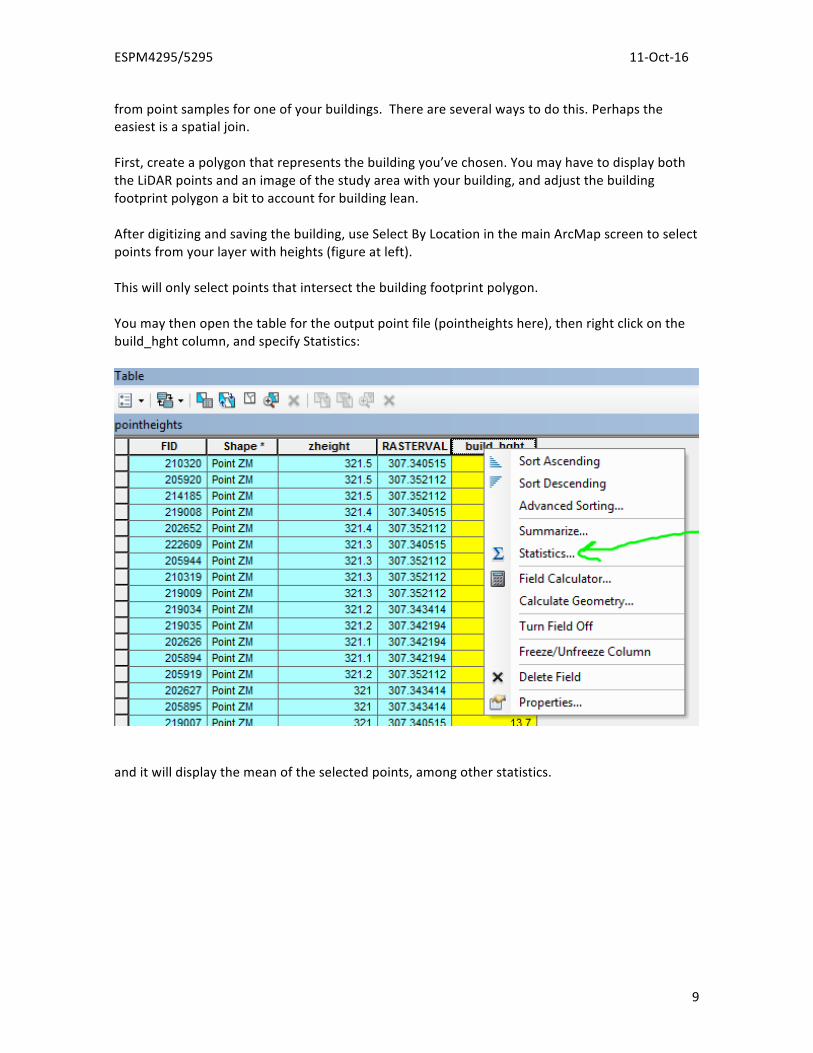
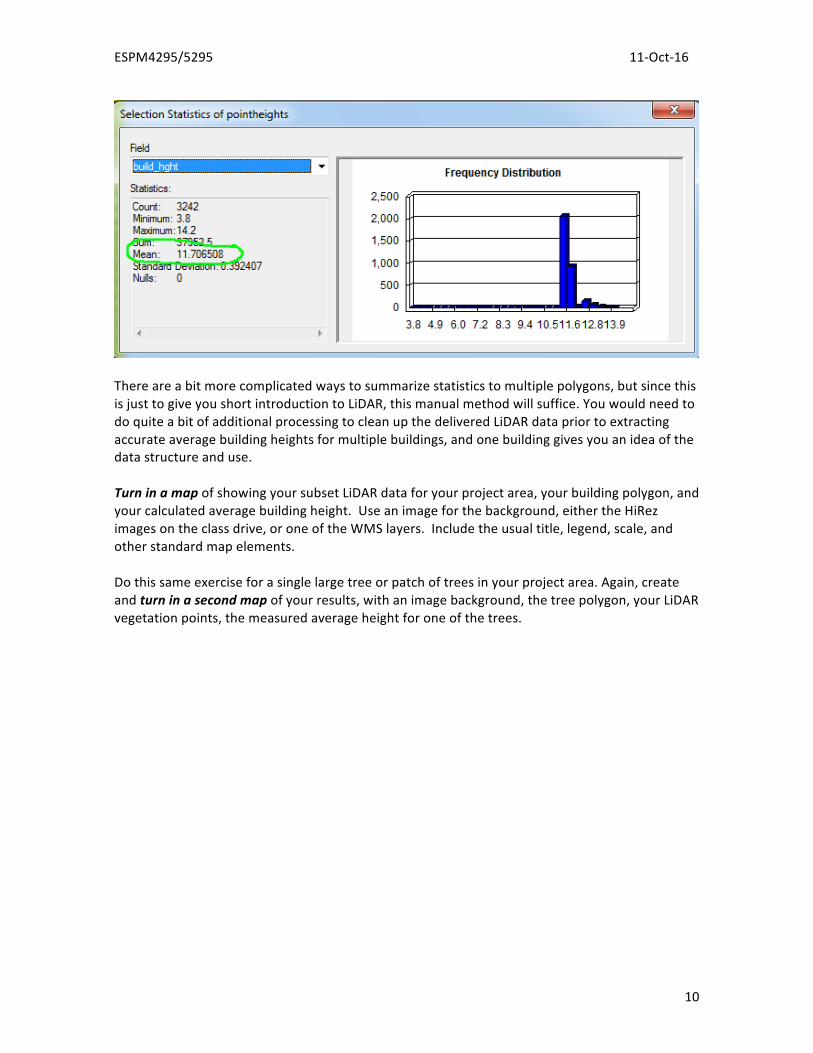
frompointsamplesforoneofyourbuildings.Thereareseveralwaystodothis.Perhapstheeasiestisaspatialjoin.First,createapolygonthatrepresentsthebuildingyou’vechosen.YoumayhavetodisplayboththeLiDARpointsandanimageofthestudyareawithyourbuilding,andadjustthebuildingfootprintpolygonabittoaccountforbuildinglean.Afterdigitizingandsavingthebuilding,useSelectByLocationinthemainArcMapscreentoselectpointsfromyourlayerwithheights(figureatleft).Thiswillonlyselectpointsthatintersectthebuildingfootprintpolygon.Youmaythenopenthetablefortheoutputpointfile(pointheightshere),thenrightclickonthebuild_hghtcolumn,andspecifyStatistics:
anditwilldisplaythemeanoftheselectedpoints,amongotherstatistics.
ESPM4295/5295 11-Oct-16
10
Thereareabitmorecomplicatedwaystosummarizestatisticstomultiplepolygons,butsincethisisjusttogiveyoushortintroductiontoLiDAR,thismanualmethodwillsuffice.YouwouldneedtodoquiteabitofadditionalprocessingtocleanupthedeliveredLiDARdatapriortoextractingaccurateaveragebuildingheightsformultiplebuildings,andonebuildinggivesyouanideaofthedatastructureanduse.TurninamapofshowingyoursubsetLiDARdataforyourprojectarea,yourbuildingpolygon,andyourcalculatedaveragebuildingheight.Useanimageforthebackground,eithertheHiRezimagesontheclassdrive,oroneoftheWMSlayers.Includetheusualtitle,legend,scale,andotherstandardmapelements.Dothissameexerciseforasinglelargetreeorpatchoftreesinyourprojectarea.Again,createandturninasecondmapofyourresults,withanimagebackground,thetreepolygon,yourLiDARvegetationpoints,themeasuredaverageheightforoneofthetrees.