introduction to qgis for lidar analysis table of · pdf fileyadag using airborne lidar...
TRANSCRIPT

YADAG Using Airborne Lidar Training, Jan 11th 2014
Introduction to QGIS for Lidar Analysis
Table of ContentsAims..................................................................................................................................................................2How to use this booklet....................................................................................................................................2What is lidar?....................................................................................................................................................3Task 1 - Setting Up Your QGIS Project...............................................................................................................5Task 2 – Opening raster files in QGIS and editing their properties....................................................................8Task 3 – Create a Hillshade (Shaded Relief Model).........................................................................................13Task 4 – Draw a Profile....................................................................................................................................17Task 5 – Mapping Archaeological features......................................................................................................21
Course Materials designed by Rebecca Bennett, January 2014Please use freely for your own information and the instruction of others but recognise the rights of the
author to be acknowledged if the material contained is disseminated.
Intro to QGIS 1
YADAG Using Airborne Lidar Training, Jan 11th 2014
Introduction
Airborne laser scanning, (commonly referred to as lidar) is an important tool for understanding landscapes past and present, due to the highly accurate terrain models that can be created using it. These models can highlight subtle changes in microtopography relating to past landuse, and there have been many archaeological examples to date illustrating the large amount of new data that can be derived from the study of lidar-derived terrain models. However, although the data themselves are becoming increasingly available to researchers, the ability to interrogate the models appropriately still relies on specialist software and skilled data manipulation.
This material and exercises in this handbook are designed to help you begin to use lidar-derived terrain models for archaeological analysis. Firstly there is a brief explanation of the data themselves, how they are collected and where archives are held. Following this are a series of exercises designed to step you through using the lidar-derived models to identify archaeological features using a geographical information system (GIS). GIS is a very powerful tool that helps you not only to manipluate the lidar data to best view archaeological features but also to overlay other data such as aerial photographs, HER data and geophysical survey.
To follow this workshop you will need to download the open source software QGIS. Detailed instructions fordownloading and installing this software can be found in the pre-course information and are not repeated here.
Aims
The aim of this lab is familiarise yourself with lidar data and QGIS. In the practical exercises you will undertake the following tasks:
• Set up a GIS project• navigate in the GIS• import and view a digital terrain model• edit the properties of a raster• create a hillshaded model• print your map to professional standard
Each of these tasks stand alone as useful GIS tools but together they provide a workflow for visualising lidar data.
How to use this booklet
Illustrations in this booklet show the icons on screen for each task. The full menu options are notated as follows: File > Open.
Intro to QGIS 2

YADAG Using Airborne Lidar Training, Jan 11th 2014
What is lidar?
Lidar is a term often used to refer to airborne laser scanning, and is generally believed to be a shortening of the phrase Light Detection And Ranging. Information about this technique can be found in the free English Heritage guide http://www.english-heritage.org.uk/publications/light-fantastic/
Lidar is used in a wide range of scientific and military applications including terrain mapping, hydrological modelling, change detection and forestry canopy and biomass analysis. Most of the data available to researchers in the UK is collected by the Geomatics Group on behalf of the Environment Agency for the purposes of flood mapping. A catalogue of the data available can be viewed here: https://www.geomatics-group.co.uk/GeoCMS/Order.aspx
The basic principle of lidar is laser-based distance measurement. A scanner is mounted below an aircraft from which a laser is fired repeatedly at the ground. The scanner oscillates back and forth, perpendicular to the direction of flight, creating a zig-zag pattern of points.
The sensor records the time taken for the reflections of the laser to bounce back offthe target. As the speed is also know thendistance from the sensor to the ground can be calculated, and a cloud of point measurements created.
Once these measurements are corrected for the real-world location of the aircraft (via GPS) and the movement of the sensor (using the aircraft's inertial measurement unit) a terrain model can be made.
It is often claimed that lidar can “see through” trees,but this is not strictly true as the laser cannotpenetrate solid material. In wooded areas, the lasercan partially reflect from parts of the canopy, withsome of the beam passing through to the ground.The sensor records these partial reflections as awavelength and from the shape of this wavelength itis possible classify ground and non-ground points(vegetation or buildings).
Intro to QGIS 3

YADAG Using Airborne Lidar Training, Jan 11th 2014
Once you have classified the lidar point data you can create a terrain model by interpolating the points to fillthe gaps. When we are using data from the EA archive this step will be undertaken already and you will have the choice to view the unfiltered data as a Digital Surface Model (including trees and buildings) and the filtered data as a Digital Terrain Model (just ground points).
It is not possible for the laser to penetrate the canopy to measure a ground point in all conditions. Areas of thick scrub or dense evergreen trees such as yew would not yield any ground points. It is important that these areas of “no data” are recognised in the terrain model, and for this reason you should always analyse both the DSM and DTM. Additionally, depending on how sensitive the filtering technique was, some archaeological features may also be removed by this process so it is always important to use all the data available to you.
Intro to QGIS 4
YADAG Using Airborne Lidar Training, Jan 11th 2014
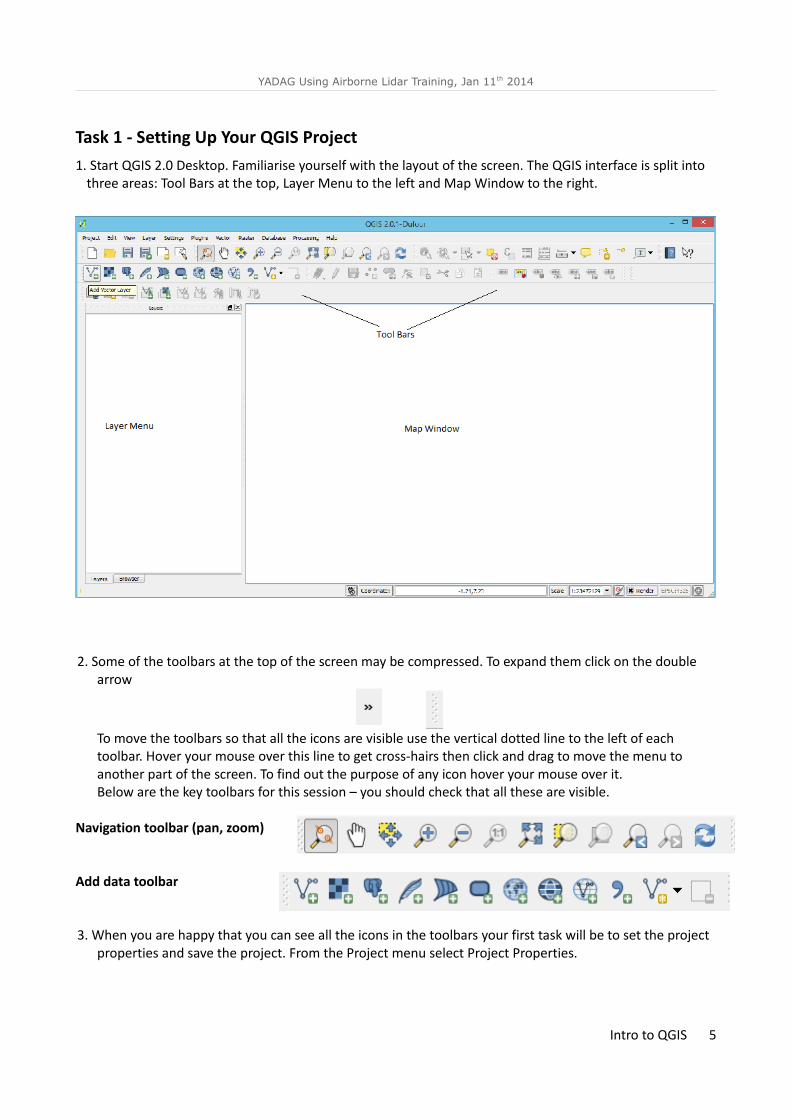
Task 1 - Setting Up Your QGIS Project1. Start QGIS 2.0 Desktop. Familiarise yourself with the layout of the screen. The QGIS interface is split into
three areas: Tool Bars at the top, Layer Menu to the left and Map Window to the right.
2. Some of the toolbars at the top of the screen may be compressed. To expand them click on the double arrow
To move the toolbars so that all the icons are visible use the vertical dotted line to the left of each toolbar. Hover your mouse over this line to get cross-hairs then click and drag to move the menu to another part of the screen. To find out the purpose of any icon hover your mouse over it.Below are the key toolbars for this session – you should check that all these are visible.
Navigation toolbar (pan, zoom)
Add data toolbar
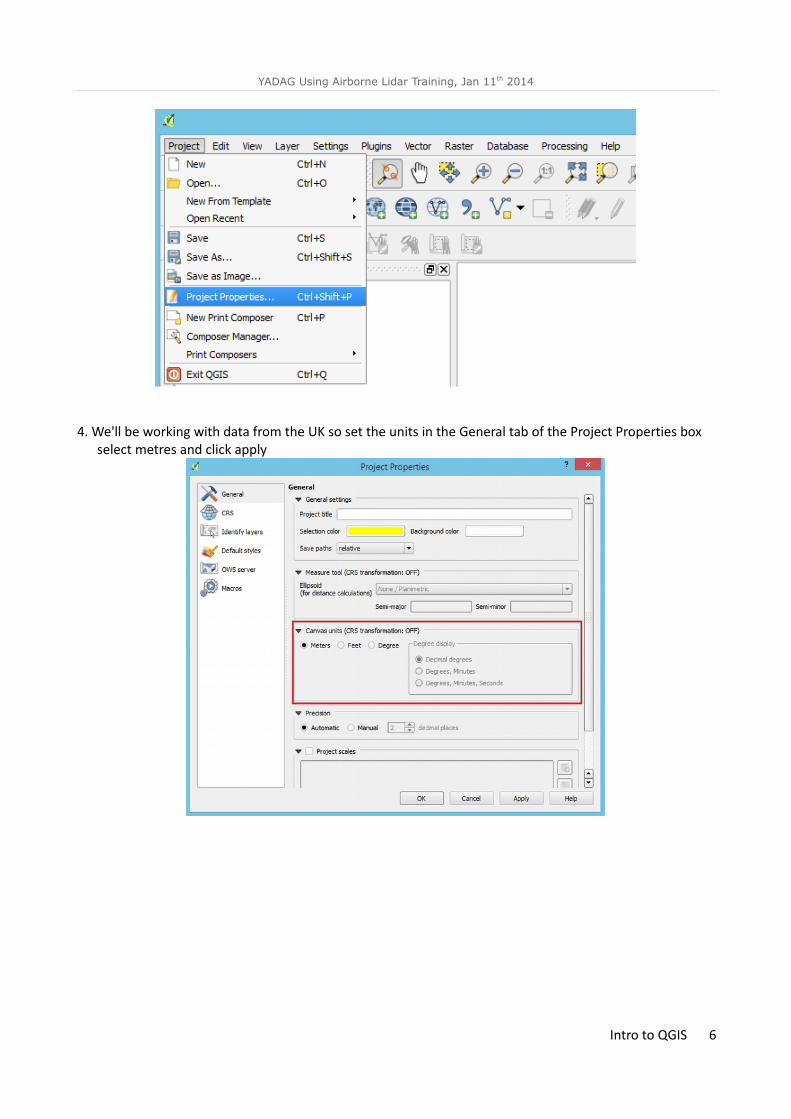
3. When you are happy that you can see all the icons in the toolbars your first task will be to set the project properties and save the project. From the Project menu select Project Properties.
Intro to QGIS 5
YADAG Using Airborne Lidar Training, Jan 11th 2014
4. We'll be working with data from the UK so set the units in the General tab of the Project Properties box select metres and click apply
Intro to QGIS 6

YADAG Using Airborne Lidar Training, Jan 11th 2014
5. To set the coordinate reference system (CRS) click on the CRS tab and check the Enable 'on the fly' CRS transformation.
The data for this tutorial is from the UK so we will search through the list for OSGB 1936. A quick way to do this is to type in the EPSG ID code 27700 in the filter box. Click on the OSGB 1936 / British National Grid in the box below to select it and then click apply to set the CRS.
6. Click OK to close Project Properties and return to the main screen.
7. Use Project>save to save the project to your working area.
Intro to QGIS 7

YADAG Using Airborne Lidar Training, Jan 11th 2014
Task 2 – Opening raster files in QGIS and editing their properties1. We will open the lidar terrain models (DTM and DSM) of the study area using the tool bar icon (layer >
add raster layer). You can hold down the shift or ctrl keys to select multiple files
2. Select the EA lidar 1m DSM ST7087_DSM_1m (downloaded from the website) The importer will ask you to define the CRS for the file, check that it is ESPG 27700 (OSGB 1936 / British National Grid) and click OK.
Intro to QGIS 8

YADAG Using Airborne Lidar Training, Jan 11th 2014
3. The lidar models will appear in the layer manager on the left of the QGIS window in the Layer Menu. You can switch the layers on and off by using the check box beside the layer name.
4. Hovering you mouse over the layer will display the file path of the layer.
Intro to QGIS 9

YADAG Using Airborne Lidar Training, Jan 11th 2014
5. Practice using the pan and zoom tools to navigate round your raster
6. To improve the lidar raster display we will now edit the raster properties. In the menu bar, right click on the raster's name and select properties.
7. Edit the symbology so that the image is stretched to min and max values. This preference can be saved asthe default for the file.
Intro to QGIS 10

YADAG Using Airborne Lidar Training, Jan 11th 2014
8. Return to the properties menu. In this menu can be found a variety of options for colouring the map, editing transparency and viewing metadata.
9. Take some time to familiarise yourself with these options:
• Change the raster from greyscale to Pseudocolour• Make the raster 25% transparent• Note below the directory location of the raster file and its CRS
• Note below the “NoData” value of the raster
10. Save your project.
Intro to QGIS 11

YADAG Using Airborne Lidar Training, Jan 11th 2014
11. We will now add another raster to the project – the filtered lidar data or Digital Terrain Model (DTM). As before use the add raster icon to open the photograph. Make sure the CRS is OSGB 36.
12. Switch the layers on and off to see the differences between the models13. Finally add an aerial photograph to the area.
14. The order of layers can be changed by dragging the layer up or down the layer menu. Practice reordering the layers.
15. In the layer properties of either layer change the transparency to view details from both layers overlaid.
Intro to QGIS 12
Click layer and drag up or down the list

YADAG Using Airborne Lidar Training, Jan 11th 2014
Task 3 – Create a Hillshade (Shaded Relief Model)1. The basic functionality of QGIS can be increase via the use of plugins. We will add a raster analysis plug in to create a hillshaded model from our lidar terrain model
2. Go to Plugins > Manage Plugins
3.Check the box beside the Raster Terrain Analysis Plugin and click close to load the plugin into QGIS.
4. Navigate to Raster Terrain Analysis. Pick hillshade to open the hillshade menu.
Intro to QGIS 13

YADAG Using Airborne Lidar Training, Jan 11th 2014
5. In the hillshade menu enter the parameters for your model. It is good practice to include the selected Azimuth (0-359° east of North) angle of illumination to the file name to keep track of the parameters used
{datasource}_{model}_ {z factor}_{azimuth}_{illumination angle} e.g lidar_HS_1_300_40.
We are going to create a number of files so it is important that you label them clearly.
6. Pick your elevation later (hint use the DSM). Browse to a location to save your output file too – don't forget to include the shading parameters in the file name! Leave the z Factor at 1 for now, check Add Result to Project. For now we will create a hillshade using the default parameters, 300 ° east of North and 40° elumination. Click OK
Intro to QGIS 14

YADAG Using Airborne Lidar Training, Jan 11th 2014
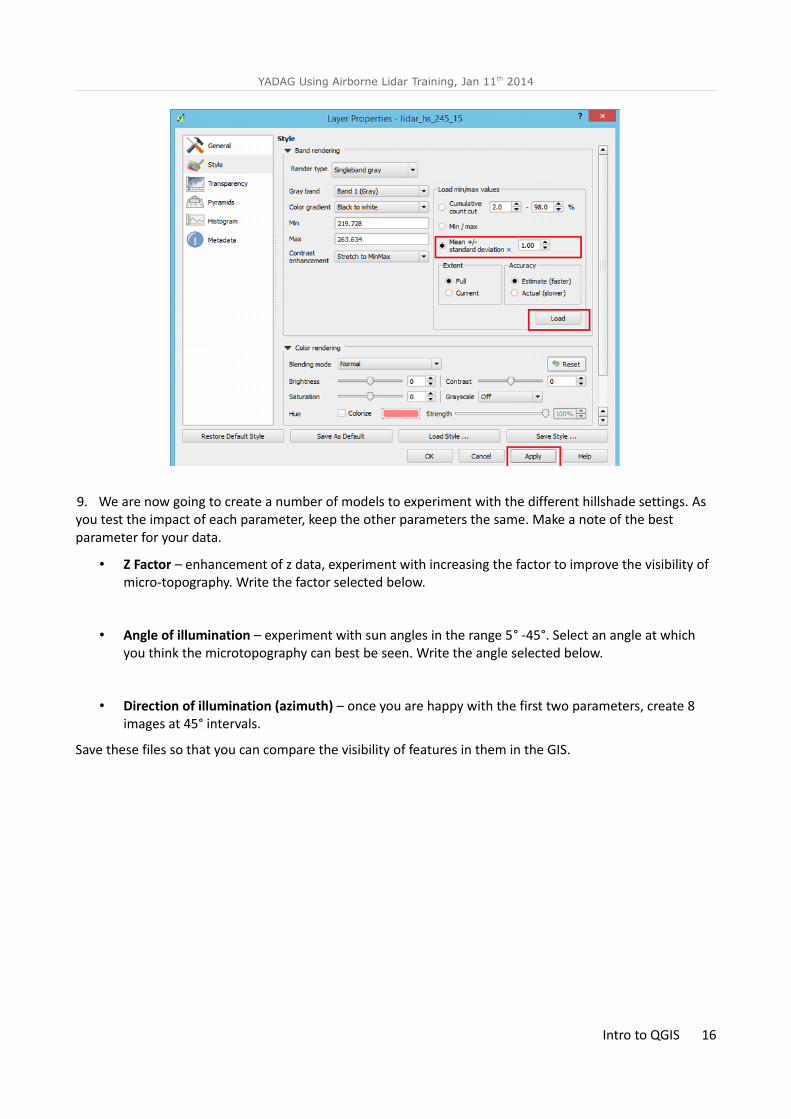
7. The resulting image may look very faint on screen (if you used the DSM rather than the DTM) because of the range of values presented – you will need to adjust the display properties to view it more easily.
8. In the Style tab, select mean +/- Standard deviation and click Load. If you are happy with the layer's presentation on screen you can save this as the default style here before clicking “OK”
Intro to QGIS 15
YADAG Using Airborne Lidar Training, Jan 11th 2014
9. We are now going to create a number of models to experiment with the different hillshade settings. As you test the impact of each parameter, keep the other parameters the same. Make a note of the best parameter for your data.
• Z Factor – enhancement of z data, experiment with increasing the factor to improve the visibility of micro-topography. Write the factor selected below.
• Angle of illumination – experiment with sun angles in the range 5° -45°. Select an angle at which you think the microtopography can best be seen. Write the angle selected below.
• Direction of illumination (azimuth) – once you are happy with the first two parameters, create 8 images at 45° intervals.
Save these files so that you can compare the visibility of features in them in the GIS.
Intro to QGIS 16

YADAG Using Airborne Lidar Training, Jan 11th 2014
Task 4 – Draw a Profile
The lidar model contains 3D height data but the GIS interface is only 2D. To better visualise the height data we can draw a profile across the raster image. We will first need to add a tool to QGIS using the plugins menu.
1. Go to Plugins > Manage and Install Plugins
2. On the left column click Get More, and in the search tab enter “profile”. Click to highlight on the Profile tool listing and click Install Plugin.
3. You will now have a new icon in your tool bar
Intro to QGIS 17

YADAG Using Airborne Lidar Training, Jan 11th 2014
4. To use the tool, select the DTM layer in the navigation menu on the left and then click on the profileicon. Zoom into a feature and draw a profile across it (click once to begin a line and twice to end theprofile). The profile will be drawn in the lower portion of the screen.
5. Switch to the Table view in the Profile Tool window. Notice that height values extracted from the raster along the profile are recorded in a table and can be exported to a spreadsheet for further analysis using the Copy to Clipboard button.
Intro to QGIS 18

YADAG Using Airborne Lidar Training, Jan 11th 2014
6. Return to the Profile view and add your hillshade layer. Click on the layer in the layer Menu then usethe Add Layer button in the profile window to add the data for the hillshade image of the same profile.
7. Change the colour of this profile on the graph by clicking on the box to the left of the layer name.
What do you notice about the scales of the two profiles? Which layer should you use to estimate the height of a feature?
Intro to QGIS 19

YADAG Using Airborne Lidar Training, Jan 11th 2014
8. Remove the Lidar DSM from the profile tool window using the Remove Layer button. Save the profile as an image using the Save icon.
Intro to QGIS 20
YADAG Using Airborne Lidar Training, Jan 11th 2014
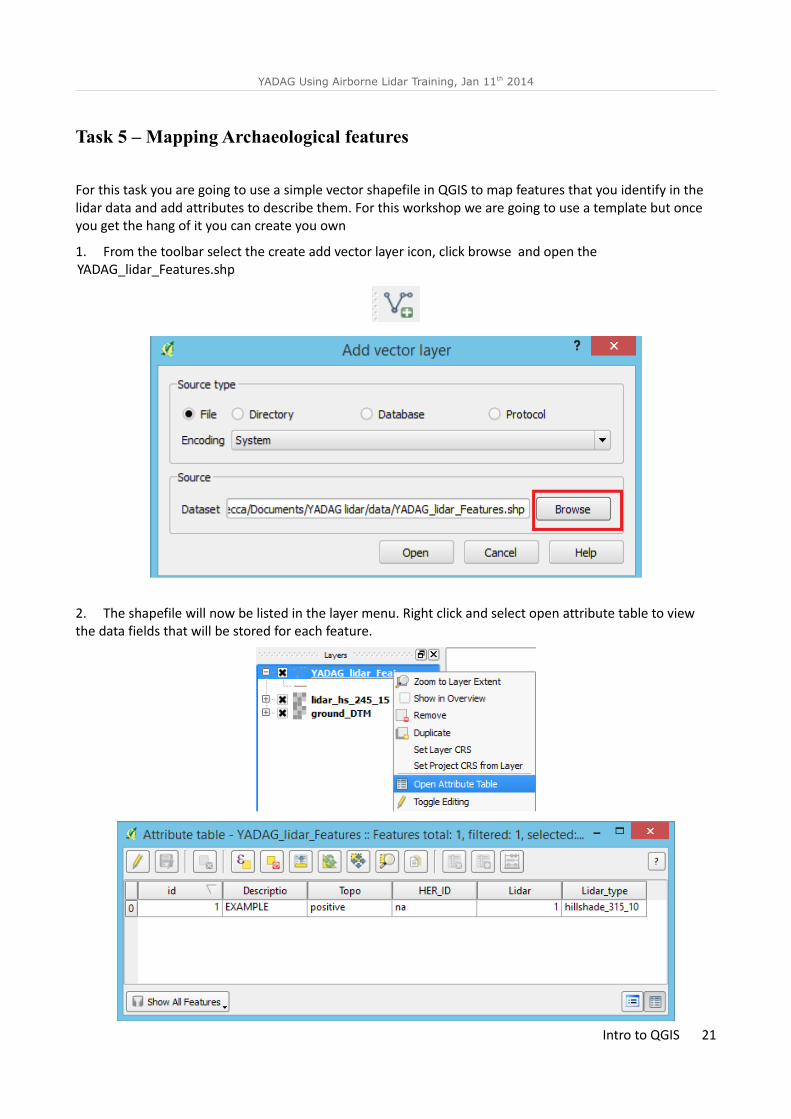
Task 5 – Mapping Archaeological features
For this task you are going to use a simple vector shapefile in QGIS to map features that you identify in the lidar data and add attributes to describe them. For this workshop we are going to use a template but once you get the hang of it you can create you own
1. From the toolbar select the create add vector layer icon, click browse and open the YADAG_lidar_Features.shp
2. The shapefile will now be listed in the layer menu. Right click and select open attribute table to view the data fields that will be stored for each feature.
Intro to QGIS 21

YADAG Using Airborne Lidar Training, Jan 11th 2014
In this instance ID = A unique number
Description = a description of the feature e.g. long linear bank
Topo = the feature's topography, positive (bank, wall, mound) or negative (ditch, pit, hollow)
HER_ID = locla Historic Environment Record ID (to allow cross-referencing)
lider = Coded fiedl indication if it is visible on lidar data (1 = yes, 0 = no) – this is useful when you are comparing a number of sources such as photographs, lidar and geophysics to record which data the feature is visible in)
Lidar_type = which visualisation technique was the feature mapped from - we have seen the visualisation techniques significantly affect visibility so recording this metadata is important.
3. Now close the attribute table by checking the cross in the top right corner. We will now start to digitise some features. Use the pan and zoom tools to zoom to a feature visible on the data.
4. Make the shapefile editabe by highlighting it in the layer menu and clicking on the edit icon from the toolbar. You will see that all the other icons on the editing toolbar now become active.
5. Select the Add New feature icon.
6. You can now begin to digitise the feature from the lidar. Click at intervals along the feature until you have mapped its length, then right click to finish. The attributes will pop up for you to fill in. Add the details of the feature and click OK
7. Save the edits to the shape file using the save icon – do this often to make sure your data is not lost!
Intro to QGIS 22

YADAG Using Airborne Lidar Training, Jan 11th 2014
8. Experiment with moving the feature using the move feature icon and editing the nodes using the node tool. Dont forget to save your changes!
9. To change the appearance of the shapefile right click on it in the layer menu and select Properties. Under the style tab you can change the colour, thickness and syle of the line in the file
Intro to QGIS 23