thalassas.webs.uvigo.esthalassas.webs.uvigo.es/thalassas 29(1)/thalassas 29(1).pdfthalassas is...
TRANSCRIPT

An International Journal of Marine Sciences
Number 29 (1) January 2013
Thalassas


ThalassasThalassas greek voice meaning...”of the sea”

THALASSAS is included in the following DATABASES:
THE BOWKER INTERNATIONAL SERIALS DATABASE (Ulrich’s International Periodicals Directory). USA.
ÍNDICE ESPAÑOL DE CIENCIA Y TECNOLOGÍA (I.C.Y.T.). SPAIN
FAO: FISHERY INFORMATION. DATA AND STATISTICS SERVICE ITALY
MS. MEDIA SERVICE GMBH. GERMANY
CATÁLOGO CSIC, SPAIN
LATINDEX, MÉXICO
SCOPUS
THOMSON REUTERS MASTER JOURNAL LIST
JOURNAL CITATION REPORTS: THOMSON-REUTERS WEB OF KNOWLEDGE
DIALNET
GEOREF
SCIENCE CITATION INDEX EXPANDED
ZOOLOGICAL RECORD
WEB PAGE: http://webs.uvigo.es/thalassas/Electronic submission of Manuscripts: http://recyt.fecyt.es/index.php/Thal
© Universidade de Vigo, 2013
Printed in Vigo. Spain
Edition: Servizo de Publicacións Universidade de Vigo. Campus das Lagoas, Marcosende 36310 Vigo. España.
I.S.S.N.: 0212-5919Dep. Leg.: C379-83Nº 29 (1) - 2013
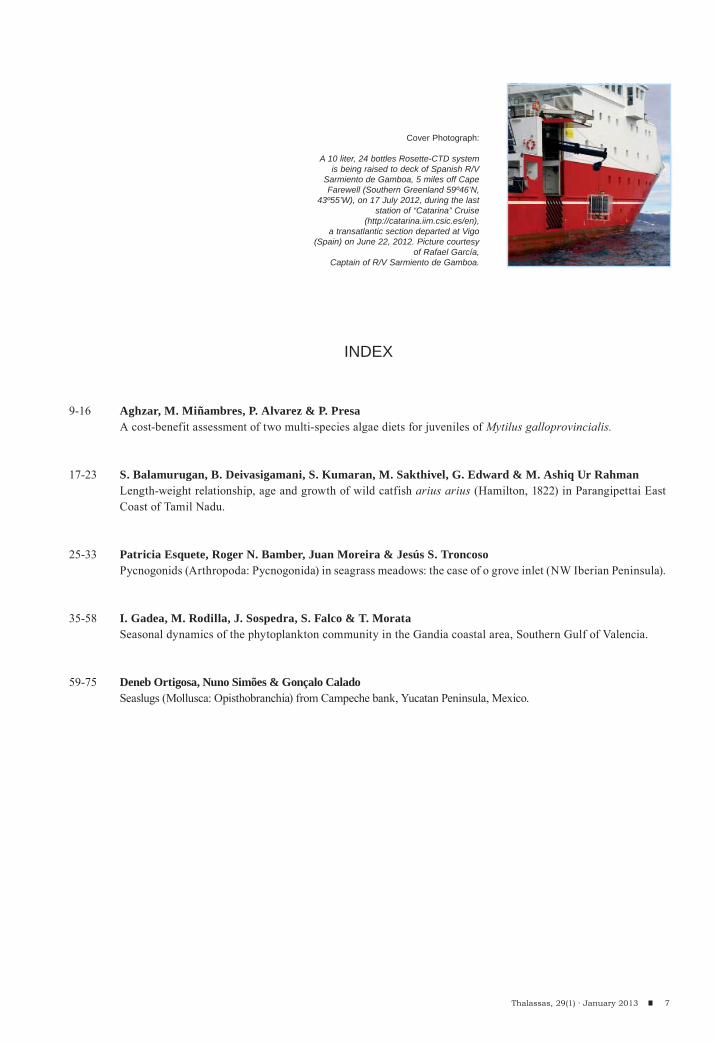
Cover photograph: A 10 liter, 24 bottles Rosette-CTD system is being raised to deck of Spanish R/V Sarmiento de Gamboa, 5 miles off Cape Farewell (Southern Greenland 59º46’N, 43º55’W), on 17 July 2012, during the last station of “Catarina” Cruise (http://catarina.iim.csic.es/en), a transatlantic section departed at Vigo (Spain) on June 22, 2012. Picture courtesy of Rafael García, Captain of R/V Sarmiento de Gamboa.
Volume 29(1)
THALASSASAN INTERNATIONAL JOURNAL OF MARINE SCIENCES


EDITORIAL BOARD
Editor-in-Chief
Scientific Committee
MANUEL J. REIGOSA ROGERDepartament of Plant Biology and Soil Science
University of Vigo, Spain
ALFREDO ARCHE MIRALLESInstituto de Geología Económica.C.S.I.C., Madrid, Spain
ANTONIO CENDRERO UCEDAD.C.I.T.T.Y.M. Facultad de Ciencias.University of Cantabria, Santander, Spain
CARLOS SOUTOFaculty of Marine SciencesUniversity of Vigo, Spain
CÁSTOR GUISANDEFaculty of Marine SciencesUniversity of Vigo, Spain
DANIEL REYFaculty of Marine SciencesUniversity of Vigo, Spain
FEDERICO ISLACentro de Geología de CostasUniversity of Mar del Plata, Argentina
FEDERICO VILAS MARTÍNFaculty of Marine SciencesUniversity of Vigo, Spain
FRANCISCO RAMILFaculty of Marine SciencesUniversity of Vigo, Spain
GUILLERMO FRANCÉSFaculty of Marine SciencesUniversity of Vigo, Spain
GABRIEL ROSÓNFaculty of Marine SciencesUniversity of Vigo, Spain
JESÚS IZCO SEVILLANOFaculty of PharmacyUniversity of Santiago, Spain
JESÚS SOUZA TRONCOSOFaculty of Marine SciencesUniversity of Vigo, Spain
JOHN L. LARGIERBodega Marine LaboratoryDepartment of Environmental Science and Policy,University of California, Davis
LUÍS GONZÁLEZDepartament of Plant Biology and Soil ScienceUniversity of Vigo, Spain
LUISA ANDRADEDepartament of PlantBiology and SoilScienceUniversity of Vigo, Spain
MIGUEL Á. NOMBELAFaculty of Marine SciencesUniversity of Vigo, Spain
M. RUFUS KITTOMarine Biology Department, Faculty of Marine SciencesKing Abdulaziz University, Jeddah, Saudi Arabia
NORBERT P. PSUTYCenter for Coastal and Environmental StudiesUniversity of New Jersey, USA
TAKESHI YASUMOTODepartment of Chemistry, Agricultural Faculty,University of Tohoku, Japan
TOMOHIRO KAWAGUCHIDepartment of Environmental HealthS ciencesThe Norman J. ArnoldS chool of Public HealthUniversity of South Carolina, USA
Papers should be submitted using the web-based application. If you want to add some materials (software, extended maps, additional material) please contact [email protected] for instructions. The application is accessed from the Journal web page (http://webs.uvigo.es/thalassas). There you should select “Send an article” and follow the instructions. Alternatively, you can directly access the application in the following address: http://recyt.fecyt.es/index.php/Thal
Thalassas publishes papers related to all fields of marine sciences. Bothregular papers, short notes and review papers are accepted. You can also contact previously with the Editor-in-Chief (Manuel Reigosa, [email protected]) this is especially encouraged before submitting review papers or letters.
ArticlesThalassas is an international journal that accepts original papers, review papers and short notes about every aspect of marine sciences,especially when a multidisciplinary approach is followed. Language accepted is English. The journal will provide also a summary in Spanish.Authors are allowed to post their accepted papers in their own Web pages. Thalassas will, in any case, provide free to all the scientificcommunity, a version of the published papers to download from the Thalassas Web page.Revision of papers will be done using electronic facilities (that is, referees would receive by e-mail the papers under revision and should answerno later than two weeks after receiving the article by e-mail or fax).Authors can apply for a picture or graphics to be used as a full colour cover image for the paper version. Please state it when you submit your paper.
Full-length papers:Those are original previously unpublished works about any aspect of marine sciences. The title should be indicative of contents, and no longer than 60characters. The first page should include the names of authors and complete affiliations, including e-mail addresses and Web page addressesif any. They will include an abstract (100 - 300 words), followed by less than 15 keywords (both included in the abstract andadditional). Materials and Methods sections will be followed by Results and Discussion. Those sections can be put together if this fits the contentof the Manuscript. Manuscripts should be written in simple sentences, conforming to accepted Scientific Standard English. Texts should be clearconsidering the great scope of the audience (this is not a very specialised journal, covering a broad range of disciplines, although always relatedto marine or coastal ecosystems).
After those sections, Acknowledgements and References should follow. The style of citation will be as follows:
Journal articles:Author AA, Author BB (year). Title of article, Complete name of Journal, number: pages
Book articles:Author AA, Author BB (year). Title of article. In: A Editor, B Editor, eds, Title of Book, Ed, number, Vol number, Publisher, City, pages.Theses Author AA (year) Title of thesis.University, City.The citations should be arranged in the text from earliest to most recent year, alphabetised by name within the same year. In the references list,order by author (s) name, after by year.Finally, figures, tables and captions for figures and tables should be included.
Review papers:Those papers will be published mainly by invitation. But suggestions are also welcome. If you feel that you can contribute with a review, pleasecontact Editor-in-Chief by e-mail.
Technical papers:These papers are especially welcome for the electronic version, but if the editors appreciate their interest, they can also be published in the paperversion. The structure of the article should follow the same recommendations as full-length papers.
Letters:Correspondence prepared for publication in the paper version should not exceed two printed pages. For the electronic version (that will be thepreferred for letters because the speed of publication and the possibility of several responses) no page limit is applied, although the shorter thebest.
Meeting reports and Conference Proceedings:For meeting reports of Conferences about Marine Sciences, the coordinator of the Congress who wishes an abstract to appear in Thalassas (eitherin electronic or paper versions) should contact Editor-in-Chief ([email protected]). Congress Proceedings could also be published as specialnumbers of the journal.
INSTRUCTIONS FOR THE AUTHORS
7Thalassas, 29(1) · January 2013
INDEX
Aghzar, M. Miñambres, P. Alvarez & P. PresaA cost-benefit assessment of two multi-species algae diets for juveniles of Mytilus galloprovincialis.
S. Balamurugan, B. Deivasigamani, S. Kumaran, M. Sakthivel, G. Edward & M. Ashiq Ur RahmanLength-weight relationship, age and growth of wild catfish arius arius (Hamilton, 1822) in Parangipettai East Coast of Tamil Nadu.
Patricia Esquete, Roger N. Bamber, Juan Moreira & Jesús S. TroncosoPycnogonids (Arthropoda: Pycnogonida) in seagrass meadows: the case of o grove inlet (NW Iberian Peninsula).
I. Gadea, M. Rodilla, J. Sospedra, S. Falco & T. MorataSeasonal dynamics of the phytoplankton community in the Gandia coastal area, Southern Gulf of Valencia.
Deneb Ortigosa, Nuno Simões & Gonçalo CaladoSeaslugs (Mollusca: Opisthobranchia) from Campeche bank, Yucatan Peninsula, Mexico.
9-16
17-23
25-33
35-58
59-75
Cover Photograph:
A 10 liter, 24 bottles Rosette-CTD system is being raised to deck of Spanish R/V
Sarmiento de Gamboa, 5 miles off Cape Farewell (Southern Greenland 59º46’N,
43º55’W), on 17 July 2012, during the last station of “Catarina” Cruise
(http://catarina.iim.csic.es/en),a transatlantic section departed at Vigo
(Spain) on June 22, 2012. Picture courtesy of Rafael García,
Captain of R/V Sarmiento de Gamboa.

A COST-BENEFIT ASSESSMENT OF TWO MULTI-SPECIES ALGAE DIETS FOR JUVENILES OF
Mytilus galloprovincialis
(1) Université Abdelmalek Essaâdi, Faculté des Sciences, Laboratoire de Biologie Appliquée et Pathologie,BP. 2121, Mhannech 2, 93002 Tétouan, Morocco
(2) University of Vigo, Department of Biochemistry, Genetics and Immunology,ECIMAT-Faculty of Marine Sciences, Illa de Toralla, 36331 Vigo, Spain
*Corresponding author: Pablo PresaUniversity of Vigo. Dep. Biochemistry, Genetics and Immunology, 36310 Vigo, Spain
Tel. & Fax: +34-986-812567. E-mail: [email protected]
Thalassas, 29(1) · January 2013: 9-16An International Journal of Marine Sciences
Key words: Chaetoceros gracilis, cost-benefi t assessment, multi-species algae diets, Mytilus galloprovincialis, Phaeodactylum tricornutum.
Palabras clave: Chaetoceros gracilis, costes de producción, dietas microalgales multiespecífi cas, Mytilus galloprovincialis, Phaeodactylum tricornutum.
A. AGHZAR(1), M. MIÑAMBRES(2), P. ALVAREZ(2) & P. PRESA(2)*
9Thalassas, 29(1) · January 2013
ABSTRACT
The optimisation of productivity in mussel hatchery requires the assessment of multi-species algae diets to enhance growth and survival during retention time. The present study monitored shell length in Mytilus galloprovincialis juveniles using diets of four micro-algae, Tetraselmis suecica, Isochrysis galbana, Phaeodactylum tricornutum and Chaetoceros gracilis. The experiment lasted 116 days to assess shell length response, used a full-sib mussel progeny to minimise familiar effects on growth variance, and enforced a mini-raft suspension system to assure equal food deliverance to all juveniles under treatment. Shell-length increment in the 26% C. gracilis-based diet was not different from the 26% P. tricornutum-based diet except in two samplings. None differences between diets were observed neither in the growth trend nor in survival (99%). Present data indicate that multi-species algae diets incorporating C. gracilis have a slight non-significant positive effect on growth of M. galloprovincialis juveniles and that such growth gain is not compensated by its higher production cost (4 times) as compared to diets composed by cheaper and easy-culturing species such as P. tricornutum. The global cost required to fill a whole raft (ca 200 ropes) using two-month old hatchery-produced mussel juveniles (One month retention time after fixation i.e. juveniles 2,000 μm in length) fed P. tricornutum was less (1,892 €/raft) than that fed C. gracilis (7,551 €/raft) or its equivalent from rocky scrapping (2,000 €/raft).
RESUMEN (Evaluación de costes y rendimiento de dos dietas microalgales multiespecíficas para juveniles de Mytilus galloprovincialis)
La optimización de la producción de semilla de mejillón en criadero requiere la evaluación de dietas multiespecificas para mejorar el crecimiento y la supervivencia durante la fase de retención. En este trabajo se efectúa el seguimiento de la longitud valvar de juveniles de Mytilus galloprovincialis alimentados con dietas compuestas de cuatro cepas microalgales, i.e. Tetraselmis suecica, Isochrysis galbana, Phaeodactylum tricornutum y Chaetoceros gracilis. El experimento duró 116 días para valorar la respuesta de crecimiento, se empleó una progenie de hermanos completos para minimizar la varianza de crecimiento debida a efectos familiares, y se utilizó un sistema experimental de minibateas en suspensión que aseguró la distribución homogénea de alimento entre los juveniles tratados. El incremento en longitud valvar del grupo sometido a la dieta que contenía 26% de C. gracilis sólo difirió del de la dieta con 26% de P. tricornutum en dos muestreos. No se observaron diferencias entre dietas, ni en la curva de crecimiento ni en la supervivencia juvenil (99%). Estos resultados indican que las dietas multialgales que incorporan C. gracilis provocan un efecto positivo en el crecimiento de juveniles de mejillón pero no es significativo al com-pararlo con dietas similares. Además este efecto positivo de C. gracilis sobre el crecimiento no está compensado por un mayor rendimiento del stock cultivado, pues su coste de producción es 4 veces mayor que el de dietas multialgales más baratas y fáciles de cultivar, tal como las basadas en la especie P. tricornutum. El coste estimado para inocular una batea de cultivo con 200 cuerdas, con juveniles de 2 meses de vida (2.000 μm de longitud), producidos y alimentados en criadero con P. tricornutum (1 mes de retención tras la fijación) es de 1.892 €/batea, i.e. cuatro veces menos que los alimentados con C. gracilis (7.551 €/batea), y menor que su equivalente procedente de la compra de semilla en el mercado (2.000 €/batea).
A. AGHZAR, M. MIÑAMBRES, P. ALVAREZ & P. PRESA
INTRODUCTION
Live microalgae are believed to provide the most important nutrients for bivalves in the wild because their shortage trends to prolong the planktonic larval phase, increasing cohort mortality due to predation (Rumrill, 1990), and to negatively affect spat recruitment in artificial rope collectors. This phenomenon has been observed in several bivalves. For example, Mytilus californianus larvae have shown limited growth and delayed development under unsuitable food supply (Paulay et al., 1985; Pechenik et al., 1990). Mytilus edulis veligers have shown limited growth due to food supply scarcity in the embayment during summer (Fotel et al., 1999). With the advancement on bivalve reproduction techniques and juveniles pre-fattening in nurseries, the culture of live microalgae has become a key requisite for massive production of juveniles (Page & Hubbard, 1987). Microalgae are used to feed larvae, post-larvae and juveniles as well as in broodstock conditioning, and their production represents 30% - 40% of hatchery operation costs (Coutteau & Sorgeloos, 1992; Helm et al., 2004). Therefore, optimisation of microalgae diets is a commonly sought parameter in bivalve hatchery production for larvae and juveniles (Liu et al., 2009). Bivalve larvae and juveniles are often fed multispecies algal diets because they exhibit better balancing of the essential nutritional compounds with particular reference to polyunsaturated fatty acids, and assure higher growth and survival than single species diets (Enright et al., 1986; Laing & Millican, 1986; De Pauw & Persoone, 1988; Nevejan et al., 2007).
Previous studies have shown growth enhancement of juveniles of some bivalves fed fresh microalgae (Ponis et al., 2003; Cragg 2006; Liu et al., 2009) belonging to several genera such as Tetraselmis, Isochrysis, Phaeodactylum, Chaetoceros, Pavlova, Dunaliella, Thalassiosira and Skeletonema (Helm et al., 2004). The food value of T. suecica is considered low possibly because of the presence of a rigid cell wall which might make it difficult to digest (Rico-Mora, 1987). However, T. suecica is an appreciated species because of its high ratio of protein content/cell volume as compared to that of many other species used in aquaculture. I. galbana has shown some technical problems in large-scale cultures (Coeroli et al., 1984), has no advantage over P. tricornutum, and is a poorer food than C. gracilis. However, I. galbana is an excellent food for many filter-feeders (Sukenik & Wahnon, 1991), especially at larval stages (Liu et al., 2009). P. tricornutum is not generally considered a good food source although it is easy to produce and has been successfully used for growing oyster larvae (Epifanio et al., 1981) and for feeding juveniles of clams and mussels (Foster-Smith,
1975). A higher growth has been observed in bivalves and copepods fed Chaetoceros sp. than fed Phaeodactylum, the latter microalgae having a reduced nutritional value of 12% of lipids against 19% of the former (Helm et al., 2004; Liu et al., 2009; Puello-Cruz et al., 2009). However, Chaetoceros sp. is more difficult and expensive to maintain in large volumes than Phaeodactylum. C. gracilis is one of the easier Chaetoceros species for culture and is widely used in larger volumes around the world (Lambade & Mohamed, 2002).
The present study aimed at assessing shell-length growth in M. galloprovincialis juveniles in nursery using multispecific diets of the above cited microalgae species, in order to address if the expected higher juvenile growth fed C. gracilis (Medium difficulty cultivation and high energetic efficiency, rich in the PUFA 20:5ω3) compensates its higher production costs against the cheaper species P. tricornutum (Low cultivation difficulty and medium-low energetic efficiency but rich in 22:6ω3). To properly estimate the cost-benefit ratio between diets, several growing parameters were fixed, such as the use of a full-sib progeny of M. galloprovincialis to minimise familiar effects of mixed progenies on growth variance, the implementation of an in vitro mini-raft suspension system that minimises differences in food availability by all juveniles under treatment, or an experimental time of 116 days to properly assess shell length response under different diets.
MATERIALS AND METHODS
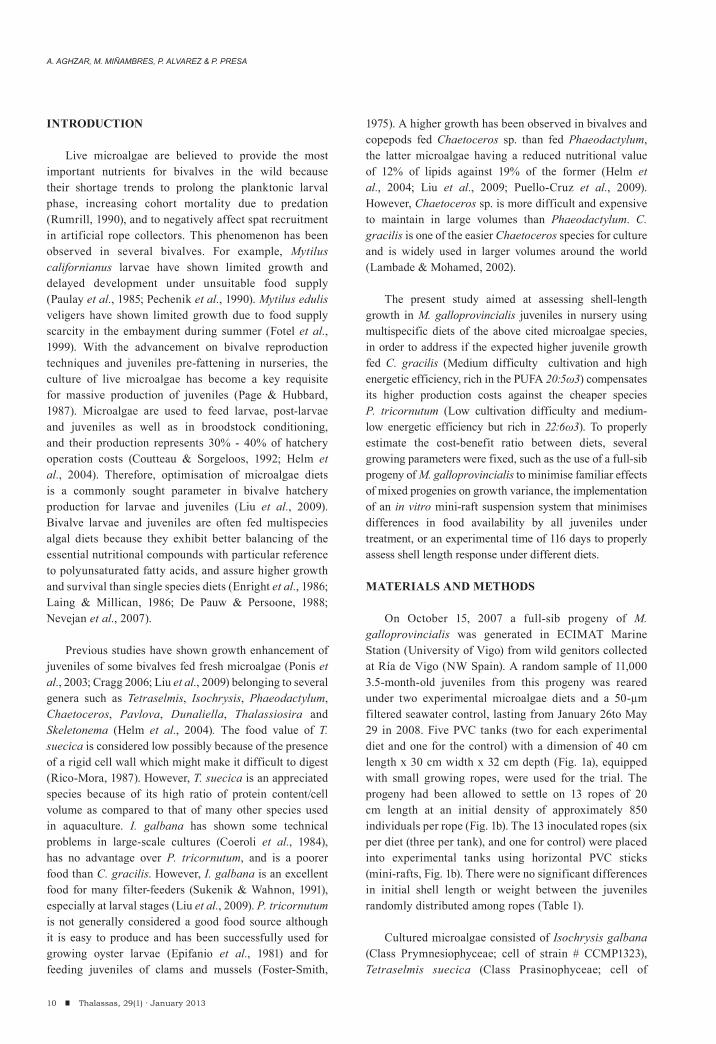
On October 15, 2007 a full-sib progeny of M. galloprovincialis was generated in ECIMAT Marine Station (University of Vigo) from wild genitors collected at Ría de Vigo (NW Spain). A random sample of 11,000 3.5-month-old juveniles from this progeny was reared under two experimental microalgae diets and a 50-μm filtered seawater control, lasting from January 26to May 29 in 2008. Five PVC tanks (two for each experimental diet and one for the control) with a dimension of 40 cm length x 30 cm width x 32 cm depth (Fig. 1a), equipped with small growing ropes, were used for the trial. The progeny had been allowed to settle on 13 ropes of 20 cm length at an initial density of approximately 850 individuals per rope (Fig. 1b). The 13 inoculated ropes (six per diet (three per tank), and one for control) were placed into experimental tanks using horizontal PVC sticks (mini-rafts, Fig. 1b). There were no significant differences in initial shell length or weight between the juveniles randomly distributed among ropes (Table 1).
Cultured microalgae consisted of Isochrysis galbana (Class Prymnesiophyceae; cell of strain # CCMP1323), Tetraselmis suecica (Class Prasinophyceae; cell of
10 Thalassas, 29(1) · January 2013

Fig 1
A COST-BENEFIT ASSESSMENT OF TWO MULTI-SPECIES ALGAE DIETS FOR JUVENILES OF Mytilus galloprovincialis
strain # CCMP904), Phaeodactylum tricornutum (Class Bacillariophyceae; Ecimat collection cell of strain # CCMP633) and Chaetoceros gracilis (Class Coscinodiscophyceae; cell of strain # CCMP1317). These strains were grown in six litres flasks in a batch system at 20±1ºC and a continuous lighting intensity of 6,000 luxes from three cool daylight fluorescent tubes. Flasks were bubbled and enriched with Walne’s medium, and pH was maintained between 7.4 and 8.3 by unmetered, continuous CO2 injection. Collection of cells for feeding was made at the exponential growth stage, and cell number per microalgae culture was estimated daily using a Neubauer counting chamber and a microscope.
The two experimental multispecies diets conformed as follows: Diet-A was composed by I. galbana and T. suecica (37% or 60 mg of the equivalent wet weight for each species) and P. tricornutum (26% or 43 mg of the equivalent wet weight); Diet-B was mostly composed as Diet-A andbut contained C. gracilis (26% or 43 mg of the equivalent wet weight) instead of P. tricornutum; instead of C. gracilis (26% or 43 mg of the equivalent wet weight); Diet-C orwas the control dietgroup and received a constant supply of 50 μm filtered seawater. The average number of cells per millilitre at the exponential culturing phase was 12,000,000 for I. galbana, 2,300,000 for T. suecica, 15,000,000 for P. tricornutum, and 3,000,000 for C. gracilisTo achieve a food equivalent of 20% of the average body wet weight of mussels, the amount of live microalgae delivered to each experimental tank contained 163 mg of wet weight day-1
For daily diet adjustment we used the cell organic weight established for C. gracilis (30 μg per 106 cells) and
P. tricornutum (23 μg per 106 cells) (Helm et al., 2004) and applied the expression (See Miñambres et al., 2011 for details):
VD = (C* Vc)/D)*fc where,
VD = deliverable volume of C. gracilisVc=Vt*0.25= deliverable volume of P. tricornutum (25%)C= No. cell/ml P. tricornutum as estimated in daily counting D= No. cell/ml C. gracilis as estimated in daily countingfc=23/30=0.77= conversion factor from P. tricornutum to C. gracilis
Final microalgae formulae was diluted to 60 L with 50 μm filtered seawater for better dosing and both diets were continuously pumped at 0.5-0.6 mL s-1. The tank for the control (Diet-C) received a constant supply of 50 μm filtered seawater (the same used to prepare Diet-A and Diet-B). All tanks received a water inflow rate of 40 mL s-1 (complete volume replacement every 24 min). Diet-C received an average phytoplankton amount from sea water of 2.0 mg DW day-1 in the course of the experiment. Experiments were conducted at 18±2ºC and tanks were aerated during the experiment to provide oxygen and to prevent microalgae cell sedimentation. Tanks were cleaned and disinfected three times a week to remove faeces and adherent particles and juveniles were rinsed with a gently spray of seawater. The absence of pseudofaeces and the presence of well defined faeces at the bottom of the tank indicated an efficient consumption of the whole diet delivered. Growth was calculated in terms of shell length increase (μm day-1). Individual shell length was measured every 15 days on a
11Thalassas, 29(1) · January 2013
b a
Figure 1:PVC tanks used for mini-raft simulation in the diet trial (Panel a); 20 cm-length culture ropes,
each containing 850 juveniles from a full-sib progeny (Panel b)
A. AGHZAR, M. MIÑAMBRES, P. ALVAREZ & P. PRESA
subsample of 50 individuals randomly taken from each mini-raft feeding. Shell-length measurements were taken with an image analysis system (Nis elements BR 3.0) connected to a magnifying glass (Nikon SMZ 1500). Three months after the beginning of the experiment, shell size of mussels in the experimental diets was large enough to replace the optical measurement system by a digital calliper with 0.01 mm accuracy (Mitutoyo IP67).
Normality length and weight per diet and sample was explored with Kolmogorov-Smirnov test. Shell-length measurements taken on serial replicates within diet were compared with a Mann-Whitney test. Comparison of average shell length between diets at each sampling as well as between temporal samplings within diet, were performed with the Kruskall-Wallis test, the ANOVA analysis and the ad hoc Scheffée test, all of them implemented in SPSS 17.0. Mortality day-1 was calculated after the number of dead animals (shells) found at the bottom of each experimental tank by the time of shell length control ca. once a week.
The production costs per rope were calculated from the
experimental data and scaled up for industrial implication. In mussel aquaculture,initial 4.5 mm juveniles taken from collector ropes or from rocky scrapping are fixed to growth ropes suspended from rafts normally placed in protected areas such as estuaries. After 3 to 5 months growing in the sea juveniles are unfolded into 2-3 ropes of about 50 kg mussels each. After an additional year of sea growth we obtain 2-3 harvesting ropes of about 150 kg mussels each (30-35 individuals per kg). Discounting 10% mortality in the first growing period we finally require
11,500 juveniles per rope and 2,310,000 juveniles per 200-rope raft. The cost of juveniles produced in nursery for 116 and 30 days of retention was considered for each multispecies diet. In addition, ten kg of juveniles of 5-15 mm length are required to fill a growth rope. Therefore, a 200- rope raft requires 2,000 kg such juveniles. The cost of mussel juveniles from rock-scrapping (1 €/kg) required to fill a raft (2,000€/raft) was also compared to the cost of similar-sized juveniles produced in nursery for 116.
RESULTS
Evolution of shell length within diet
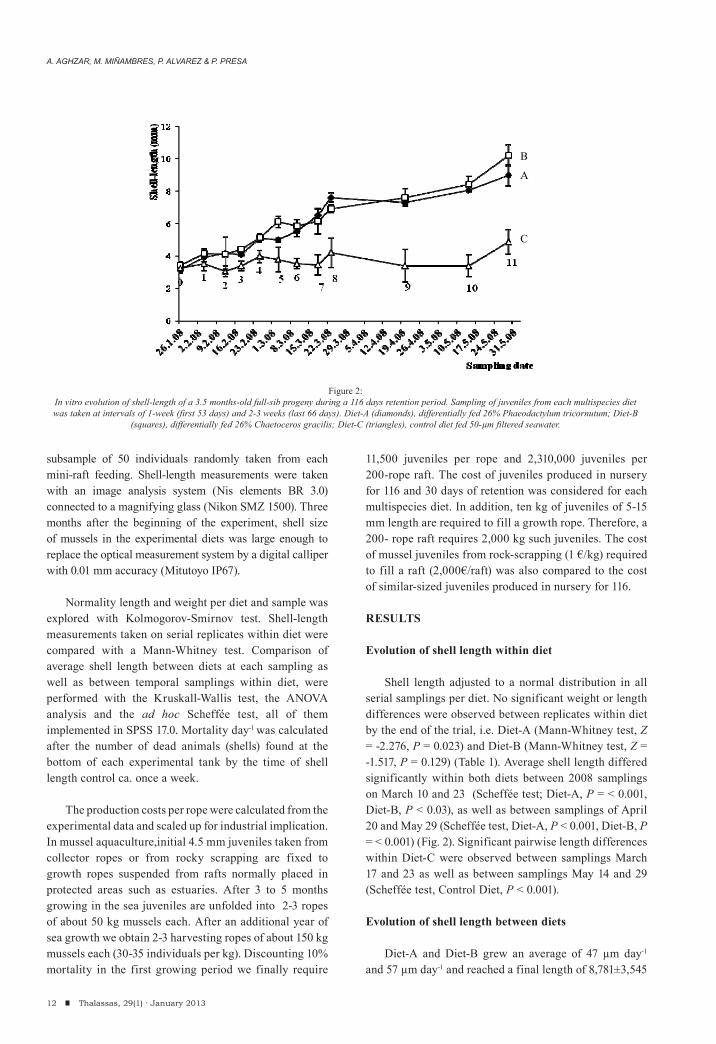
Shell length adjusted to a normal distribution in all serial samplings per diet. No significant weight or length differences were observed between replicates within diet by the end of the trial, i.e. Diet-A (Mann-Whitney test, Z = -2.276, P = 0.023) and Diet-B (Mann-Whitney test, Z = -1.517, P = 0.129) (Table 1). Average shell length differed significantly within both diets between 2008 samplings on March 10 and 23 (Scheffée test; Diet-A, P = < 0.001, Diet-B, P < 0.03), as well as between samplings of April 20 and May 29 (Scheffée test, Diet-A, P < 0.001, Diet-B, P = < 0.001) (Fig. 2). Significant pairwise length differences within Diet-C were observed between samplings March 17 and 23 as well as between samplings May 14 and 29 (Scheffée test, Control Diet, P < 0.001).
Evolution of shell length between diets
Diet-A and Diet-B grew an average of 47 μm day-1 and 57 μm day-1 and reached a final length of 8,781±3,545
12 Thalassas, 29(1) · January 2013
B
A
C
Figure 2:In vitro evolution of shell-length of a 3.5 months-old full-sib progeny during a 116 days retention period. Sampling of juveniles from each multispecies diet was taken at intervals of 1-week (first 53 days) and 2-3 weeks (last 66 days). Diet-A (diamonds), differentially fed 26% Phaeodactylum tricornutum; Diet-B
(squares), differentially fed 26% Chaetoceros gracilis; Diet-C (triangles), control diet fed 50-μm filtered seawater.

A COST-BENEFIT ASSESSMENT OF TWO MULTI-SPECIES ALGAE DIETS FOR JUVENILES OF Mytilus galloprovincialis
μm and 10,235±3,946 μm , respectively. Diet-C grew an average of 14 μm day-1 and reached a final length increment of 4,867±1,536 (Table 1). Growth of mussels in the control diet lagged from the start and differed significantly from the two multispecies diets in all samplings (ANOVA, F = 38.884, P = 0; Fig. 2). By the end of the experiment mussel groups under Diet-A and Diet-B were significantly larger than those under Diet-C (Mann-Whitney test; Diet-A, Z = -6.444, P = 0; Diet-B, Z = -3.910, P = 0) (Table 1). Significant length differences between the two multialgal diets were observed only in two samplings, March 3 (ANOVA test, F = 49.44, P < 0.001) andMay 29 (F = 38.88, P < 0.001) this later in the end of the experiment (Fig. 2). Mortality day-1 of the whole batch of juveniles was significantly less (P < 0.001) in multispecies enriched sea water (average for the two diets ± SD: 0.075 ± 0.004) than in filtered sea water (0.154 ± 0.015). Survival did not differ between supplemented diets and averaged 99.11 % across the 12 experimental mini-ropes.
Production costs
Letting alone common production costs for both diets, such as the inoculum price (30 € each), the production of algal species common to both diets (T. suecica, I. galbana) or labour, the volume of C. gracilis required to obtain an equivalent organic weight to that of P. tricornutum implied a 3.99x increment of variable costs (Table 2). The production cost invested to fill a growth rope and a whole raft (200 ropes) with 116 old
hatchery-grew juveniles from the present experiment were 37.84 €/rope and 7,568.3 €/raft for P. tricornutum, respectively, and 151.02 €/rope and 30,203.6 €/raft for C. gracilis, respectively.
DISCUSSION
Performance of multispecies diets
The coincidence observed across diets regarding the two samplingss of higher growth (i.e., between March 17 and 23 and between May 14 and 29 is likely influenced by a natural enrichment of the nutrient fraction in the seawater (phytoplankton blooming) intake to the nursery. Although Diet-A and Diet-B showed a rough similar shell length pattern across samplings, the final larger size of juveniles under Diet-B is in agreement with previous results obtained on juveniles of M. galloprovincialis (Cordero & Voltolina, 1994) and on post-larvae of Clinocardium nuttallii (Liu et al., 2009) using single species diets, and also with results on M. galloprovincialis (Whyte et al., 2002) and other cultured species (Puello-Cruz et al., 2009). Such studies indicate that Tetraselmis and Isochrysis have the highest protein content, Tetraselmis has the lowest lipids content, Isochrysis and Chaetoceros have the lowest and the highest ash content, respectively. Such congruence among studies, diets and species indicates that despite its high ash content, Chaetoceros sp. is one of the most performant living supplementary microalgae nowadays used in mollusc aquaculture.
13Thalassas, 29(1) · January 2013
Treatment Organic weight (mg day-1 (%))
Diet
No. ropes Initial Shell length (μm)
X ±SD Final Shell length (μm)
X ±SD Shell-length rate (μm day-1)
I. galbana T. suecica P. tricornutum
63 (39) 57 (35) 43 (26)
A (1) 3 3224.90a ± 940.40 3152.19a
± 937.66
8501.16a ± 3612.43 8780.69a
± 3544.87 47.30± 15.87
A (2) 3 3057.46a ± 939.99
9135.76a ± 3306.98
I. galbana T. suecica C. gracilis
63 (39) 57 (35) 43 (26)
B (1) 3 3210.30a ± 891.92
3407.67a ± 986.71
10643.97a ± 4088.20
10234.86a ± 3945.53
57.37± 20.59
B (2) 3 3371.00a ± 1045.7
9724.54a ± 3717.88
50 μm filtered seawater 2.0 (100) C 1 3257.15a
± 962.60 - 4867.44b ± 1535.37 - 13.53±
4.09
Table 1:Shell-length of full-sib M. galloprovincialis juveniles fed two composite microalgae diets (163 mg day-1; Isochrysis galbana, Tetraselmis suecica, Phaeodactylum tricornutum/Chaetoceros gracilis). The experiment lasted 116 days, from January 26th 2008 to May 29th 2008. Different superscripts in the same column indicate
significant differences among treatments for α = 0.001.

A. AGHZAR, M. MIÑAMBRES, P. ALVAREZ & P. PRESA
Growth of mussel juveniles fed mixed fresh microalgae diets was significantly enhanced regarding monospecific diets (Davis & Cambell 1998; Fotel et al., 1999; Puello-Cruz et al., 2009). For comparison of the shell-length obtained herein with mixed Diet-A (47 μm day-1 size increment and final size 8,781±3,545 μm) and Diet-B (57 μm day-1 increment and final size 10,235±3,946 μm ), the reported length increase of M. edulis juveniles under distinct experimental diets was 4.3 ± 0.4 μm day-1 in filtered sea water, 9.1 ± 0.2 μm day-1 in natural sea water, 13.1 ± 2.8 μm day-1 in enriched sea water (5x10⁴ cells mL-1 Isochrysis galbana), and 5.6 ± 0.3 μm day-1 to 7.6 ± 1.3 μm day-1 in the wild (Fotel et al., 1999). Although the amount of energy in filtered seawater is assumed to reach the minimum required for maintaining the basal metabolic rate of mussels (Wong & Levinton, 2004), the two mixed diets assayed resulted in a weight increase that equalled fourfold the weight of the control Diet-C (14 μm day-1 and final 49% length increase). The high survival (around 99%) of juveniles fed multispecies enriched seawater was close to that observed in M. edulis larvae under different food ratios (Fotel et al., 1999). Therefore, in addition to the positive growth enhancement of mussel larvae, fresh multispecific formulated diets seem to assure a good survival of juveniles during retention times prior to raft culture in suspension devices.
Production costs
An optimal balance between production costs and growth increase during retention times is a key parameter
in juveniles-production efficiency. Regarding this, the microalgae assayed were collected at 5 days-old exponential stage cultures. At this time culture of C. gracilis averaged 3,000 cells/μl while P. tricornutum produced 15,000 cells/μl. Considering that 106 cells of C. gracilis weight 30 μg and the same amount of P. tricornutum cells weights 23 μg (Helm et al., 2004), production costs of the same amount of cells (43 mg day-
1) per species were ~4 times higher for C. gracilis than for P. tricornutum in the same culturing conditions (i.e., inoculum prize, Walne’s medium, etc.) (Table 1). Such higher production costs for C. gracilis (40.91 €) were due to the higher electrical consumption required to produce equal amounts of cells as for P. tricornutum (10.24 €). This cost would be reduced by 4 if retention time is reduced to one month (2.56 € and 10.23 €, respectively) and if large scale production of microalgae and culture medium are enforced. In this sense, a final approximate cost of 1 month retention time would be 1,892 €/raft for P. tricornutum and 7,551 €/raft for C. gracilis. Taking into consideration that the number of wild juveniles required to fill a raft cost about 2,000 € in the market (Table 2), it would result profitable the production of juveniles in hatchery using cheap-optimized multialgal diets. Several species of Chaetoceros are nowadays included in multialgal diets for molluscs due to their positive synergic role on growth (Puello-Cruz et al., 2009). Nevertheless, present data indicate that using C. gracilis in multispecies diets does not compensate its high production costs when compared to other cheaper and easy-culturing species such as P. tricornutum. Provided that acceptable growth
14 Thalassas, 29(1) · January 2013
P. tricornutum C. gracilis
Experimental ropea 1 growth ropeb 1 raftc Experimental rope a 1 growth ropeb 1 raftc
No. juveniles 3,400 11,550 2,310,000 3,400 11,550 2,310,000
Volume of algae (L) 102 346.5 69,300 403 1,369 273,803
Volume of Walne medium (mL) 102 600 120,000 403 2371 474,200
Cost of the Walne medium (€) 1.22 7.2 1,440 4.84 28.45 5,690
Electrical consumptiond (€) 9.02 30.6 6,128 36.08 122.57 24,513
Production cost (€) (116 days retention) 10.24 37.84 7,568 40.91 151.02 30,203
Production cost (€) 30 days retention 2.56 9.46 1,892 10.23 37.76 7,551
a Experimental diets were applied during 116 days of retention.
b One growth rope requires 10-12 kg of 5-15 mm juveniles. c One typical raft contains about 200 growth ropes. d Electrical consumption required to produce 43 mg day-1 of P. tricornutum or C. gracilis during 116 days, other costs being equal across species. Three fluorescent 36W
tubes were used for each of the three cultivation balloons.
Table 2:Estimated differential production costs of juveniles fed two experimental diets; common costs to both species are excluded, e.g. inoculum price, instrumentation or labour costs. The higher volume of C. gracilis required to attain an equivalent organic weight to P. tricornutum, finally rises variable production costs of the
former by ≈4 times.
A COST-BENEFIT ASSESSMENT OF TWO MULTI-SPECIES ALGAE DIETS FOR JUVENILES OF Mytilus galloprovincialis
and survival seem to be guaranteed during hatchery retention times, advances in juveniles culturing using performant live microalgae would come from reducing it cost-benefit production ratio.
ACKNOWLEDGEMENTS
This research was funded by Xunta de Galicia through grant program Ayudas para la Consolidación de Unidades Competitivas de Investigación INCITE07PXI310152ES. A. Aghzar has been supported by AECID (Ministerio Español de Asuntos Exteriores y Cooperación) through a research scholarship II-A from MAEC-AECID #0000215094 (2007-2008).
REFERENCES
Brown MR, Jeffrey SW, Garland CD (1989). Nutritional aspects of microalgae used in mariculture; a literature review, CSIRO Marine Laboratories Report, 205: 1-43.
Coeroli M, De Gaillande D, Landret JP (1984). Recent innovations in cultivation of molluscs in French Polynesia, Aquaculture, 39: 45-67.
Cordero B, Voltolina D (1994). Growth of Mytilus galloprovincialis fed with four microalgae and two feeding regimes, Journal of the World Aquaculture Society, 25(3): 471-476.
Coutteau P, Sorgeloos P (1992). The use of algal substitutes and the requirement for live algae in the hatchery and nursery rearing of bivalve molluscs: an international survey, Journal of Shellfish Research, 11(2): 467-476.
Cragg SM (2006). Development, physiology, behaviour and ecology of scallop larvae. In: SE Shumway, GJ Parsons, (eds.), Scallops: Biology, Ecology and Aquaculture, Elsevier B.V. Amsterdam, pp. 45-105.
Davis JP, Cambell CR (1998). The use of a Schizochytrium-based HUFA enriched dry feed for culturing juvenile mussels (Mytilus galloprovincialis) and the comparative routine costs of producing live algae in a commercial bivalve hatchery. In: H Grizel, P Kestemont (eds.), Aquaculture and water: fish culture, shellfish culture and water usage, Oostende Belgium European Aquaculture Society Spec. Publ. 26: 65-66.
De Pauw N, Persoone G (1988). Micro-algae for aquaculture. In: MA Borowitzka, LJ Borowitzka (eds.), Micro-algal biotechnology, New York, Cambridge U. Press, p 197-221.
Enright CT, Newkirk GF, Craigie JS, Castell JD (1986). Evaluation of phytoplankton as diets for juvenile Ostrea edulis L, Journal of Experimental Marine Biology and Ecology, 96: 1-13.
Epifanio CE, Valenti CC, Turk CL (1981). A comparison of Phaeodactylum tricornutum and Thalassiosira pseudonana as foods for the oyster, Crassostrea virginica, Aquaculture, 23: 347-353.
Foster-Smith RL (1975). Some mechanisms for the control of pumping activity in bivalves, Marine Behavior and Physiology, 4: 41-60.
Fotel FL, Jensen NJ, Wittrup L, Hansen BW (1999). In situ laboratory growth by a population of blue mussel larvae (Mytilus edulis L) from a Danish embayment, Knebel Vig, Journal of Experimental Marine Biology and Ecology, 233: 213-230.
Helm MM, Bourne N, Lovatelli A (2004). Hatchery culture of bivalves: A Practical Manual, FAO Fisheries Technical Paper 471, Rome.
Laing I, Millican PF (1986). Relative growth and efficiency of Ostrea edulis L. spat fed various algal diets, Aquaculture, 54: 245-262.
Lambade SB, Mohamed KS (2002). Laboratory - scale high density culture of the marine diatom Chaetoceros sp, Indian Journal of Fisheries, 49(1): 13-21.
Liu W, Pearce CM, Alabi AO, Gurney-Smith H (2009). Effects of microalgal diets on the growth and survival of larvae and post-larvae of the basket cockle, Clinocardium nuttallii, Aquaculture, 293: 248-254.
Miñambres M, Pérez M, Alvarez P, Presa P (2011). Cálculo de parámetros elementales para el cultivo de microalgas en criadero y su aplicación en el diseño de raciones alimentarias. In: Métodos y Técnicas de Investigación Marina, JM Estévez, C Olabarria, S Pérez, E Rolán, G Rosón (eds.), Chapter XIV: pp. 159-172.
Nevejan N, Davis J, Little K, Kiliona A (2007). Use of a formulated diet for mussel spat Mytilus galloprovincialis (Lamarck 1819) in a commercial hatchery, Journal of Shellfish Research, 26(2): 357-363.
Page H, Hubbard DM (1987). Temporal and spatial patterns of growth in mussels Mytilus edulis on an offshore platform: relationships to water temperature and food availability, Journal of Experimental Marine Biology and Ecology, 111: 159-179.
Paulay G, Boring L, Strathmann RR (1985). Food limited growth and development of larvae: experiments with natural sea water, Journal of Experimental Marine Biology and Ecology, 93: 1-10.
Pechenik JA, Eyster LS, Widdows J, Bayne BL (1990). The influence of food concentration and temperature on growth and morphological differentiation of blue mussel Mytilus edulis L. larvae, Journal of Experimental Marine Biology and Ecology, 136: 47-64.
Ponis E, Robert R, Parisi G (2003). Nutritional value of fresh and concentrated algal diets for larval and juvenile Pacific oysters (Crassostrea gigas), Aquaculture, 221: 491-505.
Puello-Cruz AC, Mezo-Villalobos S, González-Rodríguez B, Voltolina D (2009). Culture of the calanoid copepod Pseudodiaptomus euryhalinus (Johnson 1939) with different microalgal diets, Aquaculture, 290: 317-319.
Rico-Mora R (1987). Efecto interactivo de la temperatura y de la concentración de microalgas en la fisiología alimenticia y
15Thalassas, 29(1) · January 2013
A. AGHZAR, M. MIÑAMBRES, P. ALVAREZ & P. PRESA
16 Thalassas, 29(1) · January 2013
la energía potencial para el crecimiento de Modiolus capax (Conrard) (Bivalvia:Mytilidae). Thesis Dissertation, Centro de Investigación Científica y de Educación Superior de Ensenada, Departamento de Ecología Marina, Ensenada, México.
Rumrill SS (1990). Natural mortality of marine invertebrate larvae, Ophelia, 32: 163-198.
Sukenik A, Wahnon R (1991). Biochemical quality of marine unicellular algae with special emphasis on lipid composition I: Isochrysis galbana, Aquaculture, 97: 61-72.
Whyte JNC, Sherry K, Ginther N, Peribere G (2002). Effects of a Schizochytrium-based diet in the growth and nutritional condition of the mussel, Mytilus galloprovincialis. In: Aquaculture Canada 2002 Abstracts. http://www.aquacu lt u reassocia t ion .ca /ac02/abs t r ac t s /mussel .htm#Whyte.
Wong WH, Levinton JS (2004). Culture of the blue mussel Mytilus edulis (Linnaeus, 1758) fed both phytoplankton and zooplankton: a microcosm experiment, Aquaculture Research, 35: 965-969.
(Received: December 9, 2011; Accepted: April 30, 2012)
LENGTH-WEIGHT RELATIONSHIP, AGE AND GROWTH OF WILD CATFISH Arius arius (HAMILTON, 1822)
IN PARANGIPETTAI EAST COAST OF TAMIL NADU
CAS in Marine Biology, Faculty of Marine Sciences, Annamalai University, Parangipettai-608502
* Email:[email protected]* (corresponding author), Fax: +914144 243641, Ph: 914144237606
Thalassas, 29(1) · January 2013: 17-23An International Journal of Marine Sciences
Key words: Arius arius, length weight, Age and growth, WBC count, parangipettai, Fisat II 1.2.2
Palabras clave: Ariusarius, longitud y peso, edad y crecimiento, conteo de células sanguíneas, FISAT II 1.2.2
S. BALAMURUGAN, B. DEIVASIGAMANI*, S. KUMARAN, M. SAKTHIVEL, G. EDWARD& M. ASHIQ UR RAHMAN
17Thalassas, 29(1) · January 2013
ABSTRACT
The catfishes constitute a momentous in terms of fisheries production in asian countries. The over fishing of marine fishes and lose stocks demands extend the studies towards understanding the identity and distribution of the stocks in space and time. The mathematical relationship between length and weight of fishes is a practical index suitable for understanding their sur-vival, growth, maturity, reproduction and general well being. The length weight relationship, age and growth of Arius arius in parangipettai coast of Tamil Nadu were assessed. The study show the length and weight relationship of length groups shows the significant at p < 0.001 except the length groups 6-9 and 21-24 cm. The values of the exponent b in the length-weight relationships W= aLb ranged from 3.1031 to 5.0423 and R2 = 0.9335 to 0.9818. The powell -Wetherall plots analysis shows that the L value was 215.00 mm and K value of 4.684. r = -0.870. The optimized values for K and L were estimated by the ELEFAN I shows 1.30 year-1 and 430.50 mm. The estimated growth performance index (Ø) for. Arius arius were 10.5 and 11 and t0 value of 1.29335. The total blood cell count shows increasing pattern in increasing in length groups. The lowest Blood Cells counts were examined in the 6-9 cm size and maximum counts were occurred in 30-33 cm size fishes.
RESUMEN (Relaciones longitud-peso, edad y crecimiento del bagre Arius arius (Hamilton, 1822) en la costa Este de Parangipettai en Tamil Nadu)
El bagre es una especie fundamental en cuanto a pesquerías en los países asiáticos. La sobrepesca de peces marinos y la pérdida de poblaciones exige ampliar los estudios dirigidos a la comprensión de la dinámica de los bancos pesqueros en el tiempo y el espacio. La relación matemática entre la longitud y el peso de los peces es un índice práctico adecuado para la comprensión de la supervivencia, el crecimiento, la madurez, la reproducción y el bienestar general de las poblaciones de peces. Se evaluaron el peso, la talla, la edad y crecimiento de ejemplares de Arius arius capturados en Parangipettai (costa de Tamil Nadu). El estudio demuestra una relación estadísticamente significativa (p< 0,001) entre la longitud y el peso excepto en el grupo de tallas de 6-9 cm y 21-24 cm de longitud. Los valores del exponente b en las relaciones talla-peso W= aLb variaron desde 3,1031 hasta 5,0423 con R2 = 0,9335 - 0,9818. El análisis de Powell-Wetherall encontró valores de L= 215,00 mm y K= 4,684, con r = -0,870. Los valores optimizados para K y L se calcularon mediante ELEFAN I alcanzando valores de 1,30 el primer año y 430,50 mm. Los valores estimados del índice de crecimiento global (Ø) para Arius arius fueron 10,5 y 11 con valor de t0= 1,29335. El recuento de glóbulos rojo total muestra un patrón creciente con el aumento de la talla. Los valores más bajos de conteos de células sanguíneas aparecieron en los peces de la categoría de tallas de 6 a 9 cm, mientras que los más altos fueron en peces de 30 a 33 cm.

S. BALAMURUGAN, B. DEIVASIGAMANI*, S. KUMARAN, M. SAKTHIVEL, G. EDWARD & M. ASHIQ UR RAHMAN
INTRODUCTION
The catfishes constitute a significant group in terms of fisheries production as evident from the total world fish catch of 96.93 million during 1991, where their contribution was just 0.63%, of which 0.44% was from the freshwater and 0.19% from the marine sector. (BBS 1989) However, according to the Statistical Bulletin published by the Government of India (1993) (Sparre P, Venema S C 1992) catfishes constitute 15% of the total fish production in India. Catfishes contribute about 14% of the total fish production in Bangladesh as well (Tandon KK 1964). The over fishing of marine fishes and lose stocks demands extend the studies towards understanding the identity and distribution of the stocks in space and time. A stock is a division of a species showing distinct morphometric characters, inhabiting a particular geographical area in which, its vital stock parameters of growth and mortality are homogeneous (Kothare PV, Bal DV 1976). The exploitation arise when a stock of single species in different geographical site. (Kothare PV, Bal DV 1976; Rao K, Venkata Subba 1982; Paramita BN, Sadashiv gopal raje 2009). Morphometic studies need to be supplemented by studies at the genetic level so as to (Paramita BN, Sadashiv gopal raje 2009) confirm whether the populations belong to different races or demes.
The mathematical relationship between length and weight of fishes is a practical index suitable for under-standing their survival, growth, maturity, reproduction
and general well being. Among marine catfishes, the engraved catfish (Arius arius, Ariidae) major species from the east coasts of India. (Rao K, Venkata Subba 1982) Length-weight relationships are useful in fishery management for both applied and basic use (Pitcher TJ, Hart PJ 1982; Moutopoulos DK, Stergiou KI 2002) 8] to (i) estimate weight from length observations; (ii) calculate production and biomass of fish population; and/or (iii) provide information on stock or organism condition at the corporal level and management for comparative growth studies.
METHODOLOGY
Study area and sample collection
The samples were collected in Parangipettai (Lat. 11º 29’N and Long. 79º 46’E) throughout the period of August 2010 to July 2011. A total of 650 adult fishes of both sexes, were collected and brought in the lab, length and weight were measured. The species were identified based on the FAO sheet, (FAO /SIDP 2000.) according to the morphometric and Meristic characters.
Morphometric Studies
Fresh specimens were used for the measurement, using divider and a measuring board the fish were measured. Three major morphometric characters were studied following. (Appa Rao T 1966; Dwivedi SN,
18 Thalassas, 29(1) · January 2013
6-9 9-12 12-1515-1818-2121-2424-2727-3030-3333-3737-40
0.0
0.5
1.0
1.5
2.0K
n V
alue
Length group (cm)
Figure 1: Study area

LENGTH-WEIGHT RELATIONSHIP, AGE AND GROWTH OF WILD CATFISH Arius arius (HAMILTON, 1822)IN PARANGIPETTAI EAST COAST OF TAMIL NADU
Menezes MR 1974). The significance of the difference between the characters, regressions of each morphometric character on fork length was considered at 5% and 1% probability level:
1. Total length (TL): Distance from the tip of the snout to the tip of longest caudal ray of the upper lobe when the upper lobe is laid back parallel to the scale.
2. Standard length (SL): Distance from the tip of the snout to the end of the vertebral column (structural base of caudal rays).
3. Fork length (FL): Distance from the tip of the snout to the end of the middle ray of the caudal fork.
Length-Weight Relationship For length-weight relationship, the total length was
measured to the nearest millimeter from the tip of the snout to the tip of the longest caudal fin ray of the lower
lobe and then weighed to the nearest gram. The allometric relationship between length (L) and weight (W) was calculated by the formula: W = a L b where, W = weight of an individual fish in gram; L = Length of an individual fish in millimeter ; a and b are constants. The data of total length and weight were analyzed by the least square method (Le Cren ED 1951) using the equation given as: Log W = Log a + b Log L where a and b are constants estimated by linear regression of the log transformed variates. Length weight relationship was determined separately, for both sexes of Arius arius from their respective locations and pooled.
To compare length and weight for a particular sample or individual, condition factors are used (Safran P 1992). One is the Fulton’s condition factor (K), equal to W/L3 (Fulton TW 1911) while other one is relative condition factor (Kn), Kn = W/aLb. In our study we used more homogenous formula of condition factor K=1000W/L3, to know the growth condition of fish (Bauchot R, Bauchot ML 1978). For length frequency data were the fishes were grouped 3cm class intervals. Powell-wetherall method (Beverton RJH, Holt SJ 1966) was used to calculate the ratio of total mortality and growth coefficient (Z/K) as initial estimate of asymptotic length (L). Length frequency data were then analysed by Electronic L Ength Frequency Analysis (ELEFAN I) (Pauly D 1980; Pauly D 1983) using the appropriate routines in FiSAT II package [19]. In this method the growth parameters, asymptotic length (L) and growth coefficient (K) were estimated following the von Bertalanffy growth equation (VBGE)9:
Lt = L (1-exp–-K (t t0)) (1)
where Lt is the length at age t, L the asymptotic length, K the growth coefficient and ‘t0’ age at which fish would have had zero length if they had always grown according to
19Thalassas, 29(1) · January 2013
6-9 9-12 12-1515-1818-2121-2424-2727-3030-3333-3737-40
0
5
0
5
0
Length group (cm)
Figure 2: Kn Value for Arius airus both sex in different length groups.
Figure 3:Condition factor K for Arius airus both sex in different length groups.
6-9 9-12 12-1515-1818-2121-2424-2727-3030-3333-3737-400.0
0.5
1.0
1.5
2.0
2.5
3.0
Cond
ition
fact
or
Length group
Figure 4:Powell-Wetherall plots of Arius airus both sex.

S. BALAMURUGAN, B. DEIVASIGAMANI*, S. KUMARAN, M. SAKTHIVEL, G. EDWARD & M. ASHIQ UR RAHMAN
the above equation. Parameters of L and K were computed from the ELEFAN I. The growth performance index (Ø) for Arius arius were computed using the following equation10:
Ø = log10K + 2 log10 L (2)
The t0 value from the length-frequency data cannot be estimated by ELEFAN, t0 are estimated by substituting the L and K in the following equation11:
log( t0) -0.176+0.260 logL 1.0 logK (3)
Total White Cells Count (Wcs)
The blood was drawn up to the mark in WBC pipette and diluted up to the mark11 with diluting fluid for 3 minutes. The cells were then allowed to settle. The cells in the four corner blocks were counted by using the low power objective and a medium ocular. The cell counts were carried out using a Neubauer heamocytomater (Hawksley and Son, England) and were expressed as cells ml-1 (Day F 1878). Mean and standard deviation (X±SD) was calculated for each set of the sample data.
RESULT
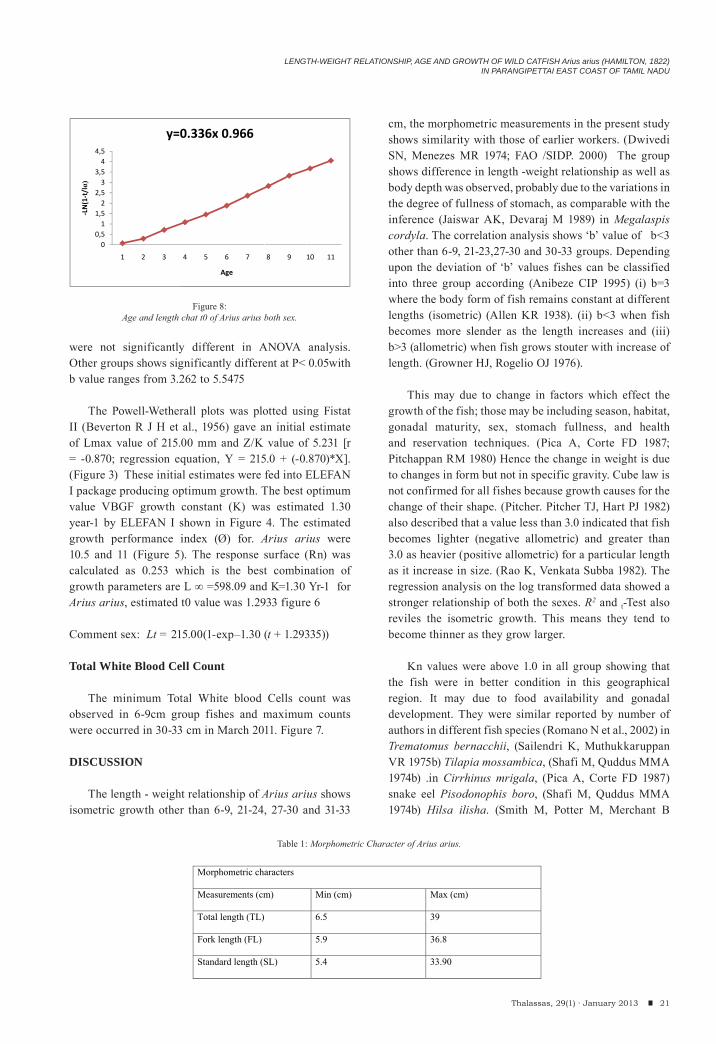
The Morphometric characters of Arius arius were given in Table 1. The length varies between 6.67-36.8 cm in fork length, 6.27-36 cm in total length and 7.45- 39 cm in standard length, the regression analysis of FL verses TL and SL shows significant different at p< 0.001 the ‘a’ value of 0.108 and ‘b’ value of 0 .8832 for FT and TL and for FL and SL the value are ‘a’’0.0282 and b is 0.9136. The length groups, the minimum, maximum and mean length (± S.E.), the minimum and maximum weight meansured, the parameters a and b, t-Test, and the coefficient of determination, R2 are presented in Table 2. Information on the growth (isometric or allometric) of each group is provided, in Table 2 and growth conditions K and Kn were presented in figure 1. The estimated coefficients of the length-weight relationship and other details of statistical analysis and the results of the ANCOVA analysis are given in Table 2. t-Test also reviles the isometric growth. The relative condition factor (Kn) were calculated (figure 1). And the K values were plotted in figure 2 our study shows that the length ranges from minimum of 7.45±0.85 cm to 38.09±0.65 cm, weight of 11.41±1.4g to 920.5±33.75g. te length group 6-9 and 21-23
20 Thalassas, 29(1) · January 2013
6 --9 9--12 12--1515--1818--2121--2424--2727--3030--3333--3737--400
1
2
3
4
5
6
Tota
l Whi
te B
lood
cel
ls c
ount
X 1
0-3/m
l
Lenght of Fish
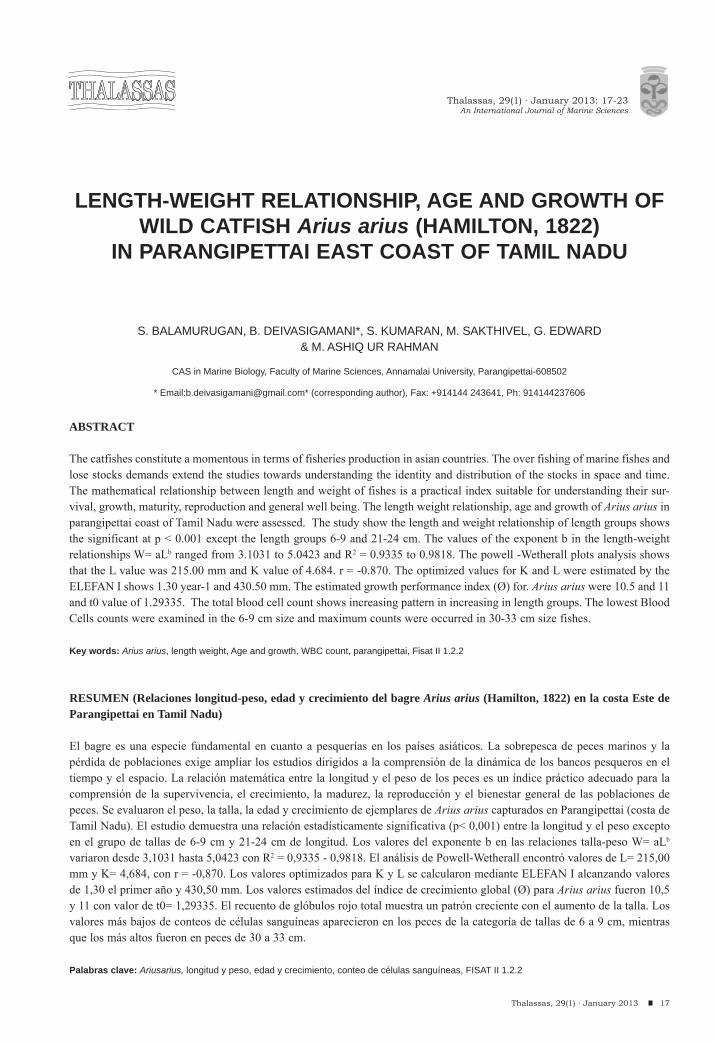
Figure 6:Growth performance index (Ø) for Arius arius both sex.
Figure 7:Total blood cell count for forArius arius both sex all groups.
Figure 5: Growth curves of Arius airus both sex.
LENGTH-WEIGHT RELATIONSHIP, AGE AND GROWTH OF WILD CATFISH Arius arius (HAMILTON, 1822)IN PARANGIPETTAI EAST COAST OF TAMIL NADU
were not significantly different in ANOVA analysis. Other groups shows significantly different at P< 0.05with b value ranges from 3.262 to 5.5475
The Powell-Wetherall plots was plotted using Fistat II (Beverton R J H et al., 1956) gave an initial estimate of Lmax value of 215.00 mm and Z/K value of 5.231 [r = -0.870; regression equation, Y = 215.0 + (-0.870)*X]. (Figure 3) These initial estimates were fed into ELEFAN I package producing optimum growth. The best optimum value VBGF growth constant (K) was estimated 1.30 year-1 by ELEFAN I shown in Figure 4. The estimated growth performance index (Ø) for. Arius arius were 10.5 and 11 (Figure 5). The response surface (Rn) was calculated as 0.253 which is the best combination of growth parameters are L ∞ =598.09 and K=1.30 Yr-1 for Arius arius, estimated t0 value was 1.2933 figure 6
Comment sex: Lt = 215.00(1-exp–1.30 (t + 1.29335))
Total White Blood Cell Count
The minimum Total White blood Cells count was observed in 6-9cm group fishes and maximum counts were occurred in 30-33 cm in March 2011. Figure 7.
DISCUSSION The length - weight relationship of Arius arius shows
isometric growth other than 6-9, 21-24, 27-30 and 31-33
cm, the morphometric measurements in the present study shows similarity with those of earlier workers. (Dwivedi SN, Menezes MR 1974; FAO /SIDP. 2000) The group shows difference in length -weight relationship as well as body depth was observed, probably due to the variations in the degree of fullness of stomach, as comparable with the inference (Jaiswar AK, Devaraj M 1989) in Megalaspis cordyla. The correlation analysis shows ‘b’ value of b<3 other than 6-9, 21-23,27-30 and 30-33 groups. Depending upon the deviation of ‘b’ values fishes can be classified into three group according (Anibeze CIP 1995) (i) b=3 where the body form of fish remains constant at different lengths (isometric) (Allen KR 1938). (ii) b<3 when fish becomes more slender as the length increases and (iii) b>3 (allometric) when fish grows stouter with increase of length. (Growner HJ, Rogelio OJ 1976).
This may due to change in factors which effect the growth of the fish; those may be including season, habitat, gonadal maturity, sex, stomach fullness, and health and reservation techniques. (Pica A, Corte FD 1987; Pitchappan RM 1980) Hence the change in weight is due to changes in form but not in specific gravity. Cube law is not confirmed for all fishes because growth causes for the change of their shape. (Pitcher. Pitcher TJ, Hart PJ 1982) also described that a value less than 3.0 indicated that fish becomes lighter (negative allometric) and greater than 3.0 as heavier (positive allometric) for a particular length as it increase in size. (Rao K, Venkata Subba 1982). The regression analysis on the log transformed data showed a stronger relationship of both the sexes. R2 and t-Test also reviles the isometric growth. This means they tend to become thinner as they grow larger.
Kn values were above 1.0 in all group showing that the fish were in better condition in this geographical region. It may due to food availability and gonadal development. They were similar reported by number of authors in different fish species (Romano N et al., 2002) in Trematomus bernacchii, (Sailendri K, Muthukkaruppan VR 1975b) Tilapia mossambica, (Shafi M, Quddus MMA 1974b) .in Cirrhinus mrigala, (Pica A, Corte FD 1987) snake eel Pisodonophis boro, (Shafi M, Quddus MMA 1974b) Hilsa ilisha. (Smith M, Potter M, Merchant B
21Thalassas, 29(1) · January 2013
0
1
2
3
4
LN(1
t/l
)
00,51
1,52
2,53
3,54
4,5
1 2 3
y=0
4 5
A
0.336x 0
6 7
Age
0.966
8 9 10 11
Figure 8:Age and length chat t0 of Arius arius both sex.
Morphometric characters
Measurements (cm) Min (cm) Max (cm)
Total length (TL) 6.5 39
Fork length (FL) 5.9 36.8
Standard length (SL) 5.4 33.90
Table 1: Morphometric Character of Arius arius.

S. BALAMURUGAN, B. DEIVASIGAMANI*, S. KUMARAN, M. SAKTHIVEL, G. EDWARD & M. ASHIQ UR RAHMAN
1970) in Lepomis macrochirus, (Sivashanthini K, Ajmal Khan S 2004) in Gerres setifer the present study showed Arius arius shows the 215.00 mm total length at the end of the first year. These values are much lower as compared to the earlier the length (Sivashanthini K, Ajmal Khan S 2004). In addition, the L∞ (34.4 cm) is slightly larger than the maximum observed length, which also suggests that the growth estimates for spotted catfish by the length frequency analysis are reliable. In the course of progress in fishery research, different methods have been evolved for determining the age of the fish in an open system. Ford- Walford used to (i) integrated method, (ii) month mode curve and (iii) probability plot method. In this present study shows L values above the L∞ max. The computed L is 215.00 in the present study are higher than the recorded value (215.00) for Arius arius unsexed.
The K values obtained for unsexed in the present study are also quite high from the recorded values 3 4.68 The t0 recorded previously for this species was 1.298 whereas the t0 values were compared to the G. setifer t0 value of males and females shows -0.0817 reported by Sivashanthini K, Ajmal Khan S 2004.
CONCLUSION
this study updates the length weight relationship, age and growth of Marine Catfsh Arius arius in parangipettai waters during the one year survey. The fish were healthy in all length groups.and it shows the the average of 10-11 year of age for a fish in this region.
LIST OF ABBREVIATIONS
TL- Total length FL- Fork LengthSL-Standard LengthK- condition factorKn- Relative Condition factorR2- Coefficient of DeterminationW = the weight of the fish in grams,L = the total length of the fish in centimetersa = exponent describing of the rate of changeof weight with lengthb = weight at unit length
ACKNOWLEDGEMENT
We thank our Dean of Faculty of Marine Science, Annamalai University for Providing Opportunity to this work. This Work was financial Supported by MoES – OASTC, New Delhi, India.
REFERENCES
BBS (1989). Statistical pocketbook of Bangladesh. Bangladesh Bureau of Statistics. Statistics Division, Ministry of Planning, Governrnent of Bangladesh, Dhaka; 348.
Sparre P, Venema SC Introduction to tropical fish stock assessment.. In: Manual. FAO Fisheries Technical Paper,
22 Thalassas, 29(1) · January 2013
ssignificant at P <0.001
Lengthgroup(cm)
MeanLength ± SD (cm)
Meanweight±SD (g)
A b R2GrowthT-Test
6-9 7.45±0.85 11.41±1.4 1.4267 0.4787ns 0.0163
b<3
9-12 10.55±1.01 28.9±2.05 0.0627 3.262 s0.9818 b<3
12-15 13.7±0.79 53.14±2.09 0.4291 3.5733s 0.987
b>3
15-18 15.44±0.82 98.85±14.8 5.04235.5475
s 0.9459b>3
18-21 19.3±0.92 120.11±29.6 1.4569 3.057s
0.1797b<3
21-24 22.57±1.09 171.9±6.97 0.5086 1.1653s 0.9456
b<3
24-27 25.5±1.04 198.5±8.76 3.9729 4.401s 0.1335 b>3
27-30 28.7±0.99 218.8±15.4
6 0.2258 1.7123s 0.9713
b<3
30-33 31.76±0.82 346.5±19.07 1.4881 2.5864
s 0.9765b<3
33-37 34.44±1.01 525.0±35.08 0.8956
3.2031s 0.9019
b<3
37-40 38.09±0.65 920.5±33.75 3.1031 3.2095
s 0.0636 b<3
Method Sex L (mm) Z/K K(yr-1) Rn/Score
Powell -Wetherall
Both 598.09 5.231 - -
ELEFAN I (i)Automatic scan
Both 430.50 - 1.30 0.253
(ii) K- Scan Both 430.50 - 0.410 0.285
Table 2:Explanatory statistics and estimated parameters of length-weight
relationship of Arius airus of parangipettai coast south India.
Table 3:Length and age analysis of Arius arius in Fisat II 1.2.2.
LENGTH-WEIGHT RELATIONSHIP, AGE AND GROWTH OF WILD CATFISH Arius arius (HAMILTON, 1822)IN PARANGIPETTAI EAST COAST OF TAMIL NADU
306,. 1, 2 Rome, 27. Tandon KK (1964). Biology and fishery of ‘Choo Parai’–
Selaroides leptolepis (Cuvier and Valenciennes) Part III: Population Studies. Indian Journal of Fisheries 9; 1: 10-36.
Kothare PV, Bal DV (1976). Morphometric study of Sphyraena obtusata (Cuv. and Val.) off Ratnagiri and Janjira. Journal of Biological Science, 19; 66-70.
Rao K, Venkata Subba (1982). Studies on the populations of Saurida tumbil (Bloch) from Indian waters. Indian Journal of Fisheries, 29; 8 -19.
Paramita BN, Sadashiv gopal raje (2009). Morphometry and length weight relationship of the Catfishes Arius caelatus (Valenciennes, 1840) and Arius thalassinus (Ruppell, 1837) off Mumbai, Veraval and Vishakhapatanam coasts. Asian Fisheries Science; 22: 215-228.
. Pitcher TJ, Hart PJ (1982). Fisheries Ecology. Chapman and Hall: London.
Moutopoulos DK, Stergiou KI (2002). Length-weight and length-length relationships of fish species from Aegean Sea (Greece). Journal of Applied Ichthyology, 18; 200-203,.
FAO /SIDP. (2000.). Species Identification Sheet-Arius caelatus. Arius thalassinus. Fisheries global information system (FIGIS). Food and Agricultural Organization of the United Nations, Rome,
Appa Rao T (1966). On some aspects of biology of Lactarius lactarius (Schn). Indian Journal Fisheries, 13; 334-349.
Dwivedi SN, Menezes MR (1974) A note on morphometry and ecology of Brachiunius orientalis (Bloch and Schenider) in the estuary of Goa. Geobios, 1; 80-83.
Le Cren ED (1951). The length-weight relationships and seasonal cycle in gonad weight and condition in the perch (Perca fluviatilis). Journal of Animal Ecology, 20; 201-219.
Safran P (1992). Theoretical analysis of the weight–length relationships in the juveniles. Marine Biology, 112; 545-551.
Fulton TW (1911). The Sovereignty of the Sea. Blackwood: Edinburgh.
Bauchot R, Bauchot ML (1978). Coefficient de condition at indice ponderal chez les Teleosteens. Cybium, 3;: 3-16
Beverton RJH, Holt SJ (1966). On the dynamics of exploited fish populations. Fisheries Investigates: London.
Pauly D (1980). On the interrelationships between natural mortality, growth parameters and mean environmental temperature in 175 fish stocks. ICES Journal of Marine Science 39: 175-192.
Pauly D (1983). Some simple methods for the assessment of tropical fish stocks. FAO Fisheries Technology, 23; 1-52.
Gayanilo FC, Pauly D (1996). The FAO-ICLARM Stock Assessment Tools (FiSAT) User’s Guide. FAO Computerized Information Series: Rome.
Day F (1878). The fishes of India. ln: Vol. 1.2, Reprinted 1958, William Dawson and Sons Ltd, London; 210-215.
Jaiswar AK, Devaraj M (1989). Morphometric study of Megalaspis cordyla (Linnaeus, 1758) along the northwest coast of India. Journal of Indian Fisheries Association, 19; 1-6.
Anibeze CIP (1995). Aspects of the ecobiology of Heterobranchus longifilis (Val. 1840) in Idodo river basin (Nigeria) and their application to aquaculture. Ph.D. thesis. University of Nigeria, Nsukka,
Allen KR (1938). Some observations on the biology of the trout (Salmo trutta) in Windermere. Journal of Animal Ecology, 7; 333-347.
Growner HJ, Rogelio OJ (1976). Length-weight relationship of pond raised milk fish in the Philippines. Aquaculture, 7; 339-346.
Pica A, Corte FD (1987). Haemopoiesis, lymphomyeloid tissues, spleen and thymus of Torpedoes in normal conditions and after treatment with cobamamide and folic acid. Archivio Italiano di Anatomia e di Embriologia, 92; .249–261.
Pitchappan RM (1980). Review on the phylogeny of splenic structure and function. Developmental Comparative Immunology 4: .395–416.
Romano N, Ceccariglia S, Mastrolia L, Mazzini M (2002). Cytology of lymphomyeloid head kidney of Antarctic fishes Trematomus bernacchii (Nototheniidae) and Chionodraco hamatus (Channicthyidae). Tissue and Cell. 34; 2.
Sailendri K, Muthukkaruppan VR (1975b) Morphology of lymphoid organs in a cichild teleost, Tilapia mossambica (Peters). Journal of Morphology; 147; 109-122.
Shafi M, Quddus MMA (1974b). The length-weight relationship in the carp, Cirrhinus mrigala (Hamilton-Buchanan). Dacca University Studies, 22; 39-45.
Shafi M, Quddus MMA (1974b). The length-weight and length-girth relationship and condition in Hilsa ilisha (Clupeidae). Bangladesh Journal of Zoology, 2; 179-185.
Smith M, Potter M, Merchant B (1970). Plasmacytopoiesis in the pronephros of the teleost, Lepomis macrochirus. Journal of Immunology; 99; .876-882.
Sivashanthini K, Ajmal Khan S (2004). Population dynamics of silver biddy Gerres setifer (Pisces: Perciformes) in the Parangipettai waters, southeast coast of India. Indian Journal of Marine Sciences, 33; 346-354.
23Thalassas, 29(1) · January 2013
(Received: May 16, 2012; Accepted: August 27, 2012)


PYCNOGONIDS (ARTHROPODA: PYCNOGONIDA)IN SEAGRASS MEADOWS: THE CASE OF O GROVE INLET
(NW IBERIAN PENINSULA)
(1) Departamento de Ecología y Biología Animal, Facultad de Ciencias del Mar,Universidad de Vigo, E-36310 Vigo, Pontevedra, Spain.
(2) ARTOO Marine Biology Consultants, Ocean Quay Marina, Belvidere Road, Southampton SO14 5QY, UK.(3) Departamento de Biología (Zoología), Universidad Autónoma de Madrid, Cantoblanco, E-28049 Madrid, Spain.
*Corresponding author: [email protected]
Thalassas, 29(1) · January 2013: 25-33An International Journal of Marine Sciences
Key words: Pycnogonida, diversity, distribution, seagrass, Atlantic Ocean.
Palabras clave: Pycnogonida, diversidad, distribución, fanerógamas marinas, Océano Atlántico.
PATRICIA ESQUETE (1*), ROGER N. BAMBER (2), JUAN MOREIRA (3) & JESÚS S. TRONCOSO (1)
25Thalassas, 29(1) · January 2013
ABSTRACT
Quantitative studies dealing with the ecology of the Pycnogonida (Arthropoda) are scarce. In this work, the pycnogonid fauna present in the seagrass meadows (Zostera spp.) of an estuarine environment in NW Spain are studied, including spatial distribution and intra-annual seasonal variations of density and diversity. Quantitative sampling showed that the pycnogonid taxocoenosis associated with seagrass meadows was rich and diverse. The best represented species in terms of distribution and abundance were Callipallene tiberi, Achelia echinata and Anoplodactylus pygmaeus. Abundances showed a strongly seasonal pattern, with the highest values in September and lowest in March. Temporal variations in the population dynamics of A. echinata suggest a strong coupling with the life story of the seagrass Zostera marina, which in turn determines the availability of food resources for the pycnogonid assemblage.
RESUMEN (Picnogónidos en praderas de fanerógamas marinas: El caso de la ensenada de O Grove (NO de la Península Ibérica)
Hasta la fecha, son escasos los estudios cuantitativos que han tratado la ecología de la clase Pycnogonida (Arthropoda). En este trabajo, la fauna de picnogónidos presente en las praderas de fanerógamas (Zostera spp.) en un ambiente estuárico del noroeste de España, incluyendo su distribución espacial y las variaciones estacionales de densidad y diversidad. Los datos cuantitativos obtenidos muestran que la taxocenosis de picnogónidos asociada a las fanerógamas es rica y diversa. Las espe-cies mejor representadas en términos de distribución espacial y abundancia fueron Callipallene tiberi, Achelia echinata y Anoplodactylus pygmaeus. Los valores de abundancia mostraron un patrón fuertemente estacional, con los mayores registros en el mes de Septiembre y los más bajos en Marzo. Las variaciones de abundancia en la población de A. echinata sugieren un patente acoplamiento con el ciclo vital de Zostera marina, que a su vez determina la disponibilidad de recursos alimentarios para los picnogónidos.

PATRICIA ESQUETE, ROGER N. BAMBER, JUAN MOREIRA & JESÚS S. TRONCOSO
26 Thalassas, 29(1) · January 2013
Figure 1: Location of O Grove inlet and the sampling sites.

PYCNOGONIDS (ARTHROPODA: PYCNOGONIDA) IN SEAGRASS MEADOWS: THE CASE OF O GROVE INLET (NW IBERIAN PENINSULA)
INTRODUCTION
The class Pycnogonida is an exclusively marine group of arthropods also known as “sea spiders”, with no clear affinities to any other group and considered either as a sister group to the Euchelicerata or as the sister group to all extant rest of the Euarthropoda (Bamber, 2007; 2010; Arango and Wheeler, 2007). Pycnogonids are predominantly benthic, slow-moving organisms, and feed mainly on sessile prey such as algae, hydroids, actiniarians and bryozoans (Wyer and King, 1974; Bamber and Davis, 1982); generally, their abundances depend on the availability of food resources (Roberts, 1981; Arnaud and Bamber, 1987). Other factors such as salinity gradients (Wolff, 1976) and hydrodynamics (Munilla León and San Vicente, 2000) have also been reported to influence their local abundance and distribution.
Quantitative studies dealing with the ecology of pycnogonids are scarce (but see Wolff, 1976; Munilla, 1981; 1991; Arnaud and Bamber, 1987 and references therein; Sánchez and Munilla, 1989; Pérez-Ruzafa and Munilla, 1992; Munilla and Nieto, 1999; Genzano, 2002; Soler i Membrives et al., 2009). In fact, most of the data available for tropical and temperate areas come from wider studies on benthic community ecology where pycnogonids are rarely found in high numbers; these data usually do not allow a reliable characterization of patterns in their environmental needs, ecological role or population dynamics.
Seagrass meadows constitute complex habitats and are considered as “ecosystem engineers” because they favour the settlement and maintenance of high benthic species diversity in temperate and tropical waters (Montadouin and Sauriau, 2000; Hasegawa et al., 2008) including that of pycnogonids (Arnaud and Bamber, 1987; Chimenz et al., 1993). In the Iberian Peninsula, some data on pycnogonids occurring in seagrass beds in the Mediterranean Sea are provided by De Haro (1967), Munilla (1981) and Arnaud (1988). Pycnogonids may play an important role in seagrass meadows because of their feeding on sessile epibiont organisms which settle there (Arnaud and Bamber, 1987); therefore, understanding their distribution patterns, habitat preferences and temporal dynamics will be necessary to assess the structure and functioning of assemblages inhabiting those habitats.
In this work, the composition and diversity of the pycnogonid assemblage present in the seagrass meadows (Zostera marina L. and Z. noltii Hornem.) of an estuarine environment (O Grove inlet, NW Spain) is studied quantitatively on a spatial and temporal scale. In
particular, the dynamics and structure of a population of Achelia echinata is investigated from the data obtained and related to the presence and the life history of the seagrasses.
MATERIAL AND METHODS
The O Grove inlet is an estuarine environment situated in the northwest coast of the Iberian Peninsula between 42º41′ –42º28′N and 09º01′ –08º44′W (Figure 1). Most of its intertidal and shallow subtidal sediments are covered by meadows of Zostera marina and Z. noltii. The area is subjected to seasonal freshwater inputs from several streams and a high level of precipitation in autumn/winter.
In December 1996, benthic samples were taken with the aim of characterizing the spatial distribution of the macrofaunal assemblages present in the meadows. Five replicate samples were taken from each of ten sites by means of a van Veen grab covering a total area of 0.28 m2 for each site (Table 1; Figure 1); additional details on location and abiotic features of the sampling sites may be found in Esquete et al. (2010). A sample of the bottom water was taken by means of a Niskin bottle and salinity, temperature and pH were measured in situ.
In addition, temporal samples were taken bimonthly between May 1998 and March 1999 at a subtidal Z. marina meadow (corresponding to site 3; see Table 1) to study the seasonal dynamics of the fauna. This site was selected for the good state of conservation of the Zostera meadow; furthermore, it was assumed that it would be less affected by salinity f luctuations than meadows situated in more sheltered areas. For this study, samples were taken by SCUBA divers, collecting five replicate quadrats of 25 x 25 cm (0.065 m2) in each occasion. The shoot and the rhizome fractions of the seagrass (the latter including the sediment) were kept separately in plastic bags and their fauna sorted separately. Abiotic parameters were measured following the same methodology as in the previous phase.
For both studies, samples were sieved through a 0.5 mm mesh and fixed in 10% buffered formalin. Specimens were later sorted, identified, and preserved in 70% ethanol. Specimens were measured using a stereomicroscope fitted with a micrometer eyepiece.
Pycnogonid classification follows that used by Bamber (2007; 2010). The body length of specimens was measured from the anterior margin of the cephalon to the posterior margin of the last lateral processes.
27Thalassas, 29(1) · January 2013
PATRICIA ESQUETE, ROGER N. BAMBER, JUAN MOREIRA & JESÚS S. TRONCOSO
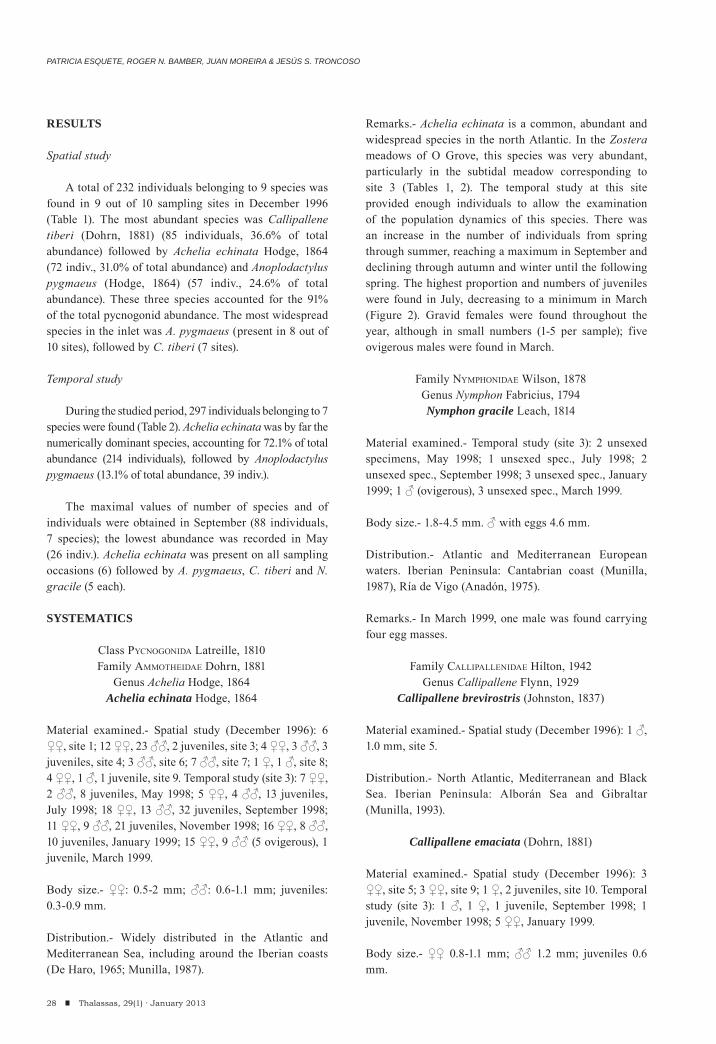
RESULTS
Spatial study
A total of 232 individuals belonging to 9 species was found in 9 out of 10 sampling sites in December 1996 (Table 1). The most abundant species was Callipallene tiberi (Dohrn, 1881) (85 individuals, 36.6% of total abundance) followed by Achelia echinata Hodge, 1864 (72 indiv., 31.0% of total abundance) and Anoplodactylus pygmaeus (Hodge, 1864) (57 indiv., 24.6% of total abundance). These three species accounted for the 91% of the total pycnogonid abundance. The most widespread species in the inlet was A. pygmaeus (present in 8 out of 10 sites), followed by C. tiberi (7 sites).
Temporal study
During the studied period, 297 individuals belonging to 7 species were found (Table 2). Achelia echinata was by far the numerically dominant species, accounting for 72.1% of total abundance (214 individuals), followed by Anoplodactylus pygmaeus (13.1% of total abundance, 39 indiv.).
The maximal values of number of species and of individuals were obtained in September (88 individuals, 7 species); the lowest abundance was recorded in May (26 indiv.). Achelia echinata was present on all sampling occasions (6) followed by A. pygmaeus, C. tiberi and N. gracile (5 each).
SYSTEMATICS
Class PYCNOGONIDA Latreille, 1810Family AMMOTHEIDAE Dohrn, 1881
Genus Achelia Hodge, 1864Achelia echinata Hodge, 1864
Material examined.- Spatial study (December 1996): 6 ♀♀, site 1; 12 ♀♀, 23 ♂♂, 2 juveniles, site 3; 4 ♀♀, 3 ♂♂, 3 juveniles, site 4; 3 ♂♂, site 6; 7 ♂♂, site 7; 1 ♀, 1 ♂, site 8; 4 ♀♀, 1 ♂, 1 juvenile, site 9. Temporal study (site 3): 7 ♀♀, 2 ♂♂, 8 juveniles, May 1998; 5 ♀♀, 4 ♂♂, 13 juveniles, July 1998; 18 ♀♀, 13 ♂♂, 32 juveniles, September 1998; 11 ♀♀, 9 ♂♂, 21 juveniles, November 1998; 16 ♀♀, 8 ♂♂, 10 juveniles, January 1999; 15 ♀♀, 9 ♂♂ (5 ovigerous), 1 juvenile, March 1999.
Body size.- ♀♀: 0.5-2 mm; ♂♂: 0.6-1.1 mm; juveniles: 0.3-0.9 mm.
Distribution.- Widely distributed in the Atlantic and Mediterranean Sea, including around the Iberian coasts (De Haro, 1965; Munilla, 1987).
Remarks.- Achelia echinata is a common, abundant and widespread species in the north Atlantic. In the Zostera meadows of O Grove, this species was very abundant, particularly in the subtidal meadow corresponding to site 3 (Tables 1, 2). The temporal study at this site provided enough individuals to allow the examination of the population dynamics of this species. There was an increase in the number of individuals from spring through summer, reaching a maximum in September and declining through autumn and winter until the following spring. The highest proportion and numbers of juveniles were found in July, decreasing to a minimum in March (Figure 2). Gravid females were found throughout the year, although in small numbers (1-5 per sample); five ovigerous males were found in March.
Family NYMPHONIDAE Wilson, 1878Genus Nymphon Fabricius, 1794Nymphon gracile Leach, 1814
Material examined.- Temporal study (site 3): 2 unsexed specimens, May 1998; 1 unsexed spec., July 1998; 2 unsexed spec., September 1998; 3 unsexed spec., January 1999; 1 ♂ (ovigerous), 3 unsexed spec., March 1999.
Body size.- 1.8-4.5 mm. ♂ with eggs 4.6 mm.
Distribution.- Atlantic and Mediterranean European waters. Iberian Peninsula: Cantabrian coast (Munilla, 1987), Ría de Vigo (Anadón, 1975).
Remarks.- In March 1999, one male was found carrying four egg masses.
Family CALLIPALLENIDAE Hilton, 1942Genus Callipallene Flynn, 1929
Callipallene brevirostris (Johnston, 1837)
Material examined.- Spatial study (December 1996): 1 ♂, 1.0 mm, site 5.
Distribution.- North Atlantic, Mediterranean and Black Sea. Iberian Peninsula: Alborán Sea and Gibraltar (Munilla, 1993).
Callipallene emaciata (Dohrn, 1881)
Material examined.- Spatial study (December 1996): 3 ♀♀, site 5; 3 ♀♀, site 9; 1 ♀, 2 juveniles, site 10. Temporal study (site 3): 1 ♂, 1 ♀, 1 juvenile, September 1998; 1 juvenile, November 1998; 5 ♀♀, January 1999.
Body size.- ♀♀ 0.8-1.1 mm; ♂♂ 1.2 mm; juveniles 0.6 mm.
28 Thalassas, 29(1) · January 2013
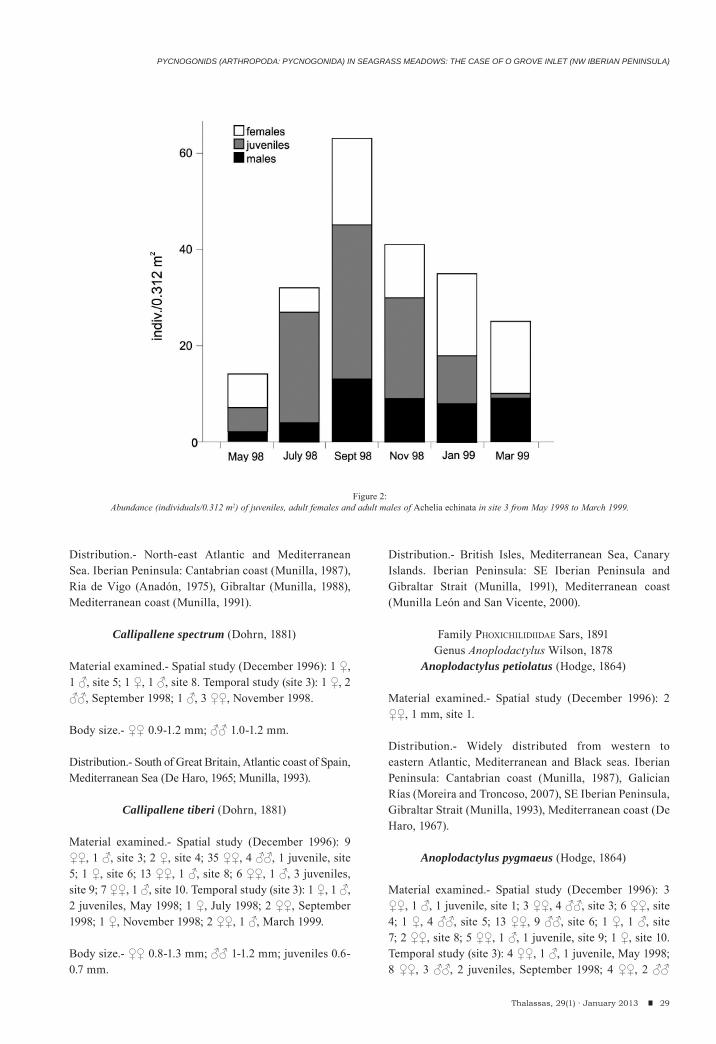
PYCNOGONIDS (ARTHROPODA: PYCNOGONIDA) IN SEAGRASS MEADOWS: THE CASE OF O GROVE INLET (NW IBERIAN PENINSULA)
Distribution.- North-east Atlantic and Mediterranean Sea. Iberian Peninsula: Cantabrian coast (Munilla, 1987), Ria de Vigo (Anadón, 1975), Gibraltar (Munilla, 1988), Mediterranean coast (Munilla, 1991).
Callipallene spectrum (Dohrn, 1881)
Material examined.- Spatial study (December 1996): 1 ♀, 1 ♂, site 5; 1 ♀, 1 ♂, site 8. Temporal study (site 3): 1 ♀, 2 ♂♂, September 1998; 1 ♂, 3 ♀♀, November 1998.
Body size.- ♀♀ 0.9-1.2 mm; ♂♂ 1.0-1.2 mm.
Distribution.- South of Great Britain, Atlantic coast of Spain, Mediterranean Sea (De Haro, 1965; Munilla, 1993).
Callipallene tiberi (Dohrn, 1881)
Material examined.- Spatial study (December 1996): 9 ♀♀, 1 ♂, site 3; 2 ♀, site 4; 35 ♀♀, 4 ♂♂, 1 juvenile, site 5; 1 ♀, site 6; 13 ♀♀, 1 ♂, site 8; 6 ♀♀, 1 ♂, 3 juveniles, site 9; 7 ♀♀, 1 ♂, site 10. Temporal study (site 3): 1 ♀, 1 ♂, 2 juveniles, May 1998; 1 ♀, July 1998; 2 ♀♀, September 1998; 1 ♀, November 1998; 2 ♀♀, 1 ♂, March 1999.
Body size.- ♀♀ 0.8-1.3 mm; ♂♂ 1-1.2 mm; juveniles 0.6-0.7 mm.
Distribution.- British Isles, Mediterranean Sea, Canary Islands. Iberian Peninsula: SE Iberian Peninsula and Gibraltar Strait (Munilla, 1991), Mediterranean coast (Munilla León and San Vicente, 2000).
Family PHOXICHILIDIIDAE Sars, 1891Genus Anoplodactylus Wilson, 1878
Anoplodactylus petiolatus (Hodge, 1864)
Material examined.- Spatial study (December 1996): 2 ♀♀, 1 mm, site 1.
Distribution.- Widely distributed from western to eastern Atlantic, Mediterranean and Black seas. Iberian Peninsula: Cantabrian coast (Munilla, 1987), Galician Rías (Moreira and Troncoso, 2007), SE Iberian Peninsula, Gibraltar Strait (Munilla, 1993), Mediterranean coast (De Haro, 1967).
Anoplodactylus pygmaeus (Hodge, 1864)
Material examined.- Spatial study (December 1996): 3 ♀♀, 1 ♂, 1 juvenile, site 1; 3 ♀♀, 4 ♂♂, site 3; 6 ♀♀, site 4; 1 ♀, 4 ♂♂, site 5; 13 ♀♀, 9 ♂♂, site 6; 1 ♀, 1 ♂, site 7; 2 ♀♀, site 8; 5 ♀♀, 1 ♂, 1 juvenile, site 9; 1 ♀, site 10. Temporal study (site 3): 4 ♀♀, 1 ♂, 1 juvenile, May 1998; 8 ♀♀, 3 ♂♂, 2 juveniles, September 1998; 4 ♀♀, 2 ♂♂
29Thalassas, 29(1) · January 2013
Figure 2:Abundance (individuals/0.312 m2) of juveniles, adult females and adult males of Achelia echinata in site 3 from May 1998 to March 1999.
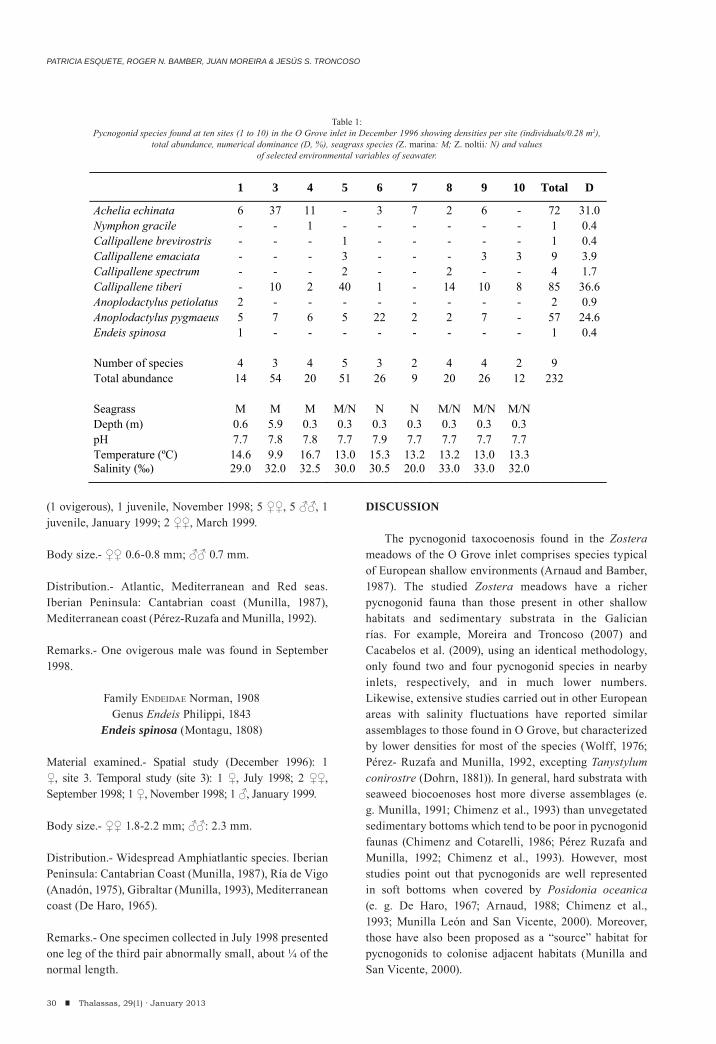
PATRICIA ESQUETE, ROGER N. BAMBER, JUAN MOREIRA & JESÚS S. TRONCOSO
(1 ovigerous), 1 juvenile, November 1998; 5 ♀♀, 5 ♂♂, 1 juvenile, January 1999; 2 ♀♀, March 1999.
Body size.- ♀♀ 0.6-0.8 mm; ♂♂ 0.7 mm.
Distribution.- Atlantic, Mediterranean and Red seas. Iberian Peninsula: Cantabrian coast (Munilla, 1987), Mediterranean coast (Pérez-Ruzafa and Munilla, 1992).
Remarks.- One ovigerous male was found in September 1998.
Family ENDEIDAE Norman, 1908Genus Endeis Philippi, 1843
Endeis spinosa (Montagu, 1808)
Material examined.- Spatial study (December 1996): 1 ♀, site 3. Temporal study (site 3): 1 ♀, July 1998; 2 ♀♀, September 1998; 1 ♀, November 1998; 1 ♂, January 1999.
Body size.- ♀♀ 1.8-2.2 mm; ♂♂: 2.3 mm.
Distribution.- Widespread Amphiatlantic species. Iberian Peninsula: Cantabrian Coast (Munilla, 1987), Ría de Vigo (Anadón, 1975), Gibraltar (Munilla, 1993), Mediterranean coast (De Haro, 1965).
Remarks.- One specimen collected in July 1998 presented one leg of the third pair abnormally small, about ¼ of the normal length.
DISCUSSION
The pycnogonid taxocoenosis found in the Zostera meadows of the O Grove inlet comprises species typical of European shallow environments (Arnaud and Bamber, 1987). The studied Zostera meadows have a richer pycnogonid fauna than those present in other shallow habitats and sedimentary substrata in the Galician rías. For example, Moreira and Troncoso (2007) and Cacabel os et al. (2009), using an identical methodology, only found two and four pycnogonid species in nearby inlets, respectively, and in much lower numbers. Likewise, extensive studies carried out in other European areas with salinity fluctuations have reported similar assemblages to those found in O Grove, but characterized by lower densities for most of the species (Wolff, 1976; Pérez- Ruzafa and Munilla, 1992, excepting Tanystylum conirostre (Dohrn, 1881)). In general, hard substrata with seaweed biocoenoses host more diverse assemblages (e. g. Munilla, 1991; Chimenz et al., 1993) than unvegetated sedimentary bottoms which tend to be poor in pycnogonid faunas (Chimenz and Cotarelli, 1986; Pérez Ruzafa and Munilla, 1992; Chimenz et al., 1993). However, most studies point out that pycnogonids are well represented in soft bottoms when covered by Posidonia oceanica (e. g. De Haro, 1967; Arnaud, 1988; Chimenz et al., 1993; Munilla León and San Vicente, 2000). Moreover, those have also been proposed as a “source” habitat for pycnogonids to colonise adjacent habitats (Munilla and San Vicente, 2000).
30 Thalassas, 29(1) · January 2013
1 3 4 5 6 7 8 9 10 Total D
Achelia echinata 6 37 11 - 3 7 2 6 - 72 31.0 Nymphon gracile - - 1 - - - - - - 1 0.4 Callipallene brevirostris - - - 1 - - - - - 1 0.4 Callipallene emaciata - - - 3 - - - 3 3 9 3.9 Callipallene spectrum - - - 2 - - 2 - - 4 1.7 Callipallene tiberi - 10 2 40 1 - 14 10 8 85 36.6 Anoplodactylus petiolatus 2 - - - - - - - - 2 0.9 Anoplodactylus pygmaeus 5 7 6 5 22 2 2 7 - 57 24.6 Endeis spinosa 1 - - - - - - - - 1 0.4
Number of species 4 3 4 5 3 2 4 4 2 9 Total abundance 14 54 20 51 26 9 20 26 12 232 Seagrass M M M M/N N N M/N M/N M/N Depth (m) 0.6 5.9 0.3 0.3 0.3 0.3 0.3 0.3 0.3 pH 7.7 7.8 7.8 7.7 7.9 7.7 7.7 7.7 7.7 Temperature (ºC) 14.6 9.9 16.7 13.0 15.3 13.2 13.2 13.0 13.3 Salinity (‰) 29.0 32.0 32.5 30.0 30.5 20.0 33.0 33.0 32.0
Table 1:Pycnogonid species found at ten sites (1 to 10) in the O Grove inlet in December 1996 showing densities per site (individuals/0.28 m2),
total abundance, numerical dominance (D, %), seagrass species (Z. marina: M; Z. noltii: N) and values of selected environmental variables of seawater.
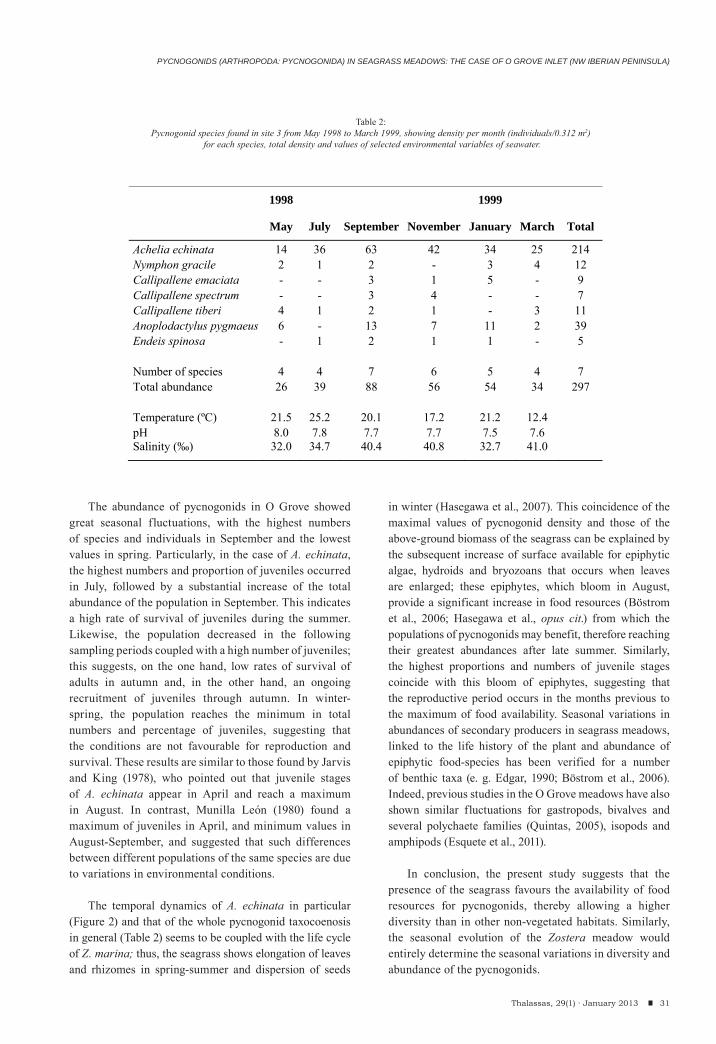
PYCNOGONIDS (ARTHROPODA: PYCNOGONIDA) IN SEAGRASS MEADOWS: THE CASE OF O GROVE INLET (NW IBERIAN PENINSULA)
The abundance of pycnogonids in O Grove showed great seasonal fluctuations, with the highest numbers of species and individuals in September and the lowest values in spring. Particularly, in the case of A. echinata, the highest numbers and proportion of juveniles occurred in July, followed by a substantial increase of the total abundance of the population in September. This indicates a high rate of survival of juveniles during the summer. Likewise, the population decreased in the following sampling periods coupled with a high number of juveniles; this suggests, on the one hand, low rates of survival of adults in autumn and, in the other hand, an ongoing recruitment of juveniles through autumn. In winter-spring, the population reaches the minimum in total numbers and percentage of juveniles, suggesting that the conditions are not favourable for reproduction and survival. These results are similar to those found by Jarvis and King (1978), who pointed out that juvenile stages of A. echinata appear in April and reach a maximum in August. In contrast, Munilla León (1980) found a maximum of juveniles in April, and minimum values in August-September, and suggested that such differences between different populations of the same species are due to variations in environmental conditions.
The temporal dynamics of A. echinata in particular (Figure 2) and that of the whole pycnogonid taxocoenosis in general (Table 2) seems to be coupled with the life cycle of Z. marina; thus, the seagrass shows elongation of leaves and rhizomes in spring-summer and dispersion of seeds
in winter (Hasegawa et al., 2007). This coincidence of the maximal values of pycnogonid density and those of the above-ground biomass of the seagrass can be explained by the subsequent increase of surface available for epiphytic algae, hydroids and bryozoans that occurs when leaves are enlarged; these epiphytes, which bloom in August, provide a significant increase in food resources (Böstrom et al., 2006; Hasegawa et al., opus cit.) from which the populations of pycnogonids may benefit, therefore reaching their greatest abundances after late summer. Similarly, the highest proportions and numbers of juvenile stages coincide with this bloom of epiphytes, suggesting that the reproductive period occurs in the months previous to the maximum of food availability. Seasonal variations in abundances of secondary producers in seagrass meadows, linked to the life history of the plant and abundance of epiphytic food-species has been verified for a number of benthic taxa (e. g. Edgar, 1990; Böstrom et al., 2006). Indeed, previous studies in the O Grove meadows have also shown similar fluctuations for gastropods, bivalves and several polychaete families (Quintas, 2005), isopods and amphipods (Esquete et al., 2011).
In conclusion, the present study suggests that the presence of the seagrass favours the availability of food resources for pycnogonids, thereby allowing a higher diversity than in other non-vegetated habitats. Similarly, the seasonal evolution of the Zostera meadow would entirely determine the seasonal variations in diversity and abundance of the pycnogonids.
31Thalassas, 29(1) · January 2013
1998 1999
May July September November January March Total
Achelia echinata 14 36 63 42 34 25 214 Nymphon gracile 2 1 2 - 3 4 12 Callipallene emaciata - - 3 1 5 - 9 Callipallene spectrum - - 3 4 - - 7 Callipallene tiberi 4 1 2 1 - 3 11 Anoplodactylus pygmaeus 6 - 13 7 11 2 39 Endeis spinosa - 1 2 1 1 - 5
Number of species 4 4 7 6 5 4 7 Total abundance 26 39 88 56 54 34 297 Temperature (ºC) 21.5 25.2 20.1 17.2 21.2 12.4 pH 8.0 7.8 7.7 7.7 7.5 7.6 Salinity (‰) 32.0 34.7 40.4 40.8 32.7 41.0
Table 2:Pycnogonid species found in site 3 from May 1998 to March 1999, showing density per month (individuals/0.312 m2)
for each species, total density and values of selected environmental variables of seawater.

PATRICIA ESQUETE, ROGER N. BAMBER, JUAN MOREIRA & JESÚS S. TRONCOSO
ACKNOWLEDGEMENTS
The authors are grateful to the members of the Adaptaciones de Animales Marinos group (Universidade de Vigo) for their help with sampling collection and especially to P. Quintas for the sorting of samples. This work was supported by the Xunta de Galicia (grant number XUGA 30101A98). Constructive comments from two anonymous referees are acknowledged.
REFERENCES
Anadón R (1975). Contribución al conocimiento de la fauna bentónica de la ría de Vigo (NW de España). I. Picnogónidos y Crustáceos de Panjón. Investigación Pesquera, 39 (1): 199-218.
Arango CP, Wheeler WC (2007). Phylogeny of the sea spiders (Arthropoda: Pycnogonida) based on direct optimization of six loci and morphology. Cladistics, 23: 253-293.
Arnaud F (1988). Les Pycnogonides (Chelicerata) de Méditerranée Distribution écologique, bathymetrique et biogeographie. Mésogée-Bulletin du Muséum D’Histoire Naturelle de Marseille, 47 : 37-58.
Arnaud F, Bamber RN (1987). The biology of the Pycnogonida. Advances in Marine Biology, 24: 1-96.
Bamber RN (2007). A holistic re-interpretation of the phylogeny of the Pycnogonida Latreille, 1810 (Arthropoda). Zootaxa, 1668: 295-312.
Bamber RN (2010). Sea-Spiders (Pycnogonida) of the north-east Atlantic. In: Synopses of the British Fauna (New Series). JH Crothers, PJ Hayward, eds, Second edition, Vol. 5, Field Studies Council, Linnean Society of London, London, 249 pp.
Bamber RN, Davis MH (1982). Feeding of Achelia echinata Hodge (Pycnogonida) on marine algae. Journal of Experimental Marine Biology and Ecology, 60: 181-187.
Böstrom C, Jackson EL, Simenstad CA (2006). Seagrass landscapes and their effects on associated fauna: a review. Estuarine, Coastal and Shelf Science, 61: 111-123.
Cacabelos E, Gestoso L, Troncoso JS (2009). Inventario de la macrofauna bentónica de sustratos blandos de la Ensenada de San Simón (NO España). Boletín de la Real Sociedad Española de Historia Natural Sección Biología, 103 (1-4): 103-11
Chimenz C, Cottarelli V (1986). Soft bottom Pycnogonida from the gulf of Salerno (Italy). Oebalia, 23: 137-143.
Chimenz C, Tosti M, Cottarelli V (1993). Taxonomical and ecological observations on Pycnogonida from Apulian coasts (southern Italy). Italian Journal of Zoology, 60 (3): 339-347.
De Haro A (1965). Picnogónidos de la fauna española. Comunidad de Picnogónidos en el alga parda Halopteris scoparia (L). Boletín de la Real Sociedad Española de Historia Natural (Biología), 63: 213-218.
De Haro A (1967). Relaciones entre Picnogónidos e Hidroideos en el medio posidonícola. Boletín de la Real Sociedad Española de Historia Natural (Biología), 65: 301-303.
Edgar G (1990). Population regulation, population dynamics and competition amongst mobile epifauna associated with seagrass. Journal of Experimental Marine Biology and Ecology, 144 (2-3): 205-234.
Esquete P, Moreira J, Troncoso JS (2010). First record of Perioculodes aequimanus (Crustacea: Amphipoda) in the north-east Atlantic, with remarks on taxonomic characters. Marine Biodiversity Records, e112: 1-7.
Esquete P, Moreira J, Troncoso JS (2011). Peracarid assemblages of Zostera meadows in an estuarine ecosystem (O Grove inlet, NW Iberian Peninsula): spatial distribution and seasonal variation. Helgoland Marine Research, 65: 445-455.
Genzano GN (2002). Associations between pycnogonids and hydroids from Buenos Aires littoral zone, with observations on the semi-parasitic life cycle of Tanystylum orbiculare (Ammotheiidae). Scientia Marina, 66 (1): 83-92.
Hasegawa N, Hori M, Mukai H (2007). Seasonal shift in seagrass bed primary producers in a cold temperate estuary: dynamics of eelgrass Zostera marina and associated epiphytic algae. Aquatic Botany, 8: 337-345.
Hasegawa N, Nori M, Mukai H (2008). Seasonal changes in eelgrass functions: current velocity reduction, prevention of sediment resuspension and control of sediment-water column nutrient flux in relation to eelgrass dynamics. Hydrobiologia, 596: 387-399.
Jarvis JH, King PE (1978). Reproductive biology of British Pycnogonids (oogenesis and reproductive cycle). Zoological Journal of the Linnean Society of London, 63 (1-2): 105-131.
Montaudouin X de, Sauriau P-G (2000). Contribution to a synopsis of marine species richness in Pertuis Charentais Sea with new insights in soft-bottom macrofauna of the Marennes-Oléron Bay. Cahiers de Biologie Marine, 41: 181-222.
Moreira J, Troncoso JS (2007). Inventario de la macrofauna bentónica de sedimentos submareales de la Ensenada de Baiona (Galicia, NO Península Ibérica). Nova Acta Científica Compostelana (Bioloxía), 16: 101-128.
Munilla T (1981). Contribució al coneixement de la distribució ecológica deis Picnogonids catalans de la Costa Brava. Butlletí de la Institució Catalana d’Història Natural, 47 (4): 77-86.
Munilla T (1987). Picnogónidos costeros del norte de España. Miscelanea Zoologica, 11: 369-373.
Munilla T (1988). Premiers pycnogonids côtiers du détroit de Gibraltar (Coté Iberique). Butlletí de la Institució Catalana d’Historia Natural, 55: 59-65.
Munilla T (1991). Picnogónidos litorales recogidos sobre el alga Mesophyllum lichenoides en Nerja (Málaga, Mar de Alborán). Orsis, 6: 95-99.
Munilla T (1993). Pycnogonids from southern Spain: Fauna I project. Journal of the Marine Biological Association of the United Kingdom, 73: 543-553.
32 Thalassas, 29(1) · January 2013
PYCNOGONIDS (ARTHROPODA: PYCNOGONIDA) IN SEAGRASS MEADOWS: THE CASE OF O GROVE INLET (NW IBERIAN PENINSULA)
Munilla León T (1980). Desarrollo anual y reproducción de Achelia echinata Hodge, 1864 (Pycnogonida). Cahiers de Biologie Marine, 21: 115-121.
Munilla T, Nieto D (1999). Littoral pycnogonids from the Chafarinas islands (Alboran sea, Western Mediterranean). Vie et Milieu, 49 (2-3): 155-161.
Munilla León T, San Vicente C (2000). Suprabenthic pycnogonids from Creixell Beach (Tarragona, West Mediterranean). Cahiers de Biologie Marine, 41 (3): 321-328.
Pérez-Ruzafa A, Munilla T (1992). Pycnogonid ecology in the Mar Menor (Murcia, SW Mediterranean). Scientia Marina, 56 (1): 21-28.
Quintas P (2005). Distribución especial y temporal de los moluscos y anélidos poliquetos en las praderas de Zostera marina L. y Zostera noltii Hornem. de la ensenada de O Grove (Galicia, España). Tesis Doctoral, Universidade de Vigo, Vigo.
Roberts D (1981). Pycnogonids from Strangford Lough, Northern Ireland. Irish Naturalists’ Journal, 20 (5): 189-192.
Sánchez E, Munilla T(1989). Estudio ecológico de los primeros Picnogónidos litorales de las Islas Canarias. Cahiers de Biologie Marine, 30 (1): 49-67
Soler i Membrives A, Turpaeva E, Munilla T (2009). Pycnogonids of the eastern Weddell Sea (Antarctica) with remarks on their bathymetric distribution. Polar Biology, 32 (9): 1389-1397.
Wolff WJ (1976). Distribution of Pantopoda in the estuarine area in the Southwestern part of the Netherlands. Netherlands Journal of Sea Research, 10 (4): 472-478.
Wyer D, King PE (1974). Feeding in British littoral Pycnogonids. Estuarine and Coastal Marine Studies, 2: 177-184.
33Thalassas, 29(1) · January 2013
(Received: September 14, 2012; Accepted: October 30, 2012)


SEASONAL DYNAMICS OF THE PHYTOPLANKTON COMMUNITY IN THE GANDIA COASTAL AREA,
SOUTHERN GULF OF VALENCIA
(1) Institut d’Investigació per a la Gestió Integrada de Zones Costaneres (IGIC), Universitat Politècnica de València, C/Paranimf 1, 46730 Grau de Gandia, Spain
Thalassas, 29(1) · January 2013: 35-58An International Journal of Marine Sciences
Key words: Phytoplankton, nutrients, eutrophication, seasonality, Western Mediterranean.
Palabras clave: Fitoplancton, nutrientes, eutrofi zación, estacionalidad, Mediterráneo Occidental
I. GADEA(1), M. RODILLA(1), J. SOSPEDRA(1), S. FALCO(1), T. MORATA(1)
35Thalassas, 29(1) · January 2013
ABSTRACTSeasonal variability in the phytoplankton community of the coastal area of Gandia in the south of the Gulf of Valencia (Western Mediterranean Sea) was exam-
ined in relation to physical and chemical surface water variables (i.e. salinity, nutrients, dissolved oxygen and temperature). This small area presents most of the
point and non-point nutrients inputs that affect coastal areas as wastewater discharges through submarine outfall, river discharges and groundwater discharges
from a detritic aquifer. Furthermore, surface channels that drain the Safor wetland, which is used mainly for agricultural crops, outflow into the confined har-
bour. The main objective of the study was to observe the variations in phytoplankton groups as a response to environmental variables during different seasons
and understand which species could be used as indicators of anthropogenic pressure. For this purpose, the taxonomic composition of the micro-phytoplankton
communities at 32 fixed stations was determined in four sampling campaigns from summer 2010 to spring 2011. The results indicate that nutrient inputs mainly
from the Serpis river and channels that drain the Safor Wetland determine the composition and abundance of the phytoplankton community, and that several key
environmental factors such as water temperature, radiation, nutrients, and the molar ratios of nutrients influence seasonal phytoplankton assemblages. However,
the discharge of effluent from a sewage treatment plant through the submarine outfall did not appear to have a significant impact on the phytoplankton community.
The phytoplankton community comprised two main groups: diatoms and dinoflagellates and a total of 108 taxa were identified. The diatom population primarily
flourished in autumn and winter whereas in spring, dinoflagellate bloom occurred with high radiation, very low DIP and high DIN:DIP and low DSi:DIN molar
ratios. In this paper we discuss the possible rationale for these nutrient changes. Furthermore, potentially blooming species were detected in the Gandia harbour
and in the mouth of the Serpis river at Venecia Beach.
RESUMEN (Variabilidad estacional de la comunidad de fitoplancton de las aguas superficiales de la zona costera de Gandía en el sur del Golfo de Valencia)La variabilidad estacional de la comunidad de fitoplancton de las aguas superficiales de la zona costera de Gandía en el sur del Golfo de Valencia (Mediterráneo
occidental) fue examinada, teniendo en cuenta su relación con diferentes variables físicas y químicas (p.e. salinidad, nutrientes, oxígeno disuelto, temperatura,
etc.). En esta pequeña área se dan la mayoría de las entradas de nutrientes, tanto puntuales como difusas, que afectan las áreas costeras: descargas de aguas resi-
duales mediante emisarios submarinos, aportes fluviales y descargas de aguas subterráneas procedentes de acuíferos costeros. Además, los canales superficiales
que drenan el humedal de La Safor, cuyo uso fundamental es la agricultura, vierten en las aguas confinadas del puerto. El objetivo principal de este estudio fue
observar las variaciones de los grupos de fitoplancton como respuesta a las variaciones ambientales en diferentes estaciones del año, y determinar que especies
pueden ser utilizadas como indicadores de presión antrópica. Para ello, se determinó la composición taxonómica de la comunidad de micro-fitoplancton en 32
puntos de muestreo fijos en cuatro campañas de muestreo, desde verano de 2010 hasta primavera de 2011. Los resultados muestran que la entrada de nutrientes,
principalmente a través del Río Serpis y los canales que drenan el humedal, determinan la composición y abundancia de la comunidad de fitoplancton. Además
diversos factores ambientales clave como temperatura del agua, radiación, nutrientes, así como las relaciones entre nutrientes influyen en las diferentes asocia-
ciones de fitoplancton observadas en cada estación. Por otro lado, la descarga del efluente procedente de la depuradora de aguas residuales no tuvo un impacto
significativo sobre la comunidad de fitoplancton. La comunidad de fitoplancton estuvo formada principalmente por dos grupos: diatomeas y dinoflagelados.
Se identificaron un total de 108 taxones. Las diatomeas proliferaron principalmente en otoño e invierno. Los dinoflagelados proliferaron en primavera, bajo
condiciones de elevada radiación, baja concentración de DIP, razones DIN:DIP elevadas y razones DSi:DIN bajas. En este documento se discute la justificación
de los cambios en la concentración de nutrientes. Además, se detectaron especies potencialmente nocivas en el Puerto de Gandía y en la desembocadura del río
Serpis, en la playa de Venecia.
35Thalassas, 29(1) · January 2013
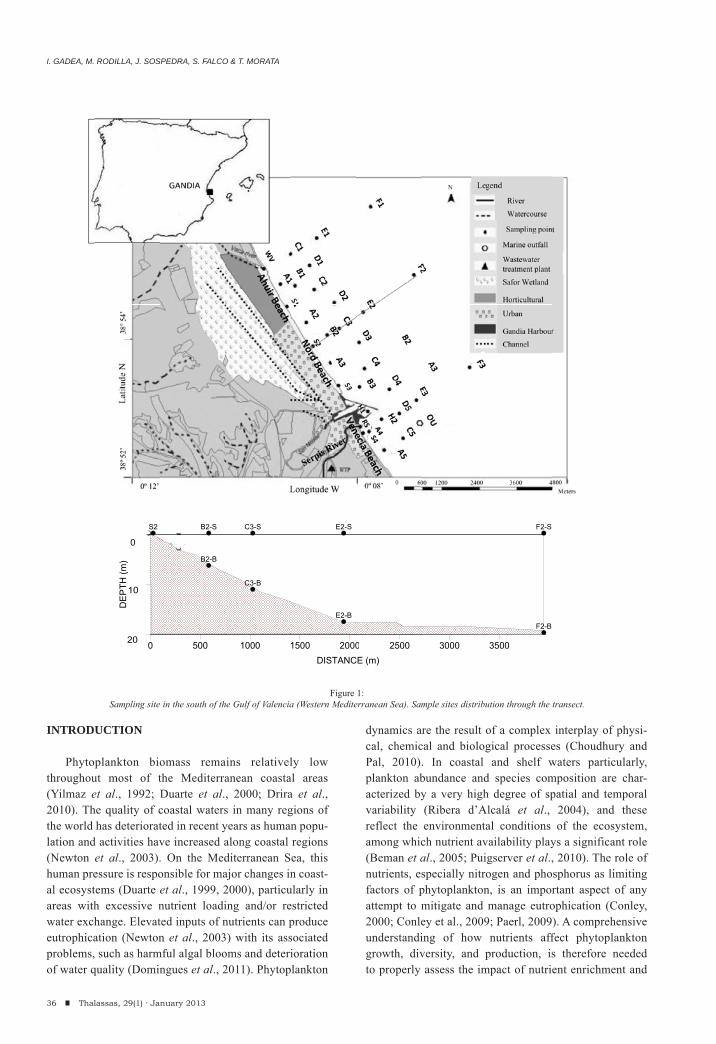
INTRODUCTION
Phytoplankton biomass remains relatively low throughout most of the Mediterranean coastal areas (Yilmaz et al., 1992; Duarte et al., 2000; Drira et al., 2010). The quality of coastal waters in many regions of the world has deteriorated in recent years as human popu-lation and activities have increased along coastal regions (Newton et al., 2003). On the Mediterranean Sea, this human pressure is responsible for major changes in coast-al ecosystems (Duarte et al., 1999, 2000), particularly in areas with excessive nutrient loading and/or restricted water exchange. Elevated inputs of nutrients can produce eutrophication (Newton et al., 2003) with its associated problems, such as harmful algal blooms and deterioration of water quality (Domingues et al., 2011). Phytoplankton
dynamics are the result of a complex interplay of physi-cal, chemical and biological processes (Choudhury and Pal, 2010). In coastal and shelf waters particularly, plankton abundance and species composition are char-acterized by a very high degree of spatial and temporal variability (Ribera d’Alcalá et al., 2004), and these reflect the environmental conditions of the ecosystem, among which nutrient availability plays a significant role (Beman et al., 2005; Puigserver et al., 2010). The role of nutrients, especially nitrogen and phosphorus as limiting factors of phytoplankton, is an important aspect of any attempt to mitigate and manage eutrophication (Conley, 2000; Conley et al., 2009; Paerl, 2009). A comprehensive understanding of how nutrients affect phytoplankton growth, diversity, and production, is therefore needed to properly assess the impact of nutrient enrichment and
36 Thalassas, 29(1) · January 2013
0
10
20 0
DE
PTH
(m)
S2
500
B2-S
B2-B
S2'-S
S2'-B
1000 1
C3-S
C3-B
1500 2000DISTANC
E2-S
E2-B
0 2500CE (m)
3000 3500
F2-S
F2-B
Figure 1:Sampling site in the south of the Gulf of Valencia (Western Mediterranean Sea). Sample sites distribution through the transect.
I. GADEA, M. RODILLA, J. SOSPEDRA, S. FALCO & T. MORATA

SEASONAL DYNAMICS OF THE PHYTOPLANKTON COMMUNITY IN THE GANDIA COASTAL AREA, SOUTHERN GULF OF VALENCIA
the efficiency of subsequent nutrient reduction strategies (Gobler et al., 2006; Domingues et al., 2011).
The North Western Mediterranean has a very dense human population (100 habitants/m of coastline in some regions); therefore, near-shore waters are very susceptible to anthropogenic alterations (Olivos et al., 2002). Siokou-Frangou et al., (2010) consider that the Catalan front is an area of higher nutrient availability and intense biological activity. In this area,cyanobacteria and picoeukaryotes often coexist or alternate with diatoms, dinoflagellates and other flagellates belonging to different algal groups. In the Catalan Sea, the strong seasonality creates optimum con-ditions for changes in the alternance of dominant groups in the phytoplankton community (Siokou-Frangou et al., 2010).Spatial and seasonal variability of primary produc-tion values can be high (Granata et al., 2004, Siokou-Frangou et al., 2010).
The Gulf of Valencia, south of the Catalan Sea, has suffered from progressive eutrophication process that has been accelerated in recent decades due to the strong industrial and demographic development of coastal cities (Soler and del Río, 1995). The coast of Gandia, located in the south of Gulf of Valencia, has different freshwater inputs: pumped water from the Safor Wetland is discharged through surface channels to Gandia Harbour and to the
Vaca intermittent watercourse which outflows, directly to the sea, on the Ahuir beach (Sebastiá et al., 2012). The hydrology of this wetland is manipulated to satisfy the different cultivation needs and these discharges are characterized by high nitrogen loads due to intensive agriculture practices (mainly citriculture). The nitrogen in these fertilisers seeps into ground water, rivers, and streams, gradually making its way into coastal waters (Newton et al., 2003). An important source of nitrogen and phosphorus is the sewage plant that treats the municipal wastewater of Gandia which discharges treated wastewater into the sea through a submarine out fall at an approximate distance of 1700 m from the coastline.
An other freshwater input is the Serpis river which has a marked Mediterranean regime characterized by a dry period in summer and humid period with torrential rains, mainly at the beginning of autumn (Garófano et al., 2009).This river is associated with important point and diffuse pollution sources due to certain land uses and fires, respectively (CHJ, 2005; Garófano et al., 2011). The sewage plant of Gandia has two overflow channels that discharge directly to the river near the mouth, which happens mainly during torrential rain episodes because wastewater and pluvial waters are not separate and in summer as consequence of the increase in the population. While the Vaca watercourse outflows in a more open
37Thalassas, 29(1) · January 2013
Figure 2:
Vertical profiles of temperature and salinity.
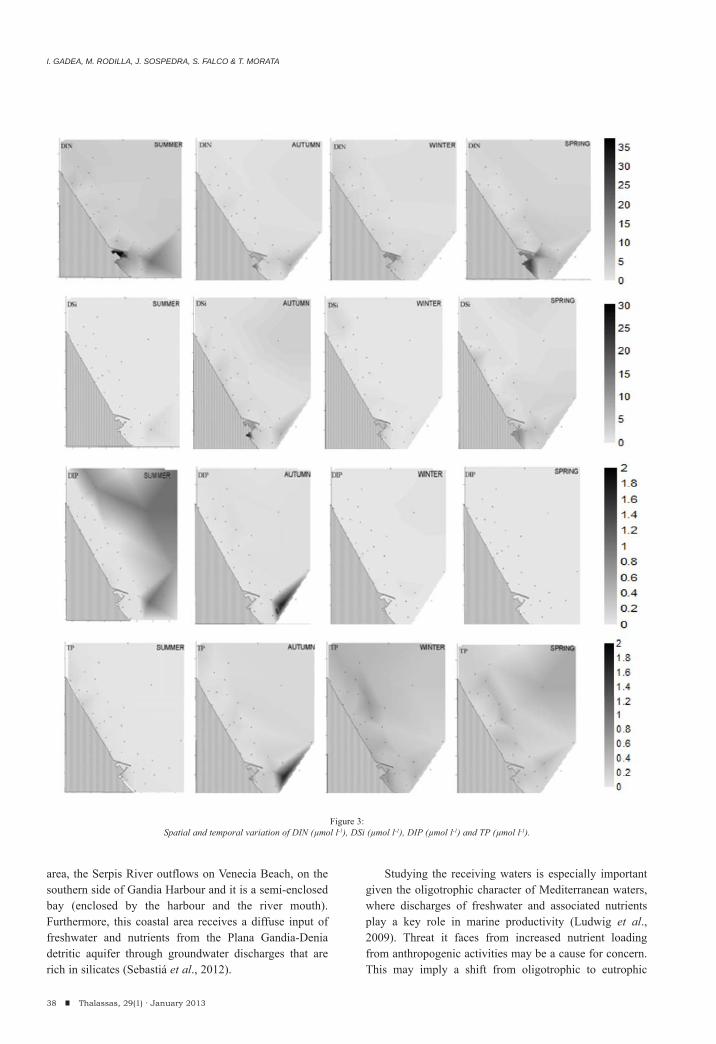
area, the Serpis River outflows on Venecia Beach, on the southern side of Gandia Harbour and it is a semi-enclosed bay (enclosed by the harbour and the river mouth). Furthermore, this coastal area receives a diffuse input of freshwater and nutrients from the Plana Gandia-Denia detritic aquifer through groundwater discharges that are rich in silicates (Sebastiá et al., 2012).
Studying the receiving waters is especially important given the oligotrophic character of Mediterranean waters, where discharges of freshwater and associated nutrients play a key role in marine productivity (Ludwig et al., 2009). Threat it faces from increased nutrient loading from anthropogenic activities may be a cause for concern. This may imply a shift from oligotrophic to eutrophic
38 Thalassas, 29(1) · January 2013
Figure 3:Spatial and temporal variation of DIN (μmol l-1), DSi (μmol l-1), DIP (μmol l-1) and TP (μmol l-1).
I. GADEA, M. RODILLA, J. SOSPEDRA, S. FALCO & T. MORATA

SEASONAL DYNAMICS OF THE PHYTOPLANKTON COMMUNITY IN THE GANDIA COASTAL AREA, SOUTHERN GULF OF VALENCIA
status whose influence on the phytoplankton community is interesting to evaluate. In the south of the Gulf of Valencia (Western Mediterranean) and its coastal zone few studies have been carried out in relation to this topic: Rodrigo et al., (2003) studied the phytoplankton community of the Safor Wetland and Sebastiá et al., (2012) studied the abundance of phytoplankton groups using diagnostic pho-topigment analysis,the study was carried out specifically in Gandia Harbour and only in spring and summer. However, the phytoplankton community structure and dynamics in relation to the physicochemistry of the Gandia coastal area is still subject to investigations.
The main objectives of this study was to analyze the variations in the phytoplankton community as a response to physical and chemical water variables during different seasons in a coastal area with different inputs of nutrients and to understand which species could be used as indica-tors of anthropogenic pressure. To achieve this objective, it was necessary to study phytoplankton composition, sea-sonal variations of environmental variables and examine the possible relationship between the phytoplankton suc-cessional patterns and the changes in nutrient and environ-mental regimen. The spatial patterns of the phytoplankton community were studied using a cluster analysis and a canonical correspondence analysis (CCA) was performed to understand if there was any environmental factor that triggers the development of HABs.
MATERIAL AND METHODS
Study site, sampling and laboratory procedures
Coastal area of Gandia is located in the Western Mediterranean Sea, in the south of the Gulf of Valencia (Spain). In this study, samples were taken from 33 sam-pling sites (fig.1) placed in parallel lines at different distances from the shoreline: surf zone (SZ), 200 m (A); 600 m (B), 1000 m (C), 1300 m (D), 2000 m (E) and 4000 m (F).The sampling sites formed a grid whose north and south limits were the mouths of the Vaca watercourse in the Ahuir Beach (station WV) and the Serpis river in Venecia Beach (station RS), respectively. This grid included the submarine outfall of the Gandia sewage treatment plant (station OU) and Gandia Harbour (stations H1, H2), where the ephemeral San Nicolás watercourse and surface chan-nels that drain the Safor Wetland outflow. The depth of the study area varied from 1.3 m to 20 m.
Four samplings were carried out from summer 2010 to spring 2011. Specifically, 26 August, 21 October, 23 February and 16 May, these samplings were designated as: Summer, Autumn, Winter and Spring monitoring, respec-tively. Samples for the physical, chemical and chlorophyll
a analysis and for the phytoplankton counts were taken at the surface layer (0.3 m depth) using a Van Dorn bottle. In order to study the vertical structure of the water column, temperature and salinity were measured in five extra sam-ples above the bottom. These samples were taken in an orthogonal transect (fig.1).
Temperature and dissolved oxygen were measured in situ with a YSI proODO sensor and light penetration was measured with Secchi disc. Water samples were kept in a cool box (4ºC) and transported to the laboratory.
Phytoplankton quantitative samples were placed in 0.125 l jars and fixed in situ with 20% formalde-hyde solution neutralized with hexametilenentramina (Throndsen, 1978). Sub-samples (50 ml) were allowed to settle for 24h in HydroBios chambers and then count-ed and identified at x400 magnifications with a Leica DMIL inverted microscope (Utermohl, 1958). Counts were made following the methodology of Andersen and Throndsen (2003). This did not include the small size fraction of phytoplankton (picoplankton and some portion of the nanoplankton). Qualitative phytoplankton samples were collected by plankton nets (mesh size 50 μm). The phytoplankton community was classified to the lowest taxonomic level possible in accordance with Tomas (1997).
The following parameters were analysed in all the samples: salinity, chlorophyll-a (Chl-a) suspended solids (SS), nitrate, nitrite and ammonium, dissolved inorganic phosphorus (DIP), total phosphate (TP) and dissolved silicate (DSi). Dissolved inorganic nitrogen (DIN) was calculated as the sum of nitrate, nitrite and ammonium. Nutrients were analysed using the method of Aminot and Chaussepied (1983). Chl-a and SS were analyzed following the methodology described in APHA (2005).Salinity was determined by means of a conductivity meter Multi 340i/SET WTW.
Precipitation, environmental temperature, wind speed and direction, as well as radiation, were measured at the weather station situated in the Royal Sailing Club of Gandia located in Gandia Harbour.
Data processing and statistical analysis.
The phytoplankton community was analysed in terms of species richness and abundance, diversity (Shannon-Weaver diversity index) and evenness (Pielou) (Zar, 1984)using the PC-ORD v.4 statistical package. The cluster analysis allowed the grouping of study sites according to their similarity in phytoplankton composition. Bray-Curtis distance along with group average was used as a linkage
39Thalassas, 29(1) · January 2013

40 Thalassas, 29(1) · January 2013
Figure 4:Seasonal changes in the mean concentrations of nutrients, chl-a and main phytoplankton groups from two stations in the entrance of the harbour (□ H1, H2),
Ahuir beach (∆ WV), submarine outfall (●OU ), river Serpis and Venecia Beach (◊ RS, S4, A4) and from rest of stations (■).
I. GADEA, M. RODILLA, J. SOSPEDRA, S. FALCO & T. MORATA
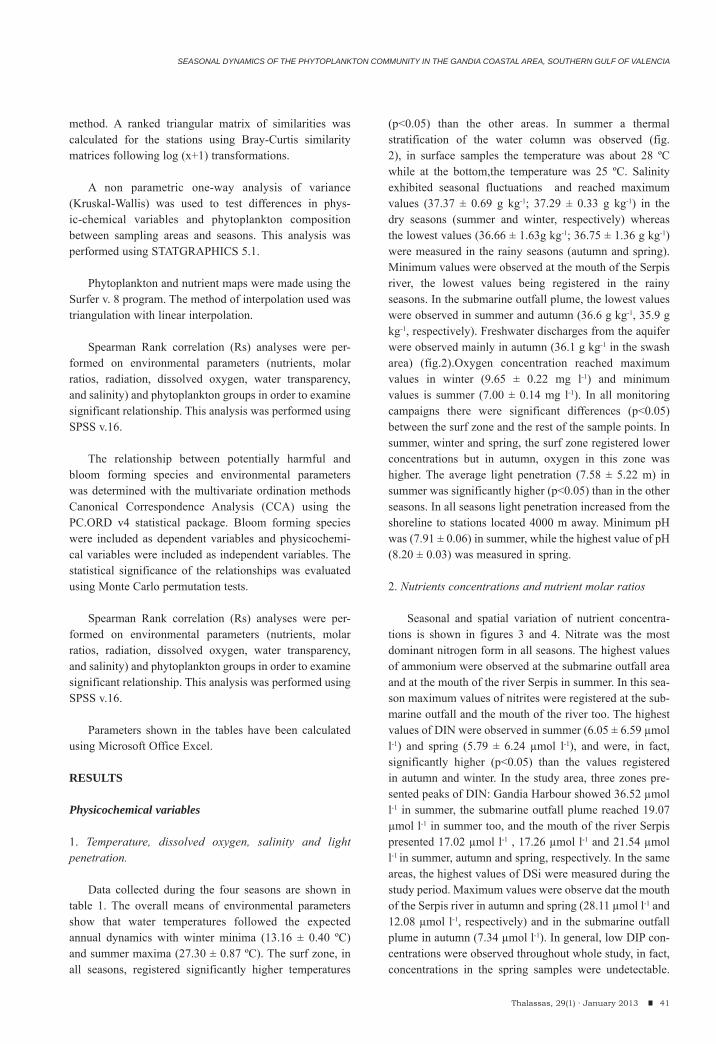
SEASONAL DYNAMICS OF THE PHYTOPLANKTON COMMUNITY IN THE GANDIA COASTAL AREA, SOUTHERN GULF OF VALENCIA
method. A ranked triangular matrix of similarities was calculated for the stations using Bray-Curtis similarity matrices following log (x+1) transformations.
A non parametric one-way analysis of variance (Kruskal-Wallis) was used to test differences in phys-ic-chemical variables and phytoplankton composition between sampling areas and seasons. This analysis was performed using STATGRAPHICS 5.1.
Phytoplankton and nutrient maps were made using the Surfer v. 8 program. The method of interpolation used was triangulation with linear interpolation.
Spearman Rank correlation (Rs) analyses were per-formed on environmental parameters (nutrients, molar ratios, radiation, dissolved oxygen, water transparency, and salinity) and phytoplankton groups in order to examine significant relationship. This analysis was performed using SPSS v.16.
The relationship between potentially harmful and bloom forming species and environmental parameters was determined with the multivariate ordination methods Canonical Correspondence Analysis (CCA) using the PC.ORD v4 statistical package. Bloom forming species were included as dependent variables and physicochemi-cal variables were included as independent variables. The statistical significance of the relationships was evaluated using Monte Carlo permutation tests.
Spearman Rank correlation (Rs) analyses were per-formed on environmental parameters (nutrients, molar ratios, radiation, dissolved oxygen, water transparency, and salinity) and phytoplankton groups in order to examine significant relationship. This analysis was performed using SPSS v.16.
Parameters shown in the tables have been calculated using Microsoft Office Excel.
RESULTS
Physicochemical variables
1. Temperature, dissolved oxygen, salinity and light penetration.
Data collected during the four seasons are shown in table 1. The overall means of environmental parameters show that water temperatures followed the expected annual dynamics with winter minima (13.16 ± 0.40 ºC) and summer maxima (27.30 ± 0.87 ºC). The surf zone, in all seasons, registered significantly higher temperatures
(p<0.05) than the other areas. In summer a thermal stratification of the water column was observed (fig. 2), in surface samples the temperature was about 28 ºC while at the bottom,the temperature was 25 ºC. Salinity exhibited seasonal fluctuations and reached maximum values (37.37 ± 0.69 g kg-1; 37.29 ± 0.33 g kg-1) in the dry seasons (summer and winter, respectively) whereas the lowest values (36.66 ± 1.63g kg-1; 36.75 ± 1.36 g kg-1) were measured in the rainy seasons (autumn and spring). Minimum values were observed at the mouth of the Serpis river, the lowest values being registered in the rainy seasons. In the submarine outfall plume, the lowest values were observed in summer and autumn (36.6 g kg-1, 35.9 g kg-1, respectively). Freshwater discharges from the aquifer were observed mainly in autumn (36.1 g kg-1 in the swash area) (fig.2).Oxygen concentration reached maximum values in winter (9.65 ± 0.22 mg l-1) and minimum values is summer (7.00 ± 0.14 mg l-1). In all monitoring campaigns there were significant differences (p<0.05) between the surf zone and the rest of the sample points. In summer, winter and spring, the surf zone registered lower concentrations but in autumn, oxygen in this zone was higher. The average light penetration (7.58 ± 5.22 m) in summer was significantly higher (p<0.05) than in the other seasons. In all seasons light penetration increased from the shoreline to stations located 4000 m away. Minimum pH was (7.91 ± 0.06) in summer, while the highest value of pH (8.20 ± 0.03) was measured in spring.
2. Nutrients concentrations and nutrient molar ratios
Seasonal and spatial variation of nutrient concentra-tions is shown in figures 3 and 4. Nitrate was the most dominant nitrogen form in all seasons. The highest values of ammonium were observed at the submarine outfall area and at the mouth of the river Serpis in summer. In this sea-son maximum values of nitrites were registered at the sub-marine outfall and the mouth of the river too. The highest values of DIN were observed in summer (6.05 ± 6.59 μmol l-1) and spring (5.79 ± 6.24 μmol l-1), and were, in fact, significantly higher (p<0.05) than the values registered in autumn and winter. In the study area, three zones pre-sented peaks of DIN: Gandia Harbour showed 36.52 μmol l-1 in summer, the submarine outfall plume reached 19.07 μmol l-1 in summer too, and the mouth of the river Serpis presented 17.02 μmol l-1 , 17.26 μmol l-1 and 21.54 μmol l-1 in summer, autumn and spring, respectively. In the same areas, the highest values of DSi were measured during the study period. Maximum values were observe dat the mouth of the Serpis river in autumn and spring (28.11 μmol l-1 and 12.08 μmol l-1, respectively) and in the submarine outfall plume in autumn (7.34 μmol l-1). In general, low DIP con-centrations were observed throughout whole study, in fact, concentrations in the spring samples were undetectable.
41Thalassas, 29(1) · January 2013
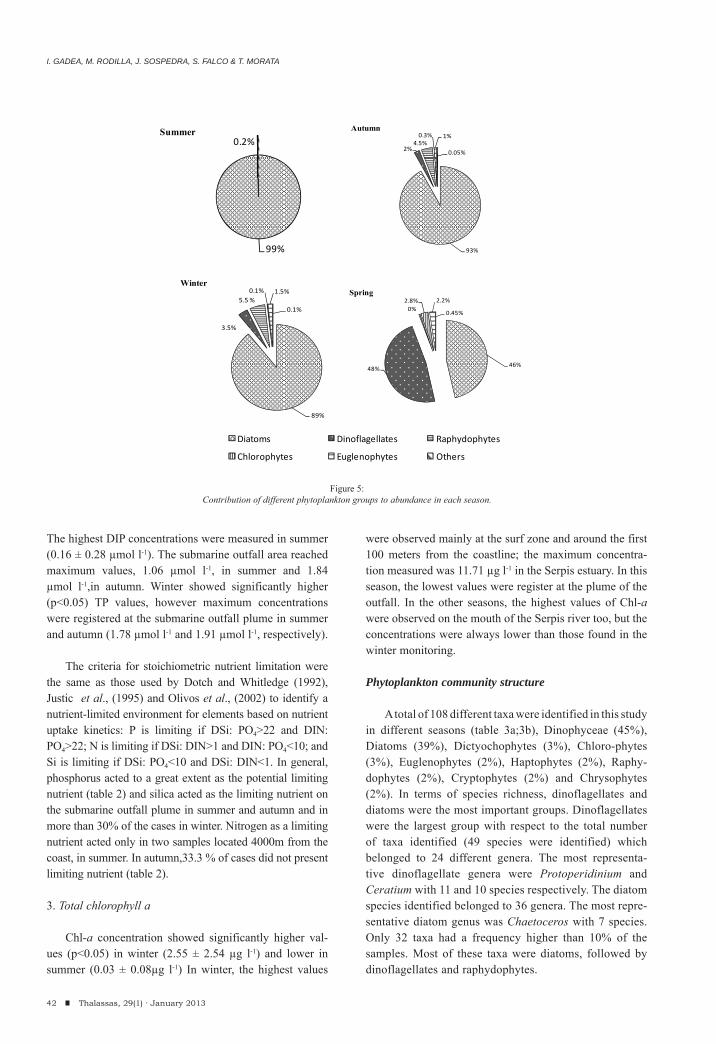
The highest DIP concentrations were measured in summer (0.16 ± 0.28 μmol l-1). The submarine outfall area reached maximum values, 1.06 μmol l-1, in summer and 1.84 μmol l-1,in autumn. Winter showed significantly higher (p<0.05) TP values, however maximum concentrations were registered at the submarine outfall plume in summer and autumn (1.78 μmol l-1 and 1.91 μmol l-1, respectively).
The criteria for stoichiometric nutrient limitation were the same as those used by Dotch and Whitledge (1992), Justic et al., (1995) and Olivos et al., (2002) to identify a nutrient-limited environment for elements based on nutrient uptake kinetics: P is limiting if DSi: PO4>22 and DIN: PO4>22; N is limiting if DSi: DIN>1 and DIN: PO4<10; and Si is limiting if DSi: PO4<10 and DSi: DIN<1. In general, phosphorus acted to a great extent as the potential limiting nutrient (table 2) and silica acted as the limiting nutrient on the submarine outfall plume in summer and autumn and in more than 30% of the cases in winter. Nitrogen as a limiting nutrient acted only in two samples located 4000m from the coast, in summer. In autumn,33.3 % of cases did not present limiting nutrient (table 2).
3. Total chlorophyll a
Chl-a concentration showed significantly higher val-ues (p<0.05) in winter (2.55 ± 2.54 μg l-1) and lower in summer (0.03 ± 0.08μg l-1) In winter, the highest values
were observed mainly at the surf zone and around the first 100 meters from the coastline; the maximum concentra-tion measured was 11.71 μg l-1 in the Serpis estuary. In this season, the lowest values were register at the plume of the outfall. In the other seasons, the highest values of Chl-a were observed on the mouth of the Serpis river too, but the concentrations were always lower than those found in the winter monitoring.
Phytoplankton community structure
A total of 108 different taxa were identified in this study in different seasons (table 3a;3b), Dinophyceae (45%), Diatoms (39%), Dictyochophytes (3%), Chloro-phytes (3%), Euglenophytes (2%), Haptophytes (2%), Raphy-dophytes (2%), Cryptophytes (2%) and Chrysophytes (2%). In terms of species richness, dinoflagellates and diatoms were the most important groups. Dinoflagellates were the largest group with respect to the total number of taxa identified (49 species were identified) which belonged to 24 different genera. The most representa-tive dinoflagellate genera were Protoperidinium and Ceratium with 11 and 10 species respectively. The diatom species identified belonged to 36 genera. The most repre-sentative diatom genus was Chaetoceros with 7 species. Only 32 taxa had a frequency higher than 10% of the samples. Most of these taxa were diatoms, followed by dinoflagellates and raphydophytes.
42 Thalassas, 29(1) · January 2013
93%
2%4.5%0.3% 1%
0.05%
Autumn
89%
3.5%
5.5 %0.1% 1.5%
0.1%
Winter
46%48%
0%2.8% 2.2%
0.45%
Spring
Diatoms Dinoflagellates Raphydophytes
Chlorophytes Euglenophytes Others
99%
0.2%Summer
Figure 5:Contribution of different phytoplankton groups to abundance in each season.
I. GADEA, M. RODILLA, J. SOSPEDRA, S. FALCO & T. MORATA
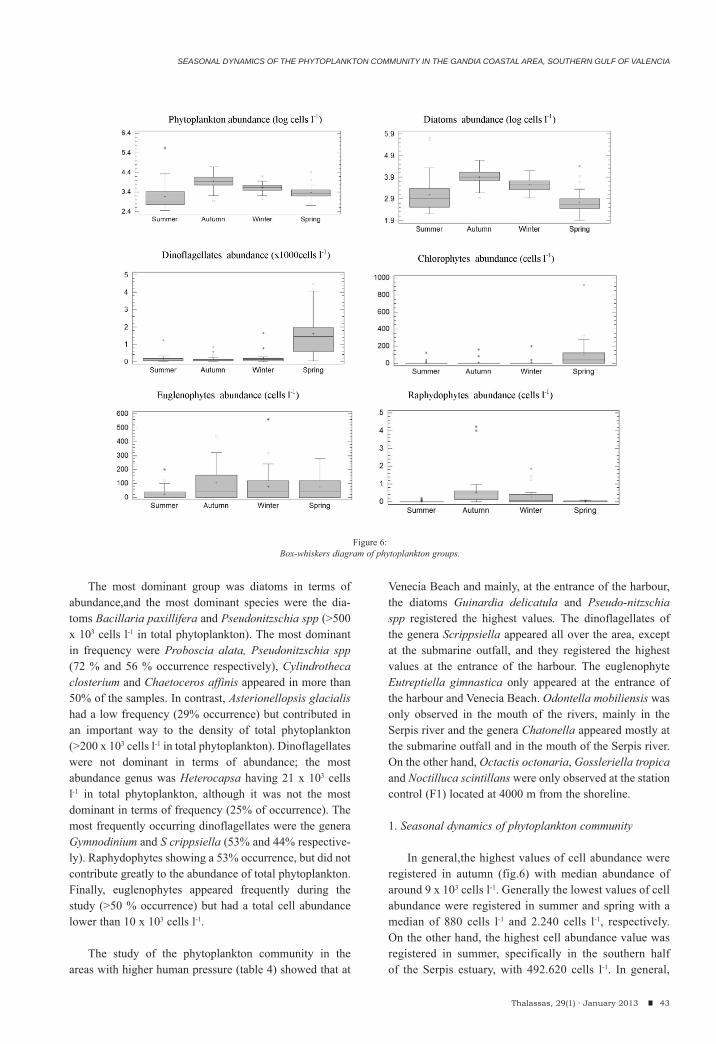
SEASONAL DYNAMICS OF THE PHYTOPLANKTON COMMUNITY IN THE GANDIA COASTAL AREA, SOUTHERN GULF OF VALENCIA
The most dominant group was diatoms in terms of abundance,and the most dominant species were the dia-toms Bacillaria paxillifera and Pseudonitzschia spp (>500 x 103 cells l-1 in total phytoplankton). The most dominant in frequency were Proboscia alata, Pseudonitzschia spp (72 % and 56 % occurrence respectively), Cylindrotheca closterium and Chaetoceros affinis appeared in more than 50% of the samples. In contrast, Asterionellopsis glacialis had a low frequency (29% occurrence) but contributed in an important way to the density of total phytoplankton (>200 x 103 cells l-1 in total phytoplankton). Dinoflagellates were not dominant in terms of abundance; the most abundance genus was Heterocapsa having 21 x 103 cells l-1 in total phytoplankton, although it was not the most dominant in terms of frequency (25% of occurrence). The most frequently occurring dinoflagellates were the genera Gymnodinium and S crippsiella (53% and 44% respective-ly). Raphydophytes showing a 53% occurrence, but did not contribute greatly to the abundance of total phytoplankton. Finally, euglenophytes appeared frequently during the study (>50 % occurrence) but had a total cell abundance lower than 10 x 103 cells l-1.
The study of the phytoplankton community in the areas with higher human pressure (table 4) showed that at
Venecia Beach and mainly, at the entrance of the harbour, the diatoms Guinardia delicatula and Pseudo-nitzschia spp registered the highest values. The dinoflagellates of the genera Scrippsiella appeared all over the area, except at the submarine outfall, and they registered the highest values at the entrance of the harbour. The euglenophyte Eutreptiella gimnastica only appeared at the entrance of the harbour and Venecia Beach. Odontella mobiliensis was only observed in the mouth of the rivers, mainly in the Serpis river and the genera Chatonella appeared mostly at the submarine outfall and in the mouth of the Serpis river. On the other hand, Octactis octonaria, Gossleriella tropica and Noctilluca scintillans were only observed at the station control (F1) located at 4000 m from the shoreline.
1. Seasonal dynamics of phytoplankton community
In general,the highest values of cell abundance were registered in autumn (fig.6) with median abundance of around 9 x 10³ cells l-1. Generally the lowest values of cell abundance were registered in summer and spring with a median of 880 cells l-1 and 2.240 cells l-1, respectively. On the other hand, the highest cell abundance value was registered in summer, specifically in the southern half of the Serpis estuary, with 492.620 cells l-1. In general,
43Thalassas, 29(1) · January 2013
Figure 6:Box-whiskers diagram of phytoplankton groups.

the temporal distribution of cell abundance coincided with temporal distribution of diatoms, which indicates that this group was responsible for the variability of cell concentration. In fact, there was a strong significant correlation (R2=0.90 p<0.01) between diatom abundance and total abundance of cells. There was a high variability in cell abundance when the temporal distribution of main groups of phytoplankton was examined. Generally, diatoms registered the highest values in autumn (fig. 6). Dinoflagellates and chlorophytes abundance in spring was significantly (p<0.05) higher than the other seasons. Euglenophytes cell density was significantly (p<0.05) lower in summer and raphydophytes were more abundant in autumn and winter than in spring and summer.
In summer (fig.5), the plankton flora was represented mainly by diatoms which represented 99% of cell abun-dance. The most dominant taxa in terms of abundance were Bacillaria paxillifera, Pseudo-nitzschia spp. and Guinardia delicatulaand in terms of frequency, Bacillaria paxillifera, Proboscia alata and Rhizosolenia sp. The genera Gymnodinium was the most abundant dinoflagel-late in this season. In autumn, the most dominant group
was diatoms (93%) followed by raphydophytes (4.5%) and dinoflaglellates (2%) (fig. 5). The most frequently occurring species were Thalassionema nitzschioides, Asterionellopsis glacialis and Pseudo-nitzschia spp., and these contributed greatly to the density of total phytoplankton. The most frequent and abundant genera of dinoflaglellates were Scrippsiella and Gymnodinium. The percentage of diatoms decreased in winter (89%) while the percentage of raphydophytes, dinoflagellates and euglenophytes increased. The most abundant and frequent species was Chaetoceros affinis,while the most abundant dinoflagellate genus was Scrippsiella and the most frequent was Gymnodinium. The relative abun-dances of different groups were significantly different in spring compared to other seasons, the group with the highest relative abundance was the dinoflagellates with 48%; diatoms accounted for 46%, and chlorophytes and euglenophytes 2.8% and 2.2%, respectively. The most abundant species was the diatom Bacillaria paxillifera but the most frequently occurring species were the dino-flagellates of the genus Gymnodinium followed by the genera Heterocapsa and Scrippsiella. Spring monitoring had significantly (p<0.05) higher values of diversity (2.03
44 Thalassas, 29(1) · January 2013
Figure 7:Dendrogram for the hierarchical clustering of the 33 stations using group-average linking of Bray-Curtis similarities calculated on log-transformed abundance data.
I. GADEA, M. RODILLA, J. SOSPEDRA, S. FALCO & T. MORATA
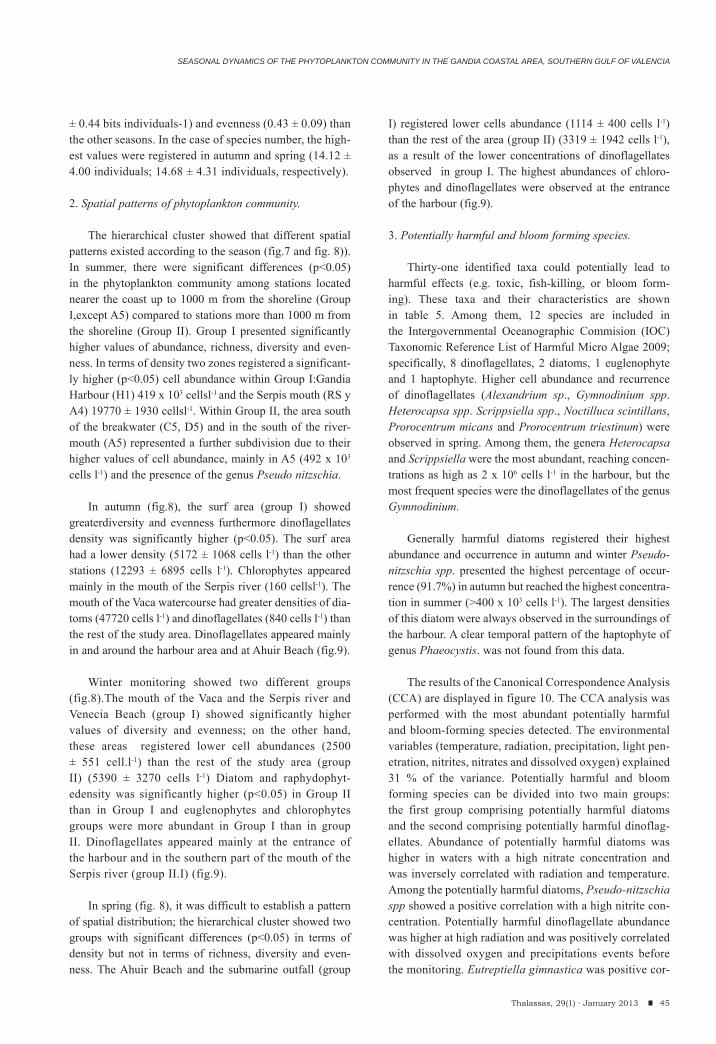
SEASONAL DYNAMICS OF THE PHYTOPLANKTON COMMUNITY IN THE GANDIA COASTAL AREA, SOUTHERN GULF OF VALENCIA
± 0.44 bits individuals-1) and evenness (0.43 ± 0.09) than the other seasons. In the case of species number, the high-est values were registered in autumn and spring (14.12 ± 4.00 individuals; 14.68 ± 4.31 individuals, respectively).
2. Spatial patterns of phytoplankton community.
The hierarchical cluster showed that different spatial patterns existed according to the season (fig.7 and fig. 8)). In summer, there were significant differences (p<0.05) in the phytoplankton community among stations located nearer the coast up to 1000 m from the shoreline (Group I,except A5) compared to stations more than 1000 m from the shoreline (Group II). Group I presented significantly higher values of abundance, richness, diversity and even-ness. In terms of density two zones registered a significant-ly higher (p<0.05) cell abundance within Group I:Gandia Harbour (H1) 419 x 103 cellsl-1 and the Serpis mouth (RS y A4) 19770 ± 1930 cellsl-1. Within Group II, the area south of the breakwater (C5, D5) and in the south of the river-mouth (A5) represented a further subdivision due to their higher values of cell abundance, mainly in A5 (492 x 103 cells l-1) and the presence of the genus Pseudo nitzschia.
In autumn (fig.8), the surf area (group I) showed greaterdiversity and evenness furthermore dinoflagellates density was significantly higher (p<0.05). The surf area had a lower density (5172 ± 1068 cells l-1) than the other stations (12293 ± 6895 cells l-1). Chlorophytes appeared mainly in the mouth of the Serpis river (160 cellsl-1). The mouth of the Vaca watercourse had greater densities of dia-toms (47720 cells l-1) and dinoflagellates (840 cells l-1) than the rest of the study area. Dinoflagellates appeared mainly in and around the harbour area and at Ahuir Beach (fig.9).
Winter monitoring showed two different groups (fig.8).The mouth of the Vaca and the Serpis river and Venecia Beach (group I) showed significantly higher values of diversity and evenness; on the other hand, these areas registered lower cell abundances (2500 ± 551 cell.l-1) than the rest of the study area (group II) (5390 ± 3270 cells l-1) Diatom and raphydophyt-edensity was significantly higher (p<0.05) in Group II than in Group I and euglenophytes and chlorophytes groups were more abundant in Group I than in group II. Dinoflagellates appeared mainly at the entrance of the harbour and in the southern part of the mouth of the Serpis river (group II.I) (fig.9).
In spring (fig. 8), it was difficult to establish a pattern of spatial distribution; the hierarchical cluster showed two groups with significant differences (p<0.05) in terms of density but not in terms of richness, diversity and even-ness. The Ahuir Beach and the submarine outfall (group
I) registered lower cells abundance (1114 ± 400 cells l-1) than the rest of the area (group II) (3319 ± 1942 cells l-1), as a result of the lower concentrations of dinoflagellates observed in group I. The highest abundances of chloro-phytes and dinoflagellates were observed at the entrance of the harbour (fig.9).
3. Potentially harmful and bloom forming species.
Thirty-one identified taxa could potentially lead to harmful effects (e.g. toxic, fish-killing, or bloom form-ing). These taxa and their characteristics are shown in table 5. Among them, 12 species are included in the Intergovernmental Oceanographic Commision (IOC) Taxonomic Reference List of Harmful Micro Algae 2009; specifically, 8 dinoflagellates, 2 diatoms, 1 euglenophyte and 1 haptophyte. Higher cell abundance and recurrence of dinoflagellates (Alexandrium sp., Gymnodinium spp. Heterocapsa spp. Scrippsiella spp., Noctilluca scintillans, Prorocentrum micans and Prorocentrum triestinum) were observed in spring. Among them, the genera Heterocapsa and Scrippsiella were the most abundant, reaching concen-trations as high as 2 x 10⁶ cells l-1 in the harbour, but the most frequent species were the dinoflagellates of the genus Gymnodinium.
Generally harmful diatoms registered their highest abundance and occurrence in autumn and winter Pseudo-nitzschia spp. presented the highest percentage of occur-rence (91.7%) in autumn but reached the highest concentra-tion in summer (>400 x 103 cells l-1). The largest densities of this diatom were always observed in the surroundings of the harbour. A clear temporal pattern of the haptophyte of genus Phaeocystis. was not found from this data.
The results of the Canonical Correspondence Analysis (CCA) are displayed in figure 10. The CCA analysis was performed with the most abundant potentially harmful and bloom-forming species detected. The environmental variables (temperature, radiation, precipitation, light pen-etration, nitrites, nitrates and dissolved oxygen) explained 31 % of the variance. Potentially harmful and bloom forming species can be divided into two main groups: the first group comprising potentially harmful diatoms and the second comprising potentially harmful dinoflag-ellates. Abundance of potentially harmful diatoms was higher in waters with a high nitrate concentration and was inversely correlated with radiation and temperature. Among the potentially harmful diatoms, Pseudo-nitzschia spp showed a positive correlation with a high nitrite con-centration. Potentially harmful dinoflagellate abundance was higher at high radiation and was positively correlated with dissolved oxygen and precipitations events before the monitoring. Eutreptiella gimnastica was positive cor-
45Thalassas, 29(1) · January 2013
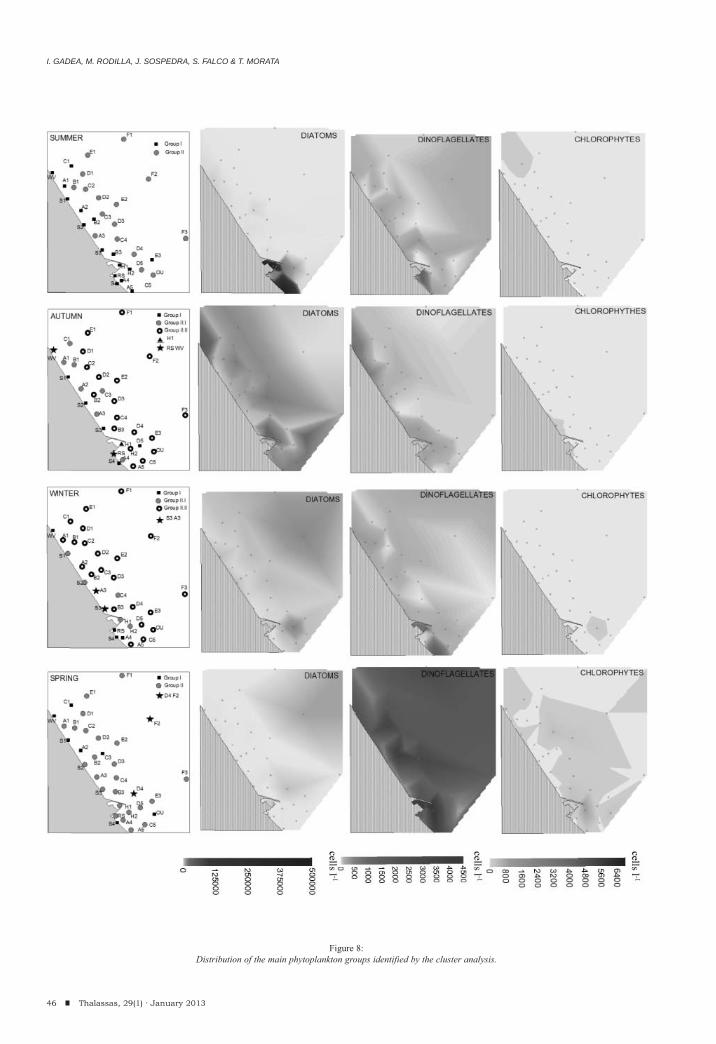
46 Thalassas, 29(1) · January 2013
Figure 8:Distribution of the main phytoplankton groups identified by the cluster analysis.
I. GADEA, M. RODILLA, J. SOSPEDRA, S. FALCO & T. MORATA

SEASONAL DYNAMICS OF THE PHYTOPLANKTON COMMUNITY IN THE GANDIA COASTAL AREA, SOUTHERN GULF OF VALENCIA
related with precipitation event before monitoring and dissolved oxygen. Guinardia delicatula was the most opportunistic species and Prorocentrum minimum and Prorocentrum lima had no clear pattern.
Relations between abiotic parameters and phytoplankton community.
Spearman Rank correlation analyses were performed on environmental parameters (water temperature, nutri-ents, radiation, water transparency, dissolved oxygen and salinity) and phytoplankton groups in order to examine significant relationships (table 6). The assessment of the correlation was based on the scale defined by Torres (2004). Diatoms group showed significantly weak positive correlations with Si and DIP and with DSi:DIN molar ratio, and they had moderately negative correlations with solar radiation and water temperature. Dinoflagellates presented a moderately positive correlation with solar radiation and weak correlation with DIN:DIP and DSi:DIP molar ratios. On the other hand, they showed a weak negative correla-tion with DIP and DSi:DIN molar ratio. Chlorophytes were weakly inversely correlated with salinity, DIP and light penetration and presented a weak positive correlation with solar radiation, DIN, DSi and DIN:DIP and DSi:DIP molar ratios. Euglenophytes showed weakly positive correlations with DSi and DSi:DIN and DSi:DIP molar ratios and they were weak inversely correlated with salinity and light pen-etration. Raphydophytes showed negative correlation with solar radiation and weak with water temperature.
Phytoplankton cell abundance had a weak positive correlation with Si and DSi:DIN molar ratio, and this was weakly inversely correlated with water temperature, radiation and salinity. Finally, Chl-a showed a moderately positive correlation with dissolved oxygen and weak cor-relation with TP and DSi:DIP molar ratio and a weak nega-tive correlation with light penetration.
DISCUSSION
The results showed that the coastal area of Gandia is characterized by a high temporal and spatial variability of physicochemical parameters. These changes were particu-larly striking during the rainy seasons (autumn and spring), which can be explained mainly by the contribution of the Serpis river, surface channels that drain the Safor Wetland and the submarine outfall discharges.
Salinity exhibited seasonal fluctuations (fig. 2) and reached maximum values in the dry seasons (summer and winter) whereas the lowest values were measured in the rainy seasons (autumn and spring). Minimum values appeared at the mouth of the Serpis River, mainly in the
rainy seasons due to the increase in the flow caused by precipitation. Minimum values were also recorded at the submarine outfall plume in summer and autumn. This was a consequence of the increased flow in summer due to the population increase because it is a popular tourist destina-tion, and in autumn because rain water arrives at the sew-age treatment plant via the sewer system and then to the sea through the submarine outfall.
On the Gandia coast, during the study period, nutri-ent concentrations (0.80- 36.52 μM for DIN, 0.03 - 28.11 μM for DSi, <0.01-0.32 μM for DIP) were below those of typical nutrient-enriched areas such as, San Francisco Bay (Cloern, 1996) and Ria Formosa (Newton et al., 2003; Brito et al., 2010) and Arenys de Mar harbour (Vila et al., 2005); and slightly higher than those observed in the Catalan Sea by Olivos et al., 2002. Among the three nutri-ents, DIP concentrations were particularly low, in the same order of magnitude as those measured in non-polluted coastal areas (Aminot and Chaussepied, 1983; Glé et al., 2008; Sebastiá et al., 2012) and slightly lower than those recorded by Olivos et al., (2002).
The highest values of DIN and DSi were observed at the mouth of the Serpis and in Gandia harbour (fig.4), mostly in the rainy seasons when, as pointed out by Sebastiá et al. (2012) precipitation events lead to ter-restrial runoff and increased river flow and also when the water from Plana Gandia-Denia aquifer, rich in nitrates and DSi, is pumped through the irrigation channels to the harbour to decrease the phreatic level and prevent crop root asphyxia. Thus, the major sources of DIN and DSi in this coastal area, are probably from the Serpis river and the channels that drain the Safor Wetland. In addition to the previous inputs, a diffuse input of freshwater and nutrients is possible, in the swash area, from the Plana Gandia-Denia detritic aquifer through groundwater discharges rich in silica and nitrates (Sebatiá et al., 2012), mainly in autumn (fig.2).According to Ballesteros-Navarro (2003), the Ahuir Beach, which is located at the end of Gandia’s urban area, receives a discharge from the Plana Gandia-Denia detritic aquifer, quantified at 66 Hm3 year-1 (2.1 m3s-1). Due to continued agricultural practices, nitrate levels in the detritic aquifer have exceeded the limit of 50 mg l-1 established by the Nitrates Directive (Directive 91/676/EEC). On the other hand, wetland species of Graminae are characterised by high silica content (typically 10-15% dry shoot weight). This biogenic silica, after decomposition of organic mate-rial, remains in the soil and it is lixiviated to the aquifer (Conley 2002). Although, the natural vegetation surface has decreased recent decades, it still remains an important soil use. Thus, biogenic silica is an important element in the terrestrial biogeochemical cycle, and must be taken
47Thalassas, 29(1) · January 2013
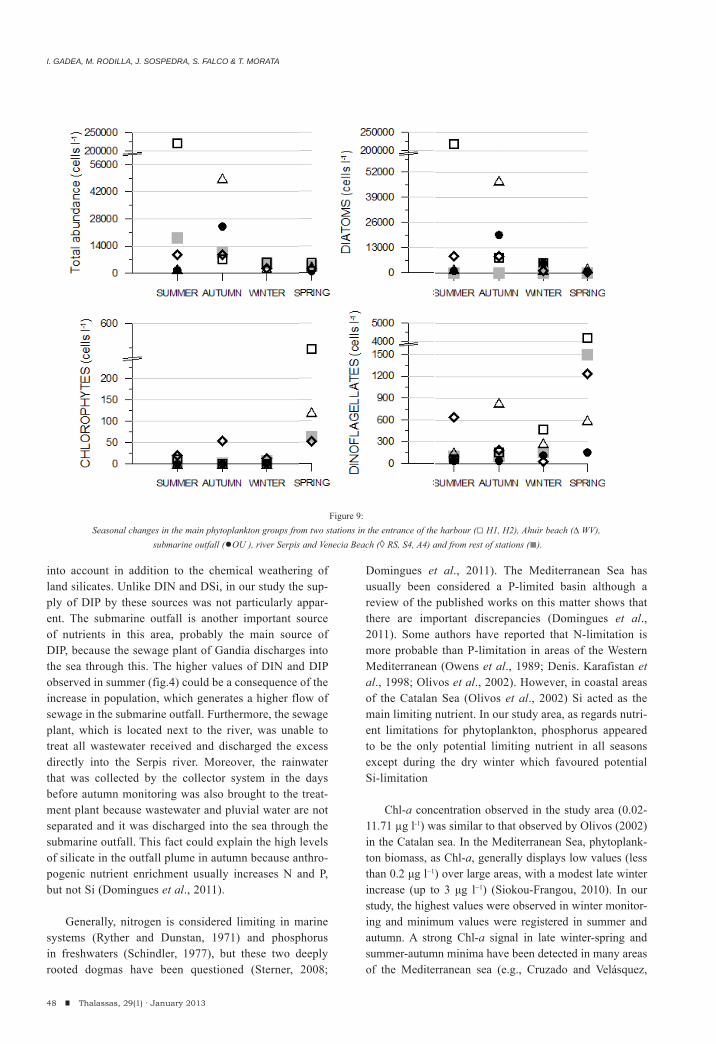
into account in addition to the chemical weathering of land silicates. Unlike DIN and DSi, in our study the sup-ply of DIP by these sources was not particularly appar-ent. The submarine outfall is another important source of nutrients in this area, probably the main source of DIP, because the sewage plant of Gandia discharges into the sea through this. The higher values of DIN and DIP observed in summer (fig.4) could be a consequence of the increase in population, which generates a higher flow of sewage in the submarine outfall. Furthermore, the sewage plant, which is located next to the river, was unable to treat all wastewater received and discharged the excess directly into the Serpis river. Moreover, the rainwater that was collected by the collector system in the days before autumn monitoring was also brought to the treat-ment plant because wastewater and pluvial water are not separated and it was discharged into the sea through the submarine outfall. This fact could explain the high levels of silicate in the outfall plume in autumn because anthro-pogenic nutrient enrichment usually increases N and P, but not Si (Domingues et al., 2011).
Generally, nitrogen is considered limiting in marine systems (Ryther and Dunstan, 1971) and phosphorus in freshwaters (Schindler, 1977), but these two deeply rooted dogmas have been questioned (Sterner, 2008;
Domingues et al., 2011). The Mediterranean Sea has usually been considered a P-limited basin although a review of the published works on this matter shows that there are important discrepancies (Domingues et al., 2011). Some authors have reported that N-limitation is more probable than P-limitation in areas of the Western Mediterranean (Owens et al., 1989; Denis. Karafistan et al., 1998; Olivos et al., 2002). However, in coastal areas of the Catalan Sea (Olivos et al., 2002) Si acted as the main limiting nutrient. In our study area, as regards nutri-ent limitations for phytoplankton, phosphorus appeared to be the only potential limiting nutrient in all seasons except during the dry winter which favoured potential Si-limitation
Chl-a concentration observed in the study area (0.02-11.71 μg l-1) was similar to that observed by Olivos (2002) in the Catalan sea. In the Mediterranean Sea, phytoplank-ton biomass, as Chl-a, generally displays low values (less than 0.2 μg l−1) over large areas, with a modest late winter increase (up to 3 μg l−1) (Siokou-Frangou, 2010). In our study, the highest values were observed in winter monitor-ing and minimum values were registered in summer and autumn. A strong Chl-a signal in late winter-spring and summer-autumn minima have been detected in many areas of the Mediterranean sea (e.g., Cruzado and Velásquez,
48 Thalassas, 29(1) · January 2013
Figure 9:Seasonal changes in the main phytoplankton groups from two stations in the entrance of the harbour (□ H1, H2), Ahuir beach (∆ WV),
submarine outfall (●OU ), river Serpis and Venecia Beach (◊ RS, S4, A4) and from rest of stations (■).
I. GADEA, M. RODILLA, J. SOSPEDRA, S. FALCO & T. MORATA
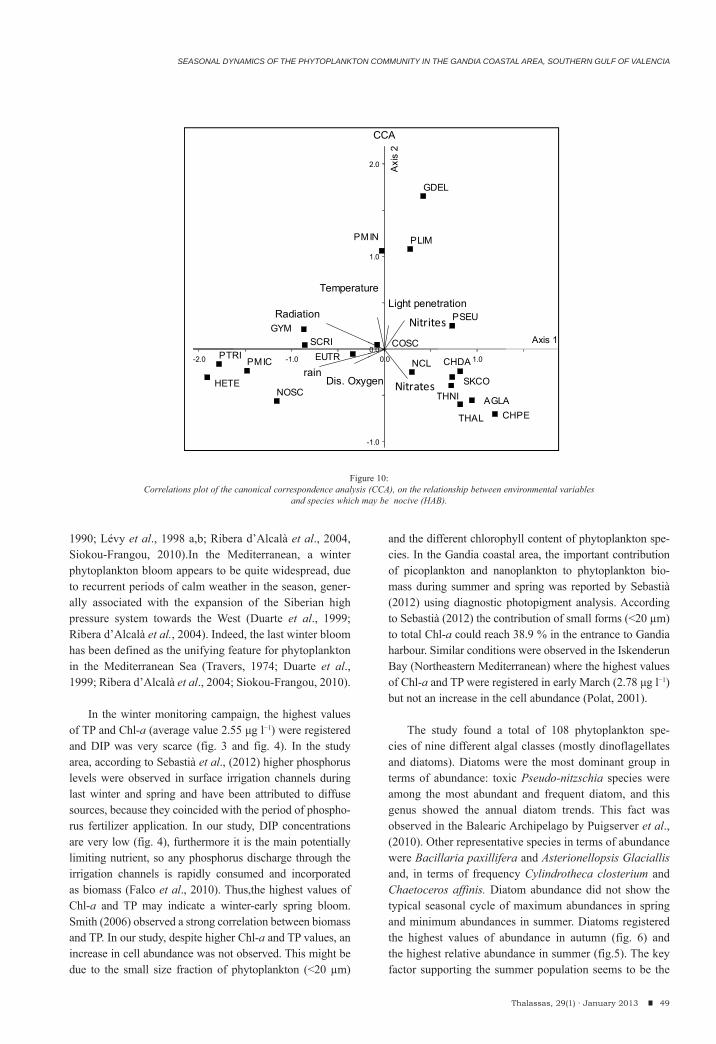
SEASONAL DYNAMICS OF THE PHYTOPLANKTON COMMUNITY IN THE GANDIA COASTAL AREA, SOUTHERN GULF OF VALENCIA
1990; Lévy et al., 1998 a,b; Ribera d’Alcalà et al., 2004, Siokou-Frangou, 2010).In the Mediterranean, a winter phytoplankton bloom appears to be quite widespread, due to recurrent periods of calm weather in the season, gener-ally associated with the expansion of the Siberian high pressure system towards the West (Duarte et al., 1999; Ribera d’Alcalà et al., 2004). Indeed, the last winter bloom has been defined as the unifying feature for phytoplankton in the Mediterranean Sea (Travers, 1974; Duarte et al., 1999; Ribera d’Alcalà et al., 2004; Siokou-Frangou, 2010).
In the winter monitoring campaign, the highest values of TP and Chl-a (average value 2.55 μg l−1) were registered and DIP was very scarce (fig. 3 and fig. 4). In the study area, according to Sebastià et al., (2012) higher phosphorus levels were observed in surface irrigation channels during last winter and spring and have been attributed to diffuse sources, because they coincided with the period of phospho-rus fertilizer application. In our study, DIP concentrations are very low (fig. 4), furthermore it is the main potentially limiting nutrient, so any phosphorus discharge through the irrigation channels is rapidly consumed and incorporated as biomass (Falco et al., 2010). Thus,the highest values of Chl-a and TP may indicate a winter-early spring bloom. Smith (2006) observed a strong correlation between biomass and TP. In our study, despite higher Chl-a and TP values, an increase in cell abundance was not observed. This might be due to the small size fraction of phytoplankton (<20 μm)
and the different chlorophyll content of phytoplankton spe-cies. In the Gandia coastal area, the important contribution of picoplankton and nanoplankton to phytoplankton bio-mass during summer and spring was reported by Sebastià (2012) using diagnostic photopigment analysis. According to Sebastià (2012) the contribution of small forms (<20 μm) to total Chl-a could reach 38.9 % in the entrance to Gandia harbour. Similar conditions were observed in the Iskenderun Bay (Northeastern Mediterranean) where the highest values of Chl-a and TP were registered in early March (2.78 μg l−1) but not an increase in the cell abundance (Polat, 2001).
The study found a total of 108 phytoplankton spe-cies of nine different algal classes (mostly dinoflagellates and diatoms). Diatoms were the most dominant group in terms of abundance: toxic Pseudo-nitzschia species were among the most abundant and frequent diatom, and this genus showed the annual diatom trends. This fact was observed in the Balearic Archipelago by Puigserver et al., (2010). Other representative species in terms of abundance were Bacillaria paxillifera and Asterionellopsis Glaciallis and, in terms of frequency Cylindrotheca closterium and Chaetoceros affinis. Diatom abundance did not show the typical seasonal cycle of maximum abundances in spring and minimum abundances in summer. Diatoms registered the highest values of abundance in autumn (fig. 6) and the highest relative abundance in summer (fig.5). The key factor supporting the summer population seems to be the
49Thalassas, 29(1) · January 2013
HET
PTR-2.0
GYM
ENOSC
PMICRI
Radia
-1.0
C
PM
SCRIEUTR
Dis. Oxyg
Temperatu
ation
rain
-
2
PLIMIN
COSC
NCL
GD
T
Light penet
NO2
NO3 gen
re
1.0
0.00.0
1.0
2.0
CCA
Axi
s 2
Nitrates
Nitrite
AGLA
CHDA
C
EL
PSEU
SKCOTHNI
THAL
tration
1.0
es
ACHPE
Axis 1
Figure 10:Correlations plot of the canonical correspondence analysis (CCA), on the relationship between environmental variables
and species which may be nocive (HAB).

I. GADEA, M. RODILLA, J. SOSPEDRA, S. FALCO & T. MORATA
continuous availability of silica (even in the dry period) together with the optimal light and temperature conditions. The lowest density and relative abundance of this group was reached in spring in spite of the high concentrations of DSi. In this season dinoflagellates showed the highest densities.
In ecosystems with phosphorus limiting conditions and high nitrate and silicate levels, inputs of phosphorus could trigger the undesired effects of phytoplankton species responsible for the generation of harmful blooms (Sebastiá et al., 2012). In our study, the highest concentrations of dinoflagellates were always observed in the areas where the lowest DIP concentrations were registered despite the fact that at the same time those areas were producing the high-est nutrient load (fig. 3 and fig.4). This fact shows that any phosphorus discharge in this area is rapidly consumed and incorporated by phytoplankton, including dinoflagellates.In summer, dinoflagellates appeared mainly in the mouth of the Serpis river (fig. 8 and fig. 9) when the treatment plant capacity is exceeded due to the population increase and the wastewater collector discharges into the Serpis directly. In autumn, they appeared in the Ahuir Beach (fig.8 and fig.9) when groundwater discharges were higher (fig. 2). During
the period of phosphorus fertilizer application in the crops an increase in the dinoflagellate abundance was observed in the harbour since it received the discharges from the chan-nels that drain the wetland. In spring dinoflagellates reached their highest abundances and relative abundance (fig.8) in the whole area, but mainly in the harbour. Phytoplankton abundance, including dinoflagellates was triggered by the increase in the incident light, and that increase led to a reduc-tion of the DIP to levels below the detection limit because of nutrient assimilation. According to Fisher et al. (1999)light can limit or co-limit algal growth in marine environ-ments that present high nitrogen inputs. This spring increase was characterized by a dominance of genera Heterocapsa, Scrippsiella and Gymnodinium. Some species that belong to these genera are capable of phagotrophy which is advanta-geous in inorganic nutrient-depleted waters (Stoecker et al., 2006).The heterotrophic dinoflagellates are important in the trophic dynamics of the plankton community due to their various feeding strategies (Jeong, 1994; 1999; Barría and Piccolo, 2008). Dinoflagellates spring bloom was observed in the coastal waters of the Balearic Archipelago (Puigserver et al., 2010), Izmik Bay (Aktan et al., 2005) and in the Catalan Sea, where maximum concentrations were detected during spring and summer (Vila and Masó, 2005).
50 Thalassas, 29(1) · January 2013
SUMMER AUTUMN WINTER SPRING
X min max X min max X min max X min max Water temperature (ºC) 27.30 0.87 26.20 30.30 20.85 0.48 19.60 22.20 13.16 0.40 12.70 14.10 20.82 0.90 19.60 23.00 Radiation (W m-2) 663 137 378 849 225 95 118 320 642 178 127 686 867 140 577 958 Salinity (g kg-1) 37.37 0.69 34.60 37.80 36.66 1.63 27.80 37.50 37.29 0.33 36.00 37.60 36.75 1.36 30.20 37.80 Dissolved oxygen (mgl-1) 7.00 0.14 6.55 7.14 7.44 0.36 6.82 8.38 9.65 0.22 9.10 9.87 8.76 0.40 7.94 9.30 pH 7.91 0.06 7.72 8.01 8.15 0.04 8.08 8.22 8.14 0.02 8.08 8.17 8.20 0.03 8.12 8.26 Secchi depth (m) 7.58 5.22 0.50 17.00 2.98 1.50 0.50 5.50 5.28 3.04 0.20 10.00 3.19 1.77 0.20 8.00 Suspended solids (mg l-1) 10.42 2.76 7.00 20.43 10.41 1.80 5.50 15.75 16.41 14.61 5.50 63.30 11.34 3.80 6.29 27.67 DIN (μM) 6.95 6.59 2.86 36.52 2.80 3.27 0.80 17.26 2.98 2.51 1.11 14.56 5.79 6.24 1.43 27.42 DIP (μM) 0.16 0.28 0.02 1.06 0.12 0.32 0.01 1.84 0.03 0.03 <0.01 0.15 <0.01 <0.01 <0.01 <0.01 TP (μM) 0.35 0.34 0.09 1.78 0.29 0.29 0.14 1.91 0.39 0.11 0.16 0.68 0.24 0.11 0.06 0.53 DSi (μM) 5.2 2.5 2.3 14.4 3.2 4.8 0.5 28.1 1.0 1.4 0.0 6.2 2.8 2.6 0.4 12.1 DIN:DIP 123.8 119.6 4.0 675.6 42.6 32.1 5.2 129.1 285.7 673.6 13.8 3533.2 236.8 251.8 57.4 1096.8 DSi:DIN 1.0 0.3 0.2 1.4 1.1 0.4 0.3 2.4 0.3 0.2 0.0 0.8 0.5 0.2 0.2 1.5 DSi:DIP 106.8 61.0 4.55 232.0 50.2 45.9 3.8 180.1 75.0 140.8 0.4 695.4 110.6 104.0 17.1 483.2 Diversity (H', bits ind-1) 1.35 0.56 0.02 2.40 1.46 0.37 0.67 2.27 1.58 0.37 1.05 2.40 2.03 0.44 1.03 2.70 Evenness ( J) 0.30 0.12 0.00 0.51 0.32 0.08 0.14 0.49 0.34 0.08 0.23 0.52 0.43 0.09 0.22 0.57 Richness (S) 8.03 4.10 3 17 14.12 4.00 8 25 11.48 2.75 7 18 14.68 4.31 5 21 Total chlorophyll-a (μgl-1) 0.06 0.08 0.02 0.45 0.14 0.06 0.06 0.32 2.55 2.54 0.12 11.71 0.18 0.13 0.02 0.76
%DIN %PO4 %SiO2Summer 6.25 87.50 3.13 3.13Autumn 0 63.64 3.03 33.33Winter 0 63.64 33.33 3.03Spring 0 100 0 0
% without % limiting nutrient
Table 1:Measured physicochemical and community structure parameters and chlorophyll-a means, standard deviations, minimum and maximum values
of stations grouped by seasons.
Table 2:Percentage when DIN, PO4 or SiO2 act as potential limiting nutrient.
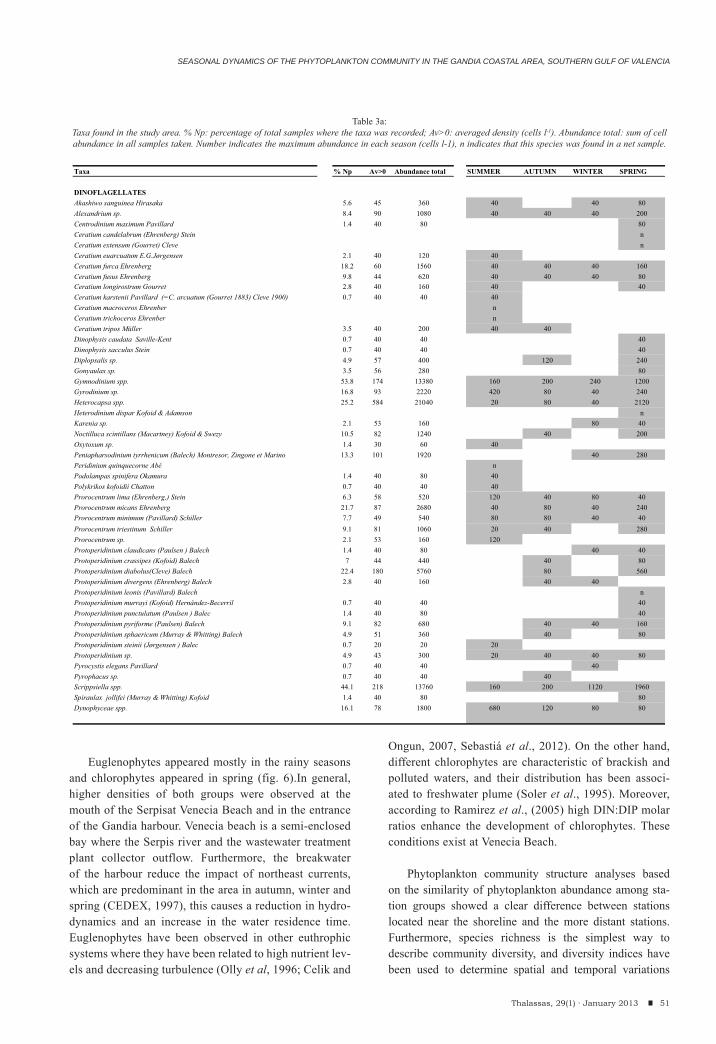
SEASONAL DYNAMICS OF THE PHYTOPLANKTON COMMUNITY IN THE GANDIA COASTAL AREA, SOUTHERN GULF OF VALENCIA
Euglenophytes appeared mostly in the rainy seasons and chlorophytes appeared in spring (fig. 6).In general, higher densities of both groups were observed at the mouth of the Serpisat Venecia Beach and in the entrance of the Gandia harbour. Venecia beach is a semi-enclosed bay where the Serpis river and the wastewater treatment plant collector outflow. Furthermore, the breakwater of the harbour reduce the impact of northeast currents, which are predominant in the area in autumn, winter and spring (CEDEX, 1997), this causes a reduction in hydro-dynamics and an increase in the water residence time. Euglenophytes have been observed in other euthrophic systems where they have been related to high nutrient lev-els and decreasing turbulence (Olly et al, 1996; Celik and
Ongun, 2007, Sebastiá et al., 2012). On the other hand, different chlorophytes are characteristic of brackish and polluted waters, and their distribution has been associ-ated to freshwater plume (Soler et al., 1995). Moreover, according to Ramirez et al., (2005) high DIN:DIP molar ratios enhance the development of chlorophytes. These conditions exist at Venecia Beach.
Phytoplankton community structure analyses based on the similarity of phytoplankton abundance among sta-tion groups showed a clear difference between stations located near the shoreline and the more distant stations. Furthermore, species richness is the simplest way to describe community diversity, and diversity indices have been used to determine spatial and temporal variations
51Thalassas, 29(1) · January 2013
Taxa % Np Av>0 Abundance total SUMMER AUTUMN WINTER SPRING
DINOFLAGELLATESAkashiwo sanguinea Hirasaka 5.6 45 360 40 40 80Alexandrium sp. 8.4 90 1080 40 40 40 200Centrodinium maximum Pavillard 1.4 40 80 80Ceratium candelabrum (Ehrenberg) Stein nCeratium extensum (Gourret) Cleve nCeratium euarcuatum E.G.Jørgensen 2.1 40 120 40Ceratium furca Ehrenberg 18.2 60 1560 40 40 40 160Ceratium fusus Ehrenberg 9.8 44 620 40 40 40 80Ceratium longirostrum Gourret 2.8 40 160 40 40Ceratium karstenii Pavillard (=C. arcuatum (Gourret 1883) Cleve 1900) 0.7 40 40 40Ceratium macroceros Ehrenber nCeratium trichoceros Ehrenber nCeratium tripos Müller 3.5 40 200 40 40Dinophysis caudata Saville-Kent 0.7 40 40 40Dinophysis sacculus Stein 0.7 40 40 40Diplopsalis sp. 4.9 57 400 120 240Gonyaulax sp. 3.5 56 280 80Gymnodinium spp. 53.8 174 13380 160 200 240 1200Gyrodinium sp. 16.8 93 2220 420 80 40 240Heterocapsa spp. 25.2 584 21040 20 80 40 2120Heterodinium dispar Kofoid & Adamson nKarenia sp. 2.1 53 160 80 40Noctilluca scintillans (Macartney) Kofoid & Swezy 10.5 82 1240 40 200Oxytoxum sp. 1.4 30 60 40Pentapharsodinium tyrrhenicum (Balech) Montresor, Zingone et Marino 13.3 101 1920 40 280Peridinium quinquecorne Abé nPodolampas spinifera Okamura 1.4 40 80 40Polykrikos kofoidii Chatton 0.7 40 40 40Prorocentrum lima (Ehrenberg,) Stein 6.3 58 520 120 40 80 40Prorocentrum micans Ehrenberg 21.7 87 2680 40 80 40 240Prorocentrum minimum (Pavillard) Schiller 7.7 49 540 80 80 40 40Prorocentrum triestinum Schiller 9.1 81 1060 20 40 280Prorocentrum sp. 2.1 53 160 120Protoperidinium claudicans (Paulsen ) Balech 1.4 40 80 40 40Protoperidinium crassipes (Kofoid) Balech 7 44 440 40 80Protoperidinium diabolus(Cleve) Balech 22.4 180 5760 80 560Protoperidinium divergens (Ehrenberg) Balech 2.8 40 160 40 40Protoperidinium leonis (Pavillard) Balech nProtoperidinium murrayi (Kofoid) Hernández-Becerril 0.7 40 40 40Protoperidinium punctulatum (Paulsen ) Balec 1.4 40 80 40Protoperidinium pyriforme (Paulsen) Balech 9.1 82 680 40 40 160Protoperidinium sphaericum (Murray & Whitting) Balech 4.9 51 360 40 80Protoperidinium steinii (Jørgensen ) Balec 0.7 20 20 20Protoperidinium sp. 4.9 43 300 20 40 40 80Pyrocystis elegans Pavillard 0.7 40 40 40Pyrophacus sp. 0.7 40 40 40Scrippsiella spp. 44.1 218 13760 160 200 1120 1960Spiraulax jollifei (Murray & Whitting) Kofoid 1.4 40 80 80Dynophyceae spp. 16.1 78 1800 680 120 80 80
Table 3a:Taxa found in the study area. % Np: percentage of total samples where the taxa was recorded; Av>0: averaged density (cells l-1). Abundance total: sum of cell abundance in all samples taken. Number indicates the maximum abundance in each season (cells l-1), n indicates that this species was found in a net sample.
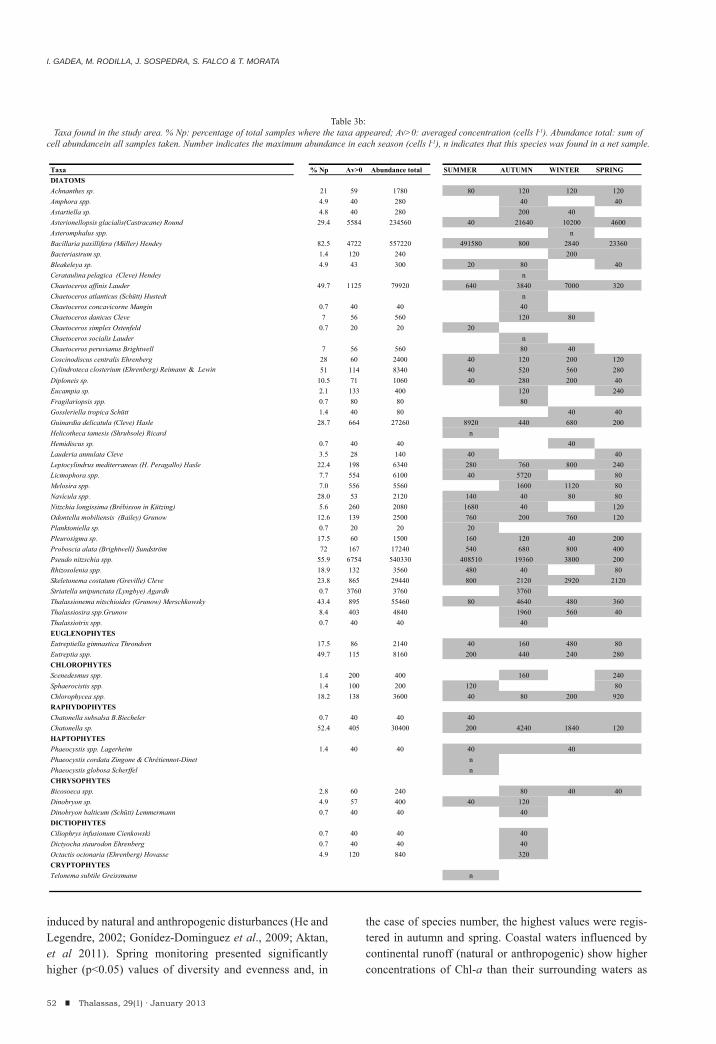
I. GADEA, M. RODILLA, J. SOSPEDRA, S. FALCO & T. MORATA
induced by natural and anthropogenic disturbances (He and Legendre, 2002; Gonídez-Dominguez et al., 2009; Aktan, et al 2011). Spring monitoring presented significantly higher (p<0.05) values of diversity and evenness and, in
the case of species number, the highest values were regis-tered in autumn and spring. Coastal waters influenced by continental runoff (natural or anthropogenic) show higher concentrations of Chl-a than their surrounding waters as
52 Thalassas, 29(1) · January 2013
Taxa % Np Av>0 Abundance total SUMMER AUTUMN WINTER SPRINGDIATOMSAchnanthes sp. 21 59 1780 80 120 120 120Amphora spp. 4.9 40 280 40 40Astartiella sp. 4.8 40 280 200 40Asterionellopsis glacialis(Castracane) Round 29.4 5584 234560 40 21640 10200 4600Asteromphalus spp. nBacillaria paxillifera (Müller) Hendey 82.5 4722 557220 491580 800 2840 23360Bacteriastrum sp. 1.4 120 240 200Bleakeleya sp. 4.9 43 300 20 80 40Cerataulina pelagica (Cleve) Hendey nChaetoceros affinis Lauder 49.7 1125 79920 640 3840 7000 320Chaetoceros atlanticus (Schütt) Hustedt nChaetoceros concavicorne Mangin 0.7 40 40 40Chaetoceros danicus Cleve 7 56 560 120 80Chaetoceros simplex Ostenfeld 0.7 20 20 20Chaetoceros socialis Lauder nChaetoceros peruvianus Brightwell 7 56 560 80 40Coscinodiscus centralis Ehrenberg 28 60 2400 40 120 200 120Cylindroteca closterium (Ehrenberg) Reimann & Lewin 51 114 8340 40 520 560 280Diploneis sp. 10.5 71 1060 40 280 200 40Eucampia sp. 2.1 133 400 120 240Fragilariopsis spp. 0.7 80 80 80Gossleriella tropica Schütt 1.4 40 80 40 40Guinardia delicatula (Cleve) Hasle 28.7 664 27260 8920 440 680 200Helicotheca tamesis (Shrubsole) Ricard nHemidiscus sp. 0.7 40 40 40Lauderia annulata Cleve 3.5 28 140 40 40Leptocylindrus mediterraneus (H. Peragallo) Hasle 22.4 198 6340 280 760 800 240Licmophora spp. 7.7 554 6100 40 5720 80Melosira spp. 7.0 556 5560 1600 1120 80Navícula spp. 28.0 53 2120 140 40 80 80Nitzchia longissima (Brébisson in Kützing) 5.6 260 2080 1680 40 120Odontella mobiliensis (Bailey) Grunow 12.6 139 2500 760 200 760 120Planktoniella sp. 0.7 20 20 20Pleurosigma sp. 17.5 60 1500 160 120 40 200Proboscia alata (Brightwell) Sundström 72 167 17240 540 680 800 400Pseudo nitzschia spp. 55.9 6754 540330 408510 19360 3800 200Rhizosolenia spp. 18.9 132 3560 480 40 80Skeletonema costatum (Greville) Cleve 23.8 865 29440 800 2120 2920 2120Striatella unipunctata (Lyngbye) Agardh 0.7 3760 3760 3760Thalassionema nitschioides (Grunow) Merschkowsky 43.4 895 55460 80 4640 480 360Thalassiosira spp.Grunow 8.4 403 4840 1960 560 40Thalassiotrix spp. 0.7 40 40 40EUGLENOPHYTESEutreptiella gimnastica Throndsen 17.5 86 2140 40 160 480 80Eutreptia spp. 49.7 115 8160 200 440 240 280CHLOROPHYTESScenedesmus spp. 1.4 200 400 160 240Sphaerocistis spp. 1.4 100 200 120 80Chlorophycea spp. 18.2 138 3600 40 80 200 920RAPHYDOPHYTESChatonella subsalsa B.Biecheler 0.7 40 40 40Chatonella sp. 52.4 405 30400 200 4240 1840 120HAPTOPHYTESPhaeocystis spp. Lagerheim 1.4 40 40 40 40Phaeocystis cordata Zingone & Chrétiennot-Dinet nPhaeocystis globosa Scherffel nCHRYSOPHYTESBicosoeca spp. 2.8 60 240 80 40 40Dinobryon sp. 4.9 57 400 40 120Dinobryon balticum (Schütt) Lemmermann 0.7 40 40 40DICTIOPHYTESCiliophrys infusionum Cienkowski 0.7 40 40 40Dictyocha staurodon Ehrenberg 0.7 40 40 40Octactis octonaria (Ehrenberg) Hovasse 4.9 120 840 320CRYPTOPHYTESTelonema subtile Greissmann n
Table 3b:Taxa found in the study area. % Np: percentage of total samples where the taxa appeared; Av>0: averaged concentration (cells l-1). Abundance total: sum of
cell abundancein all samples taken. Number indicates the maximum abundance in each season (cells l-1), n indicates that this species was found in a net sample.
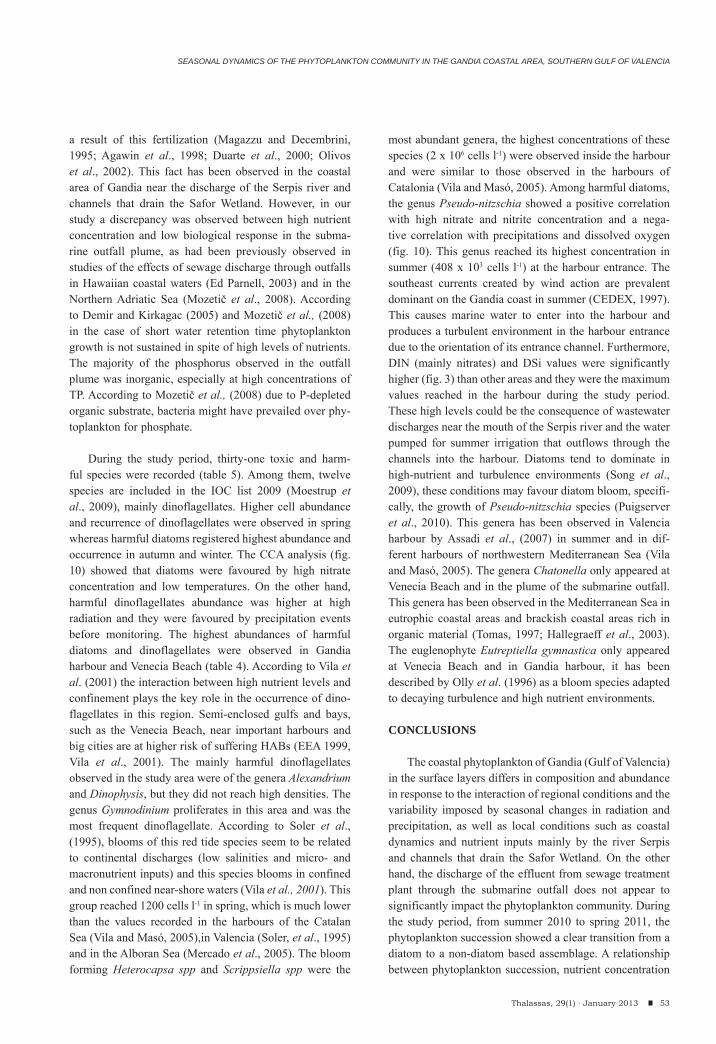
SEASONAL DYNAMICS OF THE PHYTOPLANKTON COMMUNITY IN THE GANDIA COASTAL AREA, SOUTHERN GULF OF VALENCIA
a result of this fertilization (Magazzu and Decembrini, 1995; Agawin et al., 1998; Duarte et al., 2000; Olivos et al., 2002). This fact has been observed in the coastal area of Gandia near the discharge of the Serpis river and channels that drain the Safor Wetland. However, in our study a discrepancy was observed between high nutrient concentration and low biological response in the subma-rine outfall plume, as had been previously observed in studies of the effects of sewage discharge through outfalls in Hawaiian coastal waters (Ed Parnell, 2003) and in the Northern Adriatic Sea (Mozetič et al., 2008). According to Demir and Kirkagac (2005) and Mozetič et al., (2008)in the case of short water retention time phytoplankton growth is not sustained in spite of high levels of nutrients. The majority of the phosphorus observed in the outfall plume was inorganic, especially at high concentrations of TP. According to Mozetič et al., (2008) due to P-depleted organic substrate, bacteria might have prevailed over phy-toplankton for phosphate.
During the study period, thirty-one toxic and harm-ful species were recorded (table 5). Among them, twelve species are included in the IOC list 2009 (Moestrup et al., 2009), mainly dinoflagellates. Higher cell abundance and recurrence of dinoflagellates were observed in spring whereas harmful diatoms registered highest abundance and occurrence in autumn and winter. The CCA analysis (fig. 10) showed that diatoms were favoured by high nitrate concentration and low temperatures. On the other hand, harmful dinoflagellates abundance was higher at high radiation and they were favoured by precipitation events before monitoring. The highest abundances of harmful diatoms and dinoflagellates were observed in Gandia harbour and Venecia Beach (table 4). According to Vila et al. (2001) the interaction between high nutrient levels and confinement plays the key role in the occurrence of dino-flagellates in this region. Semi-enclosed gulfs and bays, such as the Venecia Beach, near important harbours and big cities are at higher risk of suffering HABs (EEA 1999, Vila et al., 2001). The mainly harmful dinoflagellates observed in the study area were of the genera Alexandrium and Dinophysis, but they did not reach high densities. The genus Gymnodinium proliferates in this area and was the most frequent dinoflagellate. According to Soler et al., (1995), blooms of this red tide species seem to be related to continental discharges (low salinities and micro- and macronutrient inputs) and this species blooms in confined and non confined near-shore waters (Vila et al., 2001). This group reached 1200 cells l-1 in spring, which is much lower than the values recorded in the harbours of the Catalan Sea (Vila and Masó, 2005),in Valencia (Soler, et al., 1995) and in the Alboran Sea (Mercado et al., 2005). The bloom forming Heterocapsa spp and Scrippsiella spp were the
most abundant genera, the highest concentrations of these species (2 x 10⁶ cells l-1) were observed inside the harbour and were similar to those observed in the harbours of Catalonia (Vila and Masó, 2005). Among harmful diatoms, the genus Pseudo-nitzschia showed a positive correlation with high nitrate and nitrite concentration and a nega-tive correlation with precipitations and dissolved oxygen (fig. 10). This genus reached its highest concentration in summer (408 x 103 cells l-1) at the harbour entrance. The southeast currents created by wind action are prevalent dominant on the Gandia coast in summer (CEDEX, 1997). This causes marine water to enter into the harbour and produces a turbulent environment in the harbour entrance due to the orientation of its entrance channel. Furthermore, DIN (mainly nitrates) and DSi values were significantly higher (fig. 3) than other areas and they were the maximum values reached in the harbour during the study period. These high levels could be the consequence of wastewater discharges near the mouth of the Serpis river and the water pumped for summer irrigation that outflows through the channels into the harbour. Diatoms tend to dominate in high-nutrient and turbulence environments (Song et al., 2009), these conditions may favour diatom bloom, specifi-cally, the growth of Pseudo-nitzschia species (Puigserver et al., 2010). This genera has been observed in Valencia harbour by Assadi et al., (2007) in summer and in dif-ferent harbours of northwestern Mediterranean Sea (Vila and Masó, 2005). The genera Chatonella only appeared at Venecia Beach and in the plume of the submarine outfall. This genera has been observed in the Mediterranean Sea in eutrophic coastal areas and brackish coastal areas rich in organic material (Tomas, 1997; Hallegraeff et al., 2003). The euglenophyte Eutreptiella gymnastica only appeared at Venecia Beach and in Gandia harbour, it has been described by Olly et al. (1996) as a bloom species adapted to decaying turbulence and high nutrient environments.
CONCLUSIONS
The coastal phytoplankton of Gandia (Gulf of Valencia) in the surface layers differs in composition and abundance in response to the interaction of regional conditions and the variability imposed by seasonal changes in radiation and precipitation, as well as local conditions such as coastal dynamics and nutrient inputs mainly by the river Serpis and channels that drain the Safor Wetland. On the other hand, the discharge of the effluent from sewage treatment plant through the submarine outfall does not appear to significantly impact the phytoplankton community. During the study period, from summer 2010 to spring 2011, the phytoplankton succession showed a clear transition from a diatom to a non-diatom based assemblage. A relationship between phytoplankton succession, nutrient concentration
53Thalassas, 29(1) · January 2013
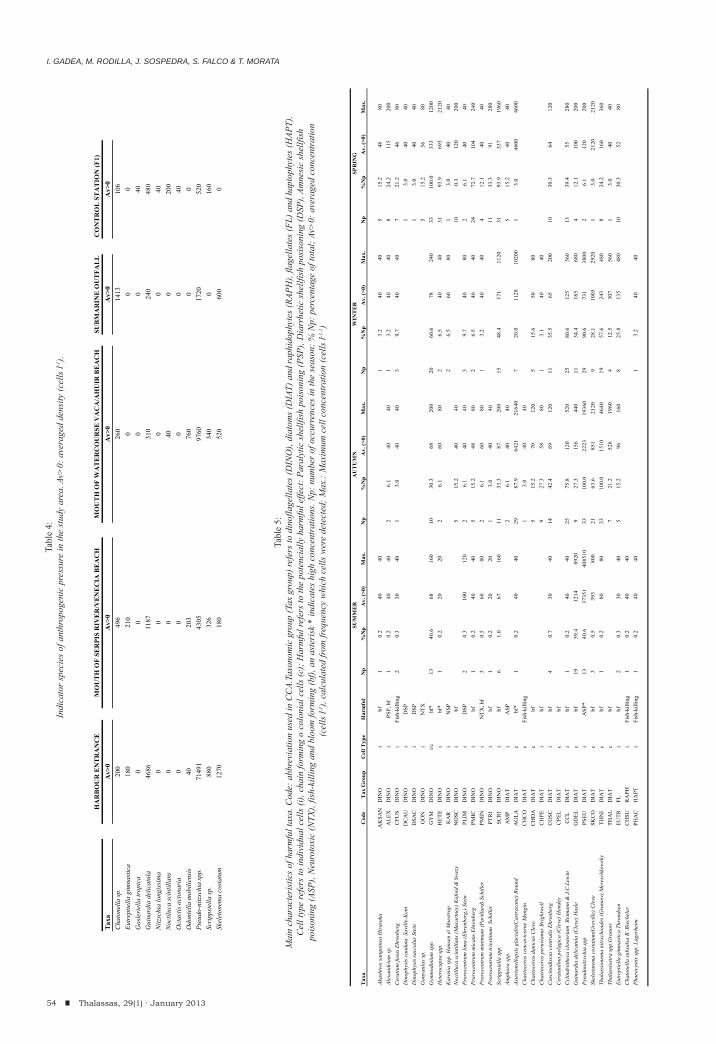
I. GADEA, M. RODILLA, J. SOSPEDRA, S. FALCO & T. MORATA
54 Thalassas, 29(1) · January 2013
Tax
aC
ode
Tax
Gro
upC
ell T
ype
Har
mfu
lN
p%
Np
Av.
(>0)
Max
.N
p%
Np
Av.
(>0)
Max
.N
p%
Np
Av.
(>0)
Max
.N
p%
Np
Av.
(>0)
Max
.
Akas
hiw
o sa
ngui
nea
Hir
asak
aA
KSA
ND
INO
ibf
10.
240
401
3.2
4040
515
.248
80Al
exan
driu
m s
p.
ALE
XD
INO
iPS
P, b
f1
0.2
4040
26.
140
401
3.2
4040
824
.211
520
0C
erat
ium
fusu
s Eh
renb
erg
CFU
SD
INO
iFi
sh-k
illin
g2
0.3
3040
13.
040
403
9.7
4040
721
.246
80D
inop
hysi
s ca
udat
a S
avill
e-K
ent
DC
AU
DIN
Oi
DSP
13.
040
40D
inop
hysi
s sa
ccul
us S
tein
DSA
CD
INO
iD
SP1
3.0
4040
Gon
yaul
ax s
p.G
ON
DIN
Oi
NT
X5
15.2
5680
Gym
nodi
nium
spp
.G
YM
DIN
Oi/c
bf*
1340
.668
160
1030
.368
200
2060
.678
240
3310
0.0
333
1200
Het
eroc
apsa
spp
.H
ETE
DIN
Oi
bf*
10.
220
202
6.1
6080
26.
540
4031
93.9
693
2120
Kar
enia
spp
. Han
sen
et M
oest
rup
KA
RD
INO
iN
SP2
6.5
6080
13.
040
40N
octil
luca
sci
ntill
ans
(Mac
artn
ey) K
ofoi
d &
Sw
ezy
NO
SCD
INO
ibf
515
.240
4010
0.3
120
200
Pror
ocen
trum
lim
a (E
hren
berg
,) St
ein
PLIM
DIN
Oi
DSP
20.
310
012
02
6.1
4040
39.
740
802
6.1
4040
Pror
ocen
trum
mic
ans
Ehre
nber
gPM
ICD
INO
ibf
10.
240
405
15.2
4880
26.
540
4024
72.7
104
240
Pror
ocen
trum
min
imum
(Pav
illar
d) S
chill
erPM
IND
INO
iN
TX
, bf
30.
560
802
6.1
6080
13.
240
404
12.1
4040
Pror
ocen
trum
trie
stin
um S
chill
erPT
RI
DIN
Oi
bf1
0.2
2020
13.
040
4011
33.3
9128
0Sc
ripp
siel
la s
pp.
SCR
ID
INO
ibf
61.
067
160
1133
.387
200
1548
.417
111
2031
93.9
337
1960
Amph
ora
spp.
AM
PD
IAT
iA
SP2
6.1
4040
515
.240
40As
teri
onel
lops
is g
laci
alis
(Cas
trac
ane)
Rou
ndA
GLA
DIA
Tc
bf*
10.
240
4029
87.9
6421
2164
07
20.0
1128
1020
01
3.0
4600
4600
Cha
etoc
eros
con
cavi
corn
e M
angi
nC
HC
OD
IAT
cFi
sh-k
illin
g1
3.0
4040
Cha
etoc
eros
dan
icus
Cle
veC
HD
AD
IAT
cbf
515
.270
120
515
.650
80C
haet
ocer
os p
eruv
ianu
s Br
ight
wel
lC
HPE
DIA
Ti
bf9
27.3
5880
13.
140
40C
osci
nodi
scus
cen
tral
is E
hren
berg
CO
SCD
IAT
ibf
40.
730
4014
42.4
6912
011
35.5
6520
010
30.3
6412
0C
erat
aulin
a pe
lagi
ca (C
leve
) Hen
dey
CPE
LD
IAT
cbf
Cyl
indr
othe
ca c
lost
eriu
m R
eim
ann
& J
.C.L
ewin
CC
LD
IAT
ibf
10.
240
4025
75.8
120
520
2580
.612
556
013
39.4
5528
0G
uina
rdia
del
icat
ula
(Cle
ve) H
asle
GD
ELD
IAT
cbf
1959
.412
1489
209
27.3
156
440
1134
.418
568
04
12.1
100
200
Pseu
doni
tzsc
hia
spp.
PSEU
DIA
Ti
ASP
*13
40.6
3735
140
8510
3310
0.0
2223
1936
029
90.6
731
3800
26.
112
020
0Sk
elet
onem
a co
stat
um(G
revi
lle) C
leve
SKC
OD
IAT
cbf
30.
539
380
021
63.6
851
2120
928
.110
0529
201
3.0
2120
2120
Thal
assi
onem
a ni
tzxc
hioi
des
(Gru
now
) Mer
esch
kow
sky
THN
ID
IAT
cbf
10.
280
8033
100.
015
1046
4019
57.6
243
480
824
.216
036
0Th
alas
sios
ira
spp.
Gru
now
THA
LD
IAT
cbf
721
.252
619
604
12.5
307
560
13.
040
40Eu
trep
tiella
gim
nast
ica
Thro
ndse
nEU
TRFL
ibf
20.
330
405
15.2
9616
08
25.8
135
480
1030
.352
80C
hato
nella
sub
sals
a B.
Bie
chel
erC
HSU
RA
PHi
Fish
-kill
ing
10.
240
40Ph
aeoc
ystis
spp
. Lag
erhe
imPH
AC
HA
PTi
Fish
-kill
ing
10.
240
401
3.2
4040
AU
TU
MN
WIN
TE
RSP
RIN
GSU
MM
ER
Tabl
e 5:
Mai
n ch
arac
teri
stic
s of
har
mfu
l tax
a. C
ode:
abb
revi
atio
n us
ed in
CC
A.Ta
xono
mic
gro
up (T
ax g
roup
) ref
ers
to d
inof
lage
llate
s (D
INO
), di
atom
s (D
IAT)
and
rap
hido
phyt
es (R
APH
), fla
gella
tes
(FL)
and
hap
toph
ytes
(HAP
T).
Cel
l typ
e re
fers
to in
divi
dual
cel
ls (i
), ch
ain
form
ing
o co
loni
al c
ells
(c);
Har
mfu
l ref
ers
to th
e po
tenc
ially
har
mfu
l effe
ct: P
aral
ytic
she
llfis
h po
ison
ing
(PSP
), D
iarr
hetic
she
llfis
h po
siso
ning
(DSP
), Am
nesi
c sh
ellfi
sh
pois
onin
g (A
SP),
Neu
roto
xic
(NTX
), fis
h-ki
lling
and
blo
om fo
rmin
g (b
f), a
n as
teri
sk *
indi
cate
s hi
gh c
once
ntra
tions
. Np:
num
ber
of o
ccur
renc
es in
the
seas
on; %
Np:
per
cent
age
of to
tal;
Av>
0: a
vera
ged
conc
entr
atio
n (c
ells
l-1),
calc
ulat
ed fr
om fr
eque
ncy
whi
ch c
ells
wer
e de
tect
ed; M
ax.:
Max
imum
cel
l con
cent
ratio
n (c
ells
l-1-1)
HA
RB
OU
R E
NT
RA
NC
EM
OU
TH
OF
SER
PIS
RIV
ER
/VEN
EC
IA B
EAC
HM
OU
TH
OF
WA
TE
RC
OU
RSE
VA
CA
/AH
UIR
BEA
CH
SUB
MA
RIN
E O
UT
FAL
LC
ON
TRO
L ST
AT
ION
(F1)
Taxa
Av>
0A
v>0
Av>
0A
v>0
Av>
0C
hato
nella
sp.
200
496
260
1413
106
Eutr
eptie
lla g
imna
stic
a18
021
00
00
Gos
leri
ella
trop
ica
00
00
40G
uina
rdia
del
icat
ula
4686
1187
310
240
480
Nitz
schi
a lo
ngis
sim
a0
00
040
Noc
tiluc
a sc
intil
lans
00
400
200
Oct
actis
oct
onar
ia0
00
040
Odo
ntel
la m
obili
ensi
s40
203
760
00
Pseu
do-n
itzsc
hia
spp.
7149
143
0597
6017
2052
0Sc
ripp
siel
la sp
.88
032
634
00
160
Skel
eton
ema
cost
atum
1270
180
520
600
0
Tabl
e 4:
Indi
cato
r sp
ecie
s of
ant
hrop
ogen
ic p
ress
ure
in th
e st
udy
area
. Av>
0: a
vera
ged
dens
ity (c
ells
l-1).

SEASONAL DYNAMICS OF THE PHYTOPLANKTON COMMUNITY IN THE GANDIA COASTAL AREA, SOUTHERN GULF OF VALENCIA
and nutrient ratios seemed to exist. In the dry winter, high values of TP and Chl-a could indicate a last winter bloom.In spring, a dinoflagellate bloom was observed when there was high radiation, very low DIP, high DIN:DIP and low DSi:DIN molar ratios, during the period of phosphorus fertilizer application in the crops of the Safor Wetland.The inputs of phosphorus from agriculture seem to have a sig-nificant response in the phytoplankton community.Gandia Harbour and Venecia Beach are areas with high risk of suffering HABs, as a consequence of the continous nutrient inputs from agriculture and wastewater discharges and the reduced water exchange (high water residence time).
ACKNOWLEDGEMENTS
Financial support for this research was provided by Ministry of Education, Culture and Sport, Government of Spain, through the Training Program for University Teachers (FPU). We would like to express our deepest thanks to Margarita Fernández and Vanessa Castan of IRTA (Research Institute of Technology, food and Agriculture).
REFERENCES
Agawin NS, Duarte CM, Agustí S(1998). Growth and abundance of Synechococcus sp. in a Mediterranean Bay: Seasonality and relationships with temperature, Marine Ecology Progress Series, 170: 45-53
Aktan Y, Tüfekçi V, Tüfekçi H, Aykulu G (2005). Distribution patterns, biomass estimates and diversity of phytoplankton in Izmit Bay (Turkey), Estuarine, Coastal and Shelf Science, 64(2-3): 372-384.
Aktan Y (2011). Large-scale patterns in summer surface water phyto-plankton (except picophytoplankton) in the Eastern Mediterranean. Estuarine, Coastal and Shelf Science, 91:551-558.
Aminot A, Chaussepied M (1983). Manuel des analyses chimiques en milieu marin, Centre National pour l’Explotation des Oceans, Brest, 396.
Andersen P, Throndsen J (2003). Estimating cell numbers, in: Hallegraeff, G.M.; Anderson, D.M.; Cembella, A.D. (Ed.)
(2003). Manual on harmful marine microalgae. Monographs on Oceanographic Methodology, 11. UNESCO Publishing, Paris, France, 793.
Anderson DM(2009). Approaches to monitoring, control and man-agement of harmful algal blooms (HAB’s), Ocean and Coastal Management, 52:342-347.
APHA (2005). Standard methods for the examination of water wastewater, 21th edition,American Public Health Association, American Water Works Association, Water Environment Federation, Washington.
Assadi C, Tasso V, García A.M (2007). Progress and trends in phytoplankton and biotoxins: In Javier Gilabert, Universidad Politécnica de Cartagena: Actas de la IX Reunión Ibérica sobre Fitoplancton Tóxico y Biotoxinas, Cartagena, 2008, 87-92.
Ballesteros-Navarro BJ (2003). Estado y evolución de los procesos de intrusión marina en la unidad hidrogeológica 08.38. Plana de Gandia-Denia (Valencia-Alicante, España), In: Lopez Geta JA, de la Orden JA, Gómez JD, Ramos G, Mejías M, Rodríguez L, Ed., Tecnología de la intrusión de agua de mar en acuíferos costeros: países mediterráneos. IGME, Madrid, p. 585-595.
Barría MS,Piccolo MC (2008). Presencia y variación estacional del dinoflagelado heterótrofo gyrodinium fusus (meunier) akselman en el estuario de Bahia Blanca, Argentina ,Atlantica, Rio Grande, 30(136 2) 129-137.
Beman J, Arrigo K, Matson P(2005). Agricultural runoff fuels large phytoplankton blooms in vulnerable areas of the ocean, Nature, 434: 211-214.
Brito A, Newton A, Tett P, Fernandes T (2010) Sediment-water interactions in a coastal shallow lagoon, Ria Formosa (Portugal): Implications within the Water Framewor Directive, Journal of Environmental Monitoring, 12: 318-328.
Caroppo C(2000). The contribution of picophytoplankton to com-munity structure in a Mediterranean brackish environment, Journal of Plankton Research, 22: 381-397.
Caroppo C, Turicchia S, Margheri MC(2006). Phytoplankton assemblages in coastal waters of the northern Ionian Sea (eastern Mediterranean), with special reference to cyano-bacteria, Journal of the Marine Biological Association of the
55Thalassas, 29(1) · January 2013
Table 6:Rank Spearman’s correlation matrix between phytoplankton groups and environmental variables.
I. GADEA, M. RODILLA, J. SOSPEDRA, S. FALCO & T. MORATA
56 Thalassas, 29(1) · January 2013
United Kingdom, 86: 927-937.CEDEX (1997). Atlas de Clima Maritimo. Dpto. Clima Maritimo
(Puertos del Estado). Centro de estudios de Puertos y Costas.Celik K., Ongun T(2007). The relationships between certain
physical and chemical variables and the seasonal dynamics of phytoplankton assemblages of two inlets of a shallow hyper-trophic lake with different nutrient inputs, Environmental Physiology & Biochemistry, 124: 321-330.
CHJ-Confederación Hidrográfica del Jucar (2005). Informe para la Comision Europea sobre los artículos 5 y 6 de la Directiva Marco del Agua. Demarcacion Hidrográfica del Júcar, Ministerio de Medio Ambiente. Valencia,528 pp
Cloern JE(1996). Phytoplankton bloom dynamics in coastal eco-systems: A review with some general lessons from sustained investigation of San Francisco Bay, California, Reviews of Geophysics, 34: 127-168.
Cloern JE(2001). Our evolving conceptual model of the coastal eutrophication problem, Marine Ecology Progress, 210: 223-253.
Conley DJ (2002). Terrestrial ecosystems and the global bio-geochemical silica cycle, Global Biogeochemical Cycles, 16(4):1121
Conley DJ, Paerl HW, Howarth RW, Boesch DF, Seitzinger SP, Havens KE, Lancelot C, Likens GE(2009). Controlling eutrophication: nitrogen and phosphorus,Science, 323: 1014-1015.
Conley DJ(2000). Biogeochemical nutrient cycles and nutrient management strategies, Hydrobiologia, 410: 87-96.
Choudhury A, Pal R (2010). Phytoplankton and nutrient dynamics of shallow coastal stations at Bay of Bengal, Eastern Indian coast, Aquatic Ecology, 44(1): 55-71.
Cugier P, Billen G, Guillaud JF, Garnier J, Menesguen A (2005). Modelling the eutrophication of the Seine Bight (France) under historical, present and future riverine nutrient loading, Journal of Hydrology, 304: 381-396.
Cruzado A, Velásquez A (1990). Nutrients and phytoplankton in the Gulf of Lions, northwestern Mediterranean, Continental Shelf Research, 10:931-942.
Demir N, Kirkagac MU (2005).Plankton composition and water quality in a pond of spring origin in Turkey, Limnology, 6(3): 89-194.
Denis-KarafistanA, Martin JM, Minas H, Brasseur P, Nihoul J, Denis C(1998). Space and seasonal distributions of nitrates in the Mediterranean Sea derived from a variational inverse model. Deep-Sea Research I, 45: 387-408.
Domingues, RB, Barbosa A, Galvao H(2005). Nutrients, light and phytoplankton succession in a temperate estuary (the Guadiana, south-western Iberia). Estuarine, Coastal and Shelf Science, 64: 249-260.
Domingues RB, Anselmo TP, Barbosa AB, Somme, U, Galvão HM(2011). Nutrient limitation of phytoplankton growth in the freshwater tidal zone of a turbid, Mediterranean estuary, Estuarine, Coastal and Shelf Science, 91: 282-297.
Duarte CM, Agusti S, Kennedy H, Vaqué D (1999). The
Mediterranean climate as a template for the Mediterranean marine ecosystem: the example of NE spanish litoral, Marine Ecology Progress series, 44: 245-270.
Duarte CM, Agusti S, Agawin N.S, (2000). Response of Mediterranean phytoplancton community to increased nutri-ent inputs: a mesocosm experiment, Marine Ecology Progress Series, 195: 61-70.
Drira Z, Hamza A, Bel Hassen M, Ayadi H, Bouain, A, Aleya, L(2010). Coupling of phytoplankton community structure to nutrients, ciliates and copepods in the Gulf of Gabés (south Ionian Se, Tunisia). Journal of the Marine Biological Association of the United Kingdom, 90: 1203-1215.
Ed Parnell P(2003). The effects of sewage discharge on water quality and phytoplankton of Hawaiian coastal waters, Marine Environmental Research, 5: 293-311.
EEA (European Environment Agency (1999). State and pres-sures of the marine and coastal Mediterranean environment. Environmental Assessment Series, 5 137 pp.
Falco S, Niencheski LF, Rodilla M, Romero I, González del Río J, Sierra JP, Mösso C (2010). Nutrient flux and budget in the Ebro estuary. Estuarine Coastal Shelf Science, 87:92-102.
Figueiras FG, Pitcher GC, Estrada M(2006). Harmful algal bloom dynamics in relation to physical proceses. In Granéli, E & J. T. Turner (eds), Ecology of Harmful Algae. Ecological Studies 189. Springer-Verlag, Berlin,127-138.
Fisher TR, Gustafson AB, Sellner K, Lacoutre R, Haas LW, Wetzel RL, Magnien R, Everitt D, Michaels B. Karrh R.,1999. Spatial and temporal variation of resource limitation in Chesapeake Bay, Marine Biology, 133: 763-778.
Garófano V, Martínez F, Delgado R(2009). Les riberes del Serpis. Gestio de l’aigua per a la seua conservació, Ed. CEIC Alfons El Vell, Gandia, Valencia, 206 pp.
Garófano V, Martínez F,Peredo M, Olaya EJ, Muñoz R, Soares RM, Pinar JL(2011). Assessing hydromorphological and floristic patterns along aregulated Mediterranean river: The Serpis River (Spain). Limnetica, 30 (2): 307-328.
Glé C, Del Amo Y, Sautour B, Laborde P, Chardy P (2008). Variability of nutrients and phytoplankton primary production in a shallow macrotidal coastal ecosystem (Arcachon Bay, France), Estuarine, Coastal and Shelf Science, 76:642-656.
Gobler, CJ, Buck NJ, Sieracki ME, Sañudo-Wilhelmy SA (2006). Nitrogen and silicon limitation of phytoplankton communities across an urban estuary: the East River-Long Island Sound system, Estuarine, Coastal and Shelf Science, 68: 127-138.
Gonídez E, Freire J, Franco C, González G (2009). Descomposing diversity patterns of a soft-bottom macroinvertebrate com-munity in the tropical Eastern Pacific Journal of the Marine Biological Association of the United Kingdom, 89 (1): 31-38.
Granata T, Estrada M, Zika U, Merry C (2004). Evidence for enhanced primary production resulting from relative vorticity induced upwelling in the Catalan Current, Science Marine, 68(S1): 113-119.
Hallegraeff GM, Anderson DM, Cembella AD (2003). Manual on Harmful Marine Microalgae, Unesco publishing, France,
SEASONAL DYNAMICS OF THE PHYTOPLANKTON COMMUNITY IN THE GANDIA COASTAL AREA, SOUTHERN GULF OF VALENCIA
57Thalassas, 29(1) · January 2013
511-522.Harris GP(1994). Pattern, process and prediction in aquatic
ecology. A limnological view of some general ecological problems,Freshwater Biology, 32 (1): 143-460
He F, Legendre P(2002). Species diversity pattern derived from species-area models. Ecology, 52: 577-586.
Jeong HJ (1994). Predation by the heterotrophic dinoflagellate Protoperidinium cf. divergens on copepod eggs and early naupliar stages. Marine. Ecology Progress Series, 114:203-208.
Jeong HJ (1999). The ecological roles of heterotrophic dino-flagellates in marine planktonic community. Journal of EukaryoticMicrobiology, 46(4):390-396.
Justic D, Rabalais NN, Turner RE, Dortch Q(1995). Changes in nutrient structureof river dominated coastal waters: stoi-chiometric nutrient balance and itsconsequences, Estuarine, Coastal and Shelf Science, 40: 339-356.
Kumar A, Pal R (2010).Phytoplankton and nutrient dynamics of shallow coastal stations at Bay of Bengal, Eastern Indian coast. Aquatic Ecology, 44: 55-71.
Lèvy M, Memery L, AndreJ.M (1998a). Simulation ofprimary pro-duction and export fluxes in the Northwestern Mediterranean Sea, Journal of Marine Research 56, 197-238.
Lèvy M, Memery L, Madec G(1998b). The onset of a bloom after deep winter convection in the northwestern Mediterranean sea: mesoscale process study with a primitive equation model, Journal of Marine Research, 16 (1-2): 7-21.
Li WKW, Zohary T, Yacobi YZ, Wood AM(1993). Ultraplankton in the eastern Mediterranean Sea: towards deriving phyto-plankton biomass from flow cytometric measurements of abundance, fluorescence and light scatter, Marine Ecology Progress Series, 102: 79-87
Ludwig W, Dumont E, Meybeck M, Heussner S (2009). Riverdischargesof water andnutrientsto the Mediterranean and Black Sea: major drivers for ecosystem changes during past and futures decades?, Progress in Oceanography, 80: 199-217.
Magazzu G, Decembrini F (1995). Primary production, biomass and abundance of phototrophic picoplankton in the Mediterranean Sea: a review,Aquatic Microbial Ecology, 9: 97-104.
Mercado J M (2005). Seasonal and interannual varibability of the phytoplankton communities in an upwelling area of the Alborán sea (SW Mediterranean Sea), Scientia Marina 69(4):451-465.
Moestrup Ø, Akselman R, Cronberg G, Elbraechter M, Fraga S, Halim Y, Hansen G, Hoppenrath M, Larsen J., Lundholm N, Nguyen LN, Zingone A (Eds) (2009 onwards). IOC-UNESCO Taxonomic Reference List of Harmful Micro Algae. Available online at http://www.marinespecies.org/HAB. Accessed on 2012-05-16
Mozetič P, Malačič V, Turk V (2008). A case study of sewage discharge in the shallow coastal area of the Northern Adriatic Sea (Gulf of Trieste), Marine Ecology, 29: 483-494.
Newton A, Icely JD, Falcao M, Nobre A, Nunues JP, Ferreira JG, Vale C (2003). Evaluation of the eutrophication in the
Ria Formosa coastal lagoon, Portugal, Continental Shelf Research, 23: 1945-1961.
Olly K, Heiskanen AS, Seppala J(1996).Development and fate of Eutreptiella gymnastica bloom in nutrient-enriched enclo-sures in the coastal Baltic Sea, Journal of Plankton Research, 18 (9): 1587-1604
Olivos A, Masó M, Camp J (2002). Continental runoff of nutri-ents and their possible influence over stoichiometric ratios (DIN:P:Si) in the northeastern Mediterranean waters of Spain (Catalan Sea). Aportes continentales de nutrientes y su posible influencia sobre las relaciones estequiométricas (DIN:P:Si) en las aguas del noreste del Mediterráneo español (Mar Catalán), Ciencias Marinas, 28:393-406.
Owens NJP, Rees AP, Woodward EMS, Mantura RFC (1989). Size-fractionated primary production and nitrogen assimilationin the north-western Mediterranean Sea during January 1989, Water Pollution Research Reports, 13: 126-135
Paerl HW (2009). Controlling eutrophication along the freshwa-ter-marine continuum: dual nutrient (N and P) reductions are essential, Estuaries and Coasts, 32: 593-601.
Polat S (2001). Nutrients, Cholophyll a and Phytoplankton in the Iskenderun Bay (Norheastern Mediterranean), Marine Ecology, 23(2): 115-126.
Puigserver M, Monerris N, Pablo J, Alós J, Moyà G (2010). Abundance patterns of the toxic phytoplankton in coastal waters of the Balearic Archipelago (NW Mediterranean Sea): A multivariate approach,Hydrobiologia, 644: 145-157.
Ramírez T, Cortés D, Mercado JM, Vargas-Yañez M, Sebastián M, Liger E (2005). Seasonal dynamics of inorganic nutrients and phytoplankton biomass in the NW Alboran Sea, Estuarine, Coastal and Shelf Science, 65:654-670.
Rocha C, Galvão H, Barbosa A (2002).Role of transient silicon limitation in the development of cyanobacteria blooms in theGuadianaestuary, south-western Iberia,Marine Ecology Progress Series, 228:35-45.
Ribera d’Alcalà M, Conversano F, Corato F, Licandro P, Mangoni O, Marino D, Mazzocchi MG, Modigh M, Montresor M, Nardella M, Saggiomo, V, Sarno D, Zingone A(2004). Seasonal patterns in plankton communities in pluriannual time series at a coastal Mediterranean site (Gulf of Naples): An attempt to discern recurrences and trends,Scientia marina, 68:65-83.
Rodrigo MA, Rojo C, Armengol X (2003).Plankton biodiversity in a landscape of shallow water bodies (Mediterranean coast, Spain), Hydrobiologia, 506-509: 317-326.
Ryther JH, Dunstan WM(1971). Nitrogen, phosphorus, and eutrophication in the coastal marine environment, Science, 171:1008-1013.
Schindler DW (1977). Evolution of phosphorus limitation in lakes, Science, 195: 260-262.
Sebastiá MT, Rodilla M, Sanchis JA, Altur V, GadeaI, Falco S (2012). Influence of nutrient inputs from a wetland dominated by agriculture on the phytoplankton community in a shallow harbour at the Spanish Mediterranean coast. Agriculture,
I. GADEA, M. RODILLA, J. SOSPEDRA, S. FALCO & T. MORATA
58 Thalassas, 29(1) · January 2013
Ecosystems & Environment, 152: 10-20.Siokou-Frangou I, Christaki U, Mazzocini MG, Montresor M,
Ribera d’Alclà M, Vaqué D, Zingone A (2010). Plankton in the open Mediterranean Sea: a review, Biogeoscience, 7:1543-1586.
Smayda TJ(1997). Harmful algal blooms: Their ecophysiology and general relevance to phytoplankton blooms in the sea. Limnology and Oceanography, 42: 1137-1151.
Smith VH (2006). Responses of estuarine and coastal marine phytoplankton to nitrogen and phosphorus enrichment, Limnology Oceanograpy Journal, 51 (2):377-384.
Soler Torres E, Del Rio JG(1995). Spatial variations of phy-toplankton community structure in a highly eutrophicated coast of the Western Mediterranean Sea, Water Science and Technology, 32:313-322.
Sterner RW(2008). On the phosphorus limitation paradigm for lakes, International Review of Hydrobiology, 93: 433-445.
Stoecker D, Tillmann U, Granéli E (2006). Phagotrophy in harm-ful algae. In Granéli, E & J. T. Turner (eds), Ecologty of Harmful Algae. Ecological Studies 189. Springer-Verlag, Berlin, 177-187.
Song X, Liangmin H, Jianlin Z, Honghui H, Tao L, Qiang S (2009). Harmful algal blooms (HABs) in Daya Bay, China: An in situ study of primaryproduction and environmental impacts,Marine Pollution Bulletin 58: 1310-1318
Throndsen J (1978). In: Sournia, A. (Ed), Phytoplankton manual,
UNESCO, Paris, 69-74.Tomas C (1997). Identifying marine phytoplankton. Carmelo R
Tomas. Academic Press, Inc.Florida,858.Torres JA, Quesada M(2004).Informática Médica. Asociación
entre dos variables. Variables cuantitativas y coeficientes de correlación. Editorial ECIMED. Cuba. 260-262.
Travers M (1974). Inventaire des protistes du Golfe de Marseille et de ses parages,Annales de l’Institut Oceanographique, Paris, 360:59-62.
Utermohl H (1958). Zur wervollkommung der quantitative phyto-plankton methodic. Mitteilungen-Internationale Vereininung für theoretische und angewandte, Limnology, 9:1-38.
Vila M, Camp J, Garcés E, Masó M, Delgado M (2001). High resolution spatio-temporal detection of potentially harmful dinoflagellates in confined waters of the NW Mediterranean, Journal of plankton research, 23 (5): 497-514.
Vila M, Masó M(2005). Phytoplankton functional groups and harmful algal species in anthropogenically impacted waters of the NW Mediterranean Sea,Scientia Marina, 69: 31-45.
Yilmaz A, Barstük Ö, Saydam C, Edige D, Yilmaz K, Hatipoglu E(1992). Eutrophication in Iskenderum Bay, Northeastern Mediterranean. Science of the Total Environment, Supplement: 705-717.
Yin K, Quian PY, Wu MCS, Chen JC, Huang L, Song X, Jian W(2001).Shift from P to N limitation of phytoplankton bio-mass across the Pearl River estuarine plume during summer,
(Received: June 6, 2012; Accepted: November, 7, 2012)

SEASLUGS (Mollusca: Opisthobranchia) FROM CAMPECHE BANK, YUCATAN PENINSULA, MEXICO
(1) UMDI-Sisal, Facultad de Ciencias, Universidad Nacional Autónoma de México. Apartado postal 70-153, C.P. 04510, Mexico, D.F. (2) Universidade Lusófona de Humanidades e Tecnologias, Av. do Campo Grande, 376 1749-024, Lisboa, Portugal.
* [email protected], [email protected], [email protected]
Thalassas, 29(1) · January 2013: 59-75An International Journal of Marine Sciences
Key words: Opisthobranchs, Mexico, Biodiversity, Biogeography, Mollusks, Campeche bank, Yucatan.
Palabras clave: Opistobranquios, México, Biodiversidad, Biogeografía, Moluscos, Banco de Campeche, Yucatán.
DENEB ORTIGOSA(1,*), NUNO SIMÕES(1) & GONÇALO CALADO(2)
59Thalassas, 29(1) · January 2013
ABSTRACT
Little is known about the seaslugs in the Mexican coast of the Gulf of Mexico and almost all the species reported are either large or have a well-developed calcareous shell. Through specific sampling methods focused in opisthobranchs fauna, in two lagoons and three coral reefs of the Campeche Bank, Yucatan Peninsula, we have recorded 51 species belonging to the clades Cephalaspidea, Aplysiomorpha, Sacoglossa, Eutenidiacea, and Cladobranchia. Of these, 30 species had not been previously reported for the Campeche Bank and 20 out of those are new records for the Atlantic coast of Mexico. The nudibranch Tambja cf. tenuilineata could be the first record for the east coast of the Atlantic Ocean. With this study, the actual number of opistho-branch fauna in the Campeche Bank are 84 species.
RESUMEN (Opistobranquios del banco de Campeche, Península de Yucatán, México)
Se sabe poco sobre los opistobranquios de la costa mexicana del Golfo de México y la mayoría de las especies reportadas son especies con conchas grandes o bien desarrolladas. A través de muestreos dirigidos específicamente a la fauna de opisto-branquios realizados en dos lagunas y en tres arrecifes del Banco de Campeche, península de Yucatán, se reportan 51 especies pertenecientes a los Clados Cephalaspidea, Aplysiomorpha, Sacoglossa, Eutenidiacea y Cladobranchia. De estos, 30 especies son nuevos registros para el Banco de Campeche y 20 de ellos son nuevos registros para la costa Atlántica de México. El nudibranquio Tambja cf. tenuilineata podría ser el primer registro de esta especie para la costa Este del océano Atlántico. Con las aportaciones del presente trabajo, se acumula un total de 84 especies de opistobranquios en el Banco de Campeche.
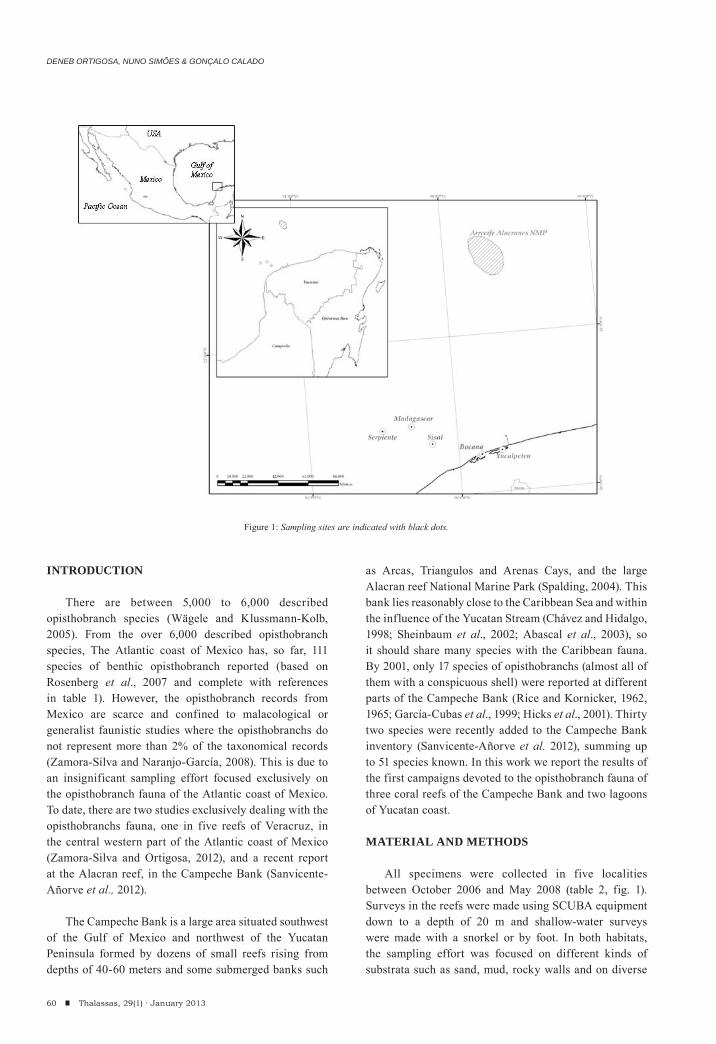
DENEB ORTIGOSA, NUNO SIMÕES & GONÇALO CALADO
INTRODUCTION
There are between 5,000 to 6,000 described opisthobranch species (Wägele and Klussmann-Kolb, 2005). From the over 6,000 described opisthobranch species, The Atlantic coast of Mexico has, so far, 111 species of benthic opisthobranch reported (based on Rosenberg et al., 2007 and complete with references in table 1). However, the opisthobranch records from Mexico are scarce and confined to malacological or generalist faunistic studies where the opisthobranchs do not represent more than 2% of the taxonomical records (Zamora-Silva and Naranjo-García, 2008). This is due to an insignificant sampling effort focused exclusively on the opisthobranch fauna of the Atlantic coast of Mexico. To date, there are two studies exclusively dealing with the opisthobranchs fauna, one in five reefs of Veracruz, in the central western part of the Atlantic coast of Mexico (Zamora-Silva and Ortigosa, 2012), and a recent report at the Alacran reef, in the Campeche Bank (Sanvicente-Añorve et al., 2012).
The Campeche Bank is a large area situated southwest of the Gulf of Mexico and northwest of the Yucatan Peninsula formed by dozens of small reefs rising from depths of 40-60 meters and some submerged banks such
as Arcas, Triangulos and Arenas Cays, and the large Alacran reef National Marine Park (Spalding, 2004). This bank lies reasonably close to the Caribbean Sea and within the influence of the Yucatan Stream (Chávez and Hidalgo, 1998; Sheinbaum et al., 2002; Abascal et al., 2003), so it should share many species with the Caribbean fauna. By 2001, only 17 species of opisthobranchs (almost all of them with a conspicuous shell) were reported at different parts of the Campeche Bank (Rice and Kornicker, 1962, 1965; García-Cubas et al., 1999; Hicks et al., 2001). Thirty two species were recently added to the Campeche Bank inventory (Sanvicente-Añorve et al. 2012), summing up to 51 species known. In this work we report the results of the first campaigns devoted to the opisthobranch fauna of three coral reefs of the Campeche Bank and two lagoons of Yucatan coast.
MATERIAL AND METHODS
All specimens were collected in five localities between October 2006 and May 2008 (table 2, fig. 1). Surveys in the reefs were made using SCUBA equipment down to a depth of 20 m and shallow-water surveys were made with a snorkel or by foot. In both habitats, the sampling effort was focused on different kinds of substrata such as sand, mud, rocky walls and on diverse
60 Thalassas, 29(1) · January 2013
Figure 1: Sampling sites are indicated with black dots.
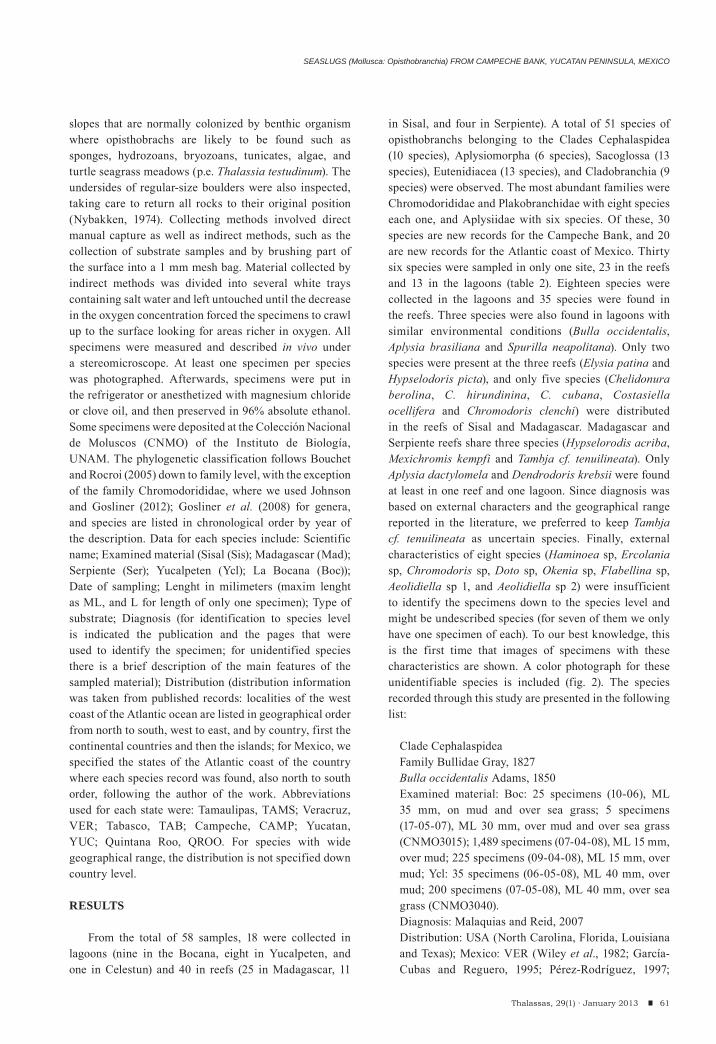
SEASLUGS (Mollusca: Opisthobranchia) FROM CAMPECHE BANK, YUCATAN PENINSULA, MEXICO
slopes that are normally colonized by benthic organism where opisthobrachs are likely to be found such as sponges, hydrozoans, bryozoans, tunicates, algae, and turtle seagrass meadows (p.e. Thalassia testudinum). The undersides of regular-size boulders were also inspected, taking care to return all rocks to their original position (Nybakken, 1974). Collecting methods involved direct manual capture as well as indirect methods, such as the collection of substrate samples and by brushing part of the surface into a 1 mm mesh bag. Material collected by indirect methods was divided into several white trays containing salt water and left untouched until the decrease in the oxygen concentration forced the specimens to crawl up to the surface looking for areas richer in oxygen. All specimens were measured and described in vivo under a stereomicroscope. At least one specimen per species was photographed. Afterwards, specimens were put in the refrigerator or anesthetized with magnesium chloride or clove oil, and then preserved in 96% absolute ethanol. Some specimens were deposited at the Colección Nacional de Moluscos (CNMO) of the Instituto de Biología, UNAM. The phylogenetic classification follows Bouchet and Rocroi (2005) down to family level, with the exception of the family Chromodorididae, where we used Johnson and Gosliner (2012); Gosliner et al. (2008) for genera, and species are listed in chronological order by year of the description. Data for each species include: Scientific name; Examined material (Sisal (Sis); Madagascar (Mad); Serpiente (Ser); Yucalpeten (Ycl); La Bocana (Boc)); Date of sampling; Lenght in milimeters (maxim lenght as ML, and L for length of only one specimen); Type of substrate; Diagnosis (for identification to species level is indicated the publication and the pages that were used to identify the specimen; for unidentified species there is a brief description of the main features of the sampled material); Distribution (distribution information was taken from published records: localities of the west coast of the Atlantic ocean are listed in geographical order from north to south, west to east, and by country, first the continental countries and then the islands; for Mexico, we specified the states of the Atlantic coast of the country where each species record was found, also north to south order, following the author of the work. Abbreviations used for each state were: Tamaulipas, TAMS; Veracruz, VER; Tabasco, TAB; Campeche, CAMP; Yucatan, YUC; Quintana Roo, QROO. For species with wide geographical range, the distribution is not specified down country level.
RESULTS
From the total of 58 samples, 18 were collected in lagoons (nine in the Bocana, eight in Yucalpeten, and one in Celestun) and 40 in reefs (25 in Madagascar, 11
in Sisal, and four in Serpiente). A total of 51 species of opisthobranchs belonging to the Clades Cephalaspidea (10 species), Aplysiomorpha (6 species), Sacoglossa (13 species), Eutenidiacea (13 species), and Cladobranchia (9 species) were observed. The most abundant families were Chromodorididae and Plakobranchidae with eight species each one, and Aplysiidae with six species. Of these, 30 species are new records for the Campeche Bank, and 20 are new records for the Atlantic coast of Mexico. Thirty six species were sampled in only one site, 23 in the reefs and 13 in the lagoons (table 2). Eighteen species were collected in the lagoons and 35 species were found in the reefs. Three species were also found in lagoons with similar environmental conditions (Bulla occidentalis, Aplysia brasiliana and Spurilla neapolitana). Only two species were present at the three reefs (Elysia patina and Hypselodoris picta), and only five species (Chelidonura berolina, C. hirundinina, C. cubana, Costasiella ocellifera and Chromodoris clenchi) were distributed in the reefs of Sisal and Madagascar. Madagascar and Serpiente reefs share three species (Hypselorodis acriba, Mexichromis kempfi and Tambja cf. tenuilineata). Only Aplysia dactylomela and Dendrodoris krebsii were found at least in one reef and one lagoon. Since diagnosis was based on external characters and the geographical range reported in the literature, we preferred to keep Tambja cf. tenuilineata as uncertain species. Finally, external characteristics of eight species (Haminoea sp, Ercolania sp, Chromodoris sp, Doto sp, Okenia sp, Flabellina sp, Aeolidiella sp 1, and Aeolidiella sp 2) were insufficient to identify the specimens down to the species level and might be undescribed species (for seven of them we only have one specimen of each). To our best knowledge, this is the first time that images of specimens with these characteristics are shown. A color photograph for these unidentifiable species is included (fig. 2). The species recorded through this study are presented in the following list:
Clade CephalaspideaFamily Bullidae Gray, 1827Bulla occidentalis Adams, 1850 Examined material: Boc: 25 specimens (10-06), ML 35 mm, on mud and over sea grass; 5 specimens (17-05-07), ML 30 mm, over mud and over sea grass (CNMO3015); 1,489 specimens (07-04-08), ML 15 mm, over mud; 225 specimens (09-04-08), ML 15 mm, over mud; Ycl: 35 specimens (06-05-08), ML 40 mm, over mud; 200 specimens (07-05-08), ML 40 mm, over sea grass (CNMO3040).Diagnosis: Malaquias and Reid, 2007Distribution: USA (North Carolina, Florida, Louisiana and Texas); Mexico: VER (Wiley et al., 1982; García-Cubas and Reguero, 1995; Pérez-Rodríguez, 1997;
61Thalassas, 29(1) · January 2013
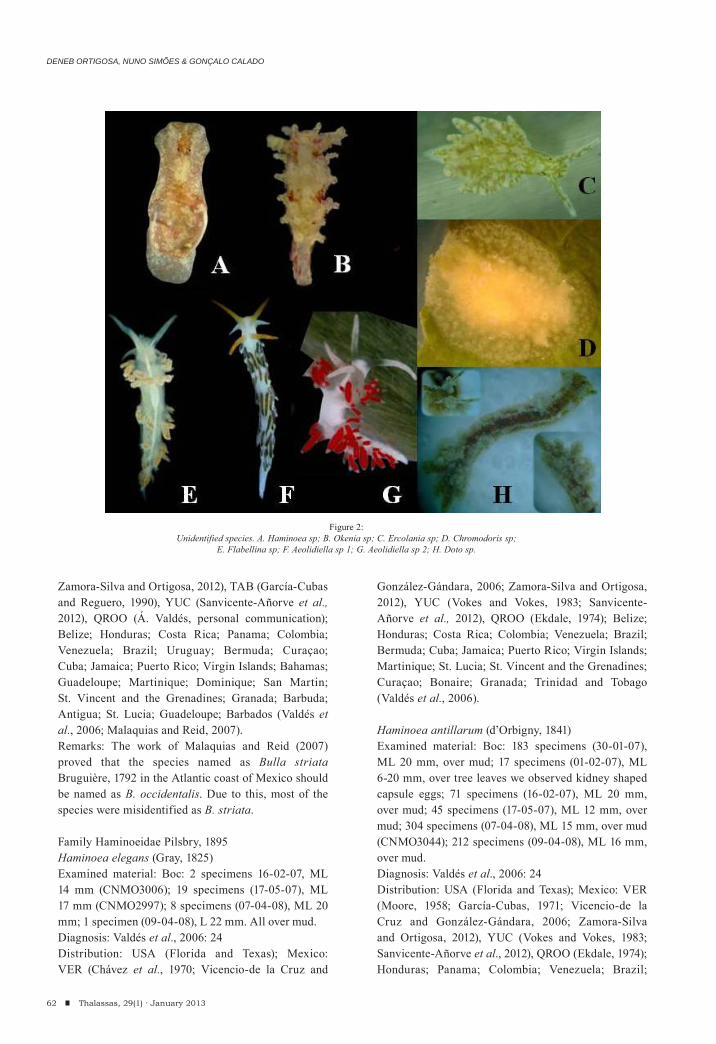
DENEB ORTIGOSA, NUNO SIMÕES & GONÇALO CALADO
Zamora-Silva and Ortigosa, 2012), TAB (García-Cubas and Reguero, 1990), YUC (Sanvicente-Añorve et al., 2012), QROO (Á. Valdés, personal communication); Belize; Honduras; Costa Rica; Panama; Colombia; Venezuela; Brazil; Uruguay; Bermuda; Curaçao; Cuba; Jamaica; Puerto Rico; Virgin Islands; Bahamas; Guadeloupe; Martinique; Dominique; San Martin; St. Vincent and the Grenadines; Granada; Barbuda; Antigua; St. Lucia; Guadeloupe; Barbados (Valdés et al., 2006; Malaquias and Reid, 2007).Remarks: The work of Malaquias and Reid (2007) proved that the species named as Bulla striata Bruguière, 1792 in the Atlantic coast of Mexico should be named as B. occidentalis. Due to this, most of the species were misidentified as B. striata.
Family Haminoeidae Pilsbry, 1895Haminoea elegans (Gray, 1825)Examined material: Boc: 2 specimens 16-02-07, ML 14 mm (CNMO3006); 19 specimens (17-05-07), ML 17 mm (CNMO2997); 8 specimens (07-04-08), ML 20 mm; 1 specimen (09-04-08), L 22 mm. All over mud.Diagnosis: Valdés et al., 2006: 24Distribution: USA (Florida and Texas); Mexico: VER (Chávez et al., 1970; Vicencio-de la Cruz and
González-Gándara, 2006; Zamora-Silva and Ortigosa, 2012), YUC (Vokes and Vokes, 1983; Sanvicente-Añorve et al., 2012), QROO (Ekdale, 1974); Belize; Honduras; Costa Rica; Colombia; Venezuela; Brazil; Bermuda; Cuba; Jamaica; Puerto Rico; Virgin Islands; Martinique; St. Lucia; St. Vincent and the Grenadines; Curaçao; Bonaire; Granada; Trinidad and Tobago (Valdés et al., 2006).
Haminoea antillarum (d’Orbigny, 1841)Examined material: Boc: 183 specimens (30-01-07), ML 20 mm, over mud; 17 specimens (01-02-07), ML 6-20 mm, over tree leaves we observed kidney shaped capsule eggs; 71 specimens (16-02-07), ML 20 mm, over mud; 45 specimens (17-05-07), ML 12 mm, over mud; 304 specimens (07-04-08), ML 15 mm, over mud (CNMO3044); 212 specimens (09-04-08), ML 16 mm, over mud.Diagnosis: Valdés et al., 2006: 24Distribution: USA (Florida and Texas); Mexico: VER (Moore, 1958; García-Cubas, 1971; Vicencio-de la Cruz and González-Gándara, 2006; Zamora-Silva and Ortigosa, 2012), YUC (Vokes and Vokes, 1983; Sanvicente-Añorve et al., 2012), QROO (Ekdale, 1974); Honduras; Panama; Colombia; Venezuela; Brazil;
62 Thalassas, 29(1) · January 2013
Figure 2:Unidentified species. A. Haminoea sp; B. Okenia sp; C. Ercolania sp; D. Chromodoris sp;
E. Flabellina sp; F. Aeolidiella sp 1; G. Aeolidiella sp 2; H. Doto sp.
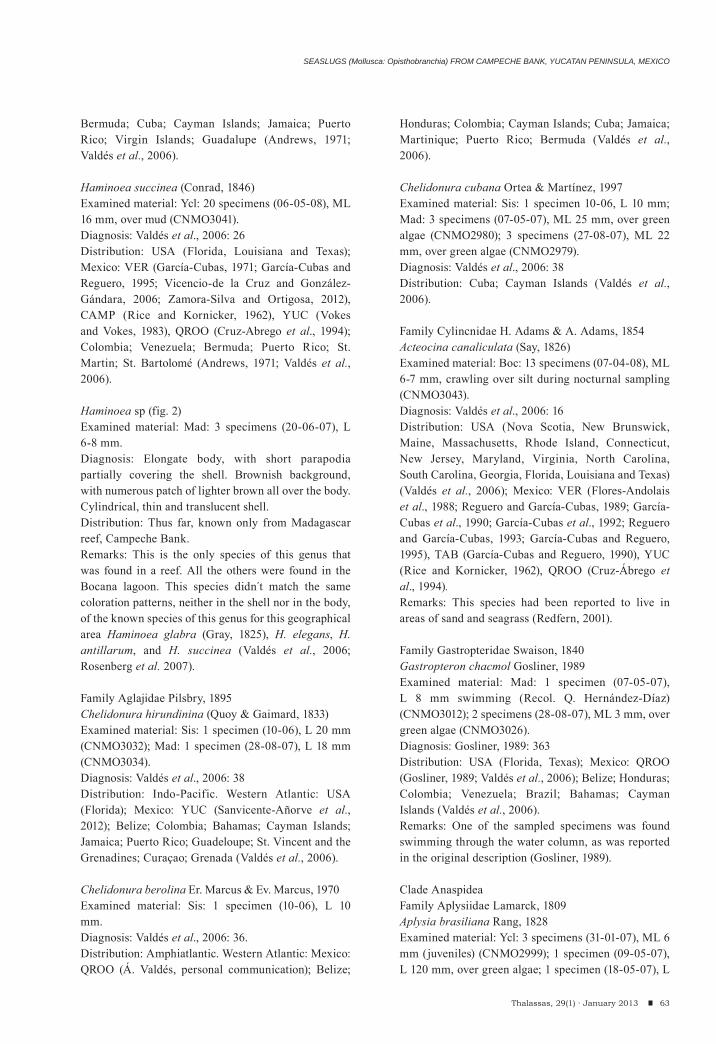
SEASLUGS (Mollusca: Opisthobranchia) FROM CAMPECHE BANK, YUCATAN PENINSULA, MEXICO
Bermuda; Cuba; Cayman Islands; Jamaica; Puerto Rico; Virgin Islands; Guadalupe (Andrews, 1971; Valdés et al., 2006).
Haminoea succinea (Conrad, 1846)Examined material: Ycl: 20 specimens (06-05-08), ML 16 mm, over mud (CNMO3041).Diagnosis: Valdés et al., 2006: 26Distribution: USA (Florida, Louisiana and Texas); Mexico: VER (García-Cubas, 1971; García-Cubas and Reguero, 1995; Vicencio-de la Cruz and González-Gándara, 2006; Zamora-Silva and Ortigosa, 2012), CAMP (Rice and Kornicker, 1962), YUC (Vokes and Vokes, 1983), QROO (Cruz-Abrego et al., 1994); Colombia; Venezuela; Bermuda; Puerto Rico; St. Martin; St. Bartolomé (Andrews, 1971; Valdés et al., 2006).
Haminoea sp (fig. 2)Examined material: Mad: 3 specimens (20-06-07), L 6-8 mm.Diagnosis: Elongate body, with short parapodia partially covering the shell. Brownish background, with numerous patch of lighter brown all over the body. Cylindrical, thin and translucent shell.Distribution: Thus far, known only from Madagascar reef, Campeche Bank.Remarks: This is the only species of this genus that was found in a reef. All the others were found in the Bocana lagoon. This species didn t match the same coloration patterns, neither in the shell nor in the body, of the known species of this genus for this geographical area Haminoea glabra (Gray, 1825), H. elegans, H. antillarum, and H. succinea (Valdés et al., 2006; Rosenberg et al. 2007).
Family Aglajidae Pilsbry, 1895Chelidonura hirundinina (Quoy & Gaimard, 1833)Examined material: Sis: 1 specimen (10-06), L 20 mm (CNMO3032); Mad: 1 specimen (28-08-07), L 18 mm (CNMO3034).Diagnosis: Valdés et al., 2006: 38Distribution: Indo-Pacific. Western Atlantic: USA (Florida); Mexico: YUC (Sanvicente-Añorve et al., 2012); Belize; Colombia; Bahamas; Cayman Islands; Jamaica; Puerto Rico; Guadeloupe; St. Vincent and the Grenadines; Curaçao; Grenada (Valdés et al., 2006).
Chelidonura berolina Er. Marcus & Ev. Marcus, 1970Examined material: Sis: 1 specimen (10-06), L 10 mm.Diagnosis: Valdés et al., 2006: 36.Distribution: Amphiatlantic. Western Atlantic: Mexico: QROO (Á. Valdés, personal communication); Belize;
Honduras; Colombia; Cayman Islands; Cuba; Jamaica; Martinique; Puerto Rico; Bermuda (Valdés et al., 2006).
Chelidonura cubana Ortea & Martínez, 1997Examined material: Sis: 1 specimen 10-06, L 10 mm; Mad: 3 specimens (07-05-07), ML 25 mm, over green algae (CNMO2980); 3 specimens (27-08-07), ML 22 mm, over green algae (CNMO2979).Diagnosis: Valdés et al., 2006: 38Distribution: Cuba; Cayman Islands (Valdés et al., 2006).
Family Cylincnidae H. Adams & A. Adams, 1854 Acteocina canaliculata (Say, 1826)Examined material: Boc: 13 specimens (07-04-08), ML 6-7 mm, crawling over silt during nocturnal sampling (CNMO3043).Diagnosis: Valdés et al., 2006: 16Distribution: USA (Nova Scotia, New Brunswick, Maine, Massachusetts, Rhode Island, Connecticut, New Jersey, Maryland, Virginia, North Carolina, South Carolina, Georgia, Florida, Louisiana and Texas) (Valdés et al., 2006); Mexico: VER (Flores-Andolais et al., 1988; Reguero and García-Cubas, 1989; García-Cubas et al., 1990; García-Cubas et al., 1992; Reguero and García-Cubas, 1993; García-Cubas and Reguero, 1995), TAB (García-Cubas and Reguero, 1990), YUC (Rice and Kornicker, 1962), QROO (Cruz-Ábrego et al., 1994). Remarks: This species had been reported to live in areas of sand and seagrass (Redfern, 2001).
Family Gastropteridae Swaison, 1840Gastropteron chacmol Gosliner, 1989Examined material: Mad: 1 specimen (07-05-07), L 8 mm swimming (Recol. Q. Hernández-Díaz) (CNMO3012); 2 specimens (28-08-07), ML 3 mm, over green algae (CNMO3026).Diagnosis: Gosliner, 1989: 363Distribution: USA (Florida, Texas); Mexico: QROO (Gosliner, 1989; Valdés et al., 2006); Belize; Honduras; Colombia; Venezuela; Brazil; Bahamas; Cayman Islands (Valdés et al., 2006).Remarks: One of the sampled specimens was found swimming through the water column, as was reported in the original description (Gosliner, 1989). Clade AnaspideaFamily Aplysiidae Lamarck, 1809Aplysia brasiliana Rang, 1828Examined material: Ycl: 3 specimens (31-01-07), ML 6 mm (juveniles) (CNMO2999); 1 specimen (09-05-07), L 120 mm, over green algae; 1 specimen (18-05-07), L
63Thalassas, 29(1) · January 2013
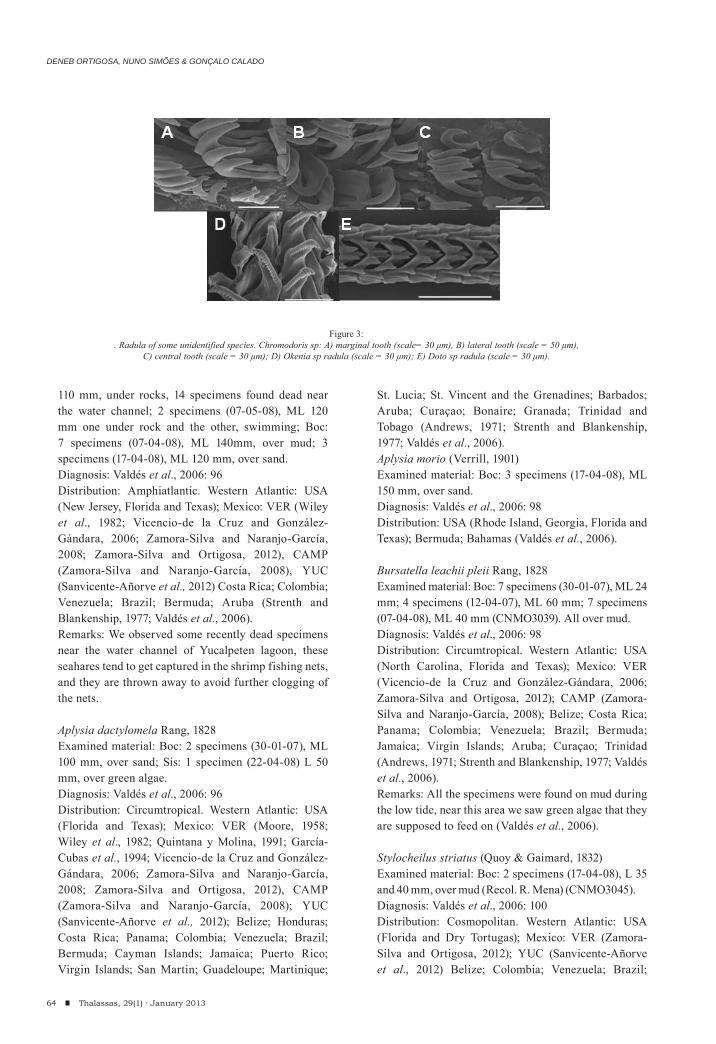
DENEB ORTIGOSA, NUNO SIMÕES & GONÇALO CALADO
110 mm, under rocks, 14 specimens found dead near the water channel; 2 specimens (07-05-08), ML 120 mm one under rock and the other, swimming; Boc: 7 specimens (07-04-08), ML 140mm, over mud; 3 specimens (17-04-08), ML 120 mm, over sand.Diagnosis: Valdés et al., 2006: 96Distribution: Amphiatlantic. Western Atlantic: USA (New Jersey, Florida and Texas); Mexico: VER (Wiley et al., 1982; Vicencio-de la Cruz and González-Gándara, 2006; Zamora-Silva and Naranjo-García, 2008; Zamora-Silva and Ortigosa, 2012), CAMP (Zamora-Silva and Naranjo-García, 2008), YUC (Sanvicente-Añorve et al., 2012) Costa Rica; Colombia; Venezuela; Brazil; Bermuda; Aruba (Strenth and Blankenship, 1977; Valdés et al., 2006).Remarks: We observed some recently dead specimens near the water channel of Yucalpeten lagoon, these seahares tend to get captured in the shrimp fishing nets, and they are thrown away to avoid further clogging of the nets.
Aplysia dactylomela Rang, 1828Examined material: Boc: 2 specimens (30-01-07), ML 100 mm, over sand; Sis: 1 specimen (22-04-08) L 50 mm, over green algae.Diagnosis: Valdés et al., 2006: 96Distribution: Circumtropical. Western Atlantic: USA (Florida and Texas); Mexico: VER (Moore, 1958; Wiley et al., 1982; Quintana y Molina, 1991; García-Cubas et al., 1994; Vicencio-de la Cruz and González-Gándara, 2006; Zamora-Silva and Naranjo-García, 2008; Zamora-Silva and Ortigosa, 2012), CAMP (Zamora-Silva and Naranjo-García, 2008); YUC (Sanvicente-Añorve et al., 2012); Belize; Honduras; Costa Rica; Panama; Colombia; Venezuela; Brazil; Bermuda; Cayman Islands; Jamaica; Puerto Rico; Virgin Islands; San Martin; Guadeloupe; Martinique;
St. Lucia; St. Vincent and the Grenadines; Barbados; Aruba; Curaçao; Bonaire; Granada; Trinidad and Tobago (Andrews, 1971; Strenth and Blankenship, 1977; Valdés et al., 2006).Aplysia morio (Verrill, 1901)Examined material: Boc: 3 specimens (17-04-08), ML 150 mm, over sand.Diagnosis: Valdés et al., 2006: 98Distribution: USA (Rhode Island, Georgia, Florida and Texas); Bermuda; Bahamas (Valdés et al., 2006).
Bursatella leachii pleii Rang, 1828Examined material: Boc: 7 specimens (30-01-07), ML 24 mm; 4 specimens (12-04-07), ML 60 mm; 7 specimens (07-04-08), ML 40 mm (CNMO3039). All over mud.Diagnosis: Valdés et al., 2006: 98Distribution: Circumtropical. Western Atlantic: USA (North Carolina, Florida and Texas); Mexico: VER (Vicencio-de la Cruz and González-Gándara, 2006; Zamora-Silva and Ortigosa, 2012); CAMP (Zamora-Silva and Naranjo-García, 2008); Belize; Costa Rica; Panama; Colombia; Venezuela; Brazil; Bermuda; Jamaica; Virgin Islands; Aruba; Curaçao; Trinidad (Andrews, 1971; Strenth and Blankenship, 1977; Valdés et al., 2006). Remarks: All the specimens were found on mud during the low tide, near this area we saw green algae that they are supposed to feed on (Valdés et al., 2006).
Stylocheilus striatus (Quoy & Gaimard, 1832)Examined material: Boc: 2 specimens (17-04-08), L 35 and 40 mm, over mud (Recol. R. Mena) (CNMO3045).Diagnosis: Valdés et al., 2006: 100Distribution: Cosmopolitan. Western Atlantic: USA (Florida and Dry Tortugas); Mexico: VER (Zamora-Silva and Ortigosa, 2012); YUC (Sanvicente-Añorve et al., 2012) Belize; Colombia; Venezuela; Brazil;
64 Thalassas, 29(1) · January 2013
Figure 3:. Radula of some unidentified species. Chromodoris sp: A) marginal tooth (scale= 30 μm), B) lateral tooth (scale = 50 μm),
C) central tooth (scale = 30 μm); D) Okenia sp radula (scale = 30 μm); E) Doto sp radula (scale = 30 μm).
SEASLUGS (Mollusca: Opisthobranchia) FROM CAMPECHE BANK, YUCATAN PENINSULA, MEXICO
Bermuda; Bahamas; Cayman Islands; Jamaica; Puerto Rico; Virgin Islands; Martinique; Barbados; St. Vincent and the Grenadines; Aruba; Curaçao; Bonaire; Grenada (Valdés et al., 2006).
Phyllaplysia engeli Er. Marcus, 1955Examined material: Ycl: 1 specimen (09-05-08), L 10 mm over Thalassia testudinum (CNMO3042).Diagnosis: Valdés et al., 2006: 104Distribution: USA (Florida); Mexico: YUC (Sanvicente-Añorve et al., 2012), QROO (Valdés et al., 2006); Costa Rica; Colombia; Brazil; Bahamas; Puerto Rico; Jamaica; St. Martin; Barbados; Curaçao (Valdés et al., 2006).Remarks: The only specimen was found 50 km west of the Bocana during an extra expedition that was made on a Thalassia meadow as it is reported (Valdés et al., 2006). This is one of the two species reported to the Caribbean Sea.
Clade SacoglossaFamily Oxynoidae Stoliczka, 1868Lobiger souberbii P. Fischer, 1857Examined material: Sis: 1 specimen (08-02-07), L 4 mm (CNMO3035). Diagnosis: Valdés et al., 2006: 52Distribution: USA (Florida); Mexico: YUC (Vokes and Vokes, 1983), QROO (Ekdale, 1974); Honduras; Costa Rica; Venezuela; Cayman Islands; Jamaica; Puerto Rico; Guadeloupe; Barbados; St. Vincent and the Grenadines; Curaçao (Valdés et al., 2006).Remarks: This species is usually found on algae of the genus Caulerpa (Redfern 2001; Valdés et al., 2006) but we could not specify the habitat because this species were found by an indirect method in a complex of different green algae.
Family Juliidae E. A. Smith, 1885Berthelinia caribbea Edmunds, 1963Examined material: Mad: 1 specimen (04-05-07), L 3 mm (CNMO3028); 2 specimens (07-05-07), ML 3 mm (CNMO3013); 1 specimen (02-05-08), L 3 mm. Diagnosis: Valdés et al., 2006: 48Distribution: USA (Florida); Mexico: QROO (Á. Valdés, personal communication); Belize; Costa Rica; Panama; Bahamas; Jamaica; Puerto Rico; Brazil (Valdés et al., 2006).Remarks: This species is frequently associated with the green algae Caulerpa verticillata (Clark et al., 1990). We found it with a variety of green algae.
Family Placobranchidae Gray, 1840Elysia cf. cornigeraExamined material: Ycl: 2 specimens (31-01-07), ML 4 mm (CNMO2995).
Diagnosis: Carmona et al., 2011 (With molecular analysis (16s and H3).Distribution: USA (Florida); Bahamas; Cuba; Cayman Islands (Ortea et al., 1994; Valdés et al., 2006). Remarks: Elysia cornigera (Nuttall, 1987) from the Pacific Ocean and Elysia timida (Risso, 1818) are valid species and sister to each other (Carmona et al., 2011).
Elysia papillosa Verrill, 1901Examined material: Mad: 1 specimen (04-05-07), L 8 mm, over green algae. Diagnosis: Valdés et al., 2006: 64Distribution: USA (Florida); Mexico: QROO (Á. Valdés, personal communication); Belize; Honduras; Costa Rica; Panama; Venezuela; Bermuda; Bahamas; Cayman Islands; Guadeloupe; St. Lucia; Martinique; Granada; Curaçao; Trinidad and Tobago; (Rios, 1994; Valdés et al., 2006).
Elysia subornata Verrill, 1901Examined material: Ycl: 1 specimen (31-01-07), L 3 mm (CNMO2998), on Caulerpa sp, with egg ribbons over the algae. Diagnosis: Valdés et al., 2006: 66Distribution: USA (Florida); Mexico: VER (Vicencio-de la Cruz and González-Gándara, 2006; Zamora-Silva and Ortigosa, 2012), YUC (Sanvicente-Añorve et al., 2012), QROO (Valdés et al., 2006); Belize; Bermuda; Bahamas; Cayman Islands; Jamaica; Puerto Rico; Virgin Islands; Martinique; Aruba; Granada; Trinidad and Tobago (Valdés et al., 2006). Remarks: Valdés et al. (2006) report that this slug feeds on the green algae Penicillus dumetosus and Udotea flabellum and Clark (1994) say that this species is associated with Caulerpa racemosa; we have found it on Caulerpa sp.
Elysia canguzua Er. Marcus, 1955Examined material: Sis: 1 specimen (10-06), L 9 mm (CNMO3017).Diagnosis: Valdés et al., 2006: 64Distribution: Costa Rica; Brazil (Valdés et al., 2006). Remarks: There are reports of E. canguzua feeding on green algae of the genus Codium (Valdés et al., 2006), but we did not identify the substrate were we found it.
Elysia tuca Ev. Marcus & Er. Marcus, 1967Examined material: Sis: 1 specimen (10-06), L 9 mm (CNMO3019).Diagnosis: Valdés et al., 2006: 66Distribution: USA (Florida); Mexico: YUC (Sanvicente-Añorve et al., 2012), QROO (Valdés et al., 2006); Honduras; Costa Rica; Panama; Colombia; Brazil; Bermuda; Cayman Islands; Jamaica; Puerto Rico;
65Thalassas, 29(1) · January 2013

DENEB ORTIGOSA, NUNO SIMÕES & GONÇALO CALADO
Virgin Islands; San Martin; St. Lucia; St. Vincent and the Grenadines; Barbados; Curaçao; Grenada (Valdés et al., 2006).Remarks: It is reported that this species is usually found on the green algae Halimeda. We could not identify the substrate.
Elysia patina Ev. Marcus, 1980Examined material: Sis: 1 specimen (27-04-07), L 10 mm; Mad: 1 specimen (07-05-07), L 8 mm, over Halimeda sp; 1 specimen (23-02-07), L 9 mm.Diagnosis: Valdés et al., 2006: 72Distribution: USA (Florida); Mexico: YUC (Sanvicente-Añorve et al., 2012), QROO (Valdés et al., 2006); Costa Rica; Bahamas; Martinique; St. Vincent and the Grenadines (Valdés et al., 2006). Remarks: One specimen of this species was found in Halimeda sp, in contrast with reports of finding it on Udotea sp. (Valdés et al., 2006).
Elysia zuleicae Ortea & Espinosa, 2002Examined material: Sis: 2 specimens (23-02-07), ML 18 mm, over green algae.Diagnosis: Valdés et al., 2006: 70Distribution: Costa Rica; Cuba; Jamaica (Valdés et al., 2006).
Thuridilla mazda Ortea & Espinosa, 2000Examined material: Mad: 1 specimen (06-06-07), L 13 mm, over Caulerpa sp (CNMO3027).Diagnosis: Valdés et al., 2006: 58Distribution: Costa Rica; Bahamas; Cuba (Valdés et al., 2006). Portugal (Azores) (Malaquias et al., 2012)
Family Limapontiidae Gray, 1847Ercolania sp (fig. 2)Examined material: Mad: 14 specimens (28-08-07), ML 2 mm, over ribbons of eggs attached to a coral (CNMO2968).Diagnosis: light green body with dark green cerata all over the body except for the head. Small white dots through all the ceratas. Smooth rhinophores. Ceratas not so dense, leaving the dorsum clear.Distribution: Thus far, known only from Madagascar reef, Campeche Bank.Remarks: Here are four species of Ercolania in the Gulf of Mexico and the Caribbean Sea. The sampled material did not have a purple spot over the head as E. viridis A. Costa, 1866; nor the black points of E. fuscata (Gould, 1870); the ceratas are not so numerous as in E. courulea Trinchese, 1872, and was described for the Atlantic east so the distribution and identification must be reviewed; finally, Rosenberg et al. (2007) reported E. fuscovittata (Lance, 1962) as an introduced species in Florida from East Pacific. Such lack of characters can be due to the small size of the sampled specimens (1-2 mm). Species of these genera had been reported to be on Caulerpa racemosa (Clark et al., 1990). However, the collected specimens were found over ribbons of eggs, as some species of limapontiids (Gosliner et al., 2008).
Costasiella ocellifera (Simroth, 1895)Material: Sis: 10 specimens (10-06), ML 8 mm (CNMO3020); 6 specimens (27-04-07), ML 6 mm (CNMO2993); 5 specimens (06-03-08), ML 4 mm; Mad: 3 specimens (11-06-07), ML 7 mm (CNMO3002); 4 specimens (11-04-08), ML 5 mm. All over the green
66 Thalassas, 29(1) · January 2013
Study area Author Year
Veracruz Flores-Andolais et al. 1988
Quintana y Molina 1991
Reguero and García-Cubas 1993
Vicencio-de la Cruz and González-Gándara 2006
Zamora and Ortigosa 2012
Tabasco García-Cubas and Reguero 1990
Quintana Roo Cruz-Ábrego et al. 1994
Gulf of Mexico Pérez-Rodríguez 1997
Zamora-Silva and Naranjo-García 2008
Campeche Bank Sanvicente-Añorve et al. 2012
Atlantic Malaquias and Reid 2007
Table 1:Previous studies in the Atlantic Coast of Mexico not cited in Rosenberg et al. 2007.
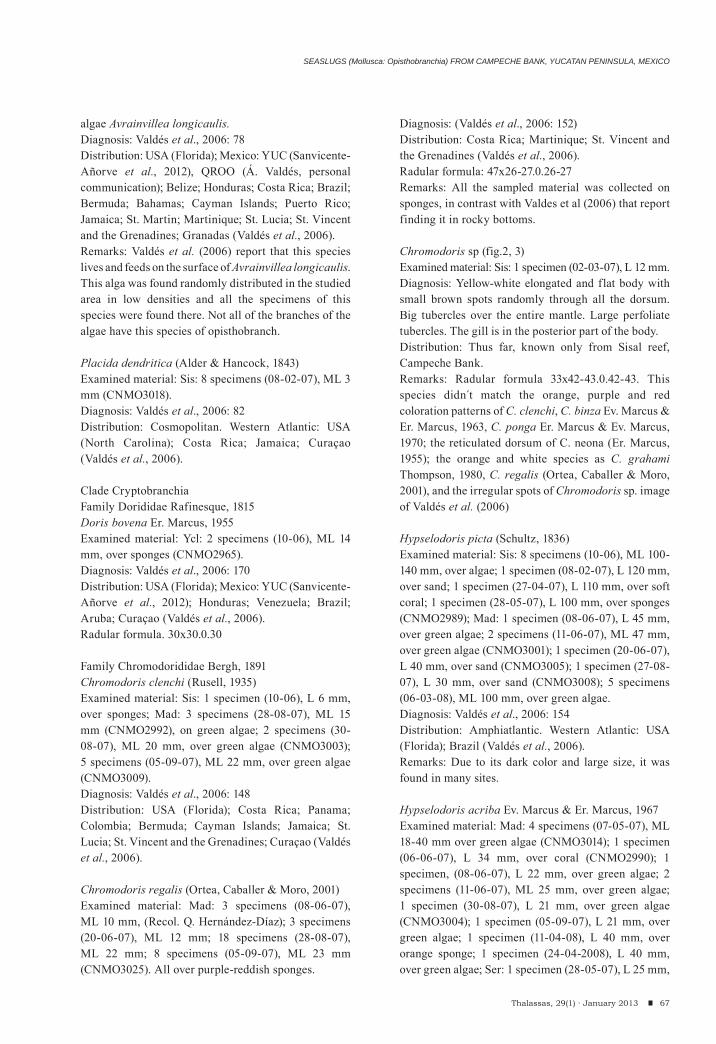
SEASLUGS (Mollusca: Opisthobranchia) FROM CAMPECHE BANK, YUCATAN PENINSULA, MEXICO
algae Avrainvillea longicaulis.Diagnosis: Valdés et al., 2006: 78Distribution: USA (Florida); Mexico: YUC (Sanvicente-Añorve et al., 2012), QROO (Á. Valdés, personal communication); Belize; Honduras; Costa Rica; Brazil; Bermuda; Bahamas; Cayman Islands; Puerto Rico; Jamaica; St. Martin; Martinique; St. Lucia; St. Vincent and the Grenadines; Granadas (Valdés et al., 2006). Remarks: Valdés et al. (2006) report that this species lives and feeds on the surface of Avrainvillea longicaulis. This alga was found randomly distributed in the studied area in low densities and all the specimens of this species were found there. Not all of the branches of the algae have this species of opisthobranch.
Placida dendritica (Alder & Hancock, 1843)Examined material: Sis: 8 specimens (08-02-07), ML 3 mm (CNMO3018).Diagnosis: Valdés et al., 2006: 82Distribution: Cosmopolitan. Western Atlantic: USA (North Carolina); Costa Rica; Jamaica; Curaçao (Valdés et al., 2006).
Clade CryptobranchiaFamily Dorididae Rafinesque, 1815Doris bovena Er. Marcus, 1955Examined material: Ycl: 2 specimens (10-06), ML 14 mm, over sponges (CNMO2965).Diagnosis: Valdés et al., 2006: 170Distribution: USA (Florida); Mexico: YUC (Sanvicente-Añorve et al., 2012); Honduras; Venezuela; Brazil; Aruba; Curaçao (Valdés et al., 2006). Radular formula. 30x30.0.30
Family Chromodorididae Bergh, 1891Chromodoris clenchi (Rusell, 1935)Examined material: Sis: 1 specimen (10-06), L 6 mm, over sponges; Mad: 3 specimens (28-08-07), ML 15 mm (CNMO2992), on green algae; 2 specimens (30-08-07), ML 20 mm, over green algae (CNMO3003); 5 specimens (05-09-07), ML 22 mm, over green algae (CNMO3009). Diagnosis: Valdés et al., 2006: 148Distribution: USA (Florida); Costa Rica; Panama; Colombia; Bermuda; Cayman Islands; Jamaica; St. Lucia; St. Vincent and the Grenadines; Curaçao (Valdés et al., 2006).
Chromodoris regalis (Ortea, Caballer & Moro, 2001)Examined material: Mad: 3 specimens (08-06-07), ML 10 mm, (Recol. Q. Hernández-Díaz); 3 specimens (20-06-07), ML 12 mm; 18 specimens (28-08-07), ML 22 mm; 8 specimens (05-09-07), ML 23 mm (CNMO3025). All over purple-reddish sponges.
Diagnosis: (Valdés et al., 2006: 152)Distribution: Costa Rica; Martinique; St. Vincent and the Grenadines (Valdés et al., 2006). Radular formula: 47x26-27.0.26-27Remarks: All the sampled material was collected on sponges, in contrast with Valdes et al (2006) that report finding it in rocky bottoms.
Chromodoris sp (fig.2, 3)Examined material: Sis: 1 specimen (02-03-07), L 12 mm.Diagnosis: Yellow-white elongated and flat body with small brown spots randomly through all the dorsum. Big tubercles over the entire mantle. Large perfoliate tubercles. The gill is in the posterior part of the body. Distribution: Thus far, known only from Sisal reef, Campeche Bank.Remarks: Radular formula 33x42-43.0.42-43. This species didn´t match the orange, purple and red coloration patterns of C. clenchi, C. binza Ev. Marcus & Er. Marcus, 1963, C. ponga Er. Marcus & Ev. Marcus, 1970; the reticulated dorsum of C. neona (Er. Marcus, 1955); the orange and white species as C. grahami Thompson, 1980, C. regalis (Ortea, Caballer & Moro, 2001), and the irregular spots of Chromodoris sp. image of Valdés et al. (2006)
Hypselodoris picta (Schultz, 1836)Examined material: Sis: 8 specimens (10-06), ML 100-140 mm, over algae; 1 specimen (08-02-07), L 120 mm, over sand; 1 specimen (27-04-07), L 110 mm, over soft coral; 1 specimen (28-05-07), L 100 mm, over sponges (CNMO2989); Mad: 1 specimen (08-06-07), L 45 mm, over green algae; 2 specimens (11-06-07), ML 47 mm, over green algae (CNMO3001); 1 specimen (20-06-07), L 40 mm, over sand (CNMO3005); 1 specimen (27-08-07), L 30 mm, over sand (CNMO3008); 5 specimens (06-03-08), ML 100 mm, over green algae.Diagnosis: Valdés et al., 2006: 154Distribution: Amphiatlantic. Western Atlantic: USA (Florida); Brazil (Valdés et al., 2006). Remarks: Due to its dark color and large size, it was found in many sites.
Hypselodoris acriba Ev. Marcus & Er. Marcus, 1967Examined material: Mad: 4 specimens (07-05-07), ML 18-40 mm over green algae (CNMO3014); 1 specimen (06-06-07), L 34 mm, over coral (CNMO2990); 1 specimen, (08-06-07), L 22 mm, over green algae; 2 specimens (11-06-07), ML 25 mm, over green algae; 1 specimen (30-08-07), L 21 mm, over green algae (CNMO3004); 1 specimen (05-09-07), L 21 mm, over green algae; 1 specimen (11-04-08), L 40 mm, over orange sponge; 1 specimen (24-04-2008), L 40 mm, over green algae; Ser: 1 specimen (28-05-07), L 25 mm,
67Thalassas, 29(1) · January 2013
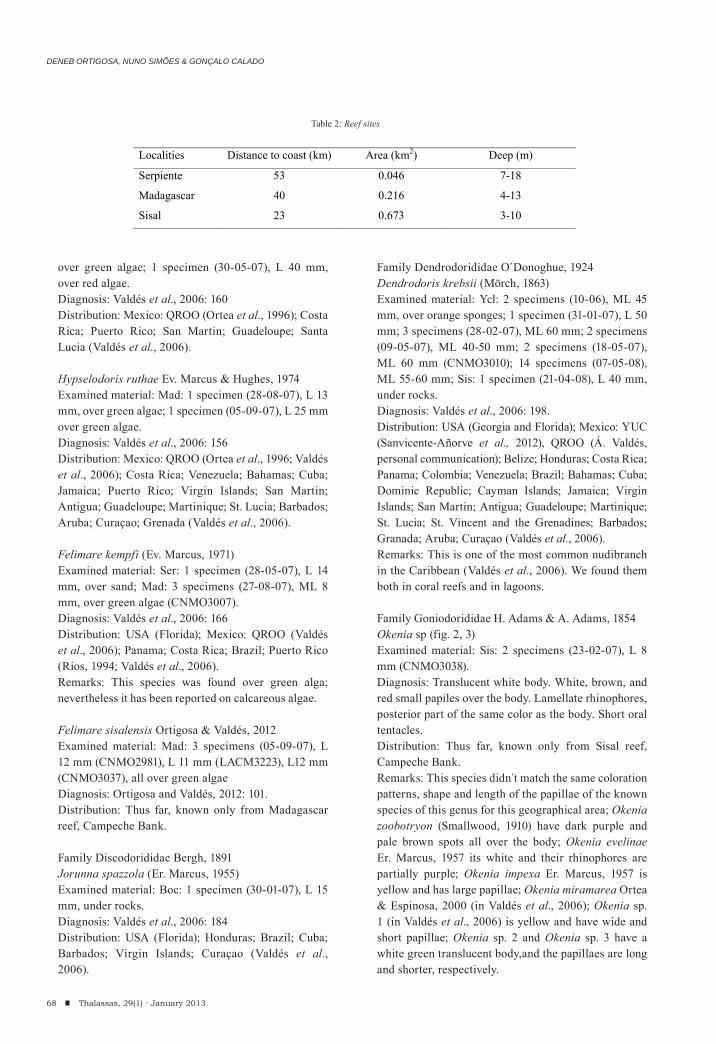
DENEB ORTIGOSA, NUNO SIMÕES & GONÇALO CALADO
over green algae; 1 specimen (30-05-07), L 40 mm, over red algae. Diagnosis: Valdés et al., 2006: 160Distribution: Mexico: QROO (Ortea et al., 1996); Costa Rica; Puerto Rico; San Martin; Guadeloupe; Santa Lucia (Valdés et al., 2006).
Hypselodoris ruthae Ev. Marcus & Hughes, 1974Examined material: Mad: 1 specimen (28-08-07), L 13 mm, over green algae; 1 specimen (05-09-07), L 25 mm over green algae.Diagnosis: Valdés et al., 2006: 156Distribution: Mexico: QROO (Ortea et al., 1996; Valdés et al., 2006); Costa Rica; Venezuela; Bahamas; Cuba; Jamaica; Puerto Rico; Virgin Islands; San Martin; Antigua; Guadeloupe; Martinique; St. Lucia; Barbados; Aruba; Curaçao; Grenada (Valdés et al., 2006).
Felimare kempfi (Ev. Marcus, 1971)Examined material: Ser: 1 specimen (28-05-07), L 14 mm, over sand; Mad: 3 specimens (27-08-07), ML 8 mm, over green algae (CNMO3007).Diagnosis: Valdés et al., 2006: 166Distribution: USA (Florida); Mexico: QROO (Valdés et al., 2006); Panama; Costa Rica; Brazil; Puerto Rico (Rios, 1994; Valdés et al., 2006).Remarks: This species was found over green alga; nevertheless it has been reported on calcareous algae.
Felimare sisalensis Ortigosa & Valdés, 2012 Examined material: Mad: 3 specimens (05-09-07), L 12 mm (CNMO2981), L 11 mm (LACM3223), L12 mm (CNMO3037), all over green algaeDiagnosis: Ortigosa and Valdés, 2012: 101.Distribution: Thus far, known only from Madagascar reef, Campeche Bank.
Family Discodorididae Bergh, 1891Jorunna spazzola (Er. Marcus, 1955)Examined material: Boc: 1 specimen (30-01-07), L 15 mm, under rocks.Diagnosis: Valdés et al., 2006: 184Distribution: USA (Florida); Honduras; Brazil; Cuba; Barbados; Virgin Islands; Curaçao (Valdés et al., 2006).
Family Dendrodorididae O´Donoghue, 1924Dendrodoris krebsii (Mörch, 1863)Examined material: Ycl: 2 specimens (10-06), ML 45 mm, over orange sponges; 1 specimen (31-01-07), L 50 mm; 3 specimens (28-02-07), ML 60 mm; 2 specimens (09-05-07), ML 40-50 mm; 2 specimens (18-05-07), ML 60 mm (CNMO3010); 14 specimens (07-05-08), ML 55-60 mm; Sis: 1 specimen (21-04-08), L 40 mm, under rocks.Diagnosis: Valdés et al., 2006: 198.Distribution: USA (Georgia and Florida); Mexico: YUC (Sanvicente-Añorve et al., 2012), QROO (Á. Valdés, personal communication); Belize; Honduras; Costa Rica; Panama; Colombia; Venezuela; Brazil; Bahamas; Cuba; Dominic Republic; Cayman Islands; Jamaica; Virgin Islands; San Martin; Antigua; Guadeloupe; Martinique; St. Lucia; St. Vincent and the Grenadines; Barbados; Granada; Aruba; Curaçao (Valdés et al., 2006).Remarks: This is one of the most common nudibranch in the Caribbean (Valdés et al., 2006). We found them both in coral reefs and in lagoons.
Family Goniodorididae H. Adams & A. Adams, 1854Okenia sp (fig. 2, 3)Examined material: Sis: 2 specimens (23-02-07), L 8 mm (CNMO3038).Diagnosis: Translucent white body. White, brown, and red small papiles over the body. Lamellate rhinophores, posterior part of the same color as the body. Short oral tentacles.Distribution: Thus far, known only from Sisal reef, Campeche Bank.Remarks: This species didn t match the same coloration patterns, shape and length of the papillae of the known species of this genus for this geographical area; Okenia zoobotryon (Smallwood, 1910) have dark purple and pale brown spots all over the body; Okenia evelinae Er. Marcus, 1957 its white and their rhinophores are partially purple; Okenia impexa Er. Marcus, 1957 is yellow and has large papillae; Okenia miramarea Ortea & Espinosa, 2000 (in Valdés et al., 2006); Okenia sp. 1 (in Valdés et al., 2006) is yellow and have wide and short papillae; Okenia sp. 2 and Okenia sp. 3 have a white green translucent body,and the papillaes are long and shorter, respectively.
68 Thalassas, 29(1) · January 2013
Localities Distance to coast (km) Area (km2) Deep (m)
Serpiente 53 0.046 7-18
Madagascar 40 0.216 4-13
Sisal 23 0.673 3-10
Table 2: Reef sites

SEASLUGS (Mollusca: Opisthobranchia) FROM CAMPECHE BANK, YUCATAN PENINSULA, MEXICO
Family Polyceridae Alder & Hankock, 1845Tambja cf. tenuilineata Miller & Haagh, 2005 (fig. 2, 3) Examined material: Mad: 1 specimen (07-05-07), L 13 mm; 1 specimen (27-08-07), L 4 mm, over green algae; Ser: 1 specimen, (30-05-07), L 2 mm.Diagnosis: Miller and Haagh, 2005
Placida dendritica (Alder & Hancock, 1843)Examined material: Sis: 8 specimens (08-02-07), ML 3 mm (CNMO3018).Diagnosis: Valdés et al., 2006: 82 Distribution: Australia (New South Wales, Southern Queensland and Lord Howe Island); New Zealand (Miller and Haagh, 2005); Portugal (Azores) (Wirtz, 1998, as Tambja sp.).Remarks: The known distribution of this species is very disjunctive; it was described in Australia, and it has been also recorded in the Azores Islands in the middle of the North-Atlantic Ocean. Here it is reported for first time for the western Atlantic. The coloration pattern of the specimens is the same as the original description. Nevertheless, molecular or taxonomical dissection will be necessary in order of confirm its identity.
Clade CladobranchiaFalimy Dotidae Gay, 1853Doto spExamined material: Mad: 1 specimen (06-06-07), L 11 mm (CNMO3033). Diagnosis: Small elongated brownish green body. Rhinophoral sheaths with pulpital shape, also brownish green. Smooth rhinophores. Tuberculate cerata arranged dorso-laterally on each side of the body, the anterior ceratas are smaller and with a simpler arrangement than the posterior ones. The base of the cerata is lighter brown through all the body. Irregular tubercles distributed through all the body (fig. 2). Radula with a single row. The reproductive system has one receptacle with an unknown function.Radular formula: 79x1.0.1 (fig 3). Distribution: Thus far, known only from Madagascar reef, Campeche Bank.Remarks: This species didn t match with the coloration patterns, or the shape and size of the ceratas of the 14 known species of this genus for this geographical area: the orange color of the ceratas of D. uva Er. Marcus 1955, D. wildeli Er. Marcus & Ev. Marcus, 1970, and D. duao, Ortea, 1955; the flat ceratas of D. pita Er. Marcus, 1955 and Doto sp 1 (in Valdes et al., 2006; the dark body and rounded ceratas of D. escatlari Ortea, Moro & Espinosa, 1997, Doto sp 2 (in Valdés et al., 2006), and Doto sp 3 (in Valdés et al., 2006); the particular coloration of Doto pygmaea Bergh, 1871, D.
divae Ev. Marcus & Er. Marcus, 1950, D. sabuli Ortea, 2001, and D. cabecar Ortea, 2001; the large apical tubercles and white spots on the dorsum of D. chica Ev. Marcus & Er. Marcus, 1960; and the white color, dense and large tubercles of D. varaderoensis Ortea, 2001. It s important to notice that there are disagreements between the identity and description of some Caribbean species (Valdés et al., 2006).Family Scyllaeidae Alder & Hancock, 1855Scyllaea pelagica Linnaeus, 1758Examined material: Sis: 1 specimen (23-02-07), L 8 mm (CNMO3021). Distribution: Circumtropical. Western Atlantic: USA (Massachusetts, North Carolina, Georgia, Florida, Texas); Mexico: YUC (Sanvicente-Añorve et al., 2012); Costa Rica; Bermuda; Bahamas; Bonaire (Valdés et al., 2006).Remarks: This species inhabits on floating Sargassum sp, here we found it by a brushing method over different species of algae.
Family Flabellinidae Bergh, 1881Flabellina dushia (Ev. Marcus & Er. Marcus, 1963)Examined material: Mad: 1 specimen (11-04-08), L 10 mm, over green algae.Diagnosis: Valdés et al., 2006: 238Distribution: USA (Florida); Bahamas; Jamaica; Martinique; Curaçao (Valdés et al., 2006).
Flabellina engeli Ev. Marcus & Er. Marcus, 1968Examined material: Mad: 1 specimen (24-04-08), L 14 mm, over red-purple sponge.Diagnosis: Valdés et al., 2006: 240Distribution: USA (Florida); Costa Rica; Colombia; Cuba; Puerto Rico; Martinique; St. Lucia; Barbados; Curaçao; Grenada (Valdés et al., 2006).
Flabellina sp (fig. 9)Examined material: Ycl: 2 specimens (28-02-07), ML 12 mm.Diagnosis: White elongated body with a slightly more translucent foot than the rest of the body. With an opaque white dorsal line across the body, it is wider in the pericardial area. Oral tentacles the same color as the body and with translucent tips. The anterior corner of the foot is small, triangular, and of the same color as the foot. Smooth white rhinophores. Numerous and densely arranged cerata, without forming clusters, the digestive gland is orange with scattered opaque white spots.Distribution: Thus far, known only from Yucalpeten lagoon, Campeche Bank.Remarks: The collected material could be attributed Flabellina verta (Er. Marcus, 1976) or Flabellina bandeli (Ev. Marcus, 1976); nevertheless, the diagnosis
69Thalassas, 29(1) · January 2013

DENEB ORTIGOSA, NUNO SIMÕES & GONÇALO CALADO
70 Thalassas, 29(1) · January 2013
Family Species
La B
ocan
a
Yuc
alpe
ten
Sisa
l
Mad
agas
car
Serp
ient
e
NR
for Y
ucat
an S
tate
N
R fr
om A
tlant
ic c
oast
of
Mex
ico
Clado Cephalaspidea Bullidae Bulla occidentalis Adams, 1850 Haminoeidae Haminoea elegans (Gray, 1825) Haminoea antillarum (d´Orbigny 1841) Haminoea succinea (Conrad, 1846) Haminoea sp Aglajidae Chelidonura hirundinina (Quoy and Gaimard, 1833) Chelidonura berolina Er. Marcus and Ev. Marcus, 1970 Chelidonura cubana Ortea and Martínez, 1997 Cylichnidae Acteocina canaliculata (Say, 1826) Gastropteridae Gastropteron chacmol Gosliner, 1989
Clado Aplysiomorpha Aplysiidae Aplysia brasiliana Rang, 1828 Aplysia dactylomela Rang, 1828 Aplysia morio (Verrill, 1901) Bursatella leachii pleii Rang, 1828 Stylocheilus striatus (Quoy and Gaimard, 1832) Phyllaplysia engeli Er. Marcus, 1955
Clado Sacoglossa Oxynoidae Lobiger souverbii P. Fischer, 1857 Juliidae Berthelinia caribbea Edmunds, 1963 Placobranchidae Elysia cf. cornigera (Nuttall, 1989) Elysia papillosa Verrill, 1901 Elysia subornata Verrill, 1901 Elysia canguzua Er. Marcus, 1955 Elysia tuca Ev. Marcus y Er. Marcus, 1967 Elysia patina Ev. Marcus, 1980 Elysia zuleicae Ortea y Espinosa, 2002 Thuridilla mazda Ortea y Espinosa, 2000 Limapontiidae Ercolania sp Costasiella ocellifera (Simroth, 1895) Placida dendritica (Alder y Hancock, 1843)
Clade Eutenidiacea Dorididae Doris bovena Er. Marcus, 1955 Chromodorididae Chromodoris clenchi (Rusell, 1935) Chromodoris regalis (Ortea, Caballer & Moro, 2001) Chromodoris sp Hypselodoris picta (Schultz, 1836) Hypselodoris acriba Ev. Marcus y Er. Marcus, 1967 Hypselodoris ruthae (Ev. Marcus y Hughes, 1974) Felimare kempfi (Ev. Marcus, 1971) Felimare sisalensis Ortigosa & Valdés, 2012 Discodorididae Jorunna spazzola (Er. Marcus, 1955) Dendrodorididae Dendrodoris krebsii (Mörch, 1863) Goniodorididae Okenia sp Polyceridae Tambja cf. tenuilineata Miller y Haagh, 2005
Clado Cladobranchia Dotidae Doto sp Scyllaeidae Scyllaea pelagica Linnaeus. 1758 Flabellinidae Flabellina dushia (Ev. Marcus y Er. Marcus, 1963) Flabellina engeli Ev. Marcus y Er. Marcus, 1968)
Table 3:Opisthobranch species sampled in the Yucalpeten and the Bocana lagoons, and in Sisal,
Madagascar, and Serpiente coral reefs (NR=New record).
Flabellina sp Aeolidiidae Aeolidiella stephanieae Valdés, 2005 Aeolidiella sp 1 Aeolidiella sp 2 Spurilla neapolitana (delle Chiaje, 1841)

SEASLUGS (Mollusca: Opisthobranchia) FROM CAMPECHE BANK, YUCATAN PENINSULA, MEXICO
of those species didn t show concluding differences between each one and both match with our specimen.
Family Aeolidiidae Gray, 1827Aeolidiella stephanieae Valdés, 2005Examined material: Ycl: 1 specimen (28-02-07), L 9 mm (CNMO2996); 1 specimen (18-05-07), L 10 mm, both beneath rocks. Diagnosis: Valdés et al., 2006: 274Distribution: USA (Florida) (Valdés et al., 2006); Mexico: YUC (Sanvicente-Añorve et al., 2012).Remarks: This species feeds on sea anemones (Valdés et al., 2006).
Aeolidiella sp 1 (fig. 2)Examined material: Mad: 1 specimen (06-06-07), L 15 mm, over Padina sp.Diagnosis: Opaque white elongated body with foot slightly wider than the rest of the body and translucent white. Oral tentacles orange and well developed. The anterior corner of the foot is small, triangular, and of the same color as the rest of the foot. Smooth orange rhinophores with no other sculpture. Numerous and densely arranged cerata, without forming groups, the digestive gland of brownish color with white tips.Distribution: Thus far, known only from Madagascar reef, Campeche Bank.
Aeolidiella sp 2 (fig. 2)Examined material: Mad: 1 specimen (05-09-07), L 14 mm, over green algae.Diagnosis: Opaque white elongated body with a translucent white foot. White Oral tentacles, well developed with a translucent white base. Smooth opaque white rhinophores with no other sculpture, with a white translucent base. Numerous and densely arranged cerata, without forming groups, red digestive gland with white tips.Distribution: Thus far, known only from Madagascar reef, Campeche Bank.Remarks: The two species of Aeolidiella didn t match the same coloration patterns of any of the known species of this genus for this geographical area A. indica Bergh, 1988, A. benteva (Er. Marcus, 1958), and A. stephanieae.
Spurilla neapolitana (delle Chiaje, 1841)Examined material: Boc: 1 specimen (30-01-07), L 12 mm, under ro ck; Ycl: 1 specimen (31-01-07), L 10 mm, under rock; 3 specimens. (28-02-07), ML 22 mm, over brown algae; 3 specimens (18-05-07), ML 18 mm, under rock.Diagnosis: Valdés et al., 2006: 270Distribution: Circumtropical. Western Atlantic: USA (Florida and Texas); Mexico: VER (Zamora-Silva and Ortigosa, 2012), YUC (Sanvicente-Añorve et al., 2012); Belize; Honduras; Costa Rica; Colombia; Venezuela; Brazil Bahamas; Bermuda; Virgin Islands; Jamaica; Puerto Rico; Barbados; St. Vincent and the Grenadines; Curaçao (Valdés et al., 2006).Remarks: This species feeds on anemones of the genus Aiptasia (Valdés et al., 2006).
DISCUSSION
The information of the distribution of these species partially fills the information gap of this group of gastropods in the Campeche Bank, Yucatan Peninsula, a very interesting transition area between the Gulf of Mexico and the Caribbean Sea. The number of species registered during this survey is the result of the sampling effort focused exclusively in this group of mollusks. The number of species recorded here is higher than those found by Zamora Silva and Ortigosa (2012), and Sanvicente-Añorve et al. (2012), since the habitats studied here include two different areas (lagoons and reefs), and also due to the use of SCUBA equipment. The indirect methods were the best to find small, cryptic and shell-less species, as it can be confirmed in Table 3. The methods used in the present study prevented damage to the fragile body structures of the shell-less species, enabling the observation of complete and intact morphological characteristics. To date, almost all the opisthobranch species reported for the Atlantic coast of Mexico were those having a well-developed calcareous shell such as J. punctostriatus, B. occidentalis, and A. canaliculata those with large size such as A. dactylomela and A. brasiliana (Zamora-Silva and Ortigosa, 2012). and only the study of Sanvicente-Añorve et al. (2012) reported cryptic and small species. The shelled seaslugs are well preserved in sand and mud samples, and
71Thalassas, 29(1) · January 2013
Area Cephalaspidea Sacoglossa Aplysiomorpha Notaspidea Nudibranchia Reference
Caribbean 29% 15.6% 5.2% 4.6% 45.7% Bertsch, 2009
Brazil 25.9% 10% 6.3% 5.4% 50.7% Bertsch, 2009
Colombia 32.47% 6.49% 24.29% ? 40.26% Ardila et al., 2007
Campeche
Bank
16.92% 24.62% 12.31% 0% 46.15% (Eutenidiacea+
Cladobranchia)
Sanvicente-Añorve et
al., 2012, this study
Table 4:Richness species of opisthobranchs in different areas.
DENEB ORTIGOSA, NUNO SIMÕES & GONÇALO CALADO
the larger ones could be easily observed, leaving the cryptic species undiscovered. Nevertheless, there are still places that were not sampled, such as live coral, sand beaches or mangroves swamps, and therefore, the number of species could increase in the future. Out of the 51 species of seaslugs reported in this study, six species have no shell and 17 species were 16 mm or less of total length in the adult stage. This could be the first record of T. cf. tenuilineata for the east coast of the Atlantic Ocean; it has been reported only in the Azores Islands (Wirtz, 1998) and in Australia (Miller and Haagh, 2005). Sisal village has an small harbor, almost confined to fishermen of the village, due to this, T. cf. tenuilineata could be introduced by ships that arrived to the Progreso Harbor (eastern of the study sites). The present checklist includes 23 species of seaslugs that are new records for the Mexican Atlantic coast (including Gulf of Mexico and Caribbean Sea). Compared with Sanvicente-Añorve et al. (2012), only 17 species were shared between studies suggesting possible differences between the reefs. Nonetheless, efforts must be made to improve the knowledge of the seaslug fauna of the Campeche bank.
In this study the clade Sacoglossa has the highest specific richness, followed by Eutenidiacea, Cephalaspidea, Aeolidina, Anaspidea, and Cladobranchia. The Eutenidiacea+ Cladobranchia group (Nudibranchia) were the most diverse with almost the half of the records, as happens with other studies at the Campeche Bank (Sanvicente-Añorve et al., 2012), Caribbean Sea (Bertsch, 2009), Colombia (Ardila et al., 2007), and Brazil (Bertsch, 2009) (Table 5). The diversity of the other clades differed between the areas. In this study, Notaspidea species were not found, as in Sanvicente-Añorve et al. (2012), although the group is reported in the warm Atlantic waters of Colombia and Brazil (Valdés et al., 2006; Ardila et al. 2007; Bertsch 2009).
From the entire species recorded, seven have a widespread distribution (A. dactylomela, B. leachii pleii, S. striatus, L. souverbii, P. dendritica, S. pelagica, and S. neapolitana), and two are recorded for the Atlantic and Pacific coasts of Mexico (C. hirundinina, and L. souverbii).
Out of the 111 species of opisthobranch reported for the Atlantic Mexican coast, 37 were reported for the Gulf of Mexico, 36 for the Mexican Caribbean, and 20 of the records do not specified the locality (Valdés et al., 2006). With the contribution of the present study, the actual number of opisthobranch fauna in the Campeche Bank increases to 84 species, representing a 64% increment of the biodiversity knowledge on the region’s species
richness of this particular taxa. As expected, due to the spatial distribution of the sampling stations we found opisthobranch species that had already been reported in the Caribbean and in the Gulf of Mexico, as it happens with other species of invertebrates that share species between regions (González et al., 1991; Gutiérrez et al., 1993; Jordán-Dahlgren, 2002).
From the 18 total species found in the lagoons, only three species were shared between both lagoons (B. occidentalis, A. brasiliana, and S. neapolitana), each one of different clades (Cephalaspidea, Aplysiomorpha, and Cladobranchia). Similarly, from the 35 species total found in the three reefs, only two (E. patina and H. picta) are shared between them from two different clades (Sacoglossa and Eutenidiacea). This could be due to the great diversity of the feeding resources inside the group (Nybakken, 1974; McDonald and Nybakken, 1991, 1997, 1999) and despite some similar habitats between each reef and between lagoons; there are differences in the feeding resources. The nudibranch D. krebsii is reported as common in the Caribbean (Valdes et al., 2006) but we only found it in seven out of the 57 sampled sites; and Elysia crispata Mörch, 1863, distributed in Veracruz reefs (Zamora-Silva and Ortigosa, 2012), at Alacranes reef (Sanvicente-Añorve et al. 2012), and at Mexican Caribbean (Á. Valdés, personal communication) was not recorder in this study.
According to Johnson and Gosliner (2012), all the Atlantic species of the Chromodoris genera have to be named as Felimida Marcus, 1971, and the species from the eastern Pacific, Atlantic, and Mediterranean known as Hypselodoris, and the eastern Pacific and Atlantic Mexichromis are part of Felimare clade, but due to the lack of molecular analysis in this study, we conserved the traditional names. The species of traditionally Mexichromis in this study are named as Felimare according to Johnson and Gosliner (2012) and Ortigosa and Valdés (2012).
As the objective of the present study was to update the opisthobranch fauna inventory of the Campeche Bank, Yucatan Peninsula, the lack of a quantitative sampling effort (using transects or quadrants), did not compromised the results, and indeed, the use of direct sampling using different collection techniques increased the rare and cryptic species numbers.
The adequate knowledge of the biodiversity of a specific area is critical for the establishment or management of conservation areas. Very large areas of the Mexican Atlantic coast remain unexplored for opisthobranchs fauna and these represent not only great
72 Thalassas, 29(1) · January 2013
SEASLUGS (Mollusca: Opisthobranchia) FROM CAMPECHE BANK, YUCATAN PENINSULA, MEXICO
challenges to increase our knowledge of this particular taxa in the region, but it also poses difficult logistic obstacles. Areas such as the Veracruz reefs at the western-central part of the Gulf of Mexico, the many cays of the Campeche Bank, the Mesoamerican Reef in the Caribbean sea, and a diverse system of coastal lagoons creates great opportunities for future opisthobranch fauna surveys and to increase the group species richness in the region.
ACKNOWLEDGEMENTS
We want to thank CONACyT for the M. Sc. scholarship through the Posgrado de Ciencias del Mar y Limnología, Universidad Nacional Autónoma de México (PCMyL, UNAM) (202617); Ecology research group of UMDI-Sisal, UNAM (M. Badillo, A. Gallardo, M. Mascaró, J. Aranda, Q. Hernández, S. Zarco, M. Oseguera, F. Mex); Dr. Ángel Valdés, California State Polytechnic University, Pomona; Natural History Museum of Los Angeles County (SEM); M. Reguero, B. Urbano, and S. Biro, UNAM; the Biology group of Universidade Lusófona de Humanidades e Tecnologias (F. Carlos, M. Albuquerque, C. Cúcio, P. Coelho). This work was funded by the UNAM (PAPIME PE207210) and CONACyT-SEMARNAT (108285 Project).
REFERENCES
Abascal AJ, Sheinbaum J, Candela J, Ochoa J, Badan A (2003). Analysis of f low variability in the Yucatan Channel, Journal of Geophysical Research 108 (C12, doi: 10.1029/2003JC001922, 2003)
Andrews J (1971). Sea shells of the Texas coast, 1st Edition, University of Texas Press, Texas, 298 pp.
Ardila NE, Báes DP, Valdés A (2007). Babosas y liebres de mar (Mollusca: Gastropoda: Opisthobranchia) de Colombia. Biota Colombiana 8 (002): 185-197.
Bertsch, H (2009). Book review of Indo-Pacific nudibranchs and sea slugs (Gosliner, Behrens and Valdés, 2008), with comparisons of global and Indo-Pacific opisthobranch taxonomic biodiversity and biogeography, Opisthobranch Newsletter, 30: 1-9.
Bouchet P, Rocroi J (2005). Classification and Nomenclator of Gastropod Families, Malacologia, 47: 1-357.
Carmona L, Malaquias MA, Gosliner TM, Pola M, Cervera JL (2011). Amphi-Atlantic distributions and cryptic species in Sacoglossan sea slugs, Journal of Molluscan Studies, 77: 401-412
Chávez E, Hidalgo E (1998). Los arrecifes coralinos del Caribe Noroccidental y Golfo de México en el contexto socioeconómico, Anales del Instituto de Ciencias del Mar y Limnología, 15(1):167-176.
Chávez EA, Hidalgo E, Sevilla ML (1970). Datos acerca de las
comunidades bentónicas del arrecife de Lobos, Veracruz, Revista de la Sociedad Mexicana de Historia Natural, 31: 211-280.
Clark K, Jensen K, Stirts H (1990). Survey for functional kleptoplasty among West Atlantic Ascoglossa (=Sacoglossa) (Mollusca: Opisthobranchia), The Veliger, 30(4): 339-345.
Clark, K (1994) Ascoglossan (=Sacoglossa) mollusks in the Florida Keys: rare marine invertebrates at special risk, Bulletin of Marine Science, 54(3): 900-916.
Cruz-Ábrego FM, Toledano-Granados A, Flores-Andolais F (1994). Ecología comunitaria de los gasterópodos marinos (Mollusca: Gastropoda) en Isla Contoy, Revista de Biología Tropical, 42: 549-556.
Ekdale AA (1974). Marine molluscs from the shallow-water environments (0-60 meters) off the northeast Yucatan coast, Mexico, Bulletin of Marine Science, 24(3): 638-668.
Flores-Andolais F, García-Cubas A, Toledano-Granados A (1988). Sistemática y algunos aspectos ecológicos de los moluscos de la Laguna de la Mancha, Veracruz, México, Anales del Instituto de Ciencias del Mar y Limnología, 175(2):235-258
García-Cubas A (1971). Ecología and distribución de los micromoluscos de la Laguna de Tamiahua, Veracruz, México, Universidad Nacional Autónoma de México, Boletín del Instituto de Geología, 91: 1-53.
García-Cubas A, Escobar F, González L, Reguero M (1990). Moluscos de la Laguna de Mecoacan, Tabasco, México: Sistemática y ecología, Anales del Instituto de Ciencias del Mar y Limnología, 17(2): 309-343.
García-Cubas A, Escobar F, Reguero M (1999). Gastrópodos marinos de la Península de Yucatán, México, Revista de la Sociedad Mexicana de Historia Natural, 49: 127-146.
García-Cubas A, Reguero M (1990). Moluscos del sistema Lagunas Tupilco-Ostion, Tabasco, México: Sistemática y ecología, Anales del Instituto de Ciencias del Mar y Limnología, 17(2): 345-359.
García-Cubas A, Reguero M (1995). Moluscos de la laguna de Sontecomapan, Veracruz, México: sistemática y ecología, Hidrobiológica, 5 (1-2): 1-24
García-Cubas A, Reguero M, Elizarrarás R (1992). Moluscos del Sistema Lagunar Chica-Grande, Veracruz, México: Sistemática y ecología, Anales del Instituto de Ciencias del Mar y Limnología, 19(1): 71-101.
García-Cubas A, Reguero M, Jácome L (1994). Moluscos arrecifales de Veracruz, México (Guía de Campo), Universidad Nacional Autónoma de México, Ciudad de México, 143 pp.
González MA, Chávez EA, de la Cruz G, Torruco D (1991). Distribution patterns of Gastropods and Bivalves at the Yucatan Peninsula, Mexico, Ciencias Marinas, 17(3):147-172.
Gosliner TM (1989). Revision of the Gastropteridae (Opisthobranchia: Cephalaspidea) with descriptions of a new genus and six new species, The Veliger, 32(4): 333-381.
Gosliner MT, Behrens DW, Valdés Á. (2008). Indo-Pacific
73Thalassas, 29(1) · January 2013

DENEB ORTIGOSA, NUNO SIMÕES & GONÇALO CALADO
nudibranchs and sea slugs. A field guide to the World s most diverse fauna. Sea Challengers Natural History Books, Hong Kong, 426 pp.
Gutiérrez D, García C, Lara M, Padilla C (1993). Comparación de arrecifes coralinos: Veracruz y Quintana Roo pp. 187-806 In: Biodiversidad Marina Costera de México. Salazar SI, González NE (eds). Com. Nal. Biodiversidad y CIQRO 865 pp.
Hicks DW, Barrera NC, Tunell Jr. W (2001). Ecological distribution of shallow-water Mollusca on the Alacran reef, Campeche Bank, Yucatan, Mexico, Texas Conchologist, 38(1): 7-30.
Johnson R, Gosliner TM (2012) Traditional taxonomic groupings mask evolutionary history: A molecular phylogeny and new classification of the chromodorid nudibranchs. PLoS ONE 7(4): e33479. doi:10.1371/journal.pone.0033479.
Jordán-Dahlgren E (2002). Gorgonian distribution patterns in coral reef environments of the Gulf of Mexico: evidence of sporadic ecological connectivity? Coral Reefs, 21: 205-215.
Malaquias M, Calado G, Cruz JF, Jensen K. (2012). On the occurrence of the Caribbean sea slug Thuridilla mazda Ortea & Espinosa, 2000 in the Eastern Atlantic Ocean, Marine Biodiversity Records, doi:10.1017/S1755267211001023.
Malaquias M, Reid D (2007). Systematic revision of the living species of Bullidae (Mollusca: Gastropoda: Cephalaspidea), with a molecular phylogenetic analysis, Zoological Journal of the Linnean Society, 153: 453-543.
McDonald G, Nybakken J (1991). A preliminary report on a world-wide review of the food of nudibranchs, Journal of Mollucan Studies. 57:61-63.
McDonald G, Nybakken J (1997). A worldwide review of the food of nudibranch mollusks I. Introduction and the suborder Arminacea, Veliger, 40 (2): 157-159.
McDonald G, Nybakken J (1999). A worldwide review of the food of nudibranch mollusks II. The suborder Dendronotacea, Veliger, 42 (1): 62-66.
Miller MC, Haagh JJ (2005). A new species of the dorid nudibranch genus Tambja Burn, 1962 (Gastropoda: Opisthobranchia) from Australasia, Vita Malacologica, 35 (3): 205-214.
Moore DR (1958). Notes on Blanquilla Reef, the most northerly coral formation in Western Gulf of Mexico, Institute Marine Science, 5: 151-155.
Nybakken J (1974). A phenology of the smaller dendronotacean, arminacean and aeolidacean nudibranchs at Asilomar State Beach over a twenty-seven month period, The Veliger, 16 (4): 370-373.
Ortigosa D, Valdés Á (2012) A new species of Felimare (formerly Mexichromis) (Gastropoda: Opisthobranchia: Chromodorididae) from the Yucatan Peninsula, Mexico, The Nautilus, 126 (3): 98-104.
Ortea J, Moro L, Espinosa J (1994). Nuevos datos sobre el género Elysia Risso, 1818 (Opisthobranchia: Sacoglossa) en el atlántico, Revista de la Academia Canaria de Ciencias IX,
(2-4): 141-155.Ortea J, Valdés A, García Gómez JC (1996). Revisión de
las especies atlánticas de la familia Chromodorididae (Mollusca: Nudibranchia) del grupo cromático azul, Avicennia suplemento, 1: 1-165.
Pérez-Rodríguez R (1997). Moluscos de la plataforma continental del Atlántico mexicano, 1st edition, Universidad Autónoma Metropolitana, Ciudad de México, 260 pp.
Quintana y Molina J (1991). Resultados del Programa de Investigaciones en arrecifes Veracruzanos del Laboratorio de sistemas Bentónicos Litorales, Hidrobiología, 1(1): 73-79.
Redfern C (2001). Bahamian Seashells: A thousand Species from Abaco, Bahamas. Bahamian Sea Shells Inc. Florida. 280 pp.
Reguero M, García-Cubas A (1989). Moluscos de la Laguna de Alvarado, Veracruz: Sistemática y ecología, Anales del Instituto de Ciencias del Mar y Limnología, 16(2): 279-306.
Reguero M and García-Cubas A (1993). Moluscos de la Laguna Pueblo Viejo, Veracruz, México: Sistemática y ecología, Anales del Instituto de Ciencias del Mar y Limnología, 20(1): 77-104.
Rice WH, Kornicker LS (1962). Mollusks of Alacran Reef, Campeche Bank, Mexico, Institute of Marine Science, 8: 366-403.
Rice WH, Kornicker LS (1965). Mollusks from the deeper waters of the northwestern Campeche Bank, Mexico, Publications of the Institute of Marine Science, 10: 108-172.
Rios EC (1994). Seashells of Brazil. 2nd ed. Editora da FURG, Rio Grande. 368 pp.
Rosenberg F, Moretzsohn F, García EF (2007). Gastropoda (Mollusca) of the Gulf of Mexico. In: DL Felder, DK Camp (Eds.) Gulf of Mexico Origin, Waters, and Biota. 1st edition, Vol. 1 Biodiversity, Texas A&M University Press, Texas, 1312 pp.
Sanvicente-Añorve L. Solís-Weiss V, Ortigosa J, Hermoso-Salazar M, Lemus-Santana E (2012). Opisthobranch fauna from the National Park Arrecife Alacranes, southern Gulf of Mexico, Cah. Biol. Mar., 53: 447-460.
Sheinbaum J, Candela J, Badan A, Ochoa J (2002). Flow structure and transport in the Yucatan Channel, Geophys, Res. Let. 29, doi:10.1029/2001GL013990.
Spalding MD (2004). A guide to the coral reefs of the Caribbean, 1st edition, University of California Press, Berkeley, 256 pp.
Strenth NE, Blankenship JE (1977). Notes on Sea Hare of South Texas, The Veliger, 20 (2): 98-100.
Valdés Á, Hamann J, Behrens D, DuPont A (2006). Caribbean sea slugs. A field guide to the opisthobranchs mollusks from the tropical northwestern Atlantic, Sea Challengers Natural History Books, Washington, 289 pp.
Vicencio de la Cruz F, González-Gándara C (2006). Lista actualizada de los gasterópodos de la planicie del arrecife Lobos, Veracruz, México, Revista UDO Agrícola, 6(1): 128-137.
Vokes HE, Vokes EH (1983). Distribution of shallow-water marine Mollusca, Yucatan Peninsula, Mexico. Mesoamerican
74 Thalassas, 29(1) · January 2013
SEASLUGS (Mollusca: Opisthobranchia) FROM CAMPECHE BANK, YUCATAN PENINSULA, MEXICO
75Thalassas, 29(1) · January 2013
Ecology Institute, Monograph 1, Tulane University, New Orleans, 183 p.
Wägele H, Klussmann-Kolb A (2005). Opisthobranchia (Mollusca, Gastropoda) - more than just slimy slugs. Shell reduction and its implications on defense and foraging, Frontiers in Zoology, 2: 1-18.
Wiley G, Circé R, Tunell J (1982). Mollusca of the rocky shores of East Central Veracruz State, Mexico, The Nautilus, 96: 55-61.
Wirtz P (1998). Opisthobranch Molluscs from the Azores, Vita Marina, 45 (1): 1-16.
Zamora-Silva A, Ortigosa D (2012). Nuevos registros de opistobranquios en el Parque Nacional Sistema Arrecifal Veracruzano, México, Revista Mexicana de Biodiversidad, 83: 359-369.
Zamora-Silva A, Naranjo-García E (2008). Los opistobranquios de la Colección Nacional de Moluscos, Revista Mexicana de Biodiversidad, 79: 333-342.
(Received: January 17, 2012; Accepted: October 30, 2012)


An International Journal of Marine Sciences
Number 28 (2) July 2012
Thalassas