29 july 1996 - virginia tech
TRANSCRIPT
MANAGEMENT INFORMATION SYSTEM INFRASTRUCTURE FOR A PROPOSED HIGHWAY MANAGEMENT SYSTEM FOR THE VIRGINIA
DEPARTMENT OF TRANSPORTATION
By
Steven T. Smayda
Thesis submitted to the Faculty of the
Virginia Polytechnic Institute and State
University in partial fulfillment of the
requirements for the degree of
MASTER OF SCIENCE
IN
CIVIL ENGINEERING
APPROVED
Jesus M. de la Garza, Ph. D., Chair
R. Donald Drew, Ph. D. Michael C. Vorster, Ph. D.
29 July 1996
Blacksburg, Virginia

LD 5655 355 1946
S639 Go

Virginia Polytechnic Institute and State University
Abstract
A MANAGEMENT INFORMATION SYSTEM
INFRASTRUCTURE FOR A PROPOSED HIGHWAY
MANAGEMENT SYSTEM
by Steven T. Smayda
Chairperson of the Supervisory Committee: Professor Jesus M. de la Garza Department of Civil Engineering
The purpose of this work was to develop an infrastructure for a Management
Information Svstem concurrent with the development of a System Dynamics model
for VDOT’s Highway Management System and the Interface between the two.
Specifics include identifying the detailed source for each parameter or developing
recommendations for future data collections. The MIS is to be in both a hard (paper)
and a soft (paperless) format. The soft copy will be based on the hypertext format and
be Windows compatible.
Parameters to be researched were identified from the model simulation code and causal
diagrams. These were then grouped into common themes and/or sources, assigned a
target date for research, and discussed with key personnel at VDOT with regards to
their validity within the model and from a data collection stand-point. Those
parameters identified as not obtainable, due to gaps within VDOT’s database system
were then estimated using engineering judgment in conjunction with key personnel at
VDOT. Obtainable data was gathered from VDOT’s databases and annual reports as
well as other sources. Key VDOT personnel then reviewed all gathered data for its

soundness. Researched parameters were then written-up with any assumptions,
definitions, and sources outlined along with the current value based on the 1995 data.
Although VDOT’s databases were effective in obtaining data for the majority of the
parameters, gaps exist within the system, which required significant input from key
personnel for recommended data collection. VDOT’s personnel proved to be the
most valuable asset in data compilation.
Of particular note is the need for statistical analysis of the data in the form of control
charts to determine the relative validity of each value within the parameter’s
distribution.

TABLE OF CONTENTS
TABLE OF CONTENTS ............cccccsscsscscccscccccccscccsccescecarscscccscceccccccsrsccsccsscccacsccsccccssccsesssesccscesscscsscscoecs iv
LIST OF FIGURES... cc cccscescccccsccnsccscccsccucccscscsvscccceccccccccscesccsccsccssccssccscecessscesosecsscescsccscscescsseees Vill
ACKNOWLEDGMENTS 2............cccccssscvssscsssccscsccssccsssscccscscscccescccsccrscceccnssccccccsscscsccscccscescsscccscccssescees Vill
CHAPTER 1 - INTRODUCTION uuu... cccscccscccsccsccccscnsccscccecccccssccccccccccccsscccecccecescccsccsseccsesescescsacs 1
BACKGROUND 00.0. ccc ccccccccccccccccccucecseeeceuecucuscecseerscueuetseseeesderteneaeasenenersusnsaeeucesascnenerteusrestsetencttrtenteetaeess I
OBJECTIVES 200. occccccccceececcceccececcccceceseecuccuceuucceetaessneesesecectaeeeecencetscensteceveseeecsuerseeesececeesecsecunetieteeetteereens 3
SCOPE AND LIMITATIONS 0000.00. .cccccccccccccececccccccucccesececccceceecueceuseeeecucsceuceecseceeceuseeceecenesectsuerttetverteaneerees 4
CHAPTER 2 - METHODOLOGY 20.0... ccc ecccccccsvcnvscecececcceccccccscescsteccncccsnccnscccscccsscssccssccscsececessosscees 6
INTRODUCTION 0 o.oo c ccc cece cc cccecccccecececrencacaccusecteeteeveusuesteueveneneesceeeeeveveveusteeeveverectetesesteatateretieiteveceneeens 6
IDENTIFICATION OF MODEL PARAMETERS .....c.ccccccccceececccccccecucceceverscuseesteaeeuecesaceusensteseueeesaucecuettteneseceness 7
ANALYSIS AND GROUPING OF PARAMETERS .o..0.0ccccccccceccuscececercecccueececcseeuceescecaesuteucenseueeisenerteartesertreeens 7
INDIVIDUAL PARAMETER RESEARCH. .0...0.0.0cccccccccccceccccesnccecececesececececeeeeseuceensrsteneaeasuceetttnseenertttterererssees 8
DATA ANALYSIS 000. cccccccccccccccecccccccuccucccecececccesuecenerseesesagresessetenenenenseetaectneetetacesetaenesteesnerererstreebenecenens 10
PARAMETER WRITE-UP 0.0.0. co.cc cece cccccceccccecccccccucucecccnsectsestecestcucuceeesesstectetevaneratenes vevevceccevacacaseeectaveeseees 11
STATISTICAL ANALYSIS ISSUES... 00. .0ccccccccccecccccuccecceceecccceececccscuecnceesacrtetersstseueresstertereteteueresettnteneetsenees 13
CHAPTER 3 - THE DEVELOPMENT OF THE MIS HELP FILE~z.w............. cc ececcsccsscescncscccsccccescece 17
THE OBJECTIVE ooo. ccc ccecececcccccccececececcucesccseeccenecencuseuccuerecserscaeeesecueeensneusntutteeeesessteetseuseessessttttteeetenes 17
THE SOFTWARE 2. ..cccccccccccecececcecccccneeececececcucacceeesessesessesageneeesesecaseeseeeteeeaeseseeeteseettesatsteuseesitrtetenseneeees 17
HELP FILE CONSTRUCTION 00000... 0occccccecccccccecccececcessccceseeucs bevececceeeeeeaeaeaececesececteusncnstseeacesssteseettettcterereees I8
CHAPTER 4 - SUMMARY AND RECOMMENDATIONS ..............cccccscscssssccccsccccccscccseccsssceccscscesces 23
ENISTING VDOT DATABASES 00.0.0.0cccccccccccccccceccucecccucccccseceeceesetensaesrsteeeeseettetrstttrtttttitittittsttteteecs 23
THE HUMAN PACTOR 0.0. o ccc cc cece cc ccecece cucu ccccccecececueceressseeueuerevesecneneeserestecnettettttttrtttttittetitretttttttrerss, 23
FUTURE SOURCES OF INFORMATION 00... cccccccccecceccececccuccecceveneteccusesensseettsecttresretscrteteritittittittitttttties. 23
RECOMMENDED DATA COLLECTION 000. ....cccccccccccccccccucccucceceecctecseuceeeuedeeeeeceteseectttittctutecscicististtececeeses 26
REFERENCES 1..........ccccccsscsccsscssccsccsscscssccssceseccescccscsscscscccscccscccccecssacescssccsssccssacccscscoscsssesssesesscansceccoecens 27
APPENDIX A: DATABASE SPREADSHEETS .2............cccccsccscsscssccscccccsscsscsscsccsssssssssccescnssonccnesecscnes 28
EVALUATION SUBSYSTEM ......cccccccccccccccccccccecceeececacessreccsueceeececeeccueceuessesteseretsrsessttuetetestsssereteuescrteeress 28
FINANCIAL SUBSYSTEM... oo... ccccccccccccccceccuccuccuccecencceccusenscecnseeeesaecesareterscueeeestsasenstettstaetescrscessuteserecepens 30
FUNCTION AL SUBSYSTEM... cc ccccccccceccccececencsececcceeeeccscececeneneeeencaceesucreneaeeeesenersnsstesetetatersrsvssatutveveceneens 32
PHYSICAL SUBSYSTEM: BRIDGE MANAGEMENT SYSTEM .......0c.ccccccccccecececcuceuccccuceeseetecscecegesestecusnceecey 3
PHYSICAL SUBSYSTEM: PAVEMENT MANAGEMENT SYSTEM .......c.cccccccececececccceceseucutesstssesesesecsessitcessecs 36
APPENDIX B: PARAMETER WRITE-UPS ...0.............cccecsscccccscsccccsccvcccsconsccscecsccccssescsccccscscsccesescsses 37
AVERAGE ANNUAL DAILY TRAFFIC VOLUME (AADT)....0..00..0.00000000... beccueuercecueesetececuseers vececeeeaversesesces 37
ACCELERATED DETERIORATION TIME OF BRIDGES (ADTB) 0.00.00. 00c ccc oc cece cece cece ccueceeccueteuecetateeessreseass 39
AVERAGE DISTANCE TRAVELED PER GALLON (ADTPG) 000.0... ooc coco ee cc eccc cece ccce cet eteteececesesestetesceeeeees 40
AGING TIME OF HIGHWAY (ATH) 20.00.0000 ccccccccc cece ccc cc cece cc cane cece neces cee eeeeeceeeseceueeesaecsutevreserieecreereneeanees 41

AVERAGE MILES TRAVELED PER VEHICLE (ATM)... 00000000000 ccc ccc cece ccc e cece teetu ee seeeece tee eeta ees cee eee teteeeies 42
AVERAGE VALUE OF A VEHICLE REGISTERED IN VIRGINIA (AVWVYV) ooo cece eee bevceeseeteeteeteeeeeeees 45
BRIDGE BUDGET (BB) 000000. .ooccoe cc ce cc cce ccc ccc cece cence be bebe ence ete be tebe tee beeceeeeeseceeeesseeeeeerins voce c eee eee eens 44
BRIDGES IN FUNCTIONALLY ADEQUATE CRITICAL CONDITION (BFACC) ooo. cccc cc cecc cece ene c ccc neee eens +8
BRIDGES IN FUNCTIONALLY ADEQUATE FAIR CONDITION (BFAFC) 0.o0occ cocci ccc cc cnc ccc ne cece cece ese eee neces 46
BRIDGES IN FUNCTIONALLY ADEQUATE GOOD CONDITION (BFAGC)..00.. ooo cece cece ccc ee cece eee eens 47
BRIDGES IN FUNCTIONALLY ADEQUATE POOR CONDITION (BFAPC) oooo0cocccccccccce cece ce cece cece cece bet ee eeeens 48
BRIDGES IN FUNCTIONALLY ADEQUATE PREFERRED CONDITION (BFAPFC) 00000... cceccccccceccceeccecceneecee ees 49
BRIDGES IN FUNCTIONALLY INADEQUATE CRITICAL CONDITION (BFICC) .o000.000 occ cccc cee ccc cece c ccc ec arcu ees 50
BRIDGES IN FUNCTIONALLY INADEQUATE FAIR CONDITION (BFIFCO) ooo cccc ccc ccceccceeeecceeeseeeseeeeenes 5]
BRIDGES IN FUNCTIONALLY INADEQUATE GOOD CONDITION (BFIGC) ..000. 00 cccccccc cece ec cceece eee eeeseecneseeees JD
BRIDGES IN FUNCTIONALLY INADEQUATE POOR CONDITION (BFIPCO) 00.00. cece 33
BRIDGES IN FUNCTIONALLY INADEQUATE PREFERRED CONDITION (BFIPFC)...0.000..00cccccccccccccc cc eeee eee S4
BIRTH RATE PARAMETER OF VIRGINIA (BRPV) 0000.00.00 ccc ccc cece cece ence cece cede cece ee see etet beeen eeteetecies veces 56
BRIDGE WIDENING BUDGET (BWB)..000000 0. coco ccc cc ccc cece cece cece ecu eet tee eeeeceeseeteeeetceinestitisettettttetttsttcsttteseee D7
BRIDGE WIDENING COST (BWC) ooo... coco ccec cc cccec ccc ccce cece ceccneeccceeneeeceeeeeeeeseteeteseettegieeseeeteteeeeteesscseeeesiaes 38
AVERAGE COST OF BEARING AND ANCHOR BOLT REPLACEMENT (CBAR) .00..o..cccccccceccecc cee cecc eee cceeeeeeeee 59
AVERAGE COST OF CONCRETE BEAM END REPAIR (CCBR)...000. coco ccccc cc cccce cc ccce cece nes cee eeeceteteteeteteeeeeaeees 61
AVERAGE COST OF CONCRETE DIAPHRAGM REPAIR (CCDR) 0000. 0oc coco ccc ccc cccc cece ce eccecevescneeeeseteeceeennenes 63
AVERAGE COST OF CATHODIC PROTECTION (CCP) ooo... 000 coco cc cccccc eee ee cece cca e ee be bebe betes ben beeet ti nbeeeeeenes 65
AVERAGE COST OF DECK EDGE REPAIR (CDER) 0000000000000 coco coco cce cence cee cee cece eee seb seen beeen eet eceeceernenena 67
AVERAGE COST OF DECK REPLACEMENT (CDKR) 000. ooo ooo occ cece cc ce cc ecccececueeceuescueessureeeueteuseessenecaeseeey 69
AVERAGE COST OF DECK OVERLAY (CDO) .....0....... cove ceccececseteeceececeeeseceueeueteeeuesrysntretsecevetetevestetesseeeees 7
AVERAGE COST OF DRAINAGE SYSTEM REPLACEMENT & REPAIR (CDSR).o000.. occ e cece cecc cece eeeec eee 3
AVERAGE COST OF EXPANSION JOINT MAINTENANCE (CEJM) oo o.occcccccccccccccececcceccccescuescaeseneeees coc eeeseeeaee 74
AVERAGE COST OF EXPANSION JOINT REPLACEMENT (CEJP) ooo cc ccccoccccccccccccececccsceeeceesceeueseevessraevevsaes 76
AVERAGE COST OF PATCHING (CPCH) 2000.0. cocoon cece ce etc etc ne cee eteeeseeetneteb esta etciettetenterstetetereereees 78
AVERAGE COST OF PARAPET GUARD RAIL MAINTENANCE (CPGM) ooococccccccceccccccccccececeeeeeeeeceesceseseeeeees 80
AVERAGE COST OF REPAIR OF ABUTMENT (CRA) 0000.0 cocci cccc ccc cce cece ccc eccceeccceecueeseaeereaeserneriestiseecreesens 82
AVERAGE COST OF REPAIR OF COLLISION DAMAGE (CRCD) oo ooo cocci ccccccceecceecccueceseecsreseeeceivececenseeas 84
AVERAGE COST OF REPLACEMENT OF ABUTMENT (CRLAD..00 ooo 0c oocccccccc cece cceeccccecceee rescue reteeseceresiaeesenees 85
AVERAGE COST OF REPLACEMENT OF PIER (CREP)..0 ooo. coco cc cece cece ccc ecceeceueceusceusseuctevenvereeecsuteseaes $7
AVERAGE COST OF REPAIR OF PIER (CRP).......0...... Lecce cece eee c eee e eee eeeteetesueecuueesunesseseestetinecstesnerneenenens 89
AVERAGE COST OF REPAINTING (CRPT ) ooo..0c cocci ccc ccccceccc ccc eccee ese eereve esse veceueeeaessrieeteaestnterecrrerteteeneeees 9]
AVERAGE COST OF SCOUR (CS) oii cccc cece cence cece ce eee ce bette este ceteueteseeeesteripesteaeseetrnetetiieesteecenereas veeeeaee 93
AVERAGE COST OF SEALING DECK/CRACK (CSDCO) o.oo. ooo cece cece ce eee ebb e beet eee bebebeteeeeeteees 95
AVERAGE COST OF STRUCTURAL STEEL SECONDARY MEMBER REPLACEMENT AND REPAIR (CSMR)..... 97
AVERAGE COST OF SPOT PAINTING (CSP) ooo oc ccc cece ccc ccccce cece eeceeccucecevecevvecuveveeeterteseerereneveveresanesaeeeens 99
AVERAGE COST OF SUPERSTRUCTURE REPLACEMENT (CSSR) oo... ccccccccccc cc ccececccneccccueccecuecsseeseevecsevecsane LO]
DETERIORATING TIME OF HIGHWAY (DHT) .00.00. 000 c beet b ete b tebe btte ete eteetnerenteens 104
DEATH RATE PARAMETER OF VIRGINIA (DRPV) 0000000 occ ccc cece cece cee ccecce cece ccc ccevevevcveeesetsinsaeseeeusrterereess 105
DETERIORATION TIME OF BRIDGES (DT TB)... o.oo cece ccc etic c eee b ee eb tee bette tebe stde btn tegetbeeeeeera 106
EXPOSURE TIME OF BRIDGES (ETB) 0.000.000... ccc cc cece ccc cece ccc cence cee e nbc e ceca bbc e tebe b ett etcnetaetaeceeertenteneeaes 107
FEDERAL AID TO VIRGINIA (FAW) ooo cece ccc c cece cent nett be cee eesuretsn seca seseretenesevapersneeaeesrerereaneney 108
FRACTION OF THE BUDGET TO BRIDGE WIDENING (FBBW).oo ooo. c coc c ccc ccc cccccnccececcuccececeevevsseecueeaes 109
FRACTION OF THE BUDGET TO FUNCTIONALLY ADEQUATE MAJOR REPAIRS OF BRIDGES (FBFAJRB)...111
FRACTION OF THE BUDGET TO FUNCTION ALLY ADEQUATE MINOR REPAIRS OF BRIDGES (FBFANRB)..113
FRACTION OF THE BUDGET TO FUNCTIONALLY ADEQUATE PREVENTATIVE MAINTENANCE OF BRIDGES
(FBFAPMB) ooo. c ccc cece cece cece eee e eee e ede se bce ete cee tessa seu setuerensrapereseuessuessrerseesarersesetensentenes 115
FRACTION OF THE BUDGET TO FUNCTION ALLY INADEQUATE MAJOR REPAIRS OF BRIDGES (FBFIJRB)..117
FRACTION OF THE BUDGET TO FUNCTION ALLY INADEQUATE MINOR REPAIRS OF BRIDGES (FBFINRB).119
V

FRACTION OF THE BUDGET TO FUNCTIONALLY INADEQUATE PREVENTATIVE MAINTENANCE OF BRIDGES
(FBFIPMB) 00.0... 0occ cece cence cece ccc ee ccc ne cece teense en eee ee eeeneeeceeeeeennneeceneeeeepeneeeeneeceeneseeneeseteeetieeteseeeneessseeees 121
FRACTION OF THE BUDGET TO HIGHWAY CONSTRUCTION (FBHC)..00000.000 ccc ccc cec cc ecce ce eee ce eeteneseeenees 123
FRACTION OF THE BUDGET TO HIGHWAY MAINTENANCE (FBHM)..0..00 0.00. 0cccccce cece cecce cece eeeeeceerseseuenes 124
FRACTION OF THE BUDGET TO THE REHABILITATION OF BRIDGES (FBRHB)......0000.000..0 ccc cece cece ceeee cee 125
FRACTION OF THE BUDGET TO THE REPLACEMENT OF BRIDGES (FBRPB).......0........00..cc0cececeeeecceeeeteeeeees 126
FRACTION OF THE CONSTRUCTION BUDGET TO THE BRIDGE BUDGET (FCBB) «0.0... .000...ccccccccceeeecceneeeeee 128
FRACTION OF THE CONSTRUCTION BUDGET TO THE SALEM DISTRICT (FCBSD).........00...0cccccceec ccc eeeeeee 129
FRACTION OF THE MAINTENANCE BUDGET TO THE BRIDGE BUDGET (FMBB) ...................500c cece ce eeeeeees 130
FRACTION OF THE MAINTENANCE BUDGET TO THE SALEM DISTRICT (FMBSD) 0.00000... cccccccceeeecceeeeeeeee 131
FRACTION OF MOTOR VEHICLE FUELS TAX TO THE HMO (FMFTH)....00..0. 000.00 ccc cce cece eee eee ccc eceneceese eens 132
FRACTION OF MOTOR VEHICLE FUELS TAX TO THE TTF (FMEFTT) ....000...00.0.00000ccccccceccc eee eeceseeeceeneeenees 133
FRACTION OF MOTOR VEHICLE LICENSE FEE TO THE HMO (FMVLFA))............ 00.0. c0cccceeceeeseseueeceuereeees 134
FRACTION OF MOTOR VEHICLE LICENSE FEE TO THE TTF (FMVLFT) ....0.....0000.000.cccc ccc eccce cece eeeeeeeeeens 135
FRACTION OF MOTOR VEHICLE LICENSE FEE TO THE HMO (FMVSTH)........00.. 00... 0ceccceccceeeccceeccseevesens 136
FRACTION OF MOTOR SALES & USE TAX TO THE TTF (FMVSTT1)...000.... ccc cecc ccc ccc ce ceceeee tte e ee ceecesseneaneeed 137
FRACTION OF THE REVENUE TO THE HIGHWAY BUDGET (FRHWY) 0.000000... 0c coc cec ccc ee cee ce eee eceeceuccuseneeens 138
FRACTION OF STATE SALES TAX TO THE HMO (FSSH) o.oo ccecc cece eeece ccc eeecesceeseeceseseeeeeceeuanesesees 139
FRACTION OF STATE SALES TAN TO THE TTF (FSST) 0000... cccccc ccc ccceccee cece eeeee cece eeseeseeeseessesessueesesraneeseess 140
HIGHWAY CONSTRUCTION BUDGET FOR THE SALEM DISTRICT (HCBSD)......000000. coe cccceccccctecccceeeeeeees 141
HIGHWAY CONSTRUCTION BUDGET IN VIRGINIA (HCBV) 00. .0ccccccccceccccceeecccc ce eeecescuaeeeesteeeesunseeessuaesenes 142
HIGHWAY IN DEFICIENT PAVEMENT CONDITION (HDFPC)........ bbccueceeeceecuseseccuccuessectessteseeaeeaseueeeeeeneres 143
HIGHWAY IN DETERIORATED PAVEMENT CONDITION (HDTPC) ooo. o.oo cccec cc ccceecccccceceeceeeeccteueeceseuseseenes 144
HIGHWAY MAINTENANCE BUDGET FOR THE SALEM DISTRICT (HMB).....00..00.0.00 coco cecccccccescceccaeeceutereees 145
HIGHWAY MAINTENANCE BUDGET IN VIRGINIA CHMBV) ..0... coc cccc ccc cc ccc ccc cccecec nec ceeeseeeeeeeseecusereeeueeees 146
HIGHWAY IN SUFFICIENT PAVEMENT CONDITION (HSFPC) 200000. ocoe cc ccec cc cec ccc ceccceeccccesceeeseseerecaeresenneevens 147
INCOME INCREASING RATE PARAMETER (ERP)... oo... occ cc ccccc cc ccececccceecceneceeeeecceesecueeeeeeeeesescsreveseecenaners 149
IN-MIGRATION PARAMETER OF VIRGINIA (IMRPV) 00. cceccceecceececeeseeeceeeererseeesesceueecsecreeeuseceneecs 150
INFLATION FACTOR (INFLF)....0.. 000.00. 00 cece cece ccc cece eceeecccaeeeeueeeseeeecueseeeeseesteesceesessessescesetetssessecersneraness 151
OUT-MIGRATION PARAMETER OF VIRGINIA (OMRPY) 00.00 coco ccc ccccceccccecesece cee eecseueeesesaeseereaeecseuaeeeeens 152
OBSOLESCENCE TIME OF BRIDGES (OTB) ..000.....000..ccccceccccceeeccccccc ea ecececeuesessencecseneesscressesausececaerereserans 155
PER CAPITA INCOME OF VIRGINIA (PCIV)..00. 000.00. ccccccccccecccceecc cu eccuneceebenseceee eeu ceeesenesseesceetessiecrieesenesens 154
PERSONAL PURCHASE RATE (PPR) 0000... .00.0.ccccccccccccceeeeccceeeeseeeeceececueseseeeeseetecuuesesesseseesessttereeseseaaeresens 155
POPULATION OF SALEM DISTRICT (PS) oo... 00... ccccccccccecccceeccccceescessueccuseeceueecsseesesuaeceueetsneesessaseseseeveveness 156
POPULATION OF VIRGINIA (PY) occ ccc cece ccecc secs cccuccuececsecaveccescecseceueecueceuserecescesevaeceetstecsereensereeerans 157
RATE OF MOTOR FUELS TAN (RMPFT) 000000... occ ccc ccc cc ccc ec ccc ecccceeccceceteecueeensccurecensessesasecseseesaeeseesereneeans 158
RATE OF MOTOR VEHICLE LICENSE FEE (RMVLE) 200... coc cc ccccccccceeccceeecccuccccuececueeccaecserecsucecuevessreveeenes 159
RATE OF MOTOR VEHICLE SALES & USE TAX (RMVSUT)....00. cocci cce cc ceccceecenecee renee bececeecveceuteceueeees 160
RATE FOR STATE SALES TAX (RSST) ooo. ccccc cece cece cccceececcceceevscecececuucreccersececeuceeececaureeventereeeteeeeeeareeecess 161
SERIOUS DETERIORATION TIME OF BRIDGES (SDTB) oo..c cocci cceeccceeccneecccuucceuteceucsenesereneeeteeeeseeee: 162
STATE SALES (SS) oocccccccccc cece cece cececcccceseeeeee cee eeeeecegeseeeeeeeeeeseececesenaeeeseseseesseeeeseseseussessseseseuessecsuceeaaneees 163
TOTAL MILEAGE (TOTMILG) ...000.. ooo ccc cece ccec ccc eeccnenereccceeceseueecceaecceaeetsuuescsseessaesesessuseceureserareeeras 164
TRAVEL TIME ON LINK KL (TITLE L) 000. o coc ce ccc ceeccceeccceeccceeceesecuceeetceessasecaeceusceecsarcerseeeeenanees 165
ANNUAL TRAFFIC VOLUME (TVOL)..00...00occcccec cc ccccccccencececceccuueevececuuuececcueeccessuuvccccnecessseesauteeeeceaaereess 167
TOTAL VALUE OF VEHICLES REGISTERED IN VIRGINIA (TWVV).......0.....cccccccceecececceecessusestccavecseseueenteees 169
VEHICLE AVERAGE ANNUAL GROWTH RATE IN VIRGINIA (VAGR) .0o..o..ccce ccc cccccccceeccccuseececueececeeaneeess 170
VEHICLE INCREASING RATE IN VIRGINIA (VINC) .ooooccccccccccc ccc ccceeecccccaeececceeeccccaeecesseseccssstecccaueeecesaanesss 171
NUMBER OF VEHICLES IN VIRGINIA (VV)....0..00cc ccc ccccccecccecccceescevcecueceeuseesecerssuecsanesusetseccescatecereeensceneees 172
WEIGHTING FACTOR FOR BEARING AND ANCHOR BOLT REPLACEMENT (WFBAR)........0...0..0...ccccceeceeeee 173
WEIGHTING FACTOR FOR BEAM END REPAIR (WFCBR) 0000... .occ ccc cece ccccceceececeeeecencsanecseesecenseeeanseeaes 174
WEIGHTING FACTOR FOR CONCRETE DIAPHRAGM REPAIR (WFCDR) 00... 00.0.oooccee cc ccccecccceeccccuecececeuaeees 175

WEIGHTING FACTOR FOR CATHODIC PROTECTION (WFCP) 0.00.00... 0c cc ccc ccc cece eccccneceeeeceseveseseseeueeseraeeeeenes 176
WEIGHTING FACTOR FOR DECK EDGE REPAIR CWFDER) 0000000000 00o oc ce ccc ccc cecc ccc cee ccueccaesteesereeceereness 177
WEIGHTING FACTOR FOR DECK REPLACEMENT (WFDRR) ..0..00.0 00 coco cee ccc cece ce ccceeccnesesereceutecseneeesaeecsens 178
WEIGHTING FACTOR FOR DECK OVERLAY (WFDO)....0000.00cocccccccccceccceccc ee ccceeceveeccseecsersuescstuueceterenesens 179
WEIGHTING FACTOR FOR DRAINAGE SYSTEM REPLACEMENT AND REPAIR (WFDSR)..000..0 oe 180
WEIGHTING FACTOR FOR EXPANSION JOINT MAINTENANCE (WFEJM).....0..000..... beceeeeeceeecatetenseeteneeeenes 181
WEIGHTING F.ACTOR FOR EXPANSION JOINT RECONSTRUCTION (WFESIR) ooo... oc ccc ccecceccceececenececueeseeueee 182
WEIGHTING FACTOR FOR PATCHING (WFPCH)....0000000000 0. ccc ccccccceccce cece eect cee eeetecesceecusaeeeceseeeeseseeeeeereenes 183
WEIGHTING FACTOR FOR PARAPET GUARD RAIL MAINTENANCE (WFPGM) ....0000.00.coccceccccceeec cee eeecce sees 184
WEIGHTING FACTOR FOR REPAIR OF ABUTMENT (WFERA)..000..occcc cc cc ccc ccc cece cece ec eeseaesesuueseeeneeceseuenestess 185
WEIGHTING FACTOR FOR REPAIR OF COLLISION DAMAGE (WFERCD). 00.00 oococ ccc cccc ec ccccc cece cecececuveceeceeas 186
WEIGHTING FACTOR FOR REPLACEMENT OF ABUTMENT (WFRLA) 0000... occ ccc cceccceeceecccuceccuseccuseseeueseeuees 187
WEIGHTING FACTOR FOR REPLACEMENT OF PIER CWERLP) 0.000.000. 000 occ cece ccc cec ce ee cee eeecneeseneeceaeeesenaess 188
WEIGHTING FACTOR FOR REPAIR OF PIER (WERP).ooo ooo c ccc cccc cece cence ce eee cee ctte cette seeetuenesterateesenes 189
WEIGHTING FACTOR FOR REP.AINTING C(WERPT) 0.00... coco ccecccccccc cece ec ca cece ecae ssa ceeusecneseuecsunsesuaesseneretaaneetaa 190
WLIGHTING FACTOR FOR SCOUR (WES) 2oo0ococccccccccccc cece c cece cece eee beet ene eee enn b eee b eet ce dtd beeebetteeeteeteeesnes 191
WEIGHTING FACTOR FOR SEALING DECK CRACKS (WFSDC) 00000000000 occ c cc cece cece cnet eceteteeeeeeeeeeeenens 192
WEIGHTING FACTOR FOR STRUCTURAL STEEL SECONDARY MEMBER REPLACEMENT AND REPAIR
(WESMR). ooo oo icc ccec cece cc cccc cece ee ecu es nee cueceuccneeee peste esebeesepeseeesceesteesceneesesceetssesieseueesseseesteecsanecesisseseesensase 193
WEIGHTING FACTOR FOR SPOT PAINTING (WESP) 0o.o00. cc ccccc ccc ccc cence cece ccc ee cee eee ncee cn eeceudeeectuseeeeeeeaes 194
WEIGHTING FACTOR FOR SUPERSTRUCTURE REPLACEMENT (WESSR).oo o.oo .occcccccceccceecccecccceeceeteseneceeres [95
APPENDIX C: MODEL CAUSAL DIAGRAMG uu. ccccsssccctsccccsscsncccessscassccsenccctecssscceescceceuescceee 196
EVALUATION SUBSYSTEM 000.0000. 000cccccccccccceeccceecce sees cee beeee ee eeee ee eteeeseteueeeteceeeetedeeetettestetseetitetesrraneceeeens 197
FINANCIAL SUBSYSTEM. ..00. 00.00.00 cccccecc ccc cc cence cee e eee ee bec ee tees eesti cee geeeecettbteessetesesseeeseressenserneeiessanecenesaees 198
FUNCTIONAL SUBSYSTEM. 000.000. ccccccceecccecceeccueeeceuneseeceeseebeeseee este eette sees seseeetieeestsunsesssteetesstesesevneserens 199
PHYSICAL SUBSYSTEM: BRIDGE MANAGEMENT SYSTEM o00... 0000. cccccccceceeeccuceccuececcuvescueresersteeseveneeeeeeaes 200
PHYSICAL SUBSYSTEM: PAVEMENT MANAGEMENT SYSTEM oo..00.c.cccccccccccccccuecccuececeueessuevecssrnneseceueeses 201
APPENDIX D: DYNAMO) CODE oui... cccccssscssccsesscccccessscensescscesesesscoccsceeuceseseuescossseescssseseceeneeeseecs 202
EVALUATION SUBSYSTEM 0.....000.00ccccccecccecceeceseccuesenteseveseessrretinetsnetrrctietesstitteretttvererssressratessteeesrersern 22
FINANCIAL SUBSYSTEM. 2000.00. .cce ccc ccc cee c cece eee ee ee ee cence epee ce bee te eetdeeee eee cceueteessesesestaternresipersresesiettereveseas 205
FUNCTION AL SUBSYSTEM... 00.0. 0cccccccccccecceece cee eeeceeeeee eect se eee cen eee te eeetebeesecetugsecessteeaecseueeetevesserneseecaaereess 208
PHYSICAL SUBSYSTEM: BRIDGE MANAGEMENT SYSTEM o000..0ccccccccccceccccecceveccreeceseuceesuesersanesessteeesserens 211
PHYSICAL SUBSYSTEM: PAVEMENT MANAGEMENT SYSTEM o00..00c0ccccccccccceccccceceecceeceessereeerenstesteeseneseers 214
APPENDIX E: MIS SOFTWARE 1..000........ccssscccnsscccsssscesscscecsscscnscecsscessescesceenssccnesessnscccenscsscesensecesees 215
VITA ,..........ccccccescccscccoscccstsccescescnssoncccesenercnsccescenssessccevccesssanssoneseaesseeseescesnensceneceeesenescenssesceseeceseueceeoeses 216
Vil

LIST OF FIGURES
Number Page
FIGURE | - DATA FLOW WITHIN THE RESEARCH PHASE 000.000.0000 cccccccecccceceeeeceeeeeeeescueseeeesueseeessieseugeseesseaeeeen 6
FIGURE 2 - SAMPLE SPREADSHEET FROM THE BRIDGE SUBSYSTEM FROM APPENDIN Aun... co..0cc.cccccceeceeeeeeeeeees 7
FIGURE 3 - EXAMPLE OF A PARAMETER WRITE-UP FROM APPENDIN Buu... ooo.ccccccce cece ccc ccc ee ceeeceecseueesueseeeeenane 11
FIGURE 4+ - NORMAL DISTRIBUTION 000.000.0000. cccc cece cc ececeecceuccceueceeveceeeceeeccseubeeseueeeetevesereeetiesteseserieesteseneesenes 14
FIGURE S - TIME INDEPENDENT CONTROL CHART 0000.0... c0cccceccccsccecceeeecsseeuesesereretseaneees bocce ecu eee eeesteteeseesenees 15
FIGURE 6 - TIME DEPENDENT CONTROL CHART 00.000. ccccccccccccccceuccceeeeeececeueeeceueeseeeeessea sees ecessetstescesnetereuness 16
Vill

ACKNOWLEDGMENTS
The author wishes to sincerely thank his advisor, Dr. J. M. de la Garza and Major Z.
Mitchell, USAF, for their patience, advice, and support with this thesis.
Additional thanks go to the rest of my committee, Dr. Vorster and Dr. Drew for their
time and assistance in this endeavor.
Of course any undertaking such as this would be incomplete without thanking those
individuals whose unwavering patience with my endless questions and requests have
made this work possible. Allen Williams, Dean Hackett, John Jones, James Shelor,
and all the others, you have my applause and gratitude for your professionalism and
effort on my behalf.
My greatest thanks goes to my wife Liza for her sacrifice in allowing me to follow my
dream of returning to school to complete this degree. Additionally, I would like to
thank my son, Connor, who has brought such unexpected pleasure into our life and
my parents, Mr. and Mrs. W. A. Smayda, Sr., for their love and support in my
abilities.
1X

CHAPTER 1 - INTRODUCTION
Background
Department of Transportation (DOT) policy makers are faced with an annual decision
concerning what fraction of their budget will be spent on maintenance versus new
construction. Dr. Allan Chasey established in his dissertation (Chasey, 1995), A
Framework for Determining the Impact of Deferred Maintenance and/or Obsolescence of a
Highway System, the need for balancing these expenditures to achieve a desired Level
of Service (LOS) within a specified period of time. Some specific points brought to
light in his dissertation are:
Federal, state, and local governments are reducing construction expenditures
in new infrastructure and in maintenance of existing infrastructure to meet
the growing demand for increased social services. There is greater political
mileage to be gained from these current high profile programs, than from the
customary programs such as infrastructure construction and maintenance are
just as vital. This same mentality is also skewed towards highly visible new
construction than that of routine maintenance.
Design standards have changed, leaving existing structures functionally
obsolete. A prime example is the Woodrow Wilson Bridge, which spans the
Potomac River connecting Northern Virginia with Maryland. Initially it was
designed for a capacity of 75,000 vehicles per day, but now carries over
170,000 (ENR, 1996; p. 9).
Necessary maintenance is deferred, resulting in increased deterioration and a
significant higher cost when the situation is mitigated. Traditionally, this is

due to lack of sufficient funds and is postponed until there is public demand
or sufficient need.
Dr. Chasey’s focus is on the “big picture”. That is, his dissertation and research deals
with the top level policy making for the Department of Transportation and
specifically with the division of monies between maintenance and new construction.
However, Allen Williams, the Maintenance Engineer for VDOT’s Salem District,
narrows this focus to the district level in a paper titled “The Impacts of Deferred
Maintenance - Verbal Description” (Williams, 1995). In this paper, the focus is on the
division of monies between ordinary (preventive) maintenance and maintenance
replacement. This is the result of the money allocated (maintenance versus new
construction) to each district by the State DOT, and is non-transferable from one to
the other.
Ordinary Maintenance is based on historical data and is applied to an element when
deterioration has caused the need for maintenance. It should be noted that it does not
replace the element, rather it extends the life of the element by decreasing the rate
with which it deteriorates. A system begins to deteriorate immediately upon
completion of construction and is dependent on three main factors: the quality of
construction, the traffic (volume and type), and the environmental conditions
(weather, etc.). An important factor of ordinary maintenance is that it not only
directly extends the life of the element, but other interrelated elements within the
system, i.e, the drainage system (gutter and/or camber) have a direct effect on the
entire system, whether it be a roadway or bridge.
In those instances when ordinary maintenance is no longer viable, such as when it has
been deferred to such an extent or the system has reached the end of its functional life,
maintenance replacement is necessary. This is dependent on the three factors outlined
above and the frequency with which ordinary maintenance has been performed.
bo

Elements falling into this category are ranked hierarchically, with those in the worst
condition and/or highest traveled sections receiving priority. The amount of
replacement within the system is based on the amount of funding available, which in
turn is based on the amount of deterioration within the system. However, since funds
are limited, not all of the required maintenance replacement can be accomplished.
This places the burden back to increased amounts of ordinary maintenance performed.
The approach to be used in this model is systems dynamics, using the DYNAMO
software to write the code. System dynamics is a paradigm shift in the manner with
which we attempt to solve problems. Traditionally, problems have been broken
down into their base components, each analyzed for their function. The result ts an
incomplete understanding of the functioning of the system as a whole. The sum of
the parts does not equal the whole. System dynamics takes the stand-point that the
whole is greater than the sum of the parts. It strives to discover the laws affecting the
conversion from input to output for the event being studied.
As with all computer programs, a need exists for the debugging and calibration of the
Highway Management System (HMS) to ensure it functions as intended. The goal is
to not only discover errors in the logic used, but also to ensure it performs as
intended. This can be done through the use of a rough data set, determined through
engineering judgment and global values. However, once the program is functioning as
planned, it ts little more than an academic exercise with little or no utility. It is for
this reason that we intend to calibrate the model using the Salem District as a test bed.
Objectives
The purpose of this thesis is to develop an infrastructure for the Management
Information System concurrent with the development of a System Dynamics Model
for VDOT’s Highway Management System and an intertace between the two. The

specific objectives for this thesis are to detine the step by step process of locating each
parameter value within VDOT’s data bases and annual reports; define all parameter
values (quantitatively) within each subsystem model; and present the findings in a
user-friendly format, both in hard (manual) and soft (software format) copy. The
software will include hypertext links (a windows type format) to allow the user to
navigate through the document. This software will have the global model of the HMS
as the master document providing links to the causal diagrams for each of the
subsystems. Within each of the causal diagrams, each parameter acronym will provide
a link to its corresponding detailed parameter write-up. A pop-up message will
identify to the user those parameters that are either model generated or
user-defined within each of the subsystems, as they are clicked upon.
Scope and Limitations
The primary method of defining each of the parameter values will be to research
relevant VDOT data bases (FMS, HTRIS, and PONTIS) and interview key personnel
such as the District Maintenance Engineer, Alan Williams, and others to include John
Jones, et al. Other sources of information include annual VDOT reports, for instance
their “Average Daily Traffic Volumes on Interstate, Arterial, and Primary Routes”.
It is anticipated there are values for which there has not been any data collected to
date. In these instances, we will rely on the engineering judgment of Alan Williams
and key individuals who are most familiar with the relevant subsystem and parameter.
A method for tracking the identified parameters will then be generated with input
from the key personnel.
The collected data will be entered into a user-friendly format such as an Excel
spreadsheet. The spreadsheet will be broken down into the five subsystems
comprising the Highway Management System. These include the Administrative,

Evaluation, Financial, Functional, and Physical Subsystems. The physical subsystem
can be further broken down into the Bridge Management System (BMS) and the
Pavement Management System (PMS). Within each of these major components, the
parameters will be ordered sequentially as they appear within the computer code for
each of the subsystems.
Upon substantial completion of the data collection, the model, computer code, and
spreadsheet will be put into a hypertext format. The global view of the model will
have links to each of the subsystem models. Within each of the subsystems, each
parameter will have a link detailing the steps necessary to locate the requisite data with
which to define this information. This set up will also be performed with each of the
subsystem source codes and spreadsheets.
Emphasis will not be placed on the quantitative value, but rather on the process one
goes through to define this value. The logic behind this is the model itself will be self-
calibrating and the quantitative values for each parameter will improve over time.

CHAPTER 2 - METHODOLOGY
Introduction
This chapter will provide the fundamental methodology for data collection and the
description of the infrastructure for the Management Information System (MIS).
The five phases which make-up the research phase consist of:
Identification of Model Parameters
Analyzing and Grouping of Parameters
Individual Parameter Research
Data Analysis
roe
wo
p
Parameter Write-Up
Figure 1 is a flow chart depicting the five phases and the thought processes and actions
required upon data collection.
| Model Parameters |
ae
I v
Individual
Paramter
a
Query Databases and/or
Key Personnel
Key Personnel
Estumate
|
1
| | |
| |
: Unsatisfactory Estimate Analy Unsatisfactory Data
Write-up
Results
Figure 1 - Data flow within the Research Phase

Identification of Model Parameters
The Causal Diagrams and the DYNAMO code were the primary sources used to
identify the model parameters for the HMS. Causal Diagrams, which are significantly
easier to identify when compared to the computer code, were used as the primary
source for parameter identification. This code acted as an alternate source --
predominantly used to understand which parameters were to be model generated,
which required user-defined data, and the data required from researching databases.
There are a total of two hundred and fifty-seven (257) parameters within the model.
One hundred and seventeen (117) are to be model generated, seventeen (17) are user
defined, and one hundred and twenty-three (123) are required to be researched.
Analysis and Grouping of Parameters
Once the parameters were identified and cross-referenced with the model and code,
they were analyzed and grouped according to common themes and likely sources, 7.e,
financial, pavement, and bridge. Once accomplished, they were further subdivided
into manageable subgroups and assigned a date (on a weekly basis) in which each
group was to be researched. For ease of maintenance and control purposes, the
parameters were then inputted into a spreadsheet. The spreadsheet was maintained in
two forms: the first separated the parameters by model subsystem, i.e, Evaluation,
Financial, etc.; the second consisted of all parameters sorted in chronological order as
to their assigned research date.
Acronym Name |Units| Value (a) | TIP | TDP Confidence Source Page (s,) | (s,t) Interval Number
TOTMILG | Total mi. 117.91 v VDOT - HTRIS 151
Mileage
Travel Time . See v Average Daily Traffic Volumes on Interstate,
TTLKL On Link KL| ™"- [Spreadsheet Arterial, & Primarv Routes - 1994 152
Figure 2 - Sample spreadsheet from the Bridge Subsystem from Appendix A

The finished spreadsheet has nine main fields for data entry. These fields are the
parameter’s Acronym, Name, Units, Value (x), TIP - Time Independent Parameter
(s-), TDP - Time Dependent Parameter (s-,), Confidence Interval, Source, and Page
Number. The first three fields are self-explanatory. When necessary, the Value (x)
field is further subdivided into three separate fields. This is to facilitate multiple
values for the same parameter, 7.e., Interstate, Primary, and Secondary, when dealing
with parameters specific to the bridge or pavement system. A quick cross-reference
with the parameter’s write-up will alleviate any confusion concerning each value and
the means used to calculate it. The next three columns (TIP, TDP, and Confidence
Interval) will be explained later. In some instances the parameter is not defined by an
equation, but is a constant. This is not to say the parameter never changes in real
time, rather it is constant relative to the simulation model, and should therefore be
updated along with the remainder of the parameters.
The source field contains a bullet description of the data source and when necessary, a
statement advising recommended changes for data collection. A more detailed, step-
by-step description of the source may be obtained in the parameter write-up. The
Page Number refers to the location of the detailed write-up, for a parameter within the
paper form of the user’s copy.
Individual Parameter Research
The parameters were subdivided into four categories according to likely research
avenues. These consist of parameters focusing on the bridge, evaluation, financial, and
pavement aspects of VDOT’s operations. Parameters relating to bridges were
discussed with Dean Hackett, a Senior Structural Engineer for VDOT’s Salem
District. Allan Williams, Salem’s Maintenance Engineer, and Wonkyu Kim, the
simulation modeler, discussed any parameters associated with traffic engineering.
Financial matters were discussed with E. E. Miller, Jr. from VDOT’s Financial
8

Planning and Debt Management department in Richmond, John Jones, Salem’s
Maintenance Manager, and Allan Williams. Finally, any pavement activities were
discussed with Allan Williams, John Jones, and James Shelor, Salem’s Pavement
Management Coordinator.
In the discussion phase with these key individuals, details such as whether specific
parameters were the best measure for achieving the desired end-state were discussed.
In instances where there was a more appropriate method for generating the desired
information, discussions were held with the modeler Wonkyu Kim and implemented
when appropriate.
Data readily obtainable was available in two forms. First, querying of a number of
databases was used. The predominant VDOT databases used in this research were the
Financial Management System (FMS) and the Highway Transportation and Record
Information System (HTRIS). These databases have a limited search capability and in
some instances, i.e, bridge condition ratings, Super Natural was used to perform a
more extensive search. Super Natural is a search engine that overlays VDOT’s
databases allowing the user to perform a search of the database based on any number
of guidelines. The other database predominantly used was the US Census database.
This database was accessed through the Internet. Data used from this database was
obtained from the 1990 census.
The second form consisted of researching various VDOT contracts and the
publications of several agencies; namely, VDOT and the Federal Highway
Administration (FHWA).
For data that was not obtainable, key personnel were asked to provide an estimate
based on their experience and, when necessary, to provide input for a recommended
data collection scheme.
In those instances where the data was unavailable in the needed form and key
personnel were unable to provide a reasonable estimate, the modeler was then
notified. The intent was to take a closer look at the model to find a more applicable
method for modeling the desired outcome. This tended to be an uncommon
occurrence, and in such instances an improved, elementary method was developed.
Data Analysis
Collected data can come in one of two forms. The first form is readily useable and
requires nothing more than verification and a write-up. Examples of this include the
data collected from the 1990 Census (Per Capita Income Level of Virginia (PCIV), etc.)
and certain budgetary items (Highway Construction Budget in Virginia (HCBV), etc.).
The second form of data required numerical manipulation to put it into a useable form
for the HMS model. The numerical manipulation could have been as simple as adding
a series of numbers to achieve the desired input (Highway Maintenance Budget for the
Salem District (HMB), etc.) or a more complicated manipulation, such as the Bureau
of Public Roads’ (BPR) method for determining the travel time between the links
(TTLKL). In such instances, a spreadsheet was used in the data manipulation. Within
each parameter write-up, a detail discussion of the data manipulation is provided.
10
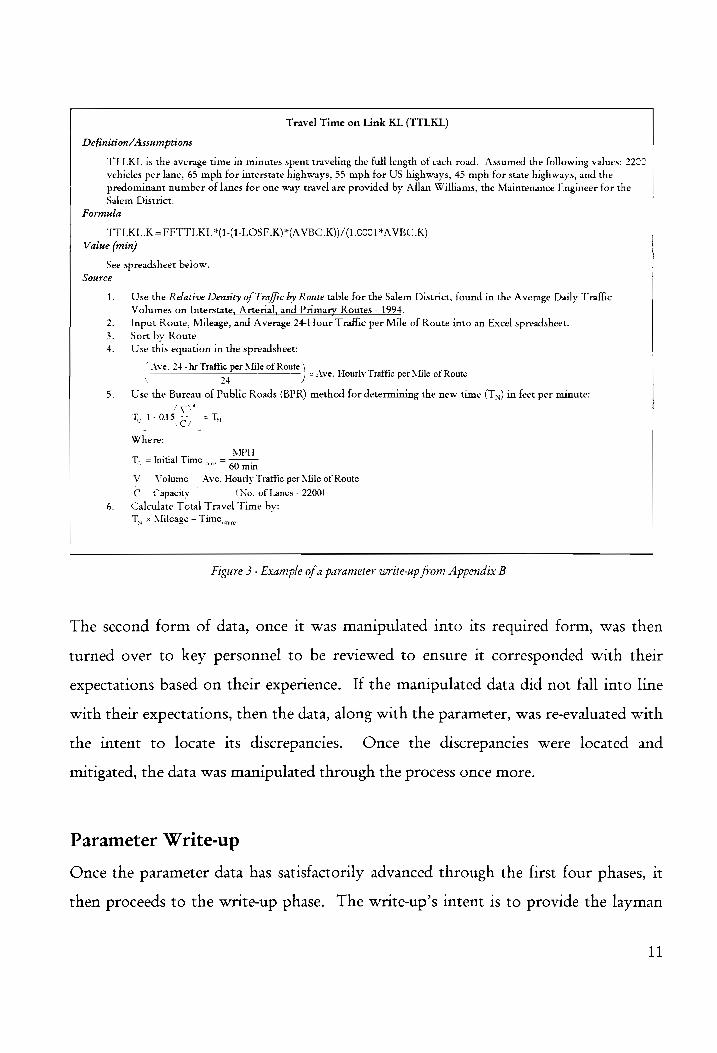
Travel Time on Link KL (TTLKL)
Definition/Assumptions
TTLKL is the average time in minutes spent traveling the full length of each road. Assumed the following values: 2207 vehicles per lane, 65 mph for interstate highways, 55 mph for US highways, 45 mph for state highways, and the predominant number of lanes for one way travel are provided by Allan Williams, the Maintenance Engineer for the Salem District.
Formula
TILKL.K=FFTTLKL*(1-(1-LOSF.K)*(A VBC.K))/(1.0CC1*A VBC.K) Value (min)
See spreadsheet below.
Source
1. Use the Relative Density of Traffic by Route table for the Salem District, found in the Average Daily Traffic Volumes on Interstate, Arterial, and Primary Routes - 1994.
2. Input Route, Mileage, and Average 24-Hour Traffic per Mile of Route into an Excel spreadsheet.
3. Sort by Route Use this equation in the spreadsheet:
“ Ave. 24-hr Traffi Mile of Route’ ae * ra = Ave. Hourly Traffic per Mile of Route
< 4
5. Use the Bureau of Public Roads (BPR) method for determining the new time (Ty) in feet per minute:
/ “47
T. -~0. S- pe oy T, 1-018 =, |= Ty
Where:
sey rs MPH T., = Initial Time... = 60 min
V Volume Ave. Hourly Traffic per Mile of Route
ec apacity ~ {No. of Lanes . 2200)
6. Calculate Total Travel Time by: Ty x Mileage = Time
(mun} Figure 3 - Example of a parameter write-up from Appendix B
The second form of data, once it was manipulated into its required form, was then
turned over to key personnel to be reviewed to ensure it corresponded with their
expectations based on their experience. If the manipulated data did not fall into line
with their expectations, then the data, along with the parameter, was re-evaluated with
the intent to locate its discrepancies. Once the discrepancies were located and
mitigated, the data was manipulated through the process once more.
Parameter Write-up
Once the parameter data has satisfactorily advanced through the first four phases, it
then proceeds to the write-up phase. The write-up’s intent is to provide the layman
11
with a clear, concise method for viewing the results and to provide the methodology
for replication for future updates.
The framework for the write-up consists of the parameter name, with its
corresponding acronym in parenthesis, as the page heading. Immediately following
the page heading is a brief description of the acronym, and if necessary, any
assumptions made during the manipulation of the data.
The value of the parameter, with its units in parenthesis, is then given. Whenever
possible this has been separated into its base components rather than using a weighted
average. The reasoning behind this is that at this point in time the model deals strictly
with the interstate highway system. Therefore, using a weighted average of the entire
road system would skew the results and provide the user with an invalid picture of the
system. Whenever possible values for the primary and secondary systems were
provided in anticipation for the expansion of the model to incorporate these systems.
Following the value is the detailed description of the source for the data. Included in
this section are the steps and formulas used for the manipulation of the data to achieve
the requested results. Whenever necessary, this section also includes the
recommended data collection program for those parameters for which data was
unavailable. Finally, an example of the Excel spreadsheet is given to provide the user
with a clear idea of the data manipulation.
12

Statistical Analysis Issues
All processes have some variation. This is especially true for the transportation and
construction industries, This basic premise must be kept in mind whenever
conducting research within a systems environment. Therefore, the best we can
accomplish is a “snap-shot” of the true picture.
The snapshot used for model calibration with this project is the 1995 data obtained
from VDOT. Exactly where each value is in relation to the overall average for each
parameter value is unknown at this time. If the value is high, it could skew the model
results to the high side. The converse is also true for the values on the low side. But
what is to be done with data that is uncharacteristically high or low, for example the
price of lumber following Hurricane Hugo in 1989 or the price of gasoline in the early
summer of 1996? Do we use this data? What does it do to our results? Are we
deceiving ourselves of the possible results by using this data? At this juncture we have
no statistical knowledge of the data. Relying on the current data to make policy
decisions would be analogous to taking a “shot in the dark”. It is for this reason that
the author recommends a statistical analysis be accomplished for each researched
parameter prior to using this data as a decision making tool. A recommended
statistical tool would be the use of control charts for each of the researched
parameters.
The use of statistical control charts will allow the user to identify whether the desired
value is within acceptable limits of the sample mean. Control charts make use of
upper and lower bounds, centered on the sample mean, called a control limit.
Through these limits, control charts distinguish between the variation that can
normally be expected due to common causes, 2.e., inflation, economic indicators, etc.
and those due to unexpected causes, such as miscalculations in the data manipulation.
13

The sample mean (x) is defined as the arithmetic average of the sample. There are two
instances where a sample set is a normal distribution (Figure 4) with mean u and
variance o-/n; the first is where the data follows a normal distribution, or the data
follows any distribution, but is taken from a sample set of 25 to 30 data points.
Therefore the probability of the sample mean falling between u-*/%5 and u+*%; is
0.9974. Putting this in clearer terms, only 2.5 items out of every hundred will fall
outside these limits, the chances of which are relatively slight. These formulas provide
the lower and upper control limits respectively. However, chances are that we will
not know the population mean (1) and standard deviation (6). Therefore, will have to
use the average of the sample means (x) as our centerline and the sample standard
deviations of the averages (5s) when calculating our control limits, where
x— A.s<x,<x+ 4,8. The constant A, is dependent on the sample size, 7, and can be
found in any statistics book.
20
» < } “O ]-a
sy UY
Figure 4 - Normal Distribution
Of concern when using this particular method is a “spike” in the data used to calculate
the control limit. By its very nature, this spike will skew the control limit and its
corresponding upper and lower limits in the favor of the spike. This in turn will
trickle down through the model with the potential of having major effects on the
results produced by the model. For this reason, a management level decision is
required as to whether or not to delete these spikes from all calculations on a global or
case-by-case basis.
14

There are two types of parameters encountered when working with the VDOT data.
First, a Time Independent Parameter (TIP), the plot of which will have a centerline
with zero slope. The distance of each data point from the centerline is defined as
x - x and the standard error of the mean is defined as s = The value ts
squared to eliminate any possibility of the sum of values equaling zero. The square
root is then taken to normalize the value, 7.e.. return it to the original units. The
smaller the error (the closer the data point to the centerline) the more accurate your
data point is to the overall average (x).
} ut
fm UCch os asa L a > , :
™ a“ \ ao a ee ;
g voy * ” ae a “Center Line -~ eared - ae
= Oda ° LCL ” ”
“ m0 4 Und
om J] 2 3 4 Hl t2 13 14 15 fo oO 7 x ’ 1a
Observation
Figure 5 - Time Independent Control Chart
The second type of parameter is the Time Dependent Parameter (TDP). This value
may vary with time, either increasing, decreasing, or remaining constant. Examples of
this include budgetary items and construction costs. The difference lies in the slope of
the centerline. Aside trom being zero it may also be either positive or negative, with
the slope likely corresponding to one of the cost indices. Figure 6 provides an
example of a time dependent control chart.

2200
UCL 2000 * a *
/ \ \ ff >» >
1800 a id
~ | A P| Li : LN fo / Center Line 51600 f---® NR , \ / 2 SN \ » > \ Ue LCL
1400 | \
1200
1000 0 4 2 3 4 5 6 7 8 9 10 11 12 13 14 #165 16
Observation
Figure 6 - Time Dependent Control Chart
It must be recognized that each parameter value obtained in this research is one value
in a distribution of values associated with each parameter. Where this value lies
within the distribution is unknown at this time. If the value lies in the 95"" percentile
the model will skew towards the upper end. The converse in also true for those values
lving in the 5" percentile. The global effects on the model are also dependent on the
parameter itself. If the parameter is one of the parameters identified as significant in
the sensitivity analysis its effects will have an even greater impact.
Although the time constraints associated with this project precluded any statistical
analvsis of the collected data, it is for these reasons that it 1s highly recommended that
this should be undertaken as soon as possible to begin laying the foundation for future
data collections. Therefore, the Confidence Interval column in the data spreadsheets
has been intentionally left blank as a reminder for this need.
16

CHAPTER 3 - THE DEVELOPMENT OF THE MIS HELP FILE
The Objective
In the development of the “soft” copy of the MIS the intent was to provide VDOT
with the same information conveyed in the “hard” copy, or paper version, which
requires minimal space, and is a stand-alone entity. Bv stand-alone it 1s meant that
VDOT would not have to load a new software package onto their systems in order to
be able to use the soft copy; it should run off their existing systems.
The idea behind the soft copy was to use the developed hard copy as the framework
and establish links in both text and pictures to related topics throughout the
document. Other desired features are to have a searchable index, to be able to print
from the document itself, and to be relatively user-friendlv for updating purposes.
With these items in mind, Web Editors were ruled out since additional software is
necessary, 1.¢., a Web browser such as Netscape, and the lack of several other desired
features. The software accepted tor use in the development of the Help File is a
shareware version of a package called EasvHelp/Web, by Eon Solutions Cheshire,
England. This software was chosen because it met and exceeded the stated
requirements by being able to create a hypertext document tor a Web Homepage with
the click of a button and reprocessing and building the document without losing the
Help tile.
The Software
Easy Help/Web was used in conjunction with two other shareware packages: Shed.exe
and HC505.exe. Shed.exe is a software package that allows the user to map pictures
placing hot spots, or clickable regions, within the picture, which are linked to other
17

areas within the document. HC505.exe is a Microsoft help compiler and is what
actually builds the help file in Windows format.
Help File Construction
The building of the Help file was accomplished in two phases: the creation of the text
document and the mapping of the causal diagrams. However, a few things need to be
accomplished prior to beginning work. Both the EasyHelp and the Shed file need to
be unzipped. Once this is accomplished, the Microsoft Help compiler needs to be
uncompressed and the four files (hc.exe, hcp.exe, hc.err, and hcp.err) must be moved
to the “HC” sub-directory of the EasyHelp directory. Accordingly, each Word
document must have the EasyHelp template attached to it prior to beginning work on
the Word document. This template may also be attached to an existing document,
which is needed to build a Help file. To attach a template, follow the directions in the
Microsoft Word manual.
Building Topics and Links within Text
A Topic is defined as the address for which a Link is told to go. A Link is a “go to”
command function. Any word or phrase within the Word document can be identified
as a Topic or Link.
To create a Topic highlight the word or phrase with the mouse cursor then click on
the “Topic” icon on the button bar at the top of your screen. The pop-up menu will
ask for the topic identifier. Type in the desired Topic name. Click on whether the
Topic is to be a Link or Pop-up topic (the default is Link). For this project, each
parameter write-up heading became a Topic with the parameter’s acronym as the
Topic name, as these needed to correspond with the Link names in the causal
diagrams.
18
Their is a minor difference in the process when creating a Link. The pop-up window
contains a scroll list of all Topic names within the document. To select one of these,
double-click on the desired Topic name and the process 1s complete. The program
ensures the match up between the type of link, z.e, Jump Links correspond to Jump
Topics. If, however, the linked Topic is in a different document then the user needs
to type in the Topic name and click on the corresponding Topic tvpe (Pop-up or
Jump).
Once all necessary items are complete, click on the “Process” icon on the button bar.
It the document is the first to be processed under a new project, click on “New” at the
right side of the pop-up menu. The user will then be asked to provide a Project
Name. Type this in and click “OK”. Next, click on the name of the project just
entered and click the “Edit” button. Click “Add” in the lower right of the menu
followed by “Yes” if the name of the document is the correct one to be added to the
“Project”. Once this is complete, click “OK” on both menus to begin the processing.
Only click on the “Build” button if the current document is to be the master
document for the Help file.
The current numbering and bulleting system organic with MS Word fails during the
compiling of the document. This means the formatting is lost. Because of this the
developers of the EasyHelp program have added “num list (a)” and “num list (b)” for
the user to place numbered lists within the Help file. “Bullet (a)” and “bullet (b)”
provide the same remedy for the bulleting problem. These can be found in the Style
drop-down menu on the button bar at the top of your screen.
Mapping of Causal Diagrams
As previously stated, the Shed software is used to develop the hot-spot areas within
each picture. However, before the picture can be mapped it must be in either a
metafile (*.wmf) or windows bitmap (*.bmp) configuration. Since the bitmap ts more
19

memory efficient it was used in this development. This is essential to keep in mind
since the Microsoft Help compiler will only handle pictures up to 64 kb in size.
Therefore, after creating the hot-spot picture, it is advisable to ensure the picture with
the *.shg (Segmented Hyper Graphics) extension is less than the maximum allowable
SIZe.
To create a hot spot within a picture place the cursor in one corner of the area you
would like mapped. Right-click the mouse and drag the box until it reaches the
desired size. At this time a menu will pop up. Areas to be concerned about within
this menu are the Context String, Type, and Attribute, all of which are found in the
Binding section.
The Context String box is where you place the name of the Topic the mapped section
is to be linked to. For the purposes of this project, the acronym name was used. The
Type box refers to the type of link desired. A jump link physically replaces the
mapped picture screen with the screen from the linked page. A Pop-up will bring up
the linked topic to overlay a section of the existing screen, which remains in the
background. The Attribute box is a drop-down menu with two choices: visible or
invisible; this refers to whether or not the user desires to have a dashed-line box
around the mapped area. All mapped areas in this file have the invisible attribute to
minimize the confusion within the causal diagrams. Once the mapping is complete
for the current picture, click on “File|Save As” and type the name of the current file.
The “Save Location” must be in the Graphics sub-directory of the EasyHelp directory.
Saving the picture in this manner will create the hot-spot picture with the *.shg
extension. The bitmap picture is required to be saved in the same directory. And is
the hot spot and the Topic it is linked to must be of the same type, z.e., jump or pop-
up.

Once the mapping is complete, the bitmap picture 1s required to be inserted into an
MS Word document. This is done with the “Insert! Picture” command of Word.
When inserting the desired picture it is important to remember to click the “Link to
File” box within the menu, otherwise the hot spots will not activate. Due to the size
of each causal diagram, each picture was inserted into a separate Word document (with
the EasyHelp template active) to minimize compilation time. To link each of the
causal diagram documents to the master document (in this project the global picture of
the Highway Management System) a “Heading” was placed in each document. This
was then converted into a Topic link, as outlined earlier. Process each of the causal
diagrams as previously stated, adding each file to the project. Only click “Build” with
the file you desire to have as the master document for the Help file. If for any reason
the picture needs to be edited, delete the picture from the document and edit the
bitmap (*.bmp) and hyper graphic (*.shg) within the graphics directory of EasyHelp
then re-insert it into the document. By double clicking on the picture to use the
Word editor the hot-spot formatting is destroved in the picture.
This chapter is meant to provide the reader with a basic knowledge of the EasyHelp
software. The nature of this document precludes delving into a detailed account of
how to use the software. However, the author has found, through numerous
correspondence, the developer, James Holroyd to be extremely helpful and prompt
with any difficulties encountered.
Appendix E contains the disk containing the compilation software (in an executable
compressed format), the files used to create the MIS help file (in compressed format),
and the MIS help file (uncompressed). Both the EasyHelp and Shed software are
shareware and the user is advised to follow the rules governing it as such.
21

To install the help file onto a computer, follow Microsoft’s directions for copving (or
moving) a file from a floppy disk to a specific directory on a hard drive. The help file
is called sources.hlp.
To run the help file, open Windows and double-click on the file name or use the “run”
command. Use the mouse to navigate through each picture. A link within a picture is
detined when the normal mouse curser (usually an arrow) changes to a pointing hand.
Click once to select the desired item. Green highlighted text is also a clickable item
within the help file.
Other useful teatures include the following:
1. The “Search” button: Allows the user to perform an index or key word search.
ho The “Back” button: Takes the user back to the previous screen.
3. The “Print” button: Prints the current Topic page(s).
4. The “«” button: Allows the user to scroll back in the current document.
5. The “»” button: Allows the user to scroll forward in the current document.
6. “Options|Font”: Allows the user to increase/decrease the size of the text within the help file.
bho
i)

CHAPTER 4 - SUMMARY AND RECOMMENDATIONS
Existing VDOT Databases
The current VDOT database system is very disjointed, with each database unable to
communicate with any other. The existing system has evolved over the past twenty
years into sixteen (16) separate database systems. Each system was designed to fulfill a
specific need in the “current” system with little or no foresight of future needs or of a
unified system for information management.
Financial Management System (FMS)
The Financial Management System is the cornerstone of VDOT’s accounting system
and has been designed for the accounting department. As money is spent, it is
recorded into a coded account for tracking purposes. One of the strengths of the
system is that it allows the user to focus on a specific system, 7.e., interstate, primary,
or secondary.
The principal limitation of the system, from both the model and management
perspective, is the activity codes used are too global to allow the user to go into any
detail within the system. For example, only five codes are used to track money spent
on all maintenance replacement for bridges. The DYNAMO model (Appendix C, p.
193) requires twenty-three distinct activities for the same information. Therefore, time
was spent working with VDOT personnel trom the Bridge division reviewing past
contracts to extract the average unit costs.
Highway Transportation and Record Information System (HTRIS)
HTRIS is currently the database used for both the pavement management system
(PMS) and the bridge management system (BMS) by VDOT. A wealth of information
23

is contained in this database, including traffic counts, road- and bridge physical
conditions, and the inventory for all roads and bridges within the state.
Although this database has proven its utility within the context of this research, some
limitations do exist. Some of the data contained herein is not concrete data, but rather
derived data based on a theoretical growth model. An example of this is the traffic
counts associated with the interstate and primary road systems. The last actual count
was taken in 1988 and, according to VDOT traffic engineers, some of the data 1s
grossly unreliable. Another significant discrepancy is this data is based on the Average
Annual Daily Traffic (AADT). More detailed information such as the peak hourly
traffic counts would provide a clearer, more realistic picture of what is actually
happening within the system.
HTRIS also contains limited information concerning the secondary road system. This
poses a problem regarding future expansion of the DYNAMO model from the
interstate system to the entire system.
Super Natural
Data manipulation and querying capabilities are limited within HTRIS. This limited
query capability has been mitigated to a certain extent with the development of the
“Super Natural” system. This system overlays the Highway Transportation and
Record Information System (HTRIS) and allows the user to query this database for
specific information spanning several parameters individually recorded within the
system, i.e, the number of functionally adequate bridges in good condition on the
Interstate system (BFAGC). Although a powerful search engine, it is extremely user-
unfriendly with the potential for disastrous effects if misused. This search engine will
allow the user to modify the HTRIS database through querying. In order for this
system to be used effectively, the user must have intimate knowledge of the three
major components of the system: an understanding of the information requested, an
24

understanding of the type of information maintained within the HTRIS database, and
finally, the semantics and logical sequence used in querying the system. This last
component is the major limiting factor of the system as it resembles a computer
programming language with three potential outcomes: the information is received, no
response is received from the system, or the system is corrupted. The last is
disastrous, the middle is frustrating as there are no error codes to inform the user
where the query is semantically (and/or logically) incorrect and, if information 1s
received, intimate knowledge of the desired information is necessary to be able to
decide if it is the correct information.
The Human Factor
The human element proved to be by far the most effective source of information,
both in real time data collection and the knowledge of where to look for seemly
impossible (unquantifiable) data. Examples of this include the average distance
traveled per gallon of fuel (ADTPG) and the average miles traveled per vehicle (ATM).
Future Sources of Information
Future sources of information include both the Integrated Maintenance Management
System (IMMS) and Pontis. The IMMS is in its developmental stage at this time and is
the end result of VDOT’s global review of their maintenance policies, procedures, and
database system. The intent is to integrate VDOT’s existing databases into this new
svstem whereby the current databases will be able to communicate with each other.
This system is also intended to be substantially more user-friendly than the current
database system.
The Pontis system is not a database, rather it is a modeling system for bridge
maintenance. The value to be derived from this model is tts bridge deterioration rates.
Although still in its infancy and the current deterioration rates are based on North
25

Carolina bridges, the model has the potential to provide accurate deterioration rates in
the future once it is calibrated with Virginia bridge data.
Recommended Data Collection
As outlined above, there are a number of changes that are required to improve and
facilitate the data collection, which in turn, will have a significant impact on the
model output. Within the detailed parameter write-ups (Appendix B), in those
instances where changes in the data collection are necessary, recommendations have
been made. These recommendations have been made in context to the current model
and with limited knowledge of the detailed aspects of VDOT’s database system. As
such, they should be viewed as recommendations to be used as a foundation in making
future improvements by someone knowledgeable in both the Highway Management
System and VDOT’s database system.

REFERENCES
Chasey, A.D. (1995); A Framework for Determining the Impact of Deferred Maintenance and/or Obsolescence of a Highway System; Doctoral Dissertation, Virginia Polytechnic Institute and State University.
. Hogg, R. V. and Ledolter, J.; Applied Statistics for Engineers and Physical Scientists; Macmillan Publishing Company, New York, N.Y., 1992.
. Kim, W. (1996); Systems Dynamics Model of a Highway Management System for VDOT; Doctoral Dissertation, Virginia Polytechnic Institute and State University.
. “Potomac Bridge Design Narrowed to Two Finalists.” Engineering News Record, May 20, 1996; p. 9. Williams, A. (1995); Interstate Highway Maintenance Management System; Masters Thesis; Civil Engineering Department, Virginia Polytechnic Institute and State University.
. Wilson, C.; Applied Statistics for Engineers; Applied Science Publishers, Ltd., Essex, England, 1972.

Evaluation Subsystem
APPENDIX A: DATABASE SPREADSHEETS
igen: | Confidence | | Page Acronym | Name Units | Value{x) : TIP (s x ) TDP (s, J Interval | Number
AADT “AVG Annual Daily Traffic; veh | See ¥ Average Daily Traffic Volumes on Interstate, 37
Volume I | Spreadsheet Arterial, & Primary Routes - 1994
Vi ily i ‘ AVG Annual Daily Traffic | wa model-generated
Volume Increasing Rate L ~ 4 I
ADTSD [AVG Distant Traveled per mi | User Defined | User Defined | Trip in Salem District '
AIR | ADT Increasing Ratio dim | User Defined ' User Defined |
icle by Cape ; ; | AVBC JAVG Vehicle by Capacity dim. Wa | model-generated |
‘Ratio | i
Vi Co I . ——
AVCF Annual Volume Conversion dum. User Defined | User Defined Factor |
[BCR Benefit-Cost Ratio dim. wa ' model-generated |
CAP AVG Network Capacity veh User Defined i User Defined |
[Continuous Compound | | CCBCR Benefit Cost Ratio dum. Wa model-generated
CLS Comprehensive Level of i dim | n/a \ | model-generated | Service | ' \
Non-User, | | | DANUBEN Discounted Annual Non User, S/yt | Wa | | model-generated | Benefit | :
to —__ op i ; * —t
DAUBEN (Discounted Annual User Sr Wa | model-generated | | Benefit
—— con Tn DFIO! | Diff in Fraction Industrial Syt wa ! model-generated
| Output to Input
DFTT Diff in Travel Time mim. Wa \ model-generated
DNUBEN [Discounted Non-User Benefit]; $/vr n/a model-generated I i
[DUBEN Discounted User Benefit S/ytr Wa | modei-generated
FFTTLKL | Free Flow Travel Time min. Wa i model-generated |
FSPD Free Flow Speed mph | User Defined User Defined |
HWY Total Construction , HCED Expenditure Discounted S/yr Wa | [rnodel-generated
HCEUD HWY Total Co nstnuction i Myr | n/a | model-generated | Expenditure Undiscounted | :
HEXPD HWY Lane-Mileage In-mi_ | Wa | model-generated | [Expanded i | | |
HWY Total Maintenance i HMED ewe diture Discounted Sy | Wa model-generated
‘HWY Total Maintenance . i HMEUD | F cenditure Undiscounted Siyr | Wa model-generated |
HRV Hourly Volume Wa | model-generated
IR Income Increasing Rate Siy1 nia model-generated
Income Increasing Rate US Census Bureau IIRP e O/yT 1.43 (www.census. gov/ftp/pub/hhes/income/4person.html l49
Parameter )
LHPA Level of Physical Adequacy . dim. nwa model-generated
LOSF [Level of Service Factor dim. Wa model-generated
Maint Expenditure per , MEPEPH Expanded Portion of HWY Sfyr Wa | model-generated
N Economue Life yr User Defined User Defined
NPVB Net Present Value of Benefit $ na | model-generated
NVB Net Value Benefit $ Wa ; model-generated
Per Capita Income of | | US Census Bureau PCIV Virgina S/person| 23,597.00 Vv (www.census.gov/ftp/pub/hhes/income/4person. html 154
_ | ) PLS Physical Level of Service dim. Wa model-generated

i te | Confidence! Page Acronym Name Units Value (x) TIP (s x ) TDP (s,, ) | Interval | Source Number
Total Construction TCED Expenditure Discounted S/yt | wa model-generated
Total Construction CEU ; : ' - TCEUD Expenditure Undiscounted | vy wa model-generated
TLCCD Total Life Cycle Cost $ Wa imodel-generated Discounted
TLCCUD j Total Life Cycle Cost $ Wa | model-generated Undiscounted | ‘ |
. Total Maintenance ' TME . . ~ {ED Expenditure Discounted Myr na | model generated
Total Maintenance ' MEU . , : i | . TMEUD enditure Undiscounted S/yr n/a : i ‘model-generated
TOTMILG | Total Mileage mi 117.91 ¥ L 164
. . . . See | ' Average Daily Traffic Volumes on Interstate. TT : min. : 1 \ ° LKL Travel Time On Link KL Spreadsheet | Y Astenal, & Primary Routes - 1994 165
- See : : ~| Average Daily Traffic Volumes on interstate. v Ann : | . ° 7
TVOL ual Traffic Volume veh Spreadsheet ‘ : Arterial, & Primary Routes - 1995 16
Undiscounted Annual User | IBEN | - UAUBE | Benefit $/yt Wa | model-generated
Undiscounted Annual Non- ANUBEN | - UANUBE} User Benefit S/yt Wa | model-generated
: i Jon- UNUBEN |Undiscounted Non-User S/yr Wa model-generated
Benefit : | [ UUBEN Undiscounted User Benefit S/yr n/a model-generated |
|voRC Vehicle Operating Cost $/veh. Va | | |model-generated |
OT ‘Value of Time $/min | User Defined | ‘User Defined |
WAHR Weighted AVG Hourly dim. | User Defined | | User Defined Volume Ratio \ ' |

Financial Subsystem
: - 1 Confidence Page A N: Units | Val TIP TDP (s, ° cronym ame ni alue (x) (s r) {s, J Interval Source | N er
Available Budget for H $f ! ! - AB Highway yr wa model-generated |
VG Dist Traveled . ADTPG oon ist ‘traveled per mi/gal 19.5 5.5 v FHWA 1994 Highway Stahstics Manual i 40
AT™ oe Miles Traveled per Mile/veh*yr.| —12,$00 100.000 Vv FHWA 1994 Highway Statistics Manual 42
AVG Value of Veh 5 . . AVVV Registered in Virginia $Wveh. 2,146.86 Vv DMV Office of Forecasting & Analysis 43
BB Bridge Budget S/yr 2,833.758.92: $,005,016 08] 3,018,059.80 Vv Six Year Plan & HTRIS 44
US Census Bureau Birth Rate Parameter of ;
BRPV Vir nia © ero persons/yr 001459) V (www.census.gov/ftp/pub/population’ www/statepop. 56
e htmi)
BRYV Birth Rate of Virginia dim wa model-generated
po ' US Census Bureau
Death Rate Parameter of 2 DRPV Vin nia © etero persons/yr | 0 008249 v (www census.gov ftp/pub/population/www/statepop. 105
8 | htm!)
' DRV Death Rate of Virginia dim | wa L model-generated
F | f
FAV Federal Aid to Virginia S/yr | 466,486.400.00 Vv FHWA 1994 High way Statistics Manual 108 1
! FBHC _'Fract Budget to HWY dim 0.8142 ¥ 1 - FBHM 123 Construction | \
FBHM Fract Budget to HW Y Maint. dim : 0.4407 v HTRIS & Data Manipulation | 124
i . 1
FCBB Fract Budget to Bndge dim | 0.0181 0.0189 0.0186 v 1 -FBEUI 128
Fraction of Construction : : . . a 9.969321 5 ‘ Be 2 FCBSD Budget to Salem District im v ix Year Plan & Data Manipulation 129
FMBB mie Budget to! sim 00177 | 90626 =: 0401 ¥ See Recommended Changes 130
Fraction of Maintenance . i . : d ' 009899 j FMBSD Budget to Salem District im | V Six Year Plan & HTRIS | 131
F tor Veh. Fuels T: . . FMFTH ract. Motor Veh. Fuels Tax dim. i 0 838983 Vv Planning & Information Group handout 132
ito HMO | |
|
. Mot . Fuel . ‘ FMFTT Frat Motor Veh. Fuels Tax dim i 0 141243 V Planaing & information Group handout 133
FMVLFH Fract. Motor Veh. License dim. ' 9.603773 v Planning & Information Group handout 134 Fee to HMO
FMVLFT_ [Pract Motor Veb. License dim | 0.113208 ¥ Planoig & Information Group handout | 135 Fee to TTF :
Fract. Motor Veh. Sales & ! d : 0 666667 Pi FMVSTH Use Tax to HMO Im. : v | anning, & Information Group handout 136
Fract. Motor Veh Sales & : ! d ‘ 9.333333 PI FMVSTT |. Tax to im. Vv Janning & Information Group handout 137
Frac of Population of the . : Vv d ‘ a/ v del-generated i
FPS Salem Distnct to VA ‘ m a model-gen i
Fraction of Revenue to . i FRHWY d 0.955 6 Year Pt:
Highway Budget moo v car sven (38
FSSH hae) State Sales Tax to dim. 900 v Planning & Information Group handout 139 po
FSST Fract. State Sales Tax to TTF dim. 0.094444 Vv Planning, & Information Group handout 140
Highway Construction A 82,746,000.00 6 Pi
HCBSD Budget in Salem Distnet syr v Year Plan 141
Hcpy Highway Construction Siyr | 887,666,000 00 V 6 Year Plan 142 Budget in Virginia
HWY Maint Budget for HMB $/ 75 286,472.31 v HTRIS Punt Met Only yr 2 M45
HWY Maint Budget of 7 9,022 2 HMBS ig jam Distnct Syr $289,022 28 Vv HTRIS
HMBV [Highway Maintenance Syr | 760,572.000.00 v 6 Year Plan 146 Budget in Virginia '
HMO HWY : agement and S/yr ‘ n/a model-generated Operation Fund L
IMRPV in-Migrahon Parameter of dim. 0.001168 V US Census Bureau 150
Virginia : (www. census.g ov/fip/pub/population/wwwi/statepop
IMRV [In-migration Rate of Virgini dim Wa model-generated L
I
MFT |Metor Fuels Tax S/yr na modei-generated
MVLF ‘Motor Veh. License Fee S/yt n/a model-generated
MVSUT [Motor Veh. Sales & Use Tax | S/yr wa model-generated i
30

i ' { TIP |rpp(s.)' Confidence t Page Acronym Name Units Value (x) ' (s,) (s;,) Interval | Source Number
| Out-Migration Parameter of . ' US Census Bureau .001737 ‘ : 2
OMRPV Virginia | dim. 0.00173 | (www. census. 0v/fip/pub/population/www/statepop. Is
CMRV Out-migration Rate of dim i n/a model-generated Virginia ‘
: US Census Bureau PPR ai Purchase Rat oo 22,570.47 ‘ ‘ 5
Person rehase Aare S/yr-person | ’ (www.bea doc. gov/bea/statp:. htm#table4 15
PS Population of Salem District person i 662,737 ' N VDOT County maps/1990 Census 156 }
. oo \ 1 US Census Bureau PV Populati f Virginia 0} 6,618,358 . 7 . 157
Opulanon of ee} person (www census. gov/ftp/pub/population/ www statepop. 5
RMFT Rate for Motor Fuels Tax Sgal. : 0.177 Planning & Information Group handout 188
—_ ¢ T RMVLF Rate Motor Veh. License Fee wer 26.50 ” Planning & Information Group handout 159
5 4 t ! RMVSUT Rate for Motor Veh. Sales & dum { 0.03 * . Planning & Information Group handout 160
Use Tax i
RSST Rate for State Sales Tax S/yr. 0.045 1 1 Planning & Information Group handout 161
1 Data Manipulation: Personal Purchase 79,454,500. ! ‘ ' . Loe 385 States Sales Nyr 149,379 500.47 : . |Rate* Population of Virginia 163
SST State Sales Tax S/yr n/a model-generated
TIF Transportation Trust Fund Syr n/a ‘model-generated
TTRV Total Revenue in Virginia Syr n/a 'model-generated
Ve Tvvv _ [Total Value of Veh | $ 353,285,000.00 DMV Office of Forecasting & Analysis 169 Registered in Virginia i
VAGR {Veh AVG Annual Growth dim 00208 0,009 yo DMV Office of Forecasting & Analysis 170 Rate in VA :
VINC vehicle Increasing Rate in vel/yr | 101,551.51 | 5,728.74 og DMV Office of Forecasting & Analysis 171
VMT Vehicle-miles Traveled yveb-myyr wa : + model-generated
VV No. of Vehicles in Virginia veb | 4,982,284 603,028 | ‘ iDMV Office of Forecasting & Analysis 172
31
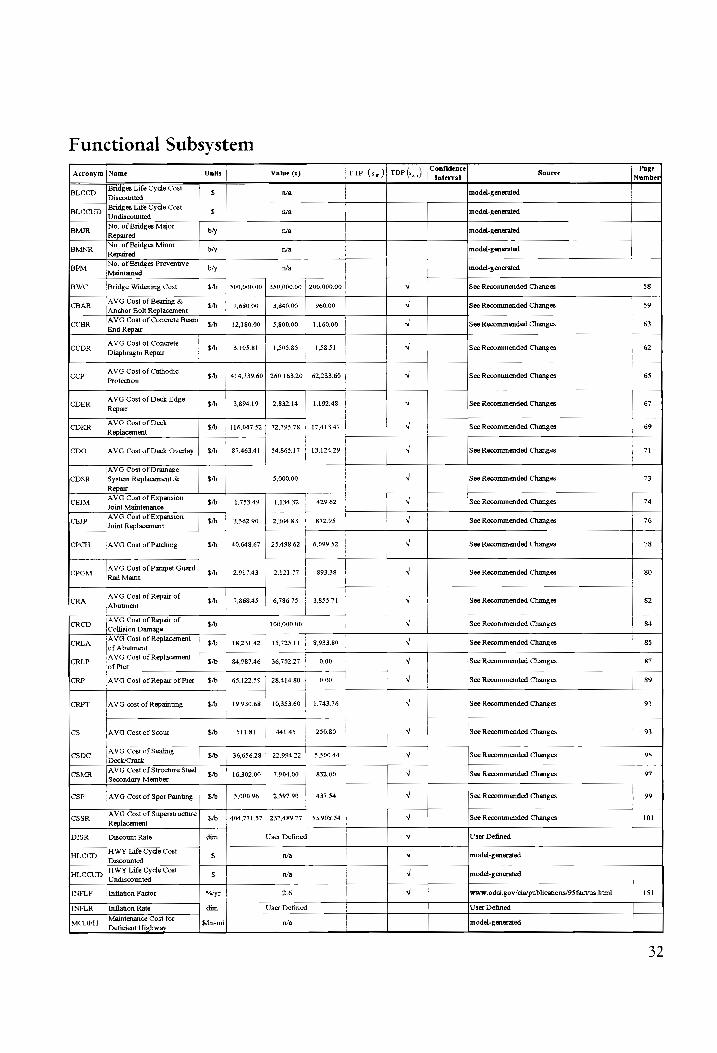
Functional Subsystem
Acronym | Name Units Value (x) ‘ TIP (s ) TDP (s, J Content Source | wee
Biccp | Bndges Life Cycle Cost $ wa model-generated Discounted : i Bridges Life Cycle Cost :
BLCCUD Undiscounted $ wa model-generated
No. of Bridges Major MOR - B Repaired b/y n/a model-generated
BMNR N°. of Bridges Minor b/y ma ! model-generated Repaired i
No. of Bridges Preventve | BPM to by n/a } model-generated
Maintained ' 2 |
BWC |Bridge Widening Cost $/b $00,000.00 350,000.00 | 200,000.00 | v See Recommended Changes 58
AVG Cost of Beanng & i | [ | ! i 0 0. . CBAR Anchor Bolt Repl ent $/ 7,680.00 3,840.00 | 960.00 v See Recommended Changes 59
AVG Cost of Concrete Beam : | "CBR - RU 5,800.00 | . CCB. End Repair $/ 12,180.00 780! | 1,160.00 See Recommended Changes 63
AVG Cost of Concrete 05.8 . ‘ . \ CCDR ap} Repair $/ | 3,105.81 | 1,505.85 | 15851 v See Recommended Changes 62
1 1
AVG Cost of Cathodic ‘ 739. 20 3.60 ccP Protection $% | 414,739.60 | 260,163.20] 62,23 ’ v See Recommended Changes 65
| CDER | AVG Cost of Deck Edge $b | 399419 | 293214 | 119248 | v See Recommended Changes 67
'Repar i
CDKR AVG Costof Deck $/> | 116,047.82 | 72,795.78 | 17,413.47 | v See Recommended Changes 69 Replacement ! :
cDo AVG Cost of Deck Overlay | $/b | 87,463.41 | 54,865.17 ' 13,124.29 | v See Recommended Changes ; 71 } ; t L !
AVG Cost of Drainage
CDSR System Replacement & $/o 5,000.00 ' v See Recommended Changes 73
Repair | AVG Cost of Expansion ‘ CEJ : 753.4 134. 429.62 v SeeR 74 M Joint tenance $/b 1,753.49 1,134.32 - ee Recommended Changes
t - + ——F
cep AVG Cost of Expansion $/ | 3,562.90 | 230483 | 872.95 v See Recommended Changes 16 iJount Replacement : _
i
CPCH AVG Cost of Patching 8 40,648.67 | 25,498.62 | 6,099 52 v See Recommended Changes 78
| . CPGM jAVG Cost of Parapet Guard $4 2,917.43 2,121.77 393.38 | Vv See Recommended Changes 80
‘Rail Maint.
AVG Cost of Repair of 7,868.4 6,786.75 3,855.71 Vv t CRA Abutment $/ 5 See Recommended Changes 82
L ,
crcp [AVG Cost of Repair of S/o 100,000.00 v See Recommended Changes 84 Collision Damage
AVG Cost of Replacement : ‘ ro) 3. 80 CRLA of Abutment $/b 18,231.42 | 15,725.11 8,933.8 Vv See Recommended Changes 85
crip AVG Costof Replacement | 5 | 94 og746 | 36,702.27 | 0.00 | ¥ See Recommended Changes 87 of Pier
' | CRP AVG Cost of Repar of Pier | $/b 65,122.59 | 28,414.80 | 9.00 v See Recommended Changes 89
CRPT AVG cost of Repainting $/ | 19,930 68 | 10,353.60 | 1,743.76 | v See Recommended Changes 91 i
cs AVG Cost of Scour $/ 311.81 441.45 250.80 v | See Recommended Changes 93
AVG Cost of Seahng | = 656. 994.22 | $,50044 | v See R csDCc DeckiC $/o 36,656.28 | 22, ee Recommended Changes 95
AVG Cost of Structure Steel 302. 7,904.00 832.00 CSMR [oon dary Member $/ | 16,302.00 9 32.0 | N See Recommended Changes 97
| CSP -AVG Cost of Spot Painting | $/> | 5,000.96 | 2597.90 | 43754 | v See Recommended Changes 99
cssr [AVG CostofSuperstructure |g, | 4o4.771.57 | 237,489.77 | 53,908.54 | v See Recommended Changes 101 Replacement
DISR Discount Rate dim. User Defined V User Defined
HLccp [HWY Life Cycle Cost $ wa ¥ model-generated Discounted { | HWY Life Cycle Cost i
HLCCUD | discounted $ n/a ; v model-generated
INFLF Inflation Factor “lyr 2.6 | v www.odci gov/cia/publicationa/95 fact/us.html 151 \ [
TNFLR Inflation Rate dim. User Defined User Defined Maintenance Cost for |
(CDFH - = ni del- ed M Deticient Highway | Sin ™ 2 model- generat
32

| Confidence Page Acronym |Name | Units Value (x) iT IP (s,) TDP (s.,) Interval Source Numbe
Maintenance Cost for . ) . nf - MCDTH Deteriorated Highwa $An-mi ‘a model-generated
MIRCB Major Repair Cost of $f wa | model-generated Bridges
MnRcB_ Minor Repair Cost of sd Wa model-generated Bridges |
péMca [Preventive Maint Costof | ¢,, wa | model-generated Bridges
RHCB R . tation Cost of Sb Wa model-g enerated Bridges
RPCB [Replacement Cost of Bridges! S/b wa ] model-g enerated
Total Bridges Expenditure | - TBED Discounted $Ar n/a model-generated
Total Bridges Expenditure TBEUD Undiscounted SAr wa model-g enerated
TBEXPD | Total Bridges Expenditure SAr n/a model-g enerated
Total HWY Construction el- THCE Expenditure Mr n/a model-g enerated
. FE
THED ‘| Total HWY Expenditure | 4, wa model-generated | Discounted { Total HWY Expenditure | THEUD |, Giscounted Sr n/a model-generated |
THME | Total HWY Maintenance SAyr wa | model-generated |Expenditure , [_
TIME Time yr. User Defined User Defined
Weighting Factor for ] WFBAR |Beanng & Anchor Bolt dim. 0.01 v See Recommended Changes 173
Replacement
wrepr | Weehting Factor for dim 0.13 v | See Recommended Changes 174 Concrete Beam End Repair
| Weighting Factor for 0. R WFCDR Concrete Di Repair dim 03 v See Recommended Changes i75
Weighting Factor for : . : R ed WFCP | cathodic Protection dim 0.01 NV See Recommended Changes 176
WEDER | Weiehtng Factor for Deck | ain, 0.04 v See Recommended Changes 177 Edge Repair
, Weighting Facior for Deck . WFDKR Rep ent dim. 0.65 Vv i See Recommended Changes 178
WFDO Oncay Factor for Deck dim. | 0.17 | Vv | see Recommended Changes | 179
Weightng Factor for
WFDSR_ | Drainage Sys Replace & dim. 0.07 Vv See Recommended Changes 180
| Repair | | Weighting Factor for | |
WFEJM Expansion Joint dim. 0.63 V See Recommended Changes 181 Maintenance
Weightng Factor for . : 0. 2 WFEJR Expansion Joint Recons dim 29 v See Recommended Changes 182
wrpcH | Weighting Factor for dim. 0.21 V See Recommended Changes 183 Patching
| Weighting Factor for Parapet] .. 1
. v ‘ WFPGM Guard Rail Maint ce dim. 0.07 | See Recommended Changes 184
[Weigh f eighting Factor for Repair : . 0.14 See Ri ied WFRA lof Abutment dim N | ee Recommended Changes 185
Weighting Factor for Repair | . 0.14 v See R ded WFRCD of Collision Damage dim ee Recommended Changes 186
Weighting Factor for : WFRL : 0.0 R
[Replacement of Abutment | aim 1 v |see ecommended Changes 187
Weighting Factor for : | WFRL. . . 0.01 v See Recommended Chang
P Replacement of Pier dim « 188
WFRP ee Factor for Repair | ai, 0.70 ty | See Recommended Changes 189
Weighting Factor for | | . 0.14 See R ded WFRPT Repainting dim Vv ee Recommended Changes 190
WFS Weighting Factor for Scour | dim. 0.13 Vv See Recommended Changes i91
WFSDC noeene Factor for Sealing| ai, 0.13 v See Recommended Changes 192
Weighting Factor for | WFSMR_ [Structure Steel Secondary dim. 0.03 v See Recommended Changes 193
Member Replace & Repair
WFSP Weighting Factor for Spot dim. 0.04 v See Recommended Changes 194 Panting
Weighting Factor for Super - . 0.2 R WFSSR g ctureR ent dim ; 2 v See Recommended Changes 195
33

Physical Subsystem: Bridge Management System
Acronym | Name Units Value (x) TIP (s x ) TDP (s; ) Confidene ° Source Never
Accelerated Deterioration : 22 Arte Time of Bridges yt 22 | 28 25 Vv See Recommended Changes 39
BCC Bridges in Critical Condition} b Wa model-generated
Bridges in Func Adequate BFACC | Gitical Condition b i 0 0 | 0 v Super Natural query of HTRIS 45
Bridges in Func Adequate | po BFAFC Fair Condition b | 121 | 277 | 633 v Super Natural query of HTRIS 46
Bnidges in Func Adequate \ | BFAGC |e od Condition b | 100 | 370 | 1031 v Super Natural query of HTRIS 47
FAI Bridges Fune. Adequacy dim. | na modei-generated Index 1
Bridges in Func Adequate ! BFAPC | sor Condition b | 6 16 53 Vv Super Natural query of HTRIS 48
Bridges in Func Adequate 1 i BFAPFC Preferred Condition b 0 0 | 0 v Super Natural query of HTRIS 49
BFC Bridges in Fair Condition b Wa model-generated
Bnidges in Func Inadequate I | BFICC Critical Condition b | 0 0 0 v Super Natural query of HTRIS 50
Bridges in Func inadequate BFIFC Fair Condition b 1 20 89 ¥ Super Natural query of HTRIS | 51
Bridges in Func Inadequate I | BFIGC Good Condition b | 2 4 34 v Super Natural query of HTRIS 52
Bridges in Func Inadequate BFIPC Poor Condition b ! a 36 79 v Super Natural query of HTRIS | 53
Bridges mn Func Inadequate | BFIPFC | 5, ferred Condition | b | ° 0 0 Vv Super Natural query of HTRIS 54
BGC Bridges in Good Condition |b Wa model-generated 1 1 |
BPAI Bridges Physical Adequacy dim. | Wa model-generated Index i
BPC Bridges in Poor Condition bi va model-generated
Bridges in Preferred PF - | - BPFC Condition db wa model-generated
BW Bridge Widerung b/yt | Wa model-generated
BWB Bridge Widening Budget Siyr 150,000.00 | v model-generated 57
DTTB Det erioration Time of yr 21 | 17 ] 19 v See Recommended Changes 106 Bridges | |
. . ! Dean Hackett: Bridges that are new go from
ETB Exposure Time of Bridges yt os y _| preferred to good condition after one winter. 107 F
Func Adequate Accelerated | | AAD . : b/yr | -
F. RB Depreciation Rate of Bridges wr wa | v model-generated
‘Func Adequate Deterioration FADRB pate of Bri dges byt Wa N model-generated
Func Adequate Exposure f | FAERB Rate of Bridges b/yr va v model-generated
Func Adequate Major ; . bs v - FAMJRB Repairs of Bridges ‘yr wa model-generated
Fune Adequate Major FAMJRBB Repairs Budget of Bridges Syr na | Vv model-generated
FAMNRB Func Adequate Minor b/yr | va Vv model-generated Repairs of Bndges |
Func Adequate Minor . . Mv - FAMNRBB) p eairs Budget of Bridges Siyt ‘a N model-generated
Func Adequate Preventive b/ - FAPMB Maint of Bridges ‘yr wa v model-generated
Func Adequate Preventive : FAPMBB |) int Bu dget of Bridges dim Wa v model-generated
Func Adequate Serious FASDRB Depreciation Rate of Bridges b/yr Wa model-generated
FBBW Fract Budget to Bridge dim | 0.5293] 0.0187; — v 6 Year Plan 109 Widening |
Fract Budget to Func |
FBFAIJRB | Adequate Major Repair of dim | 0.4022} 0.1182] 0.1233 v See Recommended Changes 11]
Bridges
Fract Budget to Func
FBFAN RB Adequate Minor Repairs of | dim | 0.0352] 0.0201 | 0.1223 Vv See Recommended Changes | 113
Bridges

: ; Confid , P. Acronym | Name | Unit | Value (x) TIP (s,) | TDP [s; ) ; Interval | Source | Nunther
Ree Bain Cet fanation | FBFAPMB /| Adequate Preventative dim } 0.0321; 0.0370 0.0971 v See Recommended Changes | Ws |
Maintenance of Bridges |
Fract Budget to Func ' j
FBFIJRB | Inadequate Major Repair of | dum | 0.0000| 02660 0.1838 v See Recommended Changes | 117
Bridges _ |
|Fract Budget to Func t ;
FBFINRB {Inadequate Minor Repair of | dir | 9.0003) 0.0015 00172 Vv See Recommended Changes | 119
| Bridges |
Fract Budget to Func | FBFIPMB | Inadequate Preventive dim | 0.0006 | 0.0003 ' 6 0032 v See Recommended Changes | 121
Maintenance of Bridges | |
Fract Budget to . | “aos . 9 0600 a — 2
FBRHB Rehabilitation of Bridges dim 00 a 0182 N | ‘ HTRIS | 12s 4 y 1 ,
FBRPB Fret Budgetto Replacement] | gang) oassa v 6 Year Plan | 126 of Bndges i | |
Func Inadequate Accelerated :
FIADRB Depreciation Rate of Bridges biyr ma : model-generated
Func Inadequate '
FIDRB Deterioration Rate of b/yr va model-generated
\ Bridges ‘
Func Inadequate Exposure i - FIERB Rate of Bridges | b/yr na model-generated
FIMIRB |Punc Inadequate Major b/yr wa model-generated Repairs of Bidges :
Fune Inadequate Major | / FIMIRBB | Repairs Budget of Bridges oy | va model-generated
FIMNRB Func Inadequate Minor b/yr na model-generated Repairs of Bridges | |
Func Inadequate Minor : : - i - FIMNRBB Repairs Budget of Bridges $41 wa model-generated
Func Inadequate |
FIPMB Preventative Maint of b/yr | Iva model-generated
Bnidges | ‘
Func Inadequate |
FIPMBB _ |Preventative Maint Budget S/yr j wa model-generated
| of Bridges |
Func Inadequate Serious : ‘ yt: ' : - FISDRB Depreciation Rate of Bndges b *| wa ; model-generated
ORB Pride Rate of b/yr va model-generated
OTB Brien Fume of yt 20 | v See Recommended Changes 153
habilitats dget of ' PY RHBB re yes on Budget of siyr wa | model-generated
RHRB edges Rate of b/yr na | model-generated |
+ T t
RPBB Baie Budget of $/yt | Wa : model-generated | !
RPRB / Replacement Rate of Bndges| b/yr na J. model-generated } | :
SDTB | Serious Deterioration Time yt 1S | 30 32 N See Recommended Changes 162 [of Bndges
WFCB Bridees Factor for Critical! gi, | User Defined L User Defined
WFGB | Weighting Factor for Good dim User Defined : ; User Defined | Bridges | _|
ty v
WFPB (ages Factor for Poor dim | UserDefined | | User Defined
WEPFR | Weighting Factor for dim | User Defined | User Defined Preferred Bndges | |

Physical Subsystem: Pavement Management System
i | Confidence Page Acronyin Name Units Value (x) | TIP (s x ) TDP (s; J Interval | Source | Number!
, + ARH Aging Rate of Highway In-mi/yr Wa | i model-generated
on ATH Aging Time of Highway yt 6 | Transportation Research Counal 41
Deteriorating Rate of i j ' DRH In-m1y : del-. ted ehway n-mi/yr Iva model-g enerat
DHT Deterio e Time of yr 5 Vv | | Transportation Research Council 104 Highway i | Fract Maint Budget to to FMBDFH dim W | del-generated Deficent HWY a | model-gen
FMBDTH FT¢t Maint Budget to dim na model-generated Deteriorated HWY ' 1 |
HpFpc — Highway in Deficent In-mi | 8.10 45.04 ~ Poy \Pave Tech PCI Ratngs 143 Pavement Condition ! | | ! =
; ' : : ' T HDRM Highway Down Ratio for dim | wa \ i model-generated |
Maintenance : | a Lo
| Highway in Deteriorated : ' | HpTepc | UB MWay in Veetenioral Inm | 22039 | 1.06878; —- foo yw Pave Tech PCI Ratings 144 Pavement Condition . | ‘
Po ee I : ‘
HPAI Highway Physical Adequacy dim wa model-generated Index | * '
__ - : Hsrpc — Haehway im Sufficient inmi | 271.15 | 1,451.91 --- voy |Pave Tech PCI Ratings 147 = Pavement Condition | i
MRDFH Maintenance Rate for In-mrvyr n/a | model-generated Defiaent Highway | a i | ee i]
: ' Maintenance Rate for . :
MRDTH -mi i del- ed Detenorated Highway in-mv/yr wa moder genera
| 4 \
Maintenance Replacement | MRRH . “P In-mi/yr n/a ! : -model-generated
Rate of Highway ' t ' }_____.. + + —_______—. i _________—_——-.
TMH Total Lane-mileage of In-m wa i model-generated Highway ee Po
WEDECH Weighting Factor for dim User Defined ; | User Defined Defiaent Condition of \ Weightng Factor for i ‘ : | WFEDTCH ene | dim User Defined ; User Defined Detenorated Condition of | | :
Oo I [ i i a
36

APPENDIX B: PARAMETER WRITE-UPS
Average Annual Daily Traffic Volume (AADT)
Definition/Assumptions
AADT is the average hourly one-way traffic per mile of route.
Formula
AADT.K=AADTJ+(DT)(ADTINC JK) Value (veh)
See spreadsheet below.
Source
1. Use the “Relative Density of Traffic by Route” table for the Salem District found in the Average Daily Traffic Volumes on Interstate, Arterial, and Primary Routes - 1994. Input Route, Mileage, and Average 24-hour Traffic per Mile of Route into an Excel spreadsheet.
3. Sort by Route.
ho
37

Spreadsheet
Route Mileage Ave. 24 Hr. Traffic per Mile of Route
1-581 6.75 60,725
1-77 24,29 25,171
I-81 86.87 33,201 US 11 68.57 12,392
US 219 1.73 4,900 US 220 108.43 20,126
US 220 BUS 0.27 30,000 US 221 89.87 6,951
US 460 99.91 15,308 US 460 BUS 3.46 6,542 US 501 14.29 2,459
US 52 27.44 3,638
US 58 83.96 6,856 US 58 BUS 6.71 15.417
VA 100 48.54 Jat VA 103 13.43 2,468
VA 108 4.24 3,300 VA 112 0.21 1,100
VA 114 8.25 10,139
VA 115 3.14 12,210 VA 116 12.78 3,670
VA 117 1.35 21,000 VA 118 0.20 13,000
VA 122 50.14 4,012 VA 148 0.87 3,900
VA 174 4.29 3,900 VA 177 2.33 3,800
VA 18 5.12 300 VA 220 ALT 6.83 16,357
VA 232 0.58 5,800 VA 24 34.36 5,315
VA 311 40.24 3,899
VA 320 1.75 300 VA 40 47.79 5,680 VA 419 6.97 28.014
VA 42 51.50 2,449 VA 43 48.86 1,420
VA 43 Y 0.11 763
VA 457 2.62 4,800 VA 57 38.22 5,693
VA 57 ALT 4.09 10,000
VA 61 13.63 775 VA 69 0.25 3,400
VA 8 55.14 3,475 VA 87 4.10 8,229
VA 94 9.20 1,100 VA 97 8.27 1,100
VA 99 1.35 5,800
38

Accelerated Deterioration Time of Bridges (ADTB)
Definition/Assumptions
ADTB is defined, as the time required for a bridge condition rating to go from “Fair” to “Poor”.
Formula
Constant.
Value (yr.)
Interstate 22
Primary 28 Secondary 25
Source (see Recommended Changes)
Current
1. This type of information is unavailable at this time, as it is not collected. 2. Dean Hackett, Salem District Bridge Engineer, with a Super Natural query
of HTRIS, obtained data used for this parameter.
3. Values were obtained by subtracting the “Year Built” from the “Year Improved” for each of the Road and Bridge classifications.
Recommended
1. For new structures, time begins subsequent to the completed structure’s first winter, as ordinary maintenance is performed to mitigate the effects of that winter, thereby placing the bridge in the “Good” condition.
2. For existing structures, time begins subsequent to any upgrade or downgrade to its existing condition.
3. Deterioration Times are then calculated by finding the difference between the date of classification for the older (higher) condition and the date for the newer (lower) condition.
Spreadsheet
N/A
39

Average Distance Traveled per Gallon (ADTPG)
Definition/Assumptions
Passenger vehicles include pickup and panel trucks (with a registered gross weight of 27,500 lb.), as well as passenger vehicles.
Formula
Constant.
Value (mi./gal)
Passenger 19.5 Other 5.5
Source
1. Federal Highway Administration’s (FHWA) Highway Statistics Manual - Table VM1.
2. An alternate source is the Division of Motor Vehicle’s (DMV) Office of Forecasting and Analysis. Point of Contact is Ms. Gerry Turner, Chief Economist. (804) 367-6473.
Spreadsheet
N/A
40

Aging Time of Highway (ATH)
Definition/Assumptions
Is the time for pavement to decline from a “Good” rating to a “Fair” rating.
Formula
Constant.
Value (yr.)
6
Source
1. This data is unavailable at this time due to the Transportation Research Council (TRC) upgrading their database system. It is estimated the new system will be in place in January 1997.
2. Mr. Tom Freeman of the TRC provided this estimate. (804) 293-1957.
Spreadsheet
N/A
41
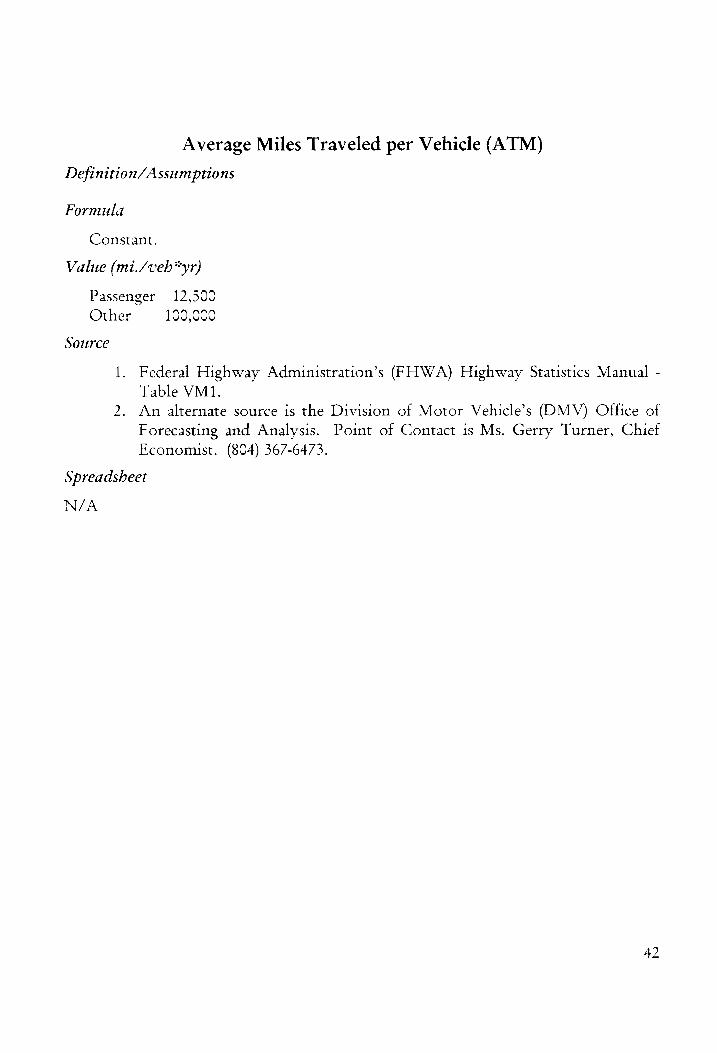
Average Miles Traveled per Vehicle (ATM)
Definition/Assumptions
Formula
Constant.
Value (mi./veh*yr)
Passenger 12,500 Other 100,000
Source
1. Federal Highway Administration’s (FHWA) Highway Statistics Manual - Table VM1.
2. An alternate source is the Division of Motor Vehicle’s (DMV) Office of Forecasting and Analysis. Point of Contact is Ms. Gerry Turner, Chief Economist. (804) 367-6473.
Spreadsheet
N/A
42

Average Value of a Vehicle Registered in Virginia (AVVV)
Definition/Assumptions
Formula
Constant.
Value ($/veb)
2,146.86
Source
1. This value was calculated from data obtained from the Division of Motor Vehicle’s (DMV) Office of Forecasting and Analysis. Point of Contact is Ms. Gerry Turner, Chief Economist. (804) 367-6473. The total amount of money collected from the Motor Vehicle Sales & Use Tax (MVSUT) is $353,285,000.00. By definition, a vehicle is either taxed at 3.0% of its total worth or $35.00, whichever is greater.
3. The value was calculated with the following formulas: MVSUT - ($35.00 x 360,000) = $340,685,000.00
Vehicles in Virginia (VV) - 360,000 = 5,125,309
$340,285,000 ——_——"___ = $2. 215.70 (5,125,309 x 3%)
a
ho
5
= $1,166.67 3% [($1.166.67 x 360,000) +($2.215.70 x 5,125,309)|
| = $2146.86 5,485,309 4. Numerical calculations of this sort are expedited through the use of a
spreadsheet.
Spreadsheet
N/A
43

Bridge Budget (BB)
Definition/Assumptions
The Bridge Budget consists of the ordinary, maintenance replacement, widening, and replacement expenditures. For 1995 data, there was not any money budgeted for bridge replacement.
Formula
BB.K=clip(clip(1.49E6*K, 1.49E6, TIME.K,5)FMBP.K*HMBS.K, TIME.K,0)
Value ($/yr.)
Interstate $2,833,758.92
Primary $8,005,016.08
Secondary $3,018,059.80
SOUrCE
1. In HTRIS, run an inquiry for the 220 (Ordinary Maintenance), 460 (Maintenance Replacement), and 404 (Bridge Inspections). Separate the inquiries by System: 3 (Primary), 4 (Secondary), and 5 (Interstate).
3. In Excel, for each of the categories, use this equation:
Bridge Widening = BWC
Act 221+ Act 222 + Act 223 + Act 224+ Act 404 = Ordinary Maintenance
Act 461+ Act 462 + Act 463 + Act 464+ Act 465 + Act 466+
Act 467 = Maintenance Replacement
bo
Bridge Widening + Ordinary Maintenance + Maintenance Replacement = BB
Spreadsheet
Maintenance Construction Total
Interstate $1,333 ,758.92 $1,500,000.00 $2,833,758.92
Primary $4,710,016.08 $3 295,000.00 $8,005,016.08
Secondary $3 018,059.80 --- $3,018,059.80
44

Bridges in Functionally Adequate Critical Condition (BFACC)
Definition/Assumptions
BFACC is detined as those bridges whose design still meets the federal specifications, but has advanced deterioration of one or more of its primary structural elements, z.e., fatigue cracks in steel or shear cracks in concrete.
Formula
BFACC.K =BFACC J+ (DT)(FASDRB JK-RHRB,JK)
Value (b)
Interstate Q
Primary 0 Secondary 0
Source
1. Dean Hackett, Salem District Bridge Engineer, Super Natural query: “Breakdown of Structures by Sufficiency Ratings”.
2. Break the data down into the three systems (3, 4, & 5). 3. For each of the sufficiency ratings, multiply the respective percentages by
its respective items (bridge or culvert) and total the two values, z.e.,
[ Bridges!" x Bridges" | +(Culvertsinews x Culverts" = BFACC o Adequate & Critical] Number (%e Adequate & Critical) sumber
Spreadsheet
See spreadsheet on page 55.
45

Bridges in Functionally Adequate Fair Condition (BFAFC)
Definition/Assumptions
BFAFC is defined as those bridges whose design still meets the federal specifications. All primary structural elements are sound but may have minor section loss, cracking, spalling or scour.
Formula
BFAFC.K =BFAFC,] + (DT) (FADRB.JK-FAMNRB.JK-FAADRB. JK)
Value (b)
Interstate 121
Primary 277 Secondary 633
Source
1. Dean Hackett, Salem District Bridge Engineer, Super Natural query: “Breakdown of Structures by Sufficiency Ratings”. Break the data down into the three systems (3, 4, & 5).
3. For each of the sufficiency ratings, multiply the respective percentages by its respective items (bridge or culvert) and total the two values, z.e., (Bridgestts x Bridges |. (cutverts'#** se Culverts ~ BFAFC
a Adequate & Fur } i Number) %9 Adequate & Farr] (Number 3
ho
Spreadsheet
See spreadsheet on page 55.
46

Bridges in Functionally Adequate Good Condition (BFAGC)
Definition/Assumptions
BFAGC is defined as those bridges whose design still meets the federal specifications, but there may be some minor problems.
Formula
BFAGC.K =BFAGC,] + (DT)(FAERB.JK-FAPMB.JK-FADRB.JK)
Value (b)
Interstate 100
Primary 370
Secondary 1031
Source
1. Dean Hackett, Salem District Bridge Engineer, Super Natural query: “Breakdown of Structures by Sufficiency Ratings”.
2. Break the data down into the three systems (3, 4, & 5). 3. For each of the sufficiency ratings, multiply the respective percentages by
its respective items (bridge or culvert) and total the two values, z.e.,
(Bridgesit= x Bridges tn | +4 [Culverts x Culverts" _ BFAGC
(°o Adequate & Good) (9° Adequate & Good {Number |
Spreadsheet
See spreadsheet on page 55.
47

Bridges in Functionally Adequate Poor Condition (BFAPC)
Definition/Assumptions
BFAPC is defined as those bridges whose design still meets the federal specifications. Poor condition is defined as advanced section loss, deterioration, spalling or scour, with local failures possible.
Formula
BFAPC.K =BFAPC,] +(DT)(FAPMB.JK +FAMNRB.JK +FAMJRB.JK+RHRBJ K+RPRB.JK +BW.JK-ORB.JK-FAERB JK)
Value (b)
Interstate 6
Primary 16 Secondary 53
Source
1. Dean Hackett, Salem District Bridge Engineer, Super Natural querv: “Breakdown of Structures by Sufficiency Ratings”. Break the data down into the three systems (3, 4, & 5).
3. For each of the sufficiency ratings, multiply the respective percentages by its respective items (bridge or culvert) and total the two values, z.e.,
(Bridges! x Bridges) | + (Culverts x Culverts" = BFAPC i%> Adequate & Poor ! 1% Adequate & Poor | {Number |
bho
Spreadsheet
See spreadsheet on page 55.
48

Bridges in Functionally Adequate Preferred Condition (BFAPFC)
Definition/Assumptions
Bridges in this category are assumed to need ordinary maintenance after one winter and therefore, are considered “Adequate Good Condition”.
Formula
BFAPFC.K=BFAPFC_] +(DT)(FAPMB.JK +FAMNRB.JK+FAMJRBJK+RH
RB.JK+RPRB.JK+VW.JK-ORB.JK-FAERB.JK)
Value (b)
Interstate 0
Primary 0 Secondary 0
Source
1. Dean Hackett, Salem District Bridge Engineer, Super Natural query: “Breakdown of Structures by Sufficiency Ratings”.
2. Break the data down into the three systems (3, 4, & 5). 3. For each of the sufficiency ratings, multiply the respective percentages by
its respective items (bridge or culvert) and total the two values, z.e, . Interstate : Interstate . Interstate ” Interstate Ie x J r —_ 2 A : ( Bridges" adewuate & Preferea’i * DIdges, =: | +(con CTS. Adequate & Prefered) * Culverts,. xe | = BFAPFC
Spreadsheet
See spreadsheet on page 55.
49

Bridges in Functionally Inadequate Critical Condition (BFICC)
Definition/Assumptions
BFICC is defined as those bridges whose design does not meet the federal specifications, but has advanced deterioration of one or more of its primary structural elements, 7.¢e., fatigue cracks in steel or shear cracks in concrete.
Formula
BFICC.K-BFICC,] + (DT)(FISDRB.JK-RPRB.JK)
Value (b)
Interstate 0 Primary 0 Secondary 0
Source
1. Dean Hackett, Salem District Bridge Engineer, Super Natural query: “Breakdown of Structures by Sufficiency Ratings’.
2. Break the data down into the three systems (3, 4, & 5). 3. For each of the sufficiency ratings, multiply the respective percentages by
its respective items (bridge or culvert) and total the two values, 2.e.,
(Bridges x Bridges "2" J+ (c ulverts re x Culverts 2" = BFICC % Inadequate & Cnitical } (Number } o Inadequate & Cntical} {Number }
Spreadsheet
See spreadsheet on page 55.
50

Bridges in Functionally Inadequate Fair Condition (BFIFC)
Definition/Assumptions
BFIFC is defined as those bridges whose design does not meet the federal specifications. All primary structural elements are sound but may have minor section loss, cracking, spalling or scour.
Formula
BFIFC.K = BFIFC J + (DT)(FIDRB.JK-FIMNRB.JK-FIADRB.JK)
Value (b)
Interstate 1
Primary 20 Secondary 89
Source
1. Dean Hackett, Salem District Bridge Engineer, Super Natural query: “Breakdown of Structures by Sufficiency Ratings”.
2. Break the data down into the three systems (3, 4, & 5).
3. For each of the sufficiency ratings, multiply the respective percentages by its respective items (bridge or culvert) and total the two values, i.e.,
(Bridges x Bridgesynre | + (Cutvertsit"= x Culverts" ] = BFIFC (° Inadequate & Fair | ( Number (% Inadequate & Fair | {Number )
Spreadsheet
See spreadsheet on page 55.
51

Bridges in Functionally Inadequate Good Condition (BFIGC)
Definition/Assumptions
BFIGC is defined as those bridges whose design does not meet the federal specifications, but there may be some minor problems.
Formula
BFIGC.K =BFIGC,] + (DT)(FIERB.JK-FIPMB .JK-FIDRB JK)
Value (b)
Interstate 2
Primary 4 Secondary 34
Source
1. Dean Hackett, Salem District Bridge Engineer, Super Natural query: “Breakdown of Structures by Sufficiency Ratings”. Break the data down into the three systems (3, 4, 8& 5).
3. For each of the sufficiency ratings, multiply the respective percentages by its respective items (bridge or culvert) and total the two values, 7.e., (Bridges Interstate x Bridges" + (Cutversi x Culverts" —_ BFIGC
(9 Inadequate & Good! ! Number i (°o Inadequate & Good} Sumber
ho
Spreadsheet
See spreadsheet on page 55.
nn bo

Bridges in Functionally Inadequate Poor Condition (BFIPC)
Definition/Assumptions
BFIPC is defined as those bridges whose design does not meet the federal specifications. Poor condition 1s defined as advanced section loss, deterioration,
spalling or scour, with local failures possible.
Formula
BFIPC.K =BFIPC,J + (DT)(FIADRB.JK-FIMNJRB.JK-FISDRB.JK)
Value (b)
Interstate 0
Primary 36 Secondary 79
SOUrCE
1. Dean Hackett, Salem District Bridge Engineer, Super Natural query: “Breakdown of Structures by Sufficiency Ratings”. Break the data down into the three systems (3, 4, & 5).
3. For each of the sufficiency ratings, multiply the respective percentages by its respective items (bridge or culvert) and total the two values, .e., [Bridgos'*" x Bridges + (Culverts x Culverts _ BFI PC
(°o Imaidequate & Poor! (Number | (%> Inadequate & Poor | Number !
bho
Spreadsheet
See spreadsheet on page 55.

Bridges in Functionally Inadequate Preferred Condition (BFIPFC)
Definition/Assumptions
Bridges in this category are assumed to need ordinary maintenance after one winter and therefore, are considered “Inadequate Good Condition”.
Formula
BFIPFC.K =FBIPFC J + (DT)(FIPMB.JK +FIMNRB.JK + FIMJRB.JK + ORB.JK- BW.JK-FIERB.JK)
Value (b)
Interstate 0
Primary 0 Secondary 0
Source
1. Dean Hackett, Salem District Bridge Engineer, Super Natural query: “Breakdown of Structures by Sufficiency Ratings”. Break the data down into the three systems (3, 4, & 5).
3. For each of the sufficiency ratings, multiply the respective percentages by its respective items (bridge or culvert) and total the two values, i.e,
[Bridges x Bridges ee Js [Culverts x Culverts 8" = BFIPFC o Inadequate & Preferred ! ‘Number } (°o Inadequate & Preferred ! i Number}
bo
Spreadsheet
See spreadsheet on page 55.
54

SYSTEM TOTALS
Bridges Culverts Total Interstate 120 110 230
Primary +05 318 723
Secondary 1435 485 1920
INTERSTATE SYSTEM
Suff = 50 Suff < 50 Bridges Culverts Total Bridges Culverts Total
Good 22.5% 27 66.4% 73 100 1.7% 2 0.0% 0 2
Fair 71.7% 86 31.8% 35 121 0.8% | 0.0% 9 1
Poor 3.3% + 1.8% 2 6 0.0% 0 0.0% 90 0
Critical 0.0% Q 0.0% Q 0 0.0% 90 0.0% 0 Q
Total 97.5% 117 100.0% 110 227 2.5% = 3 0.0% 0 3
PRIMARY SYSTEM
Sulf = 50 Sulf < 50
Bridges Culverts Total Bridges Culverts Total
Good 34.7% 141 72.2% 230 370 1.0% + 0.0% QO 4
Fair 48.0% 194 25.9% 82 277 5.0% 20 0.0% 0 20
Poor 2.5% 10 1.9% 6 16 8.9% 36 0.0% 0 36
Critical 0.0% Q 0.0% 0 Q 0.0% 0 0.0% 9 0
Total 85.2% = 345 100.0% 318 663 14.9% 60 0.0% 90 60
SECONDARY SYSTEM
Sulf = 50 Suff < 50
Bridges Culverts Total Bridges Culverts Total Good 49.6% 712 65.8% 319 1031 2.4% 34 0.0% 0 34
Fair 34.5% 495 28.5% 138 633 6.2% 89 0.0% 9 89
Poor 1.8% 26 3.7% 28 53 5.5% 79 0.0% 0 79
Critical 0.0% 0 0.0% 0 Q 0.0% Q 0.0% 0 0
Total 85.9% 1233 100.0% 485 1718 14.1% 202 0.0% 90 202
Note: A structure with a sufficiency rating less than 50 is considered by the FHWA as being eligible
for Federal funding tor replacement because it is functionally obsolete.
mn mn

Birth Rate Parameter of Virginia (BRPV)
Definition/Assumptions
BRPV is the rate at which the population of Virginia is growing each year.
Formula
Constant.
Value (persons/yr.)
0.014591
Source
1. Using the Internet, this can be found in the US Census Bureau’s homepage at: www.census.gov/ftp/pub/population/www/statepop.btml
2. It should be noted for those individuals not familiar with the mechanics of the web, addresses (URL) are case sensitive and should be typed as shown above.
Spreadsheet
N/A
56
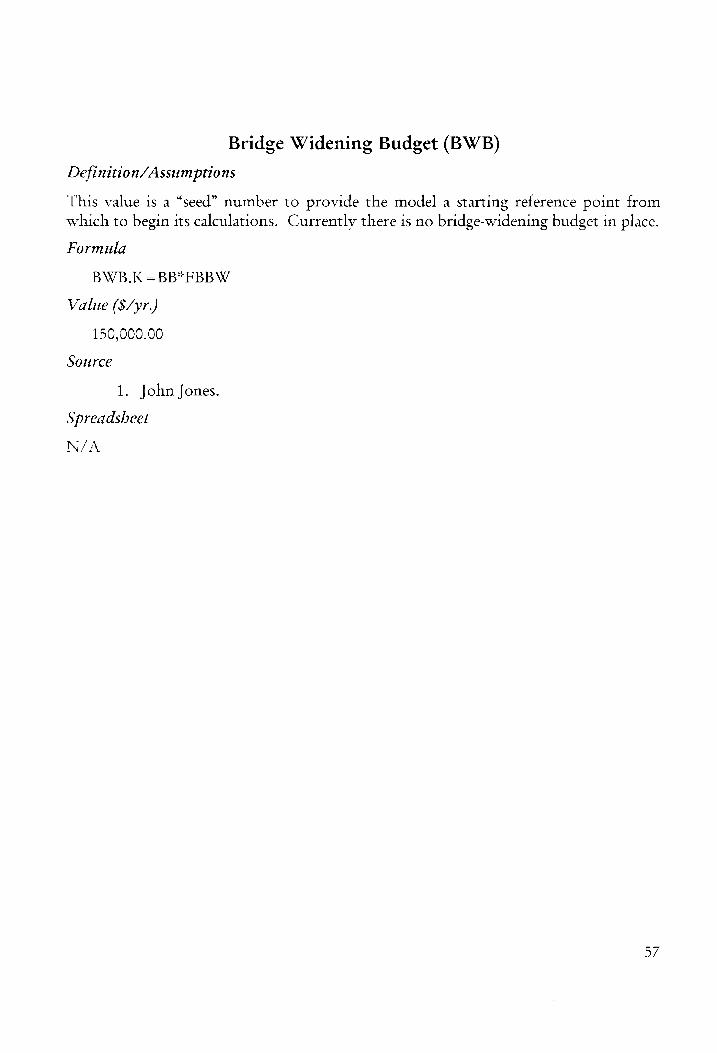
Bridge Widening Budget (BWB)
Definition/Assumptions
This value is a “seed” number to provide the model a starting reference point from which to begin its calculations. Currentlv there is no bridge-widening budget in place.
Formula
BWB.K = BB* FBBW
Value ($/yr.)
150,000.00
Source
1. John Jones.
Spreadsheet
N/A
57

Bridge Widening Cost (BWC)
Definition/Assumptions
At this time there is no recording system for this data. Dean Hackett, Salem District Bridge Engineer, provided the current values to act as a reference point.
Formula
Constant.
Value ($/yr.)
Interstate $500,000.00
Primary $350,000.00 Secondary $200,000.00
Source
Current
1. Dean Hackett, Salem District Bridge Engineer. Recommended
1. Establish new activity codes for each of the parameters. 2. Establish a data base with the following fields:
« Activity Name » Activity Code » System
» Bridge Identification Number » Cost
« Date
» Budget (Construction or Maintenance) » Bridge Condition Rating - Bridge Condition Rating Date
3. Activity costs are to be recorded on a “per bridge” basis using contract lump sums.
Spreadsheet
N/A

Average Cost of Bearing and Anchor Bolt Replacement (CBAR)
Definition/Assumptions
CBAR 1s based on the average size bridge for each of the road categories. It has been assumed that 10 percent are in need of replacement.
Formula
Constant.
Value ($/b)
Interstate $7,680.00
Primary $3,840.00 Secondary $ 960.00
Source (see Recommended Changes)
Current
1. The value of $3,200.00 per bearing is an average cost based on past contracts. 2. In Excel, for each of the categories, use this equation:
(Spans + 1) x (Beams per Span) x Cost per Bearing x 0.1 = CBAR
Recommended
1. Establish new activity codes for each of the parameters. 2. Establish a data base with the following fields:
- Activity Name - Activity Code - System
- Bridge Identification Number
+ Cost » Date + Budget (Construction or Maintenance) - Bridge Condition Rating - Bridge Condition Rating Date
3. Activity costs are to be recorded on a “per bridge” basis using contract lump sums.
Nn NO

Spreadsheet
Length (ft) Width (ft) Spans Beams per Span Cost per Bridge Interstate 209 45.1 3 7 $ 7,680.00
Primary 152 38.9 2 5 $ 3,840.00
Secondary 6+ 22.1 1 2 $ 960.00
$ 3,200.00 Cost per Bearing
Note: Assumed a value of 10 percent in need of repair.
60

Average Cost of Concrete Beam End Repair (CCBR)
Definition/Assumptions
CCBR is based on the average size bridge for each of the road categories. It has been assumed that 20 percent are in need of repair.
Formula
Constant.
Value ($/b)
Interstate $12,180.00
Primary $ 5,800.00 Secondary $ 1,160.00
Source (see Recommended Changes)
Current
1. Obtain the latest “Unit Price Listing - Salem District” from the Bridge Group.
2. Locate the item “Concrete Beam End Repair” under the major heading of “Superstructure Widening/Repair”.
3. In Excel, for each of the categories, use this equation:
(Spans + 1) x Beams per Span x Cost per Beam End « 0.2 = CCBR
Recommended
1. Establish new activity codes for each of the parameters. 2. Establish a data base with the following fields:
+ Activity Name » Activity Code + System - Bridge Identification Number + Cost + Date
- Budget (Construction or Maintenance) » Bridge Condition Rating » Bridge Condition Rating Date
3. Activity costs are to be recorded on a “per bridge” basis using contract lump sums.
61

Spreadsheet
Length (fi) Width (ft) Spans Beams per Span Cost per Bridge
Interstate 209 45.1 3 7 $ 12,180.00
Primary 152 38.9 2 5 $ 5,800.00
Secondary 64 22.1 1 2 $ 1,160.00
Cost per Beam End $ 1,450.00
Note: Assumed a value of 20 percent in need of repair.
62

Average Cost of Concrete Diaphragm Repair (CCDR)
Definition/Assumptions
CCDR is based on the average size bridge for each of the road categories. It has been assumed the diaphragms are spaced at 25 foot intervals and that 10 percent ts in need of repair.
Formula
Constant.
Value ($/b)
Interstate $3,105.81
Primary $1,505.85
Secondary $ 158.51
Source (see Recommended Changes)
Current
1. Obtain the latest “Unit Price Listing - Salem District” from the Bridge Group. 2. Locate the item “Concrete Diaphragm Repair” under the major heading of
“Superstructure Widening/Repair”. 3. Use the Average Price. 4. In Excel, for each of the categories, use this equation:
[ Length
25 x (Beams per Span - 1) x Cost per Diaphragm ~ 0.1 = CCDR
Recommended
1. Establish new activity codes for each of the parameters. 2. Establish a data base with the following fields:
- Activity Name » Activity Code + System » Bridge Identification Number ~ Cost - Date + Budget (Construction or Maintenance) + Bridge Condition Rating - Bridge Condition Rating Date
3. Activity costs are to be recorded on a “per bridge” basis using contract lump sums.

Spreadsheet
Note: Assumed a value of 10 percent in need of repair.
Length (ft) Width (ft) Spans Beams per Cost per Bridge Span
Interstate 209 45.1 3 7 $ 3,105.81 Primary 152 38.9 2 5 $ 1,505.85
Secondary 6+ 22.1 1 2 $ 158.51
Cost per Diaphragm S$ 619.18
64

Average Cost of Cathodic Protection (CCP)
Definition/Assumptions
CCP is based on the average size bridge for each of the road categories. The protection will cover the entire span of each of the bridge categories.
Formula
Constant.
Value ($/b)
Interstate $414,739.60
Primary $260,163.20 Secondary $ 62,233.60
Source (see Recommended Changes)
Current
1. Obtain the latest “Unit Price Listing - Salem District” from the Bridge Group. Locate the item “Anode System” under the major heading of “Superstructure Widening/Repair”.
3. Use the Average Price. 4. In Excel, for each of the categories, use this equation:
Length x Width x Cathodic Protection = CCP
Recommended
1. Establish new activity codes for each of the parameters. 2. Establish a data base with the following fields:
+ Activity Name » Activity Code + System + Bridge Identification Number « Cost » Date - Budget (Construction or Maintenance) - Bridge Condition Rating
» Bridge Condition Rating Date 3. Activity costs are to be recorded on a “per bridge” basis using contract
lump sums.

Spreadsheet
Length (ft) Width (ft) Spans Beams per Span Cost per Bridge
Interstate 209 45.1 3 7 $ 414,739.60
Primary 152 38.9 2 5 $ 260,163.20
Secondary 64 22.1 1 2 $ 62,233.60
Cathodic Protection $ 44.00
66
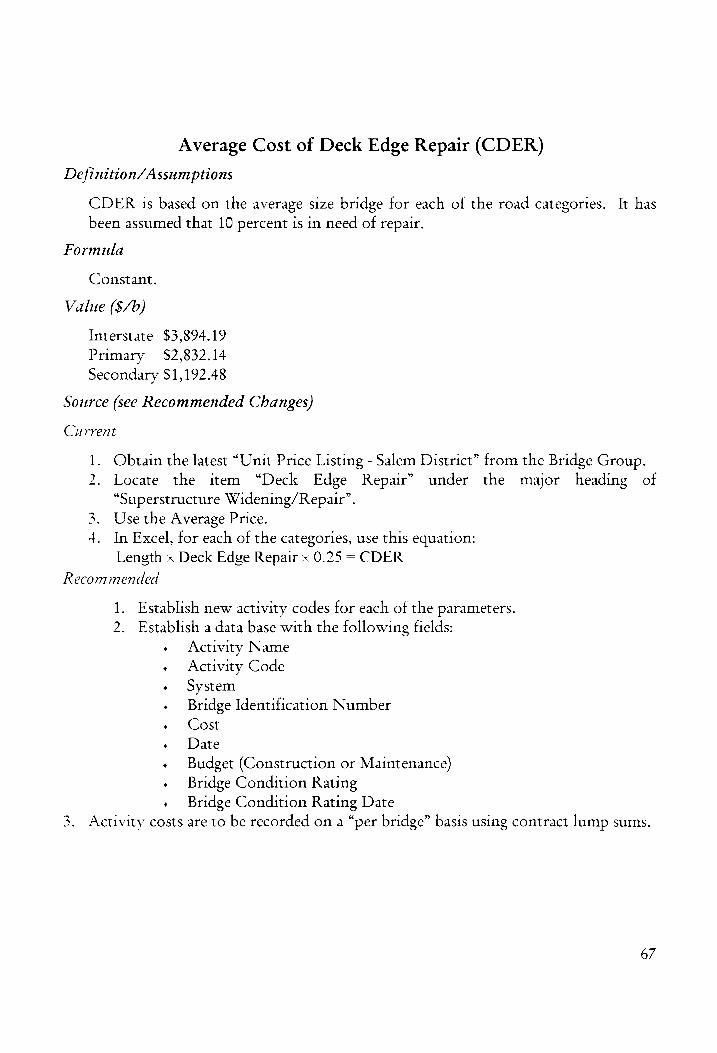
Average Cost of Deck Edge Repair (CDER)
Definition/Assumptions
CDER 1s based on the average size bridge for each of the road categories. It has been assumed that 10 percent is in need of repair.
Formula
Constant.
Value ($/b)
Interstate $3,894.19
Primary $2,832.14 Secondary $1,192.48
Source (see Recommended Changes)
Current
1. Obtain the latest “Unit Price Listing - Salem District” from the Bridge Group. 2. Locate the item “Deck Edge Repair” under the major heading of
“Superstructure Widening/Repair”. 3. Use the Average Price. +. In Excel, for each of the categories, use this equation:
Length x Deck Edge Repair x 0.25 = CDER
Recommended
1. Establish new activity codes for each of the parameters. 2. Establish a data base with the following fields:
- Activity Name » Activity Code + System » Bridge Identification Number - Cost - Date + Budget (Construction or Maintenance) » Bridge Condition Rating » Bridge Condition Rating Date
3. Activity costs are to be recorded on a “per bridge” basis using contract lump sums.
67

Spreadsheet
Length (ft) Width (ft) Spans Cost per Bridge
Interstate 209 45.1 3 $ 2,336.52
Primary 152 38.9 2 $ 1,699.28
Secondary 64 22.1 1 $ 715.49
Deck Edge Repair (If) $ 74.53
Note: Assumed a value of 15 percent in need of repair.
68
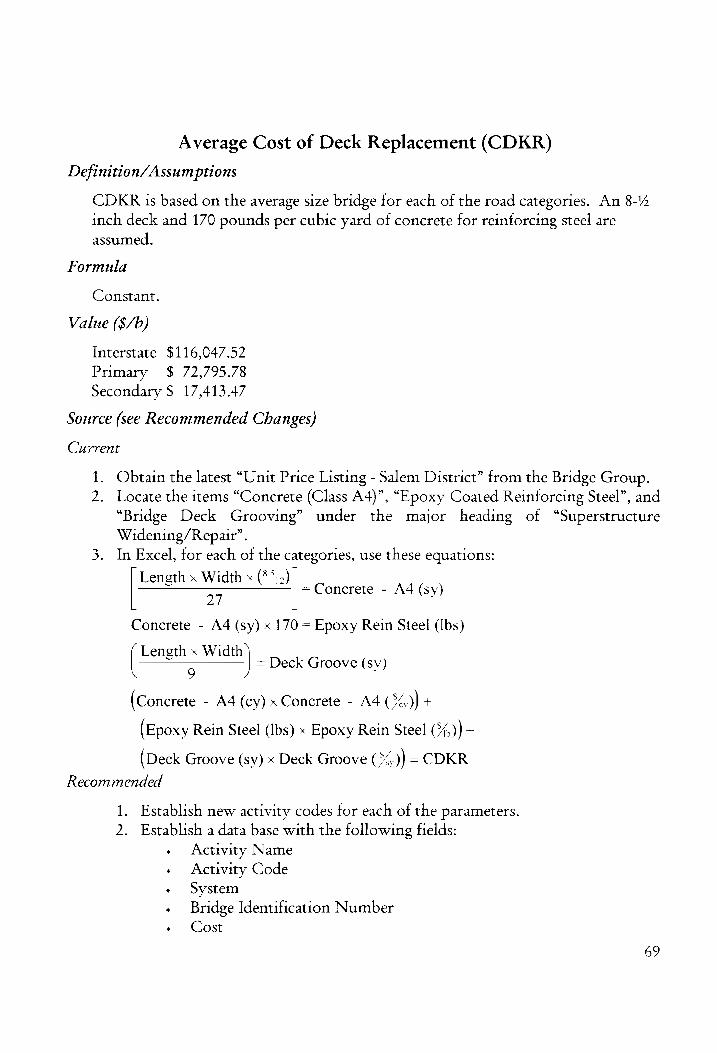
Average Cost of Deck Replacement (CDKR)
Definition/Assumptions
CDKR is based on the average size bridge tor each of the road categories. An 8-% inch deck and 170 pounds per cubic yard of concrete for reinforcing steel are assumed.
Formula
Constant.
Value ($/b)
Interstate $116,047.52
Primary $ 72,795.78 Secondary $ 17,413.47
Source (see Recommended Changes)
Current
1. Obtain the latest “Unit Price Listing - Salem District” from the Bridge Group. 2. Locate the items “Concrete (Class A4)”, “Epoxy Coated Reinforcing Steel”, and
“Bridge Deck Grooving” under the major heading of “Superstructure Widening/Repair”.
3. In Excel, for each of the categories, use these equations:
Length x Width x (**),)
27
Concrete - A4 (sy) x 170 = Epoxy Rein Steel (Ibs)
Length x Width — >. J Deck Groove (sy)
(Concrete - A4 (cy) x Concrete - A4 (%)) +
(Epoxy Rein Steel (lbs) x Epoxy Rein Steel (%)) +
(Deck Groove (sy) x Deck Groove ( 4) = CDKR
Recommended
|- Concrete - A4 (sy)
1. Establish new activity codes for each of the parameters. 2. Establish a data base with the following fields:
- Activity Name » Activity Code + System » Bridge Identification Number - Cost
69

+ Date
- Budget (Construction or Maintenance) - Bridge Condition Rating - Bridge Condition Rating Date
3. Activity costs are to be recorded on a “per bridge” basis using contract
lump sums.
Spreadsheet
Length (ft) Width Spans Concrete Epoxy Rein Steel Deck Groove (sy) | Cost per Bridge
(fy - A4 (cy) (Ib.) Interstate 209 $5.1 3 247.28 42038.35 1047.32 $ 116,047.52
Primary 152 38.9 2 155.12 26370.36 656.98 $ 72,795.78
Secondary 64 22.1 i 37.11 6308.05 157.16 $ 17,413.47
Concrete - § 325.57 A4 (cy)
Epoxy Rein $ 0.60
Steel (Ib.) Deck § 9.85
Groove (sy)
70
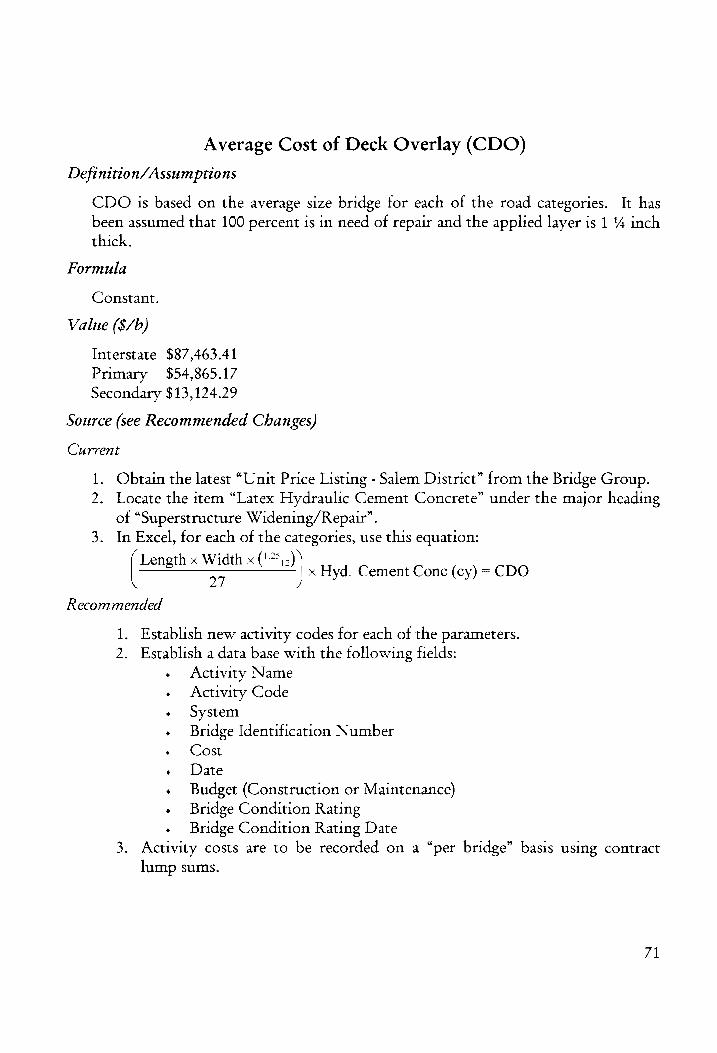
Average Cost of Deck Overlay (CDO)
Definition/Assumptions
CDO is based on the average size bridge for each of the road categories. It has been assumed that 100 percent is in need of repair and the applied layer is 1 4 inch thick.
Formula
Constant.
Value ($/b)
Interstate $87,463.41
Primary $54,865.17 Secondary $13,124.29
Source (see Recommended Changes)
Current
1. Obtain the latest “Unit Price Listing - Salem District” from the Bridge Group. 2. Locate the item “Latex Hydraulic Cement Concrete” under the major heading
of “Superstructure Widening/Repair”. 3. In Excel, for each of the categories, use this equation:
[tenes x Width x (17512) 27 x Hyd. Cement Conc (cy) = CDO
Recommended
1. Establish new activity codes for each of the parameters. 2. Establish a data base with the following fields:
+ Activity Name » Activity Code + System + Bridge Identification Number + Cost - Date + Budget (Construction or Maintenance) - Bridge Condition Rating + Bridge Condition Rating Date
3. Activity costs are to be recorded on a “per bridge” basis using contract lump sums.
71

Spreadsheet
Length (fi) Width (ft) Spans Cost per Bridge Interstate 209 45.1 3 $ 87,463.41
Primary 152 38.9 2 $ 54,865.17
Secondary 64 22.1 1 $ 13,124.29
Hyd Cement Conc. (cy) $ 801.71
Note: Assumed a value of 100 percent in need of repair.
72

Average Cost of Drainage System Replacement & Repair (CDSR)
Definition/Assumptions
CDSR is based on the average size bridge for each of the road categories. It has been assumed that 100 percent is in need of repair.
Formula
Constant.
Value ($/b)
$5,000.00
Source (see Recommended Changes)
Current
1. Dean Hackett, Salem District Bridge Engineer. Recommended
1. Establish new activity codes for each of the parameters. 2. Establish a data base with the following fields:
- Activity Name - Activity Code + System » Bridge Identification Number » Cost » Date + Budget (Construction or Maintenance) - Bridge Condition Rating - Bridge Condition Rating Date
3. Activity costs are to be recorded on a “per bridge” basis using contract lump sums.
Spreadsheet
N/A
73
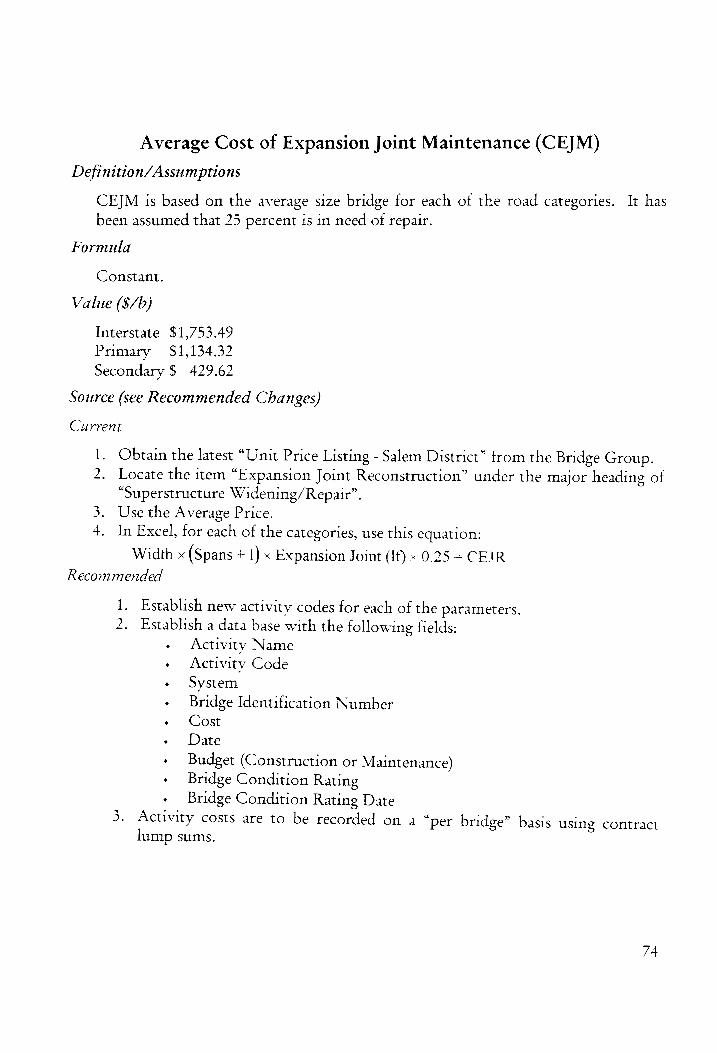
Average Cost of Expansion Joint Maintenance (CEJM)
Definition/Assumptions
CEJM is based on the average size bridge for each of the road categories. It has been assumed that 25 percent is in need of repair.
Formula
Constant.
Value ($/b)
Interstate $1,753.49
Primary $1,134.32 Secondary $ 429.62
Source (see Recommended Changes)
Current
1. Obtain the latest “Unit Price Listing - Salem District” from the Bridge Group. 2. Locate the item “Expansion Joint Reconstruction” under the major heading of
“Superstructure Widening/Repair”. 3. Use the Average Price. 4. In Excel, for each of the categories, use this equation:
Width x (Spans + 1) « Expansion Joint (If) « 0.25 = CEJR Recommended
1. Establish new activity codes for each of the parameters. 2. Establish a data base with the following fields:
- Activity Name - Activity Code + System + Bridge Identification Number « Cost - Date + Budget (Construction or Maintenance) - Bridge Condition Rating - Bridge Condition Rating Date
5. Activity costs are to be recorded on a “per bridge” basis using contract lump sums.
74

Spreadsheet
Length (ft) Width (ft) Spans Cost per Bridge
Expansion Joint (if)
Interstate 209 45.1 3 $ 1,753.49
Primary 152 38.9 2 $ 1,134.32
Secondary 64+ 22.1 1 $ 429.62
S 38.88
Note: Assumed a value of 25 percent in need of repair.
75
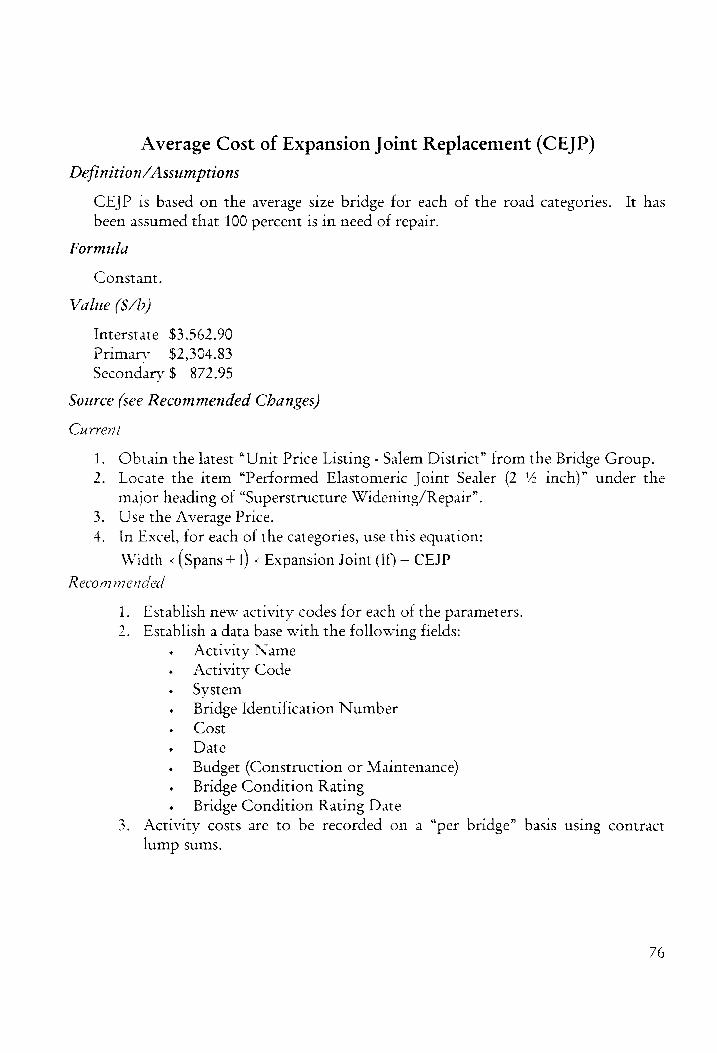
Average Cost of Expansion Joint Replacement (CEJP)
Definition/Assumptions
CEJP is based on the average size bridge for each of the road categories. It has been assumed that 100 percent is in need of repair.
Formula
Constant.
Value (S/b)
Interstate $3,562.90 Primary $2,304.83 Secondary $ 872.95
Source (see Recommended Changes)
Current
1. Obtain the latest “Unit Price Listing - Salem District” from the Bridge Group. 2. Locate the item “Performed Elastomeric Joint Sealer (2 % inch)” under the
major heading of “Superstructure Widening/Repair”. 3. Use the Average Price. 4. In Excel, for each of the categories, use this equation:
Width « (Spans + 1) x Expansion Joint (lf) = CEJP
Recommended
1. Establish new activity codes for each of the parameters. 2. Establish a data base with the following fields:
+ Activity Name » Activity Code - System
» Bridge Identification Number
» Cost
+ Date
» Budget (Construction or Maintenance) - Bridge Condition Rating - Bridge Condition Rating Date
Activity costs are to be recorded on a “per bridge” basis using contract lump sums.
(ad
76

Spreadsheet
Length (ft) Width (ft) Spans Cost per Bridge
Expansion Joint (If)
Interstate 209 $5.1 3 $ 3,562.90
Primary 152 38.9 2 $ 2,304.83
Secondary 64 22.1 1 $ 872.95
$ 19.75
Note: Assumed a value of 100 percent in need of repair.
77

Average Cost of Patching (CPCH)
Definition/Assumptions
CPCH is based on the average size bridge for each of the road categories. It has been assumed that 20 percent is in need of repair.
Formula
Constant.
Value ($/b)
Interstate $40,648.67
Primary $25,498.62 Secondary $ 6,099.52
Source (see Recommended Changes)
Current
Obtain the latest “Unit Price Listing - Salem District” trom the Bridge Group. Locate the item “Type Y Patching” under the major heading of “Superstructure Widening/Repair”.
3. Find the numerical average of the four types using the Average Price. 4. In Excel, for each of the categories, use this equation:
Length « Width
9
Recommended
Noe
x Ave. Patching (sy) x 0.2 = CPCH
1. Establish new activity codes for each of the parameters. 2. Establish a data base with the following fields:
» Activity Name » Activity Code + System - Bridge Identification Number + Cost » Date - Budget (Construction or Maintenance) + Bridge Condition Rating - Bridge Condition Rating Date
3. Activity costs are to be recorded on a “per bridge” basis using contract lump sums.
78

Spreadsheet
Length (fi) Width (fj) Spans Cost per Bridge
Interstate 209 45.1 3 $ 71,135.17
Primary 152 38.9 2 $ 44,622.59
Secondary 6+ 22.1 1 $ 10,674.16
Ave. Patching (sy) S$ 194.06
Note: Assumed a value of 35 percent in need of repair.
79

Average Cost of Parapet Guard Rail Maintenance (CPGM)
Definition/Assumptions
CPGM is based on the average size bridge for each of the road categories. It has been assumed that 15 percent is in need of maintenance. The equation takes into consideration that both sides of the bridge are in need of repair (the factor of 2 in the equation).
Formula
Constant.
Value ($/b)
Interstate $2,917.43
Primary $2,121.77 Secondary $ 893.38
Source (see Recommended Changes)
Current
1. Obtain the latest “Unit Price Listing - Salem District” from the Bridge Group. 2. Locate the item “Concrete Parapet” under the major heading of
“Superstructure Widening/Repair”. 3. In Excel, for each of the categories, use this equation:
Length x Concrete Parapet (If) x 2 x 0.15=CPGM
Recommended
1. Establish new activity codes for each of the parameters. 2. Establish a data base with the following fields:
+ Activity Name » Activity Code + System » Bridge Identification Number - Cost » Date - Budget (Construction or Maintenance) » Bridge Condition Rating » Bridge Condition Rating Date
3. Activity costs are to be recorded on a “per bridge” basis using contract lump sums.
80

Spreadsheet
Length (ft) Width (ft) Spans Cost per Bridge
Concrete Parapet (If)
Note: Assumed a value of 10 percent in need of repair.
Interstate 209 45.1 3 $ 1,944.95
Primary 152 38.9 2 $ 1,414.51
Secondary 64 22.1 1 $ 595.58
$ 46.53
81

Average Cost of Repair of Abutment (CRA)
Definition/Assumptions
CRA is based on the average size bridge for each of the road categories. It is assumed 15 percent of the surface is in need of repair.
Formula
Constant.
Value ($/b)
Interstate $7,868.45
Primary $6,786.75
Secondary $3,855.71
Source (see Recommended Changes)
Current
1. Obtain the latest “Unit Price Listing - Salem District” from the Bridge Group. Locate the items “Conc. Substructure Surface Repair” under the major heading of “Substructure Widening/Repair”.
3. In Excel, for each of the categories, use these equations: Width x Height . on. Conc Substructure Surface Repair x 0.15=CRA
Recommended
1. Establish new activity codes for each of the parameters. 2. Establish a data base with the following fields:
- Activity Name - Activity Code - System » Bridge Identification Number » Cost » Date
- Budget (Construction or Maintenance) - Bridge Condition Rating - Bridge Condition Rating Date
3. Activity costs are to be recorded on a “per bridge” basis using contract lump sums.

Spreadsheet
Length (ft} Width (ft) Height Cost per Bridge
Interstate 209 45.1 10 $ 7,868.45
Primary 152 38.9 10 $ 6,786.75
Secondary 64 22.1 10 $ 3,855.71
Conc. Substructure Surface Repair $ 523.40
Note: Assumed a value of 15 percent in need of repair.
83
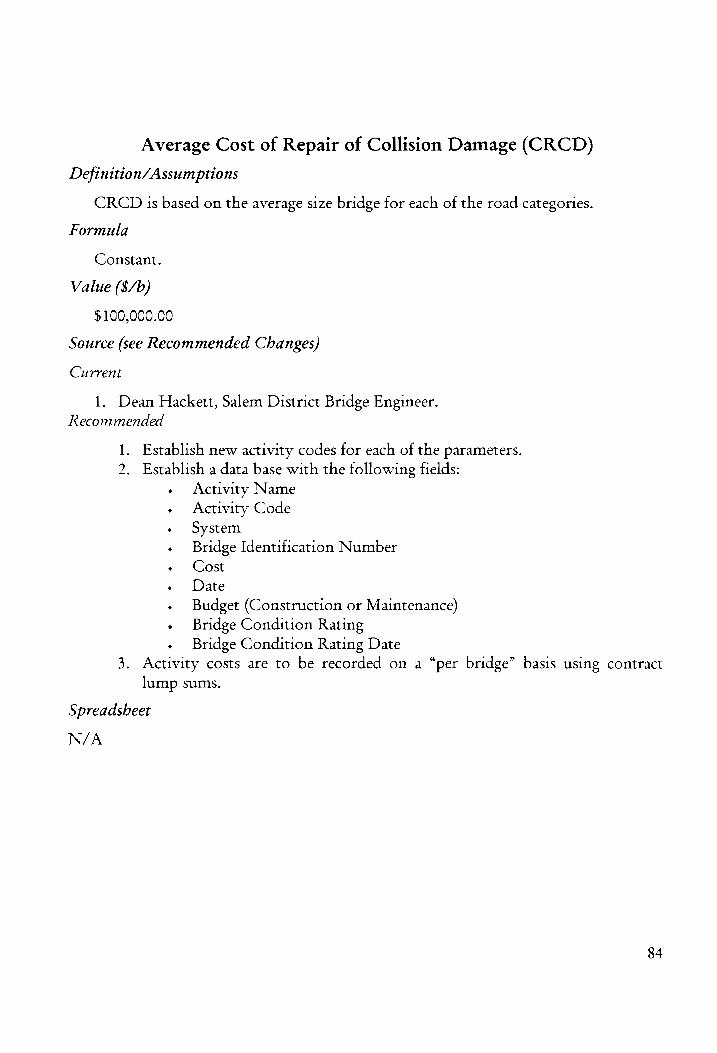
Average Cost of Repair of Collision Damage (CRCD)
Definition/Assumptions
CRCD is based on the average size bridge for each of the road categories.
Formula
Constant.
Value ($/b)
$100,000.00
Source (see Recommended Changes)
Current
1. Dean Hackett, Salem District Bridge Engineer. Recommended
1. Establish new activity codes for each of the parameters. 2. Establish a data base with the following fields:
» Activity Name » Activity Code - System » Bridge Identification Number
« Cost
+ Date - Budget (Construction or Maintenance) - Bridge Condition Rating » Bridge Condition Rating Date
3. Activity costs are to be recorded on a “per bridge” basis using contract lump sums.
Spreadsheet
N/A
84

Average Cost of Replacement of Abutment (CRLA)
Definition/Assumptions
CRLA 1s based on the average size bridge for each of the road categories. It is assumed that only one abutment is replaced and the average thickness of the abutment is three feet. Rebar is placed at 170 pounds per cubic yard.
Formula
Constant.
Value ($/b)
Interstate $18,231.42
Primary $15,725.11 Secondary $ 8,933.80
Source (see Recommended Changes)
Current
1. Obtain the latest “Unit Price Listing - Salem District” from the Bridge Group. 2. Locate the items “Concrete (A3)” and “Epoxy Coated Reinforcing Steel” under
the major heading of “Substructure”. 3. In Excel, for each of the categories, use these equations: Width x Height « Thickness
Q7% os
Concrete (A3) x 170'%, = Rein Steel
(Concrete (A3) x Cost of Concrete) + (Rein Steel x Cost of Rein Steel) = CRLA Recommended
= Concrete (A3)
1. Establish new activity codes for each of the parameters. 2. Establish a data base with the following fields:
- Activity Name » Activity Code
- System - Bridge Identification Number - Cost + Date » Budget (Construction or Maintenance) » Bridge Condition Rating - Bridge Condition Rating Date
3, Activity costs are to be recorded on a “per bridge” basis using contract lump sums.
85

Spreadsheet
Length (ft) Width (ft) Height Cost per Bridge
Interstate 209 45.1 1¢ $ 18,231.42
Primary 152 38.9 10 $ 15,725.11
Secondary 64 22.1 10 $ 8,933.80
Concrete (A3) S$ 263.52
Epoxy Rein Steel S 0.59
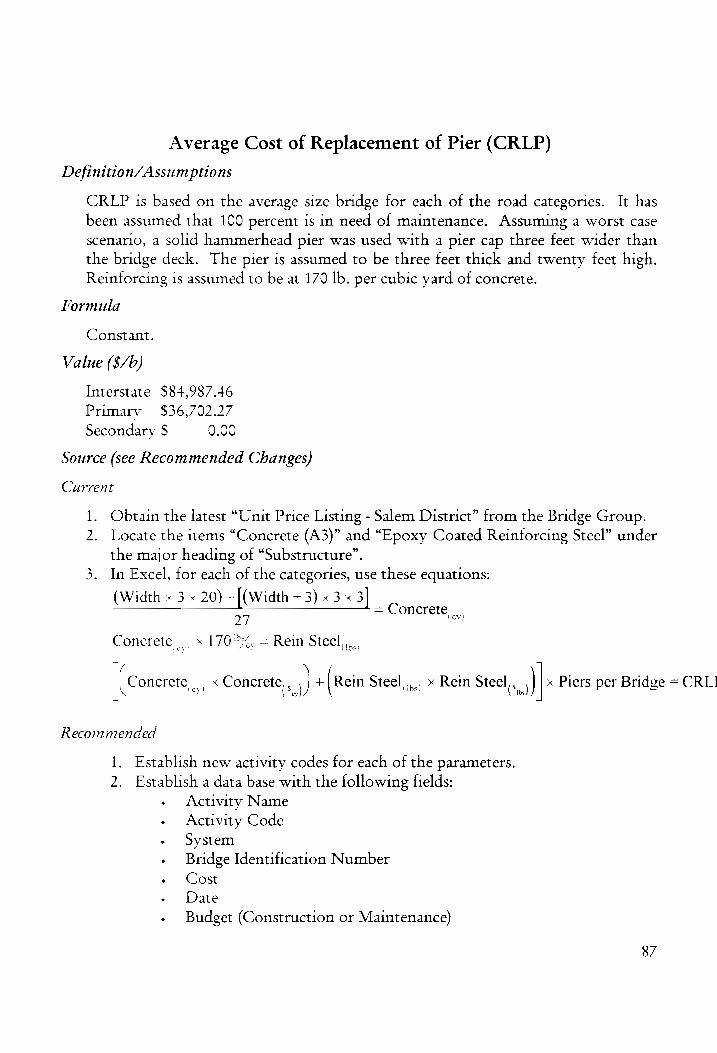
Average Cost of Replacement of Pier (CRLP)
Definition/Assumptions
CRLP is based on the average size bridge for each of the road categories. It has been assumed that 100 percent is in need of maintenance. Assuming a worst case scenario, a solid hammerhead pier was used with a pier cap three feet wider than the bridge deck. The pier is assumed to be three feet thick and twenty feet high. Reinforcing is assumed to be at 170 lb. per cubic yard of concrete.
Formula
Constant.
Value ($/b)
Interstate $84,987.46
Primary $36,702.27
Secondary $ 0.00
Source (see Recommended Changes)
Current
1. Obtain the latest “Unit Price Listing - Salem District” from the Bridge Group. Locate the items “Concrete (A3)” and “Epoxy Coated Reinforcing Steel” under the major heading of “Substructure”.
3. In Excel, for each of the categories, use these equations:
(Width ~ 3 x 20) +|(Width +3) x 3 x 3]
27
Concrete _, x 170 bs’ = Rein Steel
= Concrete, ‘|
(ibs!
- ; ; . . (Concrete, x Concrete, J + (Rein Steel... x Rein Steel 1 x Piers per Bridge = CRLI
(Sis)
Recommended
1. Establish new activity codes for each of the parameters. 2. Establish a data base with the following fields:
- Activity Name » Activity Code + System - Bridge Identification Number - Cost - Date » Budget (Construction or Maintenance)
87
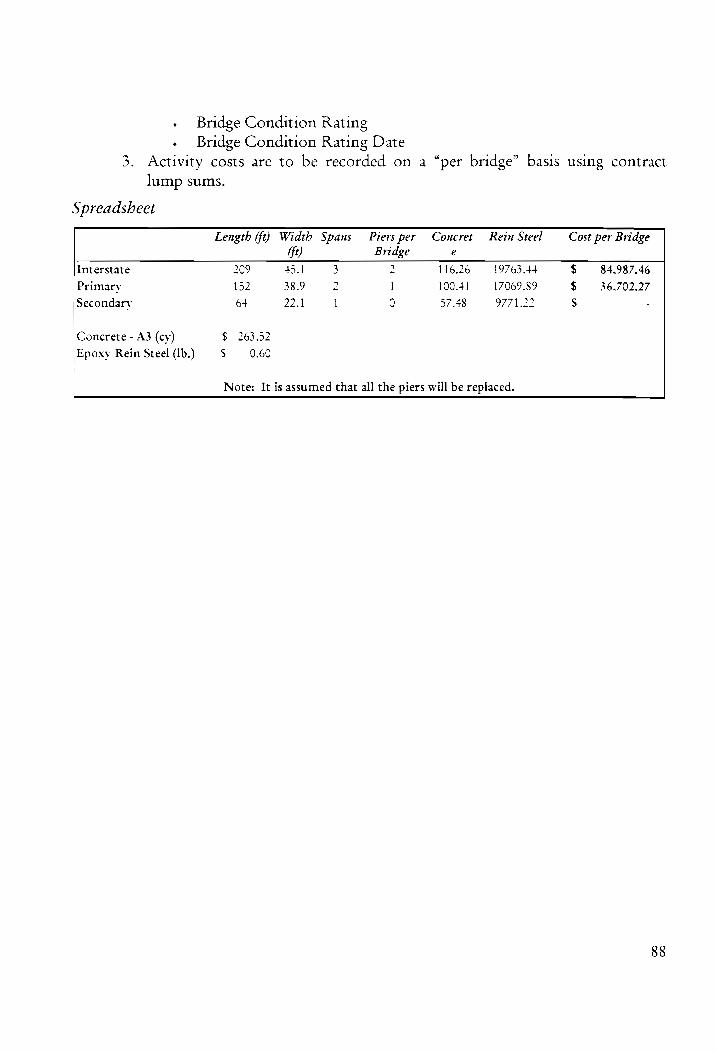
- Bridge Condition Rating - Bridge Condition Rating Date
3. Activity costs are to be recorded on a “per bridge” basis using contract lump sums.
Spreadsheet
Length (ft) Width Spans Piersper Councret Rein Steel Cost per Bridge (ft) Bridge e
Interstate 209 45.1 3 2 116.26 19763.44 $ 84,987.46
Primary 152 38.9 2 l 100.41 17069 .89 $ 36,702.27
Secondary 6+ 22.1 1 0 57.48 9771.22 $
Concrete - A3 (cy) $ 263.52
Epoxy Rein Steel (Ib.) $ 0.60
Note: It is assumed that all the piers will be replaced.
88

Average Cost of Repair of Pier (CRP)
Definition/Assumptions
CRP is based on the average size bridge for each of the road categories. It has been assumed that 25 percent is in need of maintenance. Assuming a worst case scenario, a solid hammerhead pier was used with a pier cap three feet wider than the bridge deck. The pier is assumed to be three feet thick and twenty feet high.
Formula
Constant.
Value ($/b)
Interstate $65,122.59
Primary $28,414.80 Secondary $ 0.00
Source (see Recommended Changes)
Current
1. Obtain the latest “Unit Price Listing - Salem District” from the Bridge Group. Locate the item “Conc. Substructure Surface Repair” under the major heading of “Substructure Widening/Repair”.
3. In Excel, for each of the categories, use these equations: (2 20 Widthe-[2 3 (Width-3-12 15-3 —— = Surface Area per Pier, .
\
Piers per Bridge Surface Area, , x Conc Sub Surf Repair, x 0.25= CRP
Recommended
1. Establish new activity codes for each of the parameters. 2. Establish a data base with the following fields:
» Activity Name - Activity Code + System + Bridge Identification Number + Cost - Date + Budget (Construction or Maintenance) » Bridge Condition Rating » Bridge Condition Rating Date
3. Activity costs are to be recorded on a “per bridge” basis using contract lump sums.
89

Spreadsheet
Length (ft) Width Spans Piers per Surface Area Cost per Bridge
fy
Bridge (sy) Interstate 209 $5.1 3 2 248.84 $ 65,122.59
Primary 152 38.9 2 i 217.16 $ 28,414.80
Secondary 64 22.1 1 0 131.29 $ :
Conc. Sub Surf Repair (sy) S 523.40 Note: Assumed a value of 25 percent of the surface area is in need of repair.
90
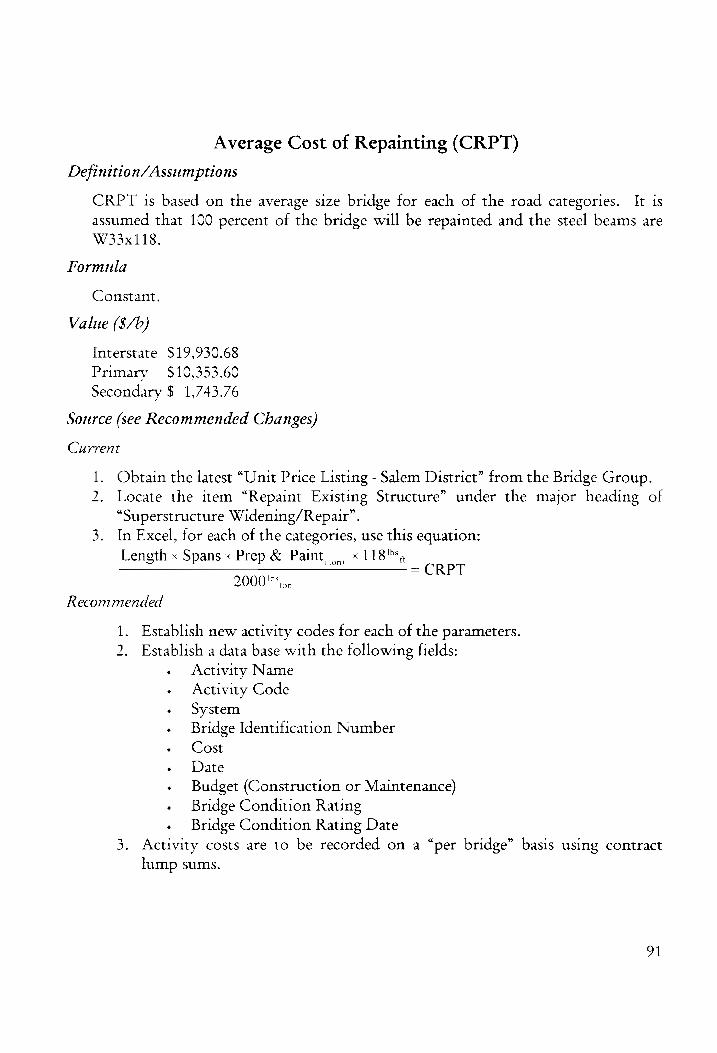
Average Cost of Repainting (CRPT)
Definition/Assumptions
CRPT is based on the average size bridge for each of the road categories. It is assumed that 100 percent of the bridge will be repainted and the steel beams are W33x118.
Formula
Constant.
Value ($/b)
Interstate $19,930.68
Primary $10,353.60 Secondary $ 1,743.76
Source (see Recommended Changes)
Current
1. Obtain the latest “Unit Price Listing - Salem District” from the Bridge Group. 2. Locate the item “Repaint Existing Structure” under the major heading of
“Superstructure Widening/Repair”. 3. In Excel, for each of the categories, use this equation:
Length « Spans x Prep & Paint x 118":
2000", = CRPT
Recommended
1. Establish new activity codes for each of the parameters. 2. Establish a data base with the following fields:
» Activity Name » Activity Code - System + Bridge Identification Number
« Cost
» Date
» Budget (Construction or Maintenance) » Bridge Condition Rating - Bridge Condition Rating Date
3. Activity costs are to be recorded on a “per bridge” basis using contract lump sums.
91

Spreadsheet
Length (ft) Width (ft) Spans Beams per Cost per Bridge Span
Interstate 209 45.1 3 7 $ 19,930.68
Primary {a2 38.9 2 5 $ 10,353.60
Secondary ot 22.1 1 2 $ 1,743.76
Prep & Paint (ton) $ 209.91 Note: Assumed a value of 100 percent in need of repainting.

Average Cost of Scour (CS)
Definition/Assumptions
CS is based on the average size bridge for each of the road categories. It 1s assumed Class II Rip Rap is placed four feet in front of the abutment.
Formula
Constant.
Value ($/b)
Interstate $1,023.57
Primary $ 882.86 Secondary $ 501.57
Source (see Recommended Changes)
Current
1. Obtain the latest “Unit Price Listing - Salem District” from the Bridge Group. Locate the item “Rip Rap Class II” under the major heading of “Substructure Widening/Repair”.
3. In Excel, for each of the categories, use this equation: Width x Rip Rap (Class II) x 4x 2.111"™% =CS
Recommended
1. Establish new activity codes for each of the parameters. 2. Establish a data base with the following fields:
- Activity Name » Activity Code » System
- Bridge Identification Number + Cost - Date - Budget (Construction or Maintenance) - Bridge Condition Rating « Bridge Condition Rating Date
3. Activity costs are to be recorded on a “per bridge” basis using contract lump sums.
93

Spreadsheet
Length (ft) Width (ft) Spans Cost per Bridge
Interstate 209 $5.1 4 $ 1,023.57
Primary 152 38.9 + $ 882.86
Secondary 64 22.1 + $ 501.57
Rip Rap Class II $ 24.19
Note: 2.111 tons of Rip Rap Class II = 1 sv.
94
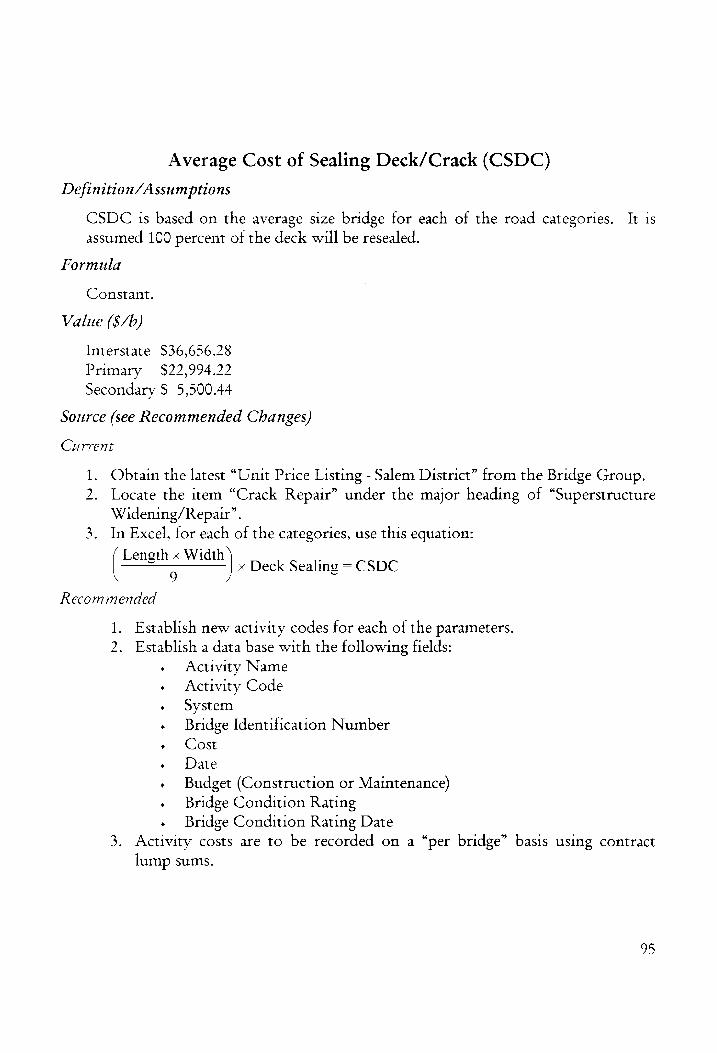
Average Cost of Sealing Deck/Crack (CSDC)
Definition/Assumptions
CSDC is based on the average size bridge for each of the road categories. It is assumed 100 percent of the deck will be resealed.
Formula
Constant.
Value ($/b)
Interstate $36,656.28
Primary $22,994.22 Secondary $ 5,500.44
Source (see Recommended Changes)
Current
1. Obtain the latest “Unit Price Listing - Salem District” from the Bridge Group. 2. Locate the item “Crack Repair” under the major heading of “Superstructure
Widening/Repair”. 3. In Excel, for each of the categories, use this equation:
( Length x Width 9 * Deck Sealing = CSDC
Recommended
1. Establish new activity codes for each of the parameters. 2. Establish a data base with the following fields:
- Activity Name » Activity Code - System + Bridge Identification Number + Cost
» Date » Budget (Construction or Maintenance) + Bridge Condition Rating » Bridge Condition Rating Date
3. Activity costs are to be recorded on a “per bridge” basis using contract lump sums.
95

Spreadsheet
Length (ft) Width (ft) Spans Cost per Bridge Interstate 209 45.1 3 $ 36,656.28
Primary 152 38.9 2 $ 22,994.22
Secondary 6+ 22.1 1 $ 5,500.44
Deck Sealing (sy) § 35.00
Note: Assumed a value of 100 percent in need of repair.
96

Average Cost of Structural Steel Secondary Member Replacement and Repair (CSMR)
Definition/Assumptions
CSMR is based on the average size bridge for each of the road categories. It has been assumed the diaphragms are spaced at 25-foot intervals and that 25 percent is in need of repair.
Formula
Constant.
Value ($/b)
Interstate $16,302.00
Primary $ 7,904.00 Secondary $ 832.00
Source (see Recommended Changes)
Current
1. Dean Hackett, Salem District Bridge Engineer. 2. In Excel, for each of the categories, use this equation:
[ Length
25
Recommended
x (Beams per Span - 1) x Cost per Diaphragm x 0.25= CSMR
1. Establish new activity codes for each of the parameters. 2. Establish a data base with the following fields:
- Activity Name » Activity Code - System
+ Bridge Identification Number - Cost + Date - Budget (Construction or Maintenance) » Bridge Condition Rating - Bridge Condition Rating Date
3. Activity costs are to be recorded on a “per bridge” basis using contract lump sums.
97

Spreadsheet
Length (ft) Width (ft) Spans Beams per Span Cost per Bridge
Interstate 209 45.1 3 7 $ 16,302.00
Primary 152 38.9 2 ) $ 7,904.00
Secondary 6+ 22.1 1 2 $ 832.00
Cost per Diaphragm $ 1,300.00
Note: Assumed a value of 25 percent in need of repair.
98

Average Cost of Spot Painting (CSP)
Definition/Assumptions
CSP is based on the average size bridge for each of the road categories. It is assumed that 10 percent of the total surface area of the beams is in need of spot painting. The surface area per lineal foot of the W33x118 beams is calculated from the Manual of Steel Construction; Load & Resistance Factor Design, Volume I
Second Edition, pp. 1-28.
Formula
Constant.
Value ($/b)
Interstate $5,000.96
Primary $2,597.90 Secondary $ 437.64
Source (see Recommended Changes)
Current
1. Obtain the latest “Unit Price Listing - Salem District” from the Bridge Group. 2. Locate the item “Prepare & Spot Paint Existing Structure” under the major
heading of “Superstructure Widening/Repair”. 3. In Excel, for each of the categories, use these equations:
11.48+[2 x (115—055)]+ (2 x 29.75) + (4 x 0.74)
125, x 1 ft = Surface Area
Length x Beams per Span x Spot Painting x Surface Area per Lineal Foot x 0.1= CSP
Recommended
1. Establish new activity codes for each of the parameters. 2. Establish a data base with the following fields:
» Activity Name « Activity Code + System » Bridge Identification Number « Cost + Date + Budget (Construction or Maintenance) » Bridge Condition Rating « Bridge Condition Rating Date
99

3. Activity costs are to be recorded on a “per bridge” basis using contract
lump sums.
Spreadsheet
Length (ft) Width (ft) Spans Beams per Cost per Bridge Span
Interstate 209 45.1 3 7 $ 5,000.96
Primary 152 38.9 2 5 $ 2,597.90
Secondary 6+ 22.1 1 2 $ 437.54
Spot Painting (sf) S 4.28
Surface Area per Lineal Foot (sf) 7.99
Note: Assumed a value of 10 percent in need of painting.
100

Average Cost of Superstructure Replacement (CSSR)
Definition/Assumptions
CSSR is based on the average size bridge for each of the road categories. Joints are placed every 7 feet across the width and every 18 feet along the length of the bridge; concrete is placed at a depth of 8% inches; reinforcing steel is placed at 170 '"/., of concrete; and structural steel is W33x118.
Formula
Constant.
Value ($/b)
Interstate $404,771.57
Primary $237,489.77 Secondary $ 53,908.54
Source (see Recommended Changes)
Current
1. Obtain the latest “Unit Price Listing - Salem District” from the Bridge Group. 2. Locate the items “Concrete (Class A4)”, “Epoxy Coated Reinforcing Steel”,
“Kansas Corral Railing”, “Bridge Deck Grooving”, “Performed Elastomeric Joint Sealer (4-in)”, “Asphalt Concrete (SM-2A)”, “Flexible Pavement Planing”, and “Structural Steel (Rolled)”.
101

tye In Excel, for each of the categories, use these equations:
Length - Width (84,5 } 7 = Concrete,
Concrete x 170%. = Rein Steel...
2 x Length = Railing,
Length Width a Groove, ..,
Leneth Width Length Width : <= tS = Joint Sealer, ,
Length Width 110
o D000 = Asph
Length Width : —,_— = Planing |
Isv]
| ton]
Length x Beams x 118 = Struc Steel,
Concrete, x Concrete, + Rein Steel
Groove, \* Groove, _., + Joint Sealer, \* Joint Sealer,,.. + Asph., ay Asph, + {tont
is) < Rein Steel. + Railing... x Railing, ., + Ibs saps if aa
Planing x Planing,,., + Struc Steel, , « Struc Steel... = CSSR (S. ibs
Recommended
1. Establish new activity codes for each of the parameters. 2. Establish a data base with the following fields:
- Activity Name - Activity Code + System - Bridge Identification Number - Cost - Date
+ Budget (Construction or Maintenance) - Bridge Condition Rating - Bridge Condition Rating Date
3. Activity costs are to be recorded on a “per bridge” basis using contract lump sums.
102

Spreadsheet
Length Width Beam Concret Rein Railin Groov Joint Aspb Planing Struc Cost per Bridge
s € Steel g e Sealer Steel
Interstate 209 45.1 7 247.23 42238.3 418 1047.3 1870.22 57.60 1047.32 172634 § 404,771.57
5 2
Primary 152 38.9 5 155.12 26372.3 304 656.98 1173.17 36.13 656.98 89682 $ 237,489.77
6
Secondary 64 22.1 2 37.11 6328.05 128 157.16 280.63 8.64 157.16 15104 $ 53,908.54
Concrete - A4 $ 325.57
(cy) Epoxv Rein S$ 2.40 Steel (Ib.) Kansas Railing $§ 65.80
(If) Deck Groove $ 9.85
(sy) Elast. Joint S$ 34.41 Sealer 4" (If) Asph Conc. - § 242.21 SM-2A (ton) Flex Pyvmt S 4.87 Planing (sv) Structural Steel $ 123 - Rolled
Note: It is assumed that asphalt concrete will be applied at a rate of 125 pounds per square vard.
103

Deteriorating Time of Highway (DHT)
Definition/Assumptions
Is the time for pavement to decline from a “Fair” rating to a “Poor” rating.
Formula
Constant.
Value (yr.)
5
Source
1. This data is unavailable at this time due to the Transportation Research Council (TRC) upgrading their database svstem. It is estimated the new system will be in place in January 1997.
2. Mr. Tom Freeman of the TRC provided the estimate. (804) 293-1957.
Spreadsheet
N/A
104
Death Rate Parameter of Virginia (DRPV)
Definition/Assumptions
DRPV is the rate at which the population of Virginia is declining each year.
Formula
Constant.
Value (persons/yr.)
0.008249
Source
1. Using the Internet, this can be found in the US Census Bureau’s homepage at: www.census.zov/ftp/pub/population/www/statepop.ptml
2. It should be noted for those individuals not familiar with the mechanics of the web, addresses (URL) are case sensitive and should be typed as shown above.
Spreadsheet
N/A

Deterioration Time of Bridges (DTTB)
Definition/Assumptions
DTTB is defined, as the time required for a bridge condition rating to go from “Good “to” Fair”.
Formula
Constant.
Value (yr.)
Interstate 21 Primary 17 Secondary 19
Source (see Recommended Changes)
Current
1. This type of information is unavailable at this time, as it is not collected. 2. Dean Hackett, Salem District Bridge Engineer, with a Super Natural query
of HTRIS, obtained data used for this parameter.
3. Values were obtained by subtracting the “Year Built” from the “Year Improved” for each of the Road and Bridge classifications.
Recommended
1. For new structures, time begins subsequent to the completed structure’s first winter, as ordinarv maintenance 1s performed to mitigate the effects of that winter, thereby placing the bridge in the “Good” condition.
2. For existing structures, time begins subsequent to any upgrade or downgrade to its existing condition.
3. Deterioration Times are then calculated by finding the difference between the date of classification for the older (higher) condition and the date for the newer (lower) condition.
Spreadsheet
N/A
106

Exposure Time of Bridges (ETB)
Definition/Assumptions
ETB is the time for bridges in “Preferred” condition to fall to “Good” condition. Bridges undergo ordinary (preventive) maintenance after their first winter to remove the salts and mitigate the effects of winter on the structure.
Formula
Constant.
Value (yr.)
0.5
Soitrce
1. Dean Hackett, Salem District Bridge Engineer.
Spreadsheet
N/A
107

Federal Aid to Virginia (FAV)
Definition/Assumptions
FAV is the subsidized amount of money allocated to the state of Virginia for its transportation budget.
Formula
Constant.
Value ($/yr.)
466,486,400.00
Source
1. Federal Highway Administration’s 1995 Highway Statistics Manual (HPM-40), Table FA-4.
Spreadsheet
N/A
108

Fraction of the Budget to Bridge Widening (FBBW)
Definition/Assumptions
FBBW is the fraction of the total bridge budget (BB) used for the widening of bridges.
Formula
Constant.
Value (dim)
Interstate 0.5293 Primary 0.0187 Secondary N/A
Source
Current
1. Construction data was obtained from VDOT’s Six-Year Plan. 2. Maintenance data was obtained from HTRIS. Activity series: 220, 460, 550,
and 560; activity 404. 3. Identify all bridge data in the Six-Year Plan. Sum widening and
replacement funds. 4. Separate and sum the maintenance codes, by system, into the following
categories: Minor Major Preventative Replacement Rehabilitation
221 +61 225 465 551 222 462 226 552 224 +66 40+ 553 565 368 463 556 566 467 557 569 354 561
555 562 567 563
364
Each category was then summed by system to determine the total amount for each category and system.
nA
Sum these totals with the construction data for the total expenditures.
Divide the construction total (widening) for each system by the overall total to determine the fraction.
Widening Expenditure : = FBBW
Total Expenditure
Recommended
1. Establish new activity codes for each of the parameters. 2. Establish a data base with the following fields:
109

Activity Name Activity Code System Bridge Identification Number Cost Date Budget (Construction or Maintenance) Bridge Condition Rating Bridge Condition Rating Date
3. Activity costs are to be recorded on a “per bridge” basis using contract lump sums.
Spreadsheet
N/A
110
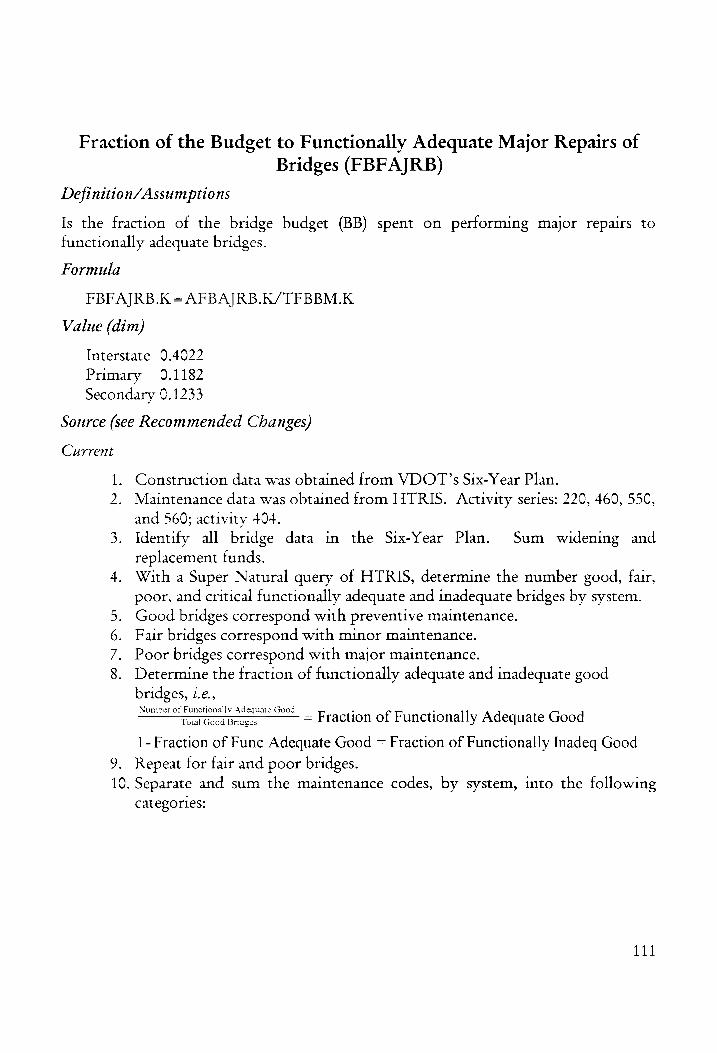
Fraction of the Budget to Functionally Adequate Major Repairs of Bridges (FBFAJRB)
Definition/Assumptions
Is the fraction of the bridge budget (BB) spent on performing major repairs to functionally adequate bridges.
Formula
FBFAJRB.K = AFBAJRB.K/TFBBM.K
Value (dim)
Interstate 0.4022 Primary 0.1182 Secondary 0.1233
Source (see Recommended Changes)
Current
1. Construction data was obtained from VDOT’s Six-Year Plan. 2. Maintenance data was obtained from HTRIS. Activity series: 220, 460, 550,
and 560; activity 404. 3. Identify all bridge data in the Six-Year Plan. Sum widening and
replacement funds. 4, With a Super Natural query of HTRIS, determine the number good, fair,
poor, and critical functionally adequate and inadequate bridges by system. Good bridges correspond with preventive maintenance. Fair bridges correspond with minor maintenance. Poor bridges correspond with major maintenance. Determine the fraction of functionally adequate and inadequate good bridges, i.e., Number of Functionally Adequate Good
Or
AwN
= Fraction of Functionally Adequate Good Total Good Bridges
1-Fraction of Func Adequate Good = Fraction of Functionally Inadeq Good
9. Repeat for fair and poor bridges. 10. Separate and sum the maintenance codes, by system, into the following
categories:
111

il,
Minor Major Preventative Replacement Rehabilitation
221 461 225 +65 551 222 462 226 552 224 466 404 353 565 568 463 556 566 467 557 569 554 561
555 562 567 563
564
Each category was then summed by system to determine the total amount for each category and system.
12. Determine the fraction of money spent on minor, major, and preventive maintenance.
13. Multiply each maintenance fraction with each of the bridge functional adequacy fractions to determine the fraction of money spent on each of the bridge functional classifications.
Recommended
1. Establish new activity codes for each of the parameters. 2. Establish a data base with the following fields:
- Activity Name - Activity Code » System - Bridge Identification Number - Cost « Date
- Budget (Construction or Maintenance) - Bridge Condition Rating » Bridge Condition Rating Date
3. Activity costs are to be recorded on a “per bridge” basis using contract lump sums.
Spreadsheet
Interstate Primary Secondary
FBBW 0.5293 0.0187 -
FBFAJRB 0.4022 0.1182 0.1233
FBFANRB 0.0352 0.0201 0.1223
FBFAPMB 0.0321 0.0370 0.0971
FBFIJRB 0.0000 0.2660 0.1838
FBFINRB 0.0003 0.0015 0.0172
FBFIPMB 0.0006 0.0003 0.0032
FBRHP 0.0001 0.1827 ---
FBRPB 0.0001 0.3554 ---
112

Fraction of the Budget to Functionally Adequate Minor Repairs of Bridges (FBFANRB)
Definition/Assumptions
Is the fraction of the bridge budget (BB) spent on performing minor repairs to functionally adequate bridges.
Formula
FBFANRB.K = AFBANRB.K/TFBBM.K
Value (dim)
Interstate 0.0352 Primary 0.0201 Secondary 0.1223
Source (see Recommended Changes)
Current
1. Construction data was obtained from VDOT’s Six-Year Plan. 2. Maintenance data was obtained from HTRIS. Activity series: 220, 460, 550,
and 560; activity 404. 3. Identify all bridge data in the Six-Year Plan. Sum widening and
replacement funds. 4, With a Super Natural query of HTRIS, determine the number good, fair,
poor, and critical functionally adequate and inadequate bridges by system. A good bridge corresponds with preventive maintenance. Fair bridges correspond with minor maintenance. Poor bridges correspond with major maintenance. Determine the fraction of functionally adequate and inadequate good bridges, 1.€., Number of Functionally Adequate Good
Total Good Bridges = Fraction of Functionally Adequate Good
ON DW
|-Fraction of Func Adequate Good = Fraction of Functionally Inadeq Good
9. Repeat for fair and poor bridges. 10. Separate and sum the maintenance codes, by system, into the following
cat egories:
Minor Major Preventative Replacement Rehabilitation
221 461 225 465 551 222 462 226 552
224 466 404 553
5365 568 +63 556
566 467 557
569 554 561
355 562
567 563
564
113
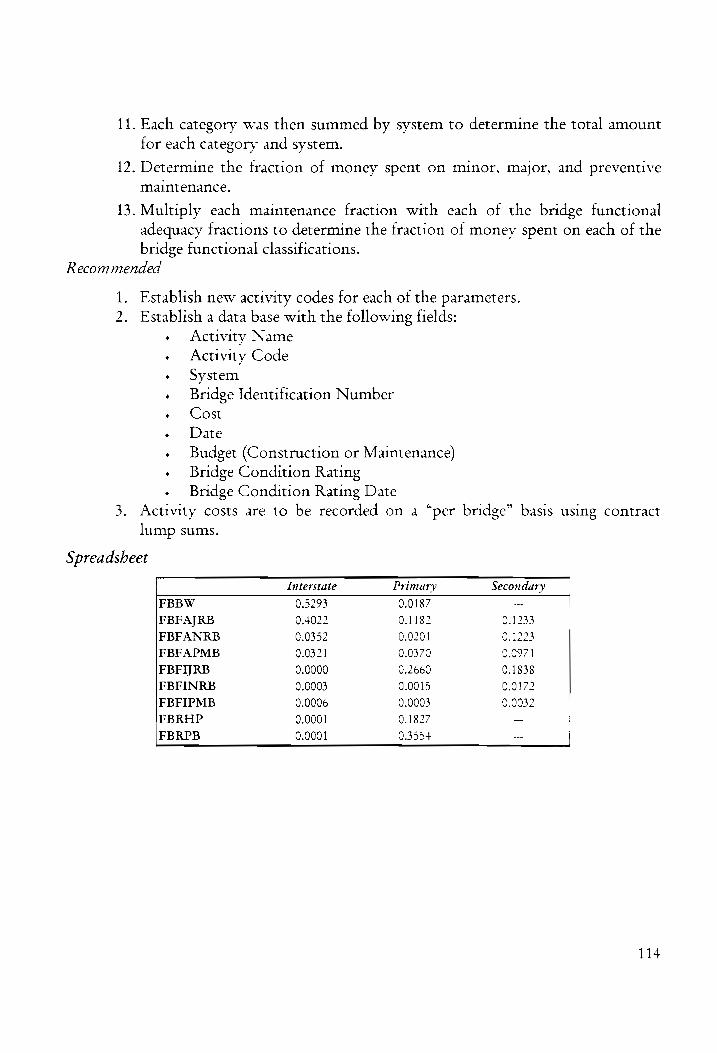
11. Each category was then summed by system to determine the total amount for each category and system.
12. Determine the fraction of money spent on minor, major, and preventive
maintenance.
13. Multiply each maintenance fraction with each of the bridge functional adequacy fractions to determine the fraction of money spent on each of the bridge functional classifications.
Recommended
1. Establish new activity codes for each of the parameters. 2. Establish a data base with the following fields:
+ Activity Name - Activity Code + System
- Bridge Identification Number + Cost + Date - Budget (Construction or Maintenance) - Bridge Condition Rating - Bridge Condition Rating Date
3. Activity costs are to be recorded on a “per bridge” basis using contract lump sums.
Spreadsheet
Interstate Primary Secondary
FBBW 0.5293 0.0187 --
FBFAJRB 0.4022 0.1182 0.1233
FBFANRB 0.0352 0.0201 0.1223
FBFAPMB 0.0321 0.0370 0.0971
FBFIJRB 0.0000 0.2660 0.1838
FBFINRB 0.0003 0.0015 0.0172
FBFIPMB 0.0006 0.0003 ¢.0032
FBRHP 0.0001 0.1827 ~-
FBRPB 0.0001 0.3554 ---
114
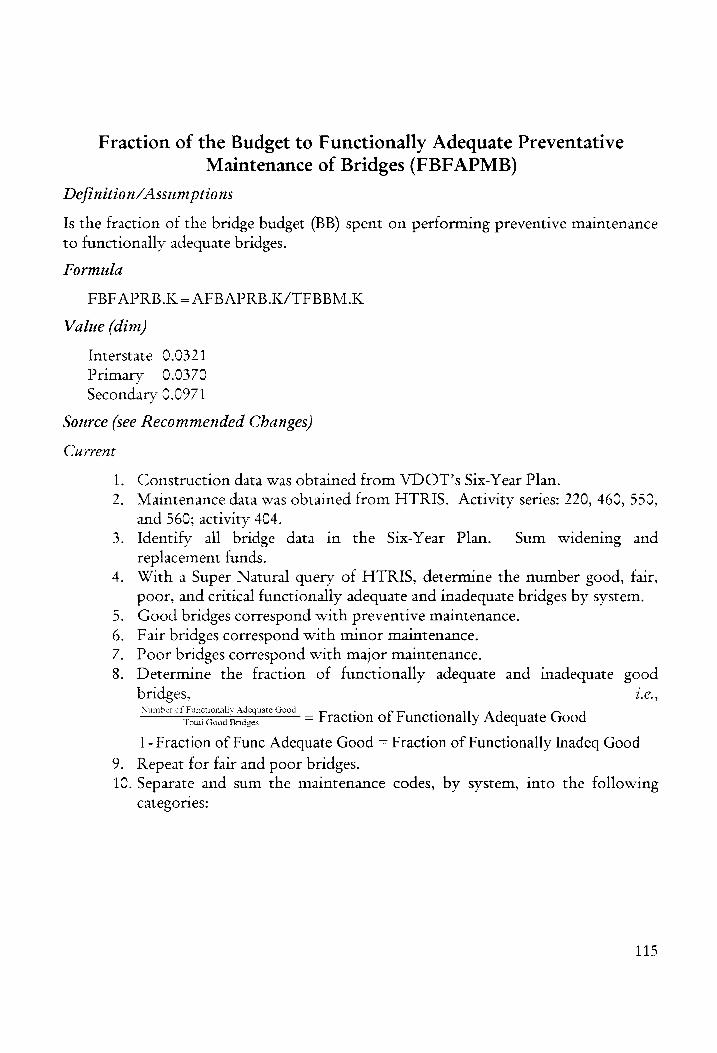
Fraction of the Budget to Functionally Adequate Preventative Maintenance of Bridges (FBFAPMB)
Definition/Assumptions
Is the fraction of the bridge budget (BB) spent on performing preventive maintenance to functionally adequate bridges.
Formula
FBFAPRB.K = AFBAPRB.K/TFBBM.K
Value (dim)
Interstate 0.0321
Primary 0.0370 Secondary 0.0971
Source (see Recommended Changes)
Current
1. Construction data was obtained trom VDOT’s Six-Year Plan. 2. Maintenance data was obtained from HTRIS. Activity series: 220, 460, 550,
and 560; activity 404. 3. Identify all bridge data in the Six-Year Plan. Sum widening and
replacement funds. 4. With a Super Natural query of HTRIS, determine the number good, fair,
poor, and critical functionally adequate and inadequate bridges by system. Good bridges correspond with preventive maintenance. Fair bridges correspond with minor maintenance. Poor bridges correspond with major maintenance. Determine the fraction of functionally adequate and inadequate good bridges, 1.€., Number of Functionally Adequate Good
Total Good Brdzes = Fraction of Functionally Adequate Good
ON Dn
1-Fraction of Func Adequate Good = Fraction of Functionally Inadeq Good
9. Repeat for fair and poor bridges. 10. Separate and sum the maintenance codes, by system, into the following
categories:
115
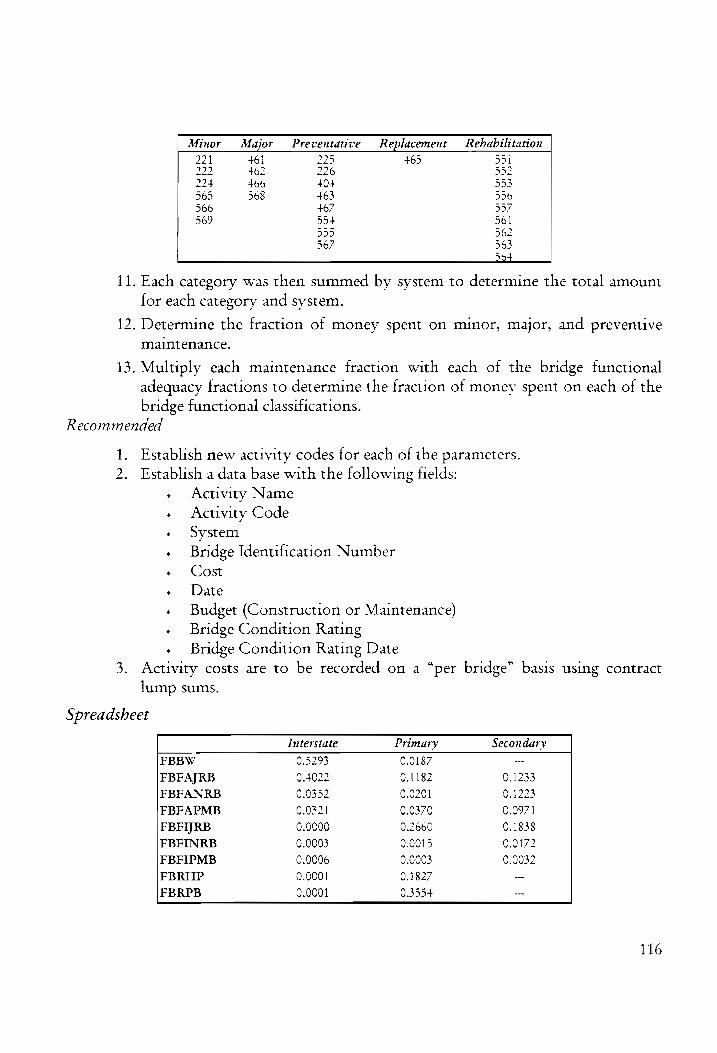
Minor Major Preventative Replacement Rehabilitation 221 461 225 465 551 222 462 226 552 224 +66 404 553 565 568 463 556 566 +67 557 569 354 561
355 562 367 563
364+
11. Each category was then summed by system to determine the total amount for each category and system.
12. Determine the fraction of money spent on minor, major, and preventive maintenance.
13. Multiply each maintenance fraction with each of the bridge functional adequacy fractions to determine the fraction of money spent on each of the bridge functional classifications.
Recommended
1. Establish new activity codes for each of the parameters. 2. Establish a data base with the following fields:
- Activity Name » Activity Code + System » Bridge Identification Number
+ Cost - Date + Budget (Construction or Maintenance) » Bridge Condition Rating » Bridge Condition Rating Date
3. Activity costs are to be recorded on a “per bridge” basis using contract
lump sums.
Spreadsheet
Interstate Primary Secondary
EBBW 0.5293 0.0187 = FBFAJRB 0.4022 0.1182 0.1233
FBFANRB 0.0352 0.0201 0.1223
FBFAPMB 0.0321 0.0370 0.0971
FBFIJRB 0.0000 0.2660 0.1838
FBFINRB 0.0003 0.0015 0.0172
FBFIPMB 0.0006 0.0003 0.0032
FBRHP 0.0001 0.1827 --
FBRPB 0.0001 0.3554 ---
116

Fraction of the Budget to Functionally Inadequate Major Repairs of Bridges (FBFIJRB)
Definition/Assumptions
Is the fraction of the bridge budget (BB) spent on performing major repairs to functionally inadequate bridges.
Formula
FBFIJRB.K = AFBIJRB.K/TFBBM.K
Value (dim)
Interstate 0.0000 Primary 0.2660 Secondary 0.1838
Source (see Recommended Changes)
Current
1. Construction data was obtained from VDOT’s Six-Year Plan.
2. Maintenance data was obtained from HTRIS. Activity series: 220, 460, 550,
and 560; activity 404.
3. Identify all bridge data in the Six-Year Plan. Sum widening and replacement funds.
4, With a Super Natural query of HTRIS, determine the number good, fair, poor, and critical functionally adequate and inadequate bridges by system.
5. Good bridges correspond with preventive maintenance. 6. Fair bridges correspond with minor maintenance. 7. Poor bridges correspond with major maintenance. 8. Determine the fraction of functionally adequate and inadequate good
bridges, 1.€.,
eS = Fraction of Functionally Adequate Good
1-Fraction of Func Adequate Good = Fraction of Functionally Inadeq Good
9. Repeat for fair and poor bridges. 10. Separate and sum the maintenance codes, by system, into the following
categories:
117

Minor Major Preventative Replacement — Rebabilitation 221 +61 225 465 551 222 +62 226 552 224 +66 +04 553 565 568 +63 556 366 +67 55/7 569 554 561
555 562 367 363
364
11. Each category was then summed by system to determine the total amount for each category and system.
12. Determine the fraction of money spent on minor, major, and preventive maintenance.
13. Multiply each maintenance fraction with each of the bridge functional adequacy fractions to determine the fraction of money spent on each of the bridge functional classifications.
Recommended
1. Establish new activity codes for each of the parameters. 2. Establish a data base with the following fields:
>
+
+
¢
¢
Activity Name Activity Code System
Bridge Identification Number Cost Date Budget (Construction or Maintenance) Bridge Condition Rating Bridge Condition Rating Date
3. Activity costs are to be recorded on a “per bridge” basis using contract lump sums.
Spreadsheet
Interstate Primary Secondary
FBBW 0.5293 0.0187 --
FBFAJRB 0.4022 0.1182 0.1233
FBFANRB 0.0352 0.0201 0.1223
FBFAPMB 0.0321 0.0370 0.097 1
FBFIJRB 0.0000 0.2660 0.1838
FBFINRB 0.0003 0.0015 0.0172
FBFIPMB 0.0006 0.0003 0.0032
FBRHP 0.0001 0.1827 --
FBRPB 0.0001 0.3554 ---
118

Fraction of the Budget to Functionally Inadequate Minor Repairs of Bridges (FBFINRB)
Definition/Assumptions
Is the traction of the bridge budget (BB) spent on performing minor repairs to functionally inadequate bridges.
Formula
FBFINRB.K = AFBINRB.K/TFBBM.K
Value (dim)
Interstate 0.0000 Primary 0.2660 Secondary 0.1838
Source (see Recommended Changes)
Current
1. Construction data was obtained from VDOT’s Six-Year Plan. 2. Maintenance data was obtained from HTRIS. Activity series: 220, 460, 550,
and 560; activity 404. 3. Identify all bridge data in the Six-Year Plan. Sum widening and
replacement funds. 4. With a Super Natural query of HTRIS, determine the number good, fair,
poor, and critical functionally adequate and inadequate bridges by system. Good bridges correspond with preventive maintenance. Fair bridges correspond with minor maintenance. Poor bridges correspond with major maintenance. Determine the fraction of functionally adequate and inadequate good bridges, i.e., Number ot Functionally Adequate Good
Total Good Bridges = Fraction of Functionally Adequate Good
ON AU
1-Fraction of Func Adequate Good = Fraction of Functionally Inadeq Good
9. Repeat for fair and poor bridges.
10. Separate and sum the maintenance codes, by system, into the following categories:
119

Minor Major Preventative Replacement Rehabilitation 221 461 225 465 551 222 462 226 552 224 466 404 553 565 568 +63 556 566 +67 357 569 554 561
355 362 567 563
So+
11. Each category was then summed by system to determine the total amount for each category and system.
12. Determine the fraction of money spent on minor, major, and preventive maintenance.
13. Multiply each maintenance fraction with each of the bridge functional adequacy fractions to determine the fraction of money spent on each of the bridge functional classifications.
Recommended
1. Establish new activity codes for each of the parameters. 2. Establish a data base with the following fields:
- Activity Name « Activity Code
» Bridge Identification Number » System
« Cost
+ Date
» Budget (Construction or Maintenance) - Bridge Condition Rating » Bridge Condition Rating Date
3. Activity costs are to be recorded on a “per bridge” basis using contract
lump sums.
Spreadsheet
Interstate Primary Secondary
FBBW 0.5293 0.0187 _. FBFAJRB 0.4022 0.1182 0.1233
FBFANRB 0.0352 0.0201 0.1223
FBFAPMB 0.0321 0.0370 0.0971
FBFIJRB 0.0000 0.2660 0.1838
FBFINRB 0.0003 0.0015 0.0172
FBFIPMB 0.0006 0.0003 0.0032
FBRHP 0.0001 0.1827 —
FBRPB 0.0001 0.3554 _
120

Fraction of the Budget to Functionally Inadequate Preventative Maintenance of Bridges (FBFIPMB)
Definition/Assumptions
Is the fraction of the bridge budget (BB) spent on performing preventive maintenance to functionally inadequate bridges.
Formula
FBFIPRB.K = AFBIPRB.K/TFBBM.K
Value (dim)
Interstate 0.0006
Primary 0.0003
Secondary 0.0032
Source (see Recommended Changes)
Current
1. Construction data was obtained from VDOT’s Six-Year Plan. 2. Maintenance data was obtained from HTRIS. Activity series: 220, 460, 550,
and 560; activity 404.
3. Identify all bridge data in the Six-Year Plan. Sum widening and replacement funds.
4, With a Super Natural query of HTRIS, determine the number good, fair, poor, and critical functionally adequate and inadequate bridges by system. Good bridges correspond with preventive maintenance. Fair bridges correspond with minor maintenance. Poor bridges correspond with major maintenance. Determine the fraction of functionally adequate and inadequate good bridges, z.e., Number of Functionally Adequate Good
Tolal Good Brides = Fraction of Functionally Adequate Good
CON DN
1-Fraction of Func Adequate Good = Fraction of Functionally Inadeq Good
9. Repeat for fair and poor bridges. 10. Separate and sum the maintenance codes, by system, into the following
categories:
121
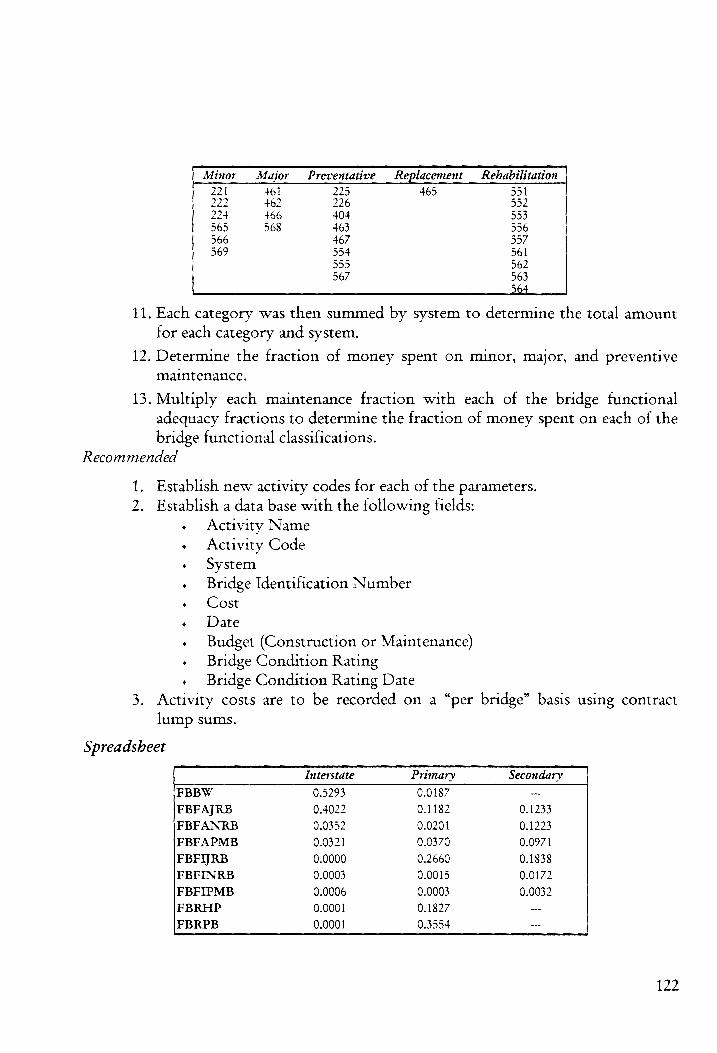
Minor Major Preventative Replacement — Rebabilitation
221 tol 225 465 351 222 462 226 552 224 466 404 553 565 368 463 556 566 467 557 569 354 561
555 562 567 563
264
11. Each category was then summed by system to determine the total amount for each category and system.
12. Determine the fraction of money spent on minor, major, and preventive maintenance.
13. Multiply each maintenance fraction with each of the bridge functional adequacy fractions to determine the fraction of money spent on each of the bridge functional classifications.
Recommended
1. Establish new activity codes for each of the parameters. 2. Establish a data base with the following fields:
¢
+
a
¢
¢
Activity Name Activity Code System Bridge Identification Number Cost Date Budget (Construction or Maintenance) Bridge Condition Rating Bridge Condition Rating Date
3. Activity costs are to be recorded on a “per bridge” basis using contract lump sums.
Spreadsheet
Interstate Primary Secondary
FBBW 0.5293 0.0187 -
FBFAJRB 0.4022 0.1182 0.1233
FBFANRB 0.0352 0.0201 0.1223
FBFAPMB 0.0321 0.0370 0.0971
FBFYRB 0.0000 0.2660 0.1838
FBFINRB 0.0003 0.0015 0.0172
FBFIPMB 0.0006 0.0003 0.0032
FBRHP 0.0001 0.1827 --
FBRPB 0.0001 0.3554 ---
122

Fraction of the Budget to Highway Construction (FBHC)
Definition/Assumptions
Is the fraction of the total Salem District budget allocated to construction.
Formula
FBHC.K = 1-FBHM
Value (dim)
0.5593
Source
1. This is determined by summing the Salem construction and maintenance budgets, then dividing the construction budget by the total budget.
Spreadsheet
N/A
123

Fraction of the Budget to Highway Maintenance (FBHM)
Definition/Assumptions
Is the fraction of the total Salem District budget allocated to maintenance.
Formula
Constant.
Value (dim)
0.4407
Source
1. This is determined by summing the Salem construction and maintenance budgets, then dividing the maintenance budget by the total budget.
Spreadsheet
N/A
124

Fraction of the Budget to the Rehabilitation of Bridges (FBRHB)
Definition/Assumptions
Is the fraction of the bridge budget (BB) spent on bridge rehabilitation.
Formutla
FBRHB.K = AFBRHB.K/TFBBM.K
Value (dim)
Interstate 0.0001
Primary 0.1827 Secondary N/A
Source
1. This is determined by subtracting the sum of all other bridge fractions from one.
|— » (Bridge Budget Fractions) = FBRHB
Spreadsheet
N/A
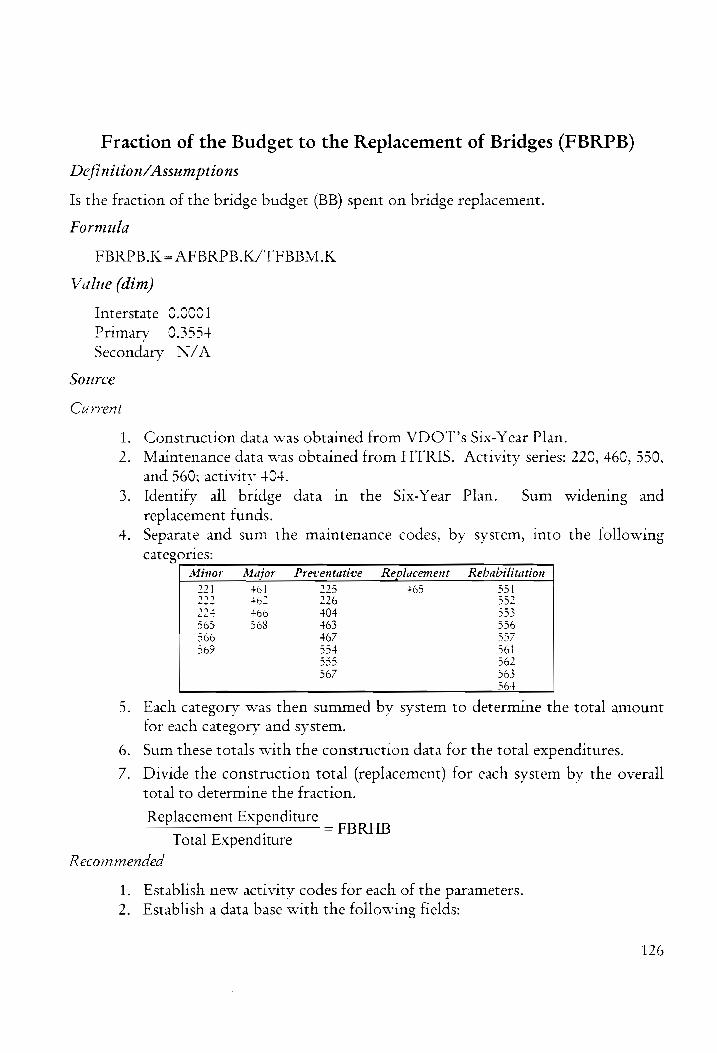
Fraction of the Budget to the Replacement of Bridges (FBRPB)
Definition/Assumptions
Is the fraction of the bridge budget (BB) spent on bridge replacement.
Formula
FBRPB.K =AFBRPB.K/TFBBM.K
Value (dim)
Interstate 0.0001
Primary 0.3554 Secondary N/A
Source
Current
1. Construction data was obtained from VDOT’s Six-Year Plan. Maintenance data was obtained from HTRIS. Activity series: 220, 460, 550,
and 560; activity 404. 3. Identify all bridge data in the Six-Year Plan. Sum widening and
replacement funds. 4, Separate and sum the maintenance codes, by system, into the following
categories: Minor Major Preventative Replacement _Rebabilitation
221 tol 225 465 551 222 +62 226 352 22+ +66 404 553 365 368 463 5356 366 467 357 569 554 561
555 362 56/7 363
364
5. Each category was then summed by system to determine the total amount for each category and system.
6. Sum these totals with the construction data for the total expenditures.
7. Divide the construction total (replacement) for each system by the overall total to determine the fraction.
Replacement Expenditure ; = FBRHB
Total Expenditure
Recommended
1. Establish new activity codes for each of the parameters. 2. Establish a data base with the following fields:
126

+
*
Activity Name Activity Code System Bridge Identification Number Cost Date Budget (Construction or Maintenance) Bridge Condition Rating Bridge Condition Rating Date
3. Activity costs are to be recorded on a “per bridge” basis using contract lump sums.
Spreadsheet
N/A
127

Fraction of the Construction Budget to the Bridge Budget (FCBB)
Definition/Assumptions
Formula
Constant.
Value (dim)
Interstate 0.0181
Primary 0.0189 Secondary 0.0186
Source (see Recommended Changes)
Current
1. Data obtained from the Commonwealth Transportation Board Six-Year
Plan. 2. For each of the road classifications (Interstate and Primary), sum the total
dollars allocated to bridgework for the Salem District. 3. Divide the total allocated funds for each of the classifications by the
construction budget for the Salem District (HCBSD), i.e., Bridge Total —HcBsp FCBB verse
Recommended
Interstate
1. Establish new activity codes for each of the parameters. 2. Establish a data base with the following fields:
- Activity Name » Activity Code + System - Bridge Identification Number
« Cost + Date
- Budget (Construction or Maintenance) » Bridge Condition Rating + Bridge Condition Rating Date
3. Activity costs are to be recorded on a “per bridge” basis using contract lump sums.
Spreadsheet
N/A
128

Fraction of the Construction Budget to the Salem District (FCBSD)
Definition/Assumptions
Formula
Constant.
Value (dim)
0.09321
Source
1. Data obtained from the Commonwealth Transportation Board Six-Year
Plan. 2. Divide allocated money to Salem District by the state wide allocation, i.e.,
HCBS HCBSD _ecRsp HCBV
Spreadsheet
N/A
129

Fraction of the Maintenance Budget to the Bridge Budget (FMBB)
Definition/Assumptions
This is the fraction of the money from the maintenance budget that is applied to the bridge budget
Formula
Constant.
Value (dim)
Interstate 0.0177
Primary 0.0626 Secondary N/A
Source
Current
1. Divide allocated money to Salem District by the state wide allocation, i.e., HMB
HMBV
Recommended
= FMBSD
1. Establish new activity codes for each of the parameters. 2. Establish a data base with the following fields:
» Activity Name » Activity Code «+ System
» Bridge Identification Number + Cost - Date - Budget (Construction or Maintenance) » Bridge Condition Rating + Bridge Condition Rating Date
3. Activity costs are to be recorded on a “per bridge” basis using contract lump sums.
Spreadsheet
N/A

Fraction of the Maintenance Budget to the Salem District (FMBSD)
Definition/Assumptions
Formula
Constant.
Value (dim)
0.09899
Source
1. Divide allocated money to Salem District by the state wide allocation, 7.e.,
HIB -= FMBSD
HMBV
Spreadsheet
N/A
131
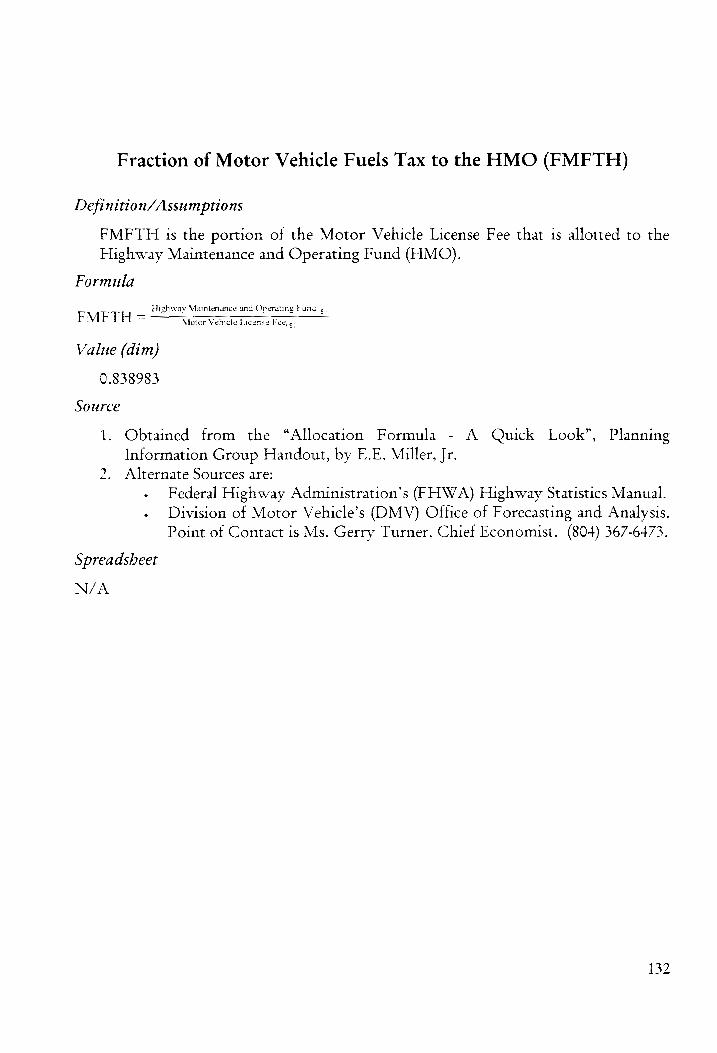
Fraction of Motor Vehicle Fuels Tax to the HMO (FMFTH)
Definition/Assumptions
FMFTH is the portion of the Motor Vehicle License Fee that is allotted to the Highway Maintenance and Operating Fund (HMO).
Formula
Highway Maintenance and Oreraung Fund < FMFTH = Motor Vehicle License Fee, <,
Value (dim)
0.838983
Source
1. Obtained from the “Allocation Formula - A Quick Look”, Planning Information Group Handout, by E.E. Miller, Jr.
2. Alternate Sources are: - Federal Highway Admuinistration’s (FHWA) Highway Statistics Manual. - Division of Motor Vehicle’s (DMV) Office of Forecasting and Analysis.
Point of Contact is Ms. Gerrv Turner, Chief Economist. (804) 367-6473.
Spreadsheet
N/A
132

Fraction of Motor Vehicle Fuels Tax to the TTF (FMFTT)
Definition/Assumptions
FMFTT is the portion of the Motor Vehicle Fuels Tax allotted to the Transportation Trust Fund (TTF).
Formula
Transportation Trust Fund, ¢,
FMEFTT = Motor Vehic le Fuels Tax, ¢,
Value (dim)
0.141243
Source
1. Obtained from the “Allocation Formula - A Quick Look”, Planning Information Group Handout, by E.E. Miller, Jr.
2. Alternate Sources are: » Federal Highway Administration’s (FHWA) Highway Statistics Manual. » Diviston of Motor Vehicle’s (DMV) Office of Forecasting and Analysis.
Point of Contact is Ms. Gerry Turner, Chief Economist. (804) 367-6473.
Spreadsheet
N/A
133

Fraction of Motor Vehicle License Fee to the HMO (FMVLFH)
Definition/Assumptions
FMVLFH is the portion of the Motor Vehicle License Fee allotted to the Highway Maintenance and Operating Fund (HMO).
Formula
Highway Mamtenance and Operating Fund, ., FMVLFH = Motor Vehicle License Fee,<,
Value (dim)
0.603773
Source
1. Obtained from the “Allocation Formula - A Quick Look”, Planning Information Group Handout, by E.E. Miller, Jr.
2. Alternate Sources are: » Federal Highway Administration’s (FHWA) Highway Statistics Manual. » Division of Motor Vehicle’s (DMV) Office of Forecasting and Analysis.
Point of Contact is Ms. Gerry Turner, Chiet Economist. (804) 367-6473.
Spreadsheet
N/A
134

Fraction of Motor Vehicle License Fee to the TTF (FMVLFT)
Definition/Assumptions
FMVLFT is the portion of the Motor Vehicle License Fee allotted to the Transportation Trust Fund (TTF).
Formula
Transportation Trust Fund, ¢,
FMVLFT = Moter Vehicle License Fee, ¢,
Value (dim)
0.113208
Source
1. Obtained from the “Allocation Formula - A Quick Look”, Planning
Information Group Handout, by E.E. Miller, Jr. 2. Alternate Sources are:
» Federal Highway Administration’s (FHWA) Highway Statistics Manual. » Division of Motor Vehicle’s (DMV) Office of Forecasting and Analysis.
Point of Contact is Ms. Gerry Turner, Chief Economist. (804) 367-6473.
Spreadsheet
N/A
135

Fraction of Motor Vehicle License Fee to the HMO (FMVSTH)
Definition/Assumptions
FMVSTH is the portion of the Motor Vehicle Sales & Use Tax allotted to the Highway Maintenance and Operating Fund (HMO).
Formula
Highway Maintenance and Operating Fur. .,,
FMVSTH = Motor Vehicle License Fee,,,
Value (dim)
0.666667
Source
1. Obtained from the “Allocation Formula - A Quick Look”, Planning Information Group Handout, by E.E. Miller, Jr.
2. Alternate Sources are: » Federal Highway Admuinistration’s (FHWA) Highway Statistics Manual. - Division of Motor Vehicle’s (DMV) Office of Forecasting and Analysis.
Point of Contact 1s Ms. Gerry Turner, Chief Economist. (804) 367-6473.
Spreadsheet
N/A
136

Fraction of Motor Sales & Use Tax to the TTF (FMVSTT)
Definition/Assumptions
FMVSTT is the portion of the Motor Vehicle Sales & Use Tax allotted to the Transportation Trust Fund (TTF).
Formula
Transportation Trust Fund,.,;
FMVSTT ™~ Motor Vehicle Sales & Use Tax, o,;
Value (dim)
0.333
Source
1. Obtained from the “Allocation Formula - A Quick Look”, Planning Information Group Handout, by E.E. Miller, Jr.
2. Alternate Sources are: » Federal Highway Administration’s (FHWA) Highway Statistics Manual. » Division of Motor Vehicle’s (DMV) Office of Forecasting and Analysis.
Point of Contact is Ms. Gerry Turner, Chief Economist. (804) 367-6473.
Spreadsheet
N/A
137

Fraction of the Revenue to the Highway Budget (FRHWY)
Definition/Assumptions
FRHWY is the fraction of the total state budget that is actually spent on the highway system, z.e., excludes the fraction of the budget that is applied to the Public Transit.
Formula
Constant.
Value (dim)
0.955
Source
1. Data obtained from the Commonwealth Transportation Board Six-Year
Plan, p. 3.
2. Subtract the “Public Transit” allocation from the “Total” allocation. 3. Divide this figure by the “Total” allocation, i.e.,
(Total - Public Transit)
Total = FRHWY
Spreadsheet
N/A
138

Fraction of State Sales Tax to the HMO (FSSH)
Definition/Assumptions
FSSH is the portion of the Motor Vehicle License Fee that is allotted to the Highway Maintenance and Operating Fund (HMO).
Formula
_ 0.85 Highway Maintenance and Operating Fund, .«,
FSSH = Motor Vehicle License Fee,,,
Value (dim)
0.00
Source
1. Obtained from the “Allocation Formula - A Quick Look”, Planning Information Group Handout, by E.E. Miller, Jr.
2. Alternate Sources are: « Federal Highway Administration’s (FHWA) Highway Statistics Manual. » Division of Motor Vehicle’s (DMV) Office of Forecasting and Analysis.
Point of Contact is Ms. Gerry Turner, Chief Economist. (804) 367-6473.
Spreadsheet
N/A
139
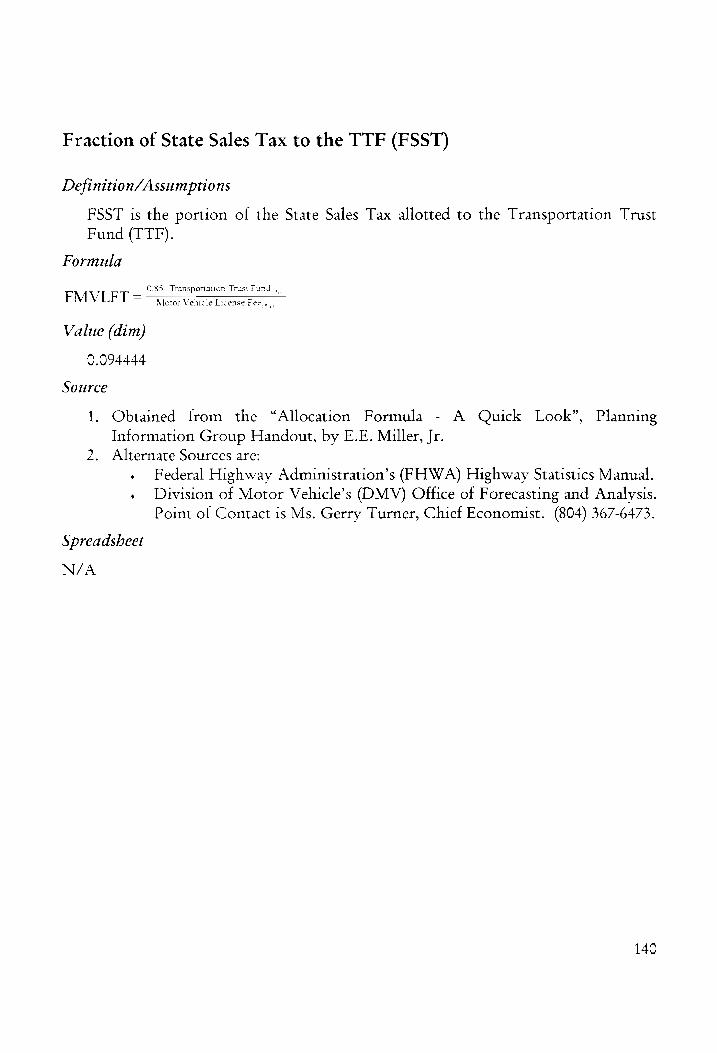
Fraction of State Sales Tax to the TTF (FSST)
Definition/Assumptions
FSST is the portion of the State Sales Tax allotted to the Transportation Trust Fund (TTF).
Formula
0.85 Transportation Trust Fund,.,,
FMVLFT = Motor Vehicle License Fee, ,,
Value (dim)
0.094444
Source
1. Obtained from the “Allocation Formula - A Quick Look”, Planning Information Group Handout, by E.E. Miller, Jr.
2. Alternate Sources are:
» Federal Highway Administration’s (FHWA) Highway Statistics Manual. » Division of Motor Vehicle’s (DMV) Office of Forecasting and Analysis.
Point of Contact is Ms. Gerry Turner, Chief Economist. (804) 367-6473.
Spreadsheet
N/A
140

Highway Construction Budget for the Salem District (HCBSD)
Definition/Assumptions
Formula
HCBSD.K =FCBSD.K*HCBCV.K
Value ($/yr.)
82,740,000.00
Value ($/yr.)
1. Commonwealth Transportation Board’s Six-Year Improvement Program - Fiscal Year 1995-96, p. 174.
Spreadsheet
N/A
141

Highway Construction Budget in Virginia (HCBV)
Definition/Assumptions
Formula
HCBV.K =FBHC.K*ABH.K
Value ($/yr.)
887 ,666,000.00
Value ($/yr.)
1. Commonwealth Transportation Board’s Six-Year Improvement Program - Fiscal Year 1995-96, p. 3.
Spreadsheet
N/A

Highway in Deficient Pavement Condition (HDFPC)
Definition/Assumptions
With the new PCI rating svstem there is no definitive point which separates highway in deteriorated (fair) from deficient (poor) and sufficient (good) conditions. For the purposes of this model, a deteriorated condition has been defined as: 79 > PCI=50 for the primary system and 84 >PCI=50 for the interstate system. Data for the secondary highway system was unavailable at the time of collection.
Formula
HDFPC.K = HDFPC,] + (DT)(ARH.JK-MRDFH.JK-DRH.JK)
Value (In-m1)
Interstate 220.39 Primary 1068.78 Secondary 0.00
Source
1.
in se Ww
Obtain the “Salem Flexible Ratings (Pavement Condition Index) - 1995” for each of the systems. In Excel, input the “PCI” and “Lane Miles” columns for each of the systems, sort the data in ascending order by “PCI”, and sum the “Lane Miles” for each system for the PCI defined earlier. Add the columns: “Rating”, “Percentage” and “Mileage”. In the “Rating” column enter the rating of “Poor”. The “Percentage” column is the percentage of total mileage of deteriorated roadway of the system, as compared to the total mileage recorded for the system. Total Mileage
' Detenorated ! =P t Total Mileage cree
(System)
Multiply this percentage by the actual mileage to determine the adjusted mileage in the deteriorated category.
Spreadsheets
See spreadsheet on page 148.
143
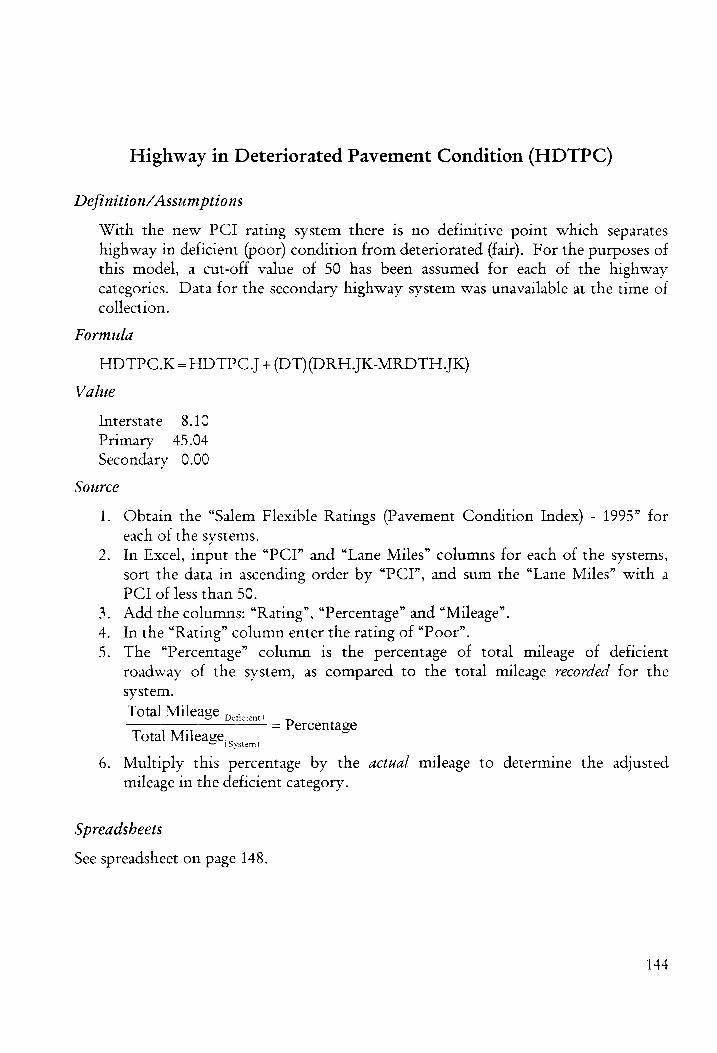
Highway in Deteriorated Pavement Condition (HDTPC)
Definition/Assumptions
With the new PCI rating system there is no definitive point which separates highway in deficient (poor) condition from deteriorated (fair). For the purposes of this model, a cut-off value of 50 has been assumed for each of the highway categories. Data for the secondary highway system was unavailable at the time of collection.
Formula
HDTPC.K=HDTPC,J +(DT)(DRH.JK-MRDTH_JK)
Value
Interstate 8.10
Primary 45.04 Secondary 0.00
SOuUrce
1. Obtain the “Salem Flexible Ratings (Pavement Condition Index) - 1995” for each of the systems.
2. In Excel, input the “PCI” and “Lane Miles” columns for each of the systems, sort the data in ascending order by “PCI”, and sum the “Lane Miles” with a PCI of less than 50.
3. Add the columns: “Rating”, “Percentage” and “Mileage”. In the “Rating” column enter the rating of “Poor”.
5. The “Percentage” column is the percentage of total mileage of deficient roadway of the system, as compared to the total mileage recorded for the system. Total Mileage,
i Deficient?
*
; = Percentage Total Mileage. ”
(Svstem!
6. Multiply this percentage by the actual mileage to determine the adjusted mileage in the deficient category.
Spreadsheets
See spreadsheet on page 148.
144

Highway Maintenance Budget for the Salem District (HMB)
Definition/Assumptions
Formula
HMB.K =clip(clip(6.2E6*K,6.2E6, TIME.K,5)FMBP.K*HMBS.K, TIME.K,0)
Value ($/yr.)
75,286,472.31
Source
1. Sum the ordinary maintenance, maintenance replacement, and incidental construction totals for each of the systems obtained from the A-17 report.
Spreadsheet
N/A

Highway Maintenance Budget in Virginia (HMBV)
Definition/Assumptions
Formula
HMBV.K =FBHM.K*HMBV.K
Value ($/yr.)
760,572,000.00
Source
1. Commonwealth Transportation Board’s Six-Year Improvement Program - Fiscal Year 1995-96, p. 3.
Spreadsheet
N/A
146

Highway in Sufficient Pavement Condition (HSFPC)
Definition/Assumptions
With the new PCI rating system there is no definitive point which separates highway in deficient (poor) condition from deteriorated (fair). For the purposes of this model a cut-off value of >78 for primary and > 83 for interstate, has been assumed for each of the highway categories. Data tor the secondary highway system was unavailable at the time of collection.
Formula
HSFPC.K =HSFPC,J +(DT)\(MRDTH.JK + ERH.JK + MRDFH JK-ARH_JK)
Value
Interstate 271.15 Primary 1451.91 Secondary 0.00
Source
1. Obtain the “Salem Flexible Ratings (Pavement Condition Index) - 1995” tor each of the systems.
2. In Excel, input the “PCI” and “Lane Miles” columns for each of the systems,
sort the data in ascending order by “PCI”, and sum the “Lane Miles” for each system for the PCI defined earlier.
3. Add the columns: “Rating”, “Percentage” and “Mileage”. 4. Inthe “Rating” column enter the rating of “Poor”. 5. The “Percentage” column is the percentage of total mileage of sufficient
roadway of the system, as compared to the total mileage recorded for the system. Total Mileage... sscsenr p
= t Total Mileage... “eee
6. Multiply this percentage by the actual mileage to determine the adjusted mileage in the sufficient category.
Spreadsheets
See spreadsheet on page 148.
147

Spreadsheets - Sufficiency Ratings
Interstate
PCI Rating Percentage Mileage
TOTAL GOOD 54.27% 271.15
TOTAL FAIR 44.11% 220.39
TOTAL POOR 1.62% 8.10
Lane Mileage 499.64
Primary
Pcl Rating Percentage Mileage
TOTAL GOOD 56.59% 1451.91
TOTAL FAIR 41.66% 1068.78
TOTAL POOR 1.76% 45.04
Lane Mileage 2565.74
148

Income Increasing Rate Parameter (IIRP)
Definition/Assumptions
IIRP is the rate at which the per capita income 1s growing each year.
Formula
Constant.
Value (%/yr.)
1.43
Source
1. Using the Internet, this can be found in the US Census Bureau’s homepage at: www.census.gov/ftp/pub/bhes/income/4person.ptml
2. It should be noted for those individuals not familiar with the mechanics of the web, addresses (URL) are case sensitive and should be typed as shown above.
Spreadsheet
N/A
149

In-Migration Parameter of Virginia (IMRPV)
Definition/Assumptions
IMRPV is the rate at which the population of Virginia is growing each year through immigration.
Formula
Constant.
Value (dim)
0.001168
Source
1. Using the Internet, this can be found in the US Census Bureau’s homepage at: www.census.gov/ftp/pub/population/www/statepop.btml
2. It should be noted for those individuals not familiar with the mechanics of the web, addresses (URL) are case sensitive and should be typed as shown above.
Spreadsheet
N/A
15C

Inflation Factor (INFLF)
Definition/Assumptions
Formula
INFLF.K = (INFLR + 1)**TIME.K
Value (%/yr.)
2.6
Source
1. Using the Internet, this can be found in the US Census Bureau’s homepage at: www.odc.gov/ca/pubulications/95fact/us.btml
2. It should be noted for those individuals not familiar with the mechanics of the web, addresses (URL) are case sensitive and should be typed as shown above.
Spreadsheet
N/A
151

Out-Migration Parameter of Virginia (OMRPV)
Definition/Assumptions
OMRPYV is the rate at which the population of Virginia is decreasing each vear through emigration.
Formula
Constant.
Value (dim)
0.001737
Source
1. Using the Internet, this can be found in the US Census Bureau’s homepage at: www.census.gov/ftp/pub/population/www/statepop.btml
2. It should be noted for those individuals not familiar with the mechanics of the web, addresses (URL) are case sensitive and should be typed as shown above.
Spreadsheet
N/A
152

Obsolescence Time of Bridges (OTB)
Definition/Assumptions
Obsolescence is a function of Policy Makers decision processes. It deals with the bridge’s ability to satisfy the current Bridge Specifications vice its structural soundness with regards to loading.
Formula
Constant
Value (yr.)
20
Source (see Recommended Changes)
Current
1. Dean Hackett, Salem District Bridge Engineer. Recommended
1. Establish new activity codes for each of the parameters. 2. Establish a data base with the following fields:
+ Activity Name » Activity Code - System - Bridge Identification Number + Cost «+ Date
+ Budget (Construction or Maintenance) » Bridge Condition Rating » Bridge Condition Rating Date
3. Activity costs are to be recorded on a “per bridge” basis using contract lump sums.
Spreadsheet
N/A
153

Per Capita Income of Virginia (PCIV)
Definition/Assumptions
Formula
PCIV.K=PCIV.J+(DT)(IIR.JK)
Value ($/person)
$23,597.00
Source
1. Using the Internet, this can be found in the US Census Bureau’s homepage at: www.bea.doc.gou/bea/statepi.btm#tabele# under the “Per capita personal income, by State and region, 1995”.
2. It should be noted for those individuals not familiar with the mechanics of the web, addresses (URL) are case sensitive and should be typed as shown above.
Spreadsheet
N/A
154
Personal Purchase Rate (PPR)
Definition/Assumptions
Formula
Constant.
Value ($/yr.-person)
22,570.47
Source
1. Using the Internet, this can be found in the US Census Bureau’s homepage at: wuw.bea.doc.gov/bea/statepi.htm#table.
2. It should be noted for those individuals not familiar with the mechanics of the web, addresses (URL) are case sensitive and should be typed as shown above.
Spreadsheet
N/A

Population of Salem District (PS)
Definition/Assumptions
Formula
Constant.
Value (person)
662,737
Source
1. This data was obtained by summing the 1990 Population Census totals found in the legend of each of the VDOT General Highway maps for each of the thirteen counties in the Salem District.
Spreadsheet
N/A
156
Population of Virginia (PV)
Definition/Assumptions
Formula
Constant.
Value (person)
6,618,358
Source
1. Using the Internet, this can be found in the US Census Bureau’s homepage at: www.census.zov/ftp/pub/population/www/statepop.html
2. It should be noted for those individuals not familiar with the mechanics of the web, addresses (URL) are case sensitive and should be typed as shown above.
Spreadsheet
N/A
157

Rate of Motor Fuels Tax (RMFT)
Definition/Assumptions
RMFT is the tax assessed each time fuel is purchased at a filling station.
Formula
Constant.
Value ($/gal)
0.177
Source
1. Obtained from the “Allocation Formula - A Quick Look”, Planning Information Group Handout, by E.E. Miller, Jr.
2. Alternate Sources are: » Federal Highway Administration’s (FHWA) Highway Statistics Manual. + Division of Motor Vehicle’s (DMV) Office of Forecasting and Analysis.
Point of Contact is Ms. Gerry Turner, Chief Economist. (804) 367-6473.
Spreadsheet
N/A
158
Rate of Motor Vehicle License Fee (RMVLF)
Definition/Assumptions
RMVLF 1s the fee associated with registering a motor vehicle with the Division of Motor Vehicles (DMV).
Formula
Constant.
Value ($/veh)
26.50
Source
1. Obtained from the “Allocation Formula - A Quick Look”, Planning Information Group Handout, by E.E. Miller, Jr.
2. Alternate Sources are: + Federal Highway Administration’s (FHWA) Highway Statistics Manual. » Division of Motor Vehicle’s (DMV) Office of Forecasting and Analysis.
Point of Contact is Ms. Gerry Turner, Chief Economist. (804) 367-6473.
Spreadsheet
N/A
159

Rate of Motor Vehicle Sales & Use Tax (RMVSUT)
Definition/Assumptions
All vehicles are taxed at 3.0 percent of their total value or $35.00 whichever 1s greater.
Formula
Constant.
Value (dim)
0.03
Source
1. Obtained from the “Allocation Formula - A Quick Look”, Planning
Information Group Handout, by E.E. Miller, Jr.
2. Alternate Sources are: » Federal Highway Administration’s (FHWA) Highway Statistics Manual. + Division of Motor Vehicle’s (DMV) Office of Forecasting and Analysis.
Point of Contact is Ms. Gerry Turner, Chief Economist. (804) 367-6473.
Spreadsheet
N/A
160

Rate for State Sales Tax (RSST)
Definition/Assumptions
The state sales tax for Virginia.
Formula
Constant.
Value ($/yr.)
0.045
Source
1. Obtained from the “Allocation Formula - A Quick Look”, Planning Information Group Handout, by E.E. Miller, Jr.
2. Alternate Sources are: + Federal Highway Administration’s (FHWA) Highway Statistics Manual. + Division of Motor Vehicle’s (DMV) Office of Forecasting and Analysis.
Point of Contact is Ms. Gerry Turner, Chief Economist. (804) 367-6473.
Spreadsheet
N/A
161

Serious Deterioration Time of Bridges (SDTB)
Definition/Assumptions
SDTB is defined as the time required for a bridge condition rating to go from “Poor” to “Critical”.
Formula
Constant
Value (yr.)
Interstate 15
Primary 30 Secondary 32
Source
Current
1. This type of information is unavailable at this time as it is not collected. 2. Data used for this parameter was obtained by Dean Hackett, Salem District
Bridge Engineer, with a Super Natural query of HTRIS. 3. Values were obtained by subtracting the “Year Built” from the “Year
Improved” for each of the Road and Bridge classifications. Recommended
1. For new structures, time begins subsequent to the completed structure’s first winter, as ordinary maintenance is performed to mitigate the effects of that winter, thereby placing the bridge in the “Good” condition.
2. For existing structures, time begins subsequent to any upgrade or downgrade to its existing condition.
3. Deterioration Times are then calculated by finding the difference between the date of classification for the older (higher) condition and the date for the newer (lower) condition.
Spreadsheet
N/A
162

State Sales (SS)
Definition/Assumptions
The estimated dollar amount of sales in the state of Virginia.
Formula
SST. K=PPR*PV.K
Value ($/yr.)
149,379,454,500.47
Source
1. Obtained by multiplying the personal purchase rate (PPR) with the population of Virginia (PV).
Spreadsheet
N/A
163

Total Mileage (TOTMILG)
Definition/Assumptions
The total road mileage in the system.
Formula
Constant
Value (mi.)
Interstate 117.91 Primary 1035.39 Secondary 7077.03
Source
1. HTRIS query
Spreadsheet
N/A
164
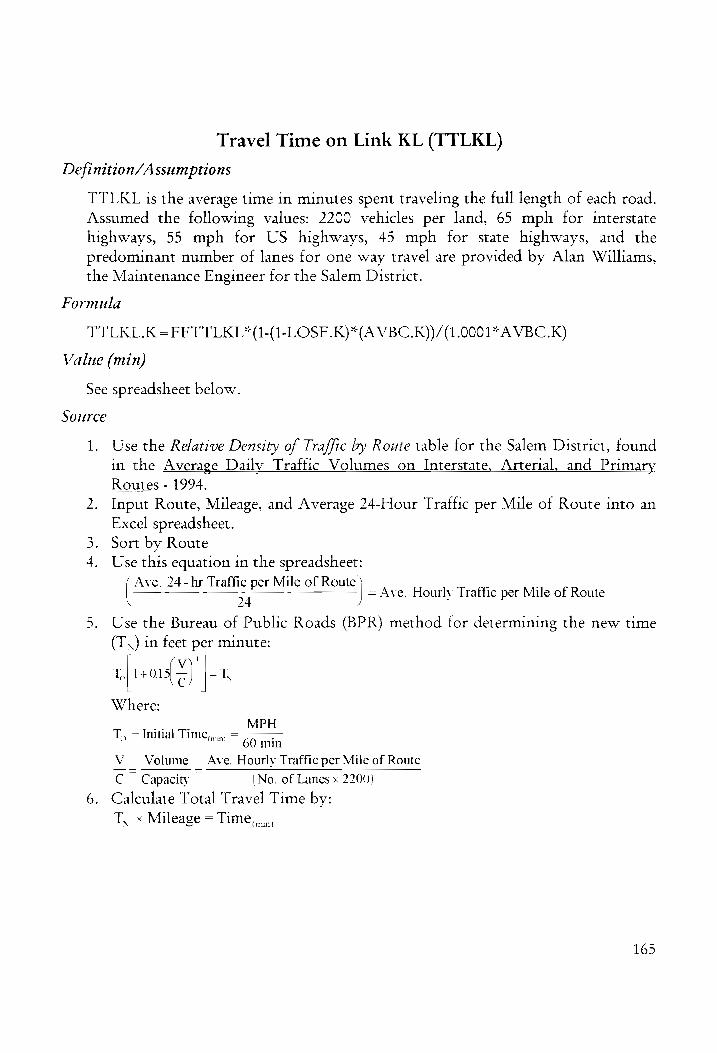
Travel Time on Link KL (TTLKL)
Definition/Assumptions
TTLKL is the average time in minutes spent traveling the full length of each road. Assumed the following values: 2200 vehicles per land, 65 mph for interstate highways, 55 mph for US highways, 45 mph for state highways, and the predominant number of lanes for one way travel are provided by Alan Williams, the Maintenance Engineer for the Salem District.
Formula
TTLKL.K =FFTTLKL*(1-(1-LOSF.K)*(AVBC.K))/(1.0001*A VBC.K)
Value (min)
See spreadsheet below
Source
1. Use the Relative Density of Traffic by Route table tor the Salem District, found in the Average Daily Traffic Volumes on Interstate, Arterial, and Primary Routes - 1994. Input Route, Mileage, and Average 24-Hour Trattfic per Mile of Route into an Excel spreadsheet.
3. Sort by Route 4. Use this equation in the spreadsheet:
f Ave. 24-hr Traffic per Mile of Route \ | x4 y= Ave. Hourly Traffic per Mile of Route
5. Use the Bureau of Public Roads (BPR) method tor determining the new time (Tx) in feet per minute:
Vv) T, +013 =| =T,
Where:
No
Doe MPH T,, = Initial Time,,,,,, = G0 min
V Volume’ Ave. Hourly Traffic per Mile of Route
fom Capacity ~ (No. of Lanes x 2200}
6. Calculate Total Travel Time by: T.. x Mileage = Time (min)
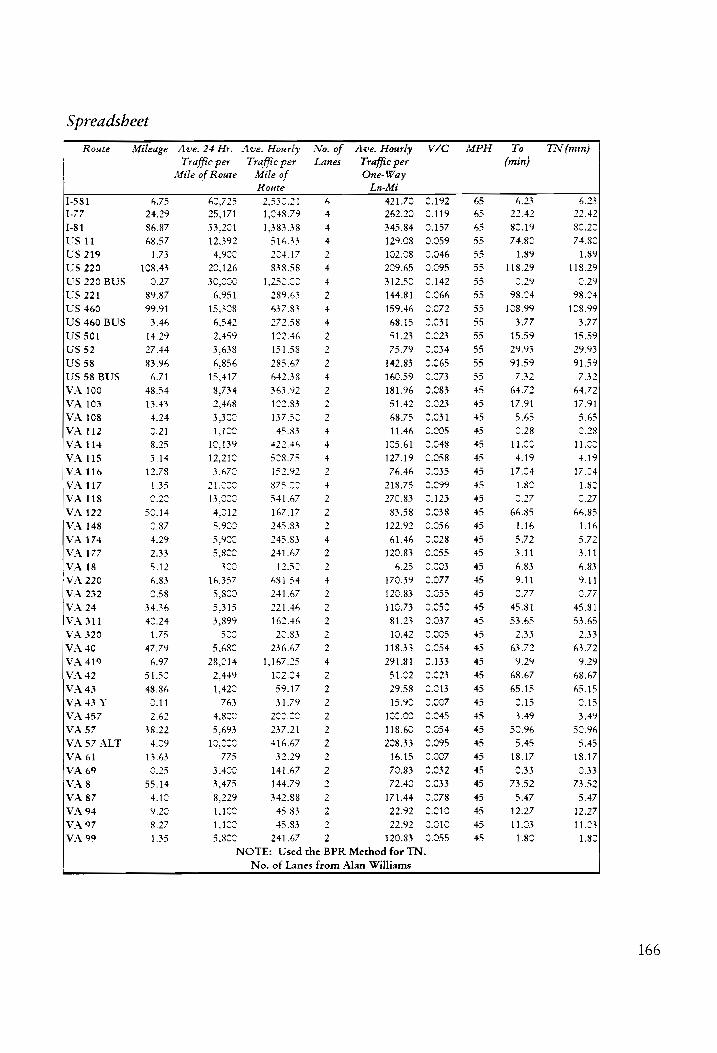
Spreadsheet
Route Mileage Ave. 24 Hr. Ave. Hourly No. of Ave. Hourly V/C MPH To IN (min) Traffic per Trafficper Lanes Traffic per (min)
Mile of Route Mile of One-Way Route En-Mi
1-581 6.75 60,725 2,532.21 6 421.70 ©.192 65 6,23 6.23
1-77 24.29 25,171 1,048.79 4 262.20 0.119 65 22.42 22.42
I-81 86.87 33,201 1,383.38 4 345.84 0.157 65 80.19 8C.22
US 11 68.57 12,392 516.33 4 129.08 0.059 55 74.80 74.80
US 219 1.73 4,900 224.17 2 102.08 0.046 55 1.89 1.89
US 220 108.43 20,126 338.58 4 09.65 9.095 35 118.29 118.29
US 220 BUS 0.27 30,000 1,252.00 4 312.50 9.142 55 v.29 0.29
US 221 89.87 6,951 289.63 2 144.81 0.066 55 98.04 98.04
US 460 99.91 15,308 637.33 4 159.46 0.072 55 108.99 128.99
US 460 BUS 3.46 6,542 272.58 4 68.15 0.031 55 3.77 3.77
US 501 14.29 2,459 122.46 2 51.23 0.023 55 15.59 15.59
US 52 27.44 3,638 151.58 2 75.79 3.034 55 29.93 29.93
US 58 83.96 6,856 285.67 2 142.83 0.C65 55 91.59 91.59
US 58 BUS 6.71 15,417 642.33 4 160.59 2.073 55 7.32 7.32
VA 100 48.54 8,734 363.92 2 181.96 0.083 45 64.72 64.72
VA 103 13.43 2,468 102.83 2 51.42 9.023 45 17.91 17.91
VA 108 4.24 3,300 137.52 2 68.75 0.031 45 5.65 3.65
VA 112 c.21 1,100 45.83 4 11.46 9.005 45 2.28 0.28
VA 114 8.25 10,139 422.46 4 105.61 0.048 45 11.00 11.¢¢
VA 115 3.14 12,212 528.75 4 127.19 0.058 45 4.19 4.19
VA 116 12.78 3,670 152.92 2 76.46 9.035 45 17.04 17.24
VA 117 1.35 21,000 875.20 4 218.75 o.C99 45 1.8¢ 1.82
VA 118 C.20 13,000 541.67 2 270.83 0.123 45 0.27 0.27
VA 122 50.14 4,012 167.17 2 83.58 0.038 45 66.85 66.85
VA 148 0.87 5,900 245.83 2 122.92 0.056 45 1.16 1.16
VA 174 4.29 5,900 245.83 4 61.46 0.028 45 5.72 5.72
VA177 2.33 5,802 241.67 2 120.83 9.055 45 3.11 3.11
VA 18 5.12 30¢ 12.5¢ 2 6.25 2.00 45 6.83 6.83
VA 220 6.83 16,357 681.54 4 170.39 9.077 45 9.11 9.11
VA 232 c.58 5,80C 241.67 2 120.83 0.055 45 0.77 c.77
VA 24 34.36 5,315 221.46 2 110.73 0.050 45 45.81 45.31
VA 311 40.24 3,899 162.46 2 $1.23 9.037 45 53.65 53.65
VA 320 1.75 Bcc 20.83 2 10.42 0.005 45 2.33 2.33
VA 40 47.79 5,68¢ 236.67 2 118.33 0.054 45 63.72 63.72
VA 419 6.97 28,014 1,167.25 4 291.81 0.133 45 9.29 9.29
VA 42 51.50 2,449 102.04 2 51.02 0.023 45 68.67 68.67
VA 43 48.86 1,42¢ 59.17 2 29.58 0.013 45 65.15 65.15
VA43 Y v.11 763 31.79 2 15.90 ¢.007 45 v.15 0.15
VA 457 2.62 4,800 COneS 2 100.co 0.045 45 3.49 3.49
VA 57 38.22 5,693 237.21 2 118.60 0.054 45 50.96 50.96
VA 57 ALT 4.09 O,000 416.67 2 208.33 0.095 45 5.45 5.45
VA 61 13.63 775 32.29 2 16.15 0.0C7 45 18.17 18.17
VA 69 0.25 3,400 141.67 2 70.83 0.032 45 0.33 0.33
VAS8 55.14 3,475 144.79 2 72.40 0.033 45 73.52 73.52
VA 87 4.12 8,229 342.88 2 171.44 0.078 45 5.47 5.47
VA 94 9.20 1,102 45.33 2 22.92 9.010 45 12.27 12.27
VA 97 8.27 1,100 45.33 2 22.92 0.010 45 11.03 11.03
VA 99 1.35 5,800 241.67 2 120.83 0.055 45 1.80 1.80
NOTE: Used the BPR Method for TN.
No. of Lanes from Alan Williams
166

Annual Traffic Volume (TVOL)
Definition/Assumptions
AADT is the estimated annual one-way tratfic volume per mile of route.
Formula
TVOL.K=AADT.K*220
Value (veh)
See spreadsheet below
Source
1. Use the “Relative Density of Traffic by Route” table for the Salem District found in the Average Daily Traffic Volumes_on Interstate, Arterial, and Primary Routes - 1994. Input Route, Mileage, and Average 24-hour Traffic per Mile of Route into an Excel spreadsheet. Sort by Route. Multiply the “Average 24-hour Traftic per Mile of Route” by 365 days to obtain the desired value.
167

Spreadsheet
Route Mileage Ave. 24 Hr. Traffic per Ave. Annual Traffic per 1-581 6.75 60,725 22,164,625 1-77 24.29 25,171 9,187,415 1-81 86.87 33,201 12,118,365 US 11 68.57 12,392 4,523,08C US 219 1.73 4,900 1,788,500 US 220 168.43 20,126 7,345,990 US 220 BUS 2.27 3,000 10,950,006 US 221 89.87 6,951 2,537,115 US 460 99.91 15,308 5,587,420 US 460 BUS 3.46 6,542 2,387,83¢ US 501 14.29 2,459 897,535 US 52 27.44 3,638 1,327,879 US 58 83.96 6,856 2,502,440 US 58 BUS 6.71 15,417 5,627,205 VA 100 48.54 8,734 3,187,910 VA 103 13.43 2,468 900,820 VA 108 4.24 3,300 1,204,500
VA 112 2.21 1,100 401,500 VA 114 8.25 10,139 3,700,735 VA 115 3.14 12.210 4,456,650 VA 116 12.78 3,670 1,339,552 VA 117 1.35 21,000 7,665,000 VA 118 2.20 13,000 4,745,000 VA 122 52.14 4,012 1,464,38¢ VA 148 2.87 5,900 2,153,500 VA 174 4.29 5,900 2,153,500 VA 177 2.33 5,800 2,117,000 VA 18 5.12 oo 109,500 VA 220 ALT 6.83 16,357 5,979,305 VA 232 2.58 5,800 2,117,000 VA 24 34.36 5,315 1,939,975 VA311 40.24 3,899 1,423,135 VA 320 1.75 500 182,500 VA 40 47.79 5,680 2,073,200 VA 419 6.97 28,014 12,225,11° VA 42 51.50 2,449 893,885 VA 43 48.86 1,420 518,300 VA43Y o.11 763 278,495 VA 457 2.62 4,800 1,752,000
VA 57 38.22 5,693 2,077,945 VA 57 ALT 4.09 c,000 3,650,000
VA 61 13.63 775 282,875 VA 69 2.25 3,400 1,241,000 VA8 55.14 3,475 1,268,375 VA 87 4.10 8,229 3,003,585 VA 94 9.20 1,100 401,500 VA97 8.27 1,100 401,502 VA 99 1.35 5,800 2,117,000
168

Total Value of Vehicles Registered in Virginia (TVVV)
Definition/Assumptions
Formula
TVVV.K=AVVV*VV.K
Value ($)
353,285,000.00
Source
1. This amount is estimated by a regression model at the Division of Motor Vehicle’s (DMV) Office of Forecasting and Analysis. Point of Contact is Ms. Gerry Turner, Chief Economist. (804) 367-6473.
Spreadsheet
N/A
169

Vehicle Average Annual Growth Rate in Virginia (VAGR)
Definition/Assumptions
The estimated rate at which the number of registered vehicles in Virginia increases (decreases).
Formula
Constant.
Value ($/yr.)
Passenger 0.0208 Other 0.0095
Source
i. Data from 1989 to 1995 was obtained from Division of Motor Vehicle’s (DMV) Office of Forecasting and Analysis. Point of Contact is Ms. Gerry Turner, Chief Economist. (804) 367-6473. The data was record as Passenger and Other until 1993. Therefore, this has been maintained to obtain a truer
mean for the value. 2. The growth rate was determined by first determining the growth rates between
each of the years by dividing the succeeding year by the preceding year then subtracting one.
Passer, 1 = 00202
Passenger, 5.
3. The final growth rate (VAGR) was determined by finding the arithmetic mean for these intermediate growth rates.
Spreadsheet
Vehicle Registration for Virginia
1989 1990 1991 1992 1993 1994 1995 Average
Passenger 4,402,077 4,440,868 4,531,770 4,678,685 4,799,366 4,882,284 4,315,016
Other 583,361 582,811 593,146 551,324 584,156 603,025
572,591 Growth Rate (Pass.) 2.02% 0.88% 2.05% 3.24% 2.58% 1.73% 2.08%
Growth Rate (Other) 1.88% -C.09% 1.77% -7 05% 5.96% 3.23% 0.95%
Note: Passenger vehicles include trucks with a registered gross weight of 7,500 Ib. or less.

Vehicle Increasing Rate in Virginia (VINC)
Definition/Assumptions
The estimated number of increased (decreased) registered vehicles in Virginia.
Formula
VINC.KL=VV.K*VAGR
Value ($/yr.)
Passenger 101,552
Other 5,729
Source
1. These estimates were obtained bv multiplying the number of registered vehicles in 1995 (VV) by their growth rate (VAGR).
Spreadsheet
N/A
171
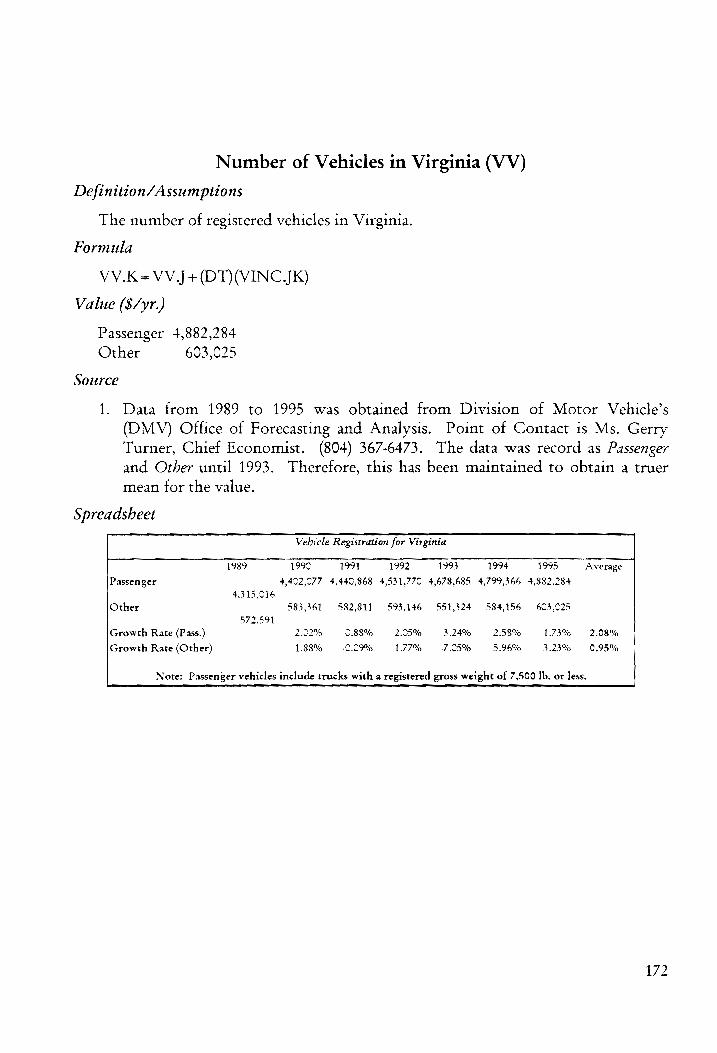
Number of Vehicles in Virginia (VV)
Definition/Assumptions
The number of registered vehicles in Virginia.
Formula
VV.K=VV.J+(DT)(VINC JK)
Value ($/yr.)
Passenger 4,882,284
Other 603,025
Source
1. Data from 1989 to 1995 was obtained from Division of Motor Vehicle’s (DMV) Office of Forecasting and Analysis. Point of Contact is Ms. Gerry Turner, Chief Economist. (804) 367-6473. The data was record as Passenger and Other until 1993. Therefore, this has been maintained to obtain a truer
mean for the value.
Spreadsheet
Vehicle Registration for Virginia
1989 1990 1991 1992 1993 1994 1995 Average
Passenger 4,402,077 4,440,868 4,531,770 4,678,685 4,799,366 4,882.284 4,315,016
Other 583,361 582,811 593,146 551,324 584,156 03,025
572,591 Growth Rate (Pass.) 2.02% c.88% 2.05% 3.24% 2.58% 1.73% 2.08%
Growth Rate (Other) 1.88% <.09% 1.77% -7 05% 5.96% 3.23% 0.95%
Note: Passenger vehicles include trucks with a registered gross weight of 7,500 Ib. or less.
172

Weighting Factor for Bearing and Anchor Bolt Replacement (WFBAR)
Definition/Assumptions
Is the fraction of the total money spent on Minor Repair Cost of Bridges (MNRCB). Other elements include average costs of: deck overlay (CDO), cathodic protection (CCP), patching (CPCH), expansion joint reconstruction (CEJR), repainting (CRPT), drainage system replacement and repair (CDSR), structural steel secondary member replacement and repair (CSMR), concrete diaphragm (CCDR), and deck edge repair (CDER). The sum of which is equal to one.
Formula
Constant.
Value (dim)
0.01
Source (see Recommended Changes)
Current
1. Dean Hackett, Salem District Bridge Engineer. Recommended
1. Establish new activity codes for each of the parameters. 2. Establish a data base with the following fields:
» Activity Name » Activity Code - System « Bridge Identification Number
- Cost - Date - Budget (Construction or Maintenance) - Bridge Condition Rating - Bridge Condition Rating Date
3. Activity costs are to be recorded on a “per bridge” basis using contract lump sums.
Spreadsheet
N/A
173
Weighting Factor for Beam End Repair (WFCBR)
Definition/Assumptions
Is the fraction of the total money spent on Major Repair Cost of Bridges (MJRCB). Other elements include average costs of deck replacement {CDKR) and superstructure replacement (CSSR). The sum of which is equal to one.
Formula
Constant.
Value (dim)
0.13
Source (see Recommended Changes)
Current
1. Dean Hackett, Salem District Bridge Engineer. Recommended
1. Establish new activity codes for each of the parameters. 2. Establish a data base with the following fields:
- Activity Name Activity Code
- System Bridge Identification Number
» Cost - Date
- Budget (Construction or Maintenance) - Bridge Condition Rating - Bridge Condition Rating Date
3. Activity costs are to be recorded on a “per bridge” basis using contract lump sums.
Spreadsheet
N/A
174

Weighting Factor for Concrete Diaphragm Repair (WFCDR)
Definition/Assumptions
Is the fraction of the total money spent on Minor Repair Cost of Bridges (MNRCB). Other elements include average costs of: deck overlay (CDO), cathodic protection (CCP), patching (CPCH), expansion joint reconstruction (CEJR), repainting (CRPT), drainage system replacement and repair (CDSR), structural steel secondary member replacement and repair (CSMR), bearing and anchor bolt replacement (CBAR), and deck edge repair (CDER). The sum of which is equal to one.
Formula
Constant.
Value (dim)
0.03
Source (see Recommended Changes)
Current
1. Dean Hackett, Salem District Bridge Engineer. Recommended
1. Establish new activity codes for each of the parameters. 2. Establish a data base with the following fields:
« Activity Name » Activity Code » System » Bridge Identification Number - Cost » Date « Budget (Construction or Maintenance) - Bridge Condition Rating » Bridge Condition Rating Date
3. Activity costs are to be recorded on a “per bridge” basis using contract lump sums.
Spreadsheet
N/A
175

Weighting Factor for Cathodic Protection (WFCP)
Definition/Assumptions
Is the fraction of the total money spent on Minor Repair Cost of Bridges (MNRCB). Other elements include average costs of: deck overlay (CDO), bearing and anchor bolt replacement (CBAR), patching (CPCH), expansion joint reconstruction (CEJR), repainting (CRPT), drainage system replacement and repair (CDSR), structural steel secondary member replacement and repair (CSMR), concrete diaphragm (CCDR), and deck edge repair (CDER). The sum of which is equal to one.
Formula
Constant.
Value (dim)
0.01
Source (see Recommended Changes)
Current
1. Dean Hackett, Salem District Bridge Engineer. Recommended
1. Establish new activity codes for each of the parameters. 2. Establish a data base with the following fields:
- Activity Name » Activity Code + System » Bridge Identification Number - Cost - Date + Budget (Construction or Maintenance) + Bridge Condition Rating + Bridge Condition Rating Date
3. Activity costs are to be recorded on a “per bridge” basis using contract lump sums.
Spreadsheet
N/A
176

Weighting Factor for Deck Edge Repair (WFDER)
Definition/Assumptions
Is the fraction of the total money spent on Minor Repair Cost of Bridges (MNRCB). Other elements include average costs of: deck overlay (CDO), cathodic protection (CCP), patching (CPCH), expansion joint reconstruction (CEJR), repainting (CRPT), drainage system replacement and repair (CDSR), structural steel secondary member replacement and repair (CSMR), concrete diaphragm (CCDR), and bearing and anchor bolt replacement (CBAR). The sum of which ts equal to one.
Formula
Constant.
Value (dim)
0.04
Source (see Recommended Changes)
Current
1. Dean Hackett, Salem District Bridge Engineer. Recommended
1. Establish new activity codes for each of the parameters. 2. Establish a data base with the following fields:
« Activity Name - Activity Code - System » Bridge Identification Number - Cost - Date - Budget (Construction or Maintenance) - Bridge Condition Rating - Bridge Condition Rating Date
3. Activity costs are to be recorded on a “per bridge” basis using contract lump sums.
Spreadsheet
N/A
177

Weighting Factor for Deck Replacement (WFDKR)
Definition/Assumptions
Is the fraction of the total money spent on Major Repair Cost of Bridges (MJRCB). Other elements include average costs of concrete beam end repair (CCBR) and superstructure replacement (CSSR). The sum of which is equal to one.
Formula
Constant.
Value (dim)
0.65
Source (see Recommended Changes)
Current
1. Dean Hackett, Salem District Bridge Engineer. Recommended
1. Establish new activity codes for each of the parameters. 2. Establish a data base with the following fields:
+ Activity Name » Activity Code + System » Bridge Identification Number » Cost - Date » Budget (Construction or Maintenance) - Bridge Condition Rating - Bridge Condition Rating Date
3. Activity costs are to be recorded on a “per bridge” basis using contract lump sums.
Spreadsheet
N/A
178

Weighting Factor for Deck Overlay (WFDO)
Definition/Assumptions
Is the fraction of the total money spent on Minor Repair Cost of Bridges (MNRCB). Other elements include average costs of: bearing and anchor bolt replacement (CBAR), cathodic protection (CCP), patching (CPCH), expansion joint reconstruction (CEJR), repainting (CRPT), drainage system replacement and repair (CDSR), structural steel secondary member replacement and repair (CSMR), concrete diaphragm (CCDR), and deck edge repair (CDER). The sum of which ts equal to one.
Formula
Constant.
Value (dim)
0.17
Source (see Recommended Changes)
Current
1. Dean Hackett, Salem District Bridge Engineer. Recommended
1. Establish new activity codes for each of the parameters. 2. Establish a data base with the following fields:
« Activity Name + Activity Code » System » Bridge Identification Number
+ Cost
+ Date
+ Budget (Construction or Maintenance) » Bridge Condition Rating » Bridge Condition Rating Date
3. Activity costs are to be recorded on a “per bridge” basis using contract lump sums.
Spreadsheet
N/A
179
Weighting Factor for Drainage System Replacement and Repair (WFDSR)
Definition/Assumptions
Is the fraction of the total money spent on Minor Repair Cost of Bridges (MNRCB). Other elements include average costs of: deck overlay (CDO), cathodic protection (CCP), patching (CPCH), expansion joint reconstruction (CEJR), repainting (CRPT), bearing and anchor bolt replacement (CBAR), structural steel secondary member replacement and repair (CSMR), concrete diaphragm (CCDR), and deck edge repair (CDER). The sum of which 1s equal to one.
Formula
Constant.
Value (dim)
0.07
Source (see Recommended Changes)
Current
1. Dean Hackett, Salem District Bridge Engineer. Recommended
1. Establish new activity codes for each of the parameters. 2. Establish a data base with the following fields:
- Activity Name » Activity Code + System » Bridge Identification Number + Cost + Date + Budget (Construction or Maintenance) « Bridge Condition Rating » Bridge Condition Rating Date
3. Activity costs are to be recorded on a “per bridge” basis using contract lump sums.
Spreadsheet
N/A
180

Weighting Factor for Expansion Joint Maintenance (WFEJM)
Definition/Assumptions
Is the fraction of the total money spent on Preventive Maintenance Cost of Bridges (PMCB). Other elements include average costs of parapet guard rail maintenance (CPGM), scour (CS), sealing deck cracks (CSDC), and spot painting (CSP). The sum of which is equal to one.
Formula
Constant.
Value (dim)
0.63
Source (see Recommended Changes)
Current
1. Dean Hackett, Salem District Bridge Engineer. Recommended
1. Establish new activity codes for each of the parameters. 2. Establish a data base with the following fields:
» Activity Name » Activity Code - System » Bridge Identification Number + Cost - Date » Budget (Construction or Maintenance) + Bridge Condition Rating » Bridge Condition Rating Date
3. Activity costs are to be recorded on a “per bridge” basis using contract lump sums.
Spreadsheet
N/A
181

Weighting Factor for Expansion Joint Reconstruction (WFEJR)
Definition/Assumptions
Is the fraction of the total money spent on Minor Repair Cost of Bridges (MNRCB). Other elements include average costs of: deck overlay (CDO), cathodic protection (CCP), patching (CPCH), bearing and anchor bolt replacement (CBAR), repainting (CRPT), drainage system replacement and repair (CDSR), structural steel secondary member replacement and repair (CSMR), concrete diaphragm (CCDR), and deck edge repair (CDER). The sum of which ts equal to one.
Formula
Constant.
Value (dim)
0.29
Source (see Recommended Changes)
Current
1. Dean Hackett, Salem District Bridge Engineer. Recommended
1. Establish new activity codes for each of the parameters. 2. Establish a data base with the following fields:
» Activity Name » Activity Code + System » Bridge Identification Number «+ Cost - Date - Budget (Construction or Maintenance) - Bridge Condition Rating - Bridge Condition Rating Date
3. Activity costs are to be recorded on a “per bridge” basis using contract lump sums.
Spreadsheet
N/A
182

Weighting Factor for Patching (WFPCH)
Definition/Assumptions
Is the fraction of the total money spent on Minor Repair Cost of Bridges (MNRCB). Other elements include average costs of: deck overlay (CDO), cathodic protection (CCP), bearing and anchor bolt replacement (CBAR), expansion joint reconstruction (CEJR), repainting (CRPT), drainage system replacement and repair (CDSR), structural steel secondary member replacement and repair (CSMR), concrete diaphragm (CCDR), and deck edge repair (CDER). The sum of which 1s equal to one.
Formula
Constant.
Value (dim)
0.21
Source (see Recommended Changes)
Current
1. Dean Hackett, Salem District Bridge Engineer. Recommended
1. Establish new activity codes for each of the parameters. 2. Establish a data base with the following fields:
+ Activity Name » Activity Code - System
» Bridge Identification Number - Cost + Date » Budget (Construction or Maintenance) - Bridge Condition Rating » Bridge Condition Rating Date
3. Activity costs are to be recorded on a “per bridge” basis using contract lump sums.
Spreadsheet
N/A
183

Weighting Factor for Parapet Guard Rail Maintenance (WFPGM)
Definition/Assumptions
Is the fraction of the total money spent on Preventive Maintenance Cost of Bridges (PMCB). Other elements include average costs of expansion joint maintenance (CEJM), scour (CS), sealing deck cracks (CSDC), and spot painting (CSP). The sum of which is equal to one.
Formula
Constant.
Value (dim)
0.07
Source (see Recommended Changes)
Current
1. Dean Hackett, Salem District Bridge Engineer. Recommended
1. Establish new activity codes for each of the parameters. 2. Establish a data base with the following fields:
- Activity Name « Activity Code - System + Bridge Identification Number » Cost + Date « Budget (Construction or Maintenance) » Bridge Condition Rating + Bridge Condition Rating Date
3. Activity costs are to be recorded on a “per bridge” basis using contract lump sums.
Spreadsheet
N/A
184

Weighting Factor for Repair of Abutment (WFRA)
Definition/Assumptions
Is the fraction of the total money spent on Rehabilitation Cost of Bridges (RHCB). Other elements include average costs of repair of collision damage (CRCD), abutment replacement (CRLA), pier replacement (CRLP), and pier repairs (CRP). The sum of which ts equal to one.
Formula
Constant.
Value (dim)
0.14
Source (see Recommended Changes)
Current
1. Dean Hackett, Salem District Bridge Engineer. Recommended
1. Establish new activity codes for each of the parameters. 2. Establish a data base with the following fields:
- Activity Name » Activity Code + System + Bridge Identification Number + Cost » Date - Budget (Construction or Maintenance) - Bridge Condition Rating - Bridge Condition Rating Date
3. Activity costs are to be recorded on a “per bridge” basis using contract lump sums.
Spreadsheet
N/A
185

Weighting Factor for Repair of Collision Damage (WFRCD)
Definition/Assumptions
Is the fraction of the total money spent on Rehabilitation Cost of Bridges (RHCB). Other elements include average costs of abutment repairs (CRA), abutment replacement (CRLA), pier replacement (CRLP), and pier repairs (CRP). The sum of which is equal to one.
Formula
Constant.
Value (dim)
0.14
Source (see Recommended Changes)
Current
1. Dean Hackett, Salem District Bridge Engineer. Recommended
1. Establish new activity codes for each of the parameters. 2. Establish a data base with the following fields:
+ Activity Name » Activity Code - System
» Bridge Identification Number - Cost
«+ Date + Budget (Construction or Maintenance) » Bridge Condition Rating - Bridge Condition Rating Date
3. Activity costs are to be recorded on a “per bridge” basis using contract lump sums.
Spreadsheet
N/A
186

Weighting Factor for Replacement of Abutment (WFRLA)
Definition/Assumptions
Is the fraction of the total money spent on Rehabilitation Cost of Bridges (RHCB). Other elements include average costs of abutment repairs (CRA), repair of collision damage (CRCD), pier replacement (CRLP), and pier repairs (CRP). The sum of which is equal to one.
Formula
Constant.
Value (dim)
0.01
Source (see Recommended Changes)
Current
1. Dean Hackett, Salem District Bridge Engineer.
Recommended
1. Establish new activity codes for each of the parameters. 2. Establish a data base with the following fields:
- Activity Name » Activity Code + System « Bridge Identification Number + Cost + Date
- Budget (Construction or Maintenance) - Bridge Condition Rating + Bridge Condition Rating Date
3. Activity costs are to be recorded on a “per bridge” basis using contract lump sums.
Spreadsheet
N/A
187
Weighting Factor for Replacement of Pier (WFRLP)
Definition/Assumptions
Is the fraction of the total money spent on Rehabilitation Cost of Bridges (RHCB). Other elements include average costs of abutment repairs (CRA), repair of collision damage (CRCD), abutment replacement (CRLA), and pier repairs (CRP). The sum of which is equal to one.
Formula
Constant.
Value (dim)
0.01
Source (see Recommended Changes)
Current
1. Dean Hackett, Salem District Bridge Engineer.
Recommended
1. Establish new activity codes for each of the parameters. 2. Establish a data base with the following fields:
» Activity Name » Activity Code + System
« Bridge Identification Number + Cost » Date - Budget (Construction or Maintenance) - Bridge Condition Rating - Bridge Condition Rating Date
3. Activity costs are to be recorded on a “per bridge” basis using contract lump sums.
Spreadsheet
N/A
188
Weighting Factor for Repair of Pier (WFRP)
Definition/Assumptions
Is the fraction of the total money spent on Rehabilitation Cost of Bridges (RHCB). Other elements include average costs of abutment repairs (CRA), repair of collision damage (CRCD), abutment replacement (CRLA), and pier replacement (CRLP). The sum of which is equal to one.
Formula
Constant.
Value (dim)
0.70
Source (see Recommended Changes)
Current
1. Dean Hackett, Salem District Bridge Engineer. Recommended
1. Establish new activity codes for each of the parameters. 2. Establish a data base with the following fields:
- Activity Name - Activity Code + System » Bridge Identification Number + Cost ~ Date - Budget (Construction or Maintenance) + Bridge Condition Rating » Bridge Condition Rating Date
3. Activity costs are to be recorded on a “per bridge” basis using contract lump sums.
Spreadsheet
N/A
189

Weighting Factor for Repainting (WFRPT)
Definition/Assumptions
Is the fraction of the total money spent on Minor Repair Cost of Bridges (MNRCB). Other elements include average costs of deck overlay (CDO), cathodic protection (CCP), patching (CPCH), expansion joint reconstruction (CEJR), bearing and anchor bolt replacement (CBAR), drainage system replacement and repair (CDSR), structural steel secondary member replacement and repair (CSMR), concrete diaphragm (CCDR), and deck edge repair (CDER). The sum of which is equal to one.
Formula
Constant.
Value (dim)
0.14
Source (see Recommended Changes)
Current
1. Dean Hackett, Salem District Bridge Engineer. Recommended
1. Establish new activity codes for each of the parameters. 2. Establish a data base with the following fields:
- Activity Name « Activity Code + System » Bridge Identification Number » Cost - Date + Budget (Construction or Maintenance) - Bridge Condition Rating » Bridge Condition Rating Date
3. Activity costs are to be recorded on a “per bridge” basis using contract lump sums.
Spreadsheet
N/A
190
Weighting Factor for Scour (WFS)
Definition/Assumptions
Is the fraction of the total money spent on Preventive Maintenance Cost of Bridges (PMCB). Other elements include average costs of expansion joint maintenance (CEJM), parapet guard rail maintenance (CPGM), sealing deck cracks (CSDC), and spot painting (CSP). The sum of which is equal to one.
Formula
Constant.
Value (dim)
0.13
Source (see Recommended Changes)
Current
{. Dean Hackett, Salem District Bridge Engineer. Recommended
1. Establish new activity codes for each of the parameters. 2. Establish a data base with the following fields:
» Activity Name » Activity Code » System » Bridge Identification Number + Cost - Date + Budget (Construction or Maintenance) + Bridge Condition Rating » Bridge Condition Rating Date
3, Activity costs are to be recorded on a “per bridge” basis using contract lump sums.
Spreadsheet
N/A
191
Weighting Factor for Sealing Deck Cracks (WFSDC)
Definition/Assumptions
Is the fraction of the total money spent on Preventive Maintenance Cost of Bridges (PMCB). Other elements include average costs of expansion joint maintenance (CEJM), parapet guardrail maintenance (CPGM), scour (CS), and spot painting (CSP). The sum of which is equal to one.
Formula
Constant.
Value (dim)
0.13
Source (see Recommended Changes)
Current
{. Dean Hackett, Salem District Bridge Engineer. Recommended
1. Establish new activity codes for each of the parameters. 2. Establish a data base with the following fields:
- Activity Name + Activity Code - System
+ Bridge Identification Number + Cost
« Date
- Budget (Construction or Maintenance) « Bridge Condition Rating - Bridge Condition Rating Date
3. Activity costs are to be recorded on a “per bridge” basis using contract lump sums.
Spreadsheet
N/A

Weighting Factor for Structural Steel Secondary Member Replacement and Repair (WFSMR)
Definition/Assumptions
Is the fraction of the total money spent on Minor Repair Cost of Bridges (MNRCB). Other elements include average costs of: deck overlay (CDO), cathodic protection (CCP), patching (CPCH), expansion joint reconstruction (CEJR), repainting (CRPT), drainage system replacement and repair (CDSR), bearing and anchor bolt replacement (CBAR), concrete diaphragm (CCDR), and deck edge repair (CDER). The sum of which is equal to one.
Formula
Constant.
Value (dim)
0.03
Source (see Recommended Changes)
Current
1. Dean Hackett, Salem District Bridge Engineer. Recommended
1. Establish new activity codes for each of the parameters. 2. Establish a data base with the following fields:
« Activity Name « Activity Code + System + Bridge Identification Number
+ Cost - Date + Budget (Construction or Maintenance) » Bridge Condition Rating » Bridge Condition Rating Date
3. Activity costs are to be recorded on a “per bridge” basis using contract lump sums.
Spreadsheet
N/A
193

Weighting Factor for Spot Painting (WFSP)
Definition/Assumptions
Is the fraction of the total money spent on Preventive Maintenance Cost of Bridges (PMCB). Other elements include average costs of: expansion joint maintenance (CEJM), parapet guardrail maintenance (CPGM), scour (CS), and sealing deck cracks (CSDC). The sum of which is equal to one.
Formula
Constant.
Value (dim)
0.04
Source (see Recommended Changes)
Current
1. Dean Hackett, Salem District Bridge Engineer. Recommended
1. Establish new activity codes for each of the parameters. 2. Establish a data base with the following fields:
+ Activity Name » Activity Code + System « Bridge Identification Number » Cost - Date + Budget (Construction or Maintenance) + Bridge Condition Rating - Bridge Condition Rating Date
3. Activity costs are to be recorded on a “per bridge” basis using contract lump sums.
Spreadsheet
N/A
194

Weighting Factor for Superstructure Replacement (WFSSR)
Definition/Assumptions
Is the fraction of the total money spent on Major Repair Cost of Bridges (MJRCB). Other elements include average costs of concrete beam end repair (CCBR) and deck replacement (CDKR). The sum of which is equal to one.
Formula
Constant.
Value (dim)
0.22
Source (see Recommended Changes)
Current
1. Dean Hackett, Salem District Bridge Engineer. Recommended
1. Establish new activity codes for each of the parameters. 2. Establish a data base with the following fields:
- Activity Name » Activity Code - System » Bridge Identification Number + Cost » Date - Budget (Construction or Maintenance) » Bridge Condition Rating » Bridge Condition Rating Date
3. Activity costs are to be recorded on a “per bridge” basis using contract lump sums.
Spreadsheet
N/A
195

APPENDIX C: MODEL CAUSAL DIAGRAMS
196

Evaluation Subsystem
Widt-SSHd
S .¢ Worf
SWiod-SSHdt »
(ores n
Se ee
wns
y TH ud
apurd~ Neanee red
. One)
AGI wal
Manabi ntragyy
ues agate
eo LS
T .
- .
, OdXTaL
‘ “A
pewnosspuny Pngrneds
a fr
(wt
ANH vane
3Shid
4a -
weniney
PASRUPIOL
AM Sy zon
HWE
ddXx- oH
HZ
“---
SWG-Mu014
a *
GnGW
ws, ,o
ag ‘
: -"
napisy "y
Ae cant
(uma) 7"
- sourvat
pewnosagq sungppuad»
3 t
é
$9 WORICY
FOI
aE lena]
+ =
e Jy
Ailey
a Inypuady: WERE IEIOL
AAH papuedxy
iad Weistyg
7 =
Dmog Tenuds,
. ny
<3—_—_____>
aingpeadxy IEW
(ur q)
e wen
ined GaWLH
Hada Sd
qt foerbpy
=! WHOH
cws-ssd '
a =
QGsW1
TL
yroshug ope
we 8
ld ’
way genes
Ba,
s Ass)
' =
“« ;
¥ ~
4 prions sn
- 4
WdHT ot
woes .
asig
moe
Pawns sipun
ean pueds
3 y,
v
! TOTP SP
at
SSN wor?
-@ i
aingpuadx3, ampnyno}
(ug)
HYP g S05 YUN
Wa ~
sETBODY &
->
Sait
”
=se Arense3
inn
HELO) LAH
punodun 9
ss unued
$909 Bune
ad au A
ae
ie
%. mom
ONaol UNSOH*
TTT?
89099 wan
AOA iva
VM Hayes
47 ‘
- a
LR Wal
twoueey .
. .
T
(va) .-
N :
bk
popinooag '
. (gr
! eit
‘ >
: a?
. 1
NM peu An
amy nner
ime
+ Wyop
ARH
OMY bUOIa
ID + (amang
” aAN
€
ere
qyq° ‘
AN & 77 TTT
tyr -
gare rt aoL
Q39H uso
A dnoou
<7" SSNg
woL4 ‘
’ +
'
. a
t “.
4 Paynes
qiso 7
2 .
ay mL
oS
trae
SSNs ators
‘
' “Gnoo 1a
wos
ww-e
nee Rew
' ssast
ig i
+ QD0TL
BAAN
wee
eee ee
“bs
ig 2
r ae?
vse,
Pahoa.
a 1*
wm
Mee .
1 -
a
en ¢
a GOTH
rece
° * TT
te me
wn ig
. ea)
Soak
widu9g
WSN
UON
ARG
Ie sy
pownetacun
_ pPawnesse
an payinor
ag *
4 alf
= =
a Nagi WO
NSAI
NT
! NAAN
(onuyg) ea areca
Naann
4 .
+ a
LOM,
' Toren
+ Tal
. -
PHY CAD
cd wc?
“.
; Ysid
¥. Jf
SRaTEmBENG >.
| .
a YS!
¥
.
Cw)
Cutyg$) ‘
-. *
peu
deal UeN [Poul €or ece
.! —
<€~ ssid wor
auaAg masala a
+.
. “.
repriceag wee
SANS
ee es annonspur
Ra me
= ssn
wos
I 7
‘ ?
f owe
ot
SW
. a
og
JASN’
4 « 27 4 NSN a Beeee
eon tenga
© wer
ypuag
s9sn fenauy
t.
x 7
1 Dead
pewnes 4q)
‘ ma
7 Paynes
spur ™.
~ :
(Han) 09905
7 -
‘ se
’ MO 4 BANG
Nadi wid
4 eioraey
cer Nagano
wee Pas
Cd *.-
(MID =
eS ~ ii.”
tl”
“..
: ag
ULE [BAIL
~m,
TIN
we”
~ =.
. Cap
ROESIEY EOL ye
VOLS FAS
Tw.
? x
i .
. Sa
oo” we olitee
we. SUAIOL
MILs
+ aie
eee
aot
- --
: 7.
’ 1
’ mh
~ ;
. ‘
Cupey an)
pears gs Fas,
joer, \
l ‘
7 Tas
ard) Leg
1 rang)
dul ‘a
eounioud +.
ee
ee
tea
UTD
A Haug)
enna po ee
waias ul
dal] 1344
warty) PHF
pa ee
+ ee
LLdO
IM LA agnastenin
inzy openienuy
Ow
Lianne painariiweiy
sn PUI!
FBAE UO
Rey TITER
% tae.
‘ an
+ st
LOA
TS LOY
. ~y
SHETOD
earstaad fay Done y
aur
oe '@ra
OWALOL
7€ Le
a
. s
sR
BY .
£ )
. Sd
(Ops a
pagytiaan 1U9
[BATT {
* ony fuse ari
de ‘
os —
~ WANT
Fe Ona
' A
"yan Launop Amon -
dl AA
. 45 O71
ryan awnycn MCL
+} ss
~ #
, Al
ayy bs eau
awed! {
t AHS s wer wert ene
, a---- yh ------
Aue
qienuny ony
+f oe
4 -~
a ;
GAIA) Wolom
y UctssanuU)
JAll
' wae)
. *
.
hurd
LIV
6 GAMER?
pun
peniaiy
wae Br
Ouse 104)
SSH
urorg awrtes
Chea
ones Qiedeg
inpey «
DUM IP OELL
JoOAY ome
OAW eoee SAA
REP
eat
de feed a-- SHVGASSHa
¥
=_
71
fenucg ony
dv °
DAY
SWdSSHgMorg +
bY LA
3sOm
(SSAZ) tiajsAsqns
uoRnenjeaq
197

Financial Subsystem
(wi! BOP.
oF paBpng
jumpy pry
wo}:
fswa)
Qylyd=
| sAsgns jeshy
Of «
. ae
(unig ~s
we TOME T
E
Sct ah
pig *
rugey ‘
=anu
OUT
Lys ee
a
jeden ToD
GHVH *
SSHkd O4
tpnq
sycvoqd ply
TO”
wo:
me
ee ee
CVTIAL
t
4Aao4d A
' se
‘ wou
fungt wee
~~ .
Wal TWP
ES 0}
FA
WES
OF ¢
; Se
wg
waAe sw
ator PAR
awe mt
~. 3
Istorg WPI
erS jobpng
Neves Red
Waly Wale,
yelp pAUpUE
SLAM ~
a pera
rn
mH gg Lk
TVeqey
Se ee
ae m
\ STA
OS
%
rt
Gea
{ SAWH
Y.
+ fay)
1 yg)
- ~
aot
7 ,
Yes
ly gy
era I<
- 7
epg atid
Pruiduyy ui petpng
yonsjqe4 J ARH
eng ae
Hs
ted 2)
| ~
~ wee
ee ee eee
a i
eee
‘Wye eee
ee eee
\Oyyu<«ae2
ct crc
AHa4
7 PADI
<5 bie
>! AIH
<4
fag
CANH "TPL
(eq
(uigy
wae weg
pet, OTS
“
fewybiy .
dP epee
Noe
_
span Naku
sais -
DIRS AFIS
Ped
Del
Why
‘ 1
ads
WAH
A ¢
WHOL
‘ TT
reds
7 PopP
EG
4 7”
A” ~
. y
Sang CMW
PE.
HLS ort
, *-
pecs ua
ve ;
“A, '
Hays “Ou OR
1 ae
CHYd
= '
- "
PA SHR
SIPS, t
pur. uo ered
PUR Lae CeUEK
Amal] Cad
pur ysnuy
uowuedt ey
' PRIME
Ld yap
1opyE PE!
1 ratty
er ony
. +
l El so 7
aes
MASAI 7777
geocttt o>
OW oan
ns wy
dll fier
rete
Bebe: eh
. -
' -
(ang) eT
fv
ee
v4
’ Lis
AR
DINH
Cp may acuacy
’ vs
own
‘ tug
WADE
PRY Lo”
a
-* ‘
dhs bag
BsuRCTy “
- 4.6
ARK HATA
eee
rcrcccccc wire
e ee wee LLL
‘
UBA JO~RY
Red
Lae ;
~enne Ls
IAW -?
' swan
a
7
‘ '
7
- cal
’ Cat
‘ vend)
' Gp)
-
oun, meee
rays) <w]
9904 Cate)
| aS
“ey Ory
(a. Je Guneygs
Wy, yy
wey
«BL vie.
2S
TOP
191 848
y YE L
AaNY 10,0
FL NG eGo we
OF THES
BRA Be
pervert) o8
f vauet|
B3u----> 199
isms coca
Oa oe
myn wen mine, — oo = en LTA
+ IN
Vo
ALS a
A ane
LS AW
LISAWA tog
AW
WAAR °
' \
. +1
.7 '
' -
' ‘|
~~
t ’
‘ Bon
' .
Larw a4)
‘ ‘\
ruta ‘ne
‘ ,
muita: Patina
at raid
yeu eee);
ahd mea
t ’
pase! Ta
Peony y
ey pa bepate yg
tay ’
uo gereyg ui
uo eit 4)
riaBin espe
ied
oie '
; potore,
id
" . SP,
sO aTNe
Ong >”
YING
KUL ’
A MAI
f 4 4
youu
et
ccnp Pap
pty
. "ses
AL “sce
. .
\de
‘
i ‘
7 OIWA
AAAY
; ANAL
a ‘
ae AMMO
AddINO
I '
j ‘
A.
' *
4
a fintg)
+s
_ A
ye, we
=?
[DLPSe TEST
SE Stare] “Tevet
. +
cuban jo
a ;
«ft +
eoeyer 4
Cae) uo
‘ ‘
sour nideg e
Ce em
WUesI3 4
wale obeys
tad payanery
‘. t
aypnyag Tana
-. riba
we
Yee
7 TR
ae tag
ea .
‘ ,
wes be
Patt
a
Tucneinde aeded
+ 39
CVA Ny
. '
a woupinde.;
WOE Dg
> A
-
A ¢
i \
, ’
went,
Bae a
+ y
Acd
: ——
+4 wa
. :
’ AS44727
Sd "os
4 :
e
' BIW
WU
vai Lament
wan
‘ :
et!
' YRteld
[en T
RIGA
ot a cuba
‘wit -!
7 Caste),
t) Otw
YEP IH PTI
3A
perepatws yeris
un .
va erat
A, yo 7.
' 4
PUB fb
YALE 4
' HonvA
see eo
o> oh Al!
frves Fund
sey ured
-" '
"w+
OF ede
ay uA
. Te
. !
H y
. A
es nar
ert
1 al
. my
a AdMI
Ad >
ASE Ada
’ wal
o?* ‘
¥
1 é
, =~
ae +
} ,
ee a ie
ewe me mee
ee
wee
me ee ee ee
° www
eeweew
wee
ew ew
ew ew “EF
FP
ew were ee eee
a
A
(SSid) WarsAsqns jeoueuiy
198
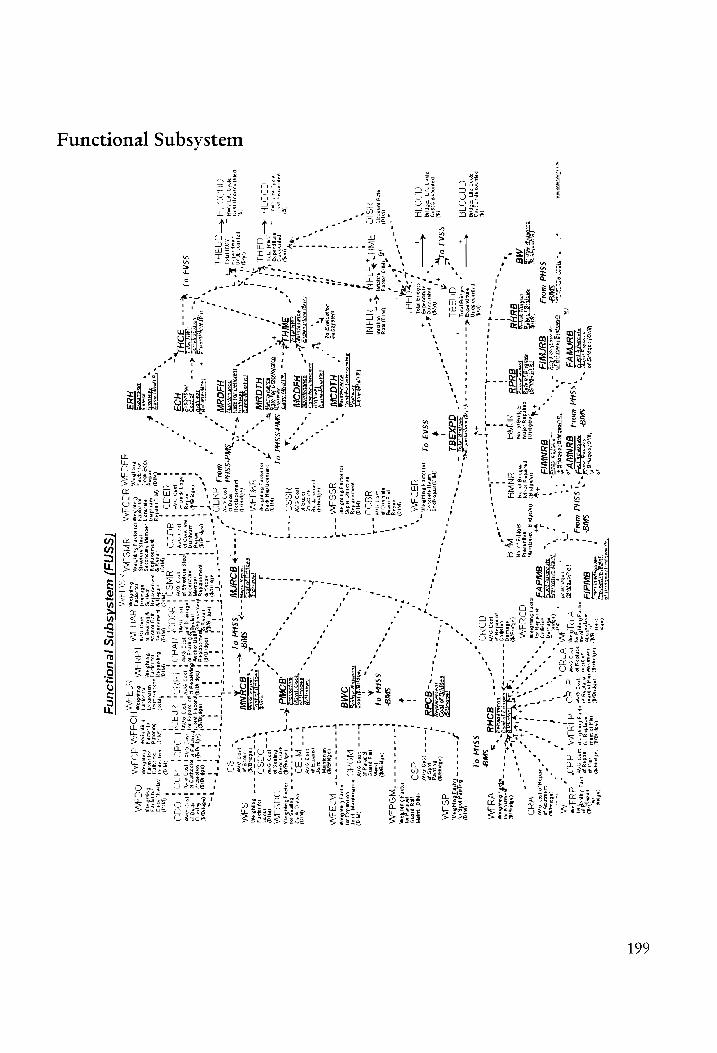
1d WE AT) LAE?
IO (atins
so . Fe
yuma Krag?
(abp sey)
CoSprmyeg) COANE
tang) s9beg 20 Id)
sobre. I
4 jo 1a
ngie ree MAIO
WEG ay
wr dn 36) =e
.oley ow
Saige
Sueray mid
4 sSWwY-
1 SNidi4
narca
ie yO
usu
MORITA
aomday
oy acday
pp |
e Ow
oar
7 aFime
ed
“1 SSHd
Korg
t ope
dang a
aseidey jo HOD
one MRE SMT
azo aay
HEL ONC
T, aN
ata. ——L
a /
- | GMM
«SSH OE NM,
_ iaucctng
VIMO
le iy
GF IMIAA
da
detom 4
STKE AISIEER
AI an
' BP.
IG Aw
- RATA
Sig eM.
me BETS
; oe
an TSIRSB A
B) 2b
& oa
, 4
eee,
( wa,
vila
‘ !
: :
2 fe
Swrg-
z -
. we
ET ee 8
‘ VERSES
eee "
t -
(bola
, BuNGId
8 Stamper
trig .
SSH
tory Burwis
. BYNMIZ
“y J
Wd de RS
' a!
ardoylo jo"
how SujeauneS)
TG gb
wt ‘
ny ’
3
5 eee
sacnna Sat
_iayesseua! —*
Mepopua) GARB PLA)
AAyabpuA) Dou RUEKY
for 1 Sum eam
’ Wao
Balun i
abe
SAGA 5
Ate, SABPBIOATPY
paurday sore
pevedmy icuyy
anuans ig ADAM
« 7
Ma
aH
fuses ce
oR mopyqio
on mipugya
ay ROplai2
ON -
: Vie!
- -
-
. H
Gudd rw
YNKIa Va
“deo nA
peurie’s '
7 ween
ae
= '
' '
' wee
° jonedon
Toqauwavyay ~ s 1OPTT j OuyyBs aan
TT eae
4 Jopoenc
ner”
W909 DAW GOH
Lag
VaIM 5
es i
Joyo 5
pep ant meena
peninos spun ty
: SSHd
O4 q nyac 19
—_—
enupundyg Bee ee
ee wo HQ
ALAS
_ é
wid) Iho
+ .?
sol png
[FOL '
oe Oy
4 MN
.
oe
oe Brug
pdg
104
a? ansel
ee" OdxX38L
ir
* ;
Kee Payday
~ 7
.
wy SSAq of
af
wer"
: or
“oy
rome
‘ (@Opeagrg)
dSaM
payinorn qisen
. og)
a
¥ Gnas nedaypug
ae
fy Tr
sll, meee
buyued spA
cu peprcoaty
” Print rerros]
7.
- Odd
Hngg P
apr un
85g <_<"
amapusda &
+ SSAZ
OL soprowe
{Cuba
_ “a
GOdH
1.--- 1509
Sav OIA
+ #
stOpug iol
. ‘
t (red!
we
‘ ‘
' 1’
dSO
IY pens
44
| '
° !
, eon
my wor
, '
on
¥ 1
1020R
4 Bu Bang
227 oe
‘ pot
OO WIM
- ~
(wid) ah
“yaqiiase 4 Cunt)
Bae ay \
' we
. swe
' Capra)
ary wnot4q
ayy >
> YRC
ag NORE WA
wor onw
og |
-. SSHd
04 1
huew SIO
+ eyry
1 ~
Tey PRE
SI. SAU
SaNE + ON
yago7 "4
4 [|
tmgpm ‘
‘ é
cry '
; h--
= $509
OAV Gata)
wawaneyde
1 1
“~. sOUPU
AEE
PY BOT
\ |
: ampnys
a ane
' a8
1 A
Oe ie)
uuisugdx4 m4
' '
u .
10g Ope
J Ouro aan
4 pe
I wipe
4 Bu
bang .
~ 4
“ edeg
n ao.
--
1 .
crcsctcct
5.
; 1
Qe woiais fears
‘ YSSAaM
‘ '
.. :
Cotpuars) ASM
‘ ‘
rd »
‘ ’
| t
*. '
UE USRULEWY
. '
3 +)
-_ ’
CaBpugess '
’ ~
' ‘et
: - We
. watia verlag
\ +.
‘ .
oy oe
a
Jussyeo
JayFEOD) 8
. au
pone ‘
Py .
1 ‘
I? Bam pues»
~- SHER
™ \
wang fo
' pom
.. I-
- wwia)
‘ 4
aa SSuevaviegy
ge HACOY
-~ x
1509 ony
1 1
*.
4 Peg
pag
Wy et
~ ‘Miitol
“ay HGQr)
---4
' *.
wm
em
Purrag 5 ‘3
wag) on
SWHLe
we
IEDR SDED
wo.
' t
. sow 4
Capi Deon, popnoran
iso rpeaseg
tn yok
teat SAGSSHd
Of '
' a
OOS IM
aK eb haus
4 <add
on BEERS
7 He vata}
' ,
= NV
QacqH
SAGA PIE
' '
' ‘
‘
Bau
ay
a
jue uas
rr day Ag
3 i
‘. eon
wk
ren «
CSHL ¥e
\ ‘
. HiOGuw
\
op ope y Buy
ean '
J .
losiqor |
mot
, ‘
~ |!
HMA
---+
[ a’
7 Taber
7 77
Bumabizan ‘
. igo
see o
4 he) 4
i ‘
‘ Tre
“a (abpagegs
i Tao
— —»
SAND e_sne2s
#6 SAA
ts04 payne
aun oe,
* ‘
‘ i
wauiaceysay on
ae> SSH
Of y
159 OF
paunoo apy riise4
wingpowd <4
a ‘
YOST
TOT RY
34
wan
t “
goarw
Ss .
a)
ADI
MH piel
Eg
DOTNUE g
BASSHid gPIP
2 =
: ‘
e wi
oe we
PTS T TTT
“ss
- me
TNIOH
€ SASHL
. :
HICH
’ aor y
AMD
2 owe eee
; rcs
r“ro.
\: c
--F ro
ee
| Osea tt
ager to x,
+ ae
(ate ass
i He dB
sb atbuaygy
§ sBprag ‘
o ‘
we a
' Wourgondey bewarnds
Won jouzue
' (tie 4
yd SPrgLE
CoOpryrgy |
yoyoapag |
Agee
Puig
sag Aguieday
P poisedug
of Fd
mipowed eon
PSO
Functional Subsystem
SSAB OL
---- Sat
x
PART Arges
\. _
aR GEL qo.
te page)
(afin
a7
1 1
ab
8 uenderq
ed ta ' i) ‘
AR PUOdES .
buyers paBeine rg
rt "09 ‘aN
yso9 aay
HOD OfMy
br OA
E500 SAY
EIST D ene
ft ' a
t tos
mney ir
“yaays BINjON AS 10
t \
, "
” Oy eee
e Bony
Wr
Ory | Met
aya
' tddry
ra
| (adit 4
\ Odo
' =~
YCboo
’ Oy,
Aye
1 I
1 4505
i 7
AAS
4 1
a 5)
} >
' cad
1 wea
t wid
Wd,
ty wid
trae
(ed
dyad vig
duedan edey
sp ede ey
wmuvredey —
Ougueday into
Agperg weg
peda Ur ded |
MRE MO
NLT duahad
wines med
coed OE
abpg ad
aye m0
7 LPAI
Fe DUC
8S be oe,
eee
SHAT aun
tops]
Boa He
Guy braan,
THETA
eo
plrghamene
ye
4 yer
oon LUMA
Susutom es
Ogd4n
FT
OR
ee NS
pupitroan AEA
yp gag Hodas dod
Hash HID
AAISAM
ying ns
/
(SSNa) warsAsqns jeuonoun4
199

4
foro tp A
FB cbr
ep ;
woe
ye ys hasaanugl
BAT AEP
E a 1599
: 4 gousriee’
tA £
aye
. >
G5
ut soln
sadaig
70 ary
n Ae Oy
_ deedbe as ey
= gerbe,
buy sunny
- tu
i Lote
8odY---->
sate
nn. o aay
a ——
” Gud
sz SR
(14h $3800 Je
, 7 Bana
<
“7 aot
* woe”
% TTA
ybonrg '
cried
1 .
~ anuned
7
\ +
‘4 1
” e
weer,
' *
-~
- qeewesh sey
,
u Tse
t gcrtias
4
\ ern Sd
As
- wl
daddy
.
, '
~ “ye eg 7
Csetpig) '
a
~we
= 7)
.
’ 1
cA HIG
In AP y
worpYOD
Cow) “
s meee
~eaer”
- 1:
.
3 .
: yea
bpog Uefa
ds 38.9 sn
OM aS urse
ees
Tat eset
pig) Set pug
» ey
a
; !
ryan
7 snd
ape ung
eS
SSHH
OF} dni
aide tna
' '
‘
' vetpngeery
oft aucsv44- 37525 2+--
wee spy
oll
Jac hbapeu wa
‘
c /
AHA
; (abqa)
Tae SPATS
ciintene rg ‘
‘ UoRIPLE>
j09, ‘
5
1 {
L oe
Ui sao e
mg
| '
dHddW4
\
’ :
‘ ‘
*, 7
meee
el -
‘
=
' S23 tpg
onterg ‘
vow wep
ie) w
“4
“TTS
ae ee,
(xP pag) ?
‘ —
- ~~
me
. f
Jeers
)
’ sted]
y to(E Wl
‘1 aEnbapyoury
oe Tass0b Bug
car Sm
UUIBPUO JeUy
1a. 4)
rg
I!
1 -_>~
aT Dapy
oun
. UL
Sa Bot ge
aenbep ‘
wo 19651 @
>
; ary
. eh 4a
—
Ll --
REWBSEE
Tay '
. wieder
wwleya ‘
~ °
—
’
\ -
c l
"BOY
ee
_ >
a wwe
apeu FY
‘ ry
oo
sOd ID
-* é_
\
Ms.
t.
! Barna
Gaarvig S77.
4
See
=.
hk vay
' rf
~--gsdepiayt oor”
SSI tory
ssityos --
t peace”
‘
q
4 enBpug
10 BUY
' SSNS
OL Gg
7: Cas
waka capa) Py
4 .
‘ ’
wv '
Uni a) sata
90 FORREST
8 PRLPIBA
Ty '
sal pug anf
wget. Sas
gposie ne
' ‘
a“ oenbepy 2)
ioe (Rrbope
ras
sone. 2usyas] Maritain
uiey Toy
Garg) ep gon
'
i a
aoe EL
8 Di
rg ew eh
ee ee
eee eee ee
eee wd
’
co 1
oy Eph
g werd OAR Ys
' (saB pug)
Bee Fg
Ivis ‘
niephapeul ‘
' ase
44
i t
vu ppuun my
Hirty
* lpn
iaeng '
Y
: i
PTT
if tte
ip wee
. ‘
sy
I
uu ig
--.._-_J ‘
441s '
on
' seBpuig
go gs Spng
\ UuMmpHuny
wey 5
; (
'
e
' ar day
OURY genbamy aur 4
_, bITU7888
78) S8bpg jd
— *
eratiprgycaruss uy
’ Cy A$)
2060138 Jo
! =>
murnbapey > ing
". ul sebrna
| a
Seng
OORT BTR? Te)
ar nbapry) 254
rebpng '
Soy
ee"
gaan
-.. O4v4a
—— Pe
eee
wnsmteg 4”
nestor ‘sn
, ae
GuNWVd g
BUNWId —
, chaciy 20h
i —
—
- _
@ ty
Ae bot
. SYN
aaa +
UNNI e+.
>
7 ~
t i
“ene
ord
‘ ‘
Vv tA
nas
“+
wee
~ f
7 re
sae 4
Utot em
wae”
V+
™
' trig \*tes@
9 qeday
Oi asseBpri
ve Dpary a
! SSasCd
S54
q SSA TOL
To Renee
re ‘
Y
t aye ribo
ny ver a
Senge
au 9fe 1
ye 0
Ob gaadp
np '
1
sung ony
Hpr@ peg
ap Hr bepy
aw
Ko
- seins. ey
Myer ete]
t 7
*
feeb 4
IKAET saépriq
po ’
on :
a uhv4a4 ahd
aerbenvar sag
ot My den nary
“so
1 ‘
\ UqpoUd) DoOS
awnbapruy vu y
1
~
1 '
; UF
SABpLG se
op boom eed
1
° wo ’
— gunida
aabicu
!
' fasi¢ratppa
yo potpn
< Ww
ca
1 qUER
Dae em
i “
“Sy itauy aneg
° ty ag
iy
i ae
BeNbape ony
ay aig
ob dg
atpugie ytorg
1
ee
1 .-
1 i
; aU
UIEBY PANINI
1 ’
* Gale fe
aay 4d €—_1___
i f
ayenbapeu; oung
4 1
EG iy
mae -
: aad
Sos ie
FOpING ay
ows TUsERY
4 +
.
i '
oe “ft
Y
303 3.1914
arnbamy ?
Neay
na
-7
“ '
-? a.
‘%
oun
gj .4 RopAK
pet mee
meow
ew eH”
ston
oopsgo
we
1
.
-
a |
NEVIS ong
ou MELTS
1 Panel
7. Ssnaes
' .
(wag) wig?
aye y
ain sods: weer ewe eww
we
l Vsate
sy
ma
7 cwiqi saba.gt-20!
pg
epg
fabpg ' F
die nbagy oun
_—
(1A) #8
one
jo aie:
a 40
atta eee
|
“5
@ poog
Panasarg at
1 auRL
cng
an
anguarasy Mend
speu ,
A
' feed eae
seu Ries
; GtAwde
4 -- got
A
‘ ‘
aenbapeul ound
Wet our gop
Opn WED
4 '
Q
f Ff
\ 1
= -~s-wee
4
1 aay,
gk
Boa aaa
: 7
¥ >
Gels s
adidas
:
=
\ ..
\ .
‘ 4
patie
ber ‘sy
1 8
e wid
'
~ was
t uepria © Op
iy wuspuip
ou '
SP) ‘
eet”
“Ssqaen _-.
oe
' Seren
nen ele
er ------
epnaisert ’
dc
““a
pa, ‘
‘
—_— ‘
(28g Eg
éabpud /
Ber bapy tatue
ant rat
W Whecna
uae so
> pantyig |
MOGI
,
a
‘ «
itvdd
.
. Ut
saben
+ I
. menbapre;
vung |
Hy
OF ,
5 *
~ .
ns em
Pic
ad
cee wes!
“tego
mal Og,
RB Pg) eaGpug
jo SevjGg~
. af
. om
aficug #
;
=
: '
ah y
asua 1-8
ayy .
=Alsg
'
7) .
W1O--- =e
Ayn ;
_
ee ;
s \
SM Le
wee eee
ee ef ee ee
ee
ETRY pa
,
(gsod ee
Cap aeeEs
a! we
‘
c
Me ee
ee eee
eee
’ TSCM
BE PUBL
Eee Prod ‘
wet
te rw ee
ee eee
eH >
SSATOL
4-
> Fg
* wm et
rw wr
eee
ee ee eee eee ee
.f*
Cy (Ss
m7 ab
SiINa- SsHa}
asds juawabeuey
sbplig (WazsAsqns
[eB atSAUd
200

Physical Subsystem: Pavement Management System
Pha ed
mae et
ee
ee
ee een
re eee
ee eee
eee
a
é
e
é a f ’ 4 '
Catyy-s ea)
f sewyounae
' cc
la yowua
neue
d
ruil, Cu ieee
' ar
JAP brsypargy
in Aer ang
‘ .
7 Jd
LOH
( -
’ ~
Hid ts}
z *
~ )
‘ |
‘ /
1%
o
rn ’
' ‘
' .,
'
CU rant Btpy
yo |
. ~
é
vompua9 '
- POpes
of 898 qh ICh '
“f,
hope 4 Buns
Frey '
aon,
“
1 ’
.
HOLOAM
' '
“. TA V
E au
t .
+ ay
AeronyB
th 10
' '
t ae
Y Bue 10129339
; Had
' '
t '
t t
‘ \
1 +’
‘ 1
f] t
' !
‘ ‘
SSAFOL '
I .
¥ ¥
* '
! ‘
~
1 :
yang) FR;
' \
‘ -
stowaway
qee eed Ll
‘
s AMEE
+ '
' ‘
° (and
auED T¥,
! '
‘ Vopugn
wewaw{
* H
1 |
s ,
UWI
Us Awnaytit
‘ -_
a
a
a”
* eae ert
, te.
SdH
1 (apy DUET
ME mYB IH LC ran
I! .
1 feomy
eeutine, Ao
ft +44
' HWE
te 4
1 a4
(Mayoryg BNET)
funigMenmgfiiy jo
¥ ’
Aeneu H te
uappucsy (AS O
IA
Ot pPapoouLe
D) '
. ae
Ww
{ue 7yw qiuj
‘ ¥
\ Wyse g Aisnp
| fhe ay
SSATO!
~*
Hay
Hoda
_
- -
-
e ”
7
.
HL
(ayy -ouer,
UdIyDUE> pavarE gy
yao Ss
ui sey
ayy
3d 4SH
+ _
=» SSAT'SSNIO}
7s
-
= ’ , t 1 t ' _
‘ -
1 .*%
a.” "7
"ht -"
'
-”
i .7
‘ +
="
1 [ETA
ae
a
‘ Tene Lk
e 1
TRIES
~ J
, '
, Hea
7, a
I “ea
'
& '
- I
SSNS
OL .
ve t
SSAZO1~~_!
ema
ne yea
+ ea
(ura) Agnnyftiyg
pap tiajag
uyetpeg mew pe
Pe
2’) HLGSW
| i
u
Taare
eo ! SS
Js tong
em ew eee hee ~ se bee eee
'
fu!
Seenutiy waisued
” ee we
guts ew ped
HIG
— .
- 4
1 4 ~
¥ ~\
Ssnsot u
HAAWH
(SWd-S SHd)
Wal SAG
juatAabeUuey TUsulaAeg
:WuaRSASGNS jesIsAug
201
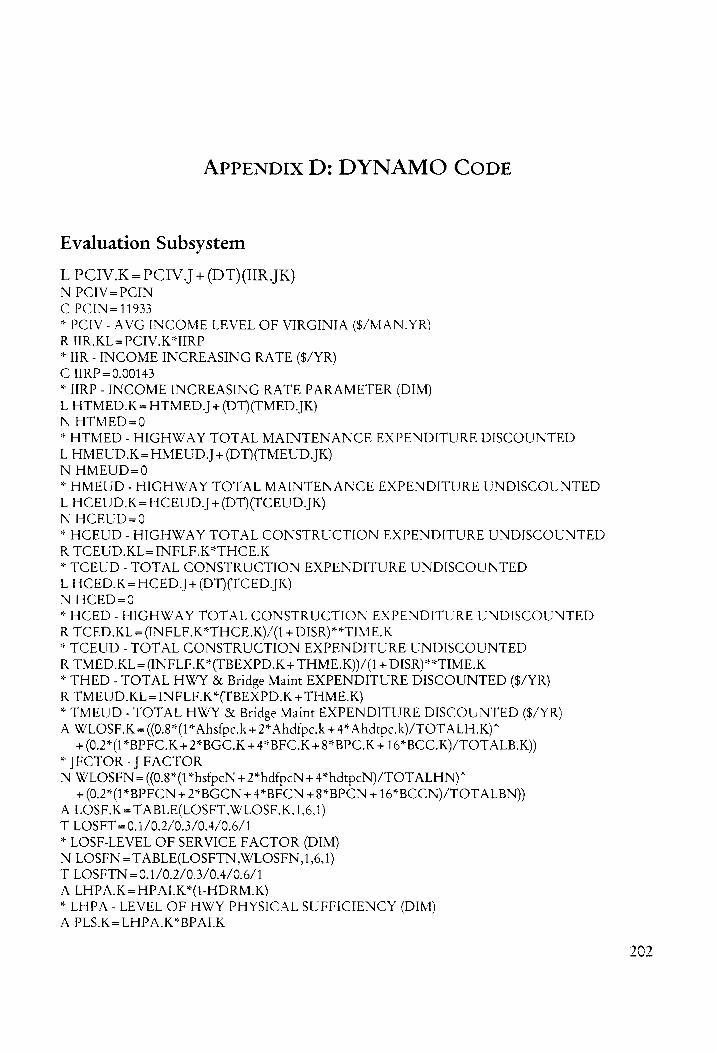
APPENDIX D: DYNAMO CODE
Evaluation Subsystem
L PCIV.K=PCIV,J + (DT)(HR.JK) N PCIV=PCIN C PCIN=11933
* PCIV - AVG INCOME LEVEL OF VIRGINIA ($/MAN.YR)
R UR.KL=PCIV.K*IIRP
* TTR - INCOME INCREASING RATE ($/YR) C IIRP=0.00143
* IIRP - INCOME INCREASING RATE PARAMETER (DIM) L HTMED.K = HTMED.]+(DT)(TMED. JK) N HTMED=0 * HTMED - HIGHWAY TOTAL MAINTENANCE EXPENDITURE DISCOUNTED
L HMEUD.K=HMEUD,J+(DT)(TMEUD JK) N HMEUD=0
* HMEUD - HIGHWAY TOTAL MAINTENANCE EXPENDITURE UNDISCOUNTED
L HCEUD.K =HCEUD.J+ (DT)(TCEUD. JK) N HCEUD=0
* HCEUD - HIGHWAY TOTAL CONSTRUCTION EXPENDITURE UNDISCOUNTED R TCEUD.KL=INFLF.K*THCE.K
* TCEUD - TOTAL CONSTRUCTION EXPENDITURE UNDISCOUNTED L HCED.K=HCED.]+(DT)(TCED.JK) N HCED=0 * HCED - HIGHWAY TOTAL CONSTRUCTION EXPENDITURE UNDISCOUNTED
R TCED.KL = (INFLF.K*THCE.K)/(1+ DISR)**TIME.K
* TCEUD - TOTAL CONSTRUCTION EXPENDITURE UNDISCOUNTED R TMED.KL=(INFLF.K*(TBEXPD.K + THME.&))/(1 + DISR)** TIME.K
* THED - TOTAL HWY & Bridge Maint EXPENDITURE DISCOUNTED ($/YR) R TMEUD.KL=INFLF.K*(TBEXPD.K + THME.K)
* TMEUD - TOTAL HWY & Bridge Maint EXPENDITURE DISCOUNTED ($/YR) A WLOSF.K = ((0.8*(1* Ahstpc.k + 2* Ahdtpce.k + 4* Ahdtpc.k)/TOTALH.K)*
+(0.2*(1*BPFC.K+2*BGC.K+4*BFC.K + 8*BPC.K + 16*BCC.K)/TOTALB.K))
* JFCTOR - J FACTOR N WLOSFEN = ((0.8*(1*hstpcN + 2*hdfpcN + 4*hdtpcN)/TOTALHN)*
+ (0.2*(1* BPFCN + 2*BGCN + 4*BFCN +8*BPCN + 16*BCCN)/TOTALBN)) A LOSF.K=TABLE(LOSFT, WLOSF.K.1,6.1) T LOSFT=0.1/0.2/0.3/0.4/0.6/1 * LOSF-LEVEL OF SERVICE FACTOR (DIM) N LOSFN = TABLE(LOSFTN, WLOSEN, 1,6, 1)
T LOSFTN=0.1/0.2/0.3/0.4/0.6/1 A LHPA.K=HPALK*(1-HDRM.K) * LHPA - LEVEL OF HWY PHYSICAL SUFFICIENCY (DIM)
A PLS.K=LHPA.K*BPALK
bo oO bho

* PLS - PHYSICAL LEVEL OF SERVICE OF BRIDGE (DIM) A VOPC.K=(TABLE(VOPCT,PLS.K.0,1,0.2))*tvol.k*totmilg T VOPCT=0.4/0.3/0.22/0.18/0.16/0.15 N VOPCN=TABLE(VOPCNT,PLSN,O,1,0.2) T VOPCNT =0.4,0.3,0.22,0.18,0.16,0.15 * VOPC - VEHICLE OPERATING COST ($/MI) * # ADDING CAPACITY FOR EXPANSION A CAP.K =CLIP(658.88*2000/(117.91*2),485.14*2000/(117.91*2), TIME. K,5) N CAPN=485.14*2000/(117.91*2) * CAP - NETWORK CAPACITY A AVBC.K=MIN(HRV.K/CAP.K,1) N AVBCN=MIN(HRVN/CAPN,1) L AADT.K=AADT.J+(DT)(ADTINC JK) N AADT=AADTN N AADTN= ((60725.*0.3*2 + 60275*0.7)*6.75-+ (25171*0.3*2+25171*0.7)*24.29*
+ (33201*0.3*2 +33201*0.7)*86.87)/(117.91) *A ADT - AVERAGE ANNUAL DAILY TRAFFIC (VEH) A HRV.K=AADT.K*WAHR N HRVN=AADTN*WAHR * HRV - HOURLY VOLUME C WAHR=0.0417 * WAHR - WEIGHTED AVERAGE HOURLY VOLUME RATIO (DIM) R ADTINC.KL=AADT.K*0.001 * ADTINC - AADT INCREASING RATE (VEH/YR) A TVOL.K=(AADT.K*220) * TVOL - ANNUAL TRAFFIC VOLUME (VEH) N TVOLN=AADTN N PLSN=LHPAN*BPAIN N LHPAN=HPAIN N HPAIN=(HSEPCN + HDFPCN*WFDFCH + HDTPCN*WFDTCH)/TMHN N TMHN=HSFPCN+HDFPCN+HDTPCN A TTLKL.K=FFTTLKL.K*(1-(1-LOSF.K)*(A VBC.K))/(1.0001-A VBC.K) * TTLKL- TRAVEL TIME (MIN) A SPD.K=MIN(TOTMILG/(TTLKL.K/60),FSPD) N TTLKLN=FFTTLKL*(1-(1-LOSFN)*(A VBCN))/(1.0001-A VBCN) A FFTTLKL.K =(TOTMILG/FSPD)*60 * FFTTLKL - FREE FLOW TRAVEL TIME ON LINK KL (MIN) C FSPD=80 * FSPD - FREE FLOW SPEED(MI/HR) A DFTT.K=(TTLKLN-TTLKL.K)/TTLKL.K A DFIOLK=TABLE(DFIOIT,DFTT.K,-.5,.5,.1) T DFIOIT =-.001/-.0008/-.0006/-.0004/-.0002/0/.0002/.0004/.0006/.0008/.001 R UAUBEN.KL=((TTLKLN-TTLKL.K)*VOT*INFLF.K)** ((TVOL.K+ TVOLN)/2))*(ADTSD/TOTMILG)
* UAUBEN - UNDISCOUNTED ANNUAL USER BENEFIT ($/YR) C ADTSD=67 * ADTSD - AVERAGE DISTANCE TRAVELED IN SALEM DISTRICT (MI) L UUBEN.K=UUBEN.]+(DT)(UAUBEN. JK) * UUBEN - UNDISCOUNTED USER BENEFIT ($/YR) N UUBEN=0 R DAUBEN.KL=((TTLKLN-TTLKL.K)*VOT*INFLF.K)**
Ko
Oo Cand

((TVOL.K + TVOLN)/2))/(1 + DISR)**TIME.K * DAUBEN - DISCOUNTED ANNUAL USER BENEEIT ($/YR) C VOT=0.15 * VOT - VALUE OF TIME ($/MIM) L DUBEN.K=DUBEN.]+(DT)(DAUBEN. JK) * DUBEN - DISCOUNTED USER BENEFIT ($/YR) N DUBEN=0 R UANUBEN.KL=(PV.K*0.17*PCIV.K*DFIOLK) * UANUBEN - UNDISCOUNTED ANNUAL NON-USER BENEFIT ($/YR) L UNUBEN.K=UNUBEN,] + (DT)(UANUBEN JK) * UNUBEN - UNDISCOUNTED NON-USER BENEFIT ($/YR) N UNUBEN=0 R DANUBEN.KL= (PV.K*PCIV.K*DFIOLK)/(1+DISR)**TIME.K * DANUBEN - DISCOUNTED ANNUAL NON-USER BENEFIT ($/YR) L DNUBEN.K=DNUBEN.] + (DT)(DANUBEN JK) * DNUBEN - DISCOUNTED NON-USER BENEFIT ($/YR) N DNUBEN=0 A TLCCUD.K=BLCCUD.K + HLCCUD.K * TLCCUD - TOTAL LIFE-CYCLE COST UNDISCOUNTED A NVB.K=UUBEN.K+ UNUBEN.K-TLCCUD.K * NVB - NET VALUE OF BENEFIT UNDISCOUNTED($) A TLCCD.K=clip((BLCCD.K + HLCCD.K),1,TIME.K,1) * TLCCD - TOTAL LIFE-CYCLE COST DISCOUNTED A NPVB.K=DUBEN.K + DNUBEN.K-TLCCD.K * NVB - NET PRESENT VALUE OF BENEFIT DISCOUNTED(3) A HCEUDE.K =CLIP(HCEUD.K,1,TIME.K,1) * HCEUDE - HIGHWAY TOTAL CONSTRUCTION EXPENDITURE ENUMERATOR L HEXPD.K =HEXPD.J+(DT)(ERH.JK) N HEXPD=HEXPDN C HEXPDN=0 A CCBCR.K =((UUBEN.K + UNUBEN.K-(HMEUD.K*HEXPD.K/TOTALH.K))* /(HCEUDE.K*DISR))*(1-EXP(-DISR*N))
* CCBCR - CONTINUOUS COMPOUND BENEFIT COST RATIO (DIM) C N=40 * N - PROJECT LIFE (YRS) A DRE.K=UUBEN.K + UNUBEN.K-HMEUD.K * DRE.K - DIFFERENCE BET. EXPENDITURE AND REVENUE A GTRMBR.K=(TVOL.K*TOTMILG*RMFT.K)/((HMB.K + BB.K)*ADTPG.K) * GTRMBR - GASOLINE TAX REVENUE MAINT. BUDGET RATIO (DIM) C TOTMILG=117.91 * TOTMILG - TOTAL MILAGE IN SALEM DISTRICT
204

Financial Subsystem eb Bb 9 Oh Ob Of 9 DECISION VARIABLES 2h 9G Of oh 9 9 oh Of OG of
C FBHM=0.5 * FBHM - FRACTION BUDGET TO HWY MAINT. (DIM) A FBHC.K=1-FBHM * FBHC - FRACTION BUDGET TO HWY CONSTRUCTION (DIM) C FCBB=0.5 * FRACTION CONSTRUCT. BUDGET TO BRIDGE (DIM) C FMBB=0.5 * FRACTION MAINT. BUDGET TO BRIDGE (DIM) A FMBP.K=1-FMBB * FRACTION MAINT. BUDGET TO PAVEMENT (DIM) CR ee oe a a a
L PV.K=PV.J+(DT)(BRV.JK+IMRV.JK-DRV.JK-OMRV.JK) N PV=PVN * PV-POPULATION OF VIRGINIA (PERSONS) C PVN= 6618358 R BRV.KL=BRPV*PV.K * BRV-BIRTH RATE OF VIRGINIA (DIM) C BRPV=0.014591 * BRPV-BIRTH RATE PARAMETER OF VIRGINIA (PERSONS/YR) R DRV.KL=DRPV*PV.K * DRV-DEATH RATE OF VIRGINIA (PERSONS/YR) C DRPV=0.008249 * DRPV-DEATH RATE PARAMETER OF VIRGINIA (DIM) R IMRV.KL=IMRPV*PV.K * IMRV - IN-MIGRATION RATE OF VIRGINIA (PERSONS/YR) C IMRPV=0.001168 * IMRPV - IN-MIGRATION RATE PARAMETER OF VIRGINIA (DIM) R OMRV.KL=OMRPV*PV.K * OMRV - OUT-MIGRATION RATE OF VIRGINIA (PERSONS/YR) C OMRPV =0.001737 * OMRPV-OUT-MIGRATION RATE PARAMETER OF VIRGINIA (DIM) L VV.K=VV.J+(DT)(VVINC.JK) * VV - NO. OF VEHS IN VIRGINIA (VEHS) N VV=0 R VVINC.KL=VV.K*VAGR * VVINC - VEH. INCREASING RATE (VEH/YR) C VAGR=0.01 * VAGR - AVG ANNUAL GROWTH RATE OF VEH. IN VIRGINIA (DIM) A VMT.K=ATMV*VV.K * VMT - VEHICLE MILE TRAVELED (VEH-NI/YR) C ATMV=12500 * ATM - AVG TRAVELED MILE PER VEH. (MILE/YR) A SS.K=PPR*PV.K * SS - STATE SALES ($/YR) C PPR=1000 * PPR - PERSONAL PERCHASE RATE ($/YR-PERSONS)
205

A MVLF.K=VV.K*RMVLF * MVLF - MOTOR VEHICLE LICENSE FEE ($/YR) C RMVLF=26.5 * RMVLE - RATE FOR MOTOR VEHICLE LICENSE FEE ($/VEH) A TVVV.K=AVVV*VV.K * TVVV - TOTAL VALUE OF VEH. REGISTERED IN VIRGINIA ($) C AVVV=20000 * AVVV - AVG. VALUE OF VEH. REGISTERED IN VIRGINIA ($/VEH.) A MVSUT.K=RMVSUT*TVVV.K * MVSUT- MOTOR VEHICLE SALES AND USE TAX ($/YR) C RMVSUT=0.03 * RMVSUT- RATE FOR MOTOR VEHICLE SALES AND USE TAX (DIM) A MFT.K=RMFT.K*VMT.K * MFT - MOTOR FUEL TAX ($/YR) A RMFT.K=0.177 * RMFT - RATE FOR MOTOR FUEL TAX ($/GAL) A ADTPG.K=TABLE(ADTPGT,SPD.K,40,80,10) T ADTPGT =40/35/30/25/18 * ADTPG - AVG DISTANCE TRAVELED PER GALLON (GAL/MI) * A ADTPG=20 A SST.K=RSST*SS.K * SST - STATE SALES TAX ($/YR) C RSST =0.045 * RSST - RATE FOR STATE SALES TAX A TTF.K =FMVLFT.K*MVLF.K + FMVSTT.K*MVSUT.K+ FMEFTT.K** MFT.K +FSST.K*SST.K * TTF - TRANSPORTATION TRSUT FUND ($/YR) A FMVLFT.K =3/26.5 * FMVLFT - FRACTION MOTOR VEHICLE LICENSE FEE TO TTF (DIM) A FMVSTT.K=1/3 * FMVSTT- FRACTION MOTOR VEHICLE SALES AND USE TAX TO TTF (DIM) A FMFTT.K=2.5/17.7 * FMETT - FRACTION MOTOR FUEL TAX TO TTF (DIM) A FSST.K=0.85"(0.5/4.5) * ESST - FRACTION STATE SALES TAX TO TTF (DIM) A HMO.K=FMVLFH.K*MVLF.K + FMVSTH.K*MVSUT.K + FMETH.K** MFT.K+ FSSH.K*SST.K * HMO - HIGHWAY MANAGEMENT AND OPERATION FUND ($/YR) A FMVLFH.K = 16/26.5 * FMVLFH - FRACTION MOTOR VEHICLE LICENSE FEE TO HMO (DIM) A FMVSTH.K =2/3 * FMVSTH- FRACTION MOTOR VEHICLE SALES AND USE TAX TO HMO (DIM) A FMFTH.K = 14.85/17.7 * FMFTH - FRACTION MOTOR FUEL TAX TO HMO (DIM) A FSSH.K=0.85*(0/4.5) * FSSH - FRACTION STATE SALES TAX TO HMO (DIM) A TTRV.K=clip(1.7e9,(TTF.K + HMO.K + FAV.K),time.k,0) * TTRV - TOTAL TRANSPORTATION REVENUE IN VIRGINIA ($/YR) A FAV.K=500000 * FAV - FEDERAL AIDS FOR VIRGINIA A ABH.K=FRHWY*TTRV.K
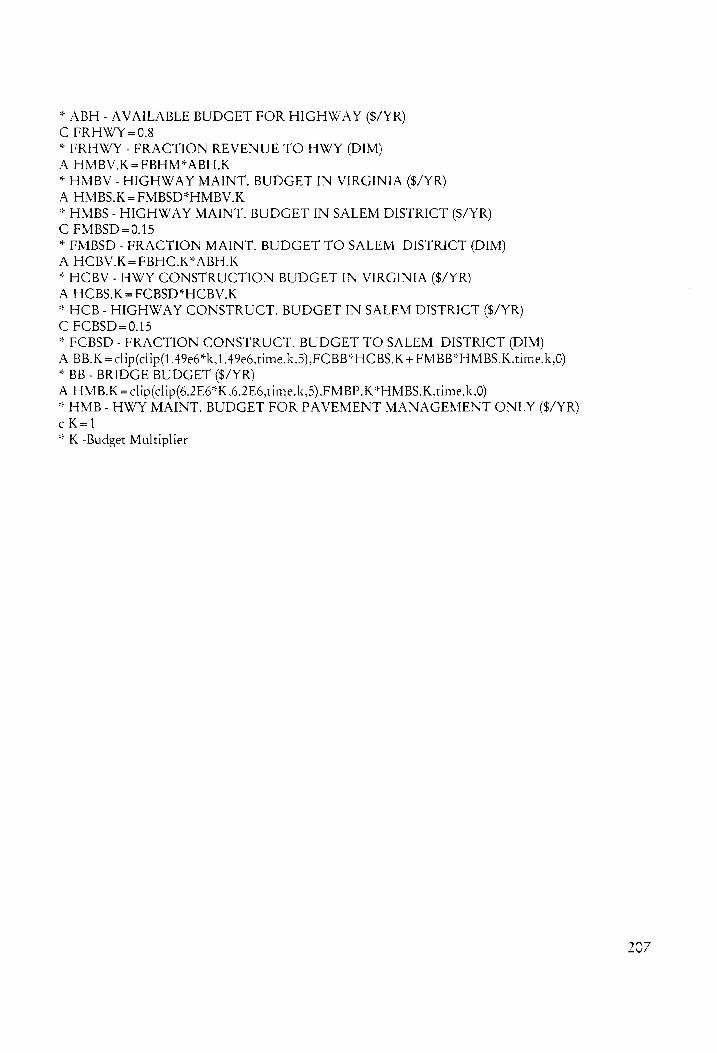
* ABH - AVAILABLE BUDGET FOR HIGHWAY ($/YR) C FRHWY =0.8 * FRHWY - FRACTION REVENUE TO HWY (DIM) A HMBV.K=FBHM*ABH.K * HMBV - HIGHWAY MAINT. BUDGET IN VIRGINIA ($/YR) A HMBS.K=FMBSD*HMBV.K * HMBS - HIGHWAY MAINT. BUDGET IN SALEM DISTRICT ($/YR) C FMBSD=0.15 * FMBSD - FRACTION MAINT. BUDGET TO SALEM DISTRICT (DIM)
A HCBV.K=FBHC.K*ABH.K * HCBV - HWY CONSTRUCTION BUDGET IN VIRGINIA ($/YR)
A HCBS.K=FCBSD*HCBV.K * HCB - HIGHWAY CONSTRUCT. BUDGET IN SALEM DISTRICT ($/YR) C FCBSD=0.15 * FCBSD - FRACTION CONSTRUCT. BUDGET TO SALEM DISTRICT (DIM) A BB.K =clip(clip(1.49e6*k,1.49e6,time.k.5),FCBB*HCBS.K + FMBB*HMBS.K.time.k,0) * BB - BRIDGE BUDGET ($/YR) A HMB.K =clip(clip(6.2E6*K,6.2E6,time.k.5), FMBP.K*HMBS.K.time.k.0) * HMB - HWY MAINT. BUDGET FOR PAVEMENT MANAGEMENT ONLY ($/YR)
cK=1 * K -Budget Multiplier

Functional Subsystem
* ***Expansion increase bridge cost 50%**** C TEST1=0.9015
C TEST2=0.10035
C TEST3=0.043919
C TEST4 =0.173385 A MCDFH.K=29000
*A MCDFH.K=TABLE(MCDFHT.HDFPC.K,0,600, 100)
*T MCDFHT = 1500/4500/10000/24000/33000/39000/43000
* MCDFH-ORDINARY MAINTENANCE COST OF HIGHWAY ($/LANE-MI)
A MCDTH.K=73000 *A MCDTH.K=TABLE(MCDTHT.HDTPC.K,0,600,100)
*T MCDTHT = 43000/55000/62500/97000/12500/14500/150000 * MCDTH-MAINTENANCE REPLACEMENT COST OF HIGHWAY ($/LANE-MI)
A ECH.K=1E6
* ECH - EXPANSION COST OF HIGHWAY ($/LN-MI) *AEP.K=1
A EP.K=clip(1.5,1,time.k,5)
* EP - COST EXPANSION PARAMETER
A PMCB.K =EP.K*(CS*ARS.K+ CSDC*ARSDC.K + CEJM*AREJM.K+ CBM*ARBM.K-+ *
CPGM*ARPGM.K+CSP*ARSP.K)
* PMCB.K - PREVENTIVE MINTENANCE COST OF BRIDGES ($/BRIDGE) A MNRCB.K=EP.K*(CDO*ARDO.K + CCP* ARCP.K + CPCH*ARPCH.K + CEJR** AREJR.K+CRPT*ARRPT.K+CBAR*ARBAR.K + CDSR*ARDSR.K + CSMR*ARSMR.K +*
CCDR*ARCDR.K +CDER*ARDER.K) * MNRCB - MINOR REPAIR COST OF BRIDGES ($/BRIDGE)
A MJRCB.K=EP.K*(CDKR*ARDKR.K + CSSR*ARSSR.K+ CCBR*ARCBR.K)
* MJRCB - MAJOR REPAIR COST OF BRIDGE ($/BRIDGE)
A RHCB.K=EP.K*(CRA*ARRA.K+CRP*ARRP.K+CRLP*ARRLP.K+CRLA*ARRLA.K +* CRCD*ARCD.K)*1.5
* RHCB - REHABILITAION COST OF BRIDGE ($/BRIDGE)
A BWC.K = 500000
* BWC - BRIDGE WIDENING COST
A RPCB.K=EP.K*1500000 C CS=8316 * CSV - AVG. COST OF SCOUR ($/BRIDGE) A ARS.K=TEST1
* ARS - AVERAGE ANNUAL APPYING RATE OF SCOUR (DIM) C CSDC = 36656.28
* CSDC - AVG. COST OF SEALING DECK CRACKS ($/BRIDGE) A ARSDC.K=TEST1
* ACP - AVERAGE ANNUAL APPYING RATE OF SEALING DECK CRACKS (DIM) C CEJM= 1753.49 * CEJM - AVG. COST OF EXPANSION JOINT MAINTENANCE ($/BRIDGE) A AREJM.K=TEST1
* AREJM - AVERAGE ANNUAL APPYING RATE OF EXPANSION JOINT MAINTENANCE
(DIM) C CBM=825
208

* CBM - AVG. COST OF BEARING MAINTENANCE ($/BRIDGE) A ARBM.K=TEST1 * ARBM - AVERAGE ANNUAL APPYING RATE OF BEARING MAINTENANCE (DIM) C CPGM=2917.43 * CPGM - AVG. COST OF PARAPET GUARD RAIL MAINTENANCE ($/BRIDGE) A ARPGM.K=TEST1 * ARPGM - AVERAGE ANNUAL APPYING RATE OF PARAPET GUARD RAIL MAINTENANCE (DIM) C CSP =5000.96 * CSP - AVG. COST OF SPOT PAINTING ($/BRIDGE) A ARSP.K=TEST1 * ARSP - AVERAGE ANNUAL APPYING RATE OF SPOT PAINTING (DIM)
C CDO=87463.41 * CDO - AVG. COST OF DECK OVERLAY ($/BRIDGE) A ARDO.K=TEST2 * ARDO - AVERAGE ANNUAL APPYING RATE OF DECK OVERLAY (DIM) C CCP =414739.60 * CCP - AVG. COST OF CATHODIC PROTECTION ($/BRIDGE) A ARCP.K=TEST2 * ARCP - AVERAGE ANNUAL APPYING RATE OF CATHODIC PROTECTION (DIM) C CPCH=71135.17 * CPCH - AVG. COST OF PATCHING ($/BRIDGE) A ARPCH.K=TEST2 * ARPCH - AVERAGE ANNUAL APPYING RATE OF PATCHING (DIM) C CEJR=1753.49 * CEJR - AVG. COST OF EXPANSION JOINT REPLACEMENT ($/BRIDGE) A AREJR.K=TEST2 * AREJR - AVERAGE ANNUAL APPYING RATE OF EXPANSION JOINT REPLACEMENT (DIM) C CRPT=19930.68 * CRPT - AVG. COST OF REPAINTING A ARRPT.K=TEST2 * ARRPT - AVERAGE ANNUAL APPYING RATE OF REPAINTING (DIM) C CBAR= 1680 * CBAR - AVG. COST OF BEARING (& ANCHOR BOLT) REPLACEMENT ($/BRIDGE) A ARBAR.K=TEST2 * ARBAR - AVERAGE ANNUAL APPYING RATE OF BEARING (& ANCHOR BOLT) REPLACEMENT (DIM) C CDSR = 100000 A ARDSR.K=TEST2 C CSMR = 100000 A ARSMR.K=TEST2 C CCDR=100000 A ARCDR.K=TEST2 C CDER = 100000 A ARDER.K=TEST2
C CDKR= 116047 * CDKR - AVG. COST OF DECK REPLACEMENT ($/BRIDGE)
209

A ARDKR.K=TEST3 C CSSR = 2288661 * CSSR - AVG. COST OF SUPER STRUCTURE REPLACEMENT ($/BRIDGE) A ARSSR.K=TEST3 C CCBR = 100000 A ARCBR.K=TEST3 %
of
C CRA =291096 * CRA - AVG. COST OF REPAIR OF ABUTMENT ($/BRIDGE) A ARRA.K=TEST4 C CRP =32561 * CRP - AVG. COST OF REPAIR OF PIER ($/BRIDGE) A ARRP.K=TEST4 C CRLA =356492 * CRA - AVG. COST OF REPLACEMENT OF ABUTMENT ($/BRIDGE) A ARRLA.K=TEST4 C CRLP =84987.46 * CRP - AVG. COST OF REPLACEMENT OF PIER ($/BRIDGE) A ARRLP.K=TEST4 C CRCD = 100000 A ARCD.K=TEST4
A TBEXPD.K =PMCB.K*BPM.K + MNRCB.K*BMNR.K + MJRCB.K*BMJR.K + BWC.k** BW.KL+RPCB.k*RPRB.KL+RHCB.K*RHRB.KL
* TBEXPD - TOTAL BRIDGE EXPENDITURE ($/YR) A BPM.K=FAPMB.KL+FIPMB.KL * BPM - NO. OF BRIDGES PREVENTIVELY MAINTAINED (BRIDGES/YR) A BMNR.K=FIMNRB.KL+FAMNRB.KL * BMNR - NO. OF BRIDGES MINOR REPAIRED (BRIDGES/YR) A BMJR.K=FIMJRB.KL+FAMJRB.KL * BMJR - NO. OF BRIDGES MAJOR REPAIRED (BRIDGES/YR) L BLCCD.K =BLCCD.]+(DT)(TBED.JK) * BLCCD - BRIDGE LIFE CYCLE COST DISCOUNTED ($) N BLCCD=0 R TBED.KL=(INFLF.K*TBEXPD.K)/(1 + DISR)**TIME.K * TBED - TOTLA BRIDGE EXPENDITURE DISCOUNTED ($/YR) A INFLF.K=(INFLR+1)**TIME.K * INFLF - INFLATION FACTOR (DIM) C INFLR=0.0 * INFLR - INFLATION RATE (DIM) C DISR=0.06 * DISR - DISCOUNT RATE (DIM) L BLCCUD.K =BLCCUD.]+(DT)(TBEUD. JK) * BLCCUD - BRIDGE LIFE CYCLE COST UNDISCOUNTED ($) N BLCCUD=0 R TBEUD.KL=(INFLF.K*TBEXPD.K) * TBEUD - TOTLA BRIDGE EXPENDITURE UNDISCOUNTED ($/YR) A THCE.K=ERH.KL*ECH.K * THCE - TOTAL HWY CONSTRUCTION EXPENDITURE ($/YR) A THME.K = MRDFH.KL*MCDFH.K+ MRDTH.KL*MCDTH.K
210

* THME - TOTAL HWY MAINTENANCE EXPENDITURE ($/YR) L HLCCUD.K=HLCCUD.]+(DT)(THEUD. JK) * HLCCUD - HWY LIFE CYCLE COST UNDISOUNTED N HLCCUD=0 R THEUD.KL=INFLF.K*(THCE.K+THME.K) * THEUD - TOTAL HWY EXPENDITURE UNDISCOUNTED ($/YR) L HLCCD.K=HLCCD.] + (DT)(THED.JK) * HLCCD - HWY LIFE CYCLE COST DISOUNTED N HLCCD=0 R THED.KL=(INFLF.K*{THCE.K + THME.K))/(1+ DISR)**TIME.K * THED - TOTAL HWY EXPENDITURE DISCOUNTED ($/YR)
Physical Subsystem: Bridge Management System
* C FBFAPMB=0.5
NOTE FBFANRB - Fract Budget to Func Adequate Preventive Maintenance of Bridges (Dim) A FBFANRB.K=(1-FBFAPMB)/3 NOTE FBFANRB.- Fract Budget to Func Adequate Minor Repairs of Bridges (Dim) A FBFAJRB.K =(1-FBEFAPMB)/3 NOTE FBFAJRB - Fract Budget to Func Adequate Major Repairs ot Bridges (Dim) c FBBW =0.0 NOTE FBBW - Fract Budget to Bridge Widening (Dim) a FBRHB.k=(1-FBFAPMB)/3 NOTE FBRHB - Fract Budget to Rehabilitation of Bridges (Dim) C FBFIPMB=0.0 NOTE FBFIPMB - Fract Budget to Func Inadequate Preventive Maintenance of Bridges (Dim) C FBFINRB=0.0 NOTE FBFINRB - Fract Budget to Func Inadequate Minor Repair of Bridges (Dim) C FBFIJRB=0.0 NOTE FBFIJRB -Fract Budget to Func Inadequate Major Repair of Bridges (Dim) C FBRPB=0.0 NOTE FBRPB - Fract Budget to Replacement ot Bridges (Dim) A ABFAPFC.K=MAX(BFAPFC.K,0) A ABFAGC.K=MAX(BFAGC.K.0)
A ABFAFC.K=MAX(BFAFC.K,0) A ABFAPC.K=MAX(BFAPC.K,0) A ABFIPFC.K =MAX(BFIPFC.K,0) A ABFIGC.K=MAX(BFIGC.K,0)
A ABFIFC.K=MAX(BFIFC.K,0) A ABFIPC.K=MAX(BFIPC.K,0) A ABFACC.K=MAX(BFACC.K.0) A ABFICC.K =MAX(BFICC.K,0) L BFAPFC.K=BFAPFC,] + (DT)(FAPMB.JK + FAMNRB.JK + FAMJRB.JK +*
RHRB.JK +RPRB.JK + BW.JK-ORB.JK-FAERB.]K) N BFAPFC=BFAPFCN C BFAPFCN=31 : NOTE FASC - Bridges in Functionally Adequate Superior Condition (Bridges) R FAERB.KL = max(BFAPFC.K/ETB,0) NOTE FAER - Functionally Adequate Exposure Rate of Bridges (Bridges/YR) C ETB=1.5
211
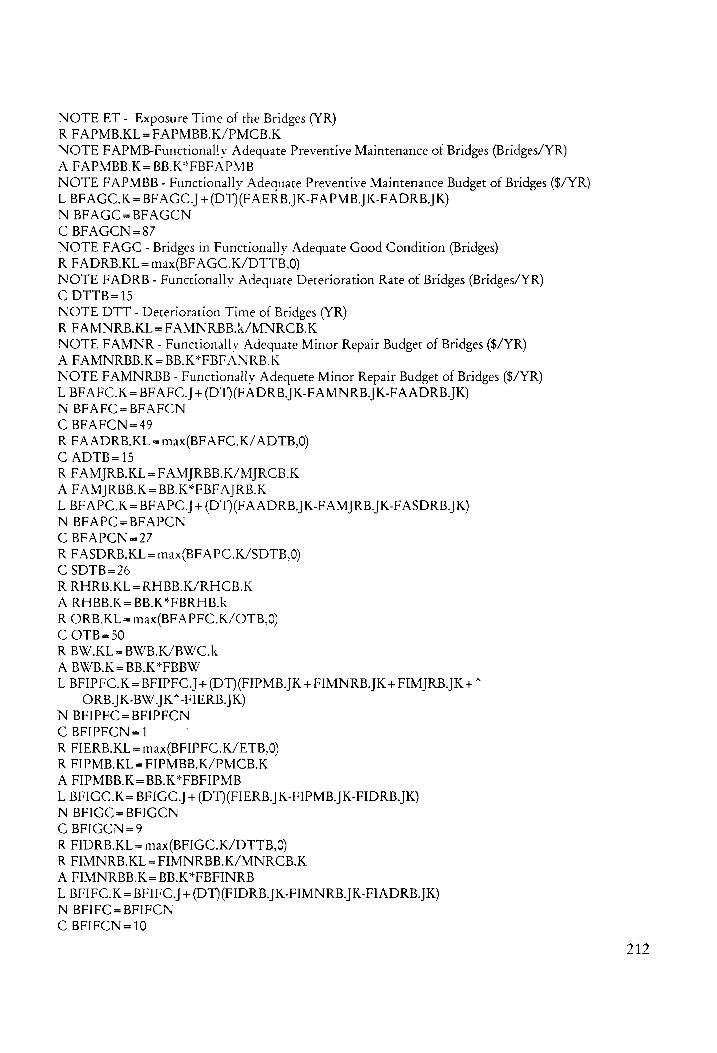
NOTE ET - Exposure Time of the Bridges (YR) R FAPMB.KL=FAPMBB.K/PMCB.K NOTE FAPMB-Functionallvy Adequate Preventive Maintenance of Bridges (Bridges/YR) A FAPMBB.K = BB.K*FBFAPMB NOTE FAPMBB - Functionally Adequate Preventive Maintenance Budget of Bridges ($/YR) L BFAGC.K=BFAGC._] + (DT)(FAERB.JK-FAPMB.JK-FADRB.JK) N BFAGC =BFAGCN C BFAGCN =87 NOTE FAGC - Bridges in Functionally Adequate Good Condition (Bridges) R FADRB.KL=max(BFAGC.K/DTTB,0) NOTE FADRB.- Functionally Adequate Deterioration Rate of Bridges (Bridges/YR) C DTTB=15 NOTE DTT - Deterioration Time of Bridges (YR) R FAMNRB.KL=FAMNRBB.k/MNRCB.K NOTE FAMNR - Functionally Adequate Minor Repair Budget of Bridges ($/YR) A FAMNRBB.K = BB.K*FBFANRB.K NOTE FAMNRBB - Functionally Adequete Minor Repair Budget of Bridges ($/YR) L BFAFC.K=BFAFC.]+(DT)(FADRB.JK-FAMNRB.JK-FAADRB.JK) N BFAFC=BFAFCN
C BFAFCN=49 R FAADRB.KL=max(BFAFC.K/ADTB,0)
C ADTB=15 R FAMJRB.KL=FAMJRBB.K/MJRCB.K A FAMJRBB.K=BB.K*FBFAJRB.K L BFAPC.K =BFAPC.J+(DT)(FAADRB JK-FAMJRB.JK-FASDRB.JK) N BFAPC=BFAPCN C BFAPCN =27 R FASDRB.KL=max(BFAPC.K/SDTB,0) C SDTB=26 R RHRB.KL=RHBB.K/RHCB.K A RHBB.K=BB.K*FBRHB.k R ORB.KL=max(BFAPFC.K/OTB,0) C OTB=50 R BW.KL=BWB.K/BWC.k
A BWB.K=BB.K*FBBW L BFIPFC.K = BFIPFC.] + (DT)(FIPMB.JK + FIMNRB. JK + FIMJRB.JK +*
ORB.JK-BW.JK*-FIERB.JK) N BFIPFC=BFIPFCN C BFIPFCN=1 R FIERB.KL=max(BFIPFC.K/ETB,0) R FIPMB.KL=FIPMBB.K/PMCB.K
A FIPMBB.K =BB.K*FBFIPMB L BFIGC.K = BFIGC.J+ (DT)(FIERB.JK-FIPMB. JK-FIDRB.JK) N BFIGC =BFIGCN C BFIGCN =9 R FIDRB.KL= max(BFIGC.K/DTTB,0) R FIMNRB.KL=FIMNRBB.K/MNRCB.K A FIMNRBB.K = BB.K*FBFINRB L BFIFC.K = BFIFC.J+(DT)(FIDRB.JK-FIMNRB,JK-FIADRB.JK) N BFIFC=BFIFCN C BFIFCN =10
212
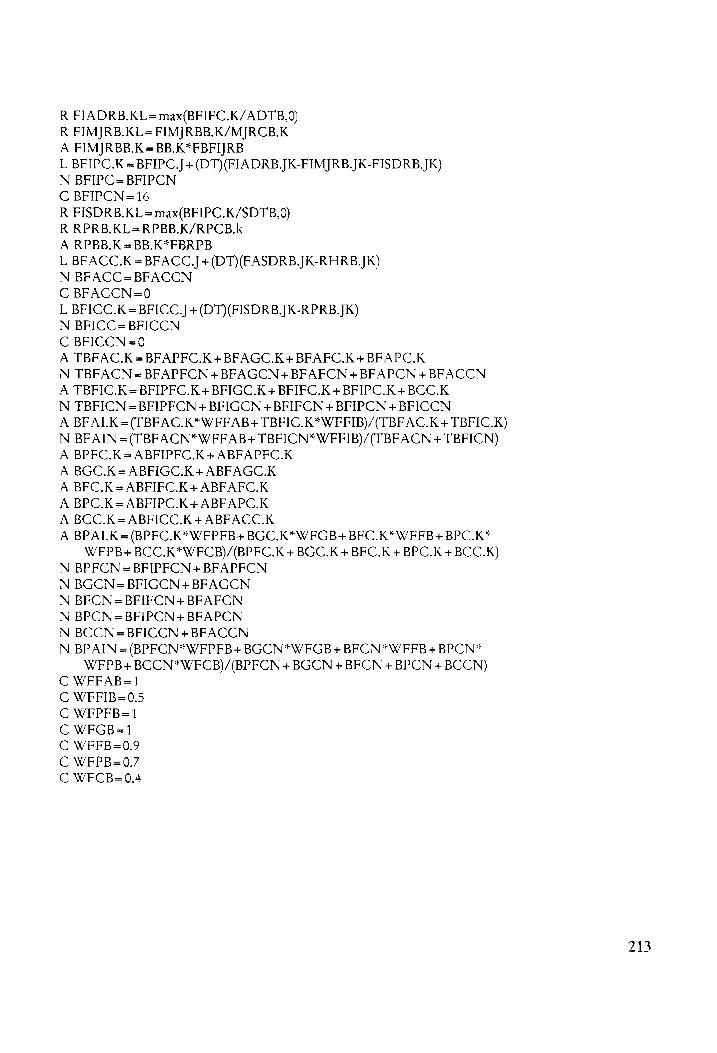
R FIADRB.KL=max(BFIFC.K/ADTB,0) R FIMJRB.KL=FIMJRBB.K/MJRCB.K A FIMJRBB.K =BB.K*FBFIJRB L BFIPC.K =BFIPC.J+(DT)(FIADRB.JK-FIMJRB.JK-FISDRB.]K) N BFIPC=BFIPCN C BFIPCN=16 R FISDRB.KL=max(BFIPC.K/SDTB,0) R RPRB.KL=RPBB.K/RPCB.k A RPBB.K =BB.K*FBRPB L BFACC.K = BFACC.] + (DT)(FASDRB.JK-RHRB.JK) N BEACC=BFACCN C BFACCN=0 L BFICC.K=BFICC.] + (DT)(FISDRB.JK-RPRB.]K) N BFICC=BFICCN C BFICCN=0 A TBFAC.K=BFAPFC.K + BEFAGC.K + BFAFC.K+ BFAPC.K N TBFACN=BFAPFCN+BFAGCN + BFAFCN + BFAPCN+BFACCN A TBFIC.K = BFIPFC.K + BFIGC.K + BFIFC.K + BFIPC.K + BCC.K N TBFICN = BFIPFCN + BFIGCN + BFIFCN + BFIPCN + BFICCN A BFALK =(TBFAC.K*WFFAB+ TBFIC.K*WFFIB)/(TBFAC.K + TBFIC.K) N BFAIN=(TBFACN*WEFFAB+ TBFICN*WFEIB)/(TBFACN + TBFICN) A BPFC.K = ABFIPFC.K + ABFAPFC.K A BGC.K=ABFIGC.K+ ABFAGC.K A BFC.K=ABFIFC.K + ABFAFC.K A BPC.K=ABFIPC.K+ ABFAPC.K A BCC.K = ABFICC.K + ABFACC.K A BPALK=(BPFC.K*WFPFB + BGC.K*WFGB+ BFC.K*WFFB+ BPC.K*
WEPB+BCC.K*WECB)/(BPFC.K + BGC.K+ BFC.K + BPC.K + BCC.K) N BPFCN=BFIPFCN+BFAPFCN N BGCN = BFIGCN + BFAGCN N BFCN=BFIFCN + BFAFCN N BPCN=BFIPCN+BFAPCN N BCCN=BFICCN+BFACCN N BPAIN=(BPFCN*WEPFB+BGCN*WFGB+BFCN*W/FFB + BPCN*
WFPB+BCCN*WECB)/(BPFCN + BGCN + BECN + BPCN + BCCN) C WFFAB=1 C WFFIB=0.5 C WFPFB=1 C WFGB=1 C WFFB=0.9 C WFPB=0.7 C WFCB=0.4
213

Physical Subsystem: Pavement Management System
C FBFAPMB=0.5 C FBOMH=0.5 A FBMRH.K = 1-FBOMH A AHSFPC.K=MAX(HSFPC.K,0) A AHDFPC.K=MAX(HDFPC.K,0) A AHDTPC.K=MAX(HDTPC.K,0) L HSFPC.K = HSFPC.]+(DT)(MRDTH.JK + ERH JK + MRDFH.JK-ARH.JK) N HSFPC=HSFPCN C HSFPCN = 149.36 * HSFPC-HIGHWAY IN SUFFICIENT PAVEMENT CONDITION (LANE-MI) R MRDFH.KL=HMB.K*FBOMH/MCDFH.K * MRDFH-ORDINARY MAINTEANACE RATE OF HIGHWAY (LANE-MI/YR) R MRDTH.KL=HMB.K*FBMRH.K/MCDTH.K * MRDTH-MAINTENANCE REPLACEMENT RATE OF HIGHWAY (LANE-MI/YR) R ARH.KL=HSFPC.K/ATH * ARH-AGING RATE OF HIGHWAY (LANE-MI/YR) C ATH=1 * ATH-AGING TIME OF HIGHWAY (YR) L HDFPC.K =HDFPC.]+(DT)(ARH.JK-MRDFH JK-DRH JK) N HDFPC =HDFPCN C HDFPCN = 127.39 *HDFPC-HIGHWAY IN DEFICIENT PAVEMENT CONDITION (LANE-MI) L HDTPC.K=HDTPC.J+(DT)(DRH.JK-MRDTH JK) N HDTPC=HDTPCN C HDTPCN = 208.38 * HDTPC-HIGHWAY IN DETERIORATED PAVEMENT CONDITION (LANE-MI) R DRH.KL=HDFPC.K/DTH * DRH-DETERIORATING RATE OF HIGHWAY (LANE-MI/YR) C DTH=4.2 * DHT-DETERIORATING TIME OF HIGHWAY (YR) A HDRM.K=(MRDFH.KL+MRDTH.KL)/(HSFPC.K + HDFPC.K+HDTPC.K) * HDRM-HIGHWAY DOWN RATIO FOR MAINTENANCE (DIM) A HPALK=(HSFPC.K+ HDFPC.K*WFDFCH + HDTPC.K*WFDTCH)* /(HSFPC.K +HDFPC.K + HDTPC.K)
* HPAI - HIGHWAY PHYSICAL ADEQUACY INDEX (DIM) C WEDFCH=0.5 * WFDFCH-WEIGHTING FACTOR FOR DEFICIENT CONDITION OF HIGHWAY (DIM) C WFDTCH=0 * WFDTCH-WEIGHTING FACTOR FOR DETERIORATED CONDITION OF HIGHWAY (DIM)
oh ob oh af 2b ab ab 9b 2b ab of ah ob ab af 26 ab of ah ab
* Expansion Rate tor * * Adding lane on I-81 * 3G BG a Ob Sh 96 2G 9b 9b Be 2h of Ob 26 9b OG ab 9f Be oh
R ERH.KL=CLIP(0,((86.87)*2)/5, TIME.K,5) * ERH-EXPANSION RATE OF HIGHWAY (LANE-MI/YR)
A TMH.K=HSFPC.K+HDFPC.K+HDTPC.K
* TMH - TOTAL LANE MILEAGE OF HIGHWAY (LANE-MI)
214

APPENDIX E: MIS SOFTWARE
215

VITA
Steve Smayda was born September 1, 1965 in Bad Constatt, Stuttgart, Germany. He
graduated from Park View High School in Sterling, Virginia in June 1983. In January
1984 he enlisted into the Marines Corps Reserve, earning the title of U. S. Marine in
August of that same year. He graduated with a Bachelors of Science Degree in
Psychology in July 1988 from Virginia Tech and was subsequently commissioned a
Second Lieutenant of Marines. He has served as a Naval Aviator as a Light Attack
pilot as well as a Combat Engineering Officer specializing in demolitions. He
returned to school in 1992, completing the majority of a Bachelors of Science Degree
in Civil Engineering at Virginia Tech prior to entering the Masters program. He is
currently a Captain of Marines with the Reserves and will be working for Kiewit
Construction upon graduation.
He is an active member of several professional organizations to include the American
Society of Civil Engineers, the Society of American Military Engineers, and the
Marine Corps Reserve Officers Association. He is married to his wife, Liza, of three
years and has a six-month-old son, Connor.
216