results - virginia tech
TRANSCRIPT

75
CHAPTER V
Results
Purpose
This chapter discusses research results. The purpose of this research is to explore
the relationship process, between manufacturers and consumers, which encourages
consumer participation in the manufacturing process. The research used a
preexperimental design with panel analysis and in-depth interviews. Twenty female
participants, out of 35 who answered the screening questionnaire, were selected from
students and acquaintances of the researcher in Blacksburg, VA. For the experiment, a
simulated web site was used by a consumer (i.e., participant) to order two pair of
customized shoes based on each consumer’s needs. The major research question is:
• What will happen in the Relationship Spiral Model when the consumer
becomes a part of the manufacturer/consumer relationship?
Specific research questions to investigate the relationship spiral are:
• What does a consumer expect from the relationship?
• How does distance, within the encounter, between manufacturers and
consumers change?
• What are the keys to maintaining the relationship with consumers?
• How do consumer characteristics affect the Relationship Spiral Model?
• Why does the consumer end the relationship?
This chapter contains the results from: (a) the participants’ information
questionnaire (i.e., demographic, shopping habits), (b) eight interviews, and (c) the
recontextualizing of the framework and model.
Method
In the preexperimental design for this study, a longitudinal case study with a panel
study technique as described by Babbie (1999) and Creswell (1994) was utilized to
investigate consumer characteristics (i.e., demographics, shopping orientation,
expectation, and experience), goods and service in encounter, and direct communication

76
over time. In-depth interviews were conducted before and after each preexperimental
stage. The following procedure was conducted: (a) interviewing the subjects, (b)
transcribing tapes and field notes, (c) segmenting data, (d) de-contextualizing data, (e)
coding data, and (f) re-contextualizing data. Interpretational qualitative analysis was
utilized for data analysis in this study.
Procedure
The experiment has conducted from December 1999 to March 2000. The same
web shopping experience was conducted twice (Phase One and Phase Two) including:
visiting web site, measuring foot, ordering a pair of shoes, and receiving, and evaluating
the shoes.
The interviews took place at the commencement of the web shopping, after
ordering, after receipt of the product, after wearing the product, and at the completion of
the shopping experience. The same procedure was conducted twice (Phase One and
Phase Two) to examine what happened over time to the spiral model. For example, if the
same participants change their expectation for goods and services, and how the
experiment affected the reorder stage.
Demographic
The participants were obtained as a judgmental sample because judgmental
sampling is proper for exploratory research for developing general ideas (Malhotra,
1996). Although this sampling technique has limitations, such as sample selection bias, it
also has some advantages, such as being less expensive and having subjects who are
interested and willing to participate (Malhotra, 1996). Because participants are requested
to furnish information for a long time, willingness to participate is important in a
longitudinal study with interviews. Thirty-five female participants were selected from
students and acquaintances of the researcher in Blacksburg, VA because of easy access
and ease of conducting the experiment over time. From this initial selection, the
participants were selected based on the requirements for computer skills, Internet
knowledge, and schedule during the experiment. Twenty female participants were
selected out of 35 who answered the screening questionnaire.
77
Females were used as participants because the company produces women’s
footwear, and women purchase more footwear than men (Footwear Industries of
America, 1998). The small sample size was desirable because interviews can be longer
and more detailed than with surveys or large samples. The information gathered from
these in-depth interviews provided answers to the research questions. The sample size
was also restricted to meet the cost and production time requirements of the participating
manufacturer.
Screening Questionnaire I
In the beginning of the experiment, participants were asked demographic
information (e.g., age range, working status). Questions about shopping behavior (e.g.,
how many pair of shoes do you already own?), shoes expenditure (e.g., how much do you
pay for a pair of your own shoes on average?), computer skills, and Internet knowledge
(e.g., describe your knowledge of the Internet?) were also asked. Frequency and
percentage were used to analyze the demographic data.
The ages of participants ranged from 18 – 64 years. The largest group (35%) was
45 – 54 years, and the next large group (30%) was between 25 – 34 years. The youngest
group (10%) was 18-24 years. The oldest group (5%) was 55 – 64 years (see Table 4).
Eighty five percent of the participants are from age range 25 – 54 years. The largest
group of the participant’s working status was full time (45%), and the next large group
was students (20%) and housewife (20%).
All participants (100%) were very interested or interested in shoes and provided
two main reasons for this interest. One reason for their interest in shoes was that they
were fashion oriented and cared about design and color. One participant mentioned that
“Shoes make a great vehicle as a fashion statement.” The other reason was related to
health such as comfort and fit. One participant said that “ I have an interest in
comfortable walking shoes.” The largest participants’ group (40%) spent $100-199 for
total shoe purchases in one year (see Table 4). Two participants (10%) spent less than
$100. Three participants (15%) spent over $600. Equal numbers of participants spent an
average of $39 - $59 (30%) and $100 - $199 (30%) for a pair of shoes (see Table 4). One
participant spent below $30.

78
Table 4. Demographic Information 1
Demographics Participant Number Participant %
Age
18 – 24
25 – 34
35 – 44
45 – 54
55 - 64
2
6
4
7
1
10
30
20
35
5
Work status
Full time
Part time
Housewife
Student
9
3
4
4
45
15
20
20
Shoe expenditure per year
Less than $100
$100 - $199
$200 - $299
$300 - $399
$400 - $499
$500 - $599
$600 - over
2
8
2
3
0
2
3
10
40
10
15
0
10
15
Shoe expenditure per pair of shoes
Below $30
$30 - $59
$60 - $99
$100 - $199
$200 - $299
$300 - $399
1
6
5
6
1
1
5
30
25
30
5
5

79
Three participants expressed that they bought shoes in two price ranges for
different purposes: lower price and higher price shoes (e.g., $30 and $200). For price per
pair of shoes, one participant indicated that she spent over $200 for a pair of shoes
sometimes. On the other hand, she also purchased a pair of approximately $10 shoes at a
discount store for daily activity such as working and shopping. Three additional
participants said that they paid different prices for shoes depending on the occasion. Also,
one participant mentioned that she wanted to buy high quality and very comfortable
shoes. She purchased a pair of shoes around $300 - $400 at the original price. Price paid
for shoes is not always the original price and could be a discounted price. The largest
group of the participants owned 5 – 10 pairs of shoes (40%) (see Table 5). One
participant owned 1 – 4 pairs of shoes (10%). On the other hand, four participants owned
30 – 39 pairs of shoes (20%). The average number of shoes owned was 16 pair. One
participant indicated that she liked shoes, but she always threw away old style shoes;
therefore, she only had four pair of shoes. One of the participants said that she had not
worn many of her shoes for a long time, yet she could not throw shoes any away.
Most participants (70%) rated themselves more than average (45%) or average
(25%) about computer skills (see Table 5). A few participants rated themselves as
beginners even though the researcher knew that they had satisfactory computer skills for
their participation in the study. Self-determination of computer skill makes it difficult for
the researcher to understand actual skill levels (Wimmer, 1994). So, additional questions
were asked. The participants said they often used computers and did know how to use
some software. For the Internet knowledge, the data profile was similar to the numbers
for computer skills. Most participants (85%) rated themselves average (45%) or more
than average (40%) (see Table 5). The majority of participants (60%) spent 1 - 4 hours on
the average on the Internet (except e-mail) per week. The next largest group spent 10 –
14 hours on the Internet per week (25%) (see Table 5). In addition, the largest number of
participants (45%) spent 1 - 4 hour shopping in stores (except grocery shopping) per
month (see Table 5). The next largest group (20%) spent 10 – 14 hours shopping in stores
per week.

80
Table 5. Demographic Information 2
Demographic Participant Number Participant %
Number of owned shoes 1 – 4
5 – 10
11 – 19
20 – 29
30 - 39
1
8
4
3
4
5
40
20
15
20
Computer skill Beginner
Average
More than average
Good
3
5
9
3
15
25
45
15
Internet Knowledge Beginning
Average
More than average
Good
1
9
8
2
5
45
40
10
Surfing on the Internet per week 1 – 4
5 – 9
10 – 14
15 – 19
12
2
5
1
60
10
25
5
Shopping per month 1 – 4
5 – 9
10 – 14
15 – 19
20 – 24
25 – 29
30 - 34
9
2
4
3
1
0
1
45
10
20
15
5
0
5

81
Questionnaire 1 – Initial and order stage – Phase 1
Most interviews were conducted in Wallace Hall on the Virginia Tech campus.
Total interview time for the initial and order stages (including web site shopping and
self-measurement) averaged one hour. Most participants were comfortable with the web
site shopping experience. Some participants mentioned that they struggled a little with
self-measurement of foot for their shoe size. Some computers loaded information slowly
during Internet shopping. The two groups of participants (45%) spent 10 – 14 minutes
and 15 – 19 minutes for the total viewing, including the measuring process and
submitting the order. The average time of this shopping was 14 minutes. The primary
causes of variation in time expenditure were due to their computers’ speed, steps in the
shopping experience, and the self-measurement process. One participant could not access
the host computer for at least 10 minutes because the line was busy. Another participant
spent over 10 minutes waiting to download pictures of products in the web site.
Questionnaire 1 was used to understand the participants and covered the
following concepts: shopping orientation, expectation for the relationship between a
manufacturer and consumers, past experience, overview of products (goods and services),
and direct communication.
Shopping orientation. At first, questions that were used to indicate a consumer’s
shopping orientation were asked. These questions were used to make a profile of the
three shopping orientations: brand oriented, convenience oriented and price oriented.
Participants represented a range of shopping orientations. All three orientations were
represented among the participants. Some participants ranked high on brand and price,
other participants were generally low on all three measures, and some participants were
clearly brand-oriented shoppers only. Also, the participants’ preferences for other
shopping issues were asked including: re-ordering, delivery time, corporate location,
custom-made shoes, and Internet shopping. Comfort is the most important consideration
when re-ordering a pair of shoes, and the next consideration is fit. Some participants
expressed that price was not important for re-purchasing. Seventy-five percent of
participants could wait a week for their shoes to be delivered. Only 25% cared about

82
delivery time. One participant mentioned that she only cared about time if the purchase
was a gift.
Most of them (75%) did not care about the corporate location of companies when
they purchase products. One participant said that “No, if they give me what I want.” A
few participants (25%) cared about the corporate location for two main reasons: (a) they
wanted to talk directly in their own language instead of sending e-mail (they could not
speak English), and (b) they thought that corporate location affected the image of product
quality, which reflects on the product. One participant said that “I usually consider the
company, it has an impact on the quality, so that’s important for me.”
More than one-half of the participants (60%) have considered ordering custom-
made shoes over the Internet. Many participants were interested in this ordering method;
however, the participants noted that some conditions such as easy to order and reduced
price must be available to make Internet shopping appealing. A few participants (20%)
had not wanted to order custom made shoes on the Internet because they wanted to see
the product in-person and buy the shoes immediately Also, a few participants (20%) said
that they could not decide to order custom made shoes over the Internet. The researcher
asked the reasons why in general would you not order on the Internet in general. The
most common reason (70%) for not ordering on the Internet was because they wanted to
touch, see, and wear directly. This response is in conflict with their responses to the
general questions about ordering twice.
Expectation. Participants who wanted a relationship between themselves and a
manufacturer had a variety of reasons: saving cost, better quality, product knowledge,
availability of size, and comfort. Before starting the relationship, almost one-half of the
participants (45%) wanted to know services information such as warranty, return policy,
and shipping cost. A few participants (20%) wanted to know corporate information. One
participant mentioned that “I would try to be socially conscious. I would try to make sure
they weren’t a company that was taking advantage of their workers.”
In this shopping experience, participants could not touch products before they
ordered them. Most of them wanted to know visual and other product information. Three
participants (15%) wanted word of mouth information before purchasing. Most
participants’ anxiety about the direct shopping from a manufacturer was about

83
communication (i.e., difficult to inform, hard to confront then personally) and customer
services (i.e., how the complain system works, return policy). In contrast to these
concerns, one participant was interested in Internet ordering because it reduced anxiety.
She has two children and does not have a time to go to shop. She mentioned that “my
thing is saving time and not bringing my kids into the shoe store and having them throw
other shoes. It lessens my anxiety a lot.”
Participants had almost the same anxiety responses of this Internet shopping as
they had to the general questions on direct shopping from a manufacturer. The major
anxiety was fitting because they could not wear shoes before ordering. In the direct
shopping from a manufacturer in general questions, the major anxiety was return policy
and communication because most participants had never contacted with manufacturers.
The participants had anxiety how the manufacturer would handle the relationship. Six of
participants, however, had had much Internet experience. These participants did not have
anxiety because they have not had major problems. Another question was asked about the
important elements to decide to order. Visual product information is the important aspect
such as color and products variety, and also price is the important aspect.
To maintain the relationship with companies, all participants emphasized that
services was the most important aspect although one participant also noted product
quality. The three high scores were warranty, delivery time, and better and easier
communication. Also, some participants expected courteous service and more customized
services such as up-to-date product information.
Concerning the price, they would pay for custom-made shoes, the average price
was $184. The largest group (45%) expected to pay around $150 - $190. Twenty percent
of the participants said that they paid less than $100, and also fifty percent of the
respondent said that they paid $400 - $490. This amount is higher than the average price
participants were willing to pay for a pair of shoes purchased in a store. Equal numbers of
participants would spend an average of $39 - $59 (30%) and $100 - $199 (30%) for a pair
of shoes.
Past Experience. Few participants (10%) had extreme problems buying shoes.
Twenty percent said they had no major problems buying shoes. Most participants (80%)
have had some problems purchasing shoes. Participants had a variety of problems or a

84
mixture of problems such as large size foot and fit. The major problem of the participants
was different foot size between left and right foot. The participants could not find their
proper shoes because these shoes were not available at most stores, except for orthopedic
shoes. Also, three participants had a large foot size. Most companies sell sizes 6 to 9.
After size 9, the companies do not sell half sizes. So one participant said that she always
fell between two sizes.
Two participants had ordered custom-made shoe at stores previous to this
experiment. Basically both participants experienced the same system: selecting design of
shoes, measuring their foot by a store person, and receiving the shoes within one or two
days. The participants said that the price range was from $30 - $200.
Some participants who purchased apparel or shoes through the Internet checked
the same company’s catalogs or retail stores before the purchased. So, participants
already knew the product quality and size. The participants purchased a variety of apparel
such as sweaters, skirts, and jackets from the Internet. Some of the participants (10%) had
minor problems about color and size in Internet shopping. In retail stores, the major
problems were out of stock items, shoe size, lack of uninformed salespeople, lack of their
knowledge, and pressure from salespeople.
Product (goods & services). Participants evaluated the product, which according
to Kotler (1991) indicates both goods and services. Participants evaluated both the shoes
(i.e., goods) and the services from the manufacturer. Concerning the quality of a pair of
shoes, participants stated a variety of criteria. The largest number of participants
considered materials (e.g., leather or man-made materials) (65%) and good finishing
(e.g., stitching and attachment) (40%) to be the most important. For the quality of
services, participants also expressed many criteria. The largest number of participants
(50%) wanted a variety of products and courteous behavior. The next largest group (30%)
indicated human related services such as personal knowledge and personal care were the
most important criteria. One participant mentioned that some salespeople advised other
shoes when they did not have her size. In general, when Internet shopping, participants
noted quick download, organized web site, and accurate color and details as important
services.

85
In the final purchase decision for their own shoes, the average score of fit (6.90),
comfort (6.95), and quality (6.15) were high on the scale of 1 – not important to 7 – very
important. Price (5.20), style (5.40), and color (5.65) were middle. When measured on the
scale, brand (3.85) was the least important criterion to the participants.
Most participants (55%) expressed concerns about the return policy, and most
wanted to use a credit card. Basically, some participants (30%) either did not want to pay
for handling and shipping or only would pay a small fee (e.g., less than $3). Also, the cost
of shipping depended on the situation. If a company made a mistake, participants did not
want to pay for any shipping or handling. The researcher asked about customized
products in general and shoes in particular. Most participants had positive opinions about
customized products and specifically custom made shoes hoping the process would
provide a better fit for the individual customer and better quality. On the other hand,
some participants had negative opinions such as expected expense. Overall participants
had high expectations about custom-made shoes.
Direct communication. Most participants (80%) wanted to order shoes directly
from manufacturers. The remaining participants (20%) did not want to order shoes from
manufacturers because they could easily find their shoes at the store and they preferred to
shop at stores. The most common benefit of in-store shopping was increased product
knowledge. Some participants were frustrated about salespeople who did not know about
shoes. They are sometimes part-time, and they could not advise properly. One participant
mentioned that she always found it difficult to contact knowledgeable sales persons in
shoe stores. She expected proper advice from manufacturers. The next most frequent
benefit was saving cost. Other benefits listed by the participants were special requests,
better quality, and more choices. The special requests were minor size adjustments and
special size orders.
The most frequency listed desired communication tool was e-mail (70%) and the
next was toll-free number (55%). Three participants wanted to write a letter. Most of the
participants wanted to be contacted when they placed the order, to get information, and to
complain. On the other hand, four participants did not want to communicate with
manufacturers directly because the participants felt it was too difficult to communicate
and they did not expect a response. The researcher inquired about preference to order

86
custom made shoes in retail stores or web sites. The answers were mixed although the
response was the same for stores and web sites. Some participants stated that both retail
formats had advantages and disadvantages. In stores, consumers could touch and wear
shoes. On web sites, consumers could order at home anytime as long as the order system
was easy. Also, some participants (15%) expressed that when they wanted to shop
depended on price. One participant was anxious about purchasing custom-made shoes
because of the self-measurement. She worried that if she made a mistake for self-
measurement, the shoes would not be good and she would be responsible.
Questionnaire 2- After Order Stage
Just after finishing ordering a pair of shoes, each participant was interviewed and
she was asked several questions about her shopping experiences at the web site. One-half
of the participants (55%) spent 10 - 14 minutes shopping including the self-measurement.
Forty percent of the participants spent 15 – 19 minutes. Most participants (70%) were
positive about this shopping even though some troubles and difficulties occurred such as
slow download and other computer troubles.
Most participants (70%) responded positively to the web site related to products
and services. Some participants, however, commented negatively about the product: lack
of variety, lack of color, and not current style. For the services, some indicated that the
web site was difficult to place an order, that measurement instructions were confusing,
and moving around the site was too slow. Some participants (35%) claimed that self-
measurement was the most difficult aspect of the process.
Three participants mentioned that a toll-free service was still necessary even if e-
mail service was available because they sometimes wanted to talk to the company
immediately. They wanted to know multiple communication sources in the web site:
address, e-mail, and toll-free number. Eight participants emphasized that more in-depth
description of products was necessary such as lining and materials. They recommended
that different picture angles were needed. One participant suggested that the company
might offer other related products such as hose and socks at the same time. Moreover,
one participant commented that services about product care was very useful for

87
consumers such as how to treat calf skin. Three participants emphasized that they wanted
to have a confirmation number or something to know that the order was received.
The most frequency selected waiting time was 2 – 3 weeks (35%). Twenty
percent of participants could wait two weeks to get their shoes. The shortest time they
were willing to wait was one to two weeks (5%) and the longest wait time was four to six
weeks, (5%). One participant expressed that this product was a customized product and
would be sent from outside of U.S., so she could wait for a month. The researcher
inquired about expectation in terms of the pictures and other information in the web site.
Forty percent of the participants considered the web site better than expected for pictures
and other information. Ten percent of the participants thought that the site was much
better than expected, and a few participants (15%) thought it was somewhat worse than
expected.
In summary, most participants were positive about the shopping experience and
took from 10 to 19 minutes to shop including self-measurement. The participants were
basically positive about the web site; however, some participants wanted extra services
such as a toll free telephone number and in-depth description of the product. Participants
said that they could wait 2-3 weeks for delivery of the product.
Questionnaire 3 - Before Consumption Stage
After waiting for delivery and just before wearing a pair of shoes, each participant
was interviewed. She was asked several questions about expectation of products, delivery
time, and comments about waiting for the product. All participants had positive opinions
about their shoes, but some had negative feelings because of delivery time. Most
participants received their shoes between 2 – 4 weeks after ordering. Three participants
waited as much as six weeks because they ordered just before the holiday seasons. The
exact delivery time varied for each participant. Many participants (70%) said that the
delivery time met their expectations. The reminder of the participants (30%) did not have
their expectations met because of the late delivery time. Some participants did not receive
their shoes within their expected delivery time, and they said that delivery did not meet
their expectation. One participant commented that she could wait for a long time as long

88
as companies mentioned the delivery time. In this experiment, the researcher did not
clearly inform the participants about the delivery time.
Most participants (90%) did not think about the order or the product during the
three to four week wait. Two participants mentioned that they were busy, so they did not
think about it. Three participants noted that they did not think about it because they had
not paid for the product.
After receiving their shoes, most participants had positive reactions about their
shoes. Comparing actual shoes and the picture on the web site, 30% of participants
indicated that the actual shoes were much better than expected, and 45% indicated that
actual product was better than expected. Specifically, most participants (55%) indicated
the product quality such as the shoes’ quality (well made), stitching, color, and leather
quality (inside and outside). Some of the participants mentioned negative comments such
as mismatched color and old style. Six participants (30%) said that the color was better
than pictured. At the same time, three participants complained that the color did not
match the color on the web site.
In summary, participants had an overall positive opinion about the product and
thought that the product was better than they perceived from the web site. On the other
hand, some participants thought that the color was mismatched to the color on the web
site. Most participants did not think about the product during the waiting time.
Questionnaire 4 - After Consumption Stage and Total Evaluation Stage
After completing the interview, all participants were asked to wear their shoes for
a while. Some participants wore them for 6 - 10 minutes (40%), and some participants
wore the shoes for 1 –5 minutes (35%), depending how their shoes fit. This waiting time
is similar to time spent in store trying on shoes. Participants who fit well tended to wear
shoes longer than participants who did not fit well.
Participants expressed many different impressions about this Internet shopping
experience. Overall, most participants had positive impressions for the shoes even though
some shoes did not fit well. Most participants (80%) indicated this pair of shoes was
better than expected from their perceptions based on the web site. Among the dissatisfied
participants, some negative opinions were about fit (30%) and visual information (10%)

89
(e.g., real product vs. photos on the web site). Most participants’ shoes (60%) fit well,
and the remaining participants (40%) said that the shoes did not fit around the arch or
length. One-half of the fit problems were in terms of foot length. Of the ill-fitting shoes,
most shoes were one or two size larger than the participants foot size. Three participants
did not fit in the arch arm. In the overall quality of services, 85% of participants were
satisfied or very satisfied.
Sixty percent of participants did not want to return the shoes, but 35% of
participants wanted to return the shoes because of fit problems. One participant said that
a decision to return the shoes depended on price. The other participants who wanted to
return the shoes had poor fit. If she paid more than $100, she would return it. Ninety
percent of participants wanted to order again. Although some participants did not receive
shoes that fit well, they wanted to order again because they could not easily find their
shoes at stores. Other participants said that they would order again, but not too soon.
In summary, most participants had a positive impression of the shoes after
wearing them, and again they thought the shoes were better than they had perceived them
to be from the web site. Some participants had shoes that did not fit well. Most
participants did not want to return the product and were willing to reorder.
Questionnaire 5 - Initial and Order Stage - Phase Two
All participants were willing to participate in the rest of the experiment (Phase
Two), and the screening questionnaire 2 was asked of each participant. Two questions
were asked: Have you been changed something (e.g., job, demographics, size of shoes)?;
what is your availability in the next three weeks? Based on willingness to continue and
the two screening questions, all participants were qualified to continue to participate in
this experiment after answering the screening questionnaire.
For the order in Phase Two, the largest number of participants expected the same
shoe quality and fit as in the beginning of Phase One. Most participants (65%) had
positive opinions for ordering customized products at this shopping; however, some
participants had worries about fit. At the reorder stage, the largest number of participants
(50%) wanted to know more about styles and colors. Also, some participants (15%)
wanted to know if the previous personalized information was still available such as their

90
foot size and order confirmation. The researcher asked about the important aspects to
maintain relationships with companies. The participants stated a variety of opinions.
Most participants (60%) expressed customer services and more information about
products and services. At the same time, some participants (10%) mentioned that they
wanted to reduce information exchange (e.g., less mail and less e-mail). One participant
stated that she only wanted to receive a letter once a year and some companies sent to her
every month.
The researcher asked about anxiety for this Internet shopping. Participants were
clearly divided into two groups: persons who had anxiety and those who did not.
Participants who received a good fit in the shoes did not have any anxiety. On the other
hand, participants who did not receive a good fit in the shoes had anxiety about fit and
self-measurement. Equal number of participants expected to pay for $40 - $80 (40%) and
$90 - $130(40%) for the shoes.
They had mixed opinions concerning whether or not they preferred shopping for
custom shoes on the web as based on their previous positive and negative experiences
and this experiment. Thirty-five percent of participants mentioned that they preferred to
order custom shoes from a web site. One participant said that “it’s easy and convenient
and it saves a time. I am still patient about the Internet shopping.” Thirty percent of
participants said that ordering depended on products, price and ease of order. Twenty-five
percent noted that they preferred to order in retail stores. They still wanted to touch and
try on shoes in stores.
In summary, participants were willing to continue their participation in the rest of
the experiment, Phase Two. The largest number of participants expected the same shoe
quality and fit as in the beginning of Phase One. Most participants expressed that they
wanted more communication with the manufacturer such as customer services including
confirmation number and predicted delivery time. They had mixed opinions about their
preference for shoe shopping on the web site or a retail store.
Questionnaire 6 - After Order Stage
After the reorder stage, most participants (70%) had confidence about Internet
shopping because they had touched and worn their shoes, and had experienced the entire

91
shopping process (i.e., selected a product, measured their feet, and ordered a product) in
Phase One. The total time for re-order in Phase Two decreased to almost one-half of the
time for the participants. In the first order time in Phase One (55% of the participants
spent 10 - 14 minutes). For the reorder stage, all participants spent less that 10 minutes to
order, and the largest number of participants spent 6 minutes (30%) to order. Twenty
percent spent only 4 minutes (20%).
Most participants responded positively to the web site about the products and
services. Some participants, however, commented again negatively about the product:
lack of variety and lack of color selection. Most participants indicated that the web site
was the same as last time. Three participants noted that they wanted to have confirmation
of their order. One participant said that she wanted notification during the process (e.g.,
production and shipping status information). Some participants were still concerned
about fitting, self-measurement, and color. After Phase One, the researcher believed that
some participants forgot what style and color they ordered because of the long time frame
from order to delivery (generally 3 - 4 weeks). This problem could increase if a consumer
only ordered once every season.
The category for waiting time with the highest number of participants was 2 – 3
weeks (40%). Thirty percent of participants said that they could wait 3 - 4 weeks to
receive their shoes. One participant could wait two weeks (5%). The researcher inquired
about expectation in terms of the pictures and other information in the web site. Very few
participants (7%) considered the web site better than expected for pictures and other
information. The researcher asked about any difference when comparing this experiment
to the first order. The largest number of participants (40%) emphasized the in confidence
with ordering and measuring, and that they were comfortable of the process.
In summary, most participants had confidence in Internet shopping because of
their previous experience with the entire shopping process. Basically, the total time for
reorder decreased approximately one-half from the first phase. Some participants
continued to be concerned about their orders in terms of fit and color.

92
Questionnaire 7 - Before Consumption Stage
After waiting for the second delivery approximately two weeks and just before
wearing the second pair of shoes, each participant was interviewed. She was asked
several questions about expectation of products, delivery time, and comments about
waiting for the product. Seventy percent of participants stated that this pair of shoes was
better than that which was viewed on the web site. All participants stated that the delivery
time was faster than the previous time. All participants received their shoes around two
weeks, so they had positive feelings about delivery time. There were mainly three reasons
for faster delivery time than the previous time. The first on most common reason was that
the company had already made each consumer’s shoe last, and they did not have to make
it again or only had to adjust the last a little based on the second order. The second reason
was that the time period was not in the holiday seasons, so the company had extra time to
make shoes quickly. The last reason was that the company became familiar with handling
custom information and production efficiently. In this second phase, all participants had
positive opinions about delivery time.
In Phase One, only ten percent of the participants were concerned about the order
or the product. In Phase Two, more participants (30%) were concerned about the order
and the product. Before wearing shoes, most participants had positive opinion about
shoes. Thirty-five percent of participants said that the shoes matched the color they
expected. Sixty-five percent of the participants had either positive or negative opinions
about the color matching compared with the pictures in the web site. Three participants
mentioned that the better color than she expected. Color is the one of the major issue on
the web site shopping (Web consumers, 1999). For negative opinion, they felt that the
colors were not accurate on the web site. Seven participants noted that the color was little
lighter than they expected.
In summary, for Phase Two in comparison to Phase One, the delivery time was
shorter for all participants, and all participants were satisfied with the delivery time. The
participants continued to be concerned about color matching and commented that the
color of the web site was not accurate when compared to the actual product.

93
Questionnaire 8 - After Consumption Stage and Total Evaluation Stage
After receiving the second pair of shoes and completing the interview, all
participants were asked to wear their shoes for a while. All participants wore them for 2 –
18 minutes. The largest number of participants wore their shoes for 6 - 10 minutes (40%)
and the next largest group wore their shoes 11 – 15 minutes (25%). The time range was
dependent on depending how they fit their shoes. Participants whose shoes fit well tended
to wear shoes longer than participants whose shoes did not fit well in Phase One and
Two. Participants were then asked to evaluate the total process. Overall, most participants
had positive impressions about the shopping even though some did not receive good fit in
their shoes. Some participants had strong negative opinions about this Internet shopping.
Two participants expressed “I would not buy again”.
Seventy-five percent of participants indicated that the first order was difficult and
the second order was much easier. One participant said that the next purchase would be
much faster. The researcher asked about the overall quality of product and services.
Seventy-five percent of the participants were satisfied or very satisfied about overall
quality of product in Phase Two. This number of participants is the same as the number
in Phase One. Most participants (85%) were satisfied or very satisfied about the overall
quality of services in Phase Two. This number is also the same as the number of in Phase
One. Sixty percent of participants noted that this pair of shoes was better than expected
from the web site. However, one participant was very dissatisfied with both products and
services because of fit and delivery time.
Most participants’ shoes (90%) fit well around the arch and in the width. This
purchasing was the same as with the first pair of shoes. Of the remaining participants
(10%), their shoes did not fit around the arch because their feet were a little wider than
their shoes. This problem is the same problem as with the first pair. Seventy percent of
the shoes fit well in terms of foot length in Phase Two. A few shoes (15%) did not fit
well because the participants had a little long foot length or a half size difference between
the right and left feet. Some participants (20%) had shoes that did not fit well in Phase
One and also had shoes that did not fit well in Phase Two.
The researcher inquired of participants whether they would return the shoes or
not. Sixty percent of participants did not want to return their shoes because the shoes fit

94
well; however, 35% of participants wanted to return their products. The main reason was
that the shoes were a larger size, and the next reason was a half size difference between
right and left feet. One participant wanted to return her shoes because the color did not
match although she was satisfied with other factors such as fit and quality.
Seventy percent of participants wanted order shoes again. Some participants noted
that they would order shoes next season. Three participants indicated that they might
order again if the manufacturer would fix the mistakes quickly without extra cost because
they could not find shoes, which fit well and were of high quality in the retail market.
Fifty percent of participants did not want to order again because the shoes did not fit well
twice. These participants can easily find their shoes at stores. A few participants (15%)
said they did not know what they would do about ordering in the future. They had no
current need or desire for additional shoes. One participant expressed that “I like to wear
different shoes, so I may try to find shoes from different companies”.
Participants were asked to score their reactions to categories on a Likert-type
scale (1 – very dissatisfied to 7 – very satisfied) for overall evaluation. For evaluation of
the entire experience, most participants (75%) rated their experiment in the satisfied
levels (Avg.=6.1). Twenty percent of the participants indicated that they were dissatisfied
with the overall experiment (Avg.=2.3) even though some participants indicated positive
levels for comfort and quality. Participants who were dissatisfied had fit problems. Fit
was the major reason for dissatisfaction or a low evaluation score. The other reason was
product-related problems: mismatched color and lack of styles and colors. Some
participants consistently noted that color of the real shoe did not match the color on the
web site, especially the navy blue. One participant indicated that although the fit was very
good, the color was different from the web site; therefore, she wanted to return them.
Finally, reasons that would prevent ordering on the Internet were asked of the
participants. Participants noted a variety of reasons. Ten participants (50%) noted that
they could not touch and see products; therefore, they worried about fit, comfort,
materials and color of products, especially for apparel and shoes. Six participants (30%)
were also concerned about security issues such as payment and credit cards, and other
services such as return policy and cost of shipping and handling. At the same time, some
participants stated positive reasons for shopping on the Internet. Three participants (15%)

95
emphasized that they liked Internet shopping because they could control their shopping
time. This reason was especially important to a person who has children. Location was
also indicated as a positive reason. One participant indicated that she lived in a rural area,
so it was easy to shop on the Internet. Another participants noted that she sometimes
wanted to buy a product that was sold far from home, and she could contact a company
by the Internet easily. Participants indicated that if price of the product on the Internet is
less than in the store that would be a positive reason to shop on the Internet. Two
participants (10%) did not worry about the Internet shopping at all.
In summary, most participants felt confident in their Internet shopping abilities.
Their experiences in Phase One had an impact on their encounters in Phase Two. For
some variables, a large variance was observed in the response of the participants at this
stage. More than one-half of the participants did not want to return their shoes because of
a good fit. A few participants were very dissatisfied with their shoes because of fit, and
they wanted to return the shoes and would not purchase again.
Initial Model and Four Sub-Models
This section discusses the results of this research based on the conceptual
framework (see Figure 5) and proposes the next research. The conceptual framework
consists of four factors: market environment, manufacturers, consumers, and the
encounter between manufacturers and consumers (see Figure 5). Among the four factors
in Figure 5 are two segments of the fashion industry pipeline (i.e., manufacturers and
consumers). They are shown by two boxes, which include a listing of their pertinent
characteristics. The interaction between these two market sectors is represented by the
box between manufacturers and consumers. The interaction involves the characteristics
of the encounter (i.e., goods and services). The relationship as shown in this model
between manufacturers and consumers is developed through direct communication. The
overall market environment including direct relationship and services orientations
influences manufacturers and consumers.
This model indicates one single moment of the relationship between a
manufacturer and consumers. In reality, consumers may develop long-term relationships
with companies. To explain long-term relationships between a manufacturer and

96
consumers, the two phase, spiral relationship model was developed (see Figure 6 and
Figure 7). These multiple phase models represent the flow of activities in the relationship
between a manufacturer and consumers; therefore, each stage is not clearly divided from
the next stage. No clear division or barrier exists between any two stages. This model
treats consumption as a process instead of a single action.
The Initial Relationship Spiral Model (see Figure 10) was proposed from the data
from the study and represents as integration of the conceptual framework and the
relationship spiral models. The vertical line in Figure 10 represents the time span of the
relationship. The horizontal line in Figure 10 represents the relationship distance between
a manufacturer and consumers in the encounter. Distance shows how the relationship
between companies and consumers is closely tied (Asai, 1989; Gassenheimer, et al.,
1995). The centerline shows the consumer’s position and locates in the center of the
encounter. The spiral line represents the distance between the manufacturer and
consumers in the encounter in each phase. This distance is evaluated by how the distance
from the centerline (radius) changes in each phase.
The literature indicates that when long-term relationships are developed between
companies and consumers, the distance (i.e., closeness or tightness) between companies
and consumers becomes shorter (Gronroos, 1990; Jackson, 1985). This change in
relationship distance was supported in this research. For example from this experiment,
most participants were anxious about this shopping experience at the beginning of the
procedure. They did not know the entire process of this shopping and could not touch and
see the real product through the web site; therefore, the distance between the
manufacturer and consumers was extensive. The radius of the circle in Phase One was
large. After participants received a real product and were satisfied with the product in
Phase One, they became confident and comfortable in this shopping experience.
Evidence of this increased confidence level and reduced distance is that some participants
whose shoes fit well did not measure their feet again. In Phase Two, the shopping time of
all participants was reduced to almost one-half of the time in Phase One. Most
participants were either not anxious or were less anxious about the second shopping. This
low level of anxiety is another indicator of reduced distance. For these reasons, the

97
Q1 *
Q2
Q3, Q4*
Q5
Q6
Q7, Q8*
ManufacturerConsumers
Phase Next
Phase Two
Phase One
Distance
Figure 10. Initial Relationship Spiral Model.
Q* = Questionnaire 1 ~ 8

98
distance between the manufacturer and consumers is considered shorter in Phase One
than Phase Two, and the spiral in the Phase Two became narrower than the spiral in the
Phase One. This finding was further supported by comments from the participants. All
participants expressed that the second order was much easier and they were more
confident compared with the first order.
In the original model (see Figure 5), the encounter is detailed only as products and
services. As a result of the study, the variables of the distance in the encounter are
identified as the following: (a) Specific Product and Services, (b) Overall Products and
Services, (c) Specific Reactions, and (d) Overall Evaluation. Specific Products included
two pairs of shoes. For this variable, participants were measured on expectation and
experience of the product. This variable included the categories of fit, comfort, quality,
style, and color. Each category was measured both qualitatively and quantitatively. The
quantitative measure used a numeric scale of 1 – very dissatisfied to 7 – very satisfied.
Overall Product and Services was measured through the participants’ reactions to
delivery time and other services. Other services included ease of the web usage (i.e.,
ordering system, self-measurement direction), providing correct information (i.e., color,
pictures of products, a variety of products and color). Overall Products and Services was
measured on a scale of 1 – very dissatisfied to 7 – very satisfied. Specific reactions to the
products and services included anxiety and other complaints, desire for returning the
product, and desire for ordering products again. Overall Evaluation was measured on a
scale of 1 – very dissatisfied to 7 – very satisfied.
Based on the revised model and the improved definition of distance, the
researcher classified participants into four groups (Table 6). Group 1 included
participants who were becoming close to the company from Phase One to Phase Two
(N=9). The spiral became narrower from Phase One to Phase Two. This group included
participants whose shoes fit well in both Phases and who were overall satisfied with both
goods and services. Group 2 included participants who were becoming more distant from
the company from Phase One to Phase Two. The spiral became wider from Phase One to
Phase Two (N=4). This group included participants whose shoes did not fit well in both
Phases and who were overall not satisfied with both goods and services. Group 3

99
Table 6. Summary of the Groups.
Group Number of participants The classification of participants
1
9
• Becoming close to the company from Phase One to
Phase Two. The spiral became narrower from Phase
One to Phase Two.
• Participants whose shoes fit well in both Phases and
who were overall satisfied with both goods and
services.
2
4
• Becoming more distant from the company from Phase
One to Phase Two. The spiral became wider from
Phase One to Phase Two.
• Participants whose shoes did not fit well in both
Phases and who were overall not satisfied with both
goods and services.
3
2
• Becoming close to the company in Phase One and
getting more distant from the company in Phase Two.
The spiral became narrower in Phase One and became
wider in Phase Two.
• Participants whose shoes did fit well in Phase One and
did not fit well in Phase Two and who were satisfied
with both goods and services in Phase One and not
satisfied with both goods and services in Phase Two.
4
5
• Becoming more distant from the company in Phase
One and getting close in Phase Two. The spiral
became wider in Phase One and became narrower in
Phase Two.
• Participants whose shoes did not fit well in Phase One
and fit well in Phase Two and who were not satisfied
with both goods and services in Phase One and were
satisfied with both goods and services in Phase Two.

100
included participants who were becoming close to the company in Phase One and getting
more distant from the company in Phase Two (N=2). The spiral became narrower in
Phase One and became wider in Phase Two. This group included participants whose
shoes did fit well in Phase One and did not fit well in Phase Two. These participants were
satisfied with both goods and services in Phase One and not satisfied with both goods and
services in Phase Two. Group 4 included participants who were becoming more distant
from the company in Phase One and getting close in Phase Two (N=5). The spiral
became wider in Phase One and became narrower in Phase Two. This group included
participants whose shoes did not fit well in Phase One and fit well in Phase Two. They
were not satisfied with both goods and services in Phase One and were satisfied with both
goods and services in Phase Two.
Using the initial relationship spiral model (see Figure 10) as the generic
relationship, the researcher developed four sub-models to represent the groups based on
the distance variables and fit and satisfaction characteristics: Model I for Group 1, Model
2 for Group 2, Model 3 for Group 3 and Model 4 for Group 4 (see Figure 11 - 14
respectively).
Model 1 for Group 1. Overall, all participants in this group made similar
responses before order stage (Questionnaire 1) and after order stage (Questionnaire 2) in
Phase One with a mix of positive and negative opinions reflected in the variables on
services related to the web site (see Figure 11). Some of these participants had anxiety
about payment, return policy, fit, and self-measurement. All participants were a similar
distance from the manufacturer at the beginning of Phase One. In the final stage of Phase
One (after consumption stage), all the participants in Group 1 responded positively about
this shopping in the Overall Products and Overall Evaluation variables. Expectations for
some participants were not met for the variables about delivery time and color. Total
average for each category of the product (i.e., fit, comfort, quality, style, color) in after
consumption stage exceeded total averages of expectations both in after order stage and
before consumption stage. All participants in Group 1 had the highest level of satisfaction
of the overall quality of product and services in Phase One when compared to Group 2,

101
Q1 *
Q2
Q3, Q4*
Q5
Q6
Q7, Q8*
Manufacturer
Participants
Phase Next
Phase Two
Phase One
Distance
Figure 11. Model 1 for Group 1.
Q* = Questionnaire 1 ~ 8

102
Q1**
Q2
Q3, Q4*
Q5
Q6
Q7, Q8*
Manufacturer
Participants
Phase Next
Phase Two
Phase One
Distance
Q* = Questionnaire 1 ~ 8
Figure 12. Model 2 for Group 2.
103
Q1**
Q2*
Q3, Q4*
Q5*
Q6*
Q7, Q8*
Manufacturer
Participants
Phase Next
Phase Two
Phase One
Distance
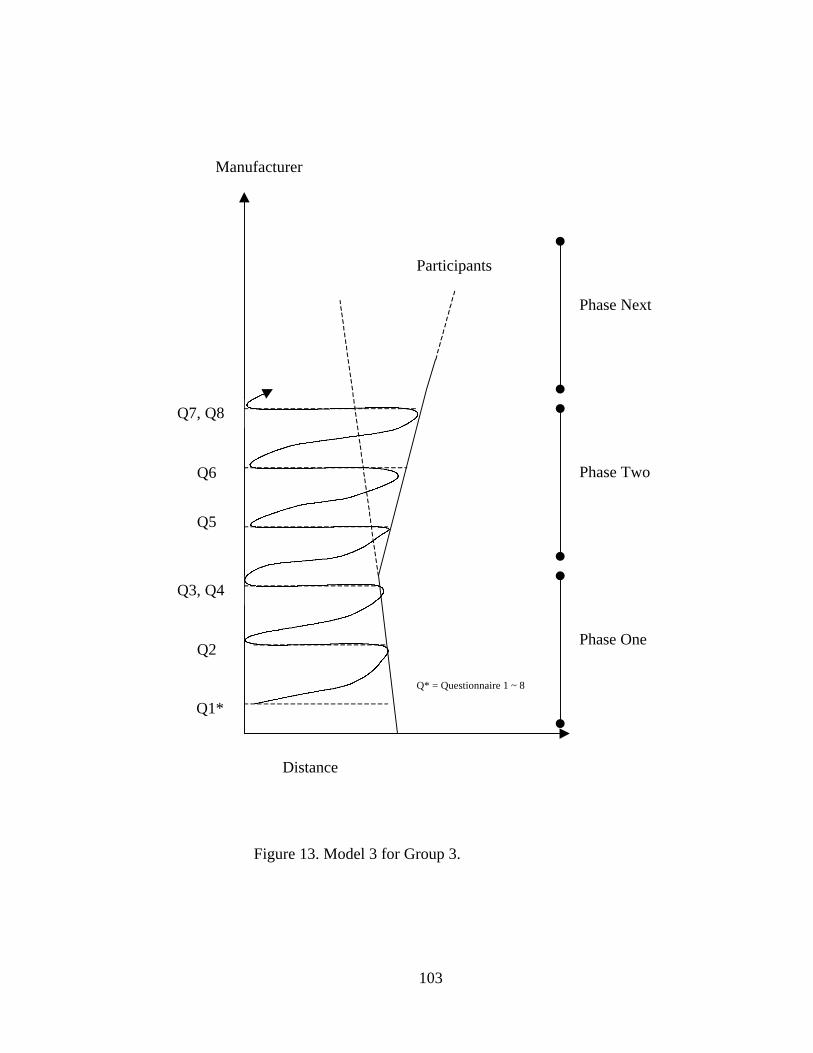
Figure 13. Model 3 for Group 3.
Q* = Questionnaire 1 ~ 8

104
Q1 *
Q2
Q3, Q4*
Q5
Q6
Q7, Q8*
Participants
Manufacturer
Phase Next
Phase Two
Phase One
Distance3.
Figure 14. Model 4 for Group 4.
Q* = Questionnaire 1 ~ 8

105
Group 3 and Group 4. The average total score was 12.7 (total 14) compared with 8 for
Group 2 for product and services. In total evaluation stage, some participants worried
about this first order and wished for more variety of styles and colors; however, all the
participants did not want to return their shoes because they fit well and were of a better
color than the pictures on the web site. Most participants (90%) wanted to order a pair of
shoes again, especially participants who could not find shoes easily in stores, but ten
percent of participants said “maybe” or “not soon”. The further the process proceeded in
Phase One, the more the group of participants had positive opinions of this shopping
experience. As judged by the participants’ responses, the distance between the
participants and the manufacturer at the end of Phase One became closer than the
distance at the beginning of Phase One.
At the beginning of Phase Two (i.e., initial stage, order stage, after order stage),
all the participants in Group 1 commented positively about custom made shoes. Overall
expectation in these stages was higher than that in Phase One. Total average for each
category of the product (i.e., fit, comfort, quality, style, color) in after consumption stage
exceeded both total averages of expectations in initial and order stage and after order
stage. All the participants in Group 1 had a higher level of satisfaction of the overall
quality of product and services in Phase Two than other groups. In initial stage and order
stage, three participants wanted to know information about the production process and
desired a confirmation of the order. Only one participant expressed that she still had
anxiety because she had not received the product she ordered. One participant wanted to
return the shoes because they were of a lighter color than what she had expected. One
participant could not decide if she wanted to return the shoes because she wanted to wear
them for a while (i.e., a couple of months).
When asked about reordering, most participants (66.7%) wanted to order a pair of
shoes again. Some participants (22.2%) said that they could not decide about re-ordering
a pair of shoes at that time because they wanted to try the shoes for a couple months, or
said that a desire to reorder depended on what other styles and colors were offered. Lack
of interest in reorder was often dependent on personal shopping demands and not on the
manufacturer’s activities.

106
All the participants were satisfied with the entire shopping experience both Phase
One and Phase Two. The longer the process proceeded in Phase Two, the more
participants had positive opinions of this shopping experience. The distance between the
manufacturer and consumers at the end of Phase Two became closer than that at the
beginning of Phase Two. Although the distance was reduced, participants still had
anxiety about Internet shopping. Jackson (1985) stated that to develop close relationships
with consumers is very difficult because of the complexity of real life. Specifically,
participants thought that with Internet shopping, they had difficulty predicting the exact
look and fit of products and material. They also worried about payment and return policy.
Model 2 for Group 2. In the final stage of Phase One (after consumption stage),
all the participants of Group 2 responded negatively about this shopping experience in
the variables of product, services and overall evaluation (see Figure 12). Although
participants evaluated highly other categories, their expectation was not met concerning
fit even though. Total average for each category of the product (i.e., fit, comfort, quality,
style, color) in after consumption stage dropped from total average of expectations in
before consumption stage. All the participants had scores in the dissatisfied or very
dissatisfied levels when evaluating the overall quality of product and services in Phase
One. The average total score was 8 (total 14) compared to 12.7 in Group 1 and 10.6 in
Group 4 for products and services. Delivery time for this group, on the average, was
similar to other groups; however, these participants were dissatisfied because of fit
problems and late delivery time. Fit for this group was worse than fit for any other
groups. All the participants wanted to return their shoes because of fit problems;
however, all the participants wanted to order a pair of shoes again because they said that
everything was better than they expected. The longer the process proceeded in Phase
One, the more the group of participants had negative opinions in this shopping
experience. The distance between the participants and the manufacturer at the end of
Phase One became farther than that at the beginning of Phase One.
At the beginning of Phase Two (initial stage and order stage and after order
stage), the participants commented about custom shoes with a mix of positive and
negative opinions. Overall expectation in these stages was lower than that of Phase One.
Total average for each category of the product (i.e., fit, comfort, quality, style, color) in

107
after consumption stage dropped below total average of expectations both in after order
stage and before consumption stage. All the participants had scores in the dissatisfied
levels for the overall quality of product and services in Phase Two. At the end of Phase
Two, all participants wanted to return their shoes because of fit problems. Most
participants did not want to order a third pair of shoes because of failing twice in securing
a satisfactory pair of shoes. One participant would desire to order again if the company
had more variety of shoe styles and colors. All the participants had scores in the
dissatisfied and very dissatisfied levels for the entire shopping experience (Phase One and
Phase Two combined). The score average was 3 compared with 6.4 in Group 1 on the
scale of 1 – very dissatisfied to 7 – very satisfied. The longer the process proceeded in
Phase Two, the more participants had negative opinions of this shopping experience. As
judged by the distance variables, the distance between the manufacturer and consumers at
the end of Phase Two became further than the distance at the beginning of Phase Two. In
this relationship, there are many intangible and unexpected elements, which when not
controlled, can create an increase in distance. To minimize this distance expansion from
happening and not to end the relationship, companies must carefully handle the encounter
(Bateson, 1995). The feedback from the consumer is vital to maintain the long-term
relationship with consumers (Gronroos, 1997).
Model 3 for Group 3. In the final stage of Phase One (after consumption stage),
all the participants of Group 3 responded positively about this shopping experience for
the overall variables (see Figure 13). Their expectations were not met concerning fit, but
they did not choose to return the shoes because they could wear them anyway. Total
average for each category of the product (i.e., fit, comfort, quality, style, color) in after
consumption stage dropped a little from total average of expectations in after order stage
and before consumption stage; however, all the participants had scores in the satisfied
levels for the overall quality of product and services in Phase One. The average total
score was 12 (total 14) compared with 8 in Group 2 for products and services. All the
participants did not want to return their shoes because fit and quality were sufficient for
them. Also, all the participants wanted to order a second pair of shoes because they felt
that product quality was better than they expected and the shoes were very comfortable
even though they did not fit. One participant noted that she did not have many choices in

108
stores because of the size and shape of her foot. That reason could answer one of the
Berry’s issues (1995): what types of customers are most receptive to relationship
marketing? Consumers who can not find satisfactory products in standardized
assortments may be willing to enter a long-term relationship to achieve an improved
product. The longer the process proceeded in Phase One, the more the group of
participants had positive opinions concerning this shopping experience. A consumer, who
can not easily find shoes in stores, might accept the long-term relationship once the
consumer is involved in the relationship. The distance between the participants and the
manufacturer at the end of Phase One became closer than at the beginning of Phase One.
At the beginning of Phase Two (initial and order stage and after order stage), the
participants commented about custom made shoes with a mix of positive and negative
opinions. At the end of Phase Two, the total average for each category of the product
(i.e., fit, comfort, quality, style, color) in after consumption stage dropped from the total
averages of expectations in all stages in Phase Two. All the participants had scores in the
dissatisfied or very dissatisfied levels for the overall quality of product in terms of final
fit in Phase Two. All the participants had scores in the satisfied or very satisfied levels for
the overall quality of services in terms of delivery time in Phase Two. The shoes were
delivered in less than two weeks. All the participants wanted to return their shoes because
of fit problems. One participant would order again as long as the company had a good
return policy because she could not find her shoes easily in stores and liked the style,
quality and arch support. This result further supports the long-term relationship as
defined in the Berry’s issues (1995). All the participants had scores in the dissatisfied or
very dissatisfied levels for the entire shopping experience. The score average was 3.5
compared with 6.4 in Phase Two of Group 1 on the scale of 1 – very dissatisfied to 7 –
very satisfied. The longer the process proceeded in Phase Two, the more participants had
negative opinions for this shopping experience. The manufacturer and consumers at the
end of Phase Two became farther apart than at the beginning at Phase Two.
In this relationship as with Group 2, there are many intangible and unexpected
elements, which are inevitable. To minimize the negative experience and to not end the
relationship, companies need to carefully handle the encounter (Bateson, 1995).

109
Model 4 for Group 4. In the final stage of Phase One (after consumption stage),
all the participants of Group 4 responded positively about this shopping experience for
the overall variables, but all participants’ shoes did not fit well. So most of the
participants wanted to return a pair of shoes. Although participants evaluated other
categories high, their expectations were not met concerning fit. The total average for each
category of the product (i.e., fit, comfort, quality, style, color) in after consumption stage
dropped from the total averages of expectations in all stages in Phase One. Most
participants (60%) had lower satisfied levels than Group 1 and Group 3 for the overall
quality of product and services in Phase One because of fit problems and late delivery
time. The score average was 10.6 (total 14) compared with 12.7 in Group 1 and 12 in
Group 3 for product and services. Three participants emphasized that they wanted to
order because they couldn’t find shoes because of size and fit problems. The longer the
process proceeded in Phase One, the more the group of participants had negative opinions
about this shopping experience. The distance between the manufacturer and the
participants at the end of Phase One became farther than the distance at the beginning of
Phase One. These participants also had fit problems as in Group 2, but they reacted more
patiently than Group 2. Difference could be because the participants in Group 4 had more
serious foot problems than those of Group 2. One participant in Group 4 expressed that
she went to thirty different shoe stores, but she could not find a pair of shoes that fit.
In the final stage of Phase Two (after consumption stage), all the participants
responded positively in the overall variables about this shopping experience. Total
average for each category of the product (i.e., fit, comfort, quality, style, color) in after
consumption stage exceeded total averages of expectations in before consumption stage.
All participants had scores in the satisfaction levels of the overall quality of product and
services in Phase One. The average total score was 11 (total 14) compared with 10.6 in
Phase One 1 for product and services. In the total evaluation stage, some participants
worried about security and return policy. All the participants wanted to keep their shoes
because they fit or were well-matched to what participants had ordered. All participants
wanted to order a pair of shoes again, especially participants who could not find shoes
easily in stores, but some participants said they would not order again soon. One
participant said that she needed to wear the shoes for a while and would reorder when

110
needed. One participant expressed that she would order more shoes if the company had
her last and would adjust it to fit perfectly for her feet. This benefit (customized
information) could answer Bitner’s question (1995): what are benefits from the
customer’s perspective of staying in a service relationship? Customization provides
consumers with a product that can not be otherwise obtained. All the participants were
satisfied with the entire shopping experience. The score average of Group 4 was 5.8
compared with 6.4 in Group 1 for product and services. The further the process
proceeded in Phase Two, the more the group of participants had positive opinions in this
shopping experience. The distance between the participants and the manufacturer at the
end of Phase Two became closer than that at the end of Phase One.
Demographic profiles of the four groups. Across the four groups, the
demographic characteristics and shopping orientation were examined. For many variables
(i.e., expenditure for shoes, working status, computer skill, age), no difference was
observed across the four groups. This finding about shopping for shoes is in contrast to
the general literature of consumer behavior that suggests that these variables are a basis
for segmentation (e.g., Engel, Blackwell, & Miniard, 1995; Lewison, 1991).
Group 1 remained positive about the experience throughout both phases.
Although these participants were easy to fit and positive about their shoes, they did have
complaints about the lack of variety in style and the limited number of colors and the
match of color between the Web site and the actual product. This difference appeared to
be related to variations in shopping orientation across the groups. As a general measure
of shopping orientation, the participants in Group 1 were different from those in Groups
2, 3, and 4. Group 1 was more sensitive to brand, price and convenience than the other
groups. For example, one participant in Group 1 said, she shopped at least once a week,
and expected her favorite stores to have new merchandise every time she shopped. She
wanted to see new products and new discounts – change, something new and deep
discounts.
In this study, a difference in past experience is noted across the four groups. The
difference is between Group 1 and the remaining groups. In general, the participants in
Groups 2, 3 and 4 had what they considered to be bad past experiences in shopping for
shoes. The reason they had had bad experiences was their problems with finding a shoe

111
that fit to their satisfaction. When asked how difficult they were to fit for shoes, the
participants in Groups 2, 3 and 4 rated themselves from very difficulty to extremely
difficult. On the other hand, the participants in Group 1 rated themselves as not difficult
or only somewhat difficult to fit. Group 1 could be considered as the easy to fit group.
Some members of Group 1 expressed that they would not need custom shoes because
they liked to shop and had no problems in finding shoes.
A third difference in characteristics of the groups was the presence of small
children in the family. Group 1 participants had none or only one child in the family.
Some of Group 2, 3 and 4 participants had two or more children in the family. Those with
multiple children in the family were more interested in Internet shopping. This difference
impacted the willingness of participants to go to the post office to return the product;
therefore, when the product did not fit these participants were especially disturbed about
the lack of match between their expectations and their experience.
Next Phase
The four sub-models (see Figure 11 - 14) were proposed based on the initial
relationship spiral model (see Figure 10). The shopping experiment was conducted twice
(Phase One and Phase Two); however, in real life consumers will continue over long
periods to conduct shopping activities. For a long-term perspective, the researcher
predicted the next stage (Next Phase) for the spiral model based on the results of the sub-
models for each group: Group 1, Group 2, Group 3 and Group 4.
Providing a custom made shoe that has a satisfactory fit is not the simple direct
variable for predicting reorder activity (i.e., long-term relationship). For example, the
participants inGroup1, although they were satisfied with the shoes, would not purchase
shoes again from this manufacturer. On the other hand, the participants in Group 4 would
purchase them again, and they didn’t receive shoes, which fit well. A reorder would be
made by participants in Group 4 because some participants could not easily find their
shoes at stores. Also, some participants in Group 2 might not purchase shoes again
because they could find them at stores easily, and they received shoes, which did not fit
well at Phase Two. That reason could answer Bitner’s (1995) question (and specific
question of the researcher): Why does the consumer end the relationship? Overall quality

112
(e.g., fit and color), needs, expectation, time and other variables were parts of the
decision to reorder or from the manufacturer’s perspective to maintain the relationship
with consumers. Berry (1995) suggested that business should determine which types of
consumers had the potential to maintain the relationship. For example, one participant
mentioned that she only went to local stores when she wanted to have some products
such as groceries or business shoes for tomorrow, and she would rather order a pair of
shoes on the Internet for a party next month or next week. Therefore, timing of needs and
purpose of product are important for the reordering of products.
The best potential participants, for this type of custom shopping, have serious
problems with their feet, and have limited time for shopping because they are full-time
workers or full-time students. Based on this research, custom made shoes from the
Internet are not necessary or desirable for all participants. Some of the participants
enjoyed shopping at stores and wanted to touch and wear shoes. Moreover, four
participants did not want to communicate with manufacturers directly even though the
participants received good fitting shoes in this shopping experiment (Phase One and
Phase Two). These participants also enjoyed shopping at stores and could find their shoes
easily. These findings support Gronroos’ (1995) opinion that every consumer does not
want to get into this relationship. Some consumers only want to be involved in a single
relationship (i.e., single exchange).
Participants who had serious problems with their feet were particularly interested
in this shopping experiment. Although she did not receive a good fit, one participant still
wanted to reorder a pair of shoes if the company fixed problems without charging. Some
participants have made an extra effort to find good fitting shoes in the latest styles and
color. They did not want orthopedic shoes. They visited many shoe stores or department
stores and used special sized shoe catalogs. Some local stores adjust their shoes to a
customer’s foot shape. In the interview, three participants had difficulty finding their size
because most companies produce the sizes from 6 to 10. No half sizes are made above
size 9; therefore, they could not easily find 10 1/2 size shoes. Participants’ experiences
and their stories about shopping indicated serious fit problems when someone had a
difference in the sizes between their feet. Some participants had a half size difference
between right foot and left foot. Basically, they can not buy good fitting shoes nor can

113
they find and the latest style shoes at stores although some local shoe stores try to adjust
to their foot shape.
Participants who had limited time for shopping were also interested in this
shopping experiment. The main reason was that they had one or two children and were
full-time workers or full-time students; therefore, they did not have extra time for
shopping at stores. When they have time for shopping, they can not concentrate on their
shopping with their children at shopping mall. The participants can control shopping time
(e.g., after children went to bed) and choose a variety of products from Internet shopping.
Kotler (1997) stated that “in niches there are riches”(p. 196); therefore, these consumers’
demands could be a profitable niche market in the near future.