204042orig1s000 - food and drug administration · center for drug evaluation and research...
TRANSCRIPT

CENTER FOR DRUG EVALUATION AND RESEARCH
APPLICATION NUMBER:
204042Orig1s000
SUMMARY REVIEW


Division Director Review
Page 2 of 27
Janssen Pharmaceuticals has conducted a diabetes development program similar to several recently approved anti-diabetic therapies. This included evaluation of the efficacy and safety of canagliflozin as monotherapy and combination therapy alongside several commonly prescribed anti-diabetic agents. In addition, the applicant proposed a prespecified meta-analysis plan to evaluate cardiovascular safety of canagliflozin in accordance with the December 2008 Guidance for Industry1 that incorporates the interim results of an ongoing cardiovascular outcomes trial (CVOT).
2. Background The IND for canagliflozin was opened on May 25, 2007. Since that time the FDA has issued the Guidance for Industry titled “Diabetes Mellitus – Evaluating Cardiovascular Risk in New Antidiabetic Therapies to Treat Type 2 Diabetes”, which has impacted all new anti-diabetic therapies under development. In brief, the Guidance outlines expectations for applicants seeking approval of a new anti-diabetic therapy to provide a prospective CV risk assessment of the drug/biologic. To balance the timely availability of new anti-diabetic therapies while ensuring acceptable CV safety, a proposal was put forward to require companies to exclude two different thresholds of CV risk. A higher threshold could be accepted in the pre-marketing stage followed by the exclusion of a lower risk margin as a required post-marketing trial under Section 505(o)(3) of the Federal Food, Drug, and Cosmetic Act.2 The guidance defined these two risk margins as the upper bound of the two-sided 95% confidence interval for the estimated risk ratio of important CV events between the investigational agent and control group being less than 1.8 pre-marketing and 1.3 post-marketing. Initial programs approved shortly after issuance of the Guidance were never considered models for subsequent drug development programs to follow. In particular, the approval of liraglutide and saxagliptin were clear examples of programs “caught in the middle” of a regulatory change for anti-diabetic therapies. These two NDAs were already submitted to FDA when the Guidance was issued and an expectation that their entire Phase 2 and 3 programs be modified at that point to exclude a risk margin of 1.8 was unreasonable. Both liraglutide and saxagliptin have postmarketing requirements to conduct a dedicated cardiovascular outcomes trial to exclude a risk margin of 1.3. Similarly, linagliptin, which was submitted shortly after the Guidance was issued, was given certain latitude in its premarketing CV risk assessment but is also required to conduct a dedicated CVOT postmarketing. Phase 2 trials for canagliflozin were still underway when the Guidance was issued. As a result, the Phase 3 trials could be designed to incorporate plans to exclude an unacceptable level of CV risk. The applicant proposed the conduct of a cardiovascular outcomes trial titled CANVAS along with several Phase 3 trials to be combined in a meta-analysis to demonstrate CV safety. The analysis plan for CANVAS has undergone many modifications since the original protocol submission in August 2009 and will be discussed further in this memo. 1 http://www.fda.gov/downloads/Drugs/GuidanceComplianceRegulatoryInformation/Guidances/UCM071627.pdf 2 See Postmarketing Requirement 2007-5 (http://www.accessdata fda.gov/drugsatfda docs/appletter/2013/022271Orig1s000ltr.pdf).
Reference ID: 3281940

Division Director Review
Page 3 of 27
FDA continues to gain experience since December 2008 on the types of CV safety data that would be acceptable in the pre- and post-marketing setting. For example, it has generally been accepted that a well-planned meta-analysis of several Phase 2 and 3 trials to exclude a CV risk margin of 1.8 based on the composite of CV death, nonfatal MI, nonfatal stroke, and unstable angina (also referred to as MACE+) can provide reasonable assurance of CV safety without presenting an undue burden to companies and delaying the availability of new therapies. However, the long-term goal for these programs is to provide more definitive evidence of CV safety and these data should be derived from robust trials based on the specific CV composite endpoints of CV death, nonfatal MI, and nonfatal stroke (or MACE). This would typically be conducted as a dedicated postmarketing CV outcomes trial which could be initiated prior to NDA/BLA submission. Since issuance of the December 2008 CV guidance, many different approaches to demonstrate an acceptable CV safety profile have been proposed by companies, including reliance on a single trial to exclude both CV risk margins. The single trial would have a stated objective of excluding a 30% excess CV risk3; however, an interim analysis of the single trial could be performed to exclude the 1.8 risk margin with appropriate statistical procedures set in place. At issue is maintaining confidentiality of the interim trial results to ensure the integrity of the ongoing portion of the trial while providing transparency to the public on how FDA has reached its benefit-risk assessment supporting market approval. The canagliflozin clinical development program provides us with an example of how the lessons learned since the December 2008 CV guidance was issued are coming into play today. Please refer to the cross-discipline team leader (CDTL) memo provided by Dr. Jean-Marc Guettier who has provided an excellent description of each scientific discipline’s program and the relevant issues in consideration of approval.
3. CMC/Device Please see reviews by Dr. Sheldon Markofsky. CMC has recommended approval with no postmarketing requirements.
4. Nonclinical Pharmacology/Toxicology Please see reviews of Drs. Daniel Minck and Fred Alavi for details of the pharmacology/toxicology program. They and pharmacology/toxicology supervisor, Dr. Todd Bourcier, recommend approval. Key findings from their reviews affecting labeling or postmarketing recommendations are summarized below. Developmental Toxicology Findings
3 Some programs have designed a single trial to demonstrate superiority which if successful would meet the requirements of excluding a 30% excess CV risk
Reference ID: 3281940


Division Director Review
Page 5 of 27
the increased incidence of tumors. Increases in LH levels were not observed in the clinical program leading pharmacology/toxicology reviewers to conclude minimal risk for such tumors in humans. The applicant attributed the increased renal and adrenal tumors to carbohydrate malabsorption due to inhibition of SGLT-1 receptors in the intestine. The glucose malabsorption triggers a cascade of events including an increased acidic intestinal environment that facilitates calcium absorption. Literature submitted and references to the nonclinical program of acarbose4 were reviewed by pharmacology/toxicology reviewers and this was deemed a plausible mechanism for tumor findings in rats. Numerical imbalances of bladder cancer identified in the clinical program of another SLT2-inhibitor, dapagliflozin, were not observed with canagliflozin. Bladder tumors were observed in the rat carcinogenicity study in the high dose groups in both males and females except for one female rat receiving low-dose treatment. None of the findings was statistically significant. Bone Health Nonclinical studies with canagliflozin and other SGLT-2 inhibitors have shown hypersostosis, increased urinary calcium excretion, decreased PTH and 1,25-OH Vit D, and increases in bone turnover markers in rats. These nonclinical findings have been attributed to the carbohydrate malabsorption and increased calcium absorption described above. Nonclinical studies in which fructose was substituted for glucose did not show similar effects of drug on calcium absorption, bone accretion rates or turnover markers. Since fructose is not dependent on SGLT-1 transporters for intestinal absorption, it was concluded that glucose malabsorption due to SGLT-1 inhibition played a causal role for adverse bone effects in rodents. Evaluations in the clinical development program, including a small study assessing for carbohydrate malabsorption, did not support a conclusion that these nonclinical findings are of clinical relevance. The applicant prospectively evaluated the clinical risk to bone health in a dedicated Phase 3 trial. Please see Clinical safety section for a discussion of these findings.
5. Clinical Pharmacology/Biopharmaceutics Please see the review authored by multiple clinical pharmacology reviewers dated 6 February 2013 wherein approval is recommended with no postmarketing requirements. Thirty-four Phase 1 studies were conducted including a tQT study, 12 drug-drug interaction (DDI) studies and two special population studies (hepatic and renal impairment). Please see Table 7 from OCP review for summary of these studies. This section of the memo will only highlight findings relevant to labeling. Based on their review of these trials and several additional post-hoc analyses, approval is recommended but with a titration-based dosing with initiation at 100 mg and increasing to 300 mg, as tolerated and necessary for additional glycemic control. This is in contrast to the applicant’s proposal to limit the use of 100 mg only to patients on diuretics or at risk for volume-related AEs. Canagliflozin is not recommended in patients with eGFR < 40 ml/min/1.73m2. Other recommendations include use of the 300 mg dose in patients taking
4 http://www.accessdata.fda.gov/drugsatfda_docs/label/2012/020482s025lbl.pdf
Reference ID: 3281940
Division Director Review
Page 6 of 27
rifampin due to an observed 52% reduction in canagliflozin exposure in a DDI study. There were no other DDIs of clinical significance. I concur with their recommendation for initiation of canagliflozin at 100 mg with dose titration to 300 mg where clinically appropriate as discussed in selected sections of this memo. The hepatic impairment study enrolled patients with mild or moderate hepatic impairment. No significant effect on canagliflozin PK was observed, hence no dosage adjustment is recommended. OCP is recommending use with caution in patients with severe hepatic impairment based on a conclusion that there is a low likelihood for significant increase in exposure in these patients.
6. Clinical Microbiology Not applicable.
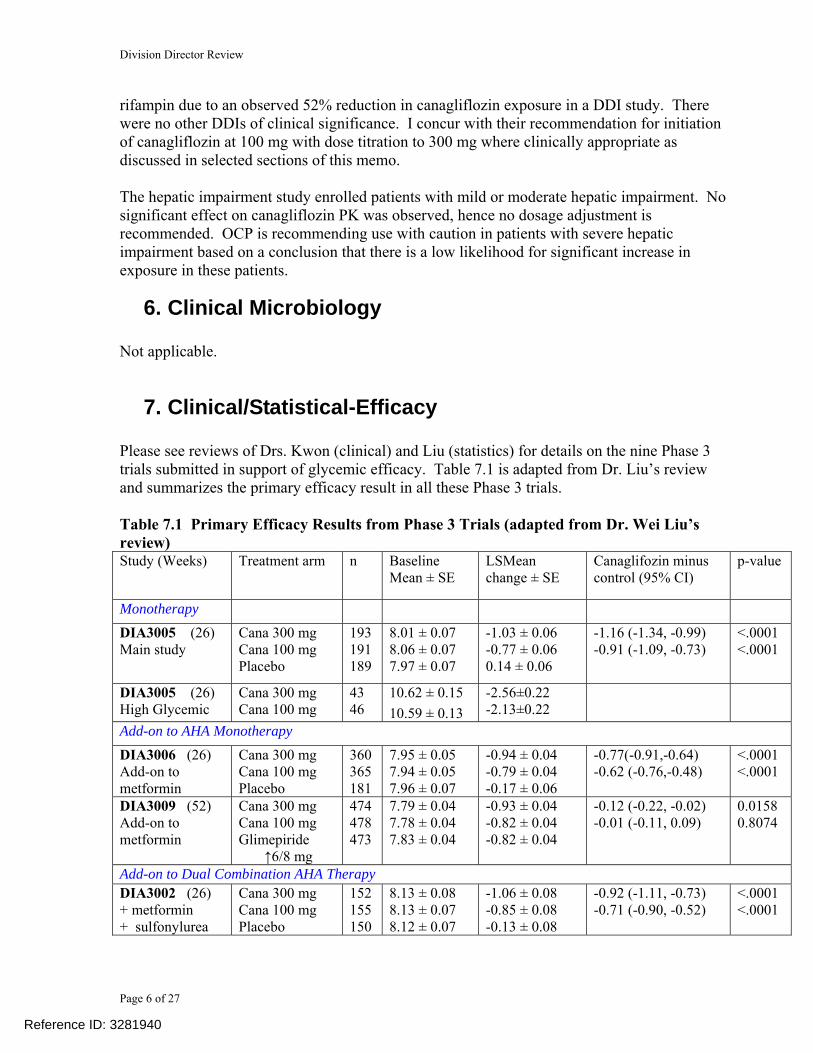
7. Clinical/Statistical-Efficacy Please see reviews of Drs. Kwon (clinical) and Liu (statistics) for details on the nine Phase 3 trials submitted in support of glycemic efficacy. Table 7.1 is adapted from Dr. Liu’s review and summarizes the primary efficacy result in all these Phase 3 trials. Table 7.1 Primary Efficacy Results from Phase 3 Trials (adapted from Dr. Wei Liu’s review) Study (Weeks) Treatment arm n Baseline
Mean ± SE LSMean change ± SE
Canaglifozin minus control (95% CI)
p-value
Monotherapy DIA3005 (26) Main study
Cana 300 mg Cana 100 mg Placebo
193 191 189
8.01 ± 0.07 8.06 ± 0.07 7.97 ± 0.07
-1.03 ± 0.06 -0.77 ± 0.06 0.14 ± 0.06
-1.16 (-1.34, -0.99) -0.91 (-1.09, -0.73)
<.0001 <.0001
DIA3005 (26) High Glycemic
Cana 300 mg Cana 100 mg
43 46
10.62 ± 0.15 10.59 ± 0.13
-2.56±0.22 -2.13±0.22
Add-on to AHA Monotherapy DIA3006 (26) Add-on to metformin
Cana 300 mg Cana 100 mg Placebo
360 365 181
7.95 ± 0.05 7.94 ± 0.05 7.96 ± 0.07
-0.94 ± 0.04 -0.79 ± 0.04 -0.17 ± 0.06
-0.77(-0.91,-0.64) -0.62 (-0.76,-0.48)
<.0001 <.0001
DIA3009 (52) Add-on to metformin
Cana 300 mg Cana 100 mg Glimepiride ↑6/8 mg
474 478 473
7.79 ± 0.04 7.78 ± 0.04 7.83 ± 0.04
-0.93 ± 0.04 -0.82 ± 0.04 -0.82 ± 0.04
-0.12 (-0.22, -0.02) -0.01 (-0.11, 0.09)
0.0158 0.8074
Add-on to Dual Combination AHA Therapy DIA3002 (26) + metformin + sulfonylurea
Cana 300 mg Cana 100 mg Placebo
152 155 150
8.13 ± 0.08 8.13 ± 0.07 8.12 ± 0.07
-1.06 ± 0.08 -0.85 ± 0.08 -0.13 ± 0.08
-0.92 (-1.11, -0.73) -0.71 (-0.90, -0.52)
<.0001 <.0001
Reference ID: 3281940

Division Director Review
Page 7 of 27
DIA3012 (26) + metformin
+ pioglitazone
Cana 300 mg Cana 100 mg Placebo
112 113 114
7.84 ± 0.09 7.99 ± 0.09 8.00 ± 0.09
-1.03 ± 0.07 -0.89 ± 0.07 -0.26 ± 0.07
-0.76 (-0.95, -0.57) -0.62 (-0.81, -0.44)
<.0001 <.0001
DIA3015 (52) + metformin
+ sulfonylurea
Cana 300 mg Sitagliptin 100mg
365 374
8.13 ± 0.05 8.12 ± 0.05
-1.03 ± 0.05 -0.66 ± 0.05
-0.37 (-0.50, -0.25)
<.0001
Special Population DIA3010 (26)1 older adults
Cana 300 mg Cana 100 mg Placebo
229 239 232
7.69 ± 0.05 7.77 ± 0.05 7.76 ± 0.05
-0.73 ± 0.06 -0.60 ± 0.06 -0.03 ± 0.06
-0.70 (-0.84, -0.57) -0.57 (-0.71, -0.44)
<.0001 <.0001
DIA3004 (26)2 Moderate renal impairment
Cana 300 mg Cana 100 mg Placebo
89 88 87
7.97 ± 0.09 7.89 ± 0.10 8.02 ± 0.10
-0.44 ± 0.09 -0.32 ± 0.09 -0.03 ± 0.09
-0.42 (-0.65, -0.19) -0.29 (-0.53, -0.06)
0.0004 0.0131
DIA3008 (18) Sulphonylurea substudy3
Cana 300 mg Cana 100 mg Placebo
39 40 40
8.28 ± 0.16 8.29 ± 0.13 8.49 ± 0.18
-0.79 ± 0.15 -0.70 ± 0.15 0.04 ± 0.15
-0.83 (-1.24, -0.42) -0.74 (-1.14, -0.33)
0.0001 0.0005
DIA3008 (18) Insulin substudy2
Cana 300 mg Cana 100 mg Placebo
572 551 545
8.27 ± 0.04 8.34 ± 0.04 8.24 ± 0.04
-0.72 ± 0.03 -0.63 ± 0.03 0.02 ± 0.03
-0.74 (-0.82, -0.65) -0.65 (-0.74, -0.56)
<.0001 <.0001
Canagliflozin 100 and 300 mg once-daily were evaluated as monotherapy and add-on to other anti-diabetic agents in placebo-controlled trials. Both doses of canagliflozin provided statistically significant reductions in HbA1c from baseline relative to placebo when used as monotherapy and as add-on to metformin, sulfonylureas, metformin plus a sulfonylurea, metformin plus pioglitazone, and insulin. The placebo-subtracted change from baseline in HbA1c was -0.91 and -1.16 for the 100 and 300 mg doses, respectively, when used as monotherapy. Excluding special populations (elderly and renal impaired), the treatment difference ranged from -0.62 to -0.92, respectively, when canagliflozin is added to other anti-diabetic therapies. In addition, the applicant conducted three active-controlled trials comparing canagliflozin 100 and 300 mg to sitagliptin and glimepiride (DIA3006 and 3009) and canagliflozin 300 mg to sitagliptin (DIA 3015). In DIA3006, both canagliflozin 100 and 300 mg doses were non-inferior to sitagliptin 100 mg with the LS mean treatment difference being 0.04 and -0.12, respectively, and the upper bound of the 95% CI around both mean changes excluding the non-inferiority margin of 0.3%. In DIA3006, both canagliflozin 100 and 300 mg doses were non-inferior to glimepiride with the LS mean treatment difference being -0.01 and -0.12, respectively, and the upper bound of the 95% CI around both mean changes excluding the non-inferiority margin of 0.3%. Canagliflozin 300 mg was also statistically superior to glimepiride5 as the upper bound of the 95% CI excluded zero. In DIA3015, canagliflozin 300 mg provided statistically significantly greater HbA1c reduction than sitagliptin 100 mg with a LS mean treatment difference of -0.37 and accompanying 95% CI of (-0.50, -0.25).
5 Glimepiride was titrated to the maximum dose of 6 or 8 mg. Although the approved maximum dose is 8 mg daily, the maximal effect on HbA1c reduction is typically observed at approximately 50% dosing hence the maximal effect was likely achieved with glimepiride in DIA3009
Reference ID: 3281940

Division Director Review
Page 8 of 27
Placebo-controlled studies of both canagliflozin doses were conducted in two special populations: moderate renal impairment and older patients (DIA3010). Although canagliflozin 100 and 300 mg resulted in statistically significant reductions in HbA1c relative to placebo in both patient populations, the effect was attenuated as discussed in the primary clinical, clinical pharmacology and statistical reviews. Efficacy in Patients with Moderate Renal Impairment As noted under the Introduction, the glycemic efficacy of SGLT-inhibitors is expected to diminish with declining renal function. As such, the clinical development included a dedicated study in patients with moderate renal impairment (DIA3004) and the applicant also conducted an integrated analysis of patients with a baseline eGFR ≥30 to <60 mL/min/1.73m2 across their placebo-controlled Phase 3 trials. DIA3004 This was a 52-week randomized, placebo-controlled, double-blind trial in patients with T2DM with eGFR ≥30 and <50 mL/min/1.73m2. The primary objective of the trial was to demonstrate superiority of canagliflozin over placebo added on to background anti-diabetic therapies with primary efficacy analysis conducted after 26 weeks of double-blind treatment. After this time point, patients were eligible to continue into a double-blind extension period. The primary efficacy endpoint was demonstration of canagliflozin 300 mg superiority over placebo with sequential testing for several other major efficacy endpoints including canagliflozin 100 mg superiority over placebo (See Figure 2, page 97 of Dr. Liu’s review for multiplicity adjustments). The trial randomized 272 patients in a 1:1:1 manner to placebo (91), canagliflozin 100 mg (90) and canagliflozin (91). Mean baseline HbA1c was approximately 8% across all three treatment groups. The efficacy results are summarized in the following table from Dr. Liu’s review. Table 7.2 Primary Efficacy Results in DIA3004 Endpoint Placebo Canagliflozin 100
mg Canagliflozin 300
mg HbA1c (%) n n n Baseline mean ± SE Adj. Mean Change from baseline±SE
LOCF* (by sponsor) MMRM PP* (by sponsor)
Cana−P, adjusted LS Mean (95% CI) LOCF* (by sponsor) MMRM PP* (by sponsor)
87 87 85 63
8.02 ± 0.10 -0.03 ± 0.09 -0.10 ± 0.08 -0.16 ± 0.10
88 88 84 67
7.89 ± 0.10 -0.33 ± 0.09 -0.33 ± 0.08 -0.32 ± 0.10 -0.30 (-0.53, -0.07) -0.23 (-0.44, -0.02) -0.17 (-0.42, 0.09)
89 89 85 77
7.97 ± 0.09 -0.44 ± 0.09 -0.48 ± 0.08 -0.48 ± 0.09 -0.40 (-0.63, -0.17) -0.38 0.58, -0.17) -0.33 (-0.57, -0.08)
Patients (%) achieving HbA1c <71,2
LOCF1
8 (11%) 10 (13%)
15 (20%) 18 (24%)
21 (25%) 23 (28%)
Reference ID: 3281940

Division Director Review
Page 9 of 27
sponsor’s results (LOCF) 3 15 (17%) 24 (27%) 29 (33%)
Based on the findings from this dedicated study in patients with moderate renal impairment, both canagliflozin 100 and 300 mg provided statistically significant reductions from baseline relative to placebo with exception for the per-protocol analysis in canagliflozin 100 mg. Overall, the HbA1c reductions were modest. Integrated Analysis in Patients with Moderate Renal Impairment in Phase 3 Placebo-controlled Trials The integrated analysis in patients with moderate renal impairment across several placebo-controlled trials, including DIA3004, allowed for a larger database (approximately 4x the number of patients studied in DIA3004) and also enabled analysis by variable degrees of eGFR within the population of patients with moderate renal impairment. The following table from Dr. Liu’s review provides efficacy by the subpopulation of patients with eGFR < 45 and ≥ 45 mL/min/1.73m2. Table 7.3. Integrated Analysis of HbA1c Reduction in Patients with Moderated Renal Impairment HbA1c (%) Placebo Canagliflozin 100
mg Canagliflozin 300
mg eGFR ≥30 to 60 mL/min/1.73 m2 n n n Baseline mean ± SE Adj. Mean Change from baseline±SE
LOCF *(by sponsor) PP
Cana−P, adjusted LS Mean (95% CI) LOCF* (by sponsor) PP
356 356 289
7.98 ± 0.05 -0.14 ± 0.06 -0.32 ± 0.06
326 326 285
8.09 ± 0.05 -0.52 ± 0.06 -0.63 ± 0.06 -0.38 (-0.50, -0.26) -0.31 (-0.44, -0.18)
354 354 309
8.07 ± 0.05 -0.62 ± 0.06 -0.72 ± 0.06 -0.47 (-0.60, -0.35) -0.40 (-0.53, -0.28)
eGFR < 45 mL/min/1.73 m2 n n n Baseline mean ± SE Adj. Mean Change from baseline±SE
LOCF* (by sponsor) PP
Cana−P, adjusted LS Mean (95% CI) LOCF* (by sponsor) PP
108 108 85
8.10 ± 0.09 0.05 ± 0.19 -0.48 ± 0.25
118 118 92
8.08 ± 0.09 -0.18 ± 0.19 -0.76 ± 0.26 -0.23 (-0.45, -0.01) -0.28 (-0.53, -0.03)
122 122 106
8.10 ± 0.08 -0.34 ± 0.19 -0.84 ± 0.26 -0.39 (-0.61, -0.17) -0.36 (-0.61, -0.12)
eGFR ≥ 45 mL/min/1.73 m2 n n n Baseline mean ± SE Adj. Mean Change from baseline±SE
LOCF* (by sponsor) PP ok
Cana−P, adjusted LS Mean (95% CI) LOCF* (by sponsor) PP
248 248 204
7.98 ± 0.06 -0.10 ± 0.07 -0.28 ± 0.07
208 208 193
8.11 ± 0.06 -0.57 ± 0.07 -0.61 ± 0.07 -0.47 (-0.61, -0.32) -0.34 (-0.49, -0.18)
232 232 203
8.10 ± 0.06 -0.62 ± 0.07 -0.72 ± 0.07 -0.52 (-0.66, -0.38) -0.44 (-0.59, -0.29)
Reference ID: 3281940

Division Director Review
Page 10 of 27
The integrated analysis revealed greater efficacy in the population with a lesser degree of renal impairment in the moderate range, as expected given the mechanism of action of this drug. For patients with eGFR ≥ 45 to < 60 mL/min/1.73m2, the placebo-subtracted mean reduction in HbA1c was approximately 0.5%. Although this degree of efficacy is attenuated relative to the normal to mild renal impairment population, the Agency has considered this to be clinically relevant in the approval of other approved anti-diabetic therapies (e.g., bromocriptine, cholestyramine, pramlintide). In contrast, the efficacy observed in patients with eGFR ≥30 to < 45 mL/min/1.73m2 of 0.2 to 0.4% is marginal and difficult to justify if adverse events occur at a higher rate in this subgroup (see Renal Safety section below). Dr. Kwon has recommended against the use of canagliflozin in patients with eGFR < 45 mL/min/1.73m2 and only canagliflozin 100 mg in those with eGFR ≥45 to 60 mL/min/1.73m2. Both doses are recommended in patients with normal to mild renal impairment. Reviewers from the Office of Clinical Pharmacology have recommended against the use of canagliflozin in patients with eGFR < 40 mL/min/1.73m2. The slightly different cutpoint for defining the more advanced state of moderate renal impairment is due to their analyses in which degree of moderate renal impairment was based on the median eGFR in the subgroup of patients analyzed. For patients with eGFR ≥40-60 mL/min/1.73m2, they are recommending initiation of therapy at canagliflozin 100 mg with caution against use of the 300 mg once-daily dose in this subpopulation. For the population with normal renal function or mild renal impairment, a starting dose of 100 mg is recommended with titration to 300 mg once-daily based on tolerability and need for additional glycemic control. In effect, they are recommending a starting dose of 100 mg once-daily in patients with normal renal function and those with eGFR ≥ 45 mL/min/1.73m2. However, greater consideration for safety with titration to 300 mg should be applied in those with eGFR ≥45 to 60 mL/min/1.73m2. As discussed later under the Renal Safety section, I concur with Dr. Kwon that in those with eGFR ≥45 to 60 mL/min/1.73m2, the dose of canagliflozin should be limited to 100 mg once-daily until further long-term safety data are obtained in this population from the postmarketing setting. Efficacy in the Elderly DIA3010 This study was a placebo-controlled, double-blind trial randomizing 716 patients who were ≥55 to ≤80 years of age to placebo, canagliflozin 100 mg and 300 mg. Women had to have been at least 3 years postmenopausal as this study also evaluated bone safety as a secondary objective. Randomization was also stratified by baseline BMD and treatment with a PPAR-agonist. The trial duration was 104 weeks with the core efficacy endpoint at Week 26. The primary efficacy analysis was to demonstrate superiority of canagliflozin 300 mg over placebo with sequential testing for other major secondary endpoints, including demonstration of superiority of canagliflozin 100 mg over placebo.
Reference ID: 3281940

Division Director Review
Page 11 of 27
Table 7.4 Primary Efficacy Results in DIA3010 Endpoint Placebo Canagliflozin 100
mg Canagliflozin 300
mg HbA1c (%) n n n Baseline mean ± SE Adj. Mean Change from baseline±SE
LOCF* (by sponsor) MMRM PP* (by sponsor)
Cana−P, adjusted LS Mean (95% CI) LOCF* (by sponsor) MMRM PP* (by sponsor)
232 232 233 169
7.76 ± 0.05 -0.03 ± 0.06 -0.09 ± 0.05 -0.21 ± 0.07
239 239 235 215
7.77 ± 0.05 -0.60 ± 0.06 -0.65 ± 0.05 -0.68 ± 0.06 -0.57 (-0.71, -0.44) -0.56 (-0.67, -0.45) -0.47 (-0.61, -0.34)
229 229 227 205
7.69 ± 0.05 -0.73 ± 0.06 -0.78 ± 0.05 -0.80 ± 0.06 -0.70 (-0.84, -0.57) -0.69 (-0.80, -0.58) -0.60 (-0.73, -0.46)
Patients (%) achieving HbA1c <71,2
LOCF1
sponsor’s results (LOCF) 3
35 (18%) 42 (21%) 65 (28%)
84 (42%) 88 (44%) 114 (48%)
96 (49%) 102 (53%) 134 (59%)
Statistically significant reductions from baseline relative to placebo were observed at both doses. Similar to the analyses performed in subgroups of patients with moderate renal impairment, an integrated analysis was conducted to evaluate efficacy by age in the placebo-controlled trials. Two datasets were utilized: PC-1and PC-2, described in Dr. Liu’s review. Both were sizeable in number of patients; however, subgroups by age showed diminishing sample size in the older patients, particularly in the subgroup of patients ≥ 75 years of age. Analyses were performed for age subgroups of < or ≥ 65 years and < or ≥ 75 years. Statistically significant reductions in HbA1c from baseline relative to placebo were observed in all age categories and with both canagliflozin doses; however, the efficacy was attenuated in the older population. In the subgroup of patients ≥ 75 years of age, Dr. Kwon noted only a 0.02% treatment difference in additional HbA1c reduction between the 100 and 300 mg doses and is recommending against the use of canagliflozin 300 mg in patients ≥ 75 years of age and with eGFR ≥ 45 to < 60 mL/min/1.73m2. Table 7.5 Integrated Analysis Evaluating Efficacy as a Function of Age in PC-2 (From Dr. Lui’s review) Placebo Canagliflozin 100 mg Canagliflozin 300 mg A1C (%), PC n n N Baseline mean ± SE Adj. Mean Change from baseline±SE
LOCF PP
Cana−P, adjusted LS Mean (95% CI) LOCF
1510 1510 1164
8.05 ± 0.02 -0.11 ± 0.02 -0.28 ± 0.02
1731 1731 1531
8.08 ± 0.02 -0.76 ± 0.02 -0.80 ± 0.02 -0.65 (-0.70, -0.59)
1737 1737 1547
8.04 ± 0.02 -0.90 ± 0.02 -0.94 ± 0.02 -0.79 (-0.84, -0.74)
Reference ID: 3281940

Division Director Review
Page 12 of 27
PP -0.52 (-0.57, -0.46) -0.66 (-0.72, -0.60) A1C (%), < 65 years old n n N Baseline mean ± SE Adj. Mean Change from baseline±SE
LOCF PP
Cana−P, adjusted LS Mean (95% CI) LOCF PP
1009 1009 763
8.13 ± 0.03 0.10 ± 0.03 -0.31 ± 0.03
1167 1167 1040
8.12 ± 0.03 -0.80 ± 0.03 -0.85 ± 0.03 -0.70 (-0.77, -0.63) -0.54 (-0.61, -0.47)
1184 1184 1064
8.06 ± 0.03 -0.96 ± 0.03 -1.00 ± 0.03 -0.85 (-0.92, -0.79) -0.70 (-0.76, -0.63)
A1C (%), ≥ 65 years old n n N Baseline mean ± SE Adj. Mean Change from baseline±SE
LOCF PP
Cana−P, adjusted LS Mean (95% CI) LOCF PP
501 501 401
7.89 ± 0.04 -0.12 ± 0.04 -0.22 ± 0.04
564 564 491
7.89 ± 0.04 -0.65 ± 0.03 -0.69 ± 0.03 -0.54 (-0.63, -0.45) -0.47 (-0.56, -0.38)
553 553 483
8.00 ± 0.04 -0.77 ± 0.04 -0.81 ± 0.04 -0.66 (-0.75, -0.57) -0.59 (-0.68, -0.50)
A1C (%), < 75 years old Baseline mean ± SE Adj. % Change from baseline±SE
LOCF PP
Cana−P, adjusted LS Mean (95% CI) LOCF PP
1429 1429 1102
8.06 ± 0.02 -0.11 ± 0.02 -0.28 ± 0.02
1629 1629 1446
8.09 ± 0.02 -0.77 ± 0.02 -0.81 ± 0.02 -0.66 (-0.71, -0.60) -0.53 (-0.59, -0.48)
1636 1636 1453
8.05 ± 0.02 -0.92 ± 0.02 -0.96 ± 0.02 -0.81 (-0.86, -0.75) -0.68 (-0.74, -0.63)
A1C (%), ≥ 75 years old Baseline mean ± SE Adj. % Change from baseline±SE
LOCF PP
Cana−P, adjusted LS Mean (95% CI) LOCF PP
81 81 62
7.88 ± 0.09 -0.19 ± 0.10 -0.39 ± 0.11
102 102 85
7.94 ± 0.09 -0.65 ± 0.09 -0.67 ± 0.10 -0.46 (-0.70, -0.23) -0.28 (-0.53, -0.02)
101 101 94
7.89 ± 0.07 -0.67 ± 0.10 -0.69 ± 0.09 -0.48 (-0.71, -0.24) -0.29 (-0.54, -0.05)
Dr. Guettier has concisely summarized the effect of canagliflozin on several secondary efficacy endpoints. Pre-specified sequential testing procedures were in place to assess the treatment differences of the primary and secondary endpoints. The effect of canagliflozin on glycemic secondary endpoints of fasting plasma glucose (FPG), postprandial glucose (PPG) and proportion meeting HbA1c goals were significantly different from placebo and supported the effect of drug on the primary glycemic endpoint of HbA1c reduction. Non-glycemic secondary endpoints included weight loss, systolic blood pressure changes, and lipid changes. Canagliflozin 100 and 300 mg resulted in an average 0.4 to 3.3% placebo-subtracted weight reduction across multiple trials. DXA assessments in a subgroup of patients revealed greater loss in fat mass than lean body mass. Average reductions of 0.1 to 7.9 mmHg in systolic blood pressure relative to placebo were also observed across trials.
Reference ID: 3281940

Division Director Review
Page 13 of 27
Increases in HDL-C over placebo were observed across trials. Changes in triglycerides were inconsistent and any decreases were modest. Any effect of canagliflozin on these two lipid parameters is countered by the increase in LDL-C ranging from 2 to 8% with the 100 mg dose and 4.6 to 12% with the 300 mg dose. Information on statin use at baseline and after study drug initiation (data cut off date of Jan 31, 2012) was requested and presented in the following table from the applicant. There was not an appreciable or consistent increase in statin use in the canagliflozin treatment groups across the Phase 3 trials.
Reference ID: 3281940

Division Director Review
Page 14 of 27
Conclusions on Efficacy Overall, the applicant has provided sufficient evidence from several adequate and well-controlled trials that canagliflozin 100 and 300 mg will provide effective glycemic control. The efficacy wanes as renal function declines; however, the degree of glycemic control remains clinically meaningful in patients with moderate renal impairment whose eGFR is ≥ 45 ml/min/m2.
8. Safety Please see the reviews of Drs. Kwon and Guettier for a detailed discussion of the safety findings in this clinical development program. For purposes of this memo I will focus only on CV safety with some highlighted summaries of bone and renal safety as outside consultation was sought on these issues. Dr. Guettier has thoroughly reviewed other safety issues including hepatic safety, hypersensitivity and cutaneous drug reactions, mycotic infections, electrolyte imbalances, and hemoconcentration in his memo, and I concur with him that risks for these safety issues can currently be mitigated through labeling. Cardiovascular Risk Assessment The applicant presented a meta-analysis of 9 randomized Phase 2 and 3 trials, including the interim data from an ongoing CV outcomes trial, CANVAS (also referred to as DIA 3008 in this memo and other reviews). Please see Dr. Andraca-Carrera’s review for the full details of this CV risk assessment for this NDA. CV Meta-analysis The agreed-upon composite endpoint for CV risk assessment to exclude both CV risk margins of 1.8 and 1.3 across all 9 trials was MACE+ (CV death, nonfatal MI, nonfatal stroke and hospitalizations due to unstable angina), all adjudicated by an external, blinded endpoint adjudication committee (EAC). A total of 9723 patients (6396 on canagliflozin and 3327 on comparator) contributed data to the CV meta-analysis. Approximately 44% of the data came from CANVAS (4327/9723) with 80% (161/201) of the MACE+ events also derived from this trial. The marked contribution of CANVAS to the overall CV events in the meta-analysis reflects not only the larger trial size and patient-years of exposure but the higher CV risk population enrolled also yielded a higher event rate compared to the other 8 trials. From Table 11 in Dr. Andraca-Carrera’s review, the event rate in CANVAS as of data cutoff date of January 31, 2012 was approximately 3.7%. In contrast, the majority of the remaining trials had event rates of approximately 1% with exception for the trial in patients with moderate renal impairment; however, the overall number of events in this study was very low (7) and did not contribute meaningfully to the overall CV risk assessment. CANVAS was a randomized, double-blind, placebo-controlled, 3-parallel-group trial with the primary objective of demonstrating CV benefit of canagliflozin plus standard of care relative to placebo plus standard of care on CV risk as measured by the hazard ratio for a composite of CV death, nonfatal MI, and nonfatal stroke (referred to as MACE). The original plan was to include two sequential study cohorts with the initial Cohort A recruiting approximately 4,500 patients randomized 1:1:1 to placebo, canagliflozin 100 or 300 mg. An interim analysis was to be performed at approximately 4 years from study initiation by an Independent Data
Reference ID: 3281940

Division Director Review
Page 15 of 27
Monitoring Committee (IDMC) to determine feasibility of demonstrating CV benefit. If deemed feasible, enrollment to Cohort B would be re-opened. Due to observations of LDL increase associated with canagliflozin therapy, a decision was made to partially unblind the results of the interim analysis and plans to enroll Cohort B were terminated. The results of the interim analysis were presented at the January 10th advisory committee and I will touch on this issue further in this section. The following table adapted from Tables 13 and 14 of Dr. Andraca-Carrera’s review summarizes the overall primary analysis for CV risk assessment and the individual components of the primary endpoint. Table 8.1 Primary CV Findings from Nine Pooled Phase 2/3 Trials Canagliflozin
N=6396 PY=6876
Comparator N=3327
PY=3470
Hazard Ratio (95% CI)
Events (rate per 1000 PY)
130 (18.9) 71 (20.5) 0.91 (0.68, 1.21)
MACE CV death MI Stroke Unstable angina
104 (5.1) 21 (3.1) 45 (6.5) 47 (6.8) 26 (3.8)
53 (15.3) 16 (4.6) 27 (7.8) 16 (4.6) 18 (5.2)
0.98 (0.70, 1.36) 0.65 (0.34, 1.24) 0.83 (0.51, 1.34) 1.46 (0.83, 2.58) 0.71 (0.39, 1.30)
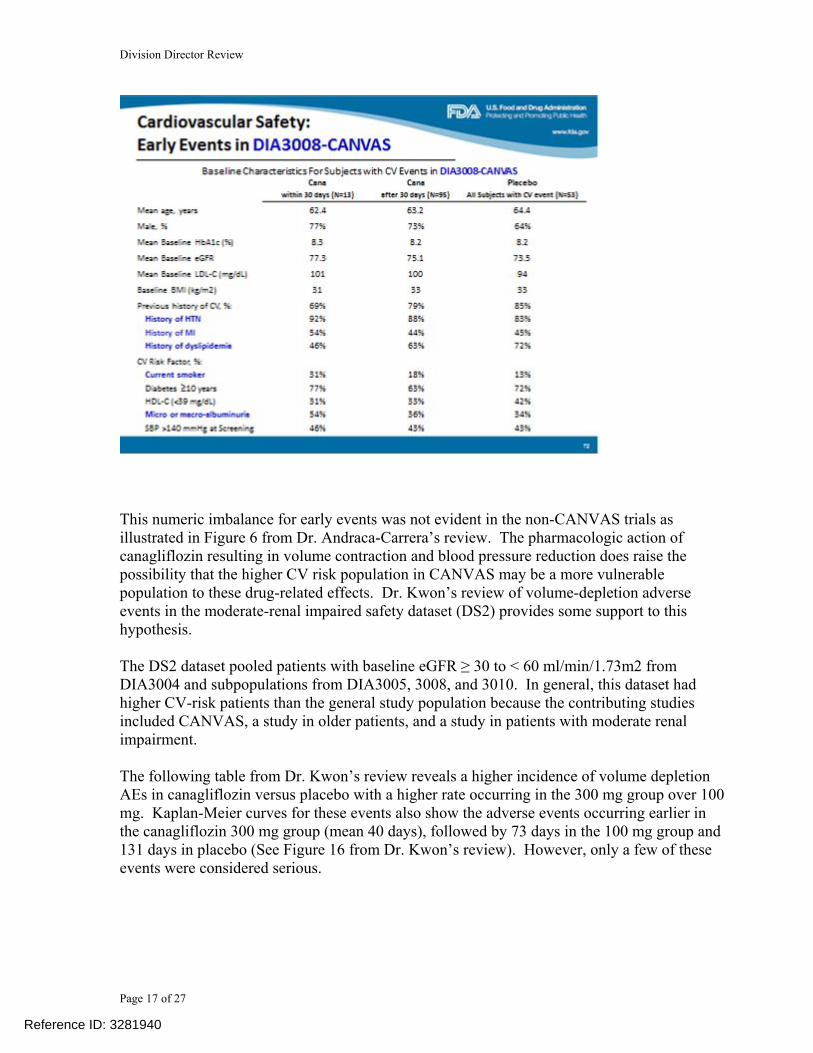
As per the pre-specified plan to exclude a CV risk margin of 1.8, the applicant was able to meet this requirement. However, several issues need further discussion including: 1. Numeric imbalance in MACE in early treatment period of CANVAS 2. HR exceeding 1.0 for stroke 3. Unblinding of CANVAS and disclosure of interim results 4. Meeting expectations to exclude a CV risk margin of 1.3 Numeric Imbalance in CV events in Early Treatment Period of CANVAS A numeric imbalance in MACE+, not favoring canagliflozin, was observed in the first 30 days of CANVAS. Thirteen patients in the canagliflozin group versus one in placebo experience a CV event as summarized in the following table from Dr. Andraca-Carrera’s review.
Reference ID: 3281940

Division Director Review
Page 17 of 27
This numeric imbalance for early events was not evident in the non-CANVAS trials as illustrated in Figure 6 from Dr. Andraca-Carrera’s review. The pharmacologic action of canagliflozin resulting in volume contraction and blood pressure reduction does raise the possibility that the higher CV risk population in CANVAS may be a more vulnerable population to these drug-related effects. Dr. Kwon’s review of volume-depletion adverse events in the moderate-renal impaired safety dataset (DS2) provides some support to this hypothesis. The DS2 dataset pooled patients with baseline eGFR ≥ 30 to < 60 ml/min/1.73m2 from DIA3004 and subpopulations from DIA3005, 3008, and 3010. In general, this dataset had higher CV-risk patients than the general study population because the contributing studies included CANVAS, a study in older patients, and a study in patients with moderate renal impairment. The following table from Dr. Kwon’s review reveals a higher incidence of volume depletion AEs in canagliflozin versus placebo with a higher rate occurring in the 300 mg group over 100 mg. Kaplan-Meier curves for these events also show the adverse events occurring earlier in the canagliflozin 300 mg group (mean 40 days), followed by 73 days in the 100 mg group and 131 days in placebo (See Figure 16 from Dr. Kwon’s review). However, only a few of these events were considered serious.
Reference ID: 3281940

Division Director Review
Page 18 of 27
Drs. Kwon and Guettier searched for changes in volume or BP status in the 14 patients experiencing an acute CV event in CANVAS. Such data were not captured routinely as a study visit was not specified until 12 weeks after baseline; hence, many of the acute CV events occurred in the absence of any preceding study visit that might record vital status or clinical symptoms prior to the CV event. In conclusion, a numeric imbalance in early CV events not favoring canagliflozin was observed in the CANVAS trial that was not evident in the non-CANVAS trials. No risk factor explaining such an imbalance or predictive of an early event could be identified. While the early events might be attributed to a high risk population being more sensitive to drug-induced volume changes, the imbalance might also be a chance finding. Even if one were to tenuously attribute a higher risk of an acute event related to canagliflozin, it is reassuring to note that this trend does not continue post 30 days in CANVAS. Further assessment of an acute CV risk associated with canagliflozin can not be explored in CANVAS as patient enrollment into Cohort A is complete. A new study or re-opening enrollment in CANVAS would be necessary to investigate this finding, and this will be recommended as a postmarketing requirement to the applicant. At present, there is no evidence of CV benefit associated with canagliflozin treatment. At best, the CV risk assessment post Day 30 in CANVAS shows neutrality on MACE+ and MACE.
Reference ID: 3281940

Division Director Review
Page 19 of 27
Should additional studies replicate the findings of early risk from CANVAS and long-term CV risk assessment fail to demonstrate CV benefit, it would be important to identify characteristics of patients at risk for an acute CV event to either closely monitor shortly after initiation of canagliflozin or to avoid its use. Further investigation of a potential for acute CV risk can also be combined with the objective of excluding a CV risk margin of 1.3 (see below). HR Exceeding 1.0 for Stroke In the pre-specified CV analysis plan, an evaluation of the individual components of MACE+ showed no evidence of increased risk based on the estimated HRs falling below 1.0 for CV death, MI and unstable angina requiring hospitalization. The only secondary endpoint whose estimated HR exceeded 1.0 was for stroke (fatal and nonfatal) (see Table 8.1). The rate per 1000 pt-years was 6.8% versus 4.6% for canagliflozin and control, respectively, yielding a HR (95% CI) of 1.46 (0.83, 2.58). The majority of these strokes were ischemic (79% in cana and 56% in control). Review of the cases and overall database did not reveal excess risk of atherothrombosis associated with canagliflozin use. While this preliminary finding is concerning, it did not reach statistical significance and is furthermore based on an interim analysis of 9 Phase 2/3 trials of which one (CANVAS) is ongoing and will provide more long-term information. The applicant will be required to provide data from either a new study or expanded enrollment to CANVAS for which risk of stroke and other CV events will be better characterized. Unblinding of CANVAS and Disclosure of Interim Results On March 13, 2012, FDA was informed of a modification to the SAP for CANVAS as a result of observed increases to LDL-C relative to placebo in the core trials of the Phase 3 program. The pooled results showed an approximate 4.5% and 8.5% LDL-C increase over placebo at the canagliflozin 100 and 300 mg doses, respectively. Because the Steering Committee and applicant felt that the integrity of CANVAS would be affected by public disclosure of the lipid effects, a decision was made to halt CANVAS and modify the objectives of the trial which was now comprised only of Cohort A. Cohort A, which was completely enrolled, was to provide CV safety – specifically to exclude both CV risk margins of 1.8 and 1.3. The interim results of CANVAS were fully disclosed at the January 10, 2013 public advisory committee. Disclosure of interim results has raised concerns on whether the integrity of the ongoing trial has been compromised such that findings at its completion may not be credible. The pre-market requirement to exclude a CV risk margin of 1.8 was adequately demonstrated in this submission. Not only did the primary CV analysis (Table 8.1) comfortably exclude this risk margin but additional secondary analyses of non-CANVAS trials and the CANVAS trial post initial 30 days also excluded this risk margin. What remains in question is whether the completion of CANVAS (i.e., Cohort A) can be relied upon to exclude a post-market CV risk margin of 1.3. Knowledge of interim results may alter behavior of investigators and/or patients. For example, a perceived benefit might lead to patient discontinuation in order to receive canagliflozin,
Reference ID: 3281940


Division Director Review
Page 22 of 27
Renal Safety Because of the diuretic effect of canagliflozin, renal safety was evaluated in several different safety databases, including a dedicated study in patients with moderate renal impairment. Please see the consult dated December 2, 2012, provided by Dr. Aliza Thompson from the Division of Cardio-Renal Products (DCaRP). Early (by Week 3 to 6) and dose-dependent decreases in eGFR were observed in Phase 3 trials. The risk for decline in renal function was greater in patients with baseline moderate renal impairment and further exacerbated if canagliflozin was used concomitantly with a loop diuretic, ACE-inhibitor or angiotensin-receptor blocker. Other renal safety parameters that accompanied the decreased eGFR include increases from baseline in BUN and creatinine, suggesting a causal role of volume depletion as a result of the diuretic effect of canagliflozin. In Figures 19 and 20 of Dr. Kwon’s review, she summarizes the effect of treatment on eGFR as assessed in safety datasets DS1 (placebo-controlled trials) and the dedicated renal safety trial, DIA3004. In patients with normal to mild renal impairment, the initial decline in eGFR slowly improved over time. Patients with moderate renal impairment did not have further decline in eGFR but the initial decrease persisted over time out to Week 26. Despite this observation, the number of serious renal-related AEs and events leading to discontinuation in the moderate renal impairment population was low and not notably different between placebo and the two canagliflozin treatment groups. Consequently, the review team has recommended the use of canagliflozin in patients with moderate renal impairment whose eGFR ≥45 to 60 mL/min/1.73m2. In patients with eGFR ≥30 to 45, mL/min/1.73m2 it was felt that the benefit did not outweigh the risk of volume-related AEs. However, the renal safety data originally provided by the applicant did not separate out these two subpopulations of moderate renal impairment. In response to a March 13, 2013 FDA information request, the applicant provided summary renal safety data within these two subpopulations. The following two figures summarize mean change in eGFR from baseline in these patient populations from the CANVAS trial (DIA3008)
Reference ID: 3281940

Division Director Review
Page 23 of 27
Source: Applicant’s 3/15/13 response to FDA information request A mean reduction from baseline that is dose-related and ranges between 1 and 5 ml/min/1.73 m2 is observed in the eGFR 45-60 ml/min/1.73 m2 population. Minimal change is observed in the placebo group. An inconsistent pattern with respect to dose and change over time in eGFR
Reference ID: 3281940

Division Director Review
Page 24 of 27
is observed in the subpopulation with eGFR 30-45 ml/min/1.73 m2. This may reflect a smaller sample size and greater variability. However, should it be assumed that the absolute decline is similar in these two populations, the percent reduction will be greater in those patients with baseline eGFR 30-45 as these patients have a lower renal reserve. The applicant was also asked to provide data on categorical changes in eGFR from baseline. The following table highlights some of the information provided by the applicant. Table 8.2 Change in eGFR by Baseline Renal Status; n (%) from DS3 Control Cana 100 Cana 300 > 60 ml/kg/1.73 m2 >30% decrease (any value)
162/2739 (5.9%) 146/2643 (5.5%) 225/2583 (8.7%)
>30% decrease (last value)
67 (2739 (2.4%) 57/2643 (2.2%) 84/2583 (3.3%)
>50% decrease (any value)
16/2739 (0.6%) 14/2643 (0.5%) 23/2583 (0.9%)
>50% decrease (last value)
6/2739 (0.2%) 1/2643 (<0.1%) 9/2583 (0.3%)
45-60 ml/kg/1.73 m2 >30% decrease (any value)
21/300 (7%) 23/252 (9.1%) 34/255 (13.3%)
>30% decrease (last value)
6/300 (2.0%) 9/252 (3.6%) 13/255 (5.1%)
>50% decrease (any value)
0 4/252 (1.6%) 0
>50% decrease (last value)
0 1/252 (0.4%) 0
30-45 ml/kg/1.73 m2 >30% decrease (any value)
12/114 (10.5%) 24/121 (19.8%) 27/123 (22%)
>30% decrease (last value)
6/114 (5.3%) 9/121 (7.4%) 9/123 (7.3%)
>50% decrease (any value)
0 2/121 (1.7%) 4/123 (3.3%)
>50% decrease (last value)
0 1/121 (0.8%) 0
Source: Applicant’s 3/15/13 response to FDA information request There were few patients who had a > 50% reduction in eGFR but there is a clear increased incidence of > 30% reduction by dose and baseline renal status. The population of patients with baseline eGFR 45-60 ml/kg/1.73 m2 (9.1-13.3% at any value) does have a lower incidence than those with more severe renal impairment (19.8 – 22% at any value). Given the slightly greater efficacy, it appears reasonable to carve out this group of patients with eGFR 45-60 ml/kg/1.73 m2 for treatment with canagliflozin. However, the modest gain in efficacy between canagliflozin 100 and 300 mg in these patients (0.05%, See Table 7.3) supports a
Reference ID: 3281940

Division Director Review
Page 25 of 27
dose limit to only canagliflozin 100 mg in patients with moderate renal impairment whose baseline eGFR is 45-60 ml/kg/1.73 m2.
9. Advisory Committee Meeting An advisory committee meeting was held on January 10, 2013 for this application. Transcripts of the meeting are not available at this time but quick minutes from the meeting have been included in Section 9.3 of Dr. Kwon’s review. Overall, the committee members voted 10 to 5 on the question, “Based on the information included in the briefing materials and presentations today, has the applicant provided sufficient efficacy and safety data to support marketing of canagliflozin for the treatment of Type 2 diabetes mellitus?” Although the majority vote signified support for approval, the discussion surrounding the preceding questions which focused on adequacy of CV safety assessment, renal safety, and bone safety also displayed a degree of caution for use in selected patients and that long-term data on efficacy and safety were still necessary. With respect to CV safety, there was concern voiced by several members of the panel that the interim results of CANVAS were disclosed at this public meeting and whether the remaining portion of CANVAS could provide us with reassurance on long-term safety for canagliflozin. There wasn’t consensus that the numeric imbalance in early events in CANVAS was a true drug effect but the diuretic effect of the drug posing a risk to a more vulnerable population when first initiating therapy was raised as a possibility. Many members felt that the increase in LDL-C necessitated longer-term data on CV safety but no member specifically cited this finding as the sole basis for withholding approval. Despite split votes on several questions, I believe the discussion points reflect a collective position by advisory committee members that there wasn’t sufficient evidence barring approval of canagliflozin but uncertainty in both long-term benefits and risks need to be better characterized in postmarketing studies which will be addressed in Section 13 of this memo.
10. Pediatrics Please see Drs. Kwon’s and Guettier’s reviews for a discussion of the pediatric plan.
11. Other Relevant Regulatory Issues None precluding final action.
12. Labeling
Reference ID: 3281940

Division Director Review
Page 26 of 27
Please see accompanying labeling in action package. Of note, .
13. Decision/Action/Risk Benefit Assessment
• Regulatory Action Approval
• Benefit-Risk Assessment The clinical development program has provided sufficient evidence that proposed doses of canagliflozin 100 and 300 mg provide clinically meaningful reductions in HbA1c when used as monotherapy and add-on to several commonly prescribed anti-diabetic therapies. Comparative efficacy data were provided from three active-controlled trials which support a conclusion of comparable glycemic efficacy between canagliflozin 100 mg and sulfonylureas and sitagliptin 100 mg. Canagliflozin 300 mg provided statistically superior HbA1c changes over these two comparators. In addition to glycemic control, the clinical trials also evaluated the effect of canagliflozin on several relevant secondary clinical endpoints including fasting plasma glucose, proportion of patients achieving HbA1c < 7%, blood pressure and weight. The effect of canagliflozin on FPG and reaching target HbA1c parallel the results on the primary efficacy endpoint of HbA1c reduction. The favorable changes in blood pressure and weight reduction further improve the benefit-risk assessment of this product as these are common co-morbid conditions in the T2DM population. Therapies that will improve on these co-morbid conditions (or not adversely impact them) are attractive additions to the diabetes armamentarium. Canagliflozin was not without adverse effects and risks. Side effects attributable to the mechanism of action of the drug include volume depletion, orthostasis, and genito-urinary infections. These risks can be managed through labeling with recommendations for appropriate selection of dose and monitoring for these side effects. There is also uncertainty on long-term risks including bone health, decline in renal function in those with underlying renal disease, and longterm CV safety; however, the current evidence does not support a degree of risk in any of these areas that can’t be mitigated through labeling or are inconclusive and can be better elucidated through a postmarketing required trial.
• Recommendation for Postmarketing Risk Evaluation and Mitigation Strategies None recommended at this time. A Medication Guide will be issued to highlight the risks for genital mycotic infections and decreased volume-related adverse events.
• Recommendation for other Postmarketing Requirements and Commitments
Reference ID: 3281940
(b) (4)

Division Director Review
Page 27 of 27
Five postmarketing requirements have been recommended: PMR 1 and 2: Pediatric studies to fulfill PREA including a PK study and a 26-week, randomized, double-blind, placebo-controlled trial in pediatric patients ages 10 to < 18 years with T2DM PMR 3: Enhance pharmacovigilance to further evaluate malignancies (pheochromocytoma, Leydig cell tumor, and renal cell carcinoma), fatal pancreatitis, hemorrhagic/necrotizing pancreatitis, severe hypersensitivity reactions, photosensitivity reactions, serious hepatic abnormalities, and pregnancy related outcomes. PMR 4: Completion and submission of DIA3010 to provide long-term bone safety data PMR 5: Conduct a new trial or expand enrollment into CANVAS with the objective of excluding a CV risk margin of 1.3 and to further investigate potential CV risk in the acute setting in high risk patients Timelines for all PMRs are still under discussion with Janssen but will be communicated in action letter.
Reference ID: 3281940

---------------------------------------------------------------------------------------------------------This is a representation of an electronic record that was signedelectronically and this page is the manifestation of the electronicsignature.---------------------------------------------------------------------------------------------------------/s/----------------------------------------------------
MARY H PARKS03/25/2013
Reference ID: 3281940