2021 workplace benefits report
TRANSCRIPT

FINANCIAL LIFE BENEFITS®
2021 Workplace Benefits ReportFinancial wellness in an increasingly diverse workplace

22021 Workplace Benefits Report
Employers are serving a diversifying employee base
For the past 11 years, Bank of America has conducted research to deeply understand benefits offered by employers and what type of support employees need on financial and non-financial topics.
We are seeing the number of employers who offer comprehensive workplace benefits programs expand dramatically. This year, 95% of employers agree that they should provide workplace financial benefits and more than half (56%) say they feel an extreme responsibility to do so.
Our research has also underscored an increase in diversity in the workplace. More young people, women and people of color are entering the workforce. Diversity has been shown to bring benefits to the workplace, but it also makes delivering employee benefits more challenging. Diverse workforces have more wide-ranging needs, but the common thread is that they are looking to their employers for help in achieving their goals.
This year’s report looks at a number of trends — from financial wellness, the type of support employers are offering to address financial needs, and where companies are going further to offer
support that extends to emotional and physical health — that can contribute to an employee’s sense of holistic wellness.
The findings from this year’s study and detailed in this report can help you understand the increasing diversity in the workplace and highlight the need for workplace benefits programs that address a wide range of needs.
I encourage you to think about the steps you can take, and how Bank of America’s Financial Life Benefits® program can help your employees — and company — thrive.
Lorna SabbiaHead of Retirement and Personal Wealth SolutionsBank of America
Bank of America is a marketing name for the Retirement Services business of Bank of America Corporation (“BofA Corp.”). Banking activities may be performed by wholly owned banking affiliates of BofA Corp., including Bank of America, N.A., member FDIC. Brokerage and investment advisory services are provided by wholly owned nonbank affiliates of BofA Corp., including Merrill Lynch, Pierce, Fenner & Smith Incorporated (also referred to as “MLPF&S” or “Merrill”), a dually registered broker-dealer and investment adviser and Member SIPC.Mutual Fund investment offerings for the Bank of America HSA are made available by MLPF&S. Investments in mutual funds are held in an omnibus account at MLPF&S in the name of Bank of America, N.A. (“BANA”), for the benefit of all HSA account owners. Recommendations as to HSA investment menu options are provided to BANA by the Chief Investment Office (“CIO”), Global Wealth & Investment Management (“GWIM”), a division of BofA Corp. The CIO, which provides investment strategies, due diligence, portfolio construction guidance and wealth management solutions for GWIM clients, is part of the Investment Solutions Group of GWIM.Financial Life Benefits is a registered trademark of Bank of America Corporation. Bank of America and the Bank of America logo are registered trademarks of BofA Corporation. Bank of America, N.A., Member FDIC.Investment products:
Are Not FDIC Insured Are Not Bank Guaranteed May Lose Value
Welcome
Table of contents
Key insights
Employer trends
Employee trends
•
•
•
Gender differences
Ethnic differences
Generational differences
Actions to consider
Ways we can help
About this study

32021 Workplace Benefits Report
Table of contents
Welcome 2
Key insights 4
Employer trends 5
Employee trends
• Gender differences
• Ethnic differences
• Generational differences
15
17
20
23
Actions to consider 28
Ways we can help 29
About this study 30

42021 Workplace Benefits Report
Among employers
Among employees
Welcome
Table of contents
Key insights
Employer trends
Employee trends
•
•
•
Gender differences
Ethnic differences
Generational differences
Actions to consider
Ways we can help
About this study
Key insights from this year’s study
In 2021, 46% of employers offer financial wellness programs, up from 40% in 2020.1
The most significant increases are among Gen Z and Millennials, with 48% feeling financially well in 2021, up from 41% in 2020 and 48% of Gen Xers feeling similarly, up from 36% over the same time period.1
And an even more impressive 56% saying that they feel an extreme sense of responsibility.
With younger employee groups demonstrating more ethnic and gender diversity.
72% of employers are currently offering or planning to offer diversity and inclusion programs in the next 1 to 2 years.
Women continue to feel less financially well and are twice as likely to be kept up at night by financial stress.
51% of employers communicate the value of benefits programs twice a year, or less.
More importantly, significant numbers of employees report that they feel debt has affected their overall quality of life.
Financial wellness programs continue to grow
Employee feelings of financial wellness are rebounding
95% of employers feel a sense of responsibility for the financial wellness of their employees
Representation of women and ethnic diversity in the workplace is increasing
Employers are expanding wellness programs to address diversity and inclusion
Women continue to lag their male counterparts in financial wellness
Employers still have an opportunity to improve communications around financial wellness
Employees across all ethnic, gender and generational groups hold a variety of debt
1 Bank of America, Workplace Benefits Report, 2020.
52021 Workplace Benefits Report
Welcome
Table of contents
Key insights
Employer trends
Employee trends
•
•
•
Gender differences
Ethnic differences
Generational differences
Actions to consider
Ways we can help
About this study
Employer trendsFinancial wellness continues to be a focus of employers of all sizes
Since the start of the Workplace Benefits Report in 2011, we have asked employers about the financial wellness resources they provide to their employees. Over time, we have seen employers’ sense of responsibility grow and the scope of financial wellness programs expand significantly. As employers take a more active role in supporting the financial needs of their workforce, we are seeing more robust and wide-ranging workplace benefits being delivered by employers.
62021 Workplace Benefits Report
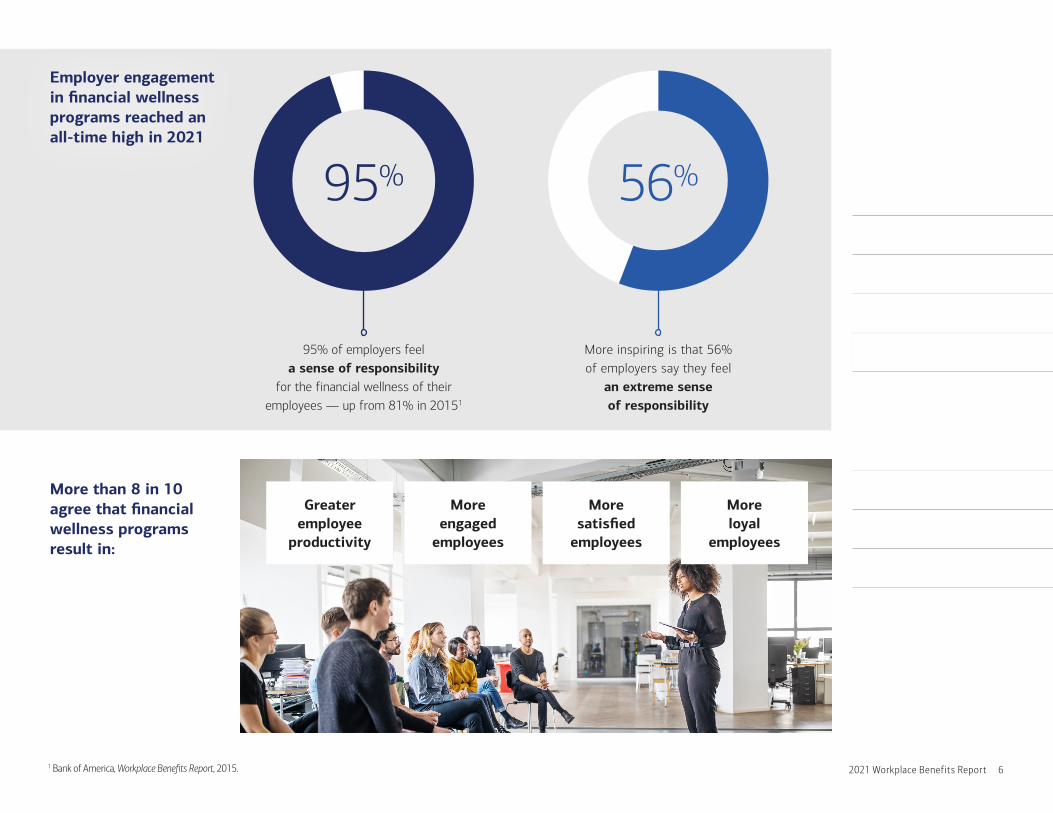
Employer engagement in financial wellness programs reached an all-time high in 2021
More than 8 in 10 agree that financial wellness programs result in:
Welcome
Table of contents
Key insights
Employer trends
Employee trends
•
•
•
Gender differences
Ethnic differences
Generational differences
Actions to consider
Ways we can help
About this study
95% of employers feel a sense of responsibility
for the financial wellness of their employees — up from 81% in 20151
95% 56%
More inspiring is that 56% of employers say they feel
an extreme sense of responsibility
Greater employee
productivity
More engaged
employees
More satisfied
employees
More loyal
employees
1 Bank of America, Workplace Benefits Report, 2015.

72021 Workplace Benefits Report
Welcome
Table of contents
Key insights
Employer trends
Employee trends
•
•
•
Gender differences
Ethnic differences
Generational differences
Actions to consider
Ways we can help
About this study
Yet company size and industry impact the availability of financial wellness programs
Adoption is growing, with significant increases since 20201
With less than $20 million in retirement plan assets
With $20 million to $100 million in retirement plan assets
With more than $100 million in retirement plan assets
Percentage of employers that offer a financial wellness program1
59% Finance and Insurance
57% Professional,
Scientific and Tech
52% Manufacturing
45% Healthcare and Social Assistance
42% Retail Trade
2020
2021 38%
34%
2020
2021 50%
42%
2020
2021 59%
50%
1 Bank of America, Workplace Benefits Report, 2020.
82021 Workplace Benefits Report
Welcome
Table of contents
Key insights
Employer trends
Employee trends
•
•
•
Gender differences
Ethnic differences
Generational differences
Actions to consider
Ways we can help
About this study
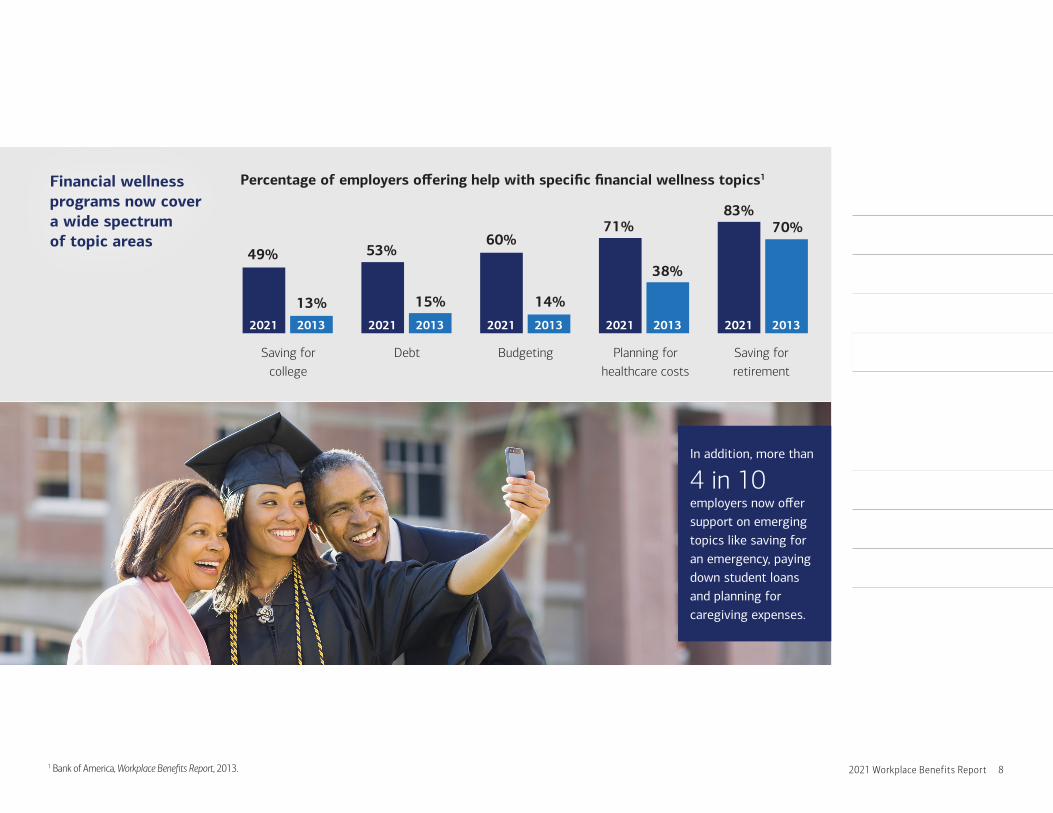
Financial wellness programs now cover a wide spectrum of topic areas
Saving for college
Debt Budgeting Planning for healthcare costs
Saving for retirement
Percentage of employers offering help with specific financial wellness topics1
49% 53% 60%
71% 83%
13% 15% 14%
38%
70%
2013 2013 2013 2013 2013 2021 2021 2021 2021 2021
In addition, more than
4 in 10 employers now offer support on emerging topics like saving for an emergency, paying down student loans and planning for caregiving expenses.
1 Bank of America, Workplace Benefits Report, 2013.

92021 Workplace Benefits Report
Welcome
Table of contents
Key insights
Employer trends
Employee trends
•
•
•
Gender differences
Ethnic differences
Generational differences
Actions to consider
Ways we can help
About this study
And in just the last year, we have seen significant expansion of certain types of financial wellness support across employers 47% of employers offer access
to financial advisors to help employees manage their assets — up from 40% in 20201
45% of employers offer support to develop good financial habits — up from 39% in 20201
38% of employers offer automatic contribution escalations as a plan feature — up from 23% in 20201
31% of employers offer tips and support on how to handle a financial shock — up from 21% in 20201
31% of employers offer access to third-party tools to help manage retirement assets — up from 26% in 20201
42% of employers offer access to financial products or services that help employees — up from 33% in 20201
47% in 2021
45% in 2021
38% in 2021
31% in 2021
31% in 2021
42% in 2021
40% in 2020
39% in 2020
23% in 2020
21% in 2020
26% in 2020
33% in 2020
up from
up from
up from
up from
up from
up from
1 Bank of America, Workplace Benefits Report, 2020.

102021 Workplace Benefits Report
Employers are taking a more holistic approach to wellness
Employers are enhancing the support they offer around managing healthcare costs, but more can be done
Percentage of employers that offer certain health-related benefits
72% of employers offer diversity and inclusion
(D&I) programs, or plan to in the next 1 to 2 years
80% of employers feel some responsibility to educate employees about healthcare costs in retirement. This is up from 22% in 20111
Only 35% of employers offer a high-deductible health plan which would give employees access to a Health Savings Account (HSA)
55% of employers are taking steps to
support and promote an intergenerational workforce
And 57% of employers say that providing resources to help employees
manage their overall well-being has driven increased productivity
72% 55% 57%
80%
35%
Employers should focus on encouraging positive behaviors beyond making contributions to an HSA
32%
Non-smoker credit
32%
Discount on gym memberships
53%
Company contribution for HSA participation
Welcome
Table of contents
Key insights
Employer trends
Employee trends
•
•
•
Gender differences
Ethnic differences
Generational differences
Actions to consider
Ways we can help
About this study
1 Bank of America, Workplace Benefits Report, 2011.

112021 Workplace Benefits Report
Welcome
Table of contents
Key insights
Employer trends
Employee trends
•
•
•
Gender differences
Ethnic differences
Generational differences
Actions to consider
Ways we can help
About this study
Employee communications is one area with the greatest opportunity to help drive positive outcomes
Only
49%
Only
21%
Nearly
1 in 10
Nearly
1 in 5
of employers are communicating about the value of company benefits plans more than 2 times a year
of employers are communicating about healthcare more than 2 times a year
communicate about benefits when an employee joins the company or not at all
only communicate about healthcare when an employee joins the company or not at all

122021 Workplace Benefits Report
Employee interest is the top barrier to implementing a financial wellness plan
Employees have indicated the type of support they want
Welcome
Table of contents
Key insights
Employer trends
Employee trends
•
•
•
Gender differences
Ethnic differences
Generational differences
Actions to consider
Ways we can help
About this study
#1Access to a financial advisor
#2Information on retirement plans
#3Help developing financial skills and good financial habits
Percentage of employers stating they face certain barriers to implementing their financial wellness program
Employees rank the support they want as:
43% Lack of
employee interest
34% Finding a
provider with an offer that
meets the employer needs
31% Acquiring
enough budget to properly
build/manage the program
24% Executive/
C-Suite buy-in
22% Human
Resources buy-in

132021 Workplace Benefits Report
Welcome
Table of contents
Key insights
Employer trends
Employee trends
•
•
•
Gender differences
Ethnic differences
Generational differences
Actions to consider
Ways we can help
About this study
Employers could be doing more to offer the types of support their employees want
This includes communicating about diversity and inclusion programs
Access to a financial advisor
47%
Information on retirement plans
64%
Help developing financial skills and
good financial habits
45%
44% of employers say they offer D&I programs today
Yet only 35% of employees say they are aware of a D&I program in their workplace
44%35%
Percentage of employers that offer certain types of financial support
And expanding programs to go beyond financial topics can help support greater overall wellness
Factors that employees feel significantly impact their overall well-being
60% Mental health
54% Physical health
46% Financial health
And
51%
of employees say their overall feelings of well-being have an impact on their productivity
Only
33%
of employers communicate about mental and physical health more than 2 times a year

142021 Workplace Benefits Report
Employers can also do more to expand equity compensation programs
Welcome
Table of contents
Key insights
Employer trends
Employee trends
•
•
•
Gender differences
Ethnic differences
Generational differences
Actions to consider
Ways we can help
About this study
With less than $20 million in
retirement plan assets
50%
With $20 million to $100 million in
retirement plan assets
58%
With more than $100 million in
retirement plan assets
60%
Percentage of employers that offer an equity compensation program
And the type of equity compensation also varies
Percentage of employers that offer specific types of equity compensation
With less than $20 million in
retirement plan assets
With $20 million to $100 million in retirement plan assets
With more than $100 million in retirement plan assets
Employee Stock Purchase Plans (ESPPs) 46% 41% 51%
Stock options 34% 34% 40%
Incentive Stock Options (ISOs) 30% 38% 40%
Larger firms tend to be more likely to offer equity compensation
Yet only
53% Only
44%
of employees who participate in equity compensation plans say it was an important reason for accepting a job
of employers offer some type of equity compensation program to employees

152021 Workplace Benefits Report
Employee trendsEmployee feelings of financial wellness are rebounding
Even in the face of increasing stress resulting from the dislocations caused by the coronavirus pandemic, employees’ sense of financial wellness started to rebound in 2021 after declining the year before. Employees’ sense of wellness continues to be influenced by a wide range of issues, from financial to mental and physical.
1 Bank of America, Workplace Benefits Report, 2019. 2 Bank of America, Workplace Benefits Report, 2020.
Welcome
Table of contents
Key insights
Employer trends
Employee trends
•
•
•
Gender differences
Ethnic differences
Generational differences
Actions to consider
Ways we can help
About this study
The number of employees that rate their financial wellness as good or excellent is rising from last year’s lows
Through a more thorough understanding of employee needs and wants, employers can better focus their workplace wellness programs to address the most pressing issues employees face. They can also provide the range of support needed to help employees address their current and future needs, regardless of where they are in their life.
in 2019 in 2020 in 2021
55%1
49%2
51%

162021 Workplace Benefits Report
Younger employee populations tend to be more ethnically diverse
And we see increasing representation of women among younger employee groups
Welcome
Table of contents
Key insights
Employer trends
Employee trends
•
•
•
Gender differences
Ethnic differences
Generational differences
Actions to consider
Ways we can help
About this study
Gender makeup of employees who participated in the 2021 Workplace Benefits Report survey
Ethnic makeup of employees who participated in the 2021 Workplace Benefits Report survey
41%
59%
Men Women
White/Caucasian Black/African-American Asian Multi-racialHispanic or Latino
9%
13%
10%
2%
65%
10%
10%
6%
1%
72%
4%7%
4%
1%
83%
Gen Z & Millennials (ages 18–44)
Gen Z & Millennials (ages 18–44)
Gen Xers (ages 45–54)
46%
54%
Gen Xers (ages 45–54)
Baby Boomers & Silent Generation (ages 55+)
51%
49%
Baby Boomers & Silent Generation (ages 55+)

172021 Workplace Benefits Report
Welcome
Table of contents
Key insights
Employer trends
Employee trends
•
•
•
Gender differences
Ethnic differences
Generational differences
Actions to consider
Ways we can help
About this study
Gender differencesGender has a significant influence on employee financial wellness. Our research has shown women tend to lag their male counterparts across metrics like feelings of financial wellness and financial preparedness. Well-rounded financial wellness programs recognize these gender differences, and offer support to help address the specific needs of women in the workplace to help close the gap.
Percentage of employees reporting that they feel a good or great sense of financial wellness1
Women trail men, but have increased their financial wellness significantly in the last year 58%
Men in 2020
41% Women in 2020
57% Men
in 2021
47% Women in 2021
Women are more likely to feel some level of stress about their financial situation
Women are twice as likely to be kept up at night by financial stress
88% 92%
0
2
4
6
8
10
12
5% 11%
Men Women
vs. vs.
1 Bank of America, Workplace Benefits Report, 2020.

182021 Workplace Benefits Report
Welcome
Table of contents
Key insights
Employer trends
Employee trends
•
•
•
Gender differences
Ethnic differences
Generational differences
Actions to consider
Ways we can help
About this study
Debt more adversely affects women than men
Percentage of employees who say they have control over their debt
Percentage of employees who say they believe debt affects their ability to achieve their goals
Women also tend to be less focused than men on retirement and more focused on near-term financial goals
Percentage of employees who ranked these goals as their top financial priority
50% Men
41% Women
23% Men
32% Women
Saving for retirement
Paying off credit card debt
Growing savings to pay for unexpected expenses
Buying my first house
46%
34%
13%
17%
7%
11%
7%
9%
Men Women
vs. vs.
192021 Workplace Benefits Report
Welcome
Table of contents
Key insights
Employer trends
Employee trends
•
•
•
Gender differences
Ethnic differences
Generational differences
Actions to consider
Ways we can help
About this study
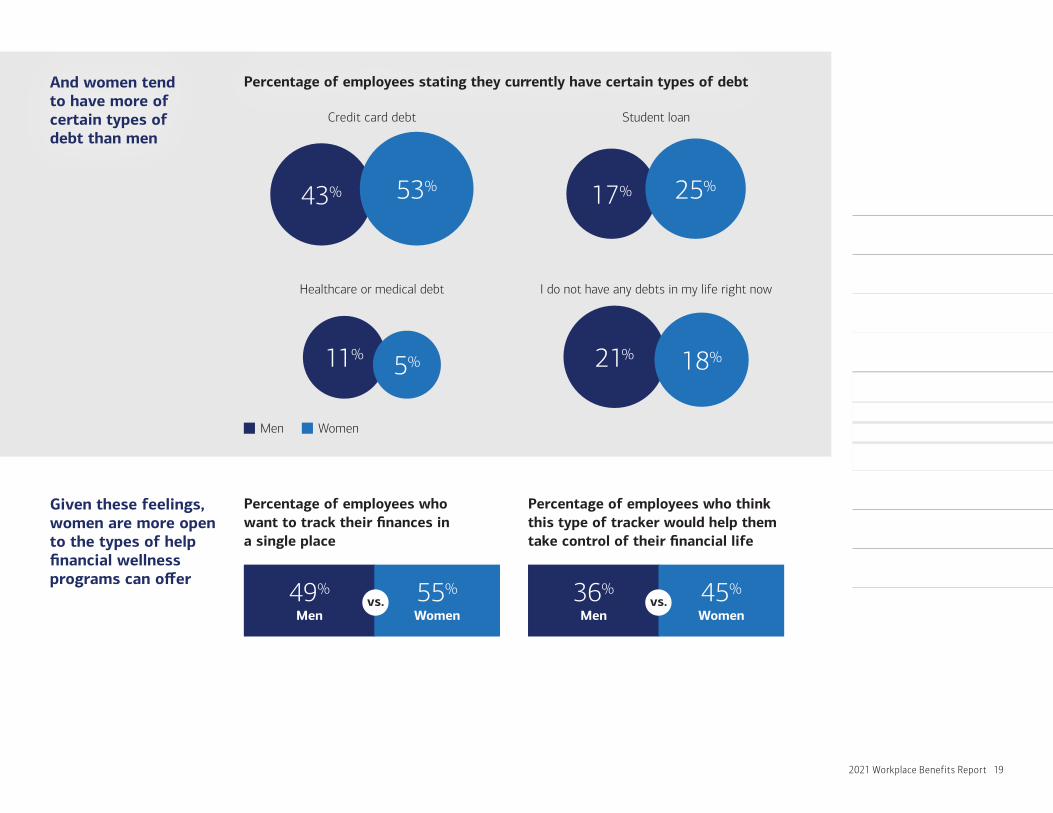
And women tend to have more of certain types of debt than men
Percentage of employees stating they currently have certain types of debt
Given these feelings, women are more open to the types of help financial wellness programs can offer
Percentage of employees who want to track their finances in a single place
Percentage of employees who think this type of tracker would help them take control of their financial life
49% Men
55% Women
36% Men
45% Women
Men Women
Credit card debt
43% 53%
Healthcare or medical debt
11% 5%
Student loan
17% 25%
I do not have any debts in my life right now
21% 18%
vs. vs.
202021 Workplace Benefits Report
Welcome
Table of contents
Key insights
Employer trends
Employee trends
•
•
•
Gender differences
Ethnic differences
Generational differences
Actions to consider
Ways we can help
About this study
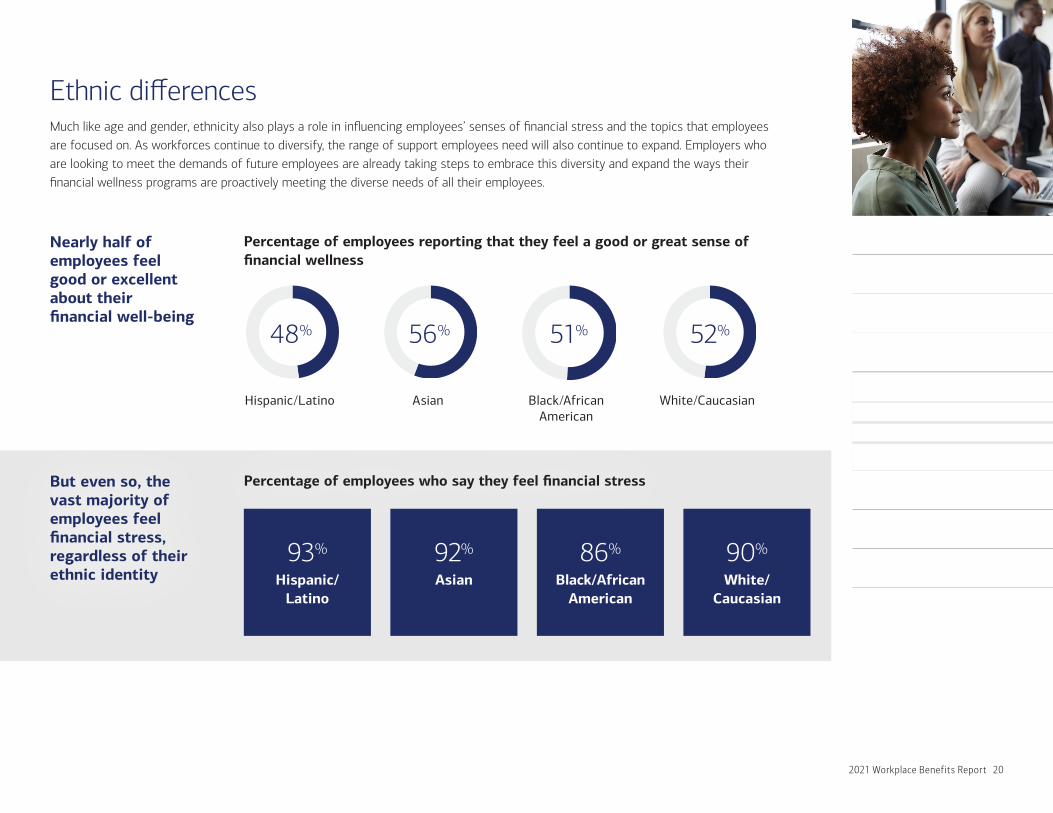
But even so, the vast majority of employees feel financial stress, regardless of their ethnic identity
Percentage of employees who say they feel financial stress
Nearly half of employees feel good or excellent about their financial well-being
Percentage of employees reporting that they feel a good or great sense of financial wellness
Hispanic/Latino Asian Black/African American
White/Caucasian
48% 51% 56% 52%
93%
Hispanic/Latino
92%
Asian
86%
Black/African American
90%
White/Caucasian
Ethnic differencesMuch like age and gender, ethnicity also plays a role in influencing employees’ senses of financial stress and the topics that employees are focused on. As workforces continue to diversify, the range of support employees need will also continue to expand. Employers who are looking to meet the demands of future employees are already taking steps to embrace this diversity and expand the ways their financial wellness programs are proactively meeting the diverse needs of all their employees.

212021 Workplace Benefits Report
Welcome
Table of contents
Key insights
Employer trends
Employee trends
•
•
•
Gender differences
Ethnic differences
Generational differences
Actions to consider
Ways we can help
About this study
There are differences in how this stress affects their feelings of productivity at work
Planning for retirement is the primary goal for all employees, but priorities that come in second and third vary
Percentage of employees stating that financial stress has a negative impact on their productivity at work
Hispanic/Latino Asian Black/African American
White/Caucasian
38% 40% 26% 22%
Most important financial priority
Hispanic/ Latino
AsianBlack/African
AmericanWhite/
Caucasian
1st Planning for retirement
Planning for retirement
Planning for retirement
Planning for retirement
2nd Buying a first house
Paying off credit cards
Growing savings to pay for unexpected
expenses
Paying off credit cards
3rd Paying off credit cards
Buying a first house
Buying a first house
Paying off mortgage

222021 Workplace Benefits Report
Welcome
Table of contents
Key insights
Employer trends
Employee trends
•
•
•
Gender differences
Ethnic differences
Generational differences
Actions to consider
Ways we can help
About this study
There is also a difference in the composition of the debt they hold
Employees want different types of help, underscoring the need for a complete financial wellness offering
A way to track my finances,
including my debts
A step-by-step roadmap for
accomplishing my goals
Streamlined information, where I can
see all my info in one place
Progress reports on where I stand
currently and where I need to
get to
Hispanic/Latino 34% 36% 24% 33%
Asian 43% 47% 35% 47%
Black/African American 42% 41% 29% 39%
White/Caucasian 30% 33% 32% 35%
Percentage of employees who say they currently hold certain types of debt
The services that employees say they want from their financial wellness program
Student loans Mortgage Credit card debt Currently holds no debt
Hispanic/Latino
27%33%
60%
13%
Asian
15%
41%
30% 30%
Black/African American
38%
28%
62%
12%
White/Caucasian
19%
48% 48%
19%

232021 Workplace Benefits Report
Welcome
Table of contents
Key insights
Employer trends
Employee trends
•
•
•
Gender differences
Ethnic differences
Generational differences
Actions to consider
Ways we can help
About this study
48% in 2021
48% in 2021
58% in 2021
41% in 2020
38% in 2020
61% in 2020
Gen Z, Millennials and Gen Xers are the least likely to rank themselves as financially well
Percentage of employees reporting that they feel a good or great sense of financial wellness1
Percentage of employees reporting that they feel stress when they think about their financial situation
And they are the most likely to report feeling financial stress
Conversely, Baby Boomers are twice as likely to say they feel “no financial stress” compared to other generations
Generational differencesNot surprisingly, employees of different generations are at different points on their financial journey. Generational differences demonstrate a wide range of feelings about financial wellness, current financial concerns and even the type of help employees need and want. The well-rounded financial wellness programs acknowledge these differences and address the wide range of employee needs.
Gen Z & Millennials (ages 18–44)
Gen Xers (ages 45–54)
Baby Boomers & Silent Generation (ages 55+)
93%
Gen Z & Millennials (ages 18–44)
94%
Gen Xers (ages 45–54)
84%
Baby Boomers & Silent Generation
(ages 55+)
up from
up from
down from
1 Bank of America, Workplace Benefits Report, 2020.

242021 Workplace Benefits Report
And the youngest employees are most likely to say the stress prevents them from being as productive as they could be
Welcome
Table of contents
Key insights
Employer trends
Employee trends
•
•
•
Gender differences
Ethnic differences
Generational differences
Actions to consider
Ways we can help
About this study
Percentage of employees saying financial stress interferes with their ability to focus and be productive at work
Percentage of employees saying they are very stressed and this stress keeps them up at night
75% 71% 55%
The youngest employees are also the most likely to be kept up at night by this stress
11%
Gen Z & Millennials (ages 18–44)
9%
Gen Xers (ages 45–54)
6%
Baby Boomers & Silent Generation (ages 55+)
Gen Z & Millennials (ages 18–44)
Gen Xers (ages 45–54)
Baby Boomers & Silent Generation
(ages 55+)

252021 Workplace Benefits Report
Planning for retirement is the primary goal for all employees, but generations differ on the level of importance they place on this objective
The priorities that come in second and third vary greatly by generation
Younger employees are also more strongly impacted by the debt they have
Welcome
Table of contents
Key insights
Employer trends
Employee trends
•
•
•
Gender differences
Ethnic differences
Generational differences
Actions to consider
Ways we can help
About this study
Percentage of employees reporting that they feel debt has affected their overall quality of life
This may be why Gen Z and Millennials rank fundamentals, like good savings habits, budgeting skills and paying for everyday expenses higher than other respondents, while Baby Boomers/Silent Generation are focused on retirement planning, having made progress against other life goals.
Percentage of employees reporting that they feel they have control over their debts
23% 15% 14%
36% 43%58%
Most important financial priority
Gen Z & Millennials (ages 18–44)
Gen Xers (ages 45–54)
Baby Boomers & Silent Generation
(ages 55+)
1st Planning for retirement
Planning for retirement
Planning for retirement
2nd Paying off credit cards
Paying off credit cards
Paying off mortgage
3rd Buying their first house
Growing savings to pay for unexpected
expenses
Paying off credit cards
Gen Z & Millennials (ages 18–44)
Gen Xers (ages 45–54)
Baby Boomers & Silent Generation (ages 55+)

262021 Workplace Benefits Report
Welcome
Table of contents
Key insights
Employer trends
Employee trends
•
•
•
Gender differences
Ethnic differences
Generational differences
Actions to consider
Ways we can help
About this study
Among eligible employees, the use of HSAs is significant, especially among Gen Xers
Eligible employees are saving more in their HSAs, while also making fewer regular withdrawals
Percentage of employees reporting that they contribute to their HSA
Percentage of eligible employees saving by using an HSA1
Percentage of eligible employees making regular withdrawals from their HSA1
74% in 2021
67% in 2020
51% in 2021
68% in 2020
68% 84% 74%
Gen Z & Millennials (ages 18–44)
Gen Xers (ages 45–54)
Baby Boomers & Silent Generation (ages 55+)
vs. vs.
1 Bank of America, Workplace Benefits Report, 2020.

272021 Workplace Benefits Report
Some employees did take extraordinary measures to help address the financial impacts of the coronavirus pandemic
However, older employees were less likely to take these steps than younger ones
Percentage of employees reporting that they had to rely on one or more of the above sources of funds as a result of the health pandemic
Welcome
Table of contents
Key insights
Employer trends
Employee trends
•
•
•
Gender differences
Ethnic differences
Generational differences
Actions to consider
Ways we can help
About this study
Making an emergency savings account withdrawal
Getting loans from family or friends
Cashing out an equity award or
selling stock
Withdrawing funds from an HSA
Withdrawing funds or borrowing from
a 401(k)
Using credit cards to pay for everyday
expenses
44%
Gen Z & Millennials (ages 18–44)
29%
Gen Xers (ages 45–54)
19%
Baby Boomers & Silent Generation
(ages 55+)

282021 Workplace Benefits Report
1 Take time to understand what employees need in order to provide the guidance and education that they need, when they need them.
2 Incorporate plan design features and provide access to education and guidance that offer a next action to consider in order to help employees track progress and nurture good financial habits.
3 Enable employees to take control of their individual financial futures, with comprehensive support to help them save and invest towards their retirement goals.
4 Invest in promoting digital resources to help drive engagement in order to increase productivity and loyalty among employees.
5 Think about how supporting workforce diversity in terms of age, gender and ethnicity can benefit the business and take action to support diversity and inclusion across the company.
Welcome
Table of contents
Key insights
Employer trends
Employee trends
•
•
•
Gender differences
Ethnic differences
Generational differences
Actions to consider
Ways we can help
About this study
Actions to considerSteps for employers
We recognize that employers are often at different stages of their journey to deliver financial life benefits to their employees. As you think about ways you can maximize the success of your programs, you may want to:

292021 Workplace Benefits Report
Ways we can helpBank of America can help you deliver financial wellness to your employees
Bank of America is a leader in delivering comprehensive financial wellness programs to companies of every size, all across the country. See how we can help you take action to help you elevate your workplace benefits offering in our Workplace Benefits Activation Guide.
Welcome
Table of contents
Key insights
Employer trends
Employee trends
•
•
•
Gender differences
Ethnic differences
Generational differences
Actions to consider
Ways we can help
About this study
* Investment products are available from Merrill Lynch, Pierce, Fenner & Smith Incorporated.
† Bank products are available from Bank of America, N.A., and affiliated banks.
To get a copy of the
Activation Guide, talk to your Bank of America
representative.
The guide gives you actionable ideas on how you can leverage our financial wellness offerings, including:
Financial Life Benefits® — a comprehensive program that delivers seamless integrated insights that help support an employee’s broad financial needs — retirement,* health savings,† banking† and investing* — along with exclusive benefits and rewards, tools, resources, and insights, as well as tailored education and guidance.
Financial Wellness Tracker — a personalized digital experience that offers employees a financial wellness score and a prioritized suggested action plan detailing the steps they can consider taking to help participants pursue their financial goals, coupled with access to a large network of financial professionals offering support and guidance to help fit their needs.1
Personal Retirement Strategy — a new digital investment advisory program that delivers personalized insights, guidance and tools, as well as access to digital investment management services for an additional fee, seamlessly integrated into the 401(k) experience.
Advice Access helps participants by providing asset allocation recommendations and ongoing management through its PersonalManager® service, an optional fee-based service. Advice Access is an investment advisory program.
Ongoing insights and thought leadership — helping educate employers and employees on a range of financial challenges, like retirement planning, caregiving and longevity, with ideas that can help them make progress towards addressing these goals.
302021 Workplace Benefits Report
Personal Retirement Strategy and Advice Access are an online investment advisory programs sponsored by Merrill Lynch, Pierce, Fenner & Smith Inc. (“MLPF&S” or “Merrill”) that uses a probabilistic approach to determine the likelihood that participants in the program will accumulate sufficient total assets to achieve their annual retirement income goal. The recommendations provided by Personal Retirement Strategy and/or Advice Access may include a higher level of investment risk than a participant may be personally comfortable with.
Participants are strongly advised to consider their personal goals, overall risk tolerance, and retirement horizon before accepting any recommendations made by Personal Retirement Strategy and/or Advice Access. Participants should carefully review the explanation of the methodology used, including key assumptions and limitations, as well as a description of services and related fees which is provided in the Personal Retirement Strategy Brochure (ADV Part 2A) or Advice Access disclosure document (ADV Part 2A). It can be obtained through Benefits OnLine or through the Retirement Benefits Contact Center.
Merrill offers a broad range of brokerage, investment advisory and other services. There are important differences between brokerage and investment advisory services, including the type of 350 advice and assistance provided, the fees charged, and the rights and obligations of the parties. It is important to understand the differences, particularly when determining which service or services to select.
IMPORTANT: The projections or other information shown in the Advice Access program and/or the Personal Retirement Strategy program regarding the likelihood of various investment outcomes are hypothetical in nature, do not reflect actual investment results and are not guarantees of future results. Results may vary with each use and over time.
Welcome
Table of contents
Key insights
Employer trends
Employee trends
•
•
•
Gender differences
Ethnic differences
Generational differences
Actions to consider
About this study
Ways we can help

Welcome
Table of contents
Key insights
Employer trends
Employee trends
•
•
•
Gender differences
Ethnic differences
Generational differences
Actions to consider
Ways we can help
About this study
To learn more about how Bank of America’s employee benefits plans may be able to help you and your employees, visit go.bofa.com/workplacebenefits.
MethodologyEscalent surveyed a national sample of 1,363 employees who are working full-time and participate in 401(k) plans, and 834 employers who offer both a 401(k) plan and have sole or shared responsibility for decisions made in the plan. The survey was conducted between December 28, 2020 and February 8, 2021.
To qualify for the survey, employees had to be current participants of a 401(k) plan and employers had to offer a 401(k) plan option. Neither was required to work with Bank of America.
Bank of America was not identified as the sponsor of the study.
Bank of America Retirement and Personal Wealth Solutions help employers and employees to take action and work toward their financial goals today and into retirement.
Employee detailsThe sample population represented:
45%
Men55%
Women
Employer detailsThe sample population represented:
419 Small companies (<$20M in 401(k) plan assets)
219 Mid-sized companies ($20M to <$100M in 401(k) plan assets)
196 Large companies (>$100M in 401(k) plan assets)
Various employee life stages were represented:
485 Gen Z & Millennials (18–44 years)
362 Gen Xers (45–54 years)
516 Baby Boomers & Silent Generation (55+ years)
78% White/Caucasian 2% Multi-racial
8% Black/African American
1% Other
10% Asian 1% American Indian or Alaska Native
0% Native Hawaiian or Pacific Islander
About this studyFirst launched in 2011, the annual Workplace Benefits Report plays a critical role in helping make financial lives better by generating real-world insights to bring solutions that fit our clients’ needs.
312021 Workplace Benefits Report
Various racial and ethnic backgrounds were represented:
7% Hispanic/Latino

1 The Financial Wellness Tracker calculates scores based on responses to questions, as well as some underlying calculations and are evaluated against the attributes of a financially well individual. The score takes into account: 1) personal information such as age, dependents and household income; 2) key financial information, including savings and expenses; and 3) the financial behaviors exhibited. Each question and answer is worth a certain number of points. Point values vary and one aggregate score is calculated to provide an individual their score.
Bank of America, its affiliates and advisors do not provide health care, legal, tax or accounting advice. You should consult your health care, legal and/or tax advisors before making any financial decisions.This material should be regarded as general information on healthcare considerations and is not intended to provide specific healthcare advice or imply that Merrill financial advisors can now or in the future will provide specific healthcare advice. Questions regarding healthcare situations should be directed to healthcare, legal or tax professionals.This report is designed to provide general information for employers to assist with planning strategies for their retirement plan and is for discussion purposes only. Bank of America is prohibited by law from giving legal or tax advice, and recommends consulting with an independent actuary, attorney and/or tax advisor before making any changes.
Financial Life Benefits is a registered trademark of Bank of America Corporation.© 2021 Bank of America Corporation | MAP3810604 | 9/2021