2019 new mexico dwi report - university of new mexico
TRANSCRIPT
New Mexico DWI Report
2019
New Mexico Department of Transportation
Traffic Safety Division, Traffic Records Bureau
ii
New Mexico Department of Transportation
Traffic Safety Division
Traffic Records Bureau
P.O. Box 1149
Santa Fe, New Mexico 87504-1149
(505) 827-0427
dot.state.nm.us
Published June 7, 2021
Available online at
gps.unm.edu/tru
Produced for the New Mexico Department of Transportation,
Traffic Safety Division, Traffic Records Bureau, under Contract 6093
Produced by the University of New Mexico,
Geospatial and Population Studies, Traffic Research Unit
Distributed in compliance with New Mexico Statute 66-7-214
as a reference source regarding New Mexico traffic crashes
For the purposes of this report, data are compiled by the University of New Mexico, Geospatial and
Population Studies (UNM-GPS), Traffic Research Unit, on behalf of the New Mexico Department of
Transportation (NMDOT). Data in this report may differ from that in other data sources, such as the
Federal Fatality Analysis Reporting System (FARS), due to the timing of publications and rules for
how data are compiled and maintained in Federal versus State databases. If you have questions
regarding this report, please contact the Traffic Safety Division at (505) 827-0427.
iii
Acknowledgements
The New Mexico Department of Transportation, Traffic Safety Division (NMDOT), would
like to thank New Mexico’s law enforcement agencies, state and local traffic safety officials,
NMDOT Traffic Records Program staff, NMDOT contractors, and other partner
organizations for their support of NMDOT programs and initiatives. Their work is central to
our success in reducing fatalities and injuries on New Mexico’s public roadways.
Special thanks go to New Mexico’s law enforcement officers for their work in documenting
traffic-related crash data using the NM state Uniform Crash Report (UCR) form, which
provides most of the data used in this report. These data are used for federal reporting and
to obtain federal grants and funding from the National Highway Transportation Safety
Administration (NHTSA) and the Federal Highway Administration (FHWA). Data in this
report are also used by traffic safety officials to identify and monitor traffic safety issues
and by New Mexico’s legislators to decide on funding for traffic-safety programs.
This report was produced for NMDOT under contract 6093 by the University of New
Mexico Geospatial and Population Studies (UNM-GPS), Traffic Research Unit (TRU), with
Robert Rhatigan, director. The editors were David Jacobs and Jessica Bloom, with maps
provided by David Jacobs and additional review by Maurreen Skowran. UNM-GPS would
like to thank Franklin Garcia, executive manager of the NMDOT Modal Divisions; and all of
the NMDOT Traffic Records staff, including Sophia Roybal-Cruz, Traffic Records staff
manager.
Photography credits:
- Cover photo courtesy of Jake Schoellkopf, NMDOT.
- Page v by Thomas Hawk. License: https://creativecommons.org/licenses/by-nc/2.0/.
- Page viii courtesy of the DWI Memorial of Perpetual Tears.
- Page x by Julie Manzerova. License: https://creativecommons.org/licenses/by-nc-sa/2.0/.
- Page 32 by Jim Legans Jr. License: https://creativecommons.org/licenses/by/2.0/.
Table of Contents
iv
TABLE OF CONTENTS .......................................................................................................................... iv
LIST OF TABLES ..................................................................................................................................... vi
LIST OF FIGURES ................................................................................................................................... ix
LIST OF MAPS ........................................................................................................................................... x
DEFINITIONS .......................................................................................................................................... xi
2019 HIGHLIGHTS ............................................................................................................................... 15
Summary of Alcohol-involved Crashes, 2019 ................................................................................ 16
Summary of Alcohol-involved Fatalities and Injuries, 2019 ........................................................... 18
ALCOHOL-INVOLVED CRASH GEOGRAPHY ................................................................................. 20
Counties ...................................................................................................................................... 26
Cities ........................................................................................................................................... 31
Rural and Urban Alcohol-involved Crashes ................................................................................... 33
CRASH CHARACTERISTICS ............................................................................................................... 35
Month, Day of Week, and Hour ................................................................................................... 35
Crash Classification ...................................................................................................................... 39
Vehicles ....................................................................................................................................... 41
DEMOGRAPHICS ................................................................................................................................... 43
Age and Sex ................................................................................................................................. 43
Teens (15-19) ............................................................................................................................... 47
Young Adults (20-24) ................................................................................................................... 51
Motorcyclists ............................................................................................................................... 55
Pedestrians .................................................................................................................................. 59
Pedalcyclists (Bicyclists) ............................................................................................................... 63
Table of Contents
Table of Contents
v
Alcohol-involved Drivers .............................................................................................................. 67
Seat Position and Victims ............................................................................................................. 71
Belt Use ....................................................................................................................................... 72
DWI ENFORCEMENT ........................................................................................................................... 73
Arrests ......................................................................................................................................... 73
Convictions .................................................................................................................................. 77
Court Dispositions ....................................................................................................................... 84
Blood Alcohol Content (BAC) ....................................................................................................... 85
RATES ...................................................................................................................................................... 86
ECONOMIC IMPACT ............................................................................................................................. 90
SOURCES ................................................................................................................................................. 91
INDEX ....................................................................................................................................................... 94
The Rio Puerco Bridge was built in the early 1930s. It is about 20 miles
west of Albuquerque, on Route 66.
List of Tables
vi
Table 1: Alcohol-involved Crashes, 2019 ................................................................................................................... 16
Table 2: Alcohol-involved Crashes, 2010 - 2019 ...................................................................................................... 16
Table 3: Alcohol-involved Fatal Crashes, 2010 - 2019 ........................................................................................... 16
Table 4: Alcohol-involved Crashes by Crash Severity, 2010 - 2019 ................................................................... 17
Table 5: People in Alcohol-involved Crashes by Severity of Injury, 2010 - 2019 .......................................... 18
Table 6: People Injured in Alcohol-involved Crashes by Type of Injury, 2010 - 2019................................. 19
Table 7: Alcohol-involved Crashes by County, 2015 - 2019 ................................................................................. 27
Table 8: Ranking and Rates of Alcohol-involved Crashes by County, 2015 - 2019 ....................................... 28
Table 9: Alcohol-involved Fatal Crashes by County, 2015 - 2019....................................................................... 29
Table 10: Ranking and Rates of Alcohol-involved Fatal Crashes by County, 2015 - 2019 .......................... 30
Table 11: Top-Ranking Cities for Alcohol-involved Crashes, 2015 - 2019 ...................................................... 31
Table 12: Top-Ranking Cities for Alcohol-involved Fatal Crash Rates, 2015 - 2019 .................................... 32
Table 13: Alcohol-involved Crashes and Number of People in Alcohol-involved Crashes
by Road System, 2019 ............................................................................................................................................. 33
Table 14: Alcohol-involved Injury Crashes and Number of People Injured by Road System, 2019 ....... 33
Table 15: Alcohol-involved Fatal Crashes and Number of People Killed by Road System, 2019 ............ 33
Table 16: Alcohol-involved Crashes and Fatalities by Crash Classification and Road System, 2019 ..... 34
Table 17: Alcohol-involved Crashes by Light Condition and Road System, 2019 ......................................... 34
Table 18: Alcohol-involved Crashes by Month and Crash Severity, 2019 ........................................................ 35
Table 19: Alcohol-involved Crashes by Day of the Week and Crash Severity, 2019 ..................................... 36
Table 20: Alcohol-involved Crashes by Day of the Week and Three-hour Segments, 2019 ...................... 37
Table 21: Alcohol-involved Crashes by Hour and Day of the Week, 2019 ....................................................... 38
Table 22: Alcohol-involved Crashes by Crash Classification, 2015 - 2019 ...................................................... 39
Table 23: Alcohol-involved Crashes by Crash Classification and Crash Severity, 2019 .............................. 40
Table 24: Alcohol-involved Crashes by Number of Vehicles Involved and Crash Severity, 2019 ............ 41
Table 25: People in Alcohol-involved in Crashes by Number of Vehicles Involved, 2019 .......................... 41
Table 26: Alcohol-involved Drivers in Crashes by Vehicle Type and Crash Severity, 2019 ....................... 42
Table 27: Alcohol-involved Drivers in Crashes by Vehicle Type and Severity of Injury, 2019 ................. 42
Table 28: People in Alcohol-involved Crashes by Age, 2015 - 2019 .................................................................. 43
Table 29: People in Alcohol-involved Crashes by Age and Sex, 2019................................................................ 44
Table 30: Fatalities in Alcohol-involved Crashes by Age and Sex, 2019 ........................................................... 45
Table 31: People in Alcohol-involved Crashes by Age and Severity of Injury, 2019 .................................... 46
Table 32: Teens (15-19) in Alcohol-involved Crashes by Severity of Injury, 2019 ...................................... 47
Table 33: Alcohol-involved Teen Drivers (15-19) in Crashes by Crash Severity, 2010 - 2019 ................. 48
Table 34: Alcohol-involved Teen Drivers (15-19) in Crashes by Sex, 2010 - 2019....................................... 49
List of Tables
List of Tables
vii
Table 35: Alcohol-involved Teen Drivers (15-19) in Crashes by Hour, 2019 ................................................. 50
Table 36: Young Adults (20-24) in Alcohol-involved Crashes by Severity of Injury, 2019 ........................ 51
Table 37: Alcohol-involved Young Adult Drivers (20-24) in Crashes by Severity, 2010 - 2019 ............... 52
Table 38: Alcohol-involved Young Adult Drivers (20-24) in Crashes by Sex, 2010 - 2019 ........................ 53
Table 39: Alcohol-involved Young Adult Drivers (20-24) by Hour, 2019 ........................................................ 54
Table 40: Alcohol-involved Motorcycle Crashes, 2019 .......................................................................................... 55
Table 41: Alcohol-involved Motorcycle Crashes by Crash Severity, 2019 ....................................................... 55
Table 42: Alcohol-involved Motorcycle Crashes, 2010 - 2019 ............................................................................ 56
Table 43: Top Counties for Alcohol-involved Motorcycle Crashes, 2015 - 2019 ........................................... 56
Table 44: Alcohol-involved Motorcycle Driver Crash Rates, 2015 - 2019 ....................................................... 57
Table 45: Alcohol-involved Motorcycle Drivers in Crashes by Age and Sex, 2019 ....................................... 58
Table 46: Alcohol-involved Pedestrian Crashes, 2019 .......................................................................................... 59
Table 47: Alcohol-involved Pedestrian Crashes by Crash Severity, 2019 ....................................................... 59
Table 48: Alcohol-involved Pedestrian Crashes, 2010 - 2019 ............................................................................. 60
Table 49: Top-Ranking Counties for Alcohol-involved Pedestrian Crashes, 2015 - 2019 .......................... 61
Table 50: Alcohol-involved Pedestrians in Alcohol-involved Crashes, 2015 - 2019 .................................... 61
Table 51: Alcohol-involved Pedestrians in Crashes by Age, 2019 ...................................................................... 62
Table 52: Alcohol-involved Pedalcycle Crashes, 2019 ........................................................................................... 63
Table 53: Alcohol-involved Pedalcycle Crashes by Crash Severity, 2019 ........................................................ 63
Table 54: Alcohol-involved Pedalcycle Crashes, 2010 - 2019 ............................................................................. 64
Table 55: Top-Ranking Counties for Alcohol-involved Pedalcycle Crashes, 2015 - 2019 .......................... 65
Table 56: Alcohol-involved Pedalcyclists in Alcohol-involved Crashes, 2015 - 2019 .................................. 65
Table 57: Alcohol-involved Pedalcyclists in Crashes by Age and Sex, 2019 ................................................... 66
Table 58: Alcohol-involved Drivers in Crashes by Sex, 2019 ............................................................................... 67
Table 59: Alcohol-involved Drivers in Crashes by License Type and Residence, 2019 ............................... 67
Table 60: Alcohol-involved Drivers in Crashes by Age and Sex, 2019 .............................................................. 69
Table 61: Alcohol-involved Drivers in Crashes by Age Group, 2010 - 2019 ................................................... 70
Table 62: People in Alcohol-involved Crashes by Sex and Seat Position, 2019 ............................................. 71
Table 63: Victims of Alcohol-involved Crashes, 2019 ............................................................................................ 71
Table 64: Unbelted Fatalities in Alcohol-involved Crashes by Age and Sex, 2019 ........................................ 72
Table 65: DWI Arrests by County, 2015 - 2019 ........................................................................................................ 73
Table 66: DWI Arrests by City, 2015 - 2019 ............................................................................................................... 74
Table 67: DWI Arrests by Age and Sex, 2019 ............................................................................................................ 75
Table 68: Number of Drivers Arrested for a DWI, 2015 - 2019 ........................................................................... 76
Table 69: DWI Convictions by County, 2015 - 2019 ................................................................................................ 77
Table 70: Top-Ranking Counties for DWI Convictions, 2015 - 2019 ................................................................. 78
Table 71: Number of Drivers with a First DWI Conviction, 2015 - 2019 .......................................................... 79
Table 72: First DWI Convictions by Age and Sex, 2019 .......................................................................................... 80
List of Tables
viii
Table 73: Repeat DWI Convictions by County, 2015 - 2019 ................................................................................. 81
Table 74: Drivers Convicted of a Repeat DWI by Age, 2015 - 2019 .................................................................... 82
Table 75: Repeat DWI Convictions by Age and Sex, 2019 ..................................................................................... 83
Table 76: Disposition of DWI Arrests in 2019 by County, as of October 2020 ............................................... 84
Table 77: Rate Denominators: Population, Vehicle Miles Traveled, Licensed Drivers,
and Motor Vehicle Registrations, 2010 - 2019 ............................................................................................... 86
Table 78: Alcohol-involved Crash Rates, 2010 - 2019 ............................................................................................ 87
Table 79: Alcohol-involved Fatal Crash Rates, 2010 - 2019 ................................................................................. 88
Table 80: Alcohol-involved Fatality Rates, 2010 - 2019 ........................................................................................ 89
Table 81: Human Capital Cost Estimates for Alcohol-involved Crashes, 2019 Adjusted ............................ 90
Table 82: Comprehensive Cost Estimates for Alcohol-involved Crashes, 2019 Adjusted .......................... 90
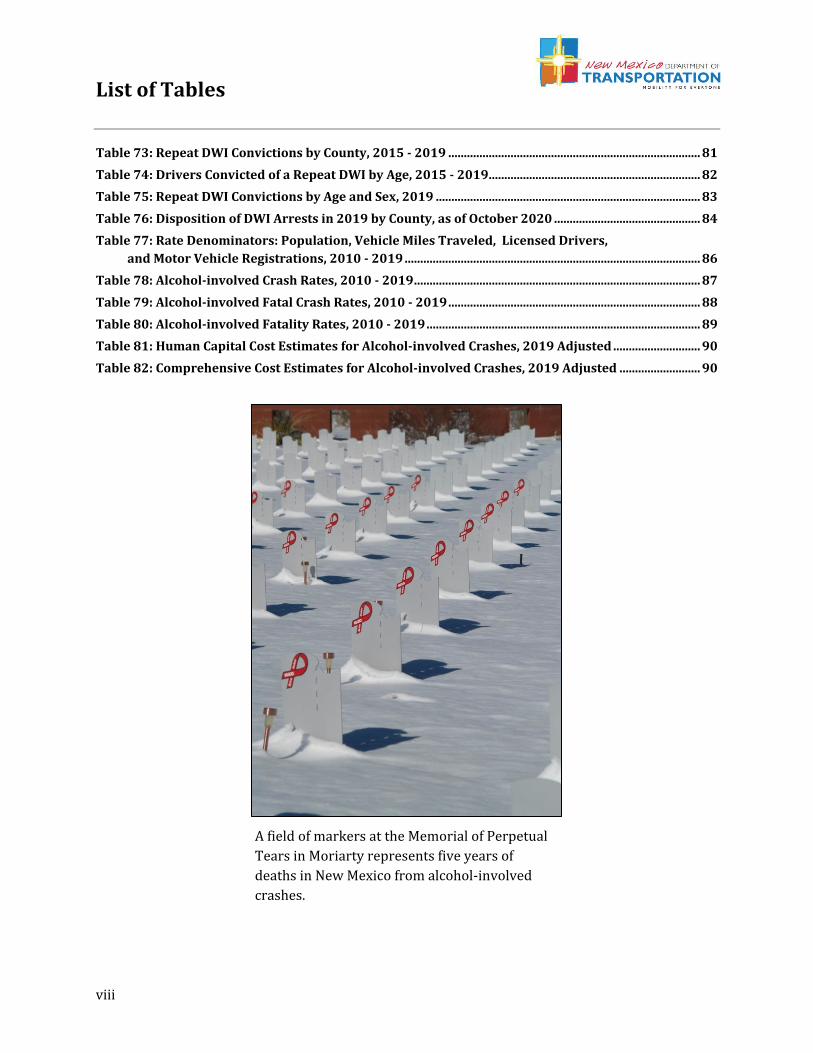
A field of markers at the Memorial of Perpetual
Tears in Moriarty represents five years of
deaths in New Mexico from alcohol-involved
crashes.
List of Figures
ix
Figure 1: Total Fatal Crashes and Alcohol-involved Fatal Crashes, 2010 - 2019 ........................................... 16
Figure 2: Alcohol-involved Total and Fatal Crashes, 2010 - 2019 ...................................................................... 17
Figure 3: People in Alcohol-involved Crashes by Severity of Injury, 2010 - 2019 ........................................ 18
Figure 4: People Injured in Alcohol-involved Crashes by Type of Injury, 2010 - 2019 ............................... 19
Figure 5: Percentage of Alcohol-involved Crashes by Month, 2019................................................................... 35
Figure 6: Percentage of Alcohol-involved Crashes by Day of the Week, 2019 ............................................... 36
Figure 7: Percentage of Alcohol-involved Crashes by Three-hour Segments, 2019 ..................................... 37
Figure 8: Alcohol-involved Crashes by Hour, 2019 ................................................................................................. 38
Figure 9: Alcohol-involved Crashes by Crash Classification, 2019 ..................................................................... 40
Figure 10: People in Alcohol-involved Crashes by Age and Sex, 2019 .............................................................. 44
Figure 11: Fatalities in Alcohol-involved Crashes by Age and Sex, 2019 ......................................................... 45
Figure 12: Percentage of People in Alcohol-involved Crashes by Age Group, 2019 ..................................... 46
Figure 13: Alcohol-involved Teen Drivers (15-19) in Crashes, 2010 - 2019 .................................................. 48
Figure 14: Alcohol-involved Teen Drivers (15-19) in Crashes by Sex, 2010 - 2019 ..................................... 49
Figure 15: Alcohol-involved Young Adult Drivers (20-24) in Crashes, 2010 - 2019 .................................... 52
Figure 16: Alcohol-involved Young Adult Drivers (20-24) in Crashes by Sex, 2010 - 2019 ....................... 53
Figure 17: Percentage of Alcohol-involved Motorcycle Drivers in Crashes by Age Group, 2019 ............. 57
Figure 18: Alcohol-involved Motorcycle Drivers in Crashes by Age and Sex, 2019 ...................................... 58
Figure 19: Alcohol-involved Pedestrian Crashes, 2010 - 2019 ........................................................................... 60
Figure 20: Percentage of Alcohol-involved Pedestrians in Crashes by Age, 2019 ........................................ 62
Figure 21: Alcohol-involved Pedalcycle Crashes, 2010 - 2019 ............................................................................ 64
Figure 22: Alcohol-involved Pedalcyclists in Crashes by Age Group, 2019 ..................................................... 66
Figure 23: Percentage and Rate of Alcohol-involved Drivers in Crashes by Age Group, 2019 ................. 68
Figure 24: Alcohol-involved Drivers in Crashes by Age and Sex, 2019 ............................................................. 68
Figure 25: Alcohol-involved Drivers in Crashes by Age Group, 2019 ............................................................... 69
Figure 26: DWI Arrests by Age and Sex, 2019 ........................................................................................................... 75
Figure 27: Number of Drivers Arrested for DWI, 2015 - 2019 ............................................................................ 76
Figure 28: Top-Ranking Counties for DWI Convictions, 2019 ............................................................................. 78
Figure 29: First DWI Convictions by Age and Sex, 2019 ........................................................................................ 80
Figure 30: Drivers Convicted of a Repeat DWI, 2015 - 2019 ................................................................................ 82
Figure 31: Repeat DWI Convictions by Age and Sex, 2019 .................................................................................... 83
Figure 32: Range of BAC Test Results from 2019 DWI Arrests ............................................................................ 85
Figure 33: Number of BAC Test Refusals and Percentage of BAC Test Refusals, 2010 - 2019 ................... 85
Figure 34: Alcohol-involved Crash Rates (Population and VMT), 2010 - 2019 .............................................. 87
Figure 35: Alcohol-involved Fatal Crash Rates (Population and VMT), 2010 - 2019 ................................... 88
Figure 36: Alcohol-involved Fatality Rates (Population and VMT), 2010 - 2019 .......................................... 89
List of Figures
List of Maps
x
Map 1: Alcohol-involved Crashes in New Mexico by County, 2019 .................................................................... 20
Map 2: Location of Alcohol-involved Crashes, 2019 ............................................................................................... 21
Map 3: Location and Density of Alcohol-involved Crashes in Albuquerque, 2019 ....................................... 22
Map 4: Location and Density of Alcohol-involved Crashes in Las Cruces, 2019 ............................................ 23
Map 5: Location and Density of Alcohol-involved Crashes in Santa Fe, 2019 ................................................. 24
Map 6: Location and Density of Alcohol-involved Crashes in Gallup, 2019 .................................................... 25
Map 7: Location and Density of Alcohol-involved Crashes in Farmington, 2019 .......................................... 25
List of Maps
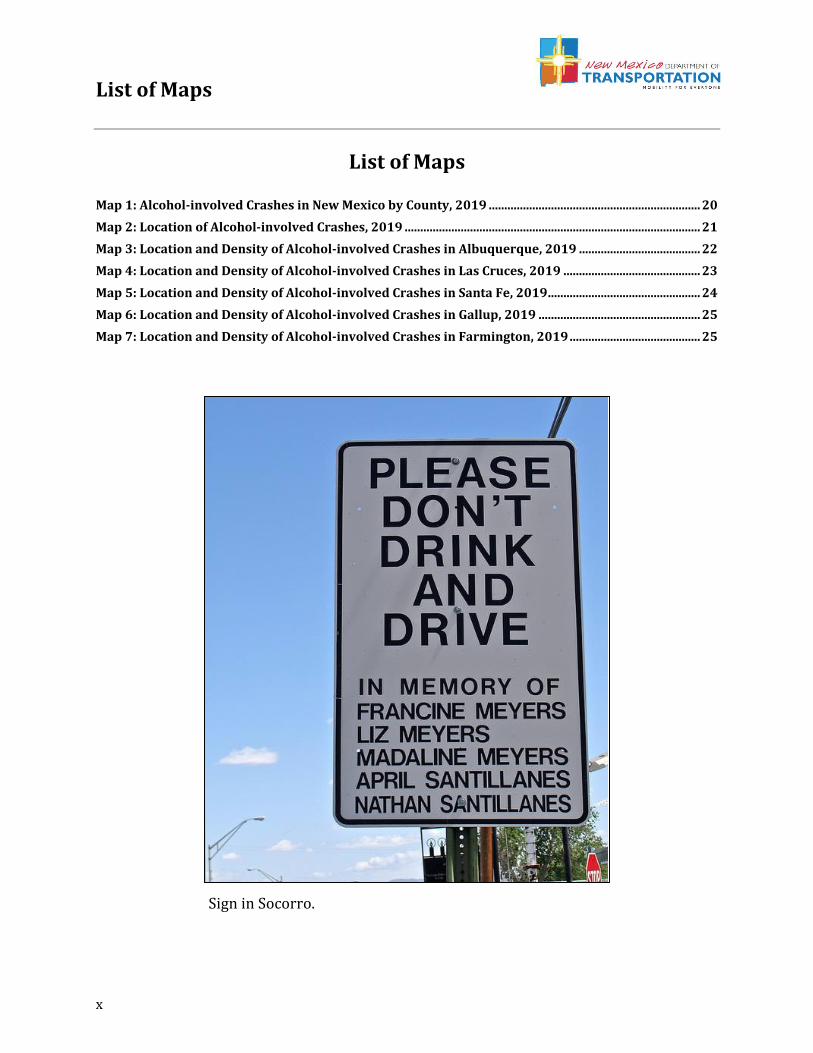
Sign in Socorro.
Definitions
xi
100M VMT – A measurement of the number of miles traveled annually by motor vehicles.
It is reported in units of 100 million vehicle miles traveled (100M VMT).
Aggravated DWI Arrest – An arrest for any of the following: 1) driving with a BAC of 0.16
or higher, 2) driving under the influence of alcohol or drugs and causing bodily injury to a
human being as a result, or 3) driving under the influence of alcohol or drugs and refusing
to submit to a BAC test at the time of arrest for DWI.
Alcohol-involved Crash – A crash for which the Uniform Crash Report indicated that 1) a
DWI citation was issued, 2) alcohol was a contributing factor, or 3) a person in control of a
vehicle (including a pedestrian or pedalcyclist) was suspected of being under the influence
of alcohol. An alcohol-involved crash can involve one or more alcohol-involved drivers.
Alcohol-involved Driver – A person in control of a vehicle who was cited for DWI or
indicated on the Uniform Crash Report as being either suspected or determined by testing
to be under the influence of alcohol. A single alcohol-involved crash can involve multiple
alcohol-involved drivers.
BAC – Blood alcohol concentration is expressed in units of grams of alcohol per deciliter of
blood (g/dL).
Crash – A reported incident on a public roadway involving one or more motor vehicles that
resulted in death, personal injury, or at least $500 in property damage. Crashes on private
property (such as a parking lot) are not included.
Driver – A person in control of a motorized vehicle. Pedestrians and pedalcyclists are
considered drivers of non-motorized vehicles.
DWI – Driving while intoxicated.
DWI Arrest (Citation) – In this report, a DWI arrest (a.k.a. a DWI citation) is an arrest for
either DWI or aggravated DWI. New Mexico’s legal limit for presumption of driving while
intoxicated (DWI) is 0.08 for non-commercial drivers older than 21 years of age, 0.04 for
commercial vehicle drivers, and 0.02 for drivers younger than 21 years of age.
Definitions
Definitions
xii
DWI Conviction – Conviction of driving under the intoxicating influence of alcohol,
narcotics, or pathogenic drugs. These convictions include those of people arrested for
aggravated DWI.
Fatal Crash – A crash in which at least one person was killed. Note that more than one
person can be killed in a single fatal crash.
Fatalities – The number of people killed in a crash. The terms “killed” and “deaths” are
synonymous with “fatalities.” A fatality is crash-related if it occurs at the time of the crash
or if the person(s) involved in the crash dies within 30 days.
Geocoding – The process of using the descriptive locational information on the Uniform
Crash Reports submitted to NMDOT to assign geographic coordinates to each crash. The
data are geocoded using ESRI ArcGIS 10.7 software. Crashes that have incomplete, missing
or invalid locational data are not geocoded.
Injuries – The number of people injured in a crash, in contrast to the number of crashes in
which people were injured. This includes suspected serious injuries (Class A), suspected
minor injuries (Class B) and possible injuries (Class C). Counts consist of people injured but
not killed.
Injury Crash – A reported crash in which at least one person was injured. Injury crashes
involve at least one suspected serious injury (Class A), suspected minor injury (Class B), or
possible injury (Class C). Fatal crashes are not included in this category.
Missing Data – An indication that the applicable field on the UCR form was left blank or
contained an invalid code. Starting with crashes that occurred in 2012, improvements in
the identification of missing data in the NMDOT crash database led to an increase in the
reported amount of missing data.
Motorcyclist – A person who is in or upon a motorcycle or all-terrain vehicle (ATV). There
can be multiple motorcyclists in a single motorcycle-involved crash.
Non-Motorized Vehicle – A pedalcyclist or pedestrian who is involved in a motor vehicle
traffic crash. Includes personal conveyances such as skateboards and wheelchairs.
Occupant – A person who is in or upon a motor vehicle in transport. This includes the
driver, passengers, and persons riding on the exterior of a motor vehicle.
Definitions
xiii
Pedalcyclist – A person riding a mechanism of transport that is powered solely by pedals.
Pedestrian – A person on foot, walking, running, jogging, hiking, sitting or lying down who
is involved in a motor vehicle traffic crash.
Possible Injury – An injury reported or claimed which is not a fatal, suspected serious or
suspected minor injury. Possible injuries are those which are reported by the person or are
indicated by his or her behavior, but no wounds or injuries are readily evident (a.k.a. Class
C injury, “Complaint of Injury”, or “Non-visible Injury”). Examples include momentary loss
of consciousness, claim of injury, limping, or complaint of pain or nausea.
Property Damage Only Crash (PDO) – A reported crash on a public road that did not
involve injuries or fatalities but resulted in more than $500 in property damage only (a.k.a.
a Class O crash).
Rate – A rate is calculated by dividing a total count (such as total crashes, drivers, or
fatalities) by a denominator such as VMT, number of licensed drivers, or population. See
page 86 for more detail.
Ratio of Males to Females – The number of males for every one female. The ratio of males
to females is calculated by dividing the number of males by the number of females. For
example, five males and two females have a ratio of 2.5 males for every one female.
Rural – Places not classified as urban are classified as rural.
Severity of Injury – The degree of injury to a person in a crash as describe by the KABCO
scale: K is Killed, ABC indicate injuries (A=suspected serious, B=suspected minor,
C=possible), and O indicates no apparent injuries (property damage only).
Suspected Minor Injury – A visible but not serious injury, such as abrasions, bruises and
minor lacerations, as observed by the officer at the scene of the crash. Also known as a
Class B injury or a visible injury.
Suspected Serious Injury – Any injury other than fatal that results in one or more of the
following:
▪ Severe laceration resulting in exposure of underlying tissues/muscle/organs or
resulting in significant loss of blood
▪ Broken or distorted extremity (arm or leg)
Definitions
xiv
▪ Crush injuries
▪ Suspected skull, chest, or abdominal injury other than bruises or minor lacerations
▪ Significant burns (second- and third-degree burns over 10% or more of the body)
▪ Unconsciousness when taken from the crash scene
▪ Paralysis
The definition above was adopted in 2014 by the Federal Highway Administration for
suspected serious injuries (Class A injuries). Before this revision, a Class A injury was
defined as “an injury, other than a fatal injury, in which the person was carried from the
scene of the crash or in which the injured person was unable to walk, drive or perform
normal activities he or she was capable of performing before the injury occurred, as
observed by the officer at the scene of the crash. Also known as an incapacitating injury.”
Uniform Crash Report (UCR) – A statewide form, submitted by law enforcement agencies
in the state to the NMDOT, for any crash on a public roadway involving one or more motor
vehicles that resulted in death, personal injury, or at least $500 in property damage.
Urban – Areas defined by the 2010 U.S. Census Urbanized Areas (NMDOT-adjusted) and
U.S. Census Urban Clusters. This definition, which is based on population density, allows
densely settled areas outside of incorporated places to be classified as “urban,” and
sparsely settled areas within incorporated boundaries to be classified as “rural.” Urban
areas for crash years 2013-2017 include a ½-mile buffer extending out from those urban
boundaries. Urban areas for crash years 2018 and after do not include a buffer, which
decreases the number of crashes classified as urban. In crashes before 2013, “urban” was
defined as a town or city with a population of at least 2,500 people.
Vehicle – A motorized car, truck, bus, van, or motorcycle (mechanically or electrically
powered) for carrying or transporting persons or things. Pedestrians and pedalcyclists are
counted as non-motorized vehicles when in a crash with a motorized vehicle.
2019 Alcohol-involved Crash Summary
15
DWI Enforcement
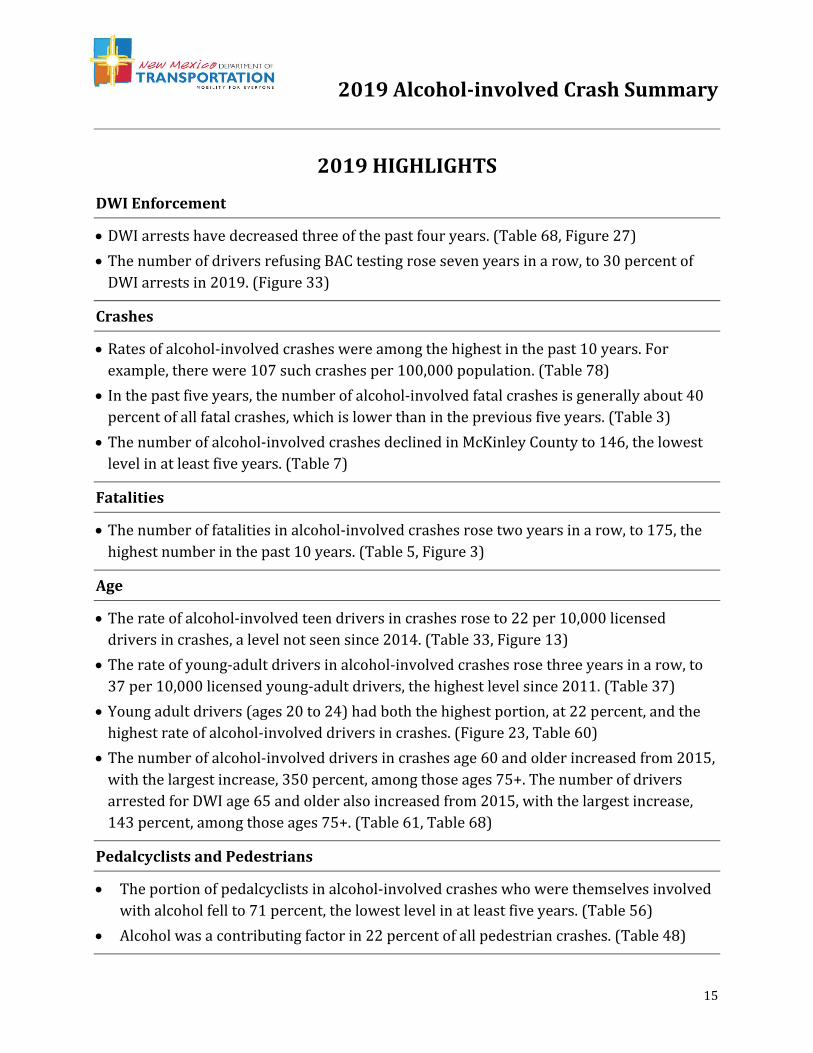
• DWI arrests have decreased three of the past four years. (Table 68, Figure 27)
• The number of drivers refusing BAC testing rose seven years in a row, to 30 percent of
DWI arrests in 2019. (Figure 33)
Crashes
• Rates of alcohol-involved crashes were among the highest in the past 10 years. For
example, there were 107 such crashes per 100,000 population. (Table 78)
• In the past five years, the number of alcohol-involved fatal crashes is generally about 40
percent of all fatal crashes, which is lower than in the previous five years. (Table 3)
• The number of alcohol-involved crashes declined in McKinley County to 146, the lowest
level in at least five years. (Table 7)
Fatalities
• The number of fatalities in alcohol-involved crashes rose two years in a row, to 175, the
highest number in the past 10 years. (Table 5, Figure 3)
Age
• The rate of alcohol-involved teen drivers in crashes rose to 22 per 10,000 licensed
drivers in crashes, a level not seen since 2014. (Table 33, Figure 13)
• The rate of young-adult drivers in alcohol-involved crashes rose three years in a row, to
37 per 10,000 licensed young-adult drivers, the highest level since 2011. (Table 37)
• Young adult drivers (ages 20 to 24) had both the highest portion, at 22 percent, and the
highest rate of alcohol-involved drivers in crashes. (Figure 23, Table 60)
• The number of alcohol-involved drivers in crashes age 60 and older increased from 2015,
with the largest increase, 350 percent, among those ages 75+. The number of drivers
arrested for DWI age 65 and older also increased from 2015, with the largest increase,
143 percent, among those ages 75+. (Table 61, Table 68)
Pedalcyclists and Pedestrians
• The portion of pedalcyclists in alcohol-involved crashes who were themselves involved
with alcohol fell to 71 percent, the lowest level in at least five years. (Table 56)
• Alcohol was a contributing factor in 22 percent of all pedestrian crashes. (Table 48)
2019 HIGHLIGHTS
2019 Alcohol-involved Crash Summary
16
Year
Alcohol-
involved
Fatal
Crashes
Total
Fatal
Crashes
Percent of
Total Fatal
Crashes
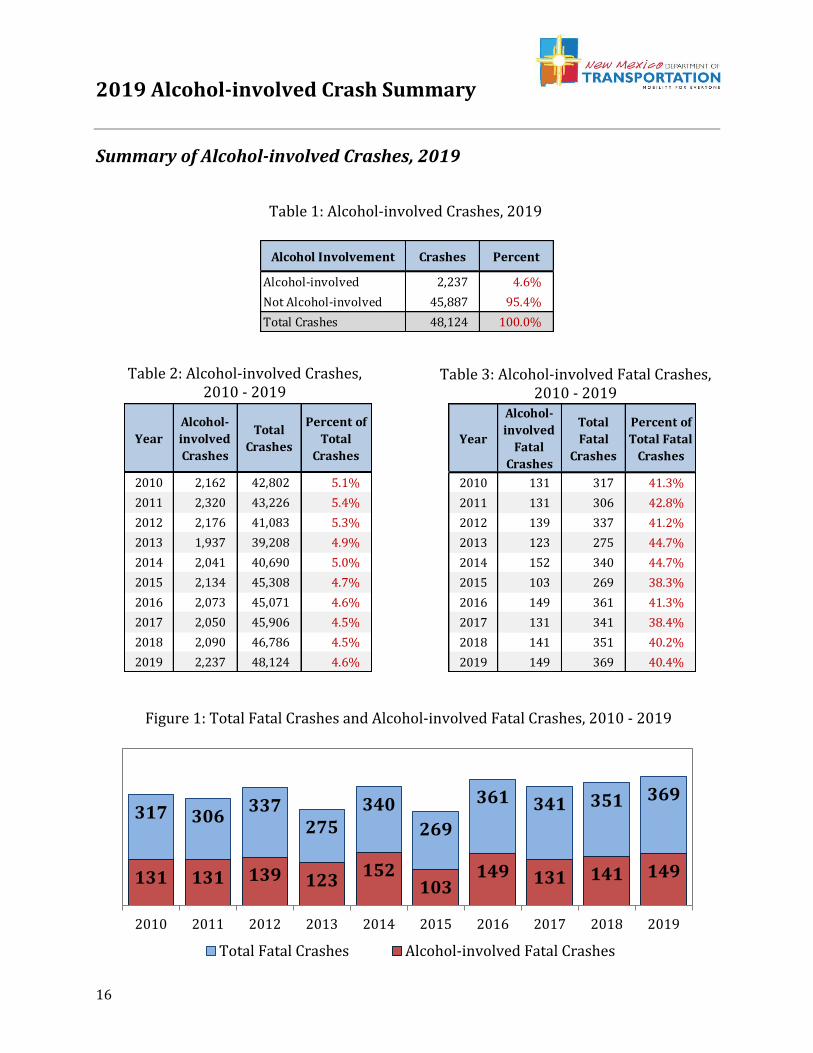
2010 131 317 41.3%
2011 131 306 42.8%
2012 139 337 41.2%
2013 123 275 44.7%
2014 152 340 44.7%
2015 103 269 38.3%
2016 149 361 41.3%
2017 131 341 38.4%
2018 141 351 40.2%
2019 149 369 40.4%
Summary of Alcohol-involved Crashes, 2019
Alcohol Involvement Crashes Percent
Alcohol-involved 2,237 4.6%
Not Alcohol-involved 45,887 95.4%
Total Crashes 48,124 100.0%
Year
Alcohol-
involved
Crashes
Total
Crashes
Percent of
Total
Crashes
2010 2,162 42,802 5.1%
2011 2,320 43,226 5.4%
2012 2,176 41,083 5.3%
2013 1,937 39,208 4.9%
2014 2,041 40,690 5.0%
2015 2,134 45,308 4.7%
2016 2,073 45,071 4.6%
2017 2,050 45,906 4.5%
2018 2,090 46,786 4.5%
2019 2,237 48,124 4.6%
317 306337
275340
269
361 341 351 369
131 131 139 123152
103149 131 141 149
2010 2011 2012 2013 2014 2015 2016 2017 2018 2019
Total Fatal Crashes Alcohol-involved Fatal Crashes
Table 1: Alcohol-involved Crashes, 2019
Table 2: Alcohol-involved Crashes, 2010 - 2019
Table 3: Alcohol-involved Fatal Crashes, 2010 - 2019
Figure 1: Total Fatal Crashes and Alcohol-involved Fatal Crashes, 2010 - 2019
2019 Alcohol-involved Crash Summary
17
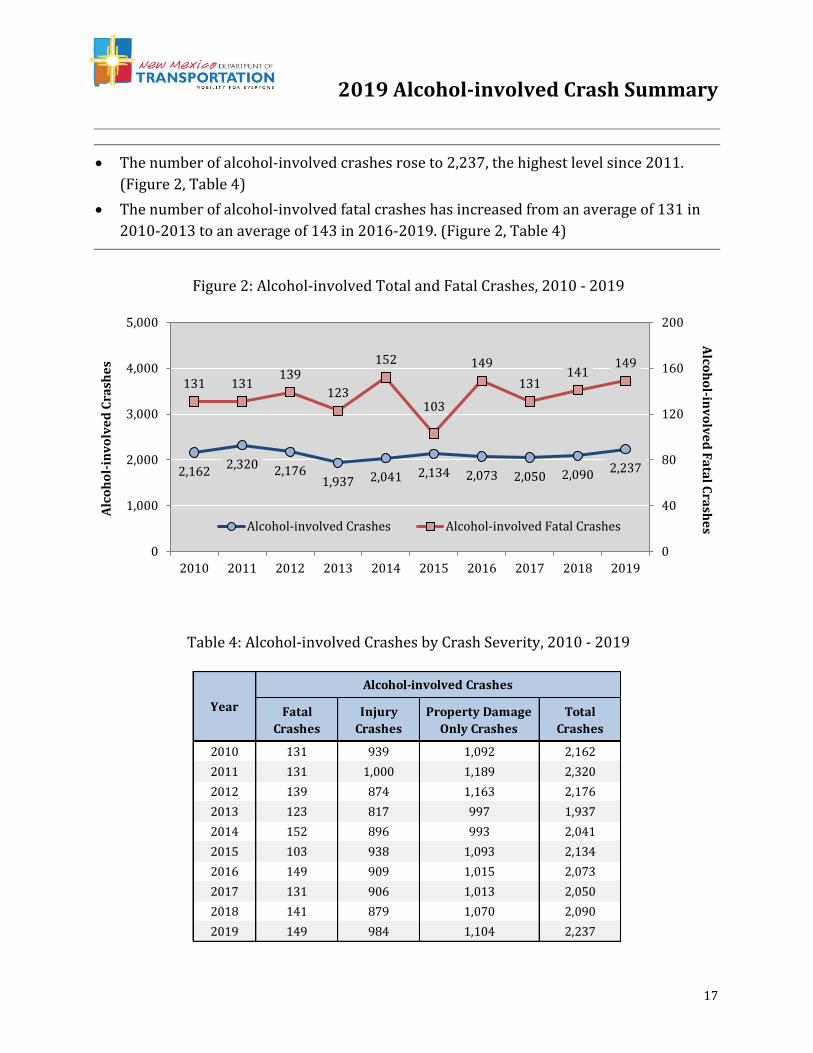
• The number of alcohol-involved crashes rose to 2,237, the highest level since 2011.
(Figure 2, Table 4)
• The number of alcohol-involved fatal crashes has increased from an average of 131 in
2010-2013 to an average of 143 in 2016-2019. (Figure 2, Table 4)
2,1622,320 2,176
1,937 2,041 2,134 2,073 2,050 2,0902,237
131 131139
123
152
103
149
131141
149
0
40
80
120
160
200
0
1,000
2,000
3,000
4,000
5,000
2010 2011 2012 2013 2014 2015 2016 2017 2018 2019
Alco
ho
l-inv
olv
ed
Fa
tal C
rash
es
Alc
oh
ol-
inv
olv
ed
Cra
she
s
Alcohol-involved Crashes Alcohol-involved Fatal Crashes
Fatal
Crashes
Injury
Crashes
Property Damage
Only Crashes
Total
Crashes
2010 131 939 1,092 2,162
2011 131 1,000 1,189 2,320
2012 139 874 1,163 2,176
2013 123 817 997 1,937
2014 152 896 993 2,041
2015 103 938 1,093 2,134
2016 149 909 1,015 2,073
2017 131 906 1,013 2,050
2018 141 879 1,070 2,090
2019 149 984 1,104 2,237
Year
Alcohol-involved Crashes
Figure 2: Alcohol-involved Total and Fatal Crashes, 2010 - 2019
Table 4: Alcohol-involved Crashes by Crash Severity, 2010 - 2019
2019 Alcohol-involved Crash Summary
18
Summary of Alcohol-involved Fatalities and Injuries, 2019
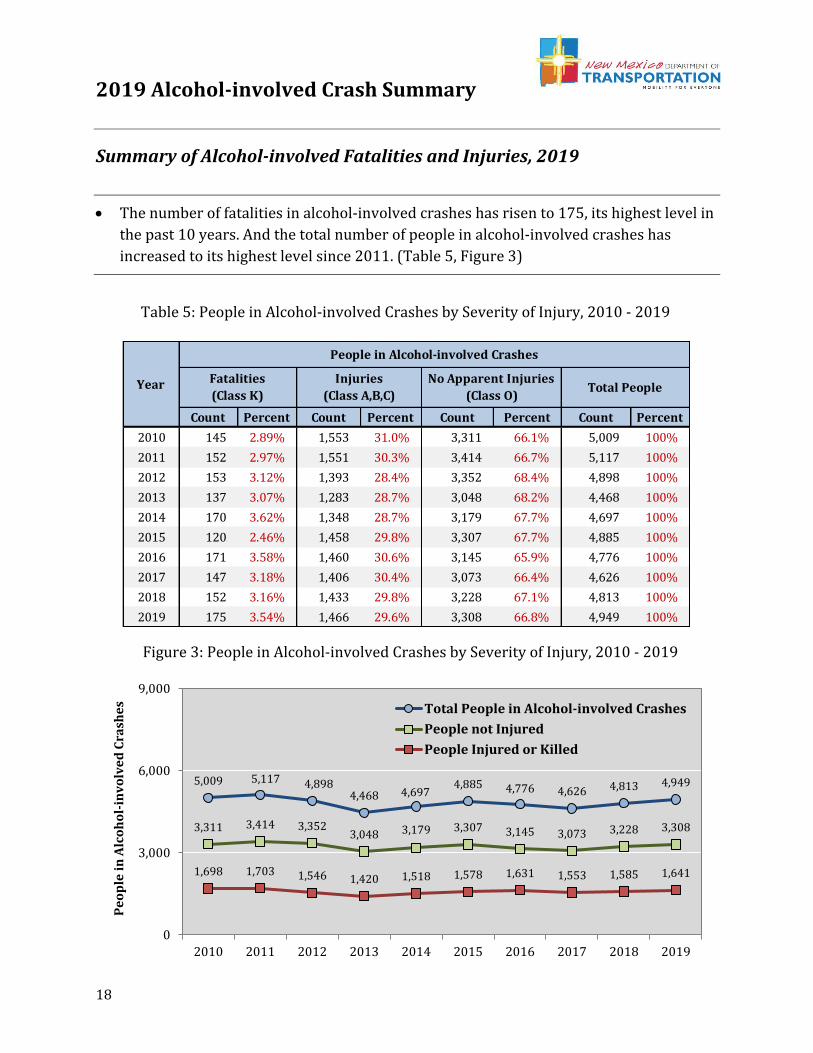
• The number of fatalities in alcohol-involved crashes has risen to 175, its highest level in
the past 10 years. And the total number of people in alcohol-involved crashes has
increased to its highest level since 2011. (Table 5, Figure 3)
Count Percent Count Percent Count Percent Count Percent
2010 145 2.89% 1,553 31.0% 3,311 66.1% 5,009 100%
2011 152 2.97% 1,551 30.3% 3,414 66.7% 5,117 100%
2012 153 3.12% 1,393 28.4% 3,352 68.4% 4,898 100%
2013 137 3.07% 1,283 28.7% 3,048 68.2% 4,468 100%
2014 170 3.62% 1,348 28.7% 3,179 67.7% 4,697 100%
2015 120 2.46% 1,458 29.8% 3,307 67.7% 4,885 100%
2016 171 3.58% 1,460 30.6% 3,145 65.9% 4,776 100%
2017 147 3.18% 1,406 30.4% 3,073 66.4% 4,626 100%
2018 152 3.16% 1,433 29.8% 3,228 67.1% 4,813 100%
2019 175 3.54% 1,466 29.6% 3,308 66.8% 4,949 100%
Year Fatalities
(Class K)
Injuries
(Class A,B,C)
No Apparent Injuries
(Class O)Total People
People in Alcohol-involved Crashes
5,009 5,117 4,8984,468 4,697
4,885 4,776 4,626 4,813 4,949
3,311 3,414 3,3523,048 3,179 3,307 3,145 3,073 3,228 3,308
1,698 1,703 1,546 1,420 1,518 1,578 1,631 1,553 1,585 1,641
0
3,000
6,000
9,000
2010 2011 2012 2013 2014 2015 2016 2017 2018 2019
Pe
op
le i
n A
lco
ho
l-in
vo
lve
d C
rash
es Total People in Alcohol-involved Crashes
People not Injured
People Injured or Killed
Table 5: People in Alcohol-involved Crashes by Severity of Injury, 2010 - 2019
Figure 3: People in Alcohol-involved Crashes by Severity of Injury, 2010 - 2019
2019 Alcohol-involved Crash Summary
19
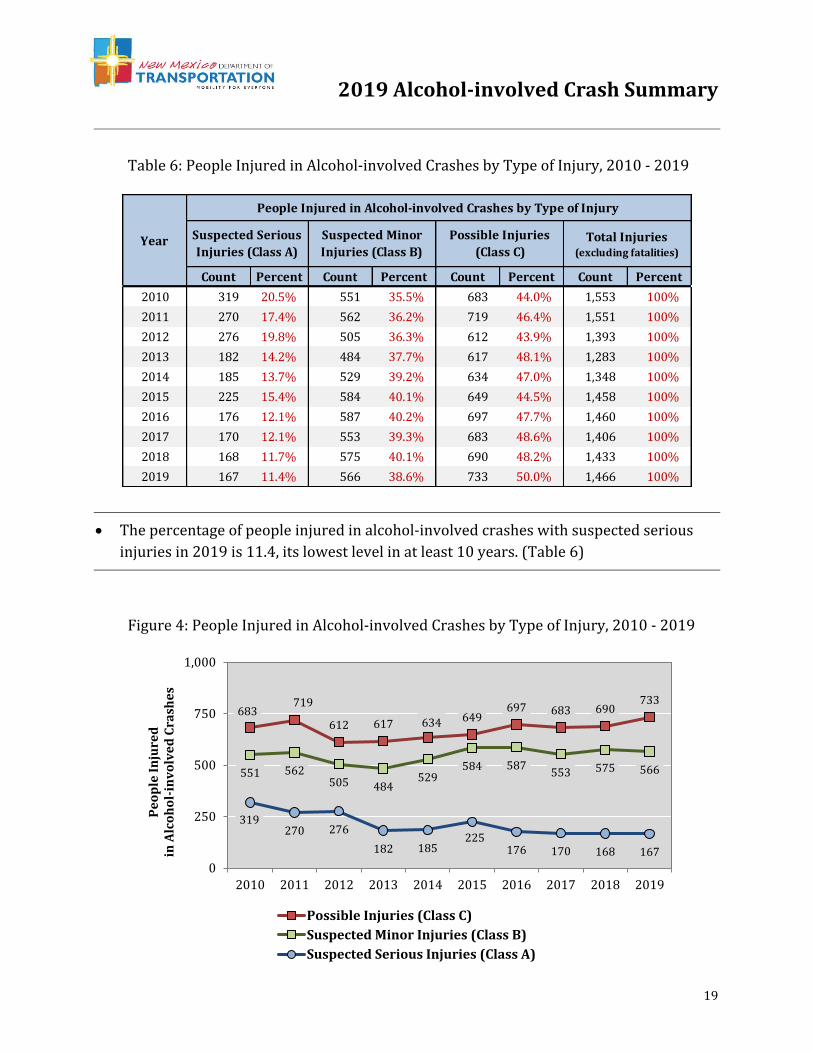
• The percentage of people injured in alcohol-involved crashes with suspected serious
injuries in 2019 is 11.4, its lowest level in at least 10 years. (Table 6)
Count Percent Count Percent Count Percent Count Percent
2010 319 20.5% 551 35.5% 683 44.0% 1,553 100%
2011 270 17.4% 562 36.2% 719 46.4% 1,551 100%
2012 276 19.8% 505 36.3% 612 43.9% 1,393 100%
2013 182 14.2% 484 37.7% 617 48.1% 1,283 100%
2014 185 13.7% 529 39.2% 634 47.0% 1,348 100%
2015 225 15.4% 584 40.1% 649 44.5% 1,458 100%
2016 176 12.1% 587 40.2% 697 47.7% 1,460 100%
2017 170 12.1% 553 39.3% 683 48.6% 1,406 100%
2018 168 11.7% 575 40.1% 690 48.2% 1,433 100%
2019 167 11.4% 566 38.6% 733 50.0% 1,466 100%
People Injured in Alcohol-involved Crashes by Type of Injury
Year Suspected Serious
Injuries (Class A)
Suspected Minor
Injuries (Class B)
Possible Injuries
(Class C)Total Injuries
(excluding fatalities)
683719
612 617 634 649697 683 690
733
551 562505 484
529584 587
553 575 566
319270 276
182 185225
176 170 168 167
0
250
500
750
1,000
2010 2011 2012 2013 2014 2015 2016 2017 2018 2019
Pe
op
le I
nju
red
in
Alc
oh
ol-
inv
olv
ed
Cra
she
s
Possible Injuries (Class C)
Suspected Minor Injuries (Class B)
Suspected Serious Injuries (Class A)
Table 6: People Injured in Alcohol-involved Crashes by Type of Injury, 2010 - 2019
Figure 4: People Injured in Alcohol-involved Crashes by Type of Injury, 2010 - 2019
Crash Geography – Maps
20
Maps
All maps are available in high-resolution color at tru.unm.edu.
Alcohol-involved Crash Geography
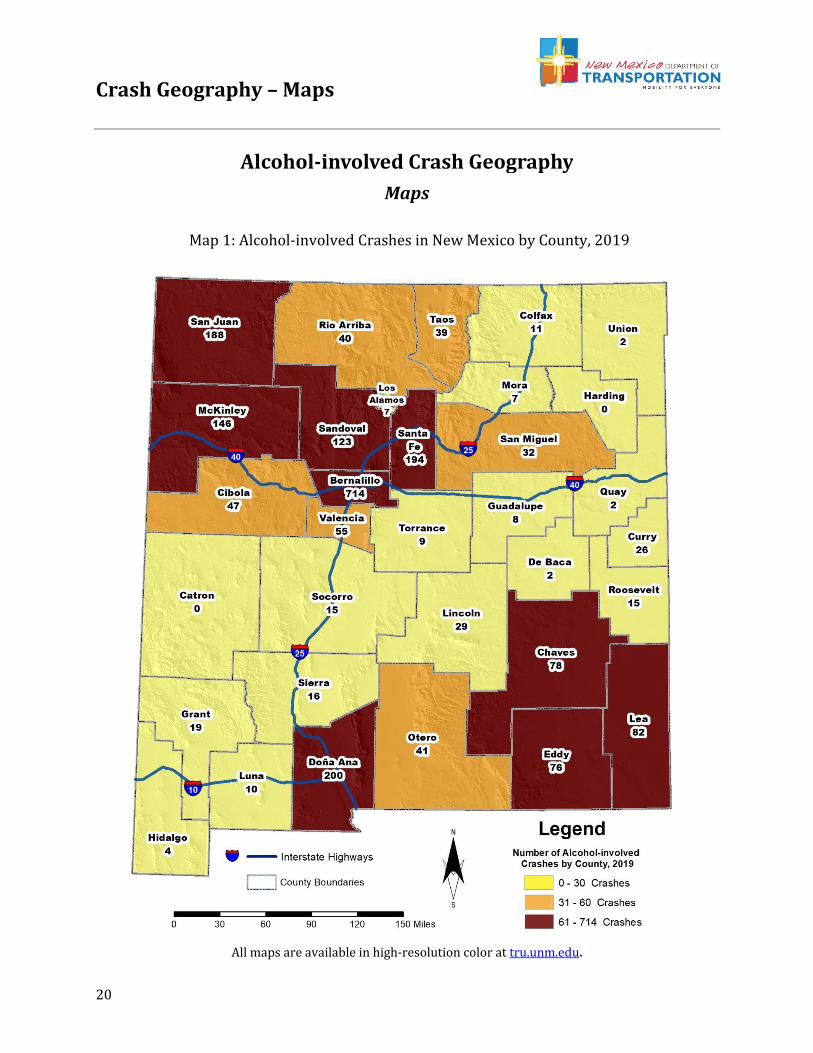
Map 1: Alcohol-involved Crashes in New Mexico by County, 2019
Crash Geography – Maps
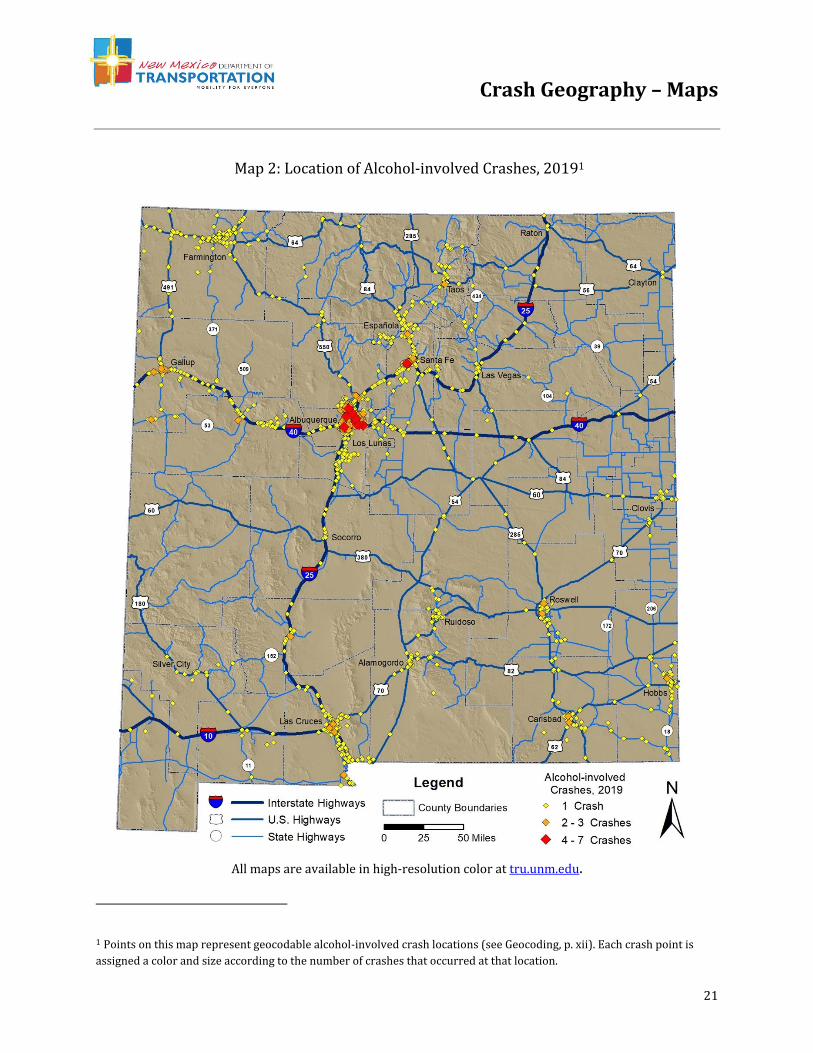
21
All maps are available in high-resolution color at tru.unm.edu.
1 Points on this map represent geocodable alcohol-involved crash locations (see Geocoding, p. xii). Each crash point is
assigned a color and size according to the number of crashes that occurred at that location.
Map 2: Location of Alcohol-involved Crashes, 20191
Crash Geography – Maps
22
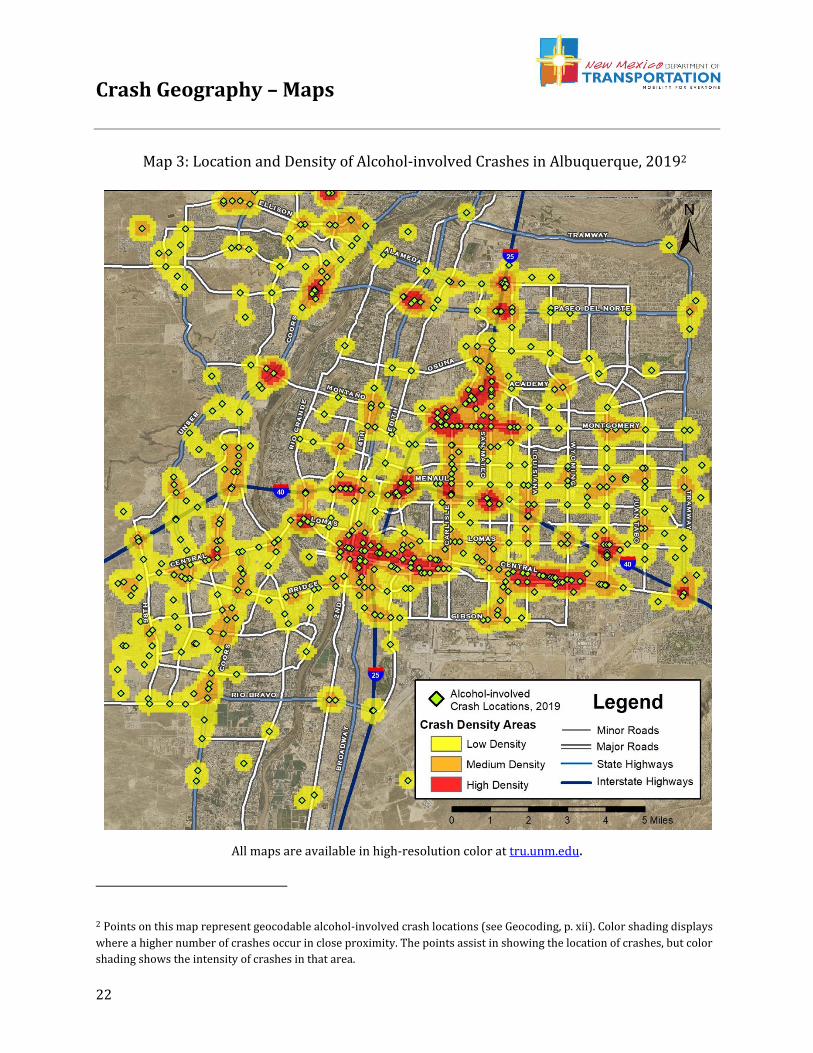
All maps are available in high-resolution color at tru.unm.edu.
2 Points on this map represent geocodable alcohol-involved crash locations (see Geocoding, p. xii). Color shading displays
where a higher number of crashes occur in close proximity. The points assist in showing the location of crashes, but color
shading shows the intensity of crashes in that area.
Map 3: Location and Density of Alcohol-involved Crashes in Albuquerque, 20192
Crash Geography – Maps
23
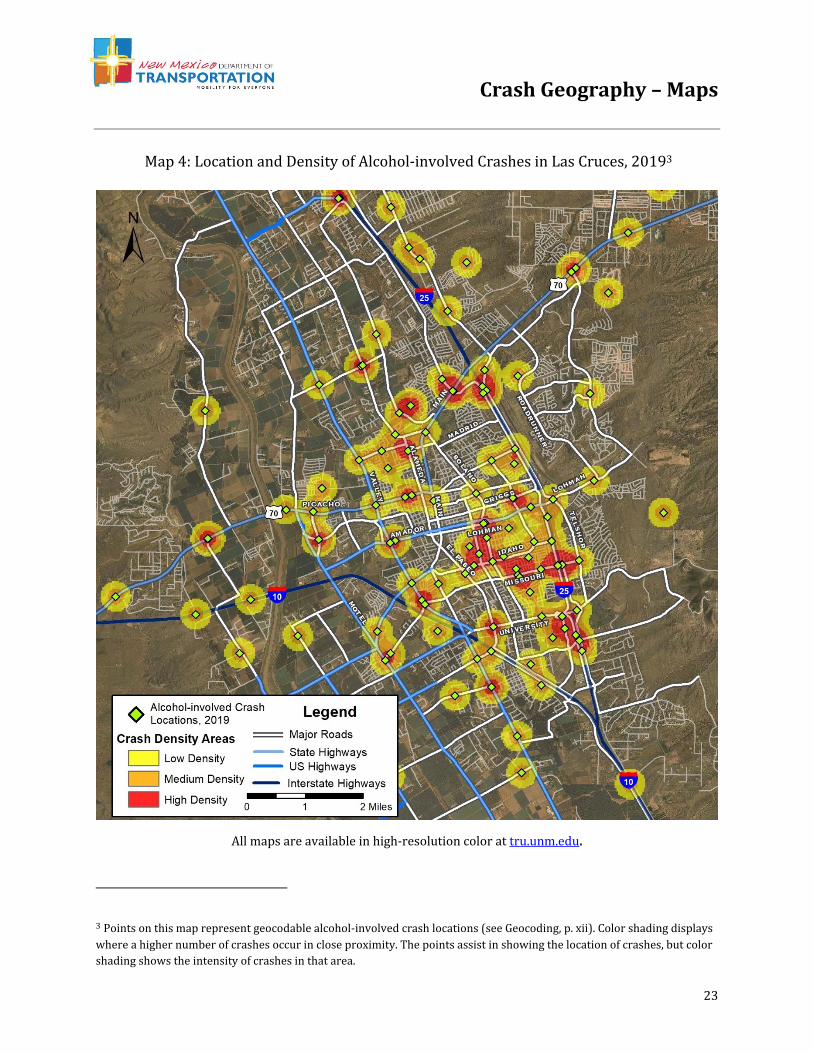
All maps are available in high-resolution color at tru.unm.edu.
3 Points on this map represent geocodable alcohol-involved crash locations (see Geocoding, p. xii). Color shading displays
where a higher number of crashes occur in close proximity. The points assist in showing the location of crashes, but color
shading shows the intensity of crashes in that area.
Map 4: Location and Density of Alcohol-involved Crashes in Las Cruces, 20193
Crash Geography – Maps
24
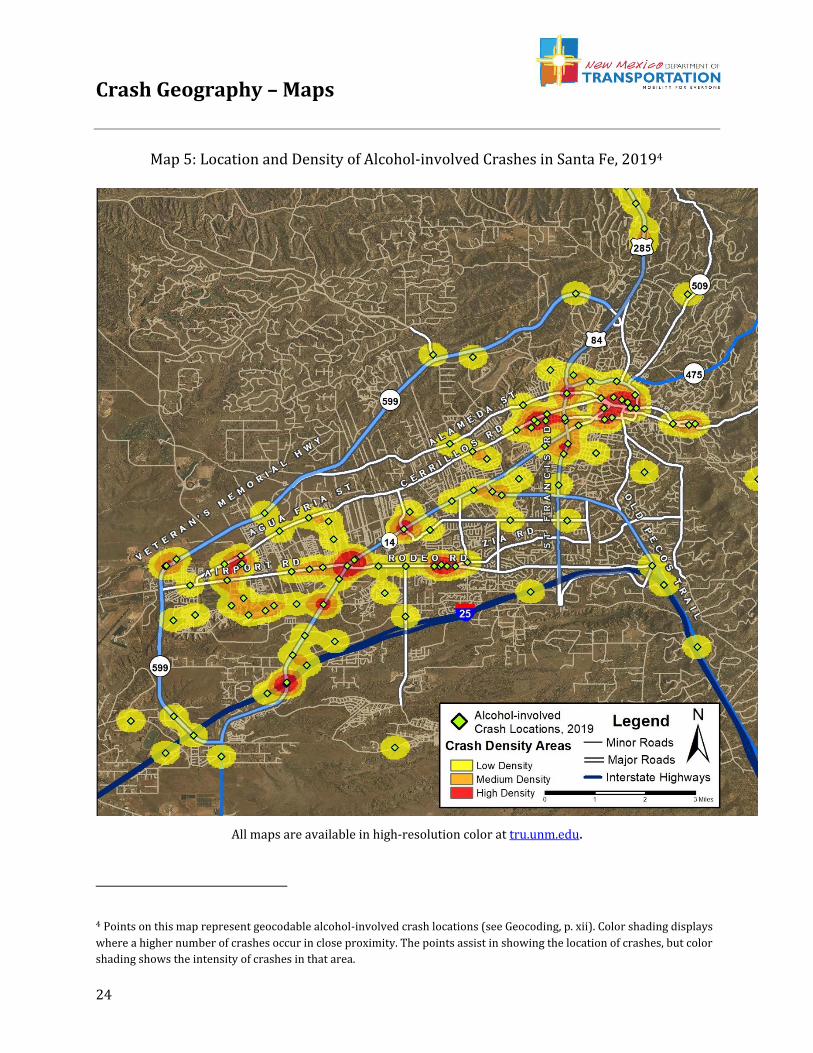
All maps are available in high-resolution color at tru.unm.edu.
4 Points on this map represent geocodable alcohol-involved crash locations (see Geocoding, p. xii). Color shading displays
where a higher number of crashes occur in close proximity. The points assist in showing the location of crashes, but color
shading shows the intensity of crashes in that area.
Map 5: Location and Density of Alcohol-involved Crashes in Santa Fe, 20194
Crash Geography – Maps
25
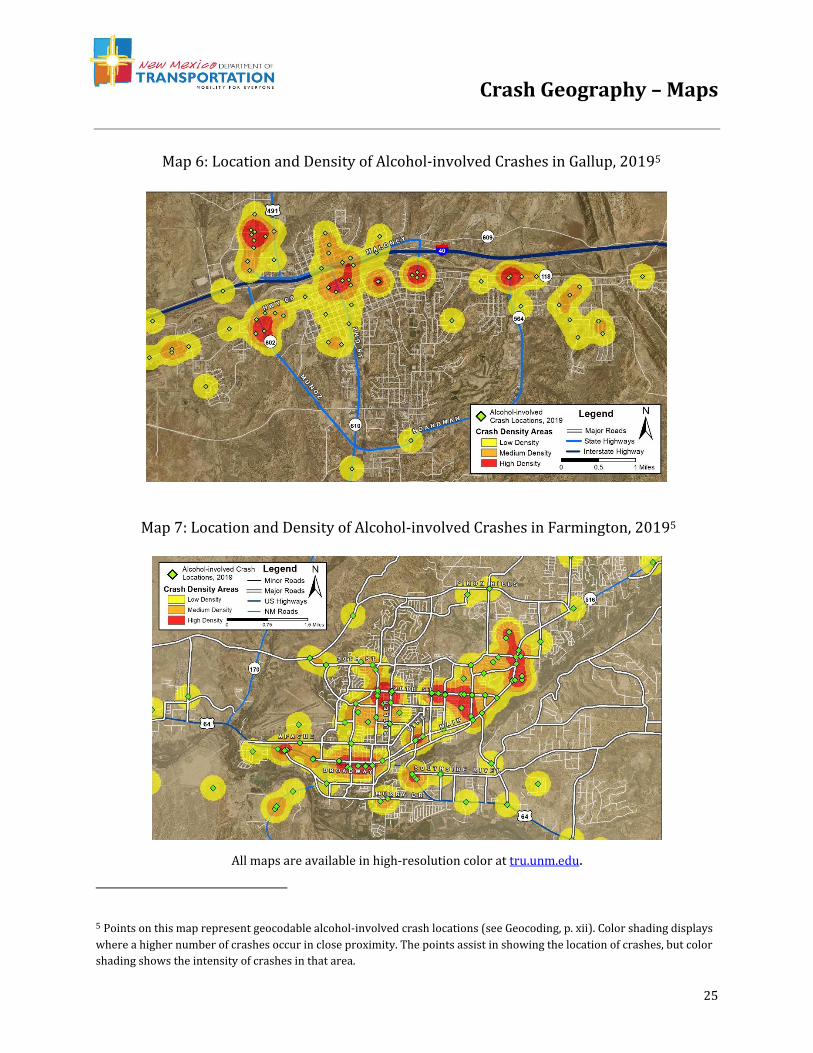
All maps are available in high-resolution color at tru.unm.edu.
5 Points on this map represent geocodable alcohol-involved crash locations (see Geocoding, p. xii). Color shading displays
where a higher number of crashes occur in close proximity. The points assist in showing the location of crashes, but color
shading shows the intensity of crashes in that area.
Map 6: Location and Density of Alcohol-involved Crashes in Gallup, 20195
Map 7: Location and Density of Alcohol-involved Crashes in Farmington, 20195
Crash Geography – Counties
26
Counties
Alcohol-involved Crashes
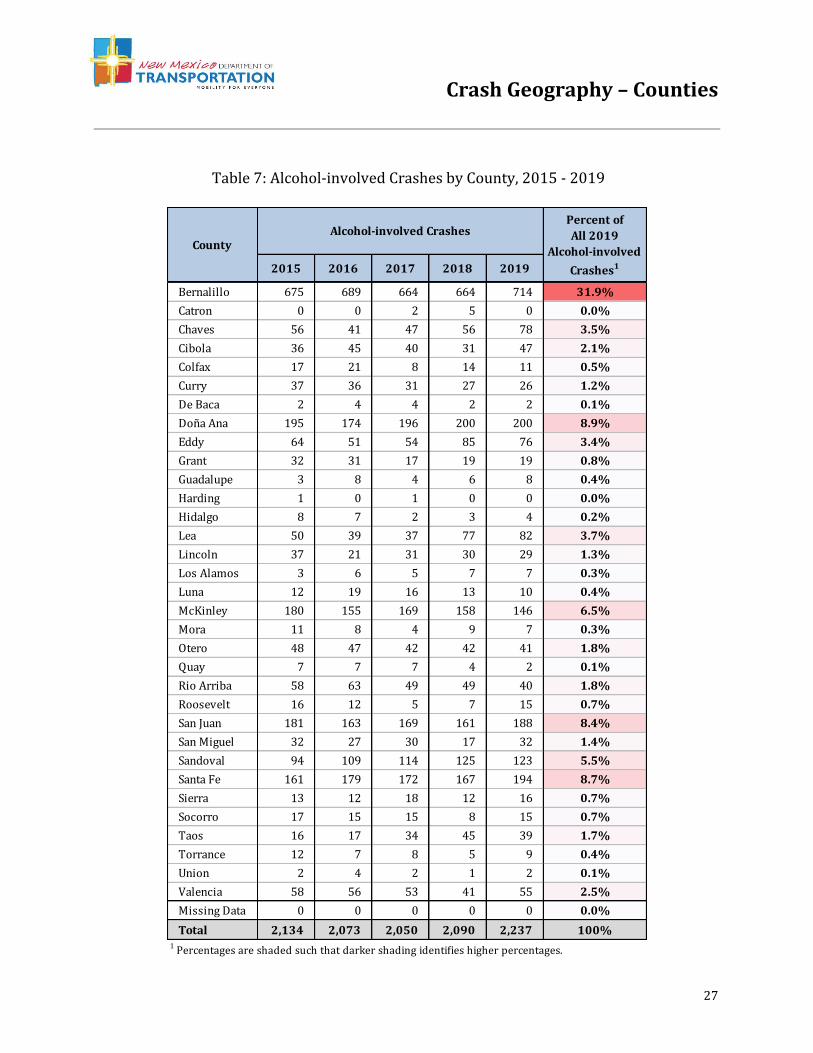
• The number of alcohol-involved crashes declined in McKinley County to 146, the
lowest level in at least five years. (Table 7)
• The number of alcohol-involved crashes has declined in each of the past four years
in Curry County, for a drop of 30 percent. (Table 7)
• The number of alcohol-involved crashes has declined in three of the past four years
in Otero County, for a decrease of 15 percent. (Table 7)
• The number of alcohol-involved crashes has risen in three of the past four years in
Sandoval County. (Table 7)
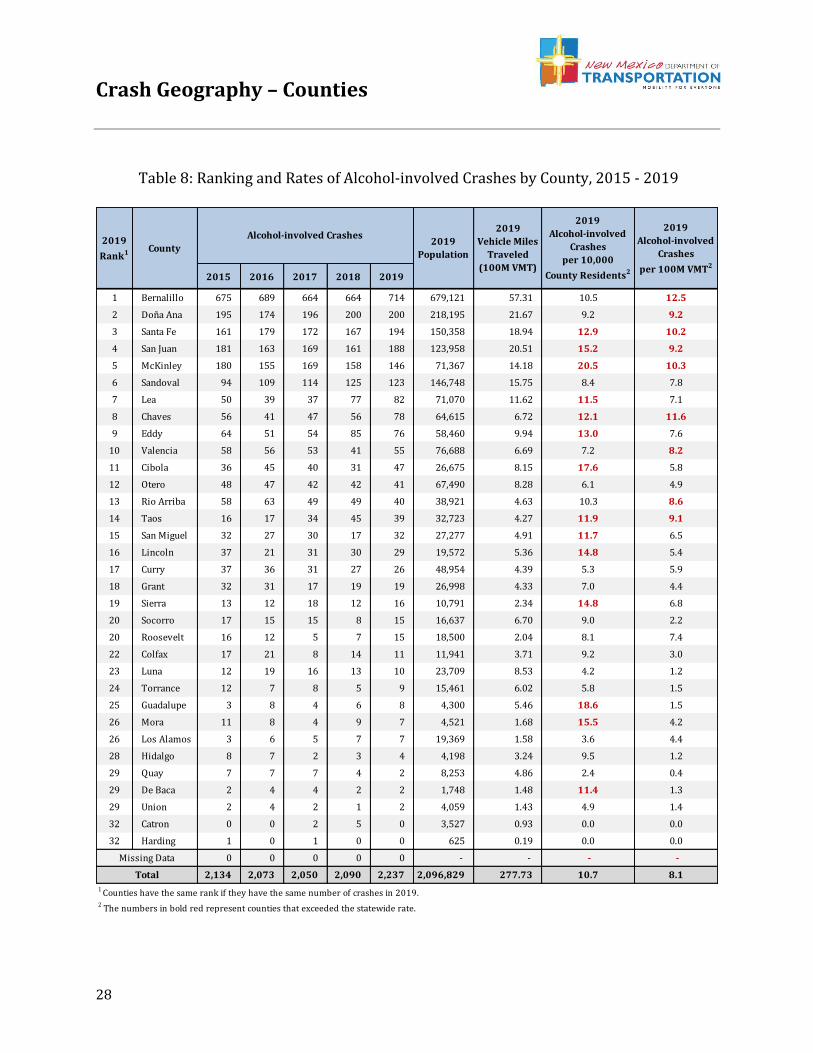
• Of the 10 counties with the highest number of alcohol-involved crashes in 2019, the
highest alcohol-involved crash rates per 100 million vehicle miles traveled occurred
in Bernalillo (12.5) and Chaves (11.6). The highest rates per 10,000 residents
occurred in McKinley (20.5) and San Juan (15.2). (Table 8).
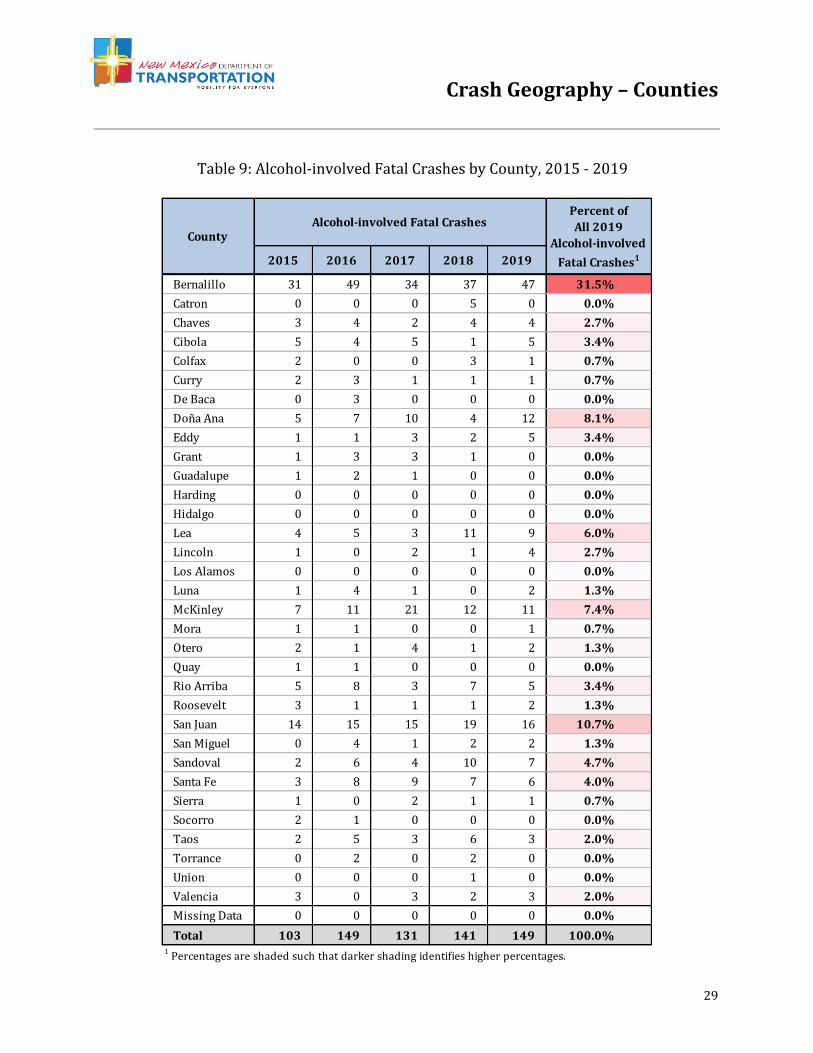
Alcohol-involved Fatal Crashes
• San Juan County accounted for 10.7 percent of all alcohol-involved fatal crashes,
although it has only 5.9 percent of the population. Similarly, McKinley County
accounted for 7.4 percent of all alcohol-involved fatal crashes, although it has only
3.4 percent of the population. Lea County had 6.0 percent of alcohol-involved fatal
crashes, although it also has only 3.4 percent of the population. (Table 9, Table 10)
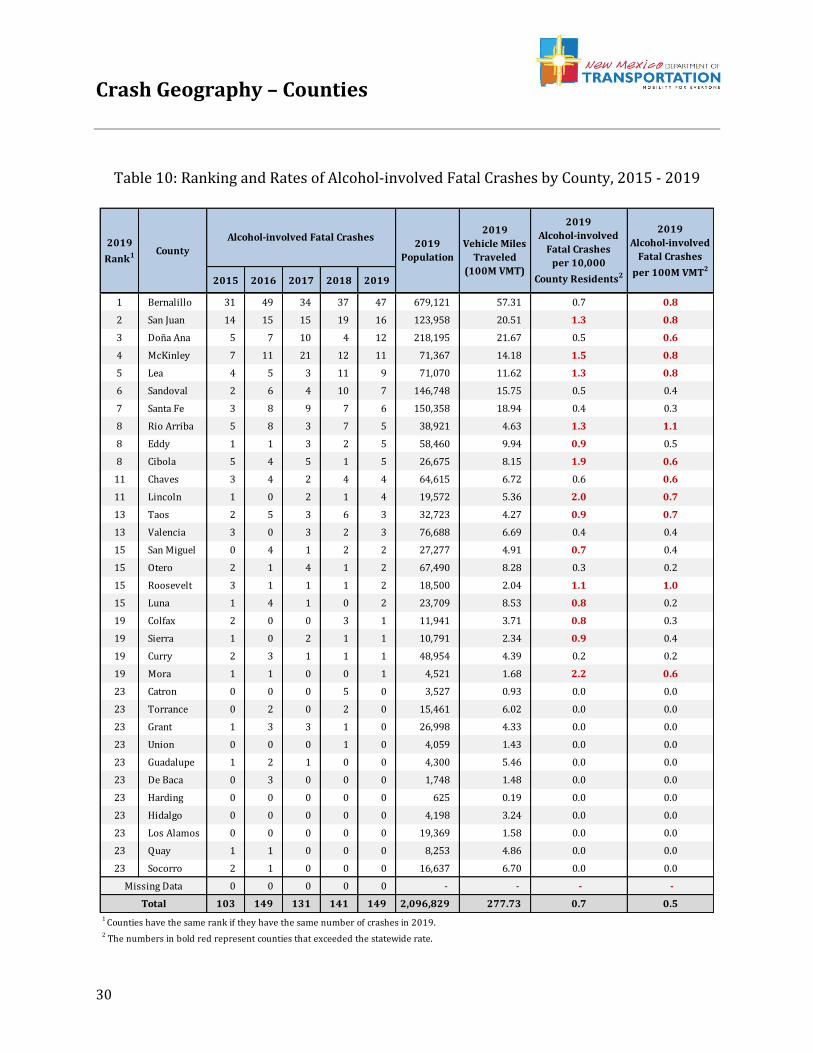
• Of the 10 counties with the highest number of alcohol-involved fatal crashes in
2019, the highest alcohol-involved fatal crash rates per 10,000 residents occurred in
Cibola (1.9), McKinley (1.5), Lea (1.3), Rio Arriba (1.3), and San Juan (1.3). The
highest rate per 100 million vehicle miles traveled occurred in Rio Arriba (1.1).
(Table 10)
Crash Geography – Counties
27
2015 2016 2017 2018 2019
Bernalillo 675 689 664 664 714 31.9%
Catron 0 0 2 5 0 0.0%
Chaves 56 41 47 56 78 3.5%
Cibola 36 45 40 31 47 2.1%
Colfax 17 21 8 14 11 0.5%
Curry 37 36 31 27 26 1.2%
De Baca 2 4 4 2 2 0.1%
Doña Ana 195 174 196 200 200 8.9%
Eddy 64 51 54 85 76 3.4%
Grant 32 31 17 19 19 0.8%
Guadalupe 3 8 4 6 8 0.4%
Harding 1 0 1 0 0 0.0%
Hidalgo 8 7 2 3 4 0.2%
Lea 50 39 37 77 82 3.7%
Lincoln 37 21 31 30 29 1.3%
Los Alamos 3 6 5 7 7 0.3%
Luna 12 19 16 13 10 0.4%
McKinley 180 155 169 158 146 6.5%
Mora 11 8 4 9 7 0.3%
Otero 48 47 42 42 41 1.8%
Quay 7 7 7 4 2 0.1%
Rio Arriba 58 63 49 49 40 1.8%
Roosevelt 16 12 5 7 15 0.7%
San Juan 181 163 169 161 188 8.4%
San Miguel 32 27 30 17 32 1.4%
Sandoval 94 109 114 125 123 5.5%
Santa Fe 161 179 172 167 194 8.7%
Sierra 13 12 18 12 16 0.7%
Socorro 17 15 15 8 15 0.7%
Taos 16 17 34 45 39 1.7%
Torrance 12 7 8 5 9 0.4%
Union 2 4 2 1 2 0.1%
Valencia 58 56 53 41 55 2.5%
Missing Data 0 0 0 0 0 0.0%
Total 2,134 2,073 2,050 2,090 2,237 100%
Alcohol-involved CrashesCounty
Percent of
All 2019
Alcohol-involved
Crashes1
1 Percentages are shaded such that darker shading identifies higher percentages.
Table 7: Alcohol-involved Crashes by County, 2015 - 2019
Crash Geography – Counties
28
2015 2016 2017 2018 2019
1 Bernalillo 675 689 664 664 714 679,121 57.31 10.5 12.5
2 Doña Ana 195 174 196 200 200 218,195 21.67 9.2 9.2
3 Santa Fe 161 179 172 167 194 150,358 18.94 12.9 10.2
4 San Juan 181 163 169 161 188 123,958 20.51 15.2 9.2
5 McKinley 180 155 169 158 146 71,367 14.18 20.5 10.3
6 Sandoval 94 109 114 125 123 146,748 15.75 8.4 7.8
7 Lea 50 39 37 77 82 71,070 11.62 11.5 7.1
8 Chaves 56 41 47 56 78 64,615 6.72 12.1 11.6
9 Eddy 64 51 54 85 76 58,460 9.94 13.0 7.6
10 Valencia 58 56 53 41 55 76,688 6.69 7.2 8.2
11 Cibola 36 45 40 31 47 26,675 8.15 17.6 5.8
12 Otero 48 47 42 42 41 67,490 8.28 6.1 4.9
13 Rio Arriba 58 63 49 49 40 38,921 4.63 10.3 8.6
14 Taos 16 17 34 45 39 32,723 4.27 11.9 9.1
15 San Miguel 32 27 30 17 32 27,277 4.91 11.7 6.5
16 Lincoln 37 21 31 30 29 19,572 5.36 14.8 5.4
17 Curry 37 36 31 27 26 48,954 4.39 5.3 5.9
18 Grant 32 31 17 19 19 26,998 4.33 7.0 4.4
19 Sierra 13 12 18 12 16 10,791 2.34 14.8 6.8
20 Socorro 17 15 15 8 15 16,637 6.70 9.0 2.2
20 Roosevelt 16 12 5 7 15 18,500 2.04 8.1 7.4
22 Colfax 17 21 8 14 11 11,941 3.71 9.2 3.0
23 Luna 12 19 16 13 10 23,709 8.53 4.2 1.2
24 Torrance 12 7 8 5 9 15,461 6.02 5.8 1.5
25 Guadalupe 3 8 4 6 8 4,300 5.46 18.6 1.5
26 Mora 11 8 4 9 7 4,521 1.68 15.5 4.2
26 Los Alamos 3 6 5 7 7 19,369 1.58 3.6 4.4
28 Hidalgo 8 7 2 3 4 4,198 3.24 9.5 1.2
29 Quay 7 7 7 4 2 8,253 4.86 2.4 0.4
29 De Baca 2 4 4 2 2 1,748 1.48 11.4 1.3
29 Union 2 4 2 1 2 4,059 1.43 4.9 1.4
32 Catron 0 0 2 5 0 3,527 0.93 0.0 0.0
32 Harding 1 0 1 0 0 625 0.19 0.0 0.0
0 0 0 0 0 - - - -
2,134 2,073 2,050 2,090 2,237 2,096,829 277.73 10.7 8.1
2 The numbers in bold red represent counties that exceeded the statewide rate.
Missing Data
Total
1 Counties have the same rank if they have the same number of crashes in 2019.
County
Alcohol-involved Crashes2019
Rank1
2019
Vehicle Miles
Traveled
(100M VMT)
2019
Alcohol-involved
Crashes
per 100M VMT2
2019
Alcohol-involved
Crashes
per 10,000
County Residents2
2019
Population
Table 8: Ranking and Rates of Alcohol-involved Crashes by County, 2015 - 2019
Crash Geography – Counties
29
2015 2016 2017 2018 2019
Bernalillo 31 49 34 37 47 31.5%
Catron 0 0 0 5 0 0.0%
Chaves 3 4 2 4 4 2.7%
Cibola 5 4 5 1 5 3.4%
Colfax 2 0 0 3 1 0.7%
Curry 2 3 1 1 1 0.7%
De Baca 0 3 0 0 0 0.0%
Doña Ana 5 7 10 4 12 8.1%
Eddy 1 1 3 2 5 3.4%
Grant 1 3 3 1 0 0.0%
Guadalupe 1 2 1 0 0 0.0%
Harding 0 0 0 0 0 0.0%
Hidalgo 0 0 0 0 0 0.0%
Lea 4 5 3 11 9 6.0%
Lincoln 1 0 2 1 4 2.7%
Los Alamos 0 0 0 0 0 0.0%
Luna 1 4 1 0 2 1.3%
McKinley 7 11 21 12 11 7.4%
Mora 1 1 0 0 1 0.7%
Otero 2 1 4 1 2 1.3%
Quay 1 1 0 0 0 0.0%
Rio Arriba 5 8 3 7 5 3.4%
Roosevelt 3 1 1 1 2 1.3%
San Juan 14 15 15 19 16 10.7%
San Miguel 0 4 1 2 2 1.3%
Sandoval 2 6 4 10 7 4.7%
Santa Fe 3 8 9 7 6 4.0%
Sierra 1 0 2 1 1 0.7%
Socorro 2 1 0 0 0 0.0%
Taos 2 5 3 6 3 2.0%
Torrance 0 2 0 2 0 0.0%
Union 0 0 0 1 0 0.0%
Valencia 3 0 3 2 3 2.0%
Missing Data 0 0 0 0 0 0.0%
Total 103 149 131 141 149 100.0%
CountyAlcohol-involved Fatal Crashes
Percent of
All 2019
Alcohol-involved
Fatal Crashes1
1 Percentages are shaded such that darker shading identifies higher percentages.
Table 9: Alcohol-involved Fatal Crashes by County, 2015 - 2019
Crash Geography – Counties
30
2015 2016 2017 2018 2019
1 Bernalillo 31 49 34 37 47 679,121 57.31 0.7 0.8
2 San Juan 14 15 15 19 16 123,958 20.51 1.3 0.8
3 Doña Ana 5 7 10 4 12 218,195 21.67 0.5 0.6
4 McKinley 7 11 21 12 11 71,367 14.18 1.5 0.8
5 Lea 4 5 3 11 9 71,070 11.62 1.3 0.8
6 Sandoval 2 6 4 10 7 146,748 15.75 0.5 0.4
7 Santa Fe 3 8 9 7 6 150,358 18.94 0.4 0.3
8 Rio Arriba 5 8 3 7 5 38,921 4.63 1.3 1.1
8 Eddy 1 1 3 2 5 58,460 9.94 0.9 0.5
8 Cibola 5 4 5 1 5 26,675 8.15 1.9 0.6
11 Chaves 3 4 2 4 4 64,615 6.72 0.6 0.6
11 Lincoln 1 0 2 1 4 19,572 5.36 2.0 0.7
13 Taos 2 5 3 6 3 32,723 4.27 0.9 0.7
13 Valencia 3 0 3 2 3 76,688 6.69 0.4 0.4
15 San Miguel 0 4 1 2 2 27,277 4.91 0.7 0.4
15 Otero 2 1 4 1 2 67,490 8.28 0.3 0.2
15 Roosevelt 3 1 1 1 2 18,500 2.04 1.1 1.0
15 Luna 1 4 1 0 2 23,709 8.53 0.8 0.2
19 Colfax 2 0 0 3 1 11,941 3.71 0.8 0.3
19 Sierra 1 0 2 1 1 10,791 2.34 0.9 0.4
19 Curry 2 3 1 1 1 48,954 4.39 0.2 0.2
19 Mora 1 1 0 0 1 4,521 1.68 2.2 0.6
23 Catron 0 0 0 5 0 3,527 0.93 0.0 0.0
23 Torrance 0 2 0 2 0 15,461 6.02 0.0 0.0
23 Grant 1 3 3 1 0 26,998 4.33 0.0 0.0
23 Union 0 0 0 1 0 4,059 1.43 0.0 0.0
23 Guadalupe 1 2 1 0 0 4,300 5.46 0.0 0.0
23 De Baca 0 3 0 0 0 1,748 1.48 0.0 0.0
23 Harding 0 0 0 0 0 625 0.19 0.0 0.0
23 Hidalgo 0 0 0 0 0 4,198 3.24 0.0 0.0
23 Los Alamos 0 0 0 0 0 19,369 1.58 0.0 0.0
23 Quay 1 1 0 0 0 8,253 4.86 0.0 0.0
23 Socorro 2 1 0 0 0 16,637 6.70 0.0 0.0
0 0 0 0 0 - - - -
103 149 131 141 149 2,096,829 277.73 0.7 0.5
Missing Data
2019
Vehicle Miles
Traveled
(100M VMT)
2019
Alcohol-involved
Fatal Crashes
per 100M VMT2
1 Counties have the same rank if they have the same number of crashes in 2019.
County
Alcohol-involved Fatal Crashes2019
Rank1
2019
Alcohol-involved
Fatal Crashes
per 10,000
County Residents2
Total
2019
Population
2 The numbers in bold red represent counties that exceeded the statewide rate.
Table 10: Ranking and Rates of Alcohol-involved Fatal Crashes by County, 2015 - 2019
Crash Geography – Cities
31
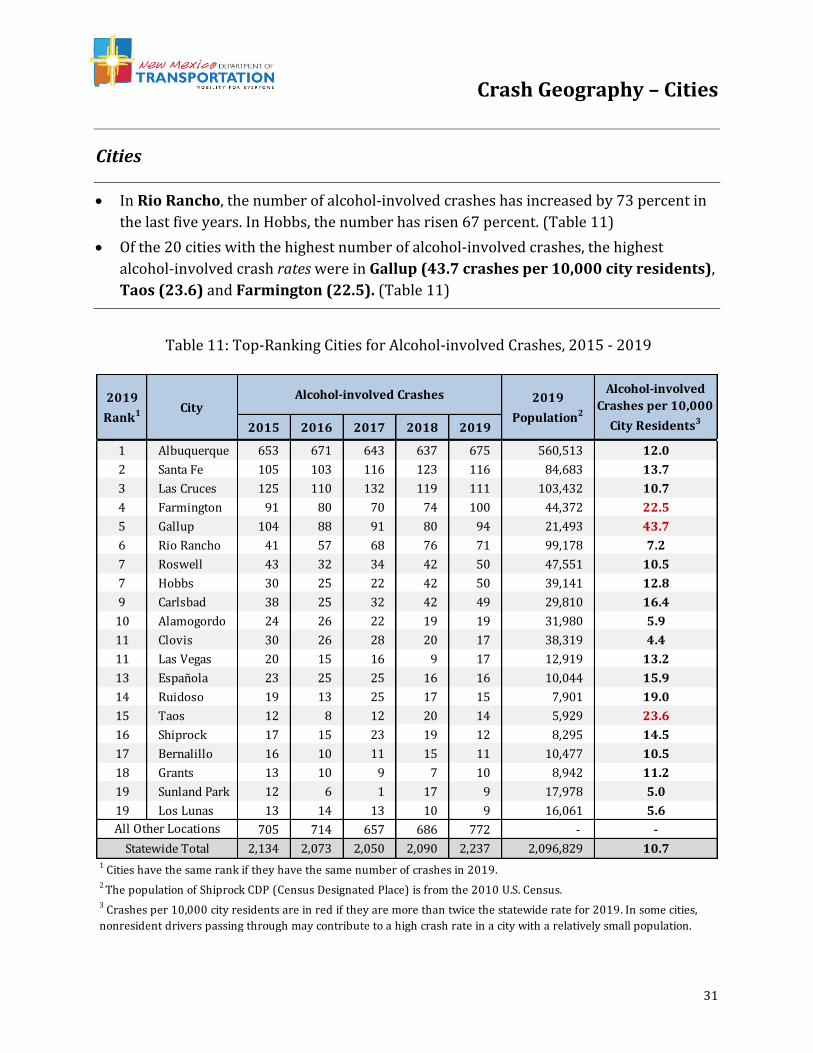
Cities
• In Rio Rancho, the number of alcohol-involved crashes has increased by 73 percent in
the last five years. In Hobbs, the number has risen 67 percent. (Table 11)
• Of the 20 cities with the highest number of alcohol-involved crashes, the highest
alcohol-involved crash rates were in Gallup (43.7 crashes per 10,000 city residents),
Taos (23.6) and Farmington (22.5). (Table 11)
2015 2016 2017 2018 2019
1 Albuquerque 653 671 643 637 675 560,513 12.0
2 Santa Fe 105 103 116 123 116 84,683 13.7
3 Las Cruces 125 110 132 119 111 103,432 10.7
4 Farmington 91 80 70 74 100 44,372 22.5
5 Gallup 104 88 91 80 94 21,493 43.7
6 Rio Rancho 41 57 68 76 71 99,178 7.2
7 Roswell 43 32 34 42 50 47,551 10.5
7 Hobbs 30 25 22 42 50 39,141 12.8
9 Carlsbad 38 25 32 42 49 29,810 16.4
10 Alamogordo 24 26 22 19 19 31,980 5.9
11 Clovis 30 26 28 20 17 38,319 4.4
11 Las Vegas 20 15 16 9 17 12,919 13.2
13 Española 23 25 25 16 16 10,044 15.9
14 Ruidoso 19 13 25 17 15 7,901 19.0
15 Taos 12 8 12 20 14 5,929 23.6
16 Shiprock 17 15 23 19 12 8,295 14.5
17 Bernalillo 16 10 11 15 11 10,477 10.5
18 Grants 13 10 9 7 10 8,942 11.2
19 Sunland Park 12 6 1 17 9 17,978 5.0
19 Los Lunas 13 14 13 10 9 16,061 5.6
705 714 657 686 772 - -
2,134 2,073 2,050 2,090 2,237 2,096,829 10.7
2019
Rank1 CityAlcohol-involved Crashes 2019
Population2
Alcohol-involved
Crashes per 10,000
City Residents3
2 The population of Shiprock CDP (Census Designated Place) is from the 2010 U.S. Census.
3 Crashes per 10,000 city residents are in red if they are more than twice the statewide rate for 2019. In some cities,
nonresident drivers passing through may contribute to a high crash rate in a city with a relatively small population.
All Other Locations
Statewide Total1 Cities have the same rank if they have the same number of crashes in 2019.
Table 11: Top-Ranking Cities for Alcohol-involved Crashes, 2015 - 2019
Crash Geography – Cities
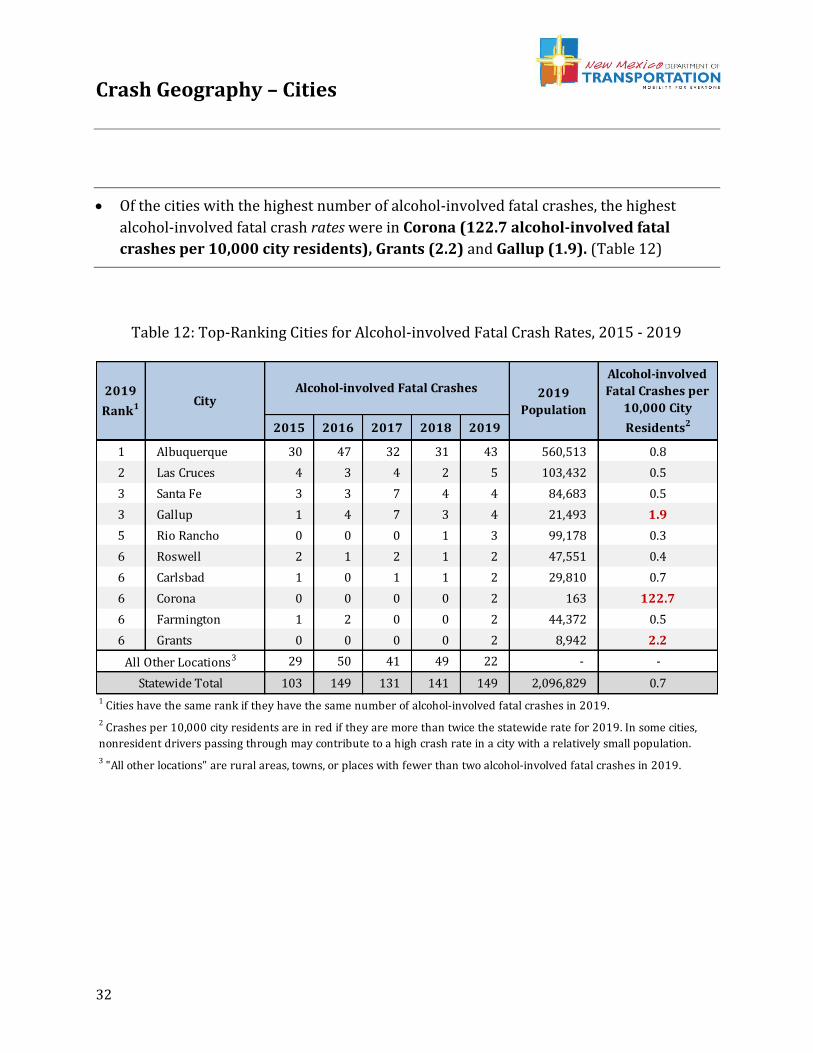
32
• Of the cities with the highest number of alcohol-involved fatal crashes, the highest
alcohol-involved fatal crash rates were in Corona (122.7 alcohol-involved fatal
crashes per 10,000 city residents), Grants (2.2) and Gallup (1.9). (Table 12)
2015 2016 2017 2018 2019
1 Albuquerque 30 47 32 31 43 560,513 0.8
2 Las Cruces 4 3 4 2 5 103,432 0.5
3 Santa Fe 3 3 7 4 4 84,683 0.5
3 Gallup 1 4 7 3 4 21,493 1.9
5 Rio Rancho 0 0 0 1 3 99,178 0.3
6 Roswell 2 1 2 1 2 47,551 0.4
6 Carlsbad 1 0 1 1 2 29,810 0.7
6 Corona 0 0 0 0 2 163 122.7
6 Farmington 1 2 0 0 2 44,372 0.5
6 Grants 0 0 0 0 2 8,942 2.2
29 50 41 49 22 - -
103 149 131 141 149 2,096,829 0.7
2019
Population
Alcohol-involved
Fatal Crashes per
10,000 City
Residents2
All Other Locations3
Statewide Total
2 Crashes per 10,000 city residents are in red if they are more than twice the statewide rate for 2019. In some cities,
nonresident drivers passing through may contribute to a high crash rate in a city with a relatively small population.
1 Cities have the same rank if they have the same number of alcohol-involved fatal crashes in 2019.
2019
Rank1 CityAlcohol-involved Fatal Crashes
3 "All other locations" are rural areas, towns, or places with fewer than two alcohol-involved fatal crashes in 2019.
Table 12: Top-Ranking Cities for Alcohol-involved Fatal Crash Rates, 2015 - 2019
Crash Geography – Rural and Urban
33
Rural and Urban Alcohol-involved Crashes
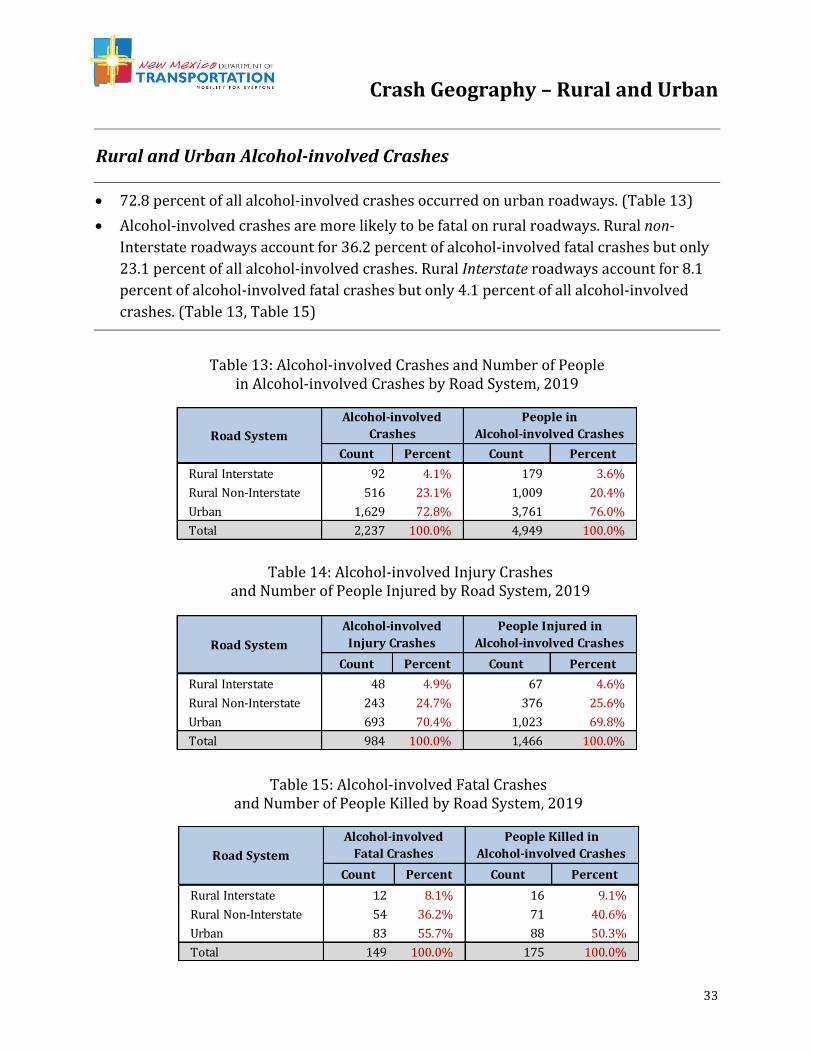
• 72.8 percent of all alcohol-involved crashes occurred on urban roadways. (Table 13)
• Alcohol-involved crashes are more likely to be fatal on rural roadways. Rural non-
Interstate roadways account for 36.2 percent of alcohol-involved fatal crashes but only
23.1 percent of all alcohol-involved crashes. Rural Interstate roadways account for 8.1
percent of alcohol-involved fatal crashes but only 4.1 percent of all alcohol-involved
crashes. (Table 13, Table 15)
Count Percent Count Percent
Rural Interstate 92 4.1% 179 3.6%
Rural Non-Interstate 516 23.1% 1,009 20.4%
Urban 1,629 72.8% 3,761 76.0%
Total 2,237 100.0% 4,949 100.0%
Road System
Alcohol-involved
Crashes
People in
Alcohol-involved Crashes
Count Percent Count Percent
Rural Interstate 48 4.9% 67 4.6%
Rural Non-Interstate 243 24.7% 376 25.6%
Urban 693 70.4% 1,023 69.8%
Total 984 100.0% 1,466 100.0%
Road System
Alcohol-involved
Injury Crashes
People Injured in
Alcohol-involved Crashes
Count Percent Count Percent
Rural Interstate 12 8.1% 16 9.1%
Rural Non-Interstate 54 36.2% 71 40.6%
Urban 83 55.7% 88 50.3%
Total 149 100.0% 175 100.0%
Road System
Alcohol-involved
Fatal Crashes
People Killed in
Alcohol-involved Crashes
Table 13: Alcohol-involved Crashes and Number of People in Alcohol-involved Crashes by Road System, 2019
Table 14: Alcohol-involved Injury Crashes and Number of People Injured by Road System, 2019
Table 15: Alcohol-involved Fatal Crashes and Number of People Killed by Road System, 2019
Crash Geography – Rural and Urban
34
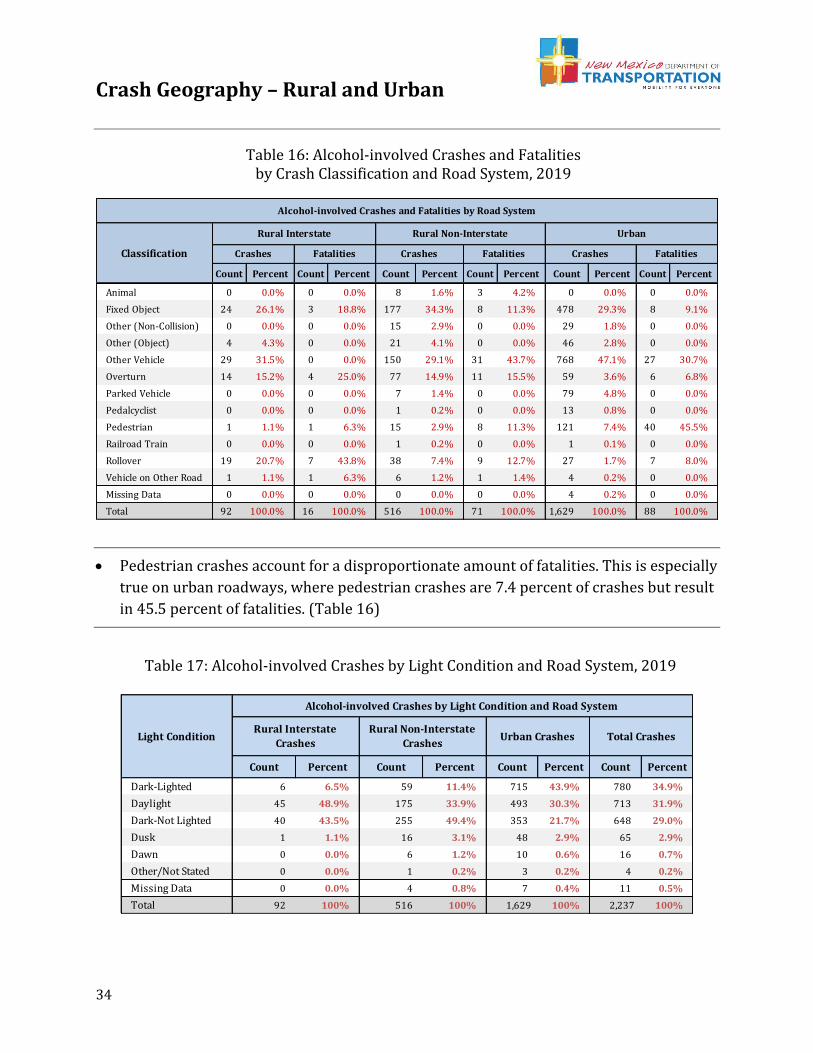
• Pedestrian crashes account for a disproportionate amount of fatalities. This is especially
true on urban roadways, where pedestrian crashes are 7.4 percent of crashes but result
in 45.5 percent of fatalities. (Table 16)
Count Percent Count Percent Count Percent Count Percent Count Percent Count Percent
Animal 0 0.0% 0 0.0% 8 1.6% 3 4.2% 0 0.0% 0 0.0%
Fixed Object 24 26.1% 3 18.8% 177 34.3% 8 11.3% 478 29.3% 8 9.1%
Other (Non-Collision) 0 0.0% 0 0.0% 15 2.9% 0 0.0% 29 1.8% 0 0.0%
Other (Object) 4 4.3% 0 0.0% 21 4.1% 0 0.0% 46 2.8% 0 0.0%
Other Vehicle 29 31.5% 0 0.0% 150 29.1% 31 43.7% 768 47.1% 27 30.7%
Overturn 14 15.2% 4 25.0% 77 14.9% 11 15.5% 59 3.6% 6 6.8%
Parked Vehicle 0 0.0% 0 0.0% 7 1.4% 0 0.0% 79 4.8% 0 0.0%
Pedalcyclist 0 0.0% 0 0.0% 1 0.2% 0 0.0% 13 0.8% 0 0.0%
Pedestrian 1 1.1% 1 6.3% 15 2.9% 8 11.3% 121 7.4% 40 45.5%
Railroad Train 0 0.0% 0 0.0% 1 0.2% 0 0.0% 1 0.1% 0 0.0%
Rollover 19 20.7% 7 43.8% 38 7.4% 9 12.7% 27 1.7% 7 8.0%
Vehicle on Other Road 1 1.1% 1 6.3% 6 1.2% 1 1.4% 4 0.2% 0 0.0%
Missing Data 0 0.0% 0 0.0% 0 0.0% 0 0.0% 4 0.2% 0 0.0%
Total 92 100.0% 16 100.0% 516 100.0% 71 100.0% 1,629 100.0% 88 100.0%
Alcohol-involved Crashes and Fatalities by Road System
Classification
Rural Interstate Rural Non-Interstate Urban
Crashes Fatalities Crashes Fatalities Crashes Fatalities
Count Percent Count Percent Count Percent Count Percent
Dark-Lighted 6 6.5% 59 11.4% 715 43.9% 780 34.9%
Daylight 45 48.9% 175 33.9% 493 30.3% 713 31.9%
Dark-Not Lighted 40 43.5% 255 49.4% 353 21.7% 648 29.0%
Dusk 1 1.1% 16 3.1% 48 2.9% 65 2.9%
Dawn 0 0.0% 6 1.2% 10 0.6% 16 0.7%
Other/Not Stated 0 0.0% 1 0.2% 3 0.2% 4 0.2%
Missing Data 0 0.0% 4 0.8% 7 0.4% 11 0.5%
Total 92 100% 516 100% 1,629 100% 2,237 100%
Rural Interstate
Crashes
Rural Non-Interstate
CrashesUrban Crashes Total CrashesLight Condition
Alcohol-involved Crashes by Light Condition and Road System
Table 16: Alcohol-involved Crashes and Fatalities by Crash Classification and Road System, 2019
Table 17: Alcohol-involved Crashes by Light Condition and Road System, 2019
Crash Characteristics – Month, Day, Hour
35
Month, Day of Week, and Hour
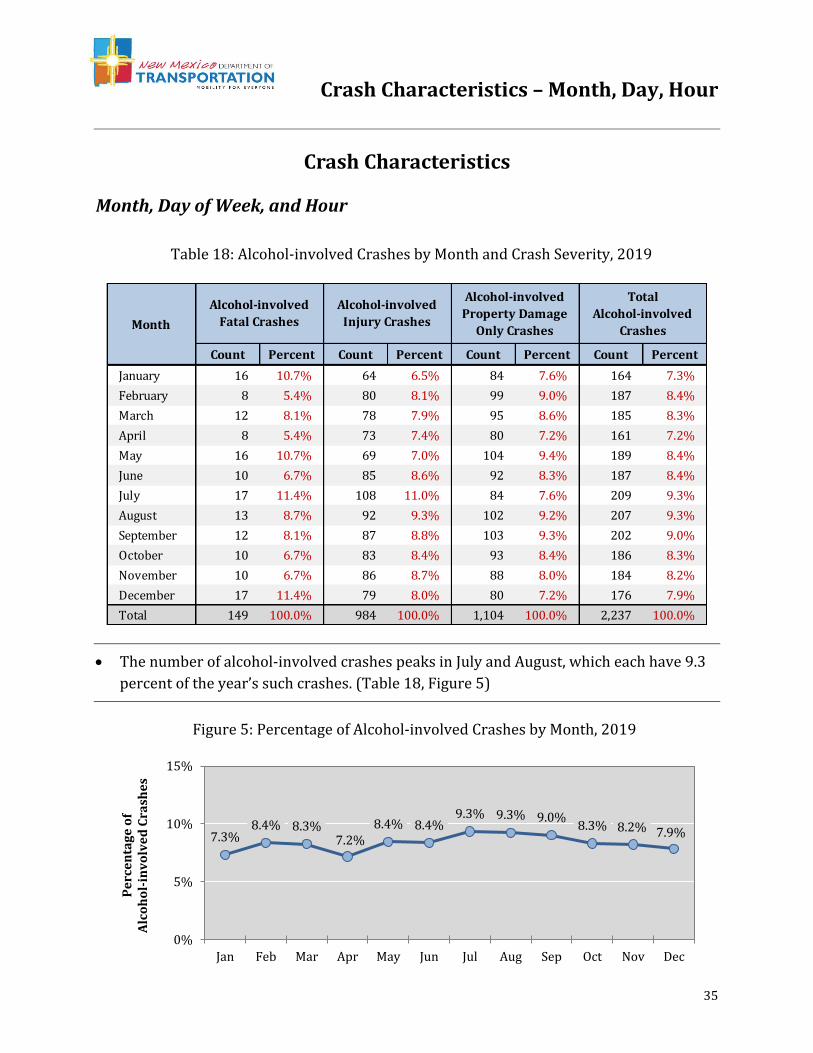
• The number of alcohol-involved crashes peaks in July and August, which each have 9.3
percent of the year’s such crashes. (Table 18, Figure 5)
Count Percent Count Percent Count Percent Count Percent
January 16 10.7% 64 6.5% 84 7.6% 164 7.3%
February 8 5.4% 80 8.1% 99 9.0% 187 8.4%
March 12 8.1% 78 7.9% 95 8.6% 185 8.3%
April 8 5.4% 73 7.4% 80 7.2% 161 7.2%
May 16 10.7% 69 7.0% 104 9.4% 189 8.4%
June 10 6.7% 85 8.6% 92 8.3% 187 8.4%
July 17 11.4% 108 11.0% 84 7.6% 209 9.3%
August 13 8.7% 92 9.3% 102 9.2% 207 9.3%
September 12 8.1% 87 8.8% 103 9.3% 202 9.0%
October 10 6.7% 83 8.4% 93 8.4% 186 8.3%
November 10 6.7% 86 8.7% 88 8.0% 184 8.2%
December 17 11.4% 79 8.0% 80 7.2% 176 7.9%
Total 149 100.0% 984 100.0% 1,104 100.0% 2,237 100.0%
Total
Alcohol-involved
CrashesMonth
Alcohol-involved
Fatal Crashes
Alcohol-involved
Injury Crashes
Alcohol-involved
Property Damage
Only Crashes
7.3%8.4% 8.3%
7.2%8.4% 8.4%
9.3% 9.3% 9.0%8.3% 8.2% 7.9%
0%
5%
10%
15%
Jan Feb Mar Apr May Jun Jul Aug Sep Oct Nov Dec
Pe
rce
nta
ge
of
Alc
oh
ol-
inv
olv
ed
Cra
she
s
Crash Characteristics
Table 18: Alcohol-involved Crashes by Month and Crash Severity, 2019
Figure 5: Percentage of Alcohol-involved Crashes by Month, 2019
Crash Characteristics – Month, Day, Hour
36
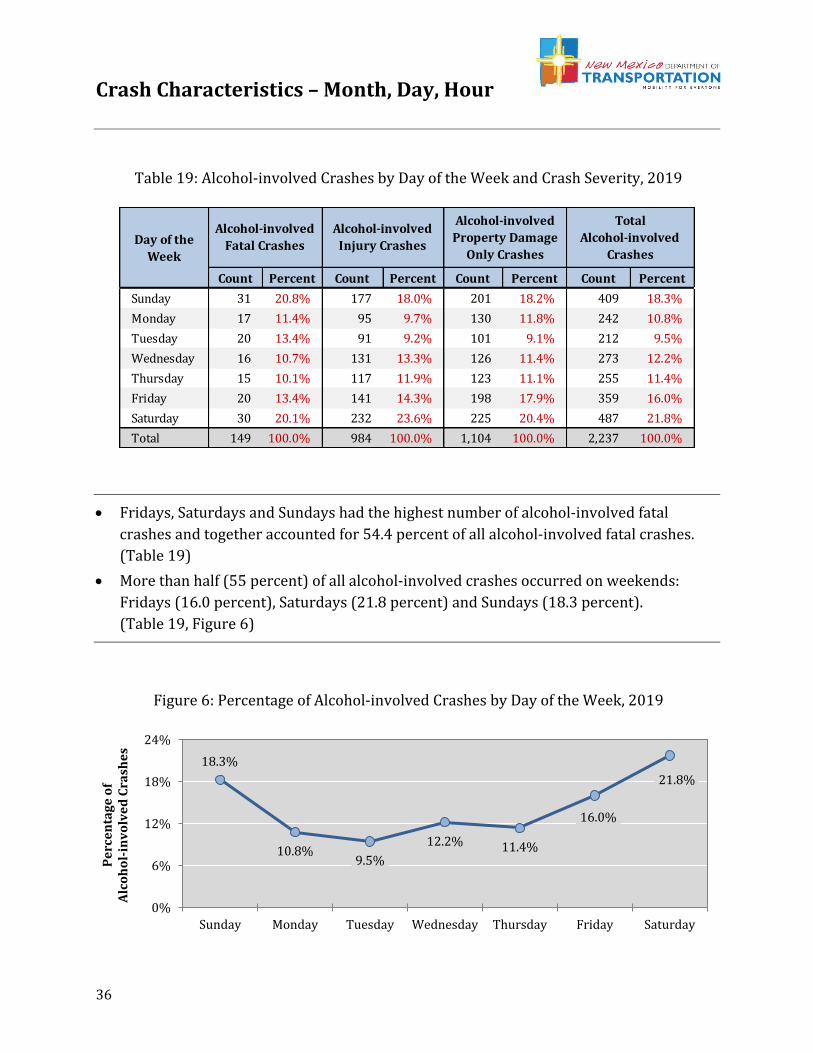
• Fridays, Saturdays and Sundays had the highest number of alcohol-involved fatal
crashes and together accounted for 54.4 percent of all alcohol-involved fatal crashes.
(Table 19)
• More than half (55 percent) of all alcohol-involved crashes occurred on weekends:
Fridays (16.0 percent), Saturdays (21.8 percent) and Sundays (18.3 percent).
(Table 19, Figure 6)
Count Percent Count Percent Count Percent Count Percent
Sunday 31 20.8% 177 18.0% 201 18.2% 409 18.3%
Monday 17 11.4% 95 9.7% 130 11.8% 242 10.8%
Tuesday 20 13.4% 91 9.2% 101 9.1% 212 9.5%
Wednesday 16 10.7% 131 13.3% 126 11.4% 273 12.2%
Thursday 15 10.1% 117 11.9% 123 11.1% 255 11.4%
Friday 20 13.4% 141 14.3% 198 17.9% 359 16.0%
Saturday 30 20.1% 232 23.6% 225 20.4% 487 21.8%
Total 149 100.0% 984 100.0% 1,104 100.0% 2,237 100.0%
Day of the
Week
Alcohol-involved
Fatal Crashes
Alcohol-involved
Injury Crashes
Alcohol-involved
Property Damage
Only Crashes
Total
Alcohol-involved
Crashes
18.3%
10.8%9.5%
12.2% 11.4%
16.0%
21.8%
0%
6%
12%
18%
24%
Sunday Monday Tuesday Wednesday Thursday Friday Saturday
Pe
rce
nta
ge
of
Alc
oh
ol-
inv
olv
ed
Cra
she
s
Table 19: Alcohol-involved Crashes by Day of the Week and Crash Severity, 2019
Figure 6: Percentage of Alcohol-involved Crashes by Day of the Week, 2019
Crash Characteristics – Month, Day, Hour
37
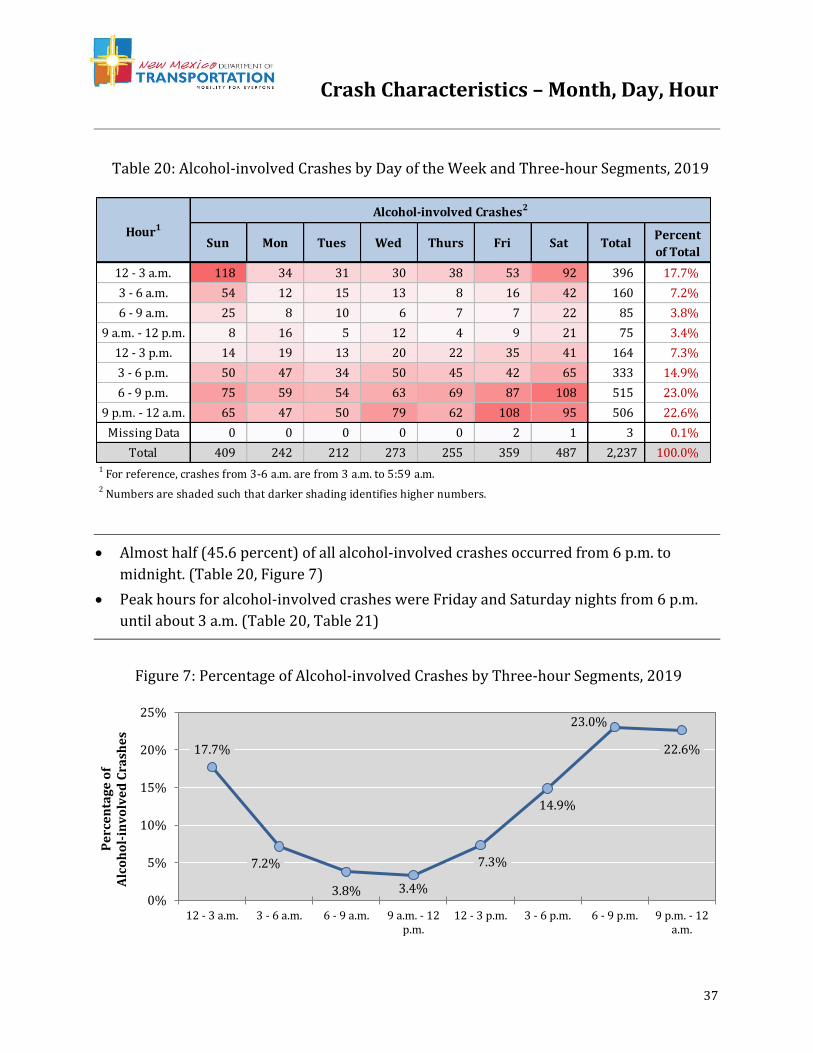
• Almost half (45.6 percent) of all alcohol-involved crashes occurred from 6 p.m. to
midnight. (Table 20, Figure 7)
• Peak hours for alcohol-involved crashes were Friday and Saturday nights from 6 p.m.
until about 3 a.m. (Table 20, Table 21)
Sun Mon Tues Wed Thurs Fri Sat TotalPercent
of Total
12 - 3 a.m. 118 34 31 30 38 53 92 396 17.7%
3 - 6 a.m. 54 12 15 13 8 16 42 160 7.2%
6 - 9 a.m. 25 8 10 6 7 7 22 85 3.8%
9 a.m. - 12 p.m. 8 16 5 12 4 9 21 75 3.4%
12 - 3 p.m. 14 19 13 20 22 35 41 164 7.3%
3 - 6 p.m. 50 47 34 50 45 42 65 333 14.9%
6 - 9 p.m. 75 59 54 63 69 87 108 515 23.0%
9 p.m. - 12 a.m. 65 47 50 79 62 108 95 506 22.6%
Missing Data 0 0 0 0 0 2 1 3 0.1%
Total 409 242 212 273 255 359 487 2,237 100.0%1 For reference, crashes from 3-6 a.m. are from 3 a.m. to 5:59 a.m.2 Numbers are shaded such that darker shading identifies higher numbers.
Hour1
Alcohol-involved Crashes2
17.7%
7.2%
3.8% 3.4%
7.3%
14.9%
23.0%
22.6%
0%
5%
10%
15%
20%
25%
12 - 3 a.m. 3 - 6 a.m. 6 - 9 a.m. 9 a.m. - 12p.m.
12 - 3 p.m. 3 - 6 p.m. 6 - 9 p.m. 9 p.m. - 12a.m.
Pe
rce
nta
ge
of
Alc
oh
ol-
inv
olv
ed
Cra
she
s
Table 20: Alcohol-involved Crashes by Day of the Week and Three-hour Segments, 2019
Figure 7: Percentage of Alcohol-involved Crashes by Three-hour Segments, 2019
Crash Characteristics – Month, Day, Hour
38
Sun Mon Tues Wed Thurs Fri Sat
12 a.m. 31 13 14 20 18 17 31 144 6.4%
1 a.m. 38 14 12 4 11 17 29 125 5.6%
2 a.m. 49 7 5 6 9 19 32 127 5.7%
3 a.m. 24 5 6 8 7 10 19 79 3.5%
4 a.m. 16 5 5 2 1 4 13 46 2.1%
5 a.m. 14 2 4 3 0 2 10 35 1.6%
6 a.m. 12 1 6 3 3 3 12 40 1.8%
7 a.m. 7 5 3 2 3 2 8 30 1.3%
8 a.m. 6 2 1 1 1 2 2 15 0.7%
9 a.m. 4 4 0 2 2 0 6 18 0.8%
10 a.m. 1 7 4 6 2 5 5 30 1.3%
11 a.m. 3 5 1 4 0 4 10 27 1.2%
Noon 3 5 4 8 9 12 12 53 2.4%
1 p.m. 2 4 3 7 5 10 18 49 2.2%
2 p.m. 9 10 6 5 8 13 11 62 2.8%
3 p.m. 15 9 5 8 6 11 13 67 3.0%
4 p.m. 19 15 11 20 15 17 24 121 5.4%
5 p.m. 16 23 18 22 24 14 28 145 6.5%
6 p.m. 25 18 14 23 24 31 38 173 7.7%
7 p.m. 25 19 17 21 23 22 32 159 7.1%
8 p.m. 25 22 23 19 22 34 38 183 8.2%
9 p.m. 26 25 21 28 23 38 32 193 8.6%
10 p.m. 21 11 17 27 26 38 37 177 7.9%
11 p.m. 18 11 12 24 13 32 26 136 6.1%
Missing Data 0 0 0 0 0 2 1 3 0.1%
Total 409 242 212 273 255 359 487 2,237 100.0%
2 Numbers are shaded such that darker shading identifies higher numbers.
1 For reference, crashes during the hour of 1 a.m. are crashes from 1 a.m. to 1:59 a.m.
Percent
by HourHour1
Alcohol-involved Crashes2Total by
Hour
144125 127
79
4635 40
3015 18
30 27
53 4962 67
121
145
173159
183193
177
136
0
60
120
180
240
Alc
oh
ol-
inv
olv
ed
C
rash
es
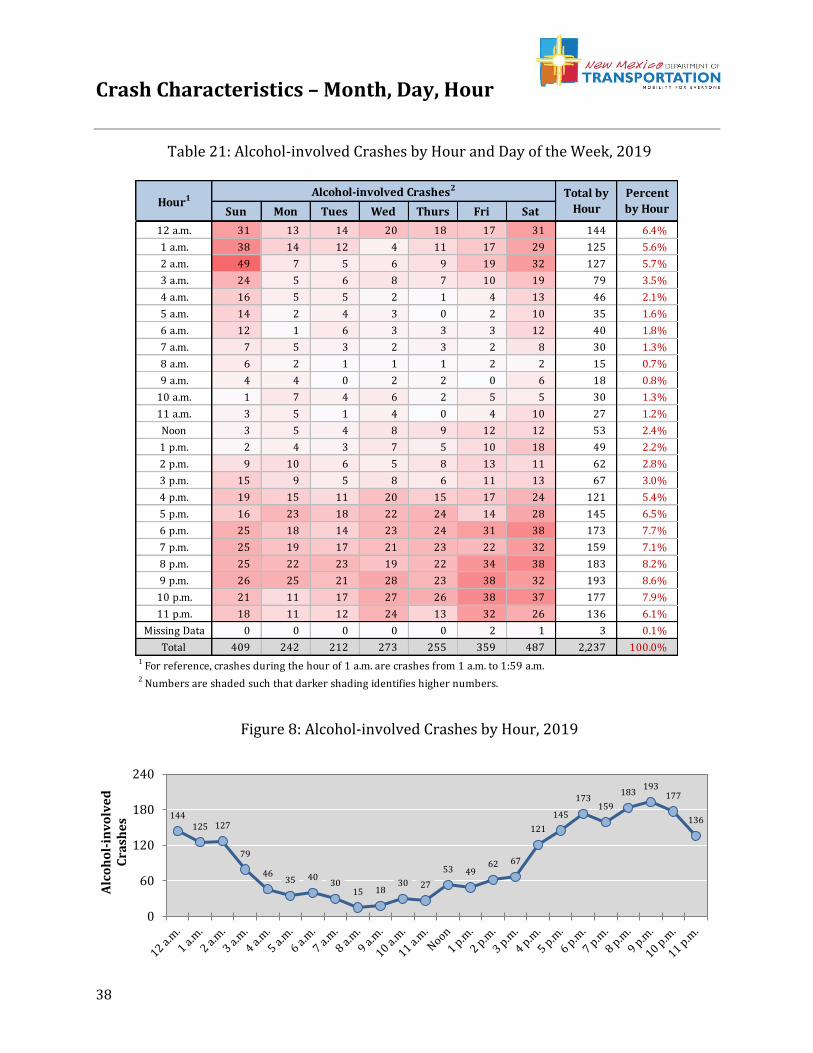
Table 21: Alcohol-involved Crashes by Hour and Day of the Week, 2019
Figure 8: Alcohol-involved Crashes by Hour, 2019
Crash Characteristics – Crash Classification
39
Crash Classification
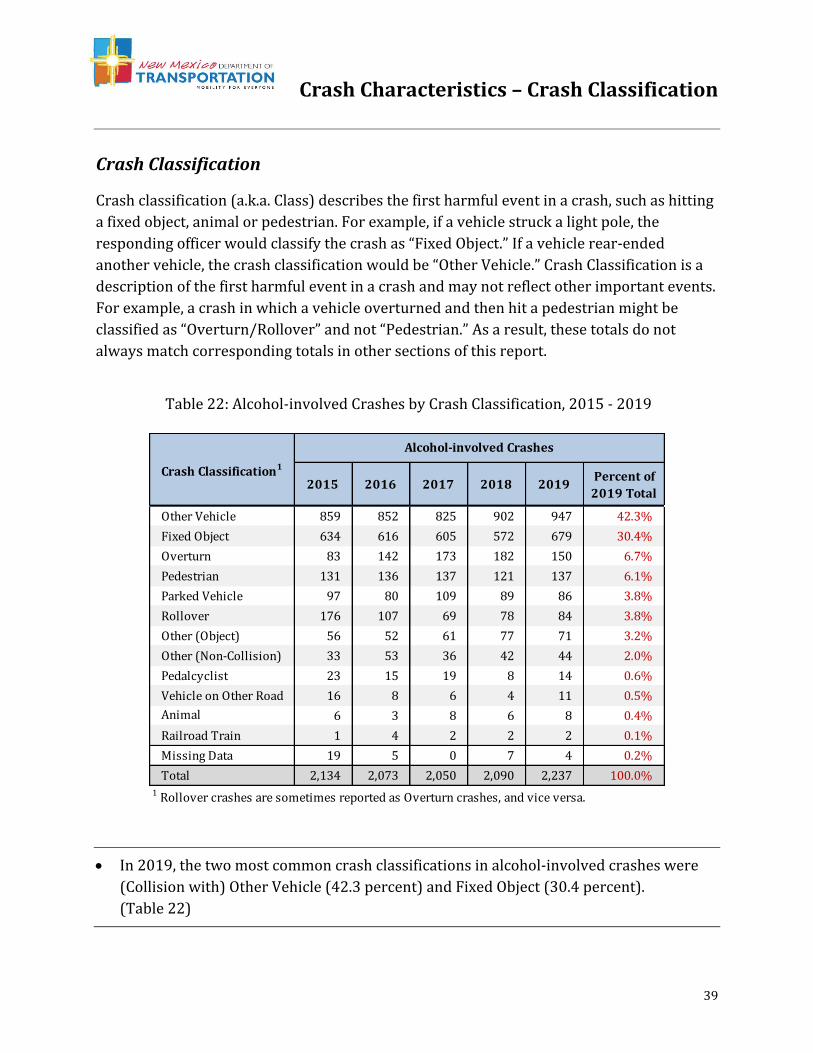
Crash classification (a.k.a. Class) describes the first harmful event in a crash, such as hitting
a fixed object, animal or pedestrian. For example, if a vehicle struck a light pole, the
responding officer would classify the crash as “Fixed Object.” If a vehicle rear-ended
another vehicle, the crash classification would be “Other Vehicle.” Crash Classification is a
description of the first harmful event in a crash and may not reflect other important events.
For example, a crash in which a vehicle overturned and then hit a pedestrian might be
classified as “Overturn/Rollover” and not “Pedestrian.” As a result, these totals do not
always match corresponding totals in other sections of this report.
• In 2019, the two most common crash classifications in alcohol-involved crashes were
(Collision with) Other Vehicle (42.3 percent) and Fixed Object (30.4 percent).
(Table 22)
2015 2016 2017 2018 2019Percent of
2019 Total
Other Vehicle 859 852 825 902 947 42.3%
Fixed Object 634 616 605 572 679 30.4%
Overturn 83 142 173 182 150 6.7%
Pedestrian 131 136 137 121 137 6.1%
Parked Vehicle 97 80 109 89 86 3.8%
Rollover 176 107 69 78 84 3.8%
Other (Object) 56 52 61 77 71 3.2%
Other (Non-Collision) 33 53 36 42 44 2.0%
Pedalcyclist 23 15 19 8 14 0.6%
Vehicle on Other Road 16 8 6 4 11 0.5%
Animal 6 3 8 6 8 0.4%
Railroad Train 1 4 2 2 2 0.1%
Missing Data 19 5 0 7 4 0.2%
Total 2,134 2,073 2,050 2,090 2,237 100.0%
Crash Classification1
Alcohol-involved Crashes
1 Rollover crashes are sometimes reported as Overturn crashes, and vice versa.
Table 22: Alcohol-involved Crashes by Crash Classification, 2015 - 2019
Crash Characteristics – Crash Classification
40
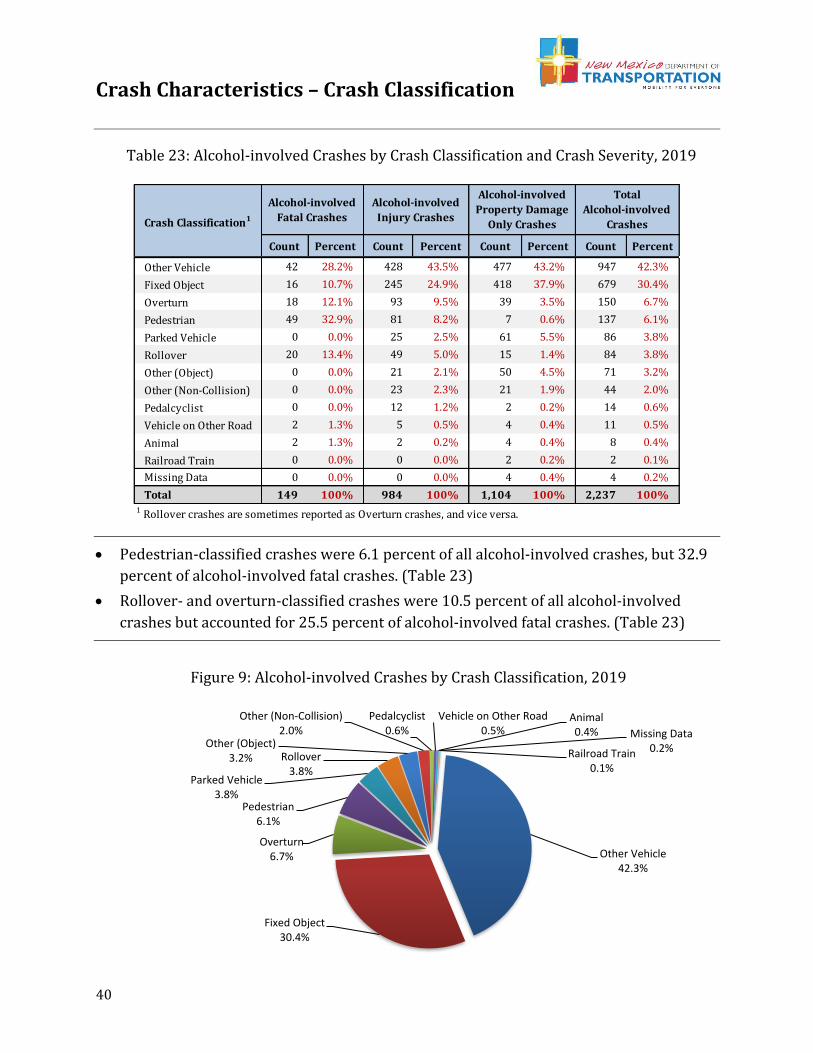
• Pedestrian-classified crashes were 6.1 percent of all alcohol-involved crashes, but 32.9
percent of alcohol-involved fatal crashes. (Table 23)
• Rollover- and overturn-classified crashes were 10.5 percent of all alcohol-involved
crashes but accounted for 25.5 percent of alcohol-involved fatal crashes. (Table 23)
Count Percent Count Percent Count Percent Count Percent
Other Vehicle 42 28.2% 428 43.5% 477 43.2% 947 42.3%
Fixed Object 16 10.7% 245 24.9% 418 37.9% 679 30.4%
Overturn 18 12.1% 93 9.5% 39 3.5% 150 6.7%
Pedestrian 49 32.9% 81 8.2% 7 0.6% 137 6.1%
Parked Vehicle 0 0.0% 25 2.5% 61 5.5% 86 3.8%
Rollover 20 13.4% 49 5.0% 15 1.4% 84 3.8%
Other (Object) 0 0.0% 21 2.1% 50 4.5% 71 3.2%
Other (Non-Collision) 0 0.0% 23 2.3% 21 1.9% 44 2.0%
Pedalcyclist 0 0.0% 12 1.2% 2 0.2% 14 0.6%
Vehicle on Other Road 2 1.3% 5 0.5% 4 0.4% 11 0.5%
Animal 2 1.3% 2 0.2% 4 0.4% 8 0.4%
Railroad Train 0 0.0% 0 0.0% 2 0.2% 2 0.1%
Missing Data 0 0.0% 0 0.0% 4 0.4% 4 0.2%
Total 149 100% 984 100% 1,104 100% 2,237 100%1 Rollover crashes are sometimes reported as Overturn crashes, and vice versa.
Crash Classification1
Alcohol-involved
Fatal Crashes
Alcohol-involved
Injury Crashes
Alcohol-involved
Property Damage
Only Crashes
Total
Alcohol-involved
Crashes
Other Vehicle42.3%
Fixed Object30.4%
Overturn6.7%
Pedestrian6.1%
Parked Vehicle3.8%
Rollover3.8%
Other (Object)3.2%
Other (Non-Collision)2.0%
Pedalcyclist0.6%
Vehicle on Other Road0.5%
Animal0.4%
Railroad Train0.1%
Missing Data0.2%
Table 23: Alcohol-involved Crashes by Crash Classification and Crash Severity, 2019
Figure 9: Alcohol-involved Crashes by Crash Classification, 2019
Crash Characteristics – Vehicles
41
Vehicles
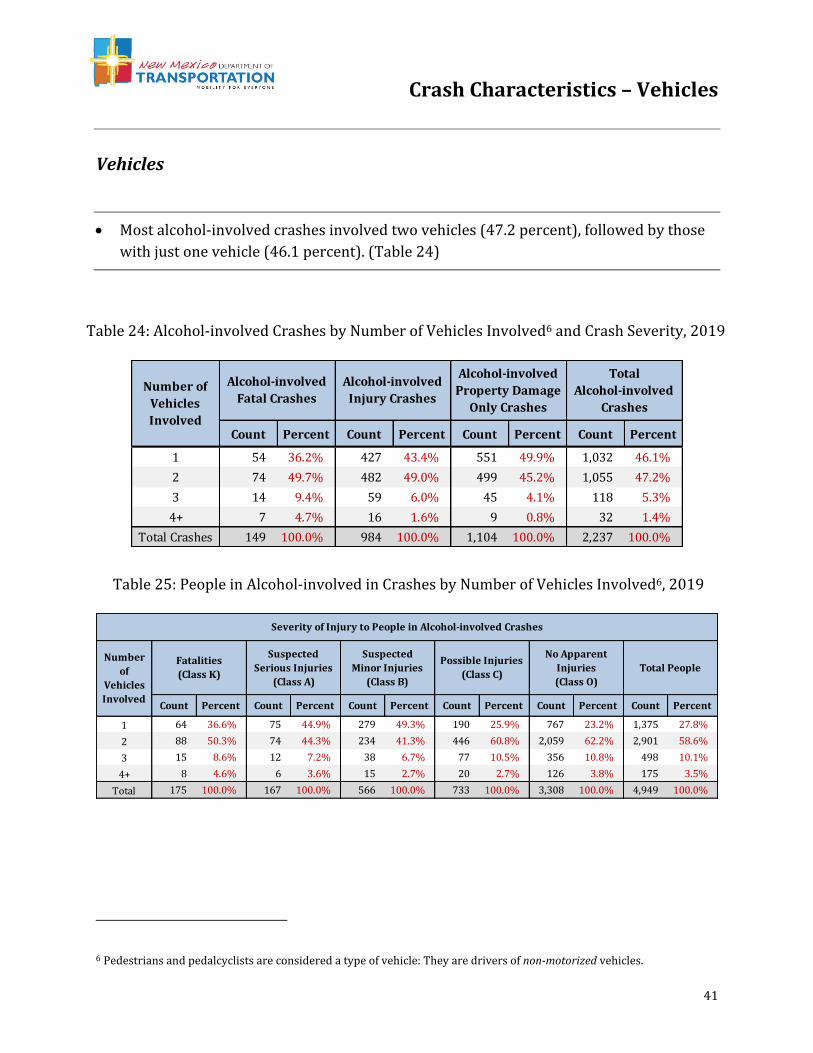
• Most alcohol-involved crashes involved two vehicles (47.2 percent), followed by those
with just one vehicle (46.1 percent). (Table 24)
6 Pedestrians and pedalcyclists are considered a type of vehicle: They are drivers of non-motorized vehicles.
Count Percent Count Percent Count Percent Count Percent
1 54 36.2% 427 43.4% 551 49.9% 1,032 46.1%
2 74 49.7% 482 49.0% 499 45.2% 1,055 47.2%
3 14 9.4% 59 6.0% 45 4.1% 118 5.3%
4+ 7 4.7% 16 1.6% 9 0.8% 32 1.4%
Total Crashes 149 100.0% 984 100.0% 1,104 100.0% 2,237 100.0%
Number of
Vehicles
Involved
Alcohol-involved
Fatal Crashes
Alcohol-involved
Injury Crashes
Alcohol-involved
Property Damage
Only Crashes
Total
Alcohol-involved
Crashes
Count Percent Count Percent Count Percent Count Percent Count Percent Count Percent
1 64 36.6% 75 44.9% 279 49.3% 190 25.9% 767 23.2% 1,375 27.8%
2 88 50.3% 74 44.3% 234 41.3% 446 60.8% 2,059 62.2% 2,901 58.6%
3 15 8.6% 12 7.2% 38 6.7% 77 10.5% 356 10.8% 498 10.1%
4+ 8 4.6% 6 3.6% 15 2.7% 20 2.7% 126 3.8% 175 3.5%
Total 175 100.0% 167 100.0% 566 100.0% 733 100.0% 3,308 100.0% 4,949 100.0%
Number
of
Vehicles
Involved
Severity of Injury to People in Alcohol-involved Crashes
No Apparent
Injuries
(Class O)
Total PeopleFatalities
(Class K)
Suspected
Serious Injuries
(Class A)
Suspected
Minor Injuries
(Class B)
Possible Injuries
(Class C)
Table 24: Alcohol-involved Crashes by Number of Vehicles Involved6 and Crash Severity, 2019
Table 25: People in Alcohol-involved in Crashes by Number of Vehicles Involved6, 2019
Crash Characteristics – Vehicles
42
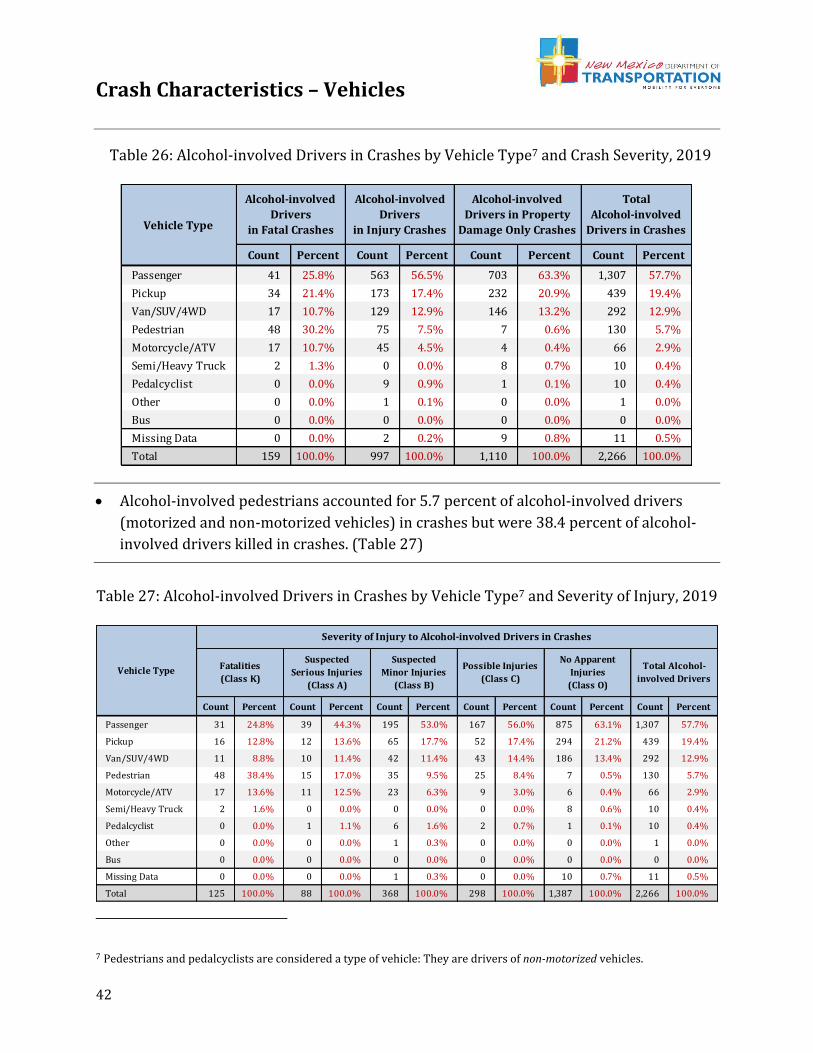
• Alcohol-involved pedestrians accounted for 5.7 percent of alcohol-involved drivers
(motorized and non-motorized vehicles) in crashes but were 38.4 percent of alcohol-
involved drivers killed in crashes. (Table 27)
7 Pedestrians and pedalcyclists are considered a type of vehicle: They are drivers of non-motorized vehicles.
Count Percent Count Percent Count Percent Count Percent
Passenger 41 25.8% 563 56.5% 703 63.3% 1,307 57.7%
Pickup 34 21.4% 173 17.4% 232 20.9% 439 19.4%
Van/SUV/4WD 17 10.7% 129 12.9% 146 13.2% 292 12.9%
Pedestrian 48 30.2% 75 7.5% 7 0.6% 130 5.7%
Motorcycle/ATV 17 10.7% 45 4.5% 4 0.4% 66 2.9%
Semi/Heavy Truck 2 1.3% 0 0.0% 8 0.7% 10 0.4%
Pedalcyclist 0 0.0% 9 0.9% 1 0.1% 10 0.4%
Other 0 0.0% 1 0.1% 0 0.0% 1 0.0%
Bus 0 0.0% 0 0.0% 0 0.0% 0 0.0%
Missing Data 0 0.0% 2 0.2% 9 0.8% 11 0.5%
Total 159 100.0% 997 100.0% 1,110 100.0% 2,266 100.0%
Vehicle Type
Alcohol-involved
Drivers
in Fatal Crashes
Alcohol-involved
Drivers
in Injury Crashes
Alcohol-involved
Drivers in Property
Damage Only Crashes
Total
Alcohol-involved
Drivers in Crashes
Count Percent Count Percent Count Percent Count Percent Count Percent Count Percent
Passenger 31 24.8% 39 44.3% 195 53.0% 167 56.0% 875 63.1% 1,307 57.7%
Pickup 16 12.8% 12 13.6% 65 17.7% 52 17.4% 294 21.2% 439 19.4%
Van/SUV/4WD 11 8.8% 10 11.4% 42 11.4% 43 14.4% 186 13.4% 292 12.9%
Pedestrian 48 38.4% 15 17.0% 35 9.5% 25 8.4% 7 0.5% 130 5.7%
Motorcycle/ATV 17 13.6% 11 12.5% 23 6.3% 9 3.0% 6 0.4% 66 2.9%
Semi/Heavy Truck 2 1.6% 0 0.0% 0 0.0% 0 0.0% 8 0.6% 10 0.4%
Pedalcyclist 0 0.0% 1 1.1% 6 1.6% 2 0.7% 1 0.1% 10 0.4%
Other 0 0.0% 0 0.0% 1 0.3% 0 0.0% 0 0.0% 1 0.0%
Bus 0 0.0% 0 0.0% 0 0.0% 0 0.0% 0 0.0% 0 0.0%
Missing Data 0 0.0% 0 0.0% 1 0.3% 0 0.0% 10 0.7% 11 0.5%
Total 125 100.0% 88 100.0% 368 100.0% 298 100.0% 1,387 100.0% 2,266 100.0%
Vehicle Type
Severity of Injury to Alcohol-involved Drivers in Crashes
Fatalities
(Class K)
Suspected
Serious Injuries
(Class A)
Suspected
Minor Injuries
(Class B)
Possible Injuries
(Class C)
No Apparent
Injuries
(Class O)
Total Alcohol-
involved Drivers
Table 26: Alcohol-involved Drivers in Crashes by Vehicle Type7 and Crash Severity, 2019
Table 27: Alcohol-involved Drivers in Crashes by Vehicle Type7 and Severity of Injury, 2019
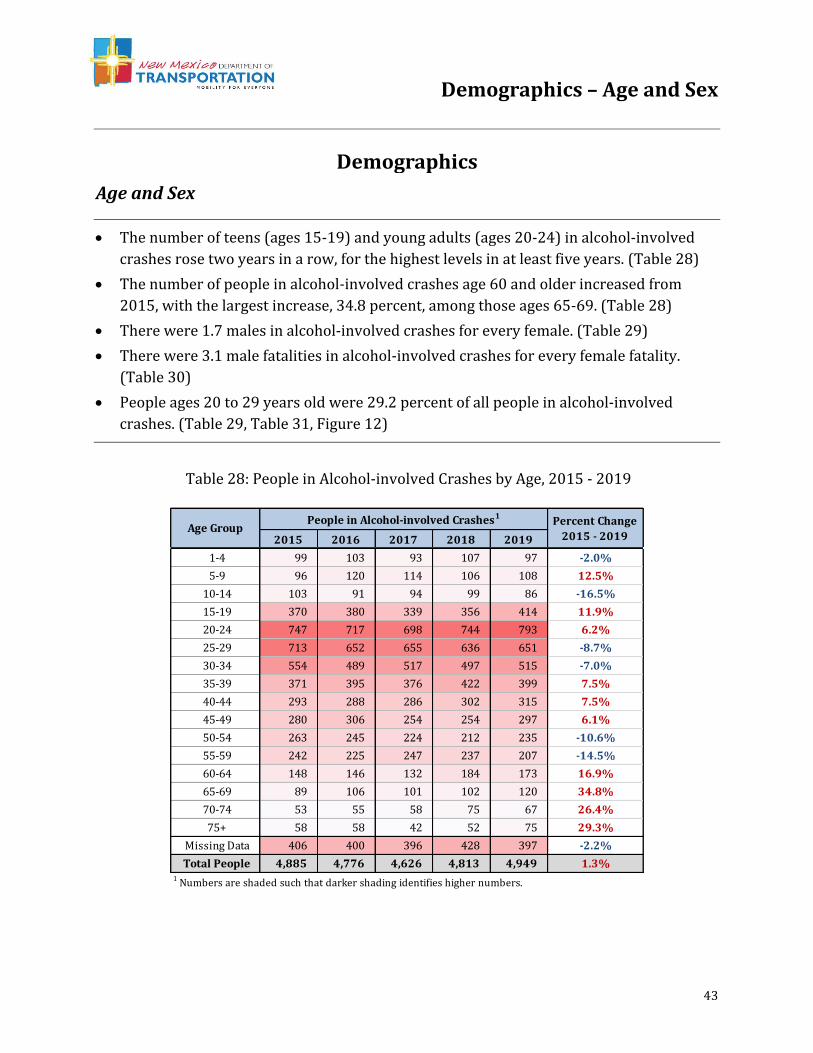
Demographics – Age and Sex
43
Age and Sex
• The number of teens (ages 15-19) and young adults (ages 20-24) in alcohol-involved
crashes rose two years in a row, for the highest levels in at least five years. (Table 28)
• The number of people in alcohol-involved crashes age 60 and older increased from
2015, with the largest increase, 34.8 percent, among those ages 65-69. (Table 28)
• There were 1.7 males in alcohol-involved crashes for every female. (Table 29)
• There were 3.1 male fatalities in alcohol-involved crashes for every female fatality.
(Table 30)
• People ages 20 to 29 years old were 29.2 percent of all people in alcohol-involved
crashes. (Table 29, Table 31, Figure 12)
2015 2016 2017 2018 2019
1-4 99 103 93 107 97 -2.0%
5-9 96 120 114 106 108 12.5%
10-14 103 91 94 99 86 -16.5%
15-19 370 380 339 356 414 11.9%
20-24 747 717 698 744 793 6.2%
25-29 713 652 655 636 651 -8.7%
30-34 554 489 517 497 515 -7.0%
35-39 371 395 376 422 399 7.5%
40-44 293 288 286 302 315 7.5%
45-49 280 306 254 254 297 6.1%
50-54 263 245 224 212 235 -10.6%
55-59 242 225 247 237 207 -14.5%
60-64 148 146 132 184 173 16.9%
65-69 89 106 101 102 120 34.8%
70-74 53 55 58 75 67 26.4%
75+ 58 58 42 52 75 29.3%
Missing Data 406 400 396 428 397 -2.2%
Total People 4,885 4,776 4,626 4,813 4,949 1.3%1 Numbers are shaded such that darker shading identifies higher numbers.
Percent Change
2015 - 2019Age Group
People in Alcohol-involved Crashes1
Demographics
Table 28: People in Alcohol-involved Crashes by Age, 2015 - 2019
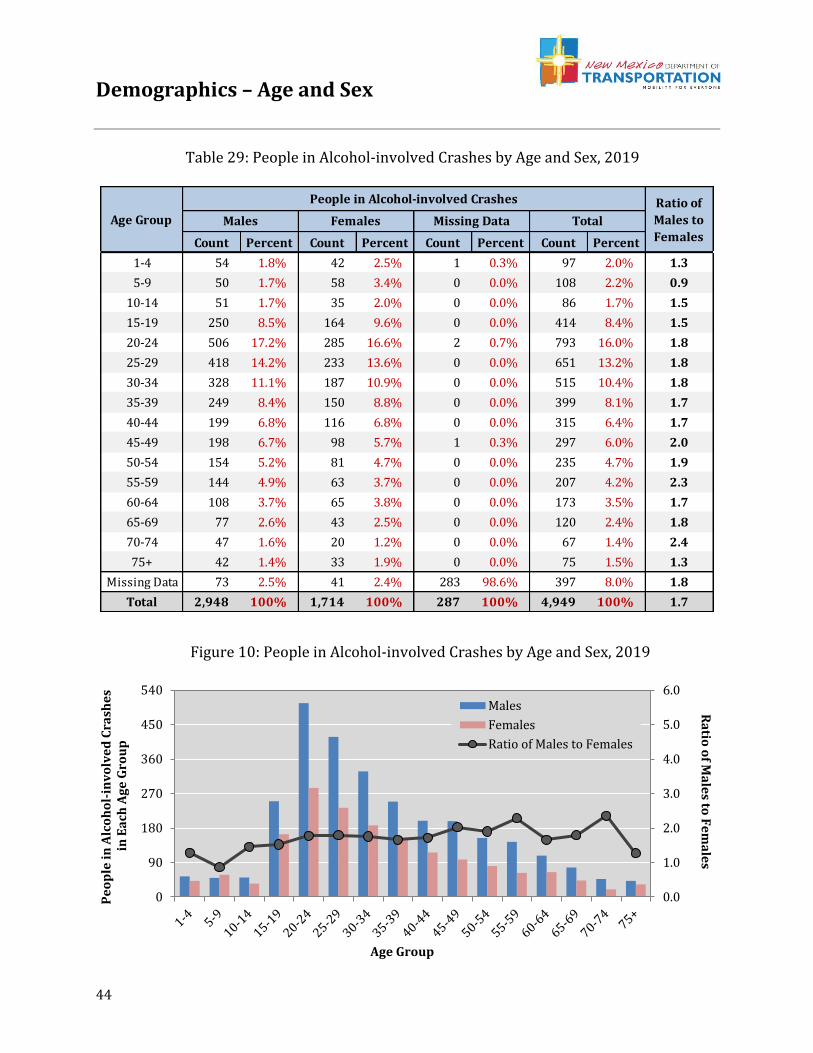
Demographics – Age and Sex
44
Count Percent Count Percent Count Percent Count Percent
1-4 54 1.8% 42 2.5% 1 0.3% 97 2.0% 1.3
5-9 50 1.7% 58 3.4% 0 0.0% 108 2.2% 0.9
10-14 51 1.7% 35 2.0% 0 0.0% 86 1.7% 1.5
15-19 250 8.5% 164 9.6% 0 0.0% 414 8.4% 1.5
20-24 506 17.2% 285 16.6% 2 0.7% 793 16.0% 1.8
25-29 418 14.2% 233 13.6% 0 0.0% 651 13.2% 1.8
30-34 328 11.1% 187 10.9% 0 0.0% 515 10.4% 1.8
35-39 249 8.4% 150 8.8% 0 0.0% 399 8.1% 1.7
40-44 199 6.8% 116 6.8% 0 0.0% 315 6.4% 1.7
45-49 198 6.7% 98 5.7% 1 0.3% 297 6.0% 2.0
50-54 154 5.2% 81 4.7% 0 0.0% 235 4.7% 1.9
55-59 144 4.9% 63 3.7% 0 0.0% 207 4.2% 2.3
60-64 108 3.7% 65 3.8% 0 0.0% 173 3.5% 1.7
65-69 77 2.6% 43 2.5% 0 0.0% 120 2.4% 1.8
70-74 47 1.6% 20 1.2% 0 0.0% 67 1.4% 2.4
75+ 42 1.4% 33 1.9% 0 0.0% 75 1.5% 1.3
Missing Data 73 2.5% 41 2.4% 283 98.6% 397 8.0% 1.8
Total 2,948 100% 1,714 100% 287 100% 4,949 100% 1.7
Males Females Missing Data Total
Ratio of
Males to
Females
People in Alcohol-involved Crashes
Age Group
0.0
1.0
2.0
3.0
4.0
5.0
6.0
0
90
180
270
360
450
540
Ra
tio o
f Ma
les to
Fe
ma
les
Pe
op
le i
n A
lco
ho
l-in
vo
lve
d C
rash
es
in E
ach
Ag
e G
rou
p
Age Group
Males
Females
Ratio of Males to Females
Table 29: People in Alcohol-involved Crashes by Age and Sex, 2019
Figure 10: People in Alcohol-involved Crashes by Age and Sex, 2019
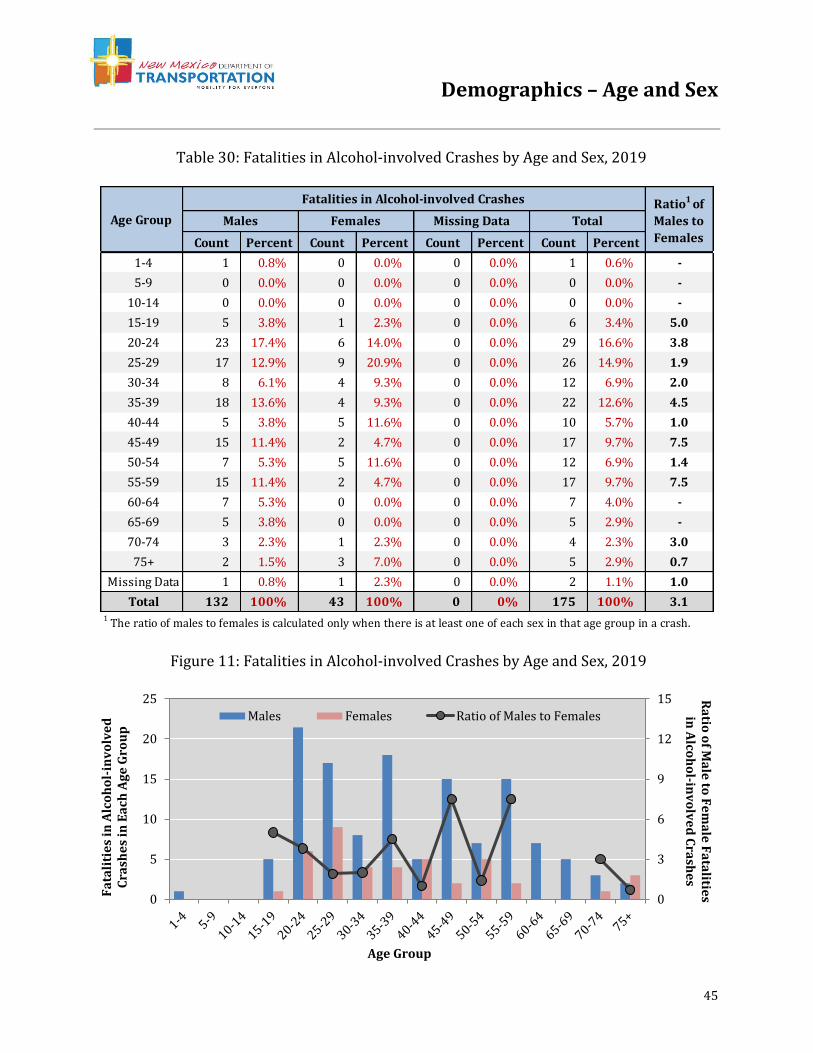
Demographics – Age and Sex
45
Count Percent Count Percent Count Percent Count Percent
1-4 1 0.8% 0 0.0% 0 0.0% 1 0.6% -
5-9 0 0.0% 0 0.0% 0 0.0% 0 0.0% -
10-14 0 0.0% 0 0.0% 0 0.0% 0 0.0% -
15-19 5 3.8% 1 2.3% 0 0.0% 6 3.4% 5.0
20-24 23 17.4% 6 14.0% 0 0.0% 29 16.6% 3.8
25-29 17 12.9% 9 20.9% 0 0.0% 26 14.9% 1.9
30-34 8 6.1% 4 9.3% 0 0.0% 12 6.9% 2.0
35-39 18 13.6% 4 9.3% 0 0.0% 22 12.6% 4.5
40-44 5 3.8% 5 11.6% 0 0.0% 10 5.7% 1.0
45-49 15 11.4% 2 4.7% 0 0.0% 17 9.7% 7.5
50-54 7 5.3% 5 11.6% 0 0.0% 12 6.9% 1.4
55-59 15 11.4% 2 4.7% 0 0.0% 17 9.7% 7.5
60-64 7 5.3% 0 0.0% 0 0.0% 7 4.0% -
65-69 5 3.8% 0 0.0% 0 0.0% 5 2.9% -
70-74 3 2.3% 1 2.3% 0 0.0% 4 2.3% 3.0
75+ 2 1.5% 3 7.0% 0 0.0% 5 2.9% 0.7
Missing Data 1 0.8% 1 2.3% 0 0.0% 2 1.1% 1.0
Total 132 100% 43 100% 0 0% 175 100% 3.1
Age Group
Fatalities in Alcohol-involved Crashes Ratio1 of
Males to
Females
Females TotalMales
1 The ratio of males to females is calculated only when there is at least one of each sex in that age group in a crash.
Missing Data
0
3
6
9
12
15
0
5
10
15
20
25 Ra
tio o
f Ma
le to
Fe
ma
le F
ata
lities
in A
lcoh
ol-in
vo
lve
d C
rash
es
Fa
tali
tie
s in
Alc
oh
ol-
inv
olv
ed
C
rash
es
in E
ach
Ag
e G
rou
p
Age Group
Males Females Ratio of Males to Females
Table 30: Fatalities in Alcohol-involved Crashes by Age and Sex, 2019
Figure 11: Fatalities in Alcohol-involved Crashes by Age and Sex, 2019
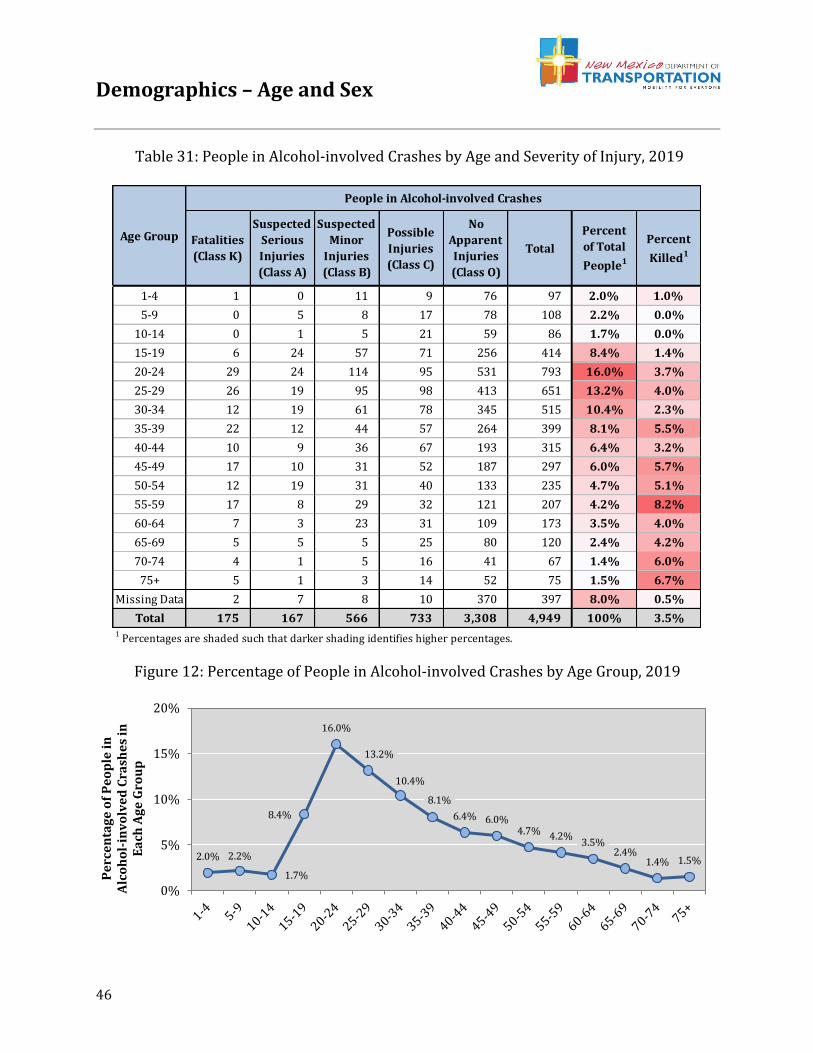
Demographics – Age and Sex
46
1-4 1 0 11 9 76 97 2.0% 1.0%
5-9 0 5 8 17 78 108 2.2% 0.0%
10-14 0 1 5 21 59 86 1.7% 0.0%
15-19 6 24 57 71 256 414 8.4% 1.4%
20-24 29 24 114 95 531 793 16.0% 3.7%
25-29 26 19 95 98 413 651 13.2% 4.0%
30-34 12 19 61 78 345 515 10.4% 2.3%
35-39 22 12 44 57 264 399 8.1% 5.5%
40-44 10 9 36 67 193 315 6.4% 3.2%
45-49 17 10 31 52 187 297 6.0% 5.7%
50-54 12 19 31 40 133 235 4.7% 5.1%
55-59 17 8 29 32 121 207 4.2% 8.2%
60-64 7 3 23 31 109 173 3.5% 4.0%
65-69 5 5 5 25 80 120 2.4% 4.2%
70-74 4 1 5 16 41 67 1.4% 6.0%
75+ 5 1 3 14 52 75 1.5% 6.7%
Missing Data 2 7 8 10 370 397 8.0% 0.5%
Total 175 167 566 733 3,308 4,949 100% 3.5%1 Percentages are shaded such that darker shading identifies higher percentages.
Possible
Injuries
(Class C)
Suspected
Minor
Injuries
(Class B)
Percent
Killed1
People in Alcohol-involved Crashes
Percent
of Total
People1
Age Group Fatalities
(Class K)
Suspected
Serious
Injuries
(Class A)
Total
No
Apparent
Injuries
(Class O)
2.0% 2.2%
1.7%
8.4%
16.0%
13.2%
10.4%
8.1%
6.4% 6.0%4.7% 4.2%
3.5%2.4%
1.4% 1.5%
0%
5%
10%
15%
20%
Pe
rce
nta
ge
of
Pe
op
le i
n
Alc
oh
ol-
inv
olv
ed
Cra
she
s in
E
ach
Ag
e G
rou
p
Table 31: People in Alcohol-involved Crashes by Age and Severity of Injury, 2019
Figure 12: Percentage of People in Alcohol-involved Crashes by Age Group, 2019
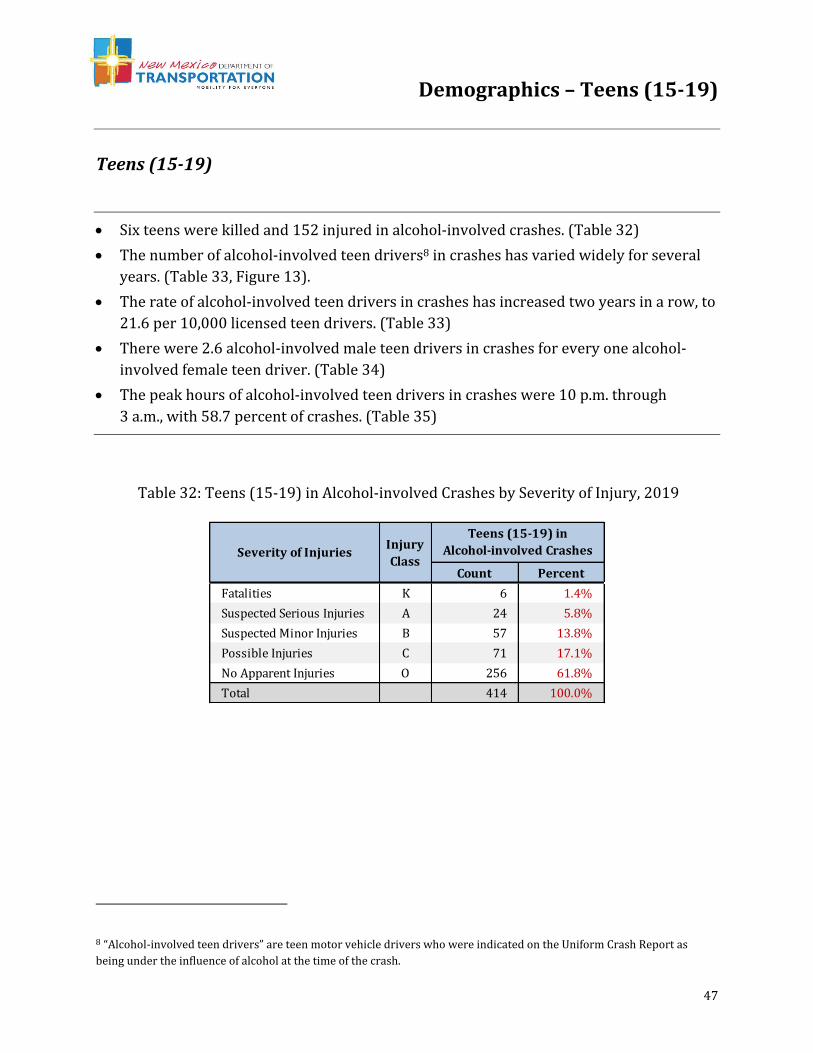
Demographics – Teens (15-19)
47
Teens (15-19)
• Six teens were killed and 152 injured in alcohol-involved crashes. (Table 32)
• The number of alcohol-involved teen drivers8 in crashes has varied widely for several
years. (Table 33, Figure 13).
• The rate of alcohol-involved teen drivers in crashes has increased two years in a row, to
21.6 per 10,000 licensed teen drivers. (Table 33)
• There were 2.6 alcohol-involved male teen drivers in crashes for every one alcohol-
involved female teen driver. (Table 34)
• The peak hours of alcohol-involved teen drivers in crashes were 10 p.m. through
3 a.m., with 58.7 percent of crashes. (Table 35)
8 “Alcohol-involved teen drivers” are teen motor vehicle drivers who were indicated on the Uniform Crash Report as
being under the influence of alcohol at the time of the crash.
Count Percent
Fatalities K 6 1.4%
Suspected Serious Injuries A 24 5.8%
Suspected Minor Injuries B 57 13.8%
Possible Injuries C 71 17.1%
No Apparent Injuries O 256 61.8%
Total 414 100.0%
Severity of InjuriesInjury
Class
Teens (15-19) in
Alcohol-involved Crashes
Table 32: Teens (15-19) in Alcohol-involved Crashes by Severity of Injury, 2019
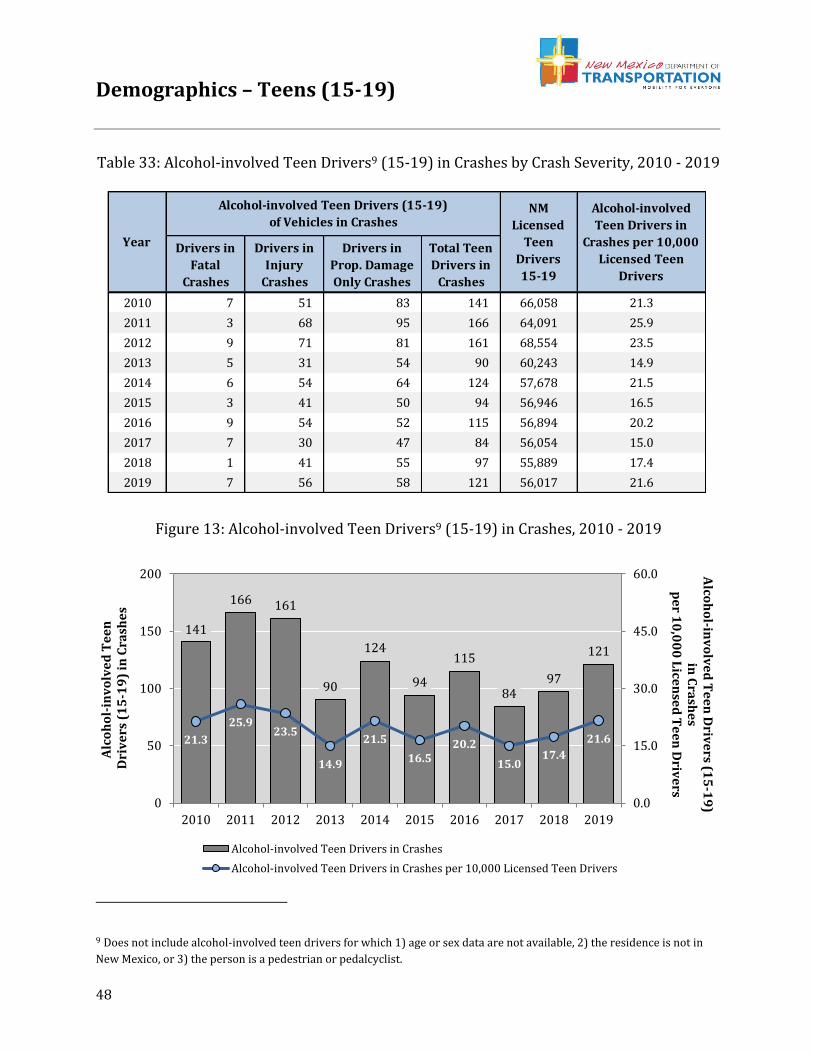
Demographics – Teens (15-19)
48
9 Does not include alcohol-involved teen drivers for which 1) age or sex data are not available, 2) the residence is not in
New Mexico, or 3) the person is a pedestrian or pedalcyclist.
Drivers in
Fatal
Crashes
Drivers in
Injury
Crashes
Drivers in
Prop. Damage
Only Crashes
Total Teen
Drivers in
Crashes
2010 7 51 83 141 66,058 21.3
2011 3 68 95 166 64,091 25.9
2012 9 71 81 161 68,554 23.5
2013 5 31 54 90 60,243 14.9
2014 6 54 64 124 57,678 21.5
2015 3 41 50 94 56,946 16.5
2016 9 54 52 115 56,894 20.2
2017 7 30 47 84 56,054 15.0
2018 1 41 55 97 55,889 17.4
2019 7 56 58 121 56,017 21.6
Alcohol-involved
Teen Drivers in
Crashes per 10,000
Licensed Teen
Drivers
NM
Licensed
Teen
Drivers
15-19
Alcohol-involved Teen Drivers (15-19)
of Vehicles in Crashes
Year
141
166 161
90
124
94
115
8497
121
21.3
25.923.5
14.9
21.5
16.520.2
15.017.4
21.6
0.0
15.0
30.0
45.0
60.0
0
50
100
150
200
2010 2011 2012 2013 2014 2015 2016 2017 2018 2019
Alco
ho
l-inv
olv
ed
Te
en
Driv
ers (1
5-1
9)
in C
rash
es
pe
r 10
,00
0 L
icen
sed
Te
en
Driv
ers
Alc
oh
ol-
inv
olv
ed
Te
en
Dri
ve
rs (
15
-19
) in
Cra
she
s
Alcohol-involved Teen Drivers in Crashes
Alcohol-involved Teen Drivers in Crashes per 10,000 Licensed Teen Drivers
Table 33: Alcohol-involved Teen Drivers9 (15-19) in Crashes by Crash Severity, 2010 - 2019
Figure 13: Alcohol-involved Teen Drivers9 (15-19) in Crashes, 2010 - 2019
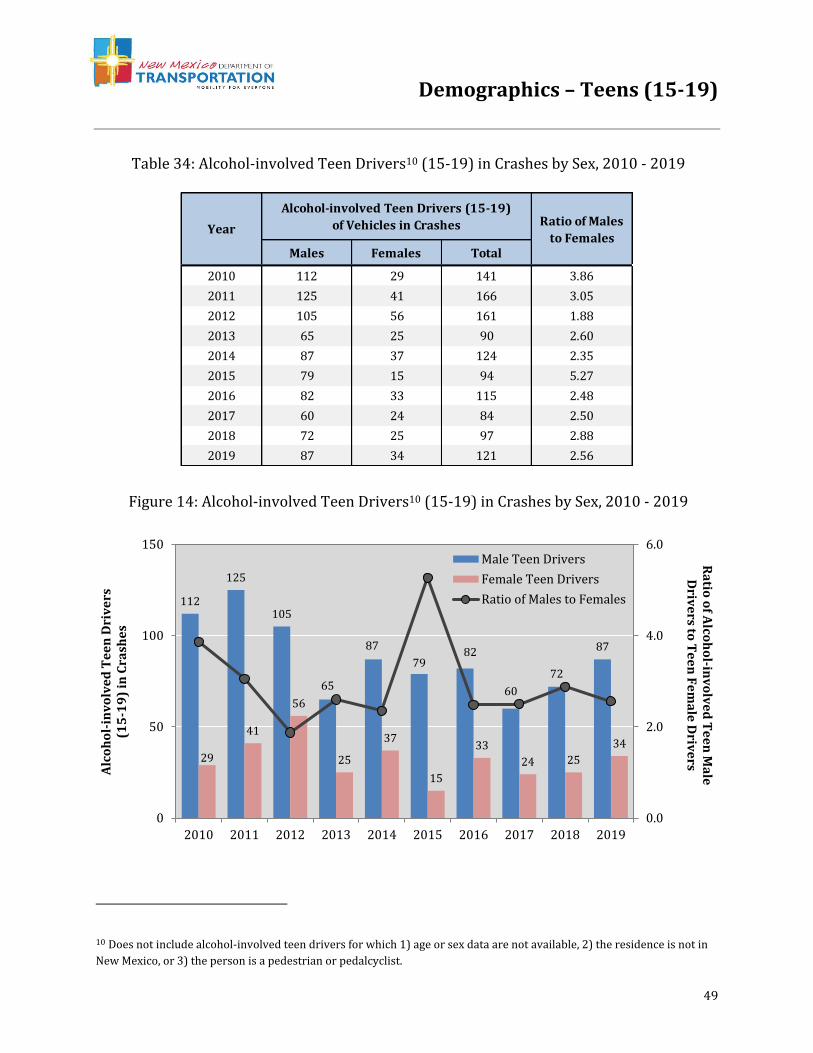
Demographics – Teens (15-19)
49
10 Does not include alcohol-involved teen drivers for which 1) age or sex data are not available, 2) the residence is not in
New Mexico, or 3) the person is a pedestrian or pedalcyclist.
Males Females Total
2010 112 29 141 3.86
2011 125 41 166 3.05
2012 105 56 161 1.88
2013 65 25 90 2.60
2014 87 37 124 2.35
2015 79 15 94 5.27
2016 82 33 115 2.48
2017 60 24 84 2.50
2018 72 25 97 2.88
2019 87 34 121 2.56
Alcohol-involved Teen Drivers (15-19)
of Vehicles in CrashesYearRatio of Males
to Females
112
125
105
65
87
7982
60
72
87
29
41
56
25
37
15
33
24 25
34
0.0
2.0
4.0
6.0
0
50
100
150
2010 2011 2012 2013 2014 2015 2016 2017 2018 2019
Ra
tio o
f Alco
ho
l-inv
olv
ed
Te
en
Ma
le
Driv
ers to
Te
en
Fe
ma
le D
rive
rsA
lco
ho
l-in
vo
lve
d T
ee
n D
riv
ers
(1
5-1
9)
in C
rash
es
Male Teen Drivers
Female Teen Drivers
Ratio of Males to Females
Table 34: Alcohol-involved Teen Drivers10 (15-19) in Crashes by Sex, 2010 - 2019
Figure 14: Alcohol-involved Teen Drivers10 (15-19) in Crashes by Sex, 2010 - 2019
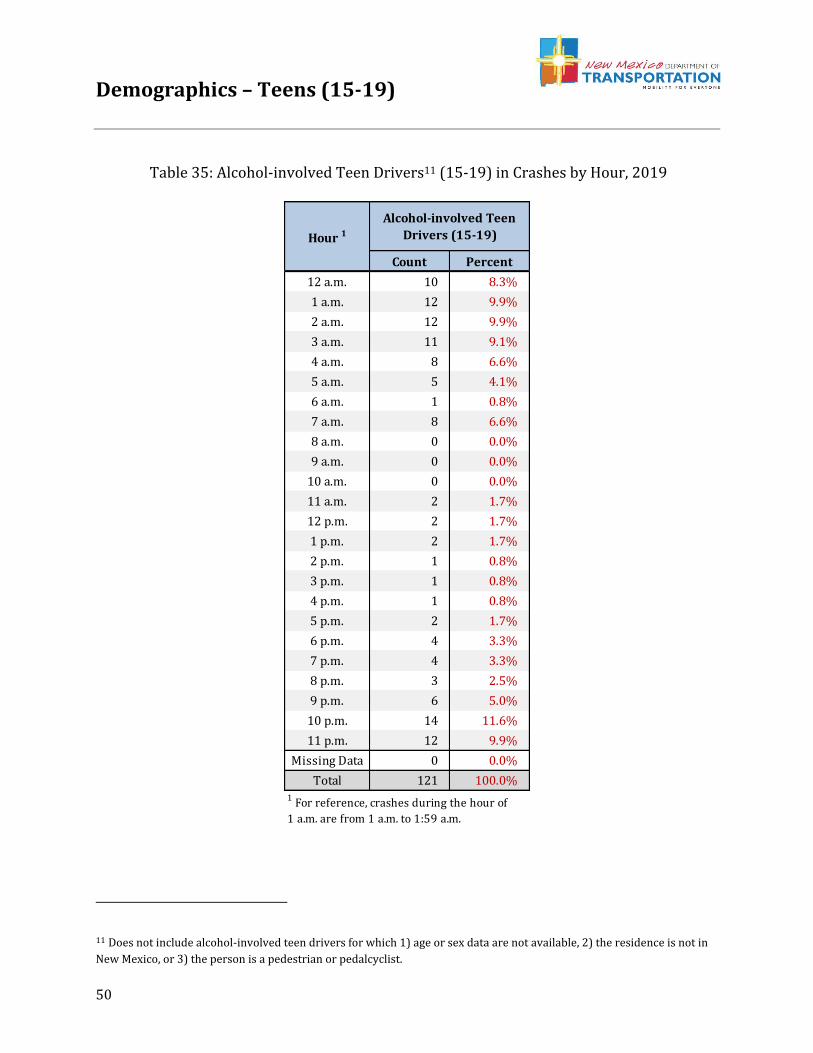
Demographics – Teens (15-19)
50
11 Does not include alcohol-involved teen drivers for which 1) age or sex data are not available, 2) the residence is not in
New Mexico, or 3) the person is a pedestrian or pedalcyclist.
Count Percent
12 a.m. 10 8.3%
1 a.m. 12 9.9%
2 a.m. 12 9.9%
3 a.m. 11 9.1%
4 a.m. 8 6.6%
5 a.m. 5 4.1%
6 a.m. 1 0.8%
7 a.m. 8 6.6%
8 a.m. 0 0.0%
9 a.m. 0 0.0%
10 a.m. 0 0.0%
11 a.m. 2 1.7%
12 p.m. 2 1.7%
1 p.m. 2 1.7%
2 p.m. 1 0.8%
3 p.m. 1 0.8%
4 p.m. 1 0.8%
5 p.m. 2 1.7%
6 p.m. 4 3.3%
7 p.m. 4 3.3%
8 p.m. 3 2.5%
9 p.m. 6 5.0%
10 p.m. 14 11.6%
11 p.m. 12 9.9%
Missing Data 0 0.0%
Total 121 100.0%
Hour 1Alcohol-involved Teen
Drivers (15-19)
1 For reference, crashes during the hour of
1 a.m. are from 1 a.m. to 1:59 a.m.
Table 35: Alcohol-involved Teen Drivers11 (15-19) in Crashes by Hour, 2019

Demographics – Young Adults (20-24)
51
Young Adults (20-24)
• 29 young adults were killed and 233 injured in alcohol-involved crashes. (Table 36)
• After a decline of five years, the number of alcohol-involved young adult drivers12 in
crashes has risen three years in a row, to 404. (Table 37, Figure 15)
• The rate of alcohol-involved young adult drivers in crashes rose to the highest level
since 2011, to 37.1 per 10,000 licensed young adult drivers. The higher rate resulted
from a decrease in the number of licensed young adult drivers in New Mexico combined
with an increase in the number of these drivers in crashes. (Table 37)
• The ratio of male alcohol-involved young adult drivers to female alcohol-involved
young adult drivers has decreased two years in a row, to 2.21. (Table 38)
• The peak hours of alcohol-involved young adult drivers in crashes were from 9 p.m.
through 10 p.m., and 1 a.m. through 3 a.m. (Table 39)
12 “Alcohol-involved young adult drivers” are young adult motor vehicle drivers who were indicated on the Uniform Crash
Report as being under the influence of alcohol at the time of the crash.
Count Percent
Fatalities K 29 3.7%
Suspected Serious Injuries A 24 3.0%
Suspected Minor Injuries B 114 14.4%
Possible Injuries C 95 12.0%
No Apparent Injuries O 531 67.0%
Total 793 100.0%
Severity of InjuriesInjury
Class
Young Adults (20-24) in
Alcohol-involved Crashes
Table 36: Young Adults (20-24) in Alcohol-involved Crashes by Severity of Injury, 2019
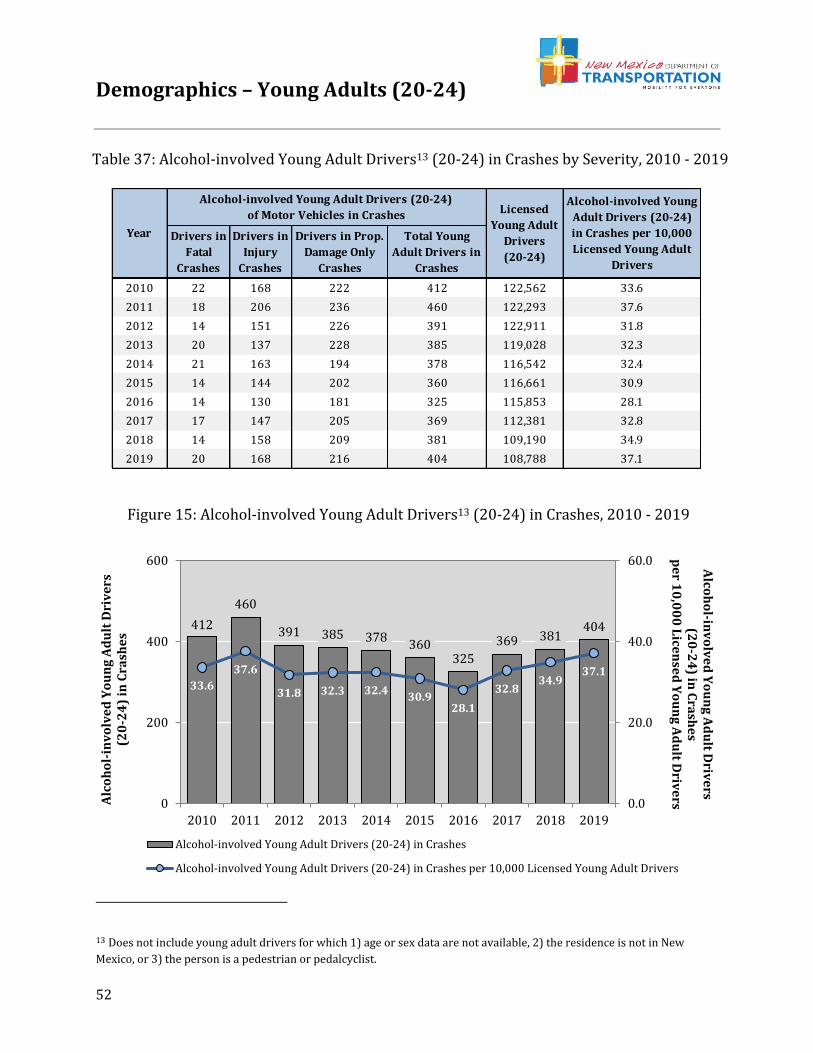
Demographics – Young Adults (20-24)
52
13 Does not include young adult drivers for which 1) age or sex data are not available, 2) the residence is not in New
Mexico, or 3) the person is a pedestrian or pedalcyclist.
Drivers in
Fatal
Crashes
Drivers in
Injury
Crashes
Drivers in Prop.
Damage Only
Crashes
Total Young
Adult Drivers in
Crashes
2010 22 168 222 412 122,562 33.6
2011 18 206 236 460 122,293 37.6
2012 14 151 226 391 122,911 31.8
2013 20 137 228 385 119,028 32.3
2014 21 163 194 378 116,542 32.4
2015 14 144 202 360 116,661 30.9
2016 14 130 181 325 115,853 28.1
2017 17 147 205 369 112,381 32.8
2018 14 158 209 381 109,190 34.9
2019 20 168 216 404 108,788 37.1
Year
Licensed
Young Adult
Drivers
(20-24)
Alcohol-involved Young
Adult Drivers (20-24)
in Crashes per 10,000
Licensed Young Adult
Drivers
Alcohol-involved Young Adult Drivers (20-24)
of Motor Vehicles in Crashes
412
460
391 385 378360
325
369 381404
33.6
37.6
31.8 32.3 32.430.9
28.1
32.834.9
37.1
0.0
20.0
40.0
60.0
0
200
400
600
2010 2011 2012 2013 2014 2015 2016 2017 2018 2019
Alco
ho
l-inv
olv
ed
Yo
un
g A
du
lt Driv
ers
(20
-24
) in C
rash
es
pe
r 10
,00
0 L
icen
sed
Yo
un
g A
du
lt Driv
ersA
lco
ho
l-in
vo
lve
d Y
ou
ng
Ad
ult
Dri
ve
rs
(20
-24
) in
Cra
she
s
Alcohol-involved Young Adult Drivers (20-24) in Crashes
Alcohol-involved Young Adult Drivers (20-24) in Crashes per 10,000 Licensed Young Adult Drivers
Table 37: Alcohol-involved Young Adult Drivers13 (20-24) in Crashes by Severity, 2010 - 2019
Figure 15: Alcohol-involved Young Adult Drivers13 (20-24) in Crashes, 2010 - 2019
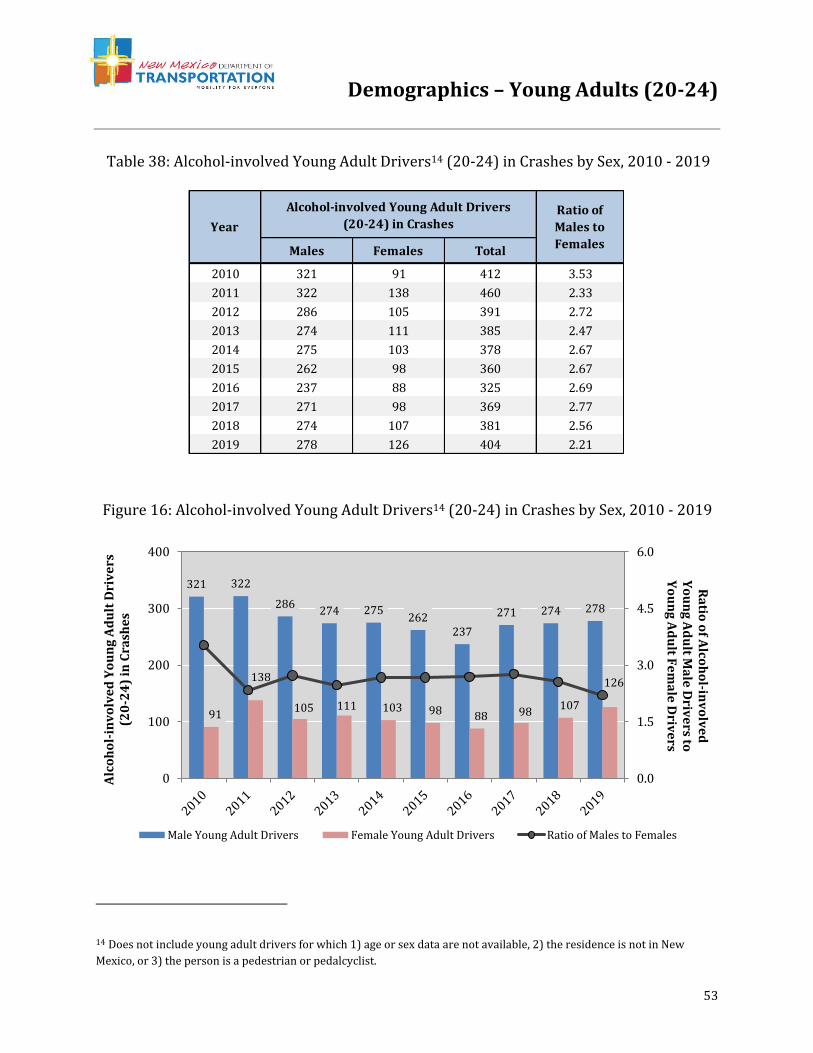
Demographics – Young Adults (20-24)
53
14 Does not include young adult drivers for which 1) age or sex data are not available, 2) the residence is not in New
Mexico, or 3) the person is a pedestrian or pedalcyclist.
Males Females Total
2010 321 91 412 3.53
2011 322 138 460 2.33
2012 286 105 391 2.72
2013 274 111 385 2.47
2014 275 103 378 2.67
2015 262 98 360 2.67
2016 237 88 325 2.69
2017 271 98 369 2.77
2018 274 107 381 2.56
2019 278 126 404 2.21
Year
Alcohol-involved Young Adult Drivers
(20-24) in CrashesRatio of
Males to
Females
321 322
286274 275
262237
271 274 278
91
138
105 111 103 98 88 98107
126
0.0
1.5
3.0
4.5
6.0
0
100
200
300
400
Ra
tio o
f Alco
ho
l-inv
olv
ed
Y
ou
ng
Ad
ult M
ale
Driv
ers to
Y
ou
ng
Ad
ult F
em
ale
Driv
ers
Alc
oh
ol-
inv
olv
ed
Yo
un
g A
du
lt D
riv
ers
(2
0-2
4)
in C
rash
es
Male Young Adult Drivers Female Young Adult Drivers Ratio of Males to Females
Table 38: Alcohol-involved Young Adult Drivers14 (20-24) in Crashes by Sex, 2010 - 2019
Figure 16: Alcohol-involved Young Adult Drivers14 (20-24) in Crashes by Sex, 2010 - 2019
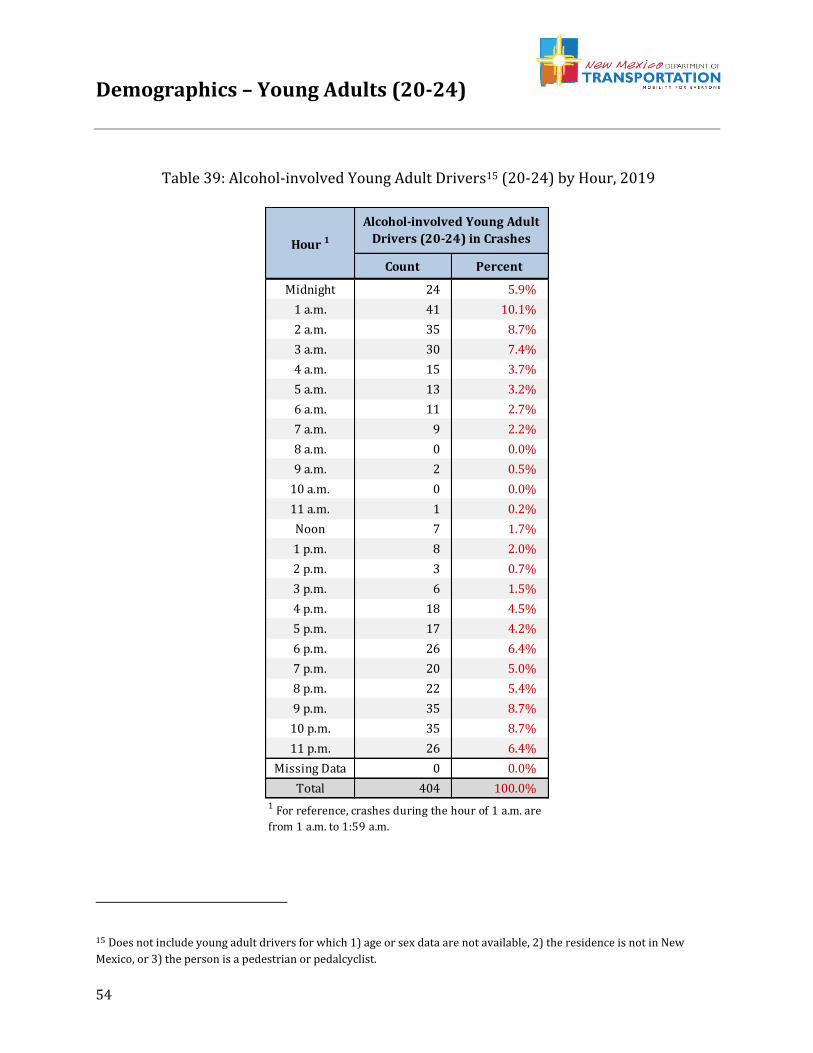
Demographics – Young Adults (20-24)
54
15 Does not include young adult drivers for which 1) age or sex data are not available, 2) the residence is not in New
Mexico, or 3) the person is a pedestrian or pedalcyclist.
Count Percent
Midnight 24 5.9%
1 a.m. 41 10.1%
2 a.m. 35 8.7%
3 a.m. 30 7.4%
4 a.m. 15 3.7%
5 a.m. 13 3.2%
6 a.m. 11 2.7%
7 a.m. 9 2.2%
8 a.m. 0 0.0%
9 a.m. 2 0.5%
10 a.m. 0 0.0%
11 a.m. 1 0.2%
Noon 7 1.7%
1 p.m. 8 2.0%
2 p.m. 3 0.7%
3 p.m. 6 1.5%
4 p.m. 18 4.5%
5 p.m. 17 4.2%
6 p.m. 26 6.4%
7 p.m. 20 5.0%
8 p.m. 22 5.4%
9 p.m. 35 8.7%
10 p.m. 35 8.7%
11 p.m. 26 6.4%
Missing Data 0 0.0%
Total 404 100.0%
Hour 1
Alcohol-involved Young Adult
Drivers (20-24) in Crashes
1 For reference, crashes during the hour of 1 a.m. are
from 1 a.m. to 1:59 a.m.
Table 39: Alcohol-involved Young Adult Drivers15 (20-24) by Hour, 2019
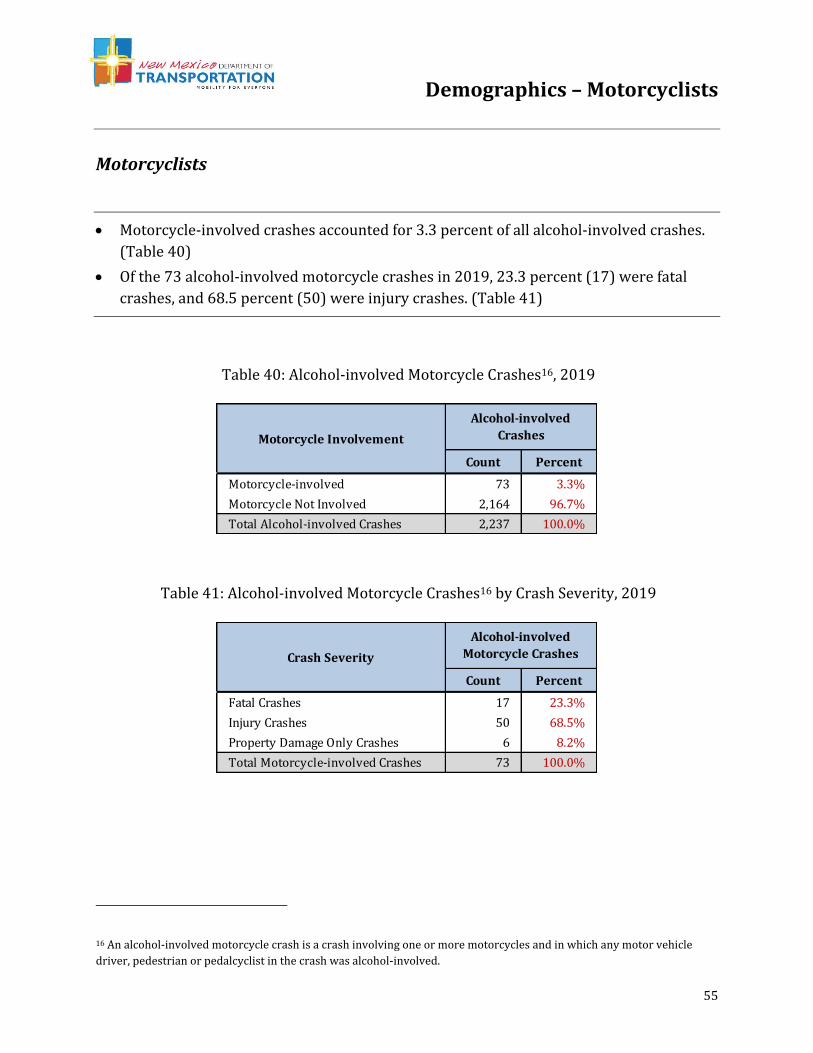
Demographics – Motorcyclists
55
Motorcyclists
• Motorcycle-involved crashes accounted for 3.3 percent of all alcohol-involved crashes.
(Table 40)
• Of the 73 alcohol-involved motorcycle crashes in 2019, 23.3 percent (17) were fatal
crashes, and 68.5 percent (50) were injury crashes. (Table 41)
16 An alcohol-involved motorcycle crash is a crash involving one or more motorcycles and in which any motor vehicle
driver, pedestrian or pedalcyclist in the crash was alcohol-involved.
Count Percent
Motorcycle-involved 73 3.3%
Motorcycle Not Involved 2,164 96.7%
Total Alcohol-involved Crashes 2,237 100.0%
Alcohol-involved
CrashesMotorcycle Involvement
Count Percent
Fatal Crashes 17 23.3%
Injury Crashes 50 68.5%
Property Damage Only Crashes 6 8.2%
Total Motorcycle-involved Crashes 73 100.0%
Crash Severity
Alcohol-involved
Motorcycle Crashes
Table 40: Alcohol-involved Motorcycle Crashes16, 2019
Table 41: Alcohol-involved Motorcycle Crashes16 by Crash Severity, 2019
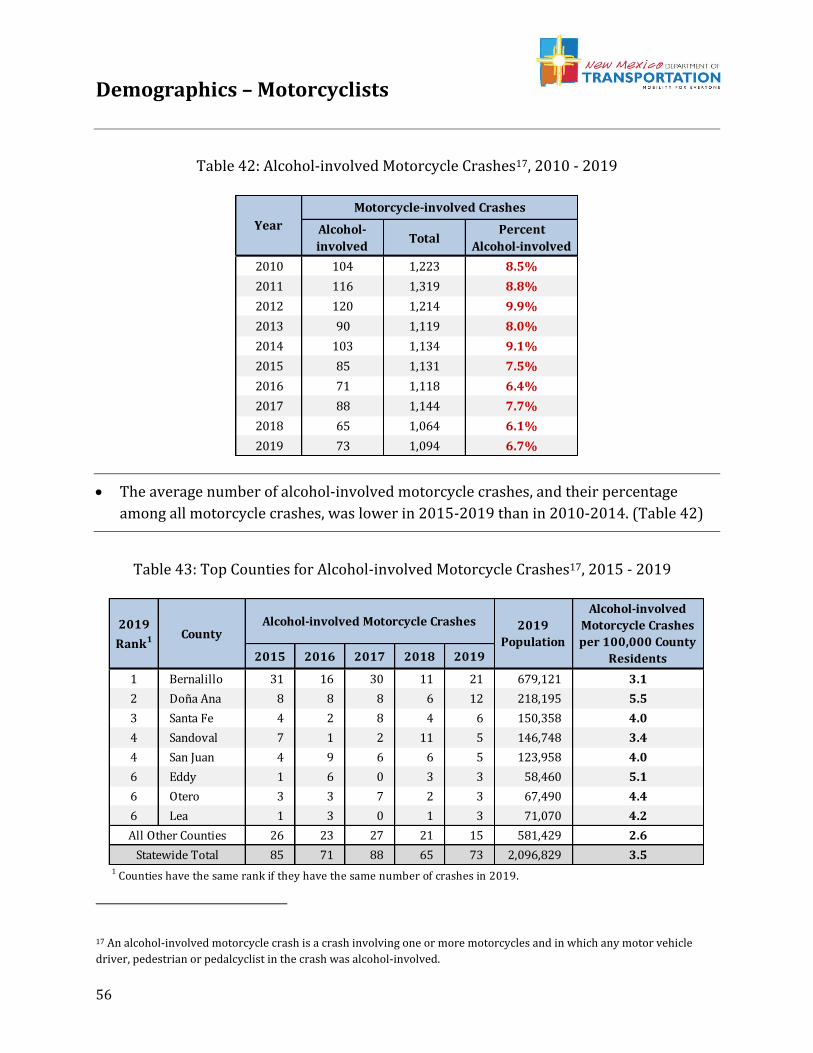
Demographics – Motorcyclists
56
• The average number of alcohol-involved motorcycle crashes, and their percentage
among all motorcycle crashes, was lower in 2015-2019 than in 2010-2014. (Table 42)
17 An alcohol-involved motorcycle crash is a crash involving one or more motorcycles and in which any motor vehicle
driver, pedestrian or pedalcyclist in the crash was alcohol-involved.
Alcohol-
involvedTotal
Percent
Alcohol-involved
2010 104 1,223 8.5%
2011 116 1,319 8.8%
2012 120 1,214 9.9%
2013 90 1,119 8.0%
2014 103 1,134 9.1%
2015 85 1,131 7.5%
2016 71 1,118 6.4%
2017 88 1,144 7.7%
2018 65 1,064 6.1%
2019 73 1,094 6.7%
Motorcycle-involved Crashes
Year
2015 2016 2017 2018 2019
1 Bernalillo 31 16 30 11 21 679,121 3.1
2 Doña Ana 8 8 8 6 12 218,195 5.5
3 Santa Fe 4 2 8 4 6 150,358 4.0
4 Sandoval 7 1 2 11 5 146,748 3.4
4 San Juan 4 9 6 6 5 123,958 4.0
6 Eddy 1 6 0 3 3 58,460 5.1
6 Otero 3 3 7 2 3 67,490 4.4
6 Lea 1 3 0 1 3 71,070 4.2
26 23 27 21 15 581,429 2.6
85 71 88 65 73 2,096,829 3.5
Alcohol-involved
Motorcycle Crashes
per 100,000 County
Residents
All Other Counties
Statewide Total1 Counties have the same rank if they have the same number of crashes in 2019.
2019
Rank1 CountyAlcohol-involved Motorcycle Crashes 2019
Population
Table 42: Alcohol-involved Motorcycle Crashes17, 2010 - 2019
Table 43: Top Counties for Alcohol-involved Motorcycle Crashes17, 2015 - 2019
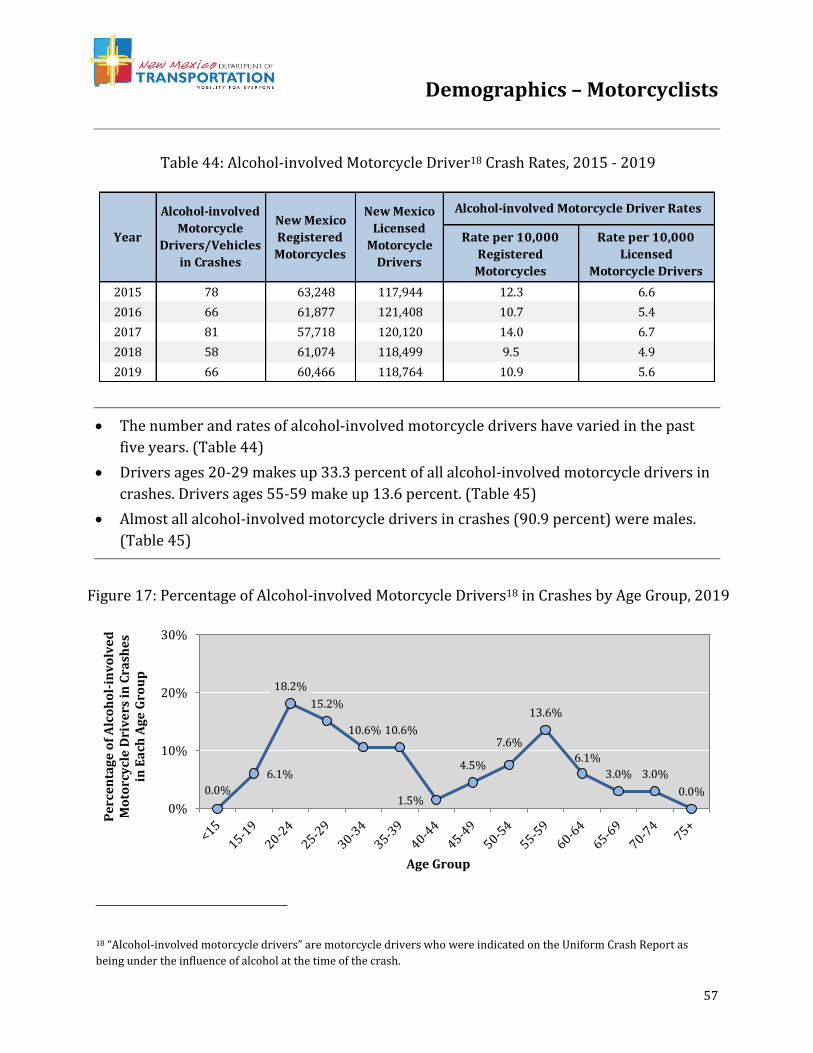
Demographics – Motorcyclists
57
• The number and rates of alcohol-involved motorcycle drivers have varied in the past
five years. (Table 44)
• Drivers ages 20-29 makes up 33.3 percent of all alcohol-involved motorcycle drivers in
crashes. Drivers ages 55-59 make up 13.6 percent. (Table 45)
• Almost all alcohol-involved motorcycle drivers in crashes (90.9 percent) were males.
(Table 45)
18 “Alcohol-involved motorcycle drivers” are motorcycle drivers who were indicated on the Uniform Crash Report as
being under the influence of alcohol at the time of the crash.
Rate per 10,000
Registered
Motorcycles
Rate per 10,000
Licensed
Motorcycle Drivers
2015 78 63,248 117,944 12.3 6.6
2016 66 61,877 121,408 10.7 5.4
2017 81 57,718 120,120 14.0 6.7
2018 58 61,074 118,499 9.5 4.9
2019 66 60,466 118,764 10.9 5.6
New Mexico
Licensed
Motorcycle
Drivers
Alcohol-involved Motorcycle Driver Rates
Year
Alcohol-involved
Motorcycle
Drivers/Vehicles
in Crashes
New Mexico
Registered
Motorcycles
0.0%
6.1%
18.2%
15.2%
10.6% 10.6%
1.5%
4.5%
7.6%
13.6%
6.1%
3.0% 3.0%
0.0%
0%
10%
20%
30%
Pe
rce
nta
ge
of
Alc
oh
ol-
inv
olv
ed
M
oto
rcy
cle
Dri
ve
rs i
n C
rash
es
in E
ach
Ag
e G
rou
p
Age Group
Table 44: Alcohol-involved Motorcycle Driver18 Crash Rates, 2015 - 2019
Figure 17: Percentage of Alcohol-involved Motorcycle Drivers18 in Crashes by Age Group, 2019
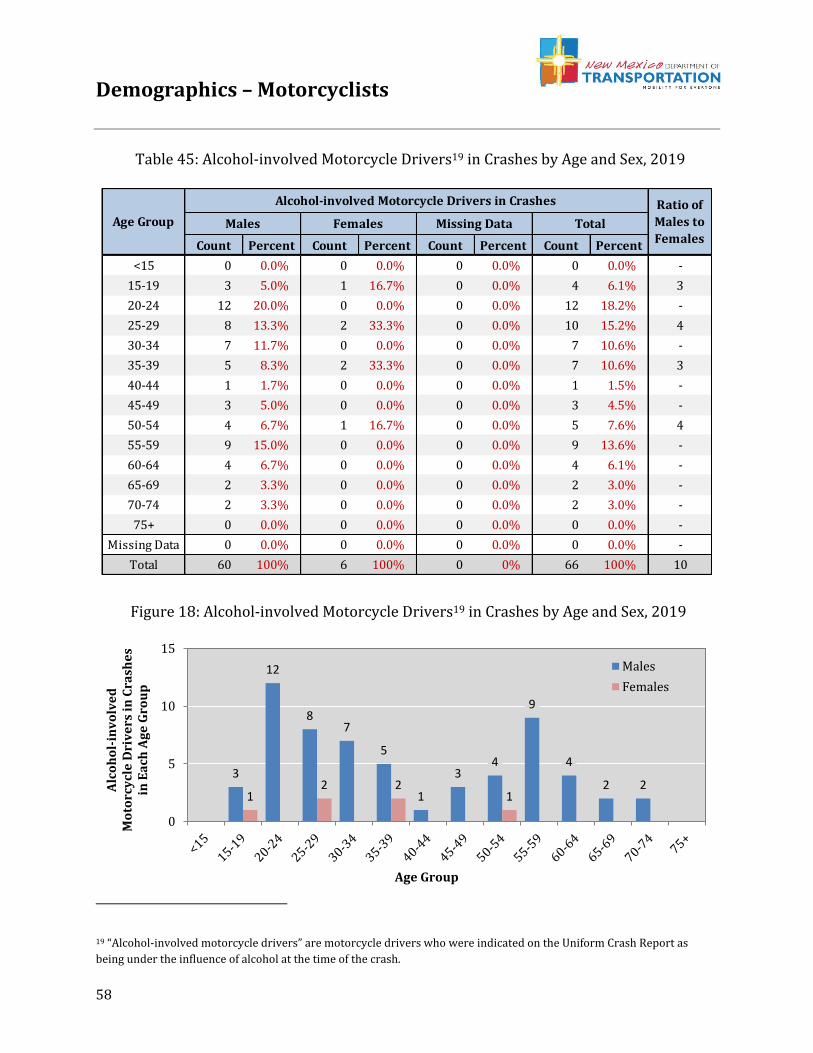
Demographics – Motorcyclists
58
19 “Alcohol-involved motorcycle drivers” are motorcycle drivers who were indicated on the Uniform Crash Report as
being under the influence of alcohol at the time of the crash.
Count Percent Count Percent Count Percent Count Percent
<15 0 0.0% 0 0.0% 0 0.0% 0 0.0% -
15-19 3 5.0% 1 16.7% 0 0.0% 4 6.1% 3
20-24 12 20.0% 0 0.0% 0 0.0% 12 18.2% -
25-29 8 13.3% 2 33.3% 0 0.0% 10 15.2% 4
30-34 7 11.7% 0 0.0% 0 0.0% 7 10.6% -
35-39 5 8.3% 2 33.3% 0 0.0% 7 10.6% 3
40-44 1 1.7% 0 0.0% 0 0.0% 1 1.5% -
45-49 3 5.0% 0 0.0% 0 0.0% 3 4.5% -
50-54 4 6.7% 1 16.7% 0 0.0% 5 7.6% 4
55-59 9 15.0% 0 0.0% 0 0.0% 9 13.6% -
60-64 4 6.7% 0 0.0% 0 0.0% 4 6.1% -
65-69 2 3.3% 0 0.0% 0 0.0% 2 3.0% -
70-74 2 3.3% 0 0.0% 0 0.0% 2 3.0% -
75+ 0 0.0% 0 0.0% 0 0.0% 0 0.0% -
Missing Data 0 0.0% 0 0.0% 0 0.0% 0 0.0% -
Total 60 100% 6 100% 0 0% 66 100% 10
Age Group
Alcohol-involved Motorcycle Drivers in Crashes Ratio of
Males to
FemalesMales Females TotalMissing Data
3
12
87
5
1
34
9
4
2 21
2 21
0
5
10
15
Alc
oh
ol-
inv
olv
ed
M
oto
rcy
cle
Dri
ve
rs i
n C
rash
es
in E
ach
Ag
e G
rou
p
Age Group
Males
Females
Table 45: Alcohol-involved Motorcycle Drivers19 in Crashes by Age and Sex, 2019
Figure 18: Alcohol-involved Motorcycle Drivers19 in Crashes by Age and Sex, 2019
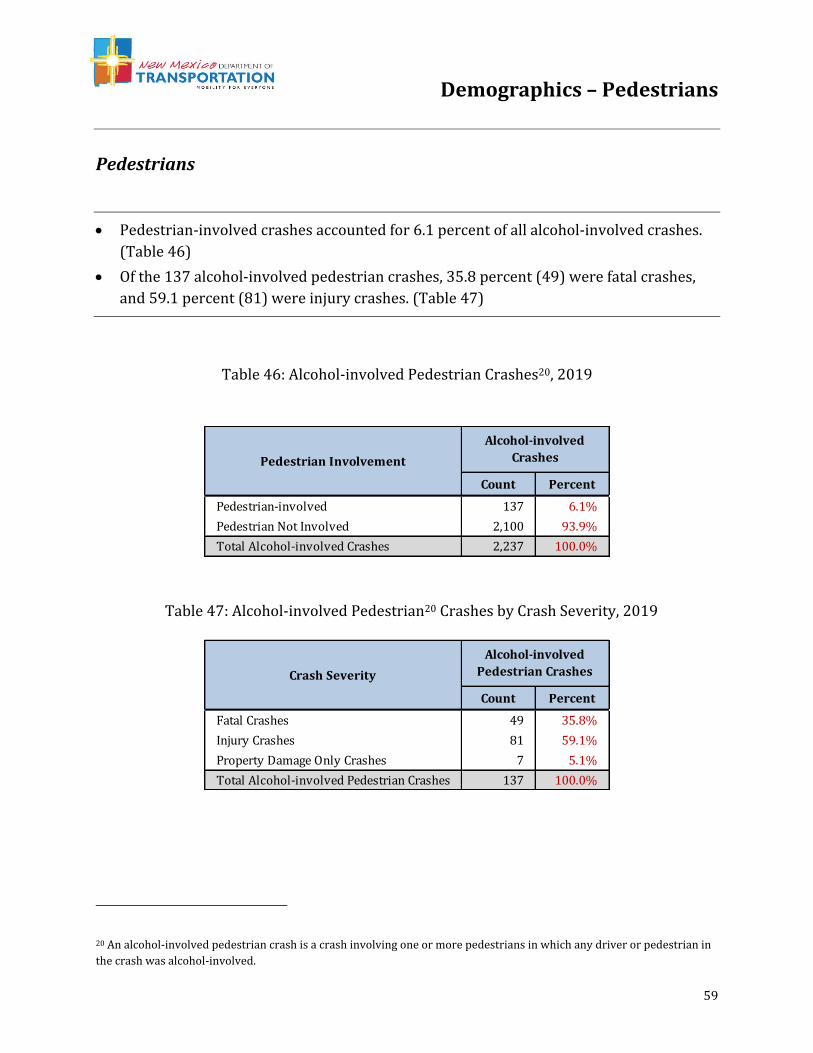
Demographics – Pedestrians
59
Pedestrians
• Pedestrian-involved crashes accounted for 6.1 percent of all alcohol-involved crashes.
(Table 46)
• Of the 137 alcohol-involved pedestrian crashes, 35.8 percent (49) were fatal crashes,
and 59.1 percent (81) were injury crashes. (Table 47)
20 An alcohol-involved pedestrian crash is a crash involving one or more pedestrians in which any driver or pedestrian in
the crash was alcohol-involved.
Count Percent
Pedestrian-involved 137 6.1%
Pedestrian Not Involved 2,100 93.9%
Total Alcohol-involved Crashes 2,237 100.0%
Pedestrian Involvement
Alcohol-involved
Crashes
Count Percent
Fatal Crashes 49 35.8%
Injury Crashes 81 59.1%
Property Damage Only Crashes 7 5.1%
Total Alcohol-involved Pedestrian Crashes 137 100.0%
Crash Severity
Alcohol-involved
Pedestrian Crashes
Table 46: Alcohol-involved Pedestrian Crashes20, 2019
Table 47: Alcohol-involved Pedestrian20 Crashes by Crash Severity, 2019
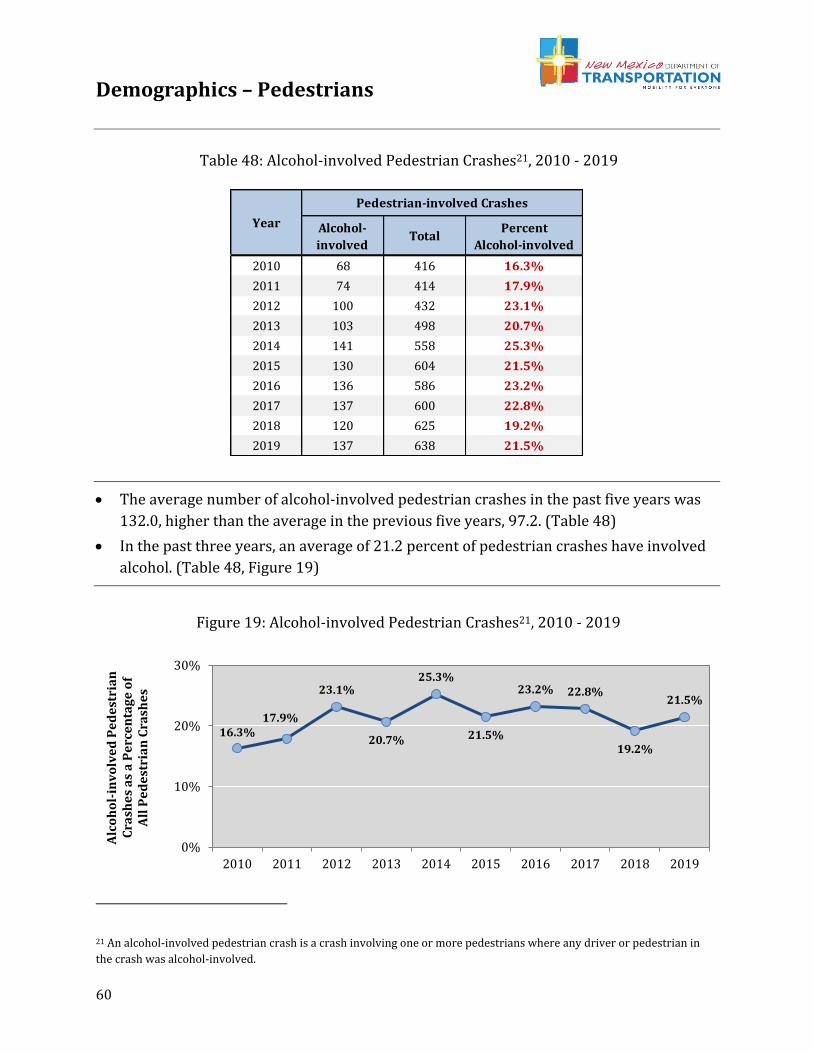
Demographics – Pedestrians
60
• The average number of alcohol-involved pedestrian crashes in the past five years was
132.0, higher than the average in the previous five years, 97.2. (Table 48)
• In the past three years, an average of 21.2 percent of pedestrian crashes have involved
alcohol. (Table 48, Figure 19)
21 An alcohol-involved pedestrian crash is a crash involving one or more pedestrians where any driver or pedestrian in
the crash was alcohol-involved.
Alcohol-
involvedTotal
Percent
Alcohol-involved
2010 68 416 16.3%
2011 74 414 17.9%
2012 100 432 23.1%
2013 103 498 20.7%
2014 141 558 25.3%
2015 130 604 21.5%
2016 136 586 23.2%
2017 137 600 22.8%
2018 120 625 19.2%
2019 137 638 21.5%
Year
Pedestrian-involved Crashes
16.3%17.9%
23.1%
20.7%
25.3%
21.5%
23.2% 22.8%
19.2%
21.5%
0%
10%
20%
30%
2010 2011 2012 2013 2014 2015 2016 2017 2018 2019
Alc
oh
ol-
inv
olv
ed
Pe
de
stri
an
C
rash
es
as
a P
erc
en
tag
e o
f A
ll P
ed
est
ria
n C
rash
es
Table 48: Alcohol-involved Pedestrian Crashes21, 2010 - 2019
Figure 19: Alcohol-involved Pedestrian Crashes21, 2010 - 2019
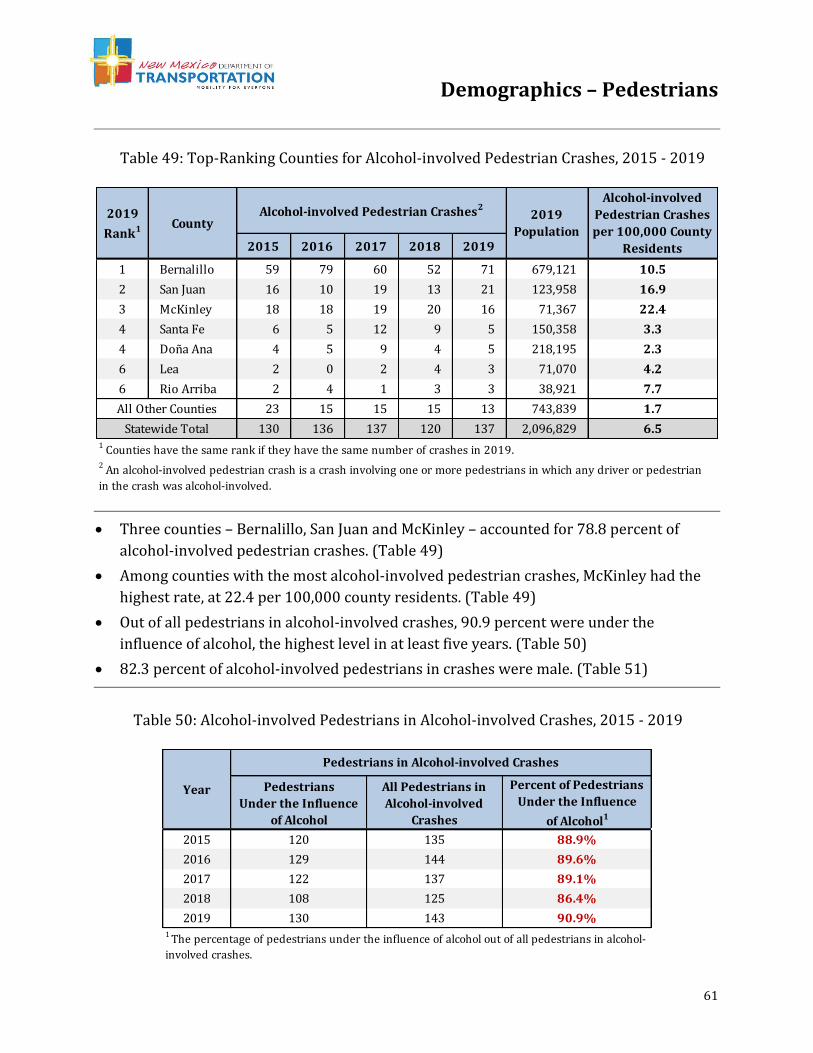
Demographics – Pedestrians
61
• Three counties – Bernalillo, San Juan and McKinley – accounted for 78.8 percent of
alcohol-involved pedestrian crashes. (Table 49)
• Among counties with the most alcohol-involved pedestrian crashes, McKinley had the
highest rate, at 22.4 per 100,000 county residents. (Table 49)
• Out of all pedestrians in alcohol-involved crashes, 90.9 percent were under the
influence of alcohol, the highest level in at least five years. (Table 50)
• 82.3 percent of alcohol-involved pedestrians in crashes were male. (Table 51)
2015 2016 2017 2018 2019
1 Bernalillo 59 79 60 52 71 679,121 10.5
2 San Juan 16 10 19 13 21 123,958 16.9
3 McKinley 18 18 19 20 16 71,367 22.4
4 Santa Fe 6 5 12 9 5 150,358 3.3
4 Doña Ana 4 5 9 4 5 218,195 2.3
6 Lea 2 0 2 4 3 71,070 4.2
6 Rio Arriba 2 4 1 3 3 38,921 7.7
23 15 15 15 13 743,839 1.7
130 136 137 120 137 2,096,829 6.51 Counties have the same rank if they have the same number of crashes in 2019.
2019
Rank1 CountyAlcohol-involved Pedestrian Crashes2
2019
Population
Alcohol-involved
Pedestrian Crashes
per 100,000 County
Residents
All Other Counties
Statewide Total
2 An alcohol-involved pedestrian crash is a crash involving one or more pedestrians in which any driver or pedestrian
in the crash was alcohol-involved.
Pedestrians
Under the Influence
of Alcohol
All Pedestrians in
Alcohol-involved
Crashes
Percent of Pedestrians
Under the Influence
of Alcohol1
2015 120 135 88.9%
2016 129 144 89.6%
2017 122 137 89.1%
2018 108 125 86.4%
2019 130 143 90.9%
Year
Pedestrians in Alcohol-involved Crashes
1 The percentage of pedestrians under the influence of alcohol out of all pedestrians in alcohol-
involved crashes.
Table 49: Top-Ranking Counties for Alcohol-involved Pedestrian Crashes, 2015 - 2019
Table 50: Alcohol-involved Pedestrians in Alcohol-involved Crashes, 2015 - 2019
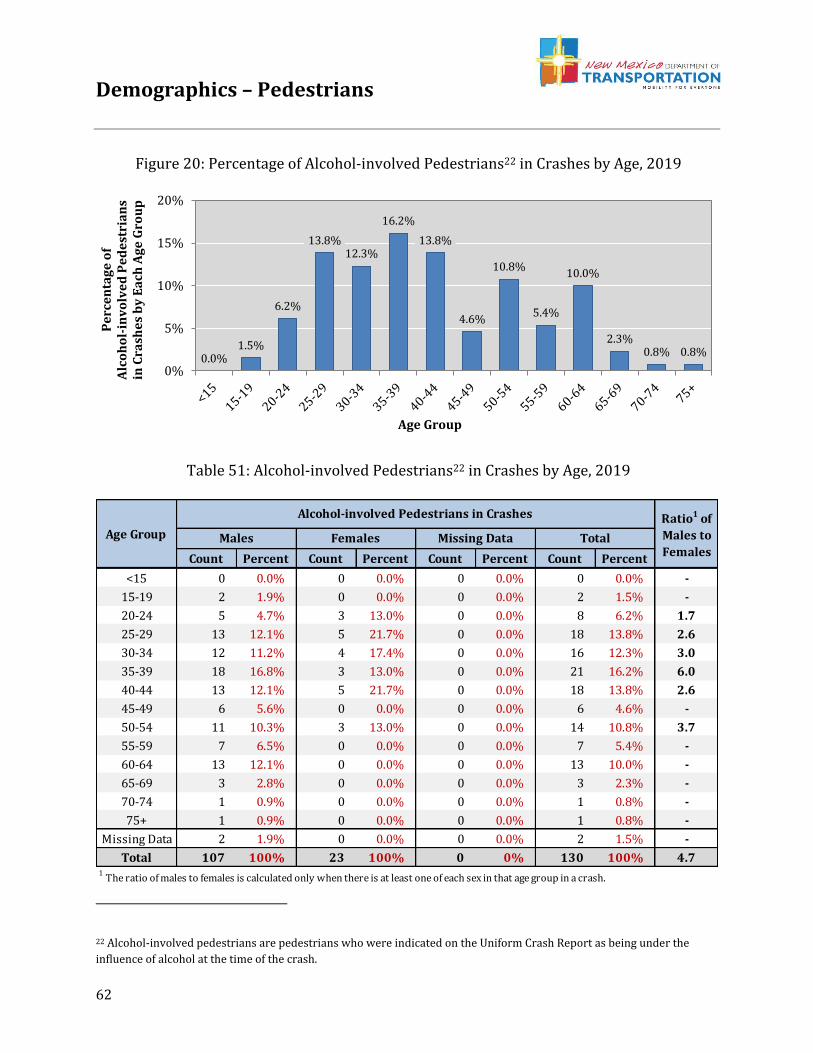
Demographics – Pedestrians
62
22 Alcohol-involved pedestrians are pedestrians who were indicated on the Uniform Crash Report as being under the
influence of alcohol at the time of the crash.
0.0%1.5%
6.2%
13.8%12.3%
16.2%
13.8%
4.6%
10.8%
5.4%
10.0%
2.3%0.8% 0.8%
0%
5%
10%
15%
20%
Pe
rce
nta
ge
of
Alc
oh
ol-
inv
olv
ed
Pe
de
stri
an
s in
Cra
she
s b
y E
ach
Ag
e G
rou
p
Age Group
Count Percent Count Percent Count Percent Count Percent
<15 0 0.0% 0 0.0% 0 0.0% 0 0.0% -
15-19 2 1.9% 0 0.0% 0 0.0% 2 1.5% -
20-24 5 4.7% 3 13.0% 0 0.0% 8 6.2% 1.7
25-29 13 12.1% 5 21.7% 0 0.0% 18 13.8% 2.6
30-34 12 11.2% 4 17.4% 0 0.0% 16 12.3% 3.0
35-39 18 16.8% 3 13.0% 0 0.0% 21 16.2% 6.0
40-44 13 12.1% 5 21.7% 0 0.0% 18 13.8% 2.6
45-49 6 5.6% 0 0.0% 0 0.0% 6 4.6% -
50-54 11 10.3% 3 13.0% 0 0.0% 14 10.8% 3.7
55-59 7 6.5% 0 0.0% 0 0.0% 7 5.4% -
60-64 13 12.1% 0 0.0% 0 0.0% 13 10.0% -
65-69 3 2.8% 0 0.0% 0 0.0% 3 2.3% -
70-74 1 0.9% 0 0.0% 0 0.0% 1 0.8% -
75+ 1 0.9% 0 0.0% 0 0.0% 1 0.8% -
Missing Data 2 1.9% 0 0.0% 0 0.0% 2 1.5% -
Total 107 100% 23 100% 0 0% 130 100% 4.71 The ratio of males to females is calculated only when there is at least one of each sex in that age group in a crash.
Age Group
Alcohol-involved Pedestrians in Crashes Ratio1 of
Males to
FemalesMales Females Missing Data Total
Figure 20: Percentage of Alcohol-involved Pedestrians22 in Crashes by Age, 2019
Table 51: Alcohol-involved Pedestrians22 in Crashes by Age, 2019
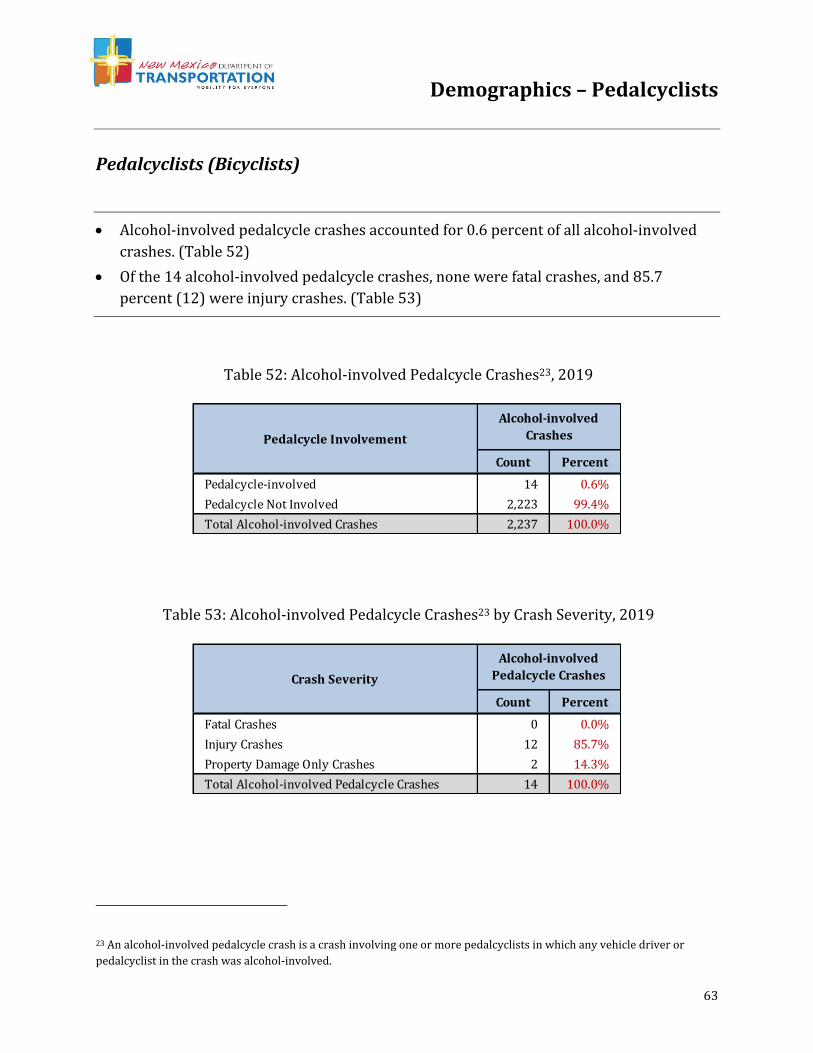
Demographics – Pedalcyclists
63
Pedalcyclists (Bicyclists)
• Alcohol-involved pedalcycle crashes accounted for 0.6 percent of all alcohol-involved
crashes. (Table 52)
• Of the 14 alcohol-involved pedalcycle crashes, none were fatal crashes, and 85.7
percent (12) were injury crashes. (Table 53)
23 An alcohol-involved pedalcycle crash is a crash involving one or more pedalcyclists in which any vehicle driver or
pedalcyclist in the crash was alcohol-involved.
Count Percent
Pedalcycle-involved 14 0.6%
Pedalcycle Not Involved 2,223 99.4%
Total Alcohol-involved Crashes 2,237 100.0%
Pedalcycle Involvement
Alcohol-involved
Crashes
Count Percent
Fatal Crashes 0 0.0%
Injury Crashes 12 85.7%
Property Damage Only Crashes 2 14.3%
Total Alcohol-involved Pedalcycle Crashes 14 100.0%
Crash Severity
Alcohol-involved
Pedalcycle Crashes
Table 52: Alcohol-involved Pedalcycle Crashes23, 2019
Table 53: Alcohol-involved Pedalcycle Crashes23 by Crash Severity, 2019
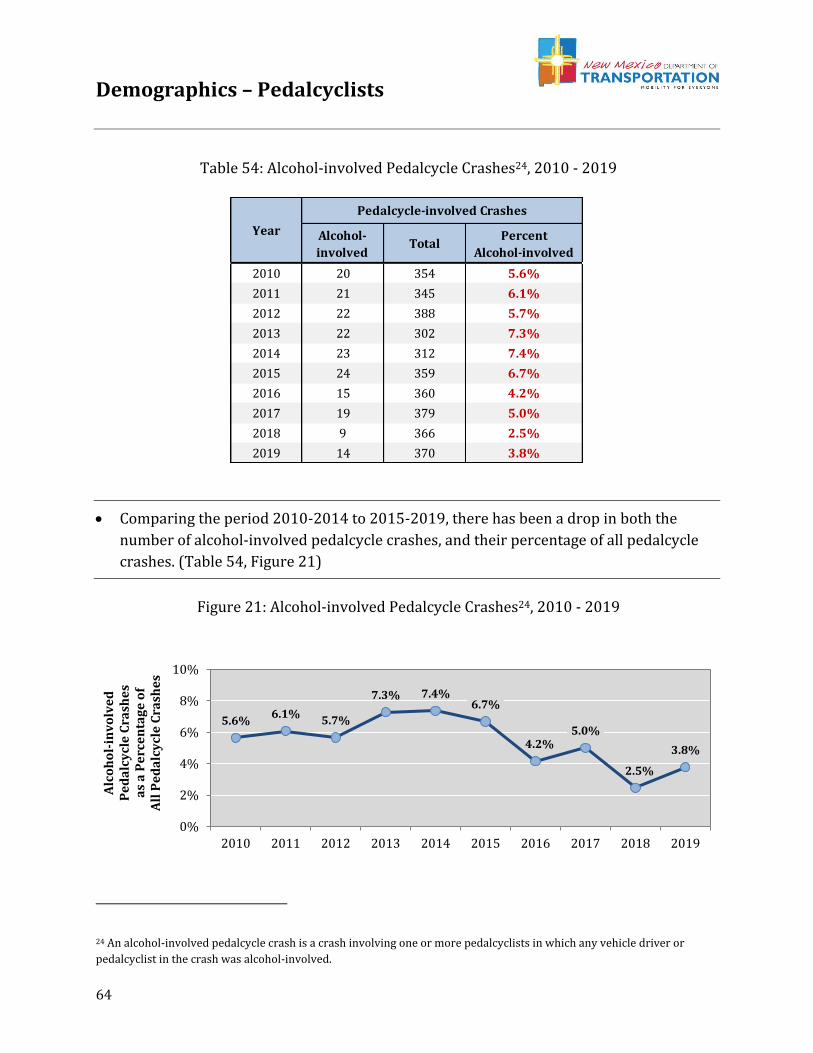
Demographics – Pedalcyclists
64
• Comparing the period 2010-2014 to 2015-2019, there has been a drop in both the
number of alcohol-involved pedalcycle crashes, and their percentage of all pedalcycle
crashes. (Table 54, Figure 21)
24 An alcohol-involved pedalcycle crash is a crash involving one or more pedalcyclists in which any vehicle driver or
pedalcyclist in the crash was alcohol-involved.
Alcohol-
involvedTotal
Percent
Alcohol-involved
2010 20 354 5.6%
2011 21 345 6.1%
2012 22 388 5.7%
2013 22 302 7.3%
2014 23 312 7.4%
2015 24 359 6.7%
2016 15 360 4.2%
2017 19 379 5.0%
2018 9 366 2.5%
2019 14 370 3.8%
Year
Pedalcycle-involved Crashes
5.6%6.1%
5.7%
7.3% 7.4%6.7%
4.2%5.0%
2.5%
3.8%
0%
2%
4%
6%
8%
10%
2010 2011 2012 2013 2014 2015 2016 2017 2018 2019
Alc
oh
ol-
inv
olv
ed
P
ed
alc
ycl
e C
rash
es
as
a P
erc
en
tag
e o
f A
ll P
ed
alc
ycl
e C
rash
es
Table 54: Alcohol-involved Pedalcycle Crashes24, 2010 - 2019
Figure 21: Alcohol-involved Pedalcycle Crashes24, 2010 - 2019
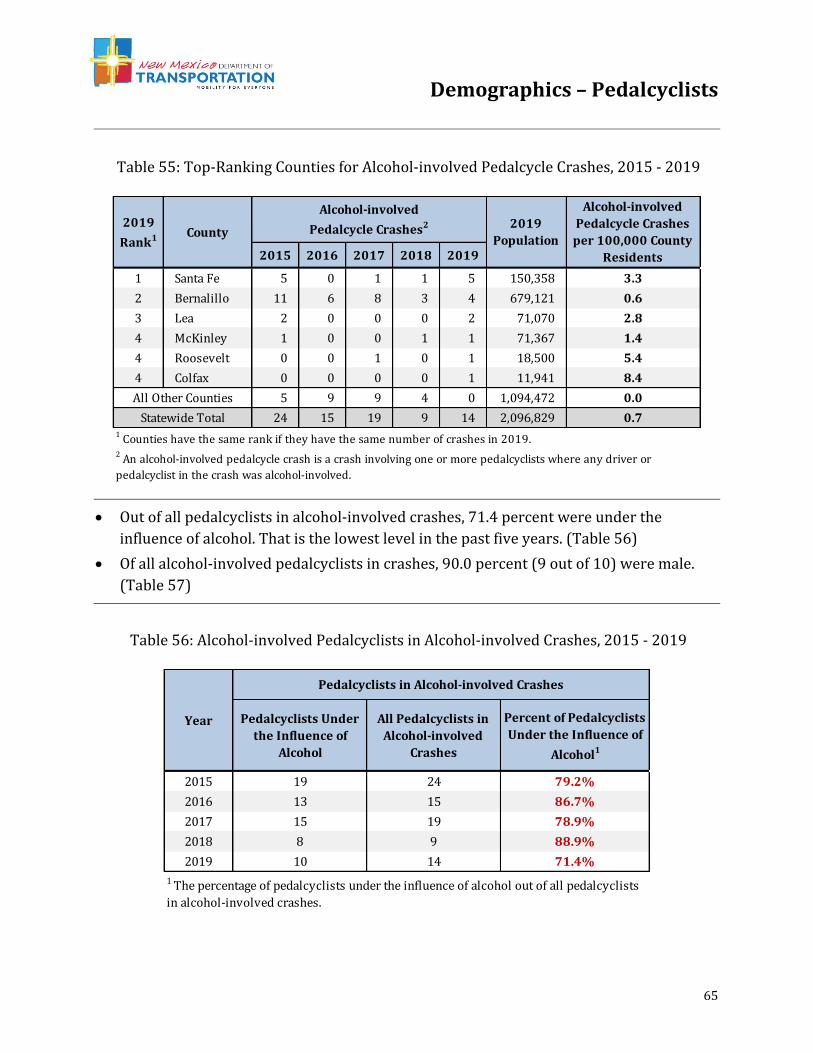
Demographics – Pedalcyclists
65
• Out of all pedalcyclists in alcohol-involved crashes, 71.4 percent were under the
influence of alcohol. That is the lowest level in the past five years. (Table 56)
• Of all alcohol-involved pedalcyclists in crashes, 90.0 percent (9 out of 10) were male.
(Table 57)
2015 2016 2017 2018 2019
1 Santa Fe 5 0 1 1 5 150,358 3.3
2 Bernalillo 11 6 8 3 4 679,121 0.6
3 Lea 2 0 0 0 2 71,070 2.8
4 McKinley 1 0 0 1 1 71,367 1.4
4 Roosevelt 0 0 1 0 1 18,500 5.4
4 Colfax 0 0 0 0 1 11,941 8.4
5 9 9 4 0 1,094,472 0.0
24 15 19 9 14 2,096,829 0.71 Counties have the same rank if they have the same number of crashes in 2019.
Alcohol-involved
Pedalcycle Crashes
per 100,000 County
Residents
2019
Population
All Other Counties
Statewide Total
2 An alcohol-involved pedalcycle crash is a crash involving one or more pedalcyclists where any driver or
pedalcyclist in the crash was alcohol-involved.
2019
Rank1 County
Alcohol-involved
Pedalcycle Crashes2
Pedalcyclists Under
the Influence of
Alcohol
All Pedalcyclists in
Alcohol-involved
Crashes
Percent of Pedalcyclists
Under the Influence of
Alcohol1
2015 19 24 79.2%
2016 13 15 86.7%
2017 15 19 78.9%
2018 8 9 88.9%
2019 10 14 71.4%
Year
Pedalcyclists in Alcohol-involved Crashes
1 The percentage of pedalcyclists under the influence of alcohol out of all pedalcyclists
in alcohol-involved crashes.
Table 55: Top-Ranking Counties for Alcohol-involved Pedalcycle Crashes, 2015 - 2019
Table 56: Alcohol-involved Pedalcyclists in Alcohol-involved Crashes, 2015 - 2019
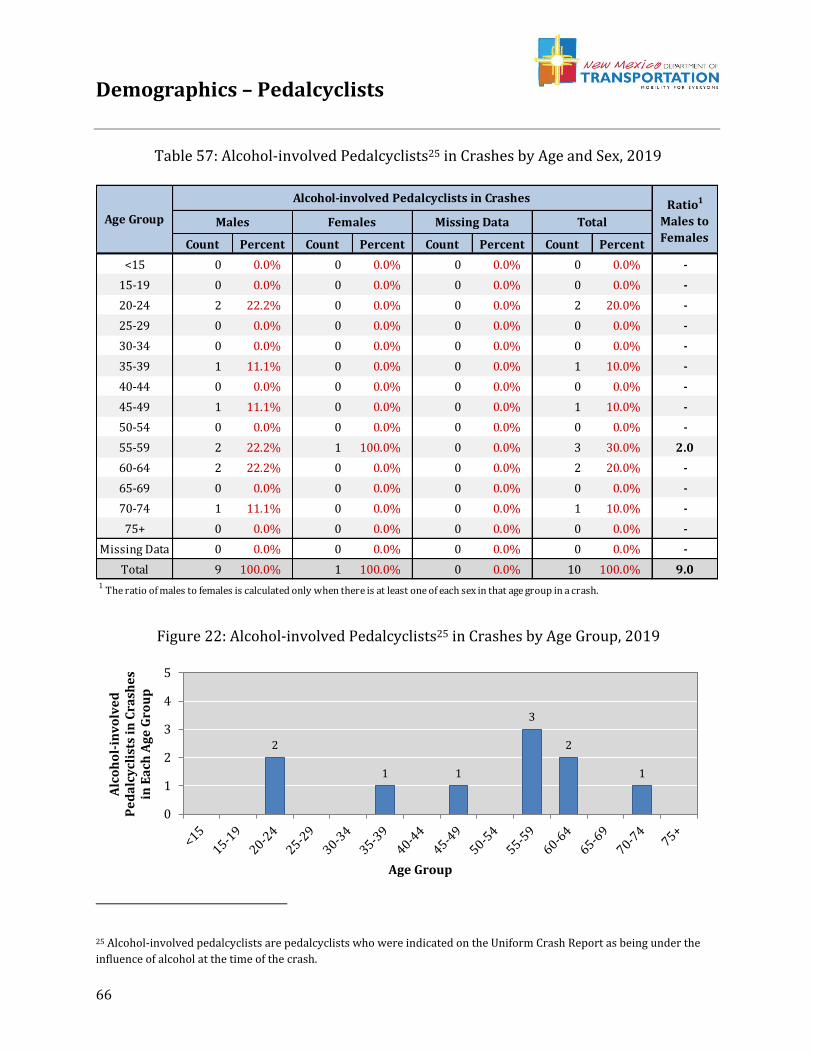
Demographics – Pedalcyclists
66
25 Alcohol-involved pedalcyclists are pedalcyclists who were indicated on the Uniform Crash Report as being under the
influence of alcohol at the time of the crash.
Count Percent Count Percent Count Percent Count Percent
<15 0 0.0% 0 0.0% 0 0.0% 0 0.0% -
15-19 0 0.0% 0 0.0% 0 0.0% 0 0.0% -
20-24 2 22.2% 0 0.0% 0 0.0% 2 20.0% -
25-29 0 0.0% 0 0.0% 0 0.0% 0 0.0% -
30-34 0 0.0% 0 0.0% 0 0.0% 0 0.0% -
35-39 1 11.1% 0 0.0% 0 0.0% 1 10.0% -
40-44 0 0.0% 0 0.0% 0 0.0% 0 0.0% -
45-49 1 11.1% 0 0.0% 0 0.0% 1 10.0% -
50-54 0 0.0% 0 0.0% 0 0.0% 0 0.0% -
55-59 2 22.2% 1 100.0% 0 0.0% 3 30.0% 2.0
60-64 2 22.2% 0 0.0% 0 0.0% 2 20.0% -
65-69 0 0.0% 0 0.0% 0 0.0% 0 0.0% -
70-74 1 11.1% 0 0.0% 0 0.0% 1 10.0% -
75+ 0 0.0% 0 0.0% 0 0.0% 0 0.0% -
Missing Data 0 0.0% 0 0.0% 0 0.0% 0 0.0% -
Total 9 100.0% 1 100.0% 0 0.0% 10 100.0% 9.01 The ratio of males to females is calculated only when there is at least one of each sex in that age group in a crash.
Age Group
Alcohol-involved Pedalcyclists in CrashesRatio1
Males to
FemalesMales Females Missing Data Total
2
1 1
3
2
1
0
1
2
3
4
5
Alc
oh
ol-
inv
olv
ed
P
ed
alc
ycl
ists
in
Cra
she
s in
Ea
ch A
ge
Gro
up
Age Group
Table 57: Alcohol-involved Pedalcyclists25 in Crashes by Age and Sex, 2019
Figure 22: Alcohol-involved Pedalcyclists25 in Crashes by Age Group, 2019
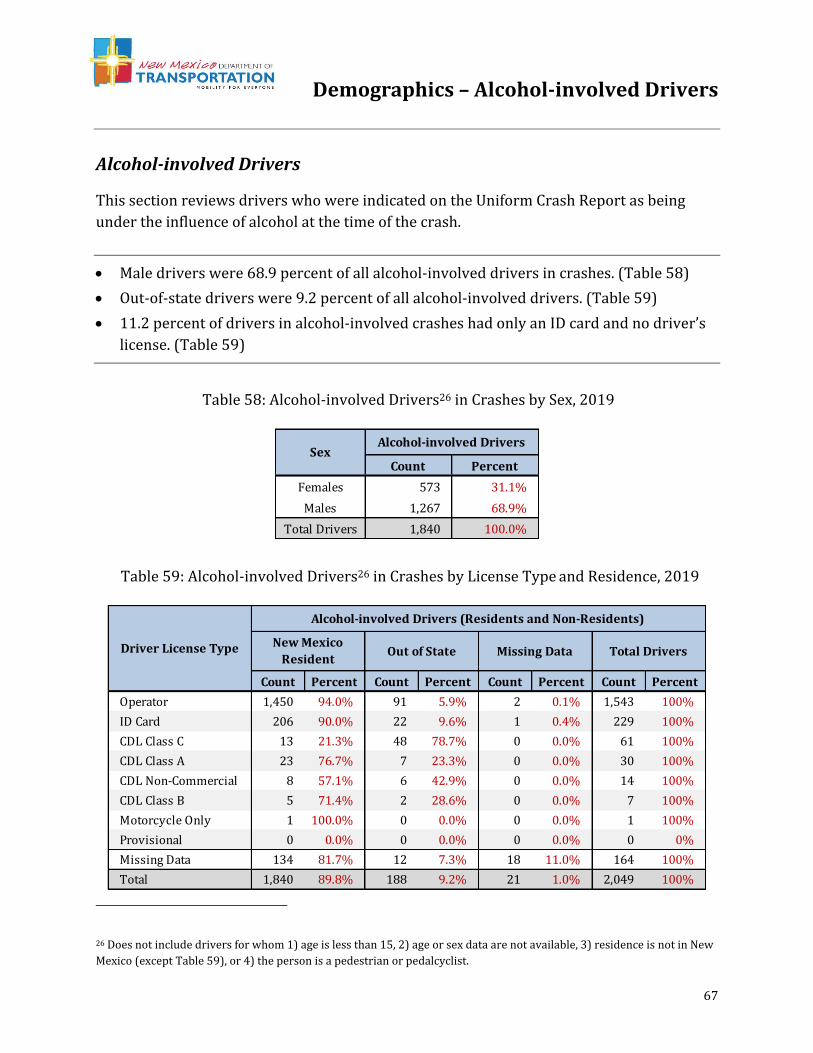
Demographics – Alcohol-involved Drivers
67
Alcohol-involved Drivers
This section reviews drivers who were indicated on the Uniform Crash Report as being
under the influence of alcohol at the time of the crash.
• Male drivers were 68.9 percent of all alcohol-involved drivers in crashes. (Table 58)
• Out-of-state drivers were 9.2 percent of all alcohol-involved drivers. (Table 59)
• 11.2 percent of drivers in alcohol-involved crashes had only an ID card and no driver’s
license. (Table 59)
26 Does not include drivers for whom 1) age is less than 15, 2) age or sex data are not available, 3) residence is not in New
Mexico (except Table 59), or 4) the person is a pedestrian or pedalcyclist.
Count Percent
Females 573 31.1%
Males 1,267 68.9%
Total Drivers 1,840 100.0%
Alcohol-involved DriversSex
Count Percent Count Percent Count Percent Count Percent
Operator 1,450 94.0% 91 5.9% 2 0.1% 1,543 100%
ID Card 206 90.0% 22 9.6% 1 0.4% 229 100%
CDL Class C 13 21.3% 48 78.7% 0 0.0% 61 100%
CDL Class A 23 76.7% 7 23.3% 0 0.0% 30 100%
CDL Non-Commercial 8 57.1% 6 42.9% 0 0.0% 14 100%
CDL Class B 5 71.4% 2 28.6% 0 0.0% 7 100%
Motorcycle Only 1 100.0% 0 0.0% 0 0.0% 1 100%
Provisional 0 0.0% 0 0.0% 0 0.0% 0 0%
Missing Data 134 81.7% 12 7.3% 18 11.0% 164 100%
Total 1,840 89.8% 188 9.2% 21 1.0% 2,049 100%
New Mexico
Resident Out of State Missing Data Total DriversDriver License Type
Alcohol-involved Drivers (Residents and Non-Residents)
Table 58: Alcohol-involved Drivers26 in Crashes by Sex, 2019
Table 59: Alcohol-involved Drivers26 in Crashes by License Type and Residence, 2019
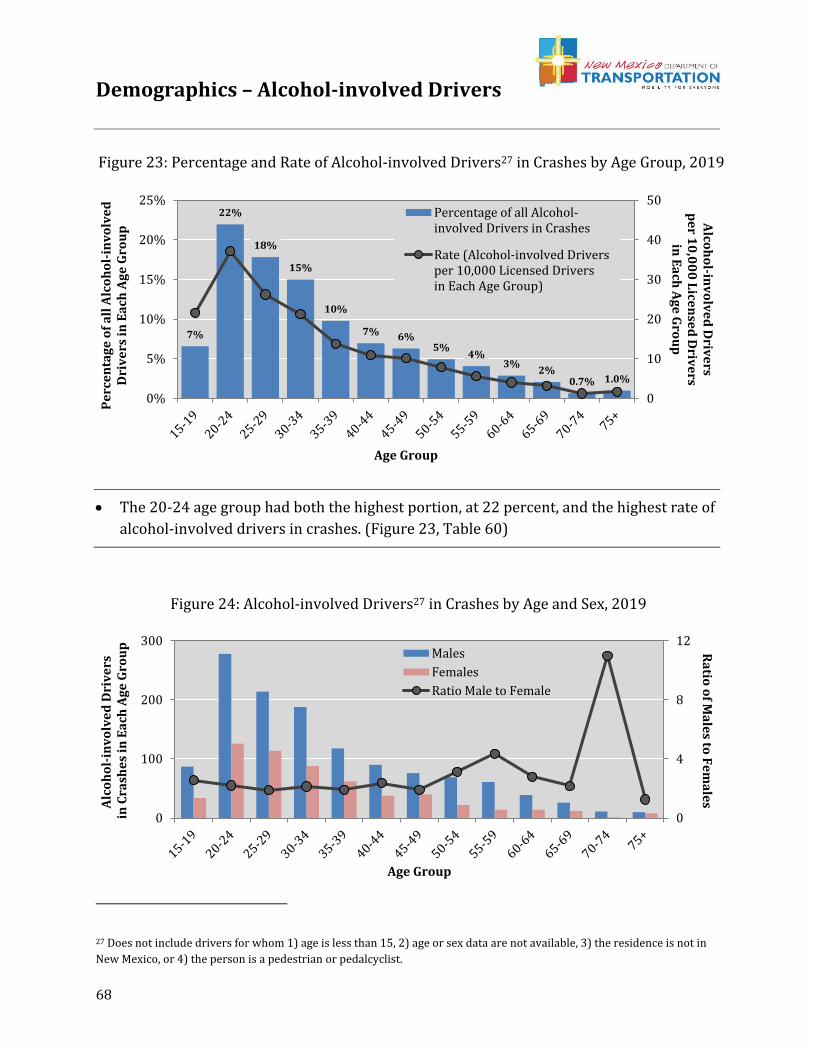
Demographics – Alcohol-involved Drivers
68
• The 20-24 age group had both the highest portion, at 22 percent, and the highest rate of
alcohol-involved drivers in crashes. (Figure 23, Table 60)
27 Does not include drivers for whom 1) age is less than 15, 2) age or sex data are not available, 3) the residence is not in
New Mexico, or 4) the person is a pedestrian or pedalcyclist.
7%
22%
18%
15%
10%
7% 6%5%
4%3%
2%0.7% 1.0%
0
10
20
30
40
50
0%
5%
10%
15%
20%
25%
Alco
ho
l-inv
olv
ed
Driv
ers
pe
r 10
,00
0 L
icen
sed
Driv
ers
in E
ach
Ag
e G
rou
p
Pe
rce
nta
ge
of
all
Alc
oh
ol-
inv
olv
ed
D
riv
ers
in
Ea
ch A
ge
Gro
up
Age Group
Percentage of all Alcohol-involved Drivers in Crashes
Rate (Alcohol-involved Driversper 10,000 Licensed Driversin Each Age Group)
0
4
8
12
0
100
200
300
Ra
tio o
f Ma
les to
Fe
ma
lesA
lco
ho
l-in
vo
lve
d D
riv
ers
in
Cra
she
s in
Ea
ch A
ge
Gro
up
Age Group
Males
Females
Ratio Male to Female
Figure 23: Percentage and Rate of Alcohol-involved Drivers27 in Crashes by Age Group, 2019
Figure 24: Alcohol-involved Drivers27 in Crashes by Age and Sex, 2019
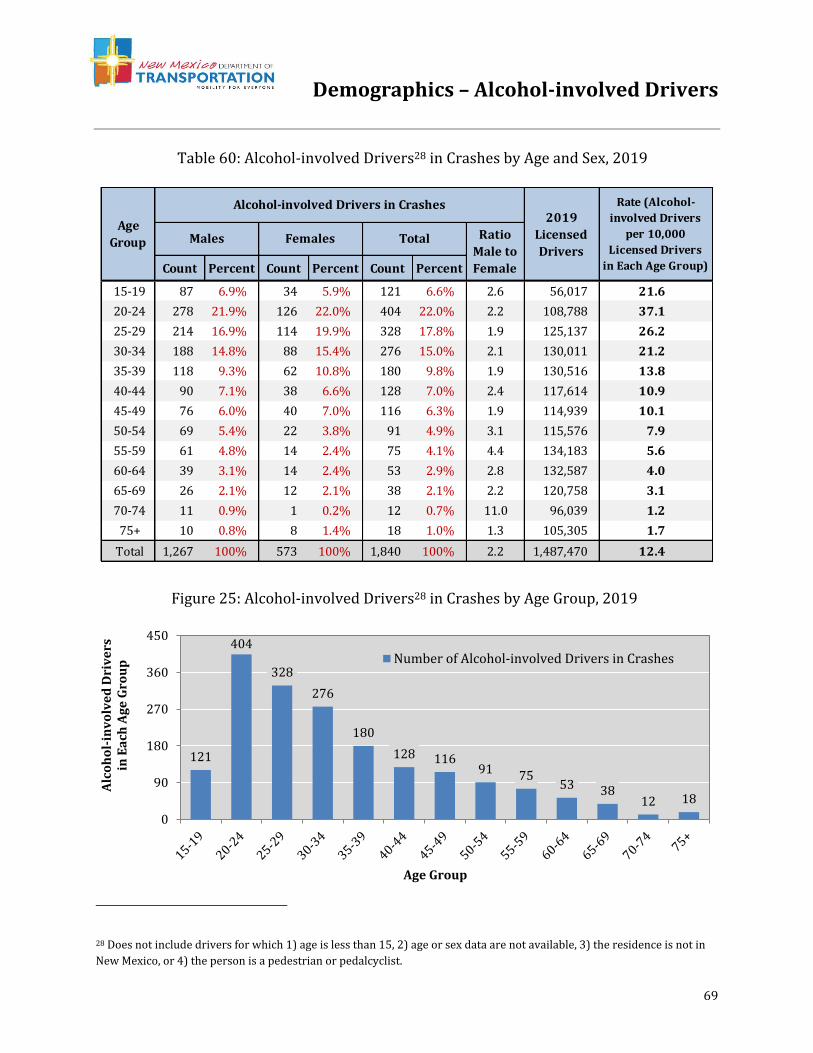
Demographics – Alcohol-involved Drivers
69
28 Does not include drivers for which 1) age is less than 15, 2) age or sex data are not available, 3) the residence is not in
New Mexico, or 4) the person is a pedestrian or pedalcyclist.
Count Percent Count Percent Count Percent
15-19 87 6.9% 34 5.9% 121 6.6% 2.6 56,017 21.6
20-24 278 21.9% 126 22.0% 404 22.0% 2.2 108,788 37.1
25-29 214 16.9% 114 19.9% 328 17.8% 1.9 125,137 26.2
30-34 188 14.8% 88 15.4% 276 15.0% 2.1 130,011 21.2
35-39 118 9.3% 62 10.8% 180 9.8% 1.9 130,516 13.8
40-44 90 7.1% 38 6.6% 128 7.0% 2.4 117,614 10.9
45-49 76 6.0% 40 7.0% 116 6.3% 1.9 114,939 10.1
50-54 69 5.4% 22 3.8% 91 4.9% 3.1 115,576 7.9
55-59 61 4.8% 14 2.4% 75 4.1% 4.4 134,183 5.6
60-64 39 3.1% 14 2.4% 53 2.9% 2.8 132,587 4.0
65-69 26 2.1% 12 2.1% 38 2.1% 2.2 120,758 3.1
70-74 11 0.9% 1 0.2% 12 0.7% 11.0 96,039 1.2
75+ 10 0.8% 8 1.4% 18 1.0% 1.3 105,305 1.7
Total 1,267 100% 573 100% 1,840 100% 2.2 1,487,470 12.4
Age
Group Males Females
Alcohol-involved Drivers in Crashes
Ratio
Male to
Female
Total
2019
Licensed
Drivers
Rate (Alcohol-
involved Drivers
per 10,000
Licensed Drivers
in Each Age Group)
121
404
328
276
180
128 11691 75
53 3812 18
0
90
180
270
360
450
Alc
oh
ol-
inv
olv
ed
Dri
ve
rs
in E
ach
Ag
e G
rou
p
Age Group
Number of Alcohol-involved Drivers in Crashes
Table 60: Alcohol-involved Drivers28 in Crashes by Age and Sex, 2019
Figure 25: Alcohol-involved Drivers28 in Crashes by Age Group, 2019
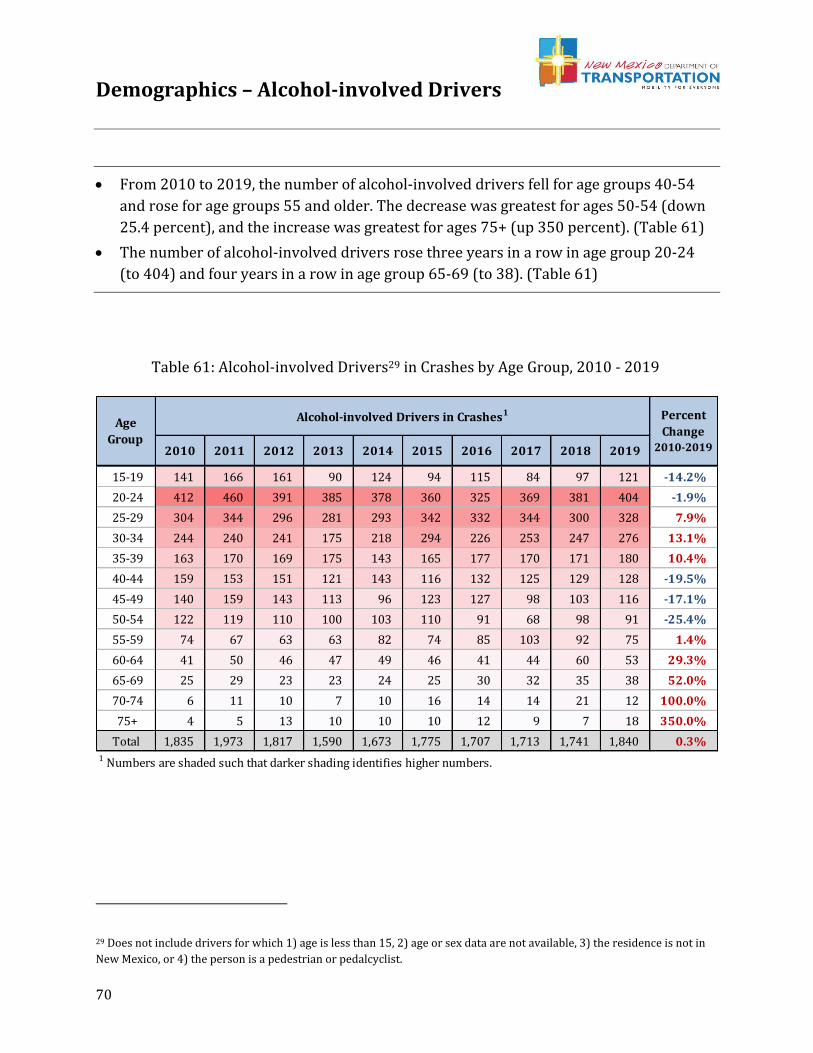
Demographics – Alcohol-involved Drivers
70
• From 2010 to 2019, the number of alcohol-involved drivers fell for age groups 40-54
and rose for age groups 55 and older. The decrease was greatest for ages 50-54 (down
25.4 percent), and the increase was greatest for ages 75+ (up 350 percent). (Table 61)
• The number of alcohol-involved drivers rose three years in a row in age group 20-24
(to 404) and four years in a row in age group 65-69 (to 38). (Table 61)
29 Does not include drivers for which 1) age is less than 15, 2) age or sex data are not available, 3) the residence is not in
New Mexico, or 4) the person is a pedestrian or pedalcyclist.
2010 2011 2012 2013 2014 2015 2016 2017 2018 2019
15-19 141 166 161 90 124 94 115 84 97 121 -14.2%
20-24 412 460 391 385 378 360 325 369 381 404 -1.9%
25-29 304 344 296 281 293 342 332 344 300 328 7.9%
30-34 244 240 241 175 218 294 226 253 247 276 13.1%
35-39 163 170 169 175 143 165 177 170 171 180 10.4%
40-44 159 153 151 121 143 116 132 125 129 128 -19.5%
45-49 140 159 143 113 96 123 127 98 103 116 -17.1%
50-54 122 119 110 100 103 110 91 68 98 91 -25.4%
55-59 74 67 63 63 82 74 85 103 92 75 1.4%
60-64 41 50 46 47 49 46 41 44 60 53 29.3%
65-69 25 29 23 23 24 25 30 32 35 38 52.0%
70-74 6 11 10 7 10 16 14 14 21 12 100.0%
75+ 4 5 13 10 10 10 12 9 7 18 350.0%
Total 1,835 1,973 1,817 1,590 1,673 1,775 1,707 1,713 1,741 1,840 0.3%1 Numbers are shaded such that darker shading identifies higher numbers.
Age
Group
Alcohol-involved Drivers in Crashes1 Percent
Change 2010-2019
Table 61: Alcohol-involved Drivers29 in Crashes by Age Group, 2010 - 2019
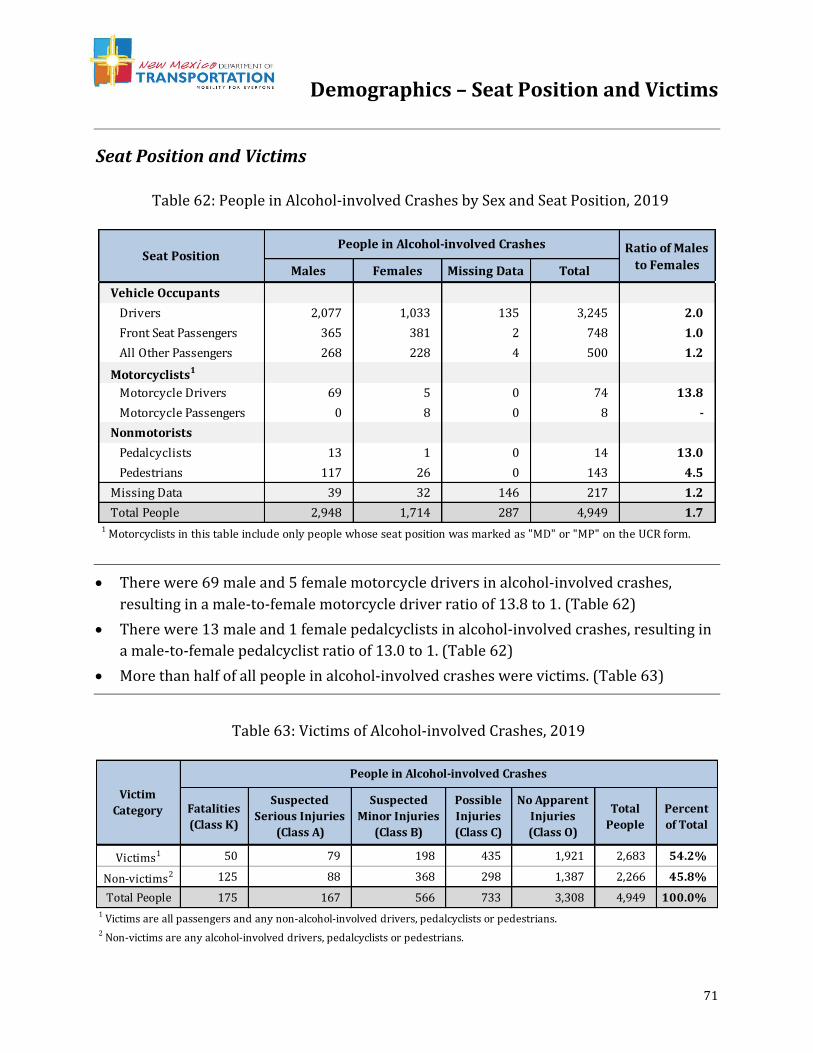
Demographics – Seat Position and Victims
71
Seat Position and Victims
• There were 69 male and 5 female motorcycle drivers in alcohol-involved crashes,
resulting in a male-to-female motorcycle driver ratio of 13.8 to 1. (Table 62)
• There were 13 male and 1 female pedalcyclists in alcohol-involved crashes, resulting in
a male-to-female pedalcyclist ratio of 13.0 to 1. (Table 62)
• More than half of all people in alcohol-involved crashes were victims. (Table 63)
Males Females Missing Data Total
Vehicle Occupants
Drivers 2,077 1,033 135 3,245 2.0
Front Seat Passengers 365 381 2 748 1.0
All Other Passengers 268 228 4 500 1.2
Motorcyclists1
Motorcycle Drivers 69 5 0 74 13.8
Motorcycle Passengers 0 8 0 8 -
Nonmotorists
Pedalcyclists 13 1 0 14 13.0
Pedestrians 117 26 0 143 4.5
Missing Data 39 32 146 217 1.2
Total People 2,948 1,714 287 4,949 1.71 Motorcyclists in this table include only people whose seat position was marked as "MD" or "MP" on the UCR form.
Seat PositionPeople in Alcohol-involved Crashes Ratio of Males
to Females
Victims1 50 79 198 435 1,921 2,683 54.2%
Non-victims2 125 88 368 298 1,387 2,266 45.8%
Total People 175 167 566 733 3,308 4,949 100.0%1 Victims are all passengers and any non-alcohol-involved drivers, pedalcyclists or pedestrians.2 Non-victims are any alcohol-involved drivers, pedalcyclists or pedestrians.
Victim
Category
People in Alcohol-involved Crashes
Fatalities
(Class K)
Suspected
Serious Injuries
(Class A)
Suspected
Minor Injuries
(Class B)
Possible
Injuries
(Class C)
No Apparent
Injuries
(Class O)
Total
People
Percent
of Total
Table 62: People in Alcohol-involved Crashes by Sex and Seat Position, 2019
Table 63: Victims of Alcohol-involved Crashes, 2019
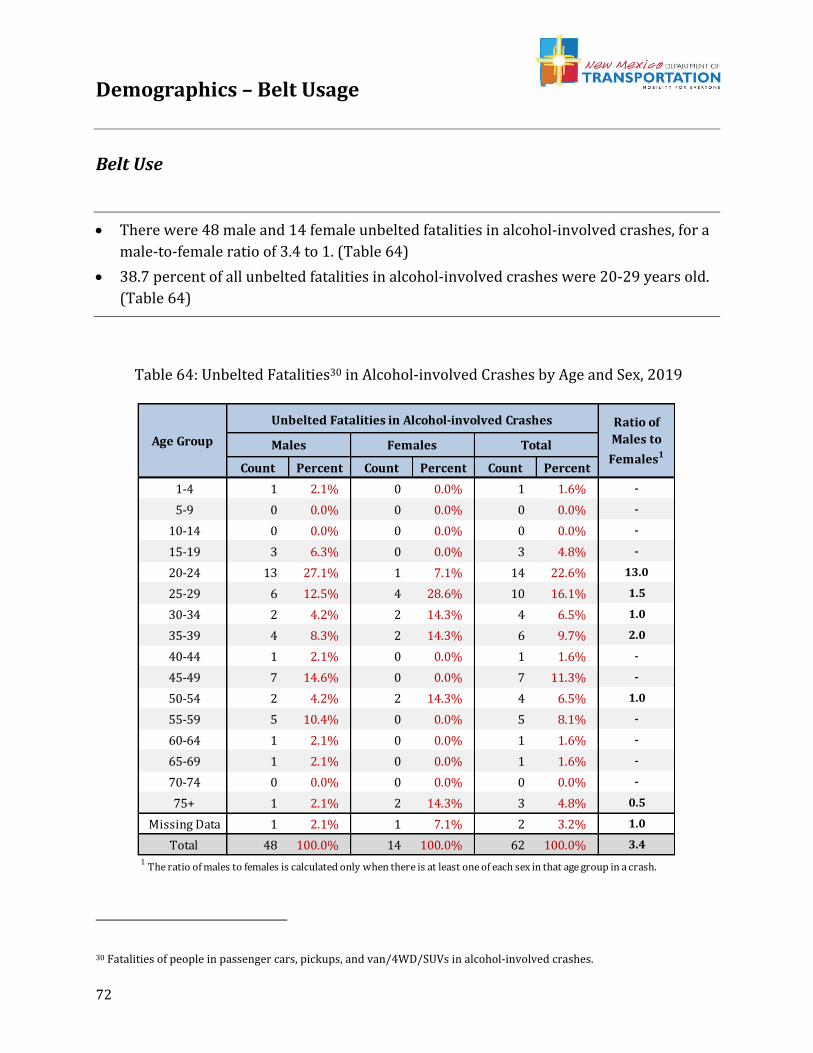
Demographics – Belt Usage
72
Belt Use
• There were 48 male and 14 female unbelted fatalities in alcohol-involved crashes, for a
male-to-female ratio of 3.4 to 1. (Table 64)
• 38.7 percent of all unbelted fatalities in alcohol-involved crashes were 20-29 years old.
(Table 64)
30 Fatalities of people in passenger cars, pickups, and van/4WD/SUVs in alcohol-involved crashes.
Count Percent Count Percent Count Percent
1-4 1 2.1% 0 0.0% 1 1.6% -
5-9 0 0.0% 0 0.0% 0 0.0% -
10-14 0 0.0% 0 0.0% 0 0.0% -
15-19 3 6.3% 0 0.0% 3 4.8% -
20-24 13 27.1% 1 7.1% 14 22.6% 13.0
25-29 6 12.5% 4 28.6% 10 16.1% 1.5
30-34 2 4.2% 2 14.3% 4 6.5% 1.0
35-39 4 8.3% 2 14.3% 6 9.7% 2.0
40-44 1 2.1% 0 0.0% 1 1.6% -
45-49 7 14.6% 0 0.0% 7 11.3% -
50-54 2 4.2% 2 14.3% 4 6.5% 1.0
55-59 5 10.4% 0 0.0% 5 8.1% -
60-64 1 2.1% 0 0.0% 1 1.6% -
65-69 1 2.1% 0 0.0% 1 1.6% -
70-74 0 0.0% 0 0.0% 0 0.0% -
75+ 1 2.1% 2 14.3% 3 4.8% 0.5
Missing Data 1 2.1% 1 7.1% 2 3.2% 1.0
Total 48 100.0% 14 100.0% 62 100.0% 3.4
1 The ratio of males to females is calculated only when there is at least one of each sex in that age group in a crash.
Age Group
Unbelted Fatalities in Alcohol-involved Crashes Ratio of
Males to
Females1Males Females Total
Table 64: Unbelted Fatalities30 in Alcohol-involved Crashes by Age and Sex, 2019
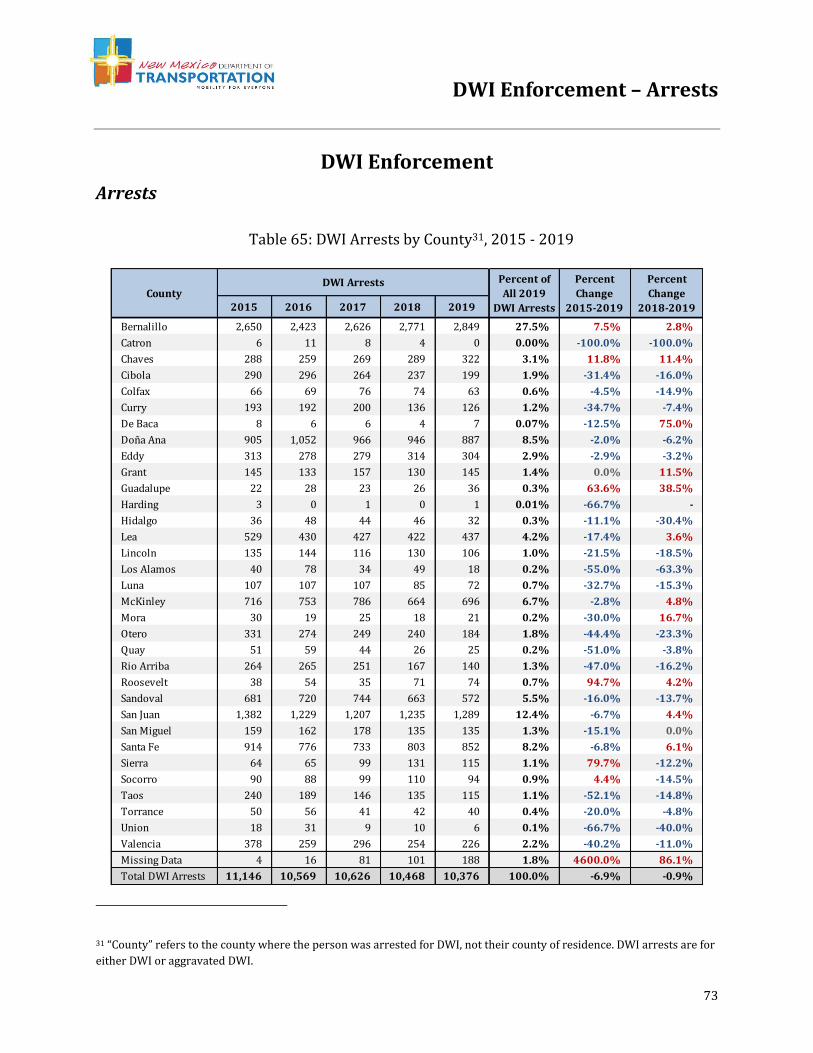
DWI Enforcement – Arrests
73
Arrests
31 “County” refers to the county where the person was arrested for DWI, not their county of residence. DWI arrests are for
either DWI or aggravated DWI.
2015 2016 2017 2018 2019
Bernalillo 2,650 2,423 2,626 2,771 2,849 27.5% 7.5% 2.8%
Catron 6 11 8 4 0 0.00% -100.0% -100.0%
Chaves 288 259 269 289 322 3.1% 11.8% 11.4%
Cibola 290 296 264 237 199 1.9% -31.4% -16.0%
Colfax 66 69 76 74 63 0.6% -4.5% -14.9%
Curry 193 192 200 136 126 1.2% -34.7% -7.4%
De Baca 8 6 6 4 7 0.07% -12.5% 75.0%
Doña Ana 905 1,052 966 946 887 8.5% -2.0% -6.2%
Eddy 313 278 279 314 304 2.9% -2.9% -3.2%
Grant 145 133 157 130 145 1.4% 0.0% 11.5%
Guadalupe 22 28 23 26 36 0.3% 63.6% 38.5%
Harding 3 0 1 0 1 0.01% -66.7% -
Hidalgo 36 48 44 46 32 0.3% -11.1% -30.4%
Lea 529 430 427 422 437 4.2% -17.4% 3.6%
Lincoln 135 144 116 130 106 1.0% -21.5% -18.5%
Los Alamos 40 78 34 49 18 0.2% -55.0% -63.3%
Luna 107 107 107 85 72 0.7% -32.7% -15.3%
McKinley 716 753 786 664 696 6.7% -2.8% 4.8%
Mora 30 19 25 18 21 0.2% -30.0% 16.7%
Otero 331 274 249 240 184 1.8% -44.4% -23.3%
Quay 51 59 44 26 25 0.2% -51.0% -3.8%
Rio Arriba 264 265 251 167 140 1.3% -47.0% -16.2%
Roosevelt 38 54 35 71 74 0.7% 94.7% 4.2%
Sandoval 681 720 744 663 572 5.5% -16.0% -13.7%
San Juan 1,382 1,229 1,207 1,235 1,289 12.4% -6.7% 4.4%
San Miguel 159 162 178 135 135 1.3% -15.1% 0.0%
Santa Fe 914 776 733 803 852 8.2% -6.8% 6.1%
Sierra 64 65 99 131 115 1.1% 79.7% -12.2%
Socorro 90 88 99 110 94 0.9% 4.4% -14.5%
Taos 240 189 146 135 115 1.1% -52.1% -14.8%
Torrance 50 56 41 42 40 0.4% -20.0% -4.8%
Union 18 31 9 10 6 0.1% -66.7% -40.0%
Valencia 378 259 296 254 226 2.2% -40.2% -11.0%
Missing Data 4 16 81 101 188 1.8% 4600.0% 86.1%
Total DWI Arrests 11,146 10,569 10,626 10,468 10,376 100.0% -6.9% -0.9%
CountyDWI Arrests Percent of
All 2019
DWI Arrests
Percent
Change
2015-2019
Percent
Change
2018-2019
DWI Enforcement
Table 65: DWI Arrests by County31, 2015 - 2019
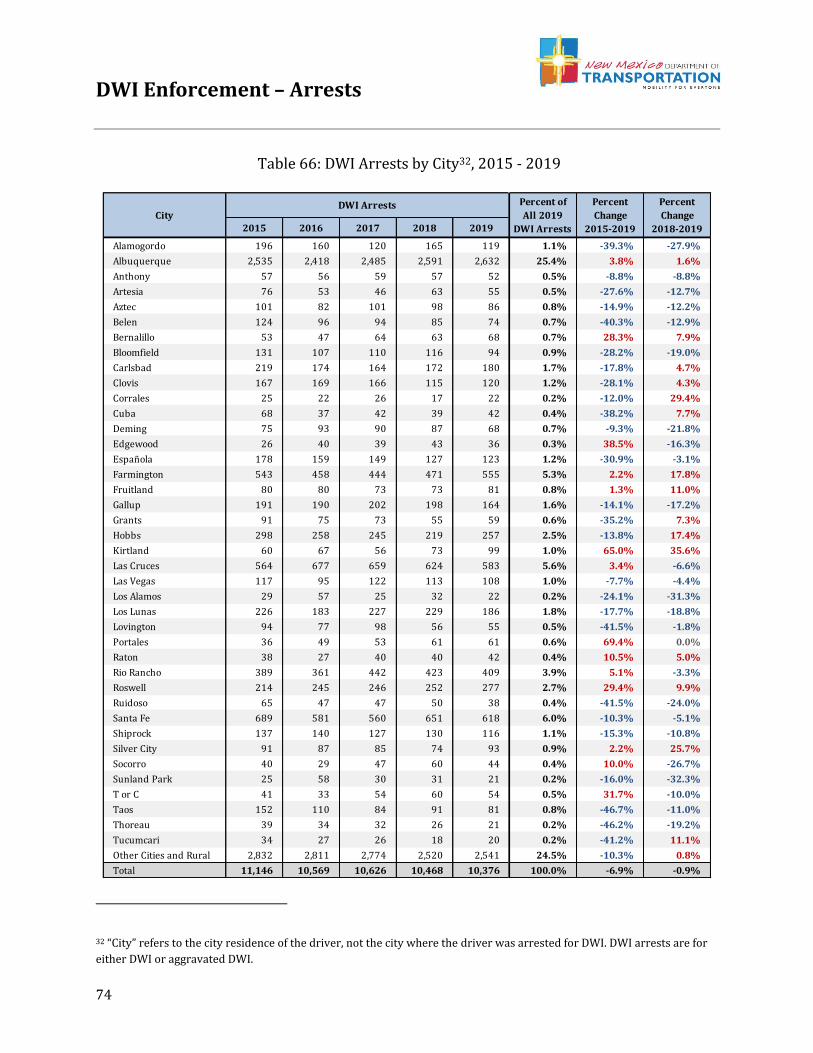
DWI Enforcement – Arrests
74
32 “City” refers to the city residence of the driver, not the city where the driver was arrested for DWI. DWI arrests are for
either DWI or aggravated DWI.
2015 2016 2017 2018 2019
Alamogordo 196 160 120 165 119 1.1% -39.3% -27.9%
Albuquerque 2,535 2,418 2,485 2,591 2,632 25.4% 3.8% 1.6%
Anthony 57 56 59 57 52 0.5% -8.8% -8.8%
Artesia 76 53 46 63 55 0.5% -27.6% -12.7%
Aztec 101 82 101 98 86 0.8% -14.9% -12.2%
Belen 124 96 94 85 74 0.7% -40.3% -12.9%
Bernalillo 53 47 64 63 68 0.7% 28.3% 7.9%
Bloomfield 131 107 110 116 94 0.9% -28.2% -19.0%
Carlsbad 219 174 164 172 180 1.7% -17.8% 4.7%
Clovis 167 169 166 115 120 1.2% -28.1% 4.3%
Corrales 25 22 26 17 22 0.2% -12.0% 29.4%
Cuba 68 37 42 39 42 0.4% -38.2% 7.7%
Deming 75 93 90 87 68 0.7% -9.3% -21.8%
Edgewood 26 40 39 43 36 0.3% 38.5% -16.3%
Española 178 159 149 127 123 1.2% -30.9% -3.1%
Farmington 543 458 444 471 555 5.3% 2.2% 17.8%
Fruitland 80 80 73 73 81 0.8% 1.3% 11.0%
Gallup 191 190 202 198 164 1.6% -14.1% -17.2%
Grants 91 75 73 55 59 0.6% -35.2% 7.3%
Hobbs 298 258 245 219 257 2.5% -13.8% 17.4%
Kirtland 60 67 56 73 99 1.0% 65.0% 35.6%
Las Cruces 564 677 659 624 583 5.6% 3.4% -6.6%
Las Vegas 117 95 122 113 108 1.0% -7.7% -4.4%
Los Alamos 29 57 25 32 22 0.2% -24.1% -31.3%
Los Lunas 226 183 227 229 186 1.8% -17.7% -18.8%
Lovington 94 77 98 56 55 0.5% -41.5% -1.8%
Portales 36 49 53 61 61 0.6% 69.4% 0.0%
Raton 38 27 40 40 42 0.4% 10.5% 5.0%
Rio Rancho 389 361 442 423 409 3.9% 5.1% -3.3%
Roswell 214 245 246 252 277 2.7% 29.4% 9.9%
Ruidoso 65 47 47 50 38 0.4% -41.5% -24.0%
Santa Fe 689 581 560 651 618 6.0% -10.3% -5.1%
Shiprock 137 140 127 130 116 1.1% -15.3% -10.8%
Silver City 91 87 85 74 93 0.9% 2.2% 25.7%
Socorro 40 29 47 60 44 0.4% 10.0% -26.7%
Sunland Park 25 58 30 31 21 0.2% -16.0% -32.3%
T or C 41 33 54 60 54 0.5% 31.7% -10.0%
Taos 152 110 84 91 81 0.8% -46.7% -11.0%
Thoreau 39 34 32 26 21 0.2% -46.2% -19.2%
Tucumcari 34 27 26 18 20 0.2% -41.2% 11.1%
Other Cities and Rural 2,832 2,811 2,774 2,520 2,541 24.5% -10.3% 0.8%
Total 11,146 10,569 10,626 10,468 10,376 100.0% -6.9% -0.9%
CityDWI Arrests Percent of
All 2019
DWI Arrests
Percent
Change
2015-2019
Percent
Change
2018-2019
Table 66: DWI Arrests by City32, 2015 - 2019
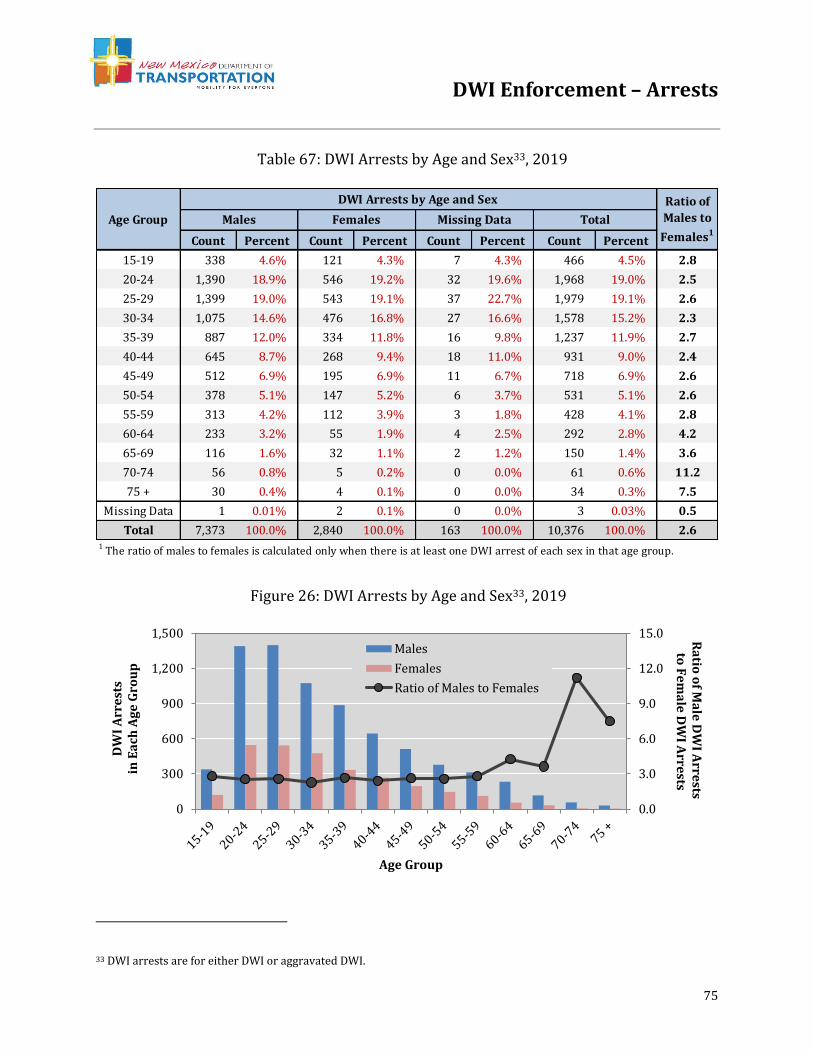
DWI Enforcement – Arrests
75
33 DWI arrests are for either DWI or aggravated DWI.
Count Percent Count Percent Count Percent Count Percent
15-19 338 4.6% 121 4.3% 7 4.3% 466 4.5% 2.8
20-24 1,390 18.9% 546 19.2% 32 19.6% 1,968 19.0% 2.5
25-29 1,399 19.0% 543 19.1% 37 22.7% 1,979 19.1% 2.6
30-34 1,075 14.6% 476 16.8% 27 16.6% 1,578 15.2% 2.3
35-39 887 12.0% 334 11.8% 16 9.8% 1,237 11.9% 2.7
40-44 645 8.7% 268 9.4% 18 11.0% 931 9.0% 2.4
45-49 512 6.9% 195 6.9% 11 6.7% 718 6.9% 2.6
50-54 378 5.1% 147 5.2% 6 3.7% 531 5.1% 2.6
55-59 313 4.2% 112 3.9% 3 1.8% 428 4.1% 2.8
60-64 233 3.2% 55 1.9% 4 2.5% 292 2.8% 4.2
65-69 116 1.6% 32 1.1% 2 1.2% 150 1.4% 3.6
70-74 56 0.8% 5 0.2% 0 0.0% 61 0.6% 11.2
75 + 30 0.4% 4 0.1% 0 0.0% 34 0.3% 7.5
Missing Data 1 0.01% 2 0.1% 0 0.0% 3 0.03% 0.5
Total 7,373 100.0% 2,840 100.0% 163 100.0% 10,376 100.0% 2.61 The ratio of males to females is calculated only when there is at least one DWI arrest of each sex in that age group.
Age Group
DWI Arrests by Age and Sex Ratio of
Males to
Females1
Males Females Missing Data Total
0.0
3.0
6.0
9.0
12.0
15.0
0
300
600
900
1,200
1,500 Ra
tio o
f Ma
le D
WI A
rrests
to F
em
ale
DW
I Arre
stsD
WI
Arr
est
s in
Ea
ch A
ge
Gro
up
Age Group
Males
Females
Ratio of Males to Females
Table 67: DWI Arrests by Age and Sex33, 2019
Figure 26: DWI Arrests by Age and Sex33, 2019
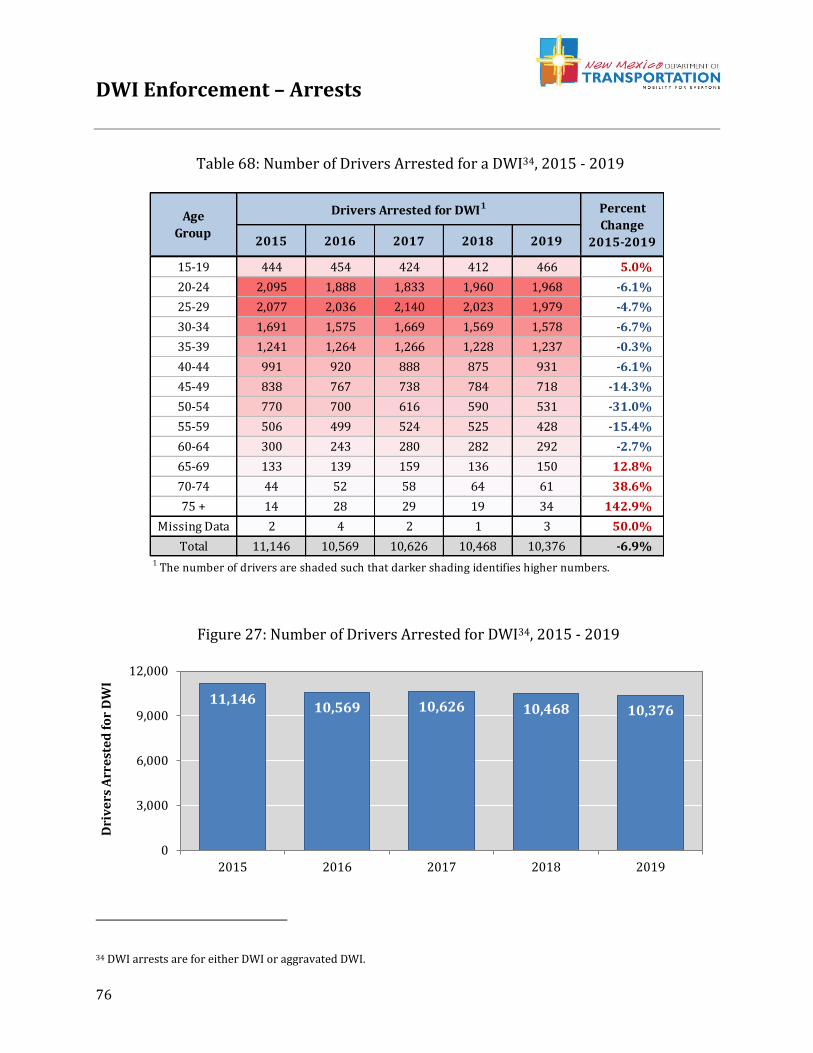
DWI Enforcement – Arrests
76
34 DWI arrests are for either DWI or aggravated DWI.
2015 2016 2017 2018 2019
15-19 444 454 424 412 466 5.0%
20-24 2,095 1,888 1,833 1,960 1,968 -6.1%
25-29 2,077 2,036 2,140 2,023 1,979 -4.7%
30-34 1,691 1,575 1,669 1,569 1,578 -6.7%
35-39 1,241 1,264 1,266 1,228 1,237 -0.3%
40-44 991 920 888 875 931 -6.1%
45-49 838 767 738 784 718 -14.3%
50-54 770 700 616 590 531 -31.0%
55-59 506 499 524 525 428 -15.4%
60-64 300 243 280 282 292 -2.7%
65-69 133 139 159 136 150 12.8%
70-74 44 52 58 64 61 38.6%
75 + 14 28 29 19 34 142.9%
Missing Data 2 4 2 1 3 50.0%
Total 11,146 10,569 10,626 10,468 10,376 -6.9%
Age
Group
Drivers Arrested for DWI1 Percent
Change
2015-2019
1 The number of drivers are shaded such that darker shading identifies higher numbers.
11,14610,569 10,626 10,468 10,376
0
3,000
6,000
9,000
12,000
2015 2016 2017 2018 2019
Dri
ve
rs A
rre
ste
d f
or
DW
I
Table 68: Number of Drivers Arrested for a DWI34, 2015 - 2019
Figure 27: Number of Drivers Arrested for DWI34, 2015 - 2019
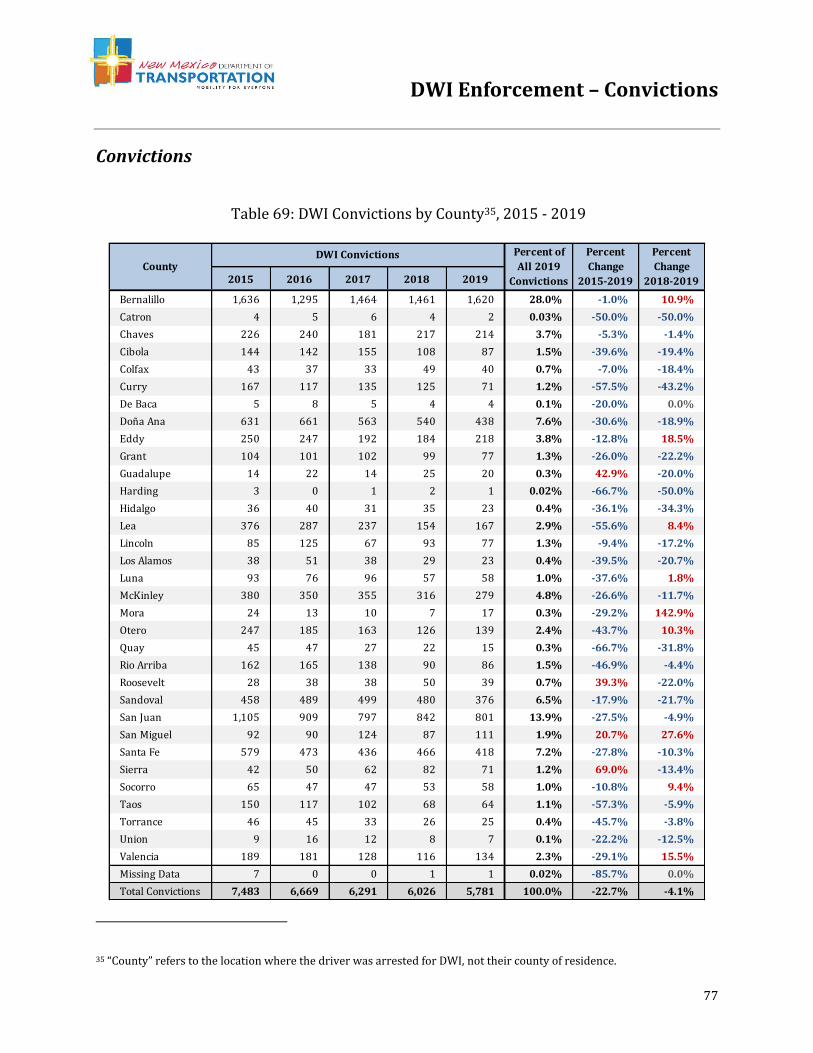
DWI Enforcement – Convictions
77
Convictions
35 “County” refers to the location where the driver was arrested for DWI, not their county of residence.
2015 2016 2017 2018 2019
Bernalillo 1,636 1,295 1,464 1,461 1,620 28.0% -1.0% 10.9%
Catron 4 5 6 4 2 0.03% -50.0% -50.0%
Chaves 226 240 181 217 214 3.7% -5.3% -1.4%
Cibola 144 142 155 108 87 1.5% -39.6% -19.4%
Colfax 43 37 33 49 40 0.7% -7.0% -18.4%
Curry 167 117 135 125 71 1.2% -57.5% -43.2%
De Baca 5 8 5 4 4 0.1% -20.0% 0.0%
Doña Ana 631 661 563 540 438 7.6% -30.6% -18.9%
Eddy 250 247 192 184 218 3.8% -12.8% 18.5%
Grant 104 101 102 99 77 1.3% -26.0% -22.2%
Guadalupe 14 22 14 25 20 0.3% 42.9% -20.0%
Harding 3 0 1 2 1 0.02% -66.7% -50.0%
Hidalgo 36 40 31 35 23 0.4% -36.1% -34.3%
Lea 376 287 237 154 167 2.9% -55.6% 8.4%
Lincoln 85 125 67 93 77 1.3% -9.4% -17.2%
Los Alamos 38 51 38 29 23 0.4% -39.5% -20.7%
Luna 93 76 96 57 58 1.0% -37.6% 1.8%
McKinley 380 350 355 316 279 4.8% -26.6% -11.7%
Mora 24 13 10 7 17 0.3% -29.2% 142.9%
Otero 247 185 163 126 139 2.4% -43.7% 10.3%
Quay 45 47 27 22 15 0.3% -66.7% -31.8%
Rio Arriba 162 165 138 90 86 1.5% -46.9% -4.4%
Roosevelt 28 38 38 50 39 0.7% 39.3% -22.0%
Sandoval 458 489 499 480 376 6.5% -17.9% -21.7%
San Juan 1,105 909 797 842 801 13.9% -27.5% -4.9%
San Miguel 92 90 124 87 111 1.9% 20.7% 27.6%
Santa Fe 579 473 436 466 418 7.2% -27.8% -10.3%
Sierra 42 50 62 82 71 1.2% 69.0% -13.4%
Socorro 65 47 47 53 58 1.0% -10.8% 9.4%
Taos 150 117 102 68 64 1.1% -57.3% -5.9%
Torrance 46 45 33 26 25 0.4% -45.7% -3.8%
Union 9 16 12 8 7 0.1% -22.2% -12.5%
Valencia 189 181 128 116 134 2.3% -29.1% 15.5%
Missing Data 7 0 0 1 1 0.02% -85.7% 0.0%
Total Convictions 7,483 6,669 6,291 6,026 5,781 100.0% -22.7% -4.1%
CountyDWI Convictions Percent of
All 2019
Convictions
Percent
Change
2015-2019
Percent
Change
2018-2019
Table 69: DWI Convictions by County35, 2015 - 2019
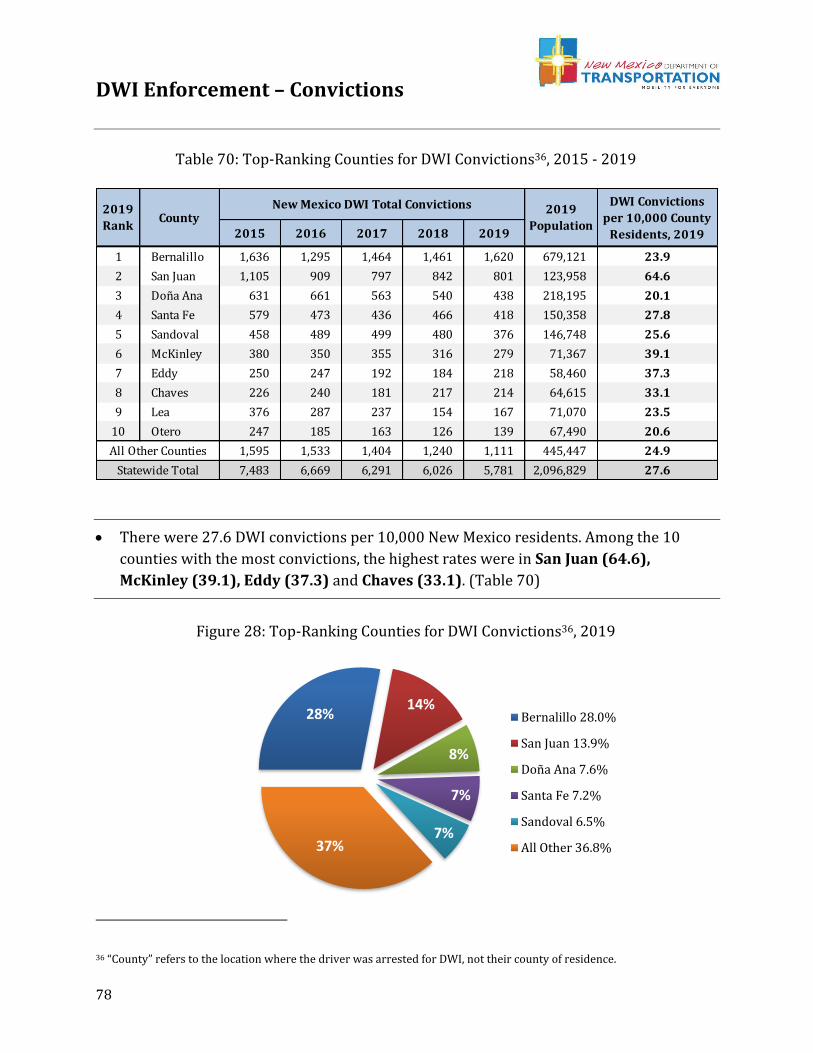
DWI Enforcement – Convictions
78
• There were 27.6 DWI convictions per 10,000 New Mexico residents. Among the 10
counties with the most convictions, the highest rates were in San Juan (64.6),
McKinley (39.1), Eddy (37.3) and Chaves (33.1). (Table 70)
36 “County” refers to the location where the driver was arrested for DWI, not their county of residence.
2015 2016 2017 2018 2019
1 Bernalillo 1,636 1,295 1,464 1,461 1,620 679,121 23.9
2 San Juan 1,105 909 797 842 801 123,958 64.6
3 Doña Ana 631 661 563 540 438 218,195 20.1
4 Santa Fe 579 473 436 466 418 150,358 27.8
5 Sandoval 458 489 499 480 376 146,748 25.6
6 McKinley 380 350 355 316 279 71,367 39.1
7 Eddy 250 247 192 184 218 58,460 37.3
8 Chaves 226 240 181 217 214 64,615 33.1
9 Lea 376 287 237 154 167 71,070 23.5
10 Otero 247 185 163 126 139 67,490 20.6
1,595 1,533 1,404 1,240 1,111 445,447 24.9
7,483 6,669 6,291 6,026 5,781 2,096,829 27.6Statewide Total
New Mexico DWI Total Convictions 2019
Population
DWI Convictions
per 10,000 County
Residents, 2019
2019
RankCounty
All Other Counties
28%14%
8%
7%
7%37%
Bernalillo 28.0%
San Juan 13.9%
Doña Ana 7.6%
Santa Fe 7.2%
Sandoval 6.5%
All Other 36.8%
Table 70: Top-Ranking Counties for DWI Convictions36, 2015 - 2019
Figure 28: Top-Ranking Counties for DWI Convictions36, 2019
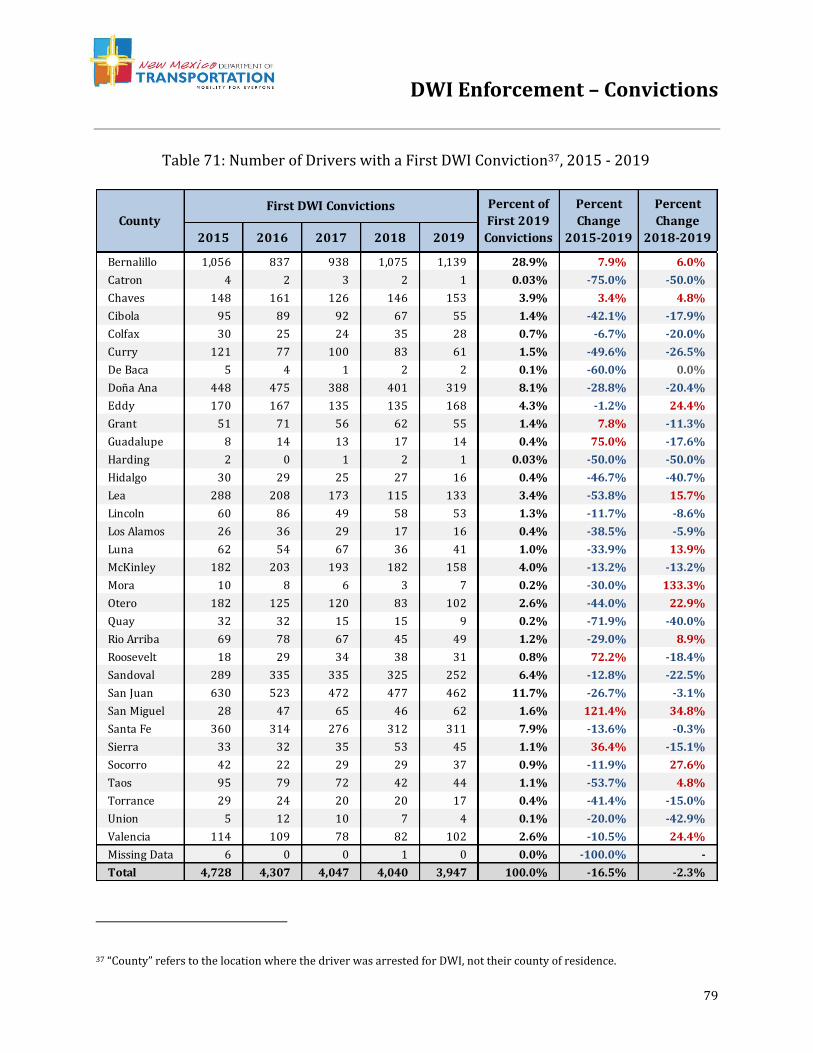
DWI Enforcement – Convictions
79
37 “County” refers to the location where the driver was arrested for DWI, not their county of residence.
2015 2016 2017 2018 2019
Bernalillo 1,056 837 938 1,075 1,139 28.9% 7.9% 6.0%
Catron 4 2 3 2 1 0.03% -75.0% -50.0%
Chaves 148 161 126 146 153 3.9% 3.4% 4.8%
Cibola 95 89 92 67 55 1.4% -42.1% -17.9%
Colfax 30 25 24 35 28 0.7% -6.7% -20.0%
Curry 121 77 100 83 61 1.5% -49.6% -26.5%
De Baca 5 4 1 2 2 0.1% -60.0% 0.0%
Doña Ana 448 475 388 401 319 8.1% -28.8% -20.4%
Eddy 170 167 135 135 168 4.3% -1.2% 24.4%
Grant 51 71 56 62 55 1.4% 7.8% -11.3%
Guadalupe 8 14 13 17 14 0.4% 75.0% -17.6%
Harding 2 0 1 2 1 0.03% -50.0% -50.0%
Hidalgo 30 29 25 27 16 0.4% -46.7% -40.7%
Lea 288 208 173 115 133 3.4% -53.8% 15.7%
Lincoln 60 86 49 58 53 1.3% -11.7% -8.6%
Los Alamos 26 36 29 17 16 0.4% -38.5% -5.9%
Luna 62 54 67 36 41 1.0% -33.9% 13.9%
McKinley 182 203 193 182 158 4.0% -13.2% -13.2%
Mora 10 8 6 3 7 0.2% -30.0% 133.3%
Otero 182 125 120 83 102 2.6% -44.0% 22.9%
Quay 32 32 15 15 9 0.2% -71.9% -40.0%
Rio Arriba 69 78 67 45 49 1.2% -29.0% 8.9%
Roosevelt 18 29 34 38 31 0.8% 72.2% -18.4%
Sandoval 289 335 335 325 252 6.4% -12.8% -22.5%
San Juan 630 523 472 477 462 11.7% -26.7% -3.1%
San Miguel 28 47 65 46 62 1.6% 121.4% 34.8%
Santa Fe 360 314 276 312 311 7.9% -13.6% -0.3%
Sierra 33 32 35 53 45 1.1% 36.4% -15.1%
Socorro 42 22 29 29 37 0.9% -11.9% 27.6%
Taos 95 79 72 42 44 1.1% -53.7% 4.8%
Torrance 29 24 20 20 17 0.4% -41.4% -15.0%
Union 5 12 10 7 4 0.1% -20.0% -42.9%
Valencia 114 109 78 82 102 2.6% -10.5% 24.4%
Missing Data 6 0 0 1 0 0.0% -100.0% -
Total 4,728 4,307 4,047 4,040 3,947 100.0% -16.5% -2.3%
CountyFirst DWI Convictions Percent of
First 2019
Convictions
Percent
Change
2015-2019
Percent
Change
2018-2019
Table 71: Number of Drivers with a First DWI Conviction37, 2015 - 2019
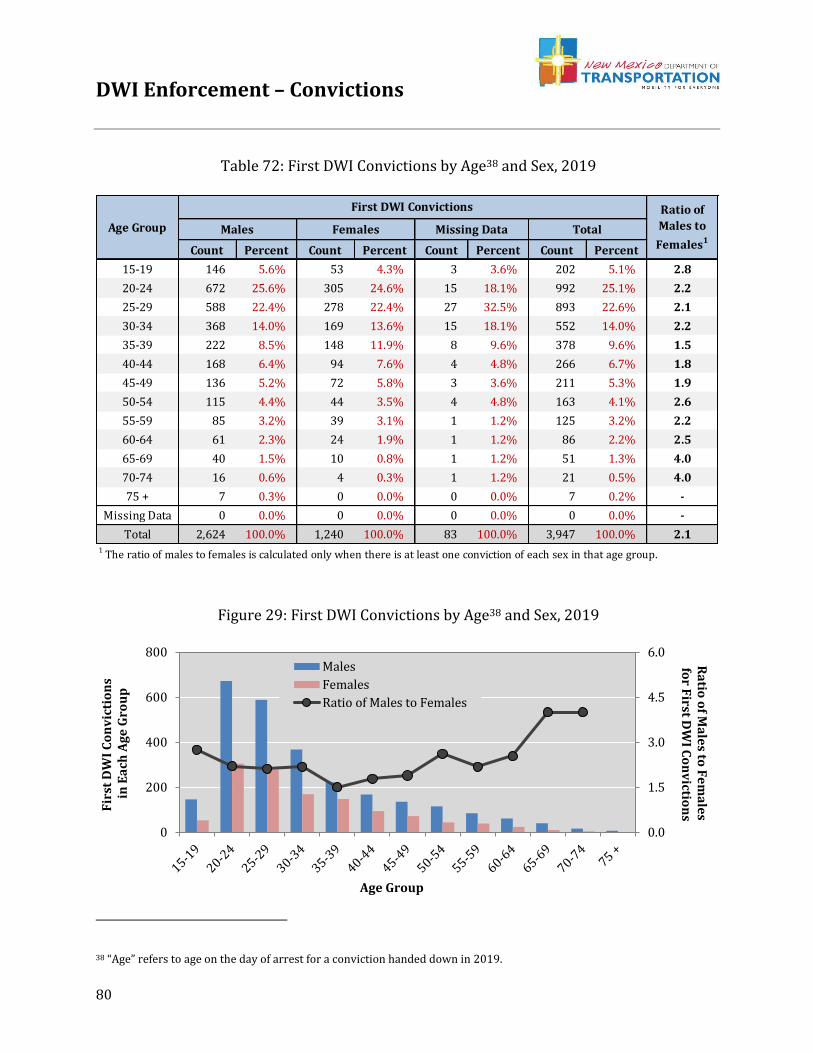
DWI Enforcement – Convictions
80
38 “Age” refers to age on the day of arrest for a conviction handed down in 2019.
Count Percent Count Percent Count Percent Count Percent
15-19 146 5.6% 53 4.3% 3 3.6% 202 5.1% 2.8
20-24 672 25.6% 305 24.6% 15 18.1% 992 25.1% 2.2
25-29 588 22.4% 278 22.4% 27 32.5% 893 22.6% 2.1
30-34 368 14.0% 169 13.6% 15 18.1% 552 14.0% 2.2
35-39 222 8.5% 148 11.9% 8 9.6% 378 9.6% 1.5
40-44 168 6.4% 94 7.6% 4 4.8% 266 6.7% 1.8
45-49 136 5.2% 72 5.8% 3 3.6% 211 5.3% 1.9
50-54 115 4.4% 44 3.5% 4 4.8% 163 4.1% 2.6
55-59 85 3.2% 39 3.1% 1 1.2% 125 3.2% 2.2
60-64 61 2.3% 24 1.9% 1 1.2% 86 2.2% 2.5
65-69 40 1.5% 10 0.8% 1 1.2% 51 1.3% 4.0
70-74 16 0.6% 4 0.3% 1 1.2% 21 0.5% 4.0
75 + 7 0.3% 0 0.0% 0 0.0% 7 0.2% -
Missing Data 0 0.0% 0 0.0% 0 0.0% 0 0.0% -
Total 2,624 100.0% 1,240 100.0% 83 100.0% 3,947 100.0% 2.11 The ratio of males to females is calculated only when there is at least one conviction of each sex in that age group.
Ratio of
Males to
Females1
First DWI Convictions
Age Group Missing Data TotalFemalesMales
0.0
1.5
3.0
4.5
6.0
0
200
400
600
800
Ra
tio o
f Ma
les to
Fe
ma
les
for F
irst DW
I Co
nv
iction
sFir
st D
WI
Co
nv
icti
on
sin
Ea
ch A
ge
Gro
up
Age Group
Males
Females
Ratio of Males to Females
Table 72: First DWI Convictions by Age38 and Sex, 2019
Figure 29: First DWI Convictions by Age38 and Sex, 2019
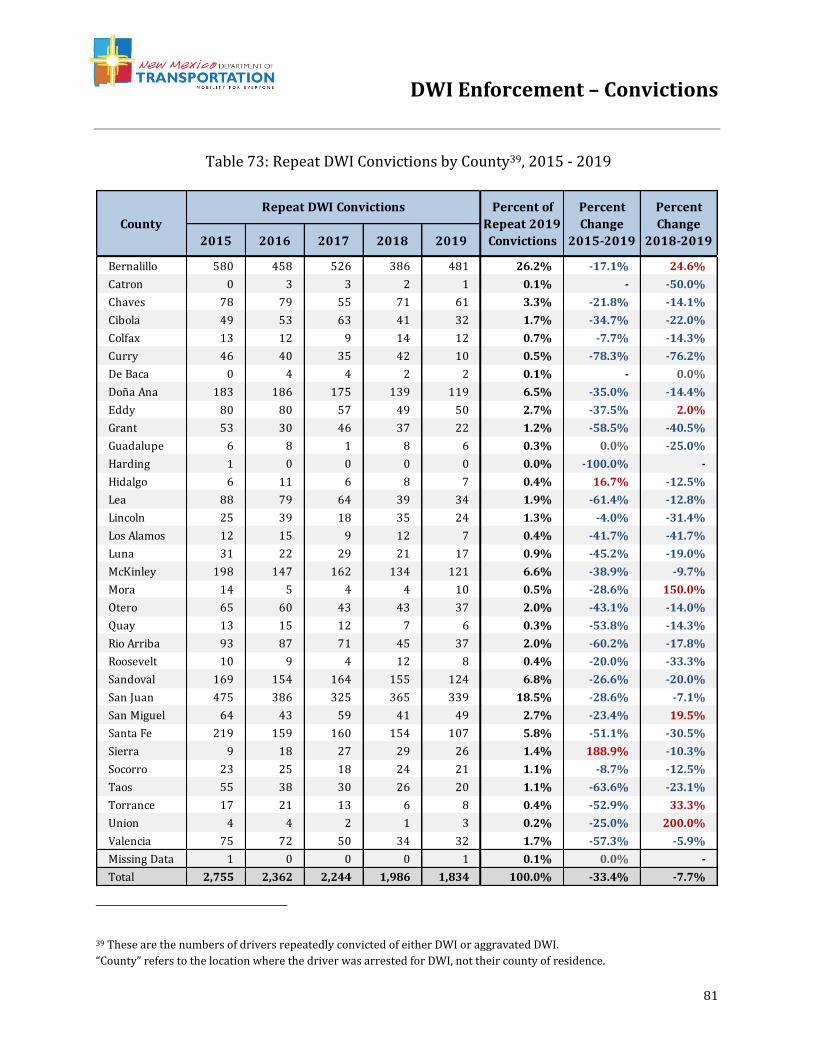
DWI Enforcement – Convictions
81
39 These are the numbers of drivers repeatedly convicted of either DWI or aggravated DWI.
“County” refers to the location where the driver was arrested for DWI, not their county of residence.
2015 2016 2017 2018 2019
Bernalillo 580 458 526 386 481 26.2% -17.1% 24.6%
Catron 0 3 3 2 1 0.1% - -50.0%
Chaves 78 79 55 71 61 3.3% -21.8% -14.1%
Cibola 49 53 63 41 32 1.7% -34.7% -22.0%
Colfax 13 12 9 14 12 0.7% -7.7% -14.3%
Curry 46 40 35 42 10 0.5% -78.3% -76.2%
De Baca 0 4 4 2 2 0.1% - 0.0%
Doña Ana 183 186 175 139 119 6.5% -35.0% -14.4%
Eddy 80 80 57 49 50 2.7% -37.5% 2.0%
Grant 53 30 46 37 22 1.2% -58.5% -40.5%
Guadalupe 6 8 1 8 6 0.3% 0.0% -25.0%
Harding 1 0 0 0 0 0.0% -100.0% -
Hidalgo 6 11 6 8 7 0.4% 16.7% -12.5%
Lea 88 79 64 39 34 1.9% -61.4% -12.8%
Lincoln 25 39 18 35 24 1.3% -4.0% -31.4%
Los Alamos 12 15 9 12 7 0.4% -41.7% -41.7%
Luna 31 22 29 21 17 0.9% -45.2% -19.0%
McKinley 198 147 162 134 121 6.6% -38.9% -9.7%
Mora 14 5 4 4 10 0.5% -28.6% 150.0%
Otero 65 60 43 43 37 2.0% -43.1% -14.0%
Quay 13 15 12 7 6 0.3% -53.8% -14.3%
Rio Arriba 93 87 71 45 37 2.0% -60.2% -17.8%
Roosevelt 10 9 4 12 8 0.4% -20.0% -33.3%
Sandoval 169 154 164 155 124 6.8% -26.6% -20.0%
San Juan 475 386 325 365 339 18.5% -28.6% -7.1%
San Miguel 64 43 59 41 49 2.7% -23.4% 19.5%
Santa Fe 219 159 160 154 107 5.8% -51.1% -30.5%
Sierra 9 18 27 29 26 1.4% 188.9% -10.3%
Socorro 23 25 18 24 21 1.1% -8.7% -12.5%
Taos 55 38 30 26 20 1.1% -63.6% -23.1%
Torrance 17 21 13 6 8 0.4% -52.9% 33.3%
Union 4 4 2 1 3 0.2% -25.0% 200.0%
Valencia 75 72 50 34 32 1.7% -57.3% -5.9%
Missing Data 1 0 0 0 1 0.1% 0.0% -
Total 2,755 2,362 2,244 1,986 1,834 100.0% -33.4% -7.7%
County
Repeat DWI Convictions Percent of
Repeat 2019
Convictions
Percent
Change
2015-2019
Percent
Change
2018-2019
Table 73: Repeat DWI Convictions by County39, 2015 - 2019
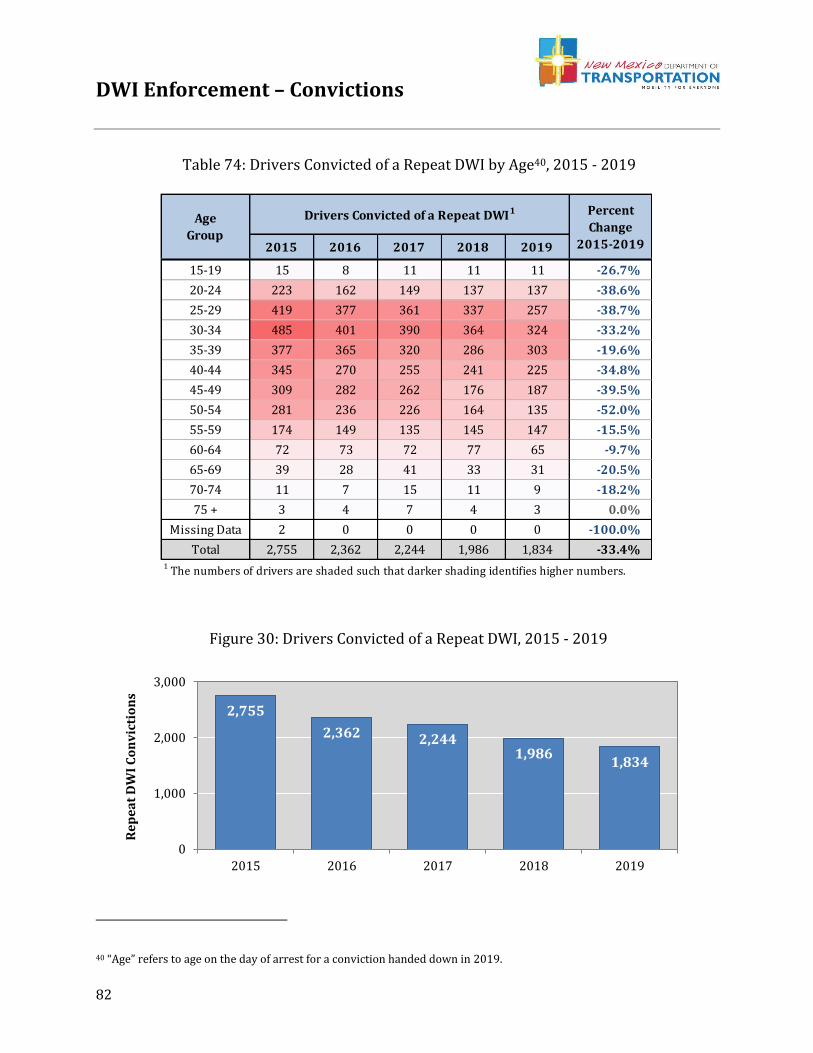
DWI Enforcement – Convictions
82
40 “Age” refers to age on the day of arrest for a conviction handed down in 2019.
2015 2016 2017 2018 2019
15-19 15 8 11 11 11 -26.7%
20-24 223 162 149 137 137 -38.6%
25-29 419 377 361 337 257 -38.7%
30-34 485 401 390 364 324 -33.2%
35-39 377 365 320 286 303 -19.6%
40-44 345 270 255 241 225 -34.8%
45-49 309 282 262 176 187 -39.5%
50-54 281 236 226 164 135 -52.0%
55-59 174 149 135 145 147 -15.5%
60-64 72 73 72 77 65 -9.7%
65-69 39 28 41 33 31 -20.5%
70-74 11 7 15 11 9 -18.2%
75 + 3 4 7 4 3 0.0%
Missing Data 2 0 0 0 0 -100.0%
Total 2,755 2,362 2,244 1,986 1,834 -33.4%
Age
Group
Drivers Convicted of a Repeat DWI1 Percent
Change
2015-2019
1 The numbers of drivers are shaded such that darker shading identifies higher numbers.
2,755
2,362 2,2441,986
1,834
0
1,000
2,000
3,000
2015 2016 2017 2018 2019
Re
pe
at
DW
I C
on
vic
tio
ns
Table 74: Drivers Convicted of a Repeat DWI by Age40, 2015 - 2019
Figure 30: Drivers Convicted of a Repeat DWI, 2015 - 2019
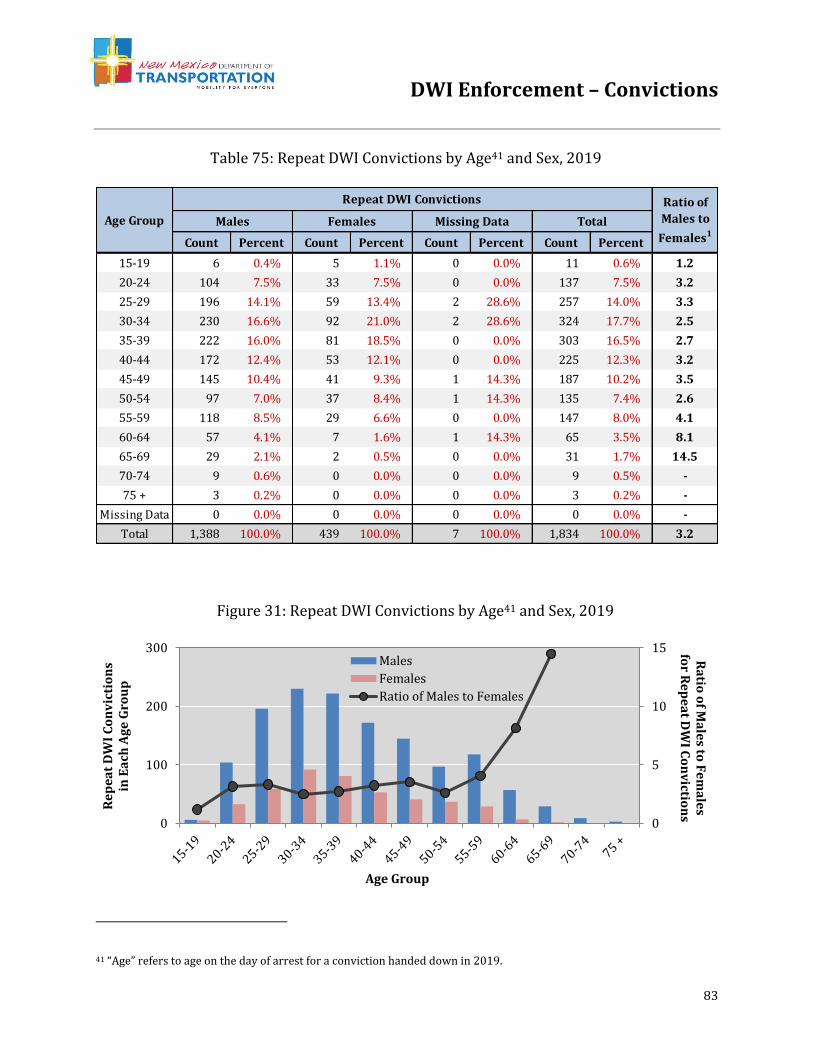
DWI Enforcement – Convictions
83
41 “Age” refers to age on the day of arrest for a conviction handed down in 2019.
Count Percent Count Percent Count Percent Count Percent
15-19 6 0.4% 5 1.1% 0 0.0% 11 0.6% 1.2
20-24 104 7.5% 33 7.5% 0 0.0% 137 7.5% 3.2
25-29 196 14.1% 59 13.4% 2 28.6% 257 14.0% 3.3
30-34 230 16.6% 92 21.0% 2 28.6% 324 17.7% 2.5
35-39 222 16.0% 81 18.5% 0 0.0% 303 16.5% 2.7
40-44 172 12.4% 53 12.1% 0 0.0% 225 12.3% 3.2
45-49 145 10.4% 41 9.3% 1 14.3% 187 10.2% 3.5
50-54 97 7.0% 37 8.4% 1 14.3% 135 7.4% 2.6
55-59 118 8.5% 29 6.6% 0 0.0% 147 8.0% 4.1
60-64 57 4.1% 7 1.6% 1 14.3% 65 3.5% 8.1
65-69 29 2.1% 2 0.5% 0 0.0% 31 1.7% 14.5
70-74 9 0.6% 0 0.0% 0 0.0% 9 0.5% -
75 + 3 0.2% 0 0.0% 0 0.0% 3 0.2% -
Missing Data 0 0.0% 0 0.0% 0 0.0% 0 0.0% -
Total 1,388 100.0% 439 100.0% 7 100.0% 1,834 100.0% 3.2
Age Group
Repeat DWI Convictions Ratio of
Males to
Females1Males Females Missing Data Total
0
5
10
15
0
100
200
300
Ra
tio o
f Ma
les to
Fe
ma
les
for R
ep
ea
t DW
I Co
nv
iction
sRe
pe
at
DW
I C
on
vic
tio
ns
in E
ach
Ag
e G
rou
p
Age Group
Males
Females
Ratio of Males to Females
Table 75: Repeat DWI Convictions by Age41 and Sex, 2019
Figure 31: Repeat DWI Convictions by Age41 and Sex, 2019
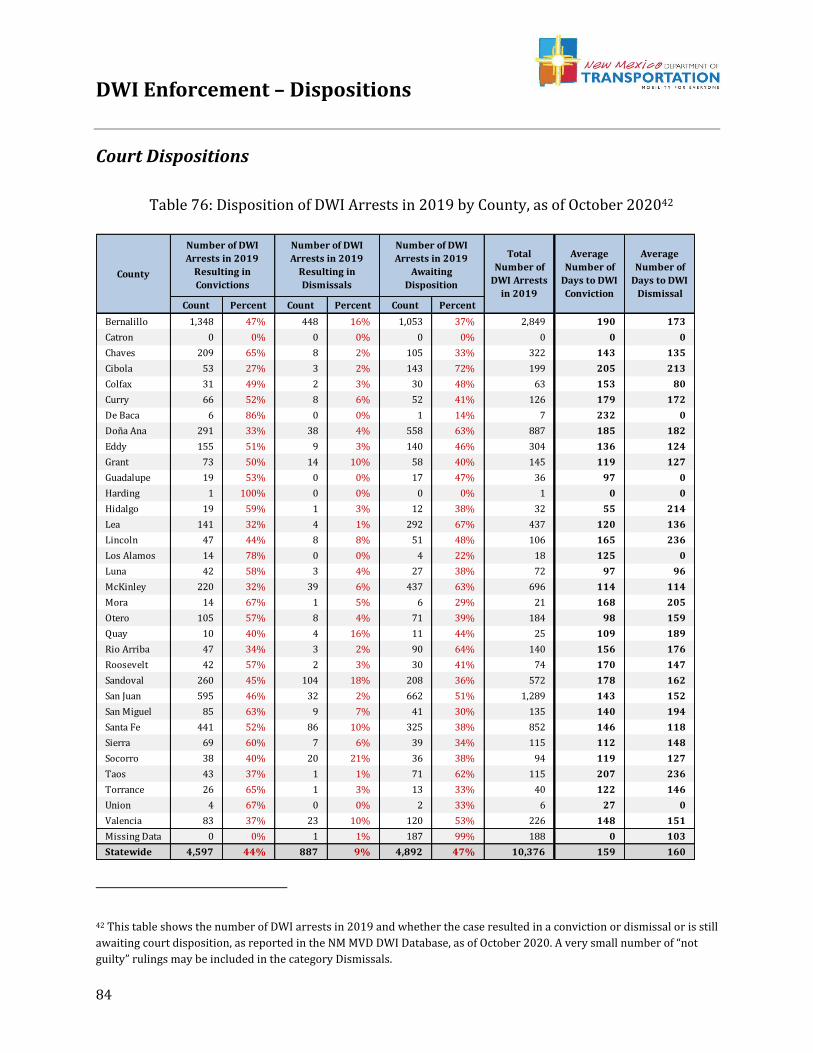
DWI Enforcement – Dispositions
84
Court Dispositions
42 This table shows the number of DWI arrests in 2019 and whether the case resulted in a conviction or dismissal or is still
awaiting court disposition, as reported in the NM MVD DWI Database, as of October 2020. A very small number of “not
guilty” rulings may be included in the category Dismissals.
Count Percent Count Percent Count Percent
Bernalillo 1,348 47% 448 16% 1,053 37% 2,849 190 173
Catron 0 0% 0 0% 0 0% 0 0 0
Chaves 209 65% 8 2% 105 33% 322 143 135
Cibola 53 27% 3 2% 143 72% 199 205 213
Colfax 31 49% 2 3% 30 48% 63 153 80
Curry 66 52% 8 6% 52 41% 126 179 172
De Baca 6 86% 0 0% 1 14% 7 232 0
Doña Ana 291 33% 38 4% 558 63% 887 185 182
Eddy 155 51% 9 3% 140 46% 304 136 124
Grant 73 50% 14 10% 58 40% 145 119 127
Guadalupe 19 53% 0 0% 17 47% 36 97 0
Harding 1 100% 0 0% 0 0% 1 0 0
Hidalgo 19 59% 1 3% 12 38% 32 55 214
Lea 141 32% 4 1% 292 67% 437 120 136
Lincoln 47 44% 8 8% 51 48% 106 165 236
Los Alamos 14 78% 0 0% 4 22% 18 125 0
Luna 42 58% 3 4% 27 38% 72 97 96
McKinley 220 32% 39 6% 437 63% 696 114 114
Mora 14 67% 1 5% 6 29% 21 168 205
Otero 105 57% 8 4% 71 39% 184 98 159
Quay 10 40% 4 16% 11 44% 25 109 189
Rio Arriba 47 34% 3 2% 90 64% 140 156 176
Roosevelt 42 57% 2 3% 30 41% 74 170 147
Sandoval 260 45% 104 18% 208 36% 572 178 162
San Juan 595 46% 32 2% 662 51% 1,289 143 152
San Miguel 85 63% 9 7% 41 30% 135 140 194
Santa Fe 441 52% 86 10% 325 38% 852 146 118
Sierra 69 60% 7 6% 39 34% 115 112 148
Socorro 38 40% 20 21% 36 38% 94 119 127
Taos 43 37% 1 1% 71 62% 115 207 236
Torrance 26 65% 1 3% 13 33% 40 122 146
Union 4 67% 0 0% 2 33% 6 27 0
Valencia 83 37% 23 10% 120 53% 226 148 151
Missing Data 0 0% 1 1% 187 99% 188 0 103
Statewide 4,597 44% 887 9% 4,892 47% 10,376 159 160
County
Total
Number of
DWI Arrests
in 2019
Number of DWI
Arrests in 2019
Resulting in
Convictions
Number of DWI
Arrests in 2019
Resulting in
Dismissals
Number of DWI
Arrests in 2019
Awaiting
Disposition
Average
Number of
Days to DWI
Conviction
Average
Number of
Days to DWI
Dismissal
Table 76: Disposition of DWI Arrests in 2019 by County, as of October 202042
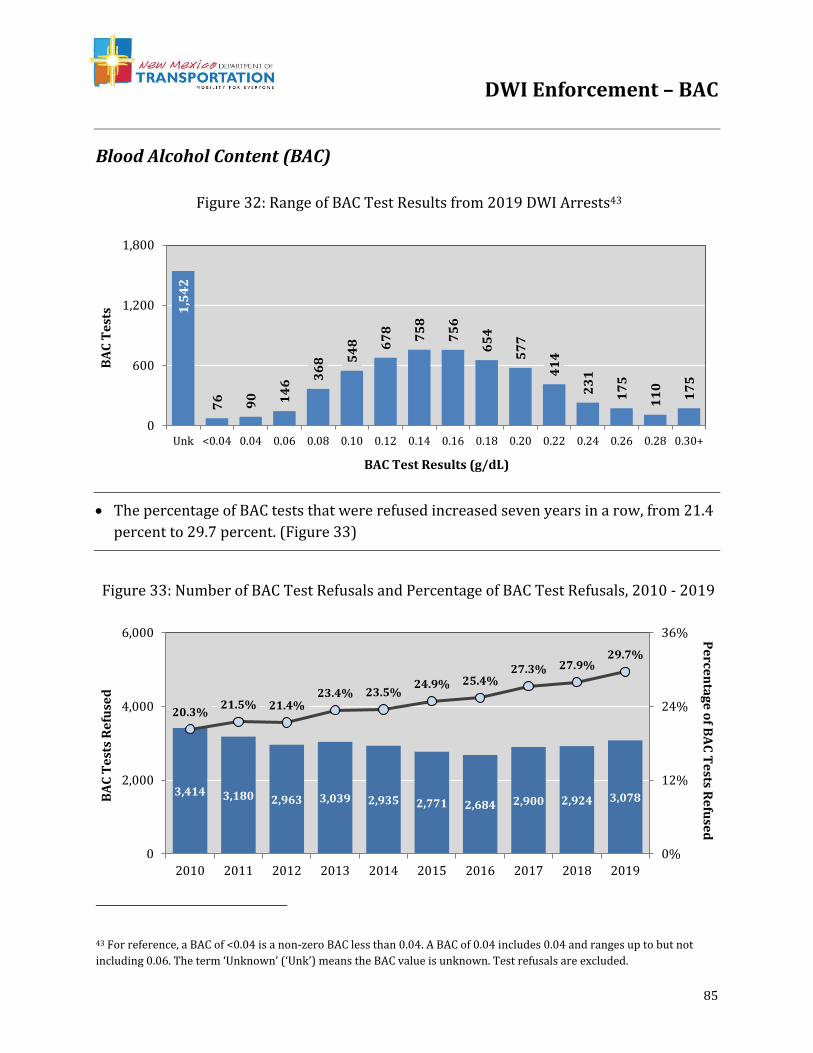
DWI Enforcement – BAC
85
Blood Alcohol Content (BAC)
• The percentage of BAC tests that were refused increased seven years in a row, from 21.4
percent to 29.7 percent. (Figure 33)
43 For reference, a BAC of <0.04 is a non-zero BAC less than 0.04. A BAC of 0.04 includes 0.04 and ranges up to but not
including 0.06. The term ‘Unknown’ (‘Unk’) means the BAC value is unknown. Test refusals are excluded.
1,5
42
76 90 14
6 36
8 54
8 67
8
75
8
75
6
65
4
57
7
41
4
23
1
17
5
11
0
17
5
0
600
1,200
1,800
Unk <0.04 0.04 0.06 0.08 0.10 0.12 0.14 0.16 0.18 0.20 0.22 0.24 0.26 0.28 0.30+
BA
C T
est
s
BAC Test Results (g/dL)
3,414 3,180 2,963 3,039 2,935 2,771 2,684 2,900 2,924 3,078
20.3%21.5% 21.4%
23.4% 23.5%24.9% 25.4%
27.3% 27.9%29.7%
0%
12%
24%
36%
0
2,000
4,000
6,000
2010 2011 2012 2013 2014 2015 2016 2017 2018 2019
Pe
rcen
tag
e o
f BA
C T
ests R
efu
sed
BA
C T
est
s R
efu
sed
Figure 32: Range of BAC Test Results from 2019 DWI Arrests43
Figure 33: Number of BAC Test Refusals and Percentage of BAC Test Refusals, 2010 - 2019
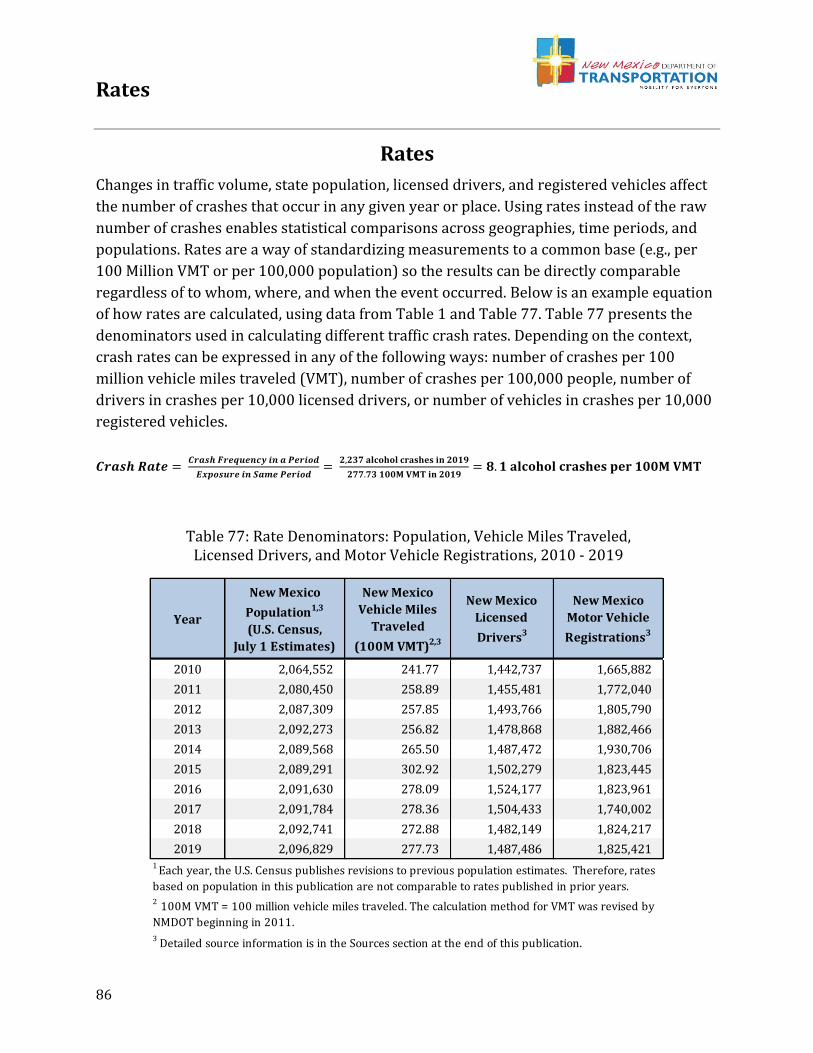
Rates
86
Changes in traffic volume, state population, licensed drivers, and registered vehicles affect
the number of crashes that occur in any given year or place. Using rates instead of the raw
number of crashes enables statistical comparisons across geographies, time periods, and
populations. Rates are a way of standardizing measurements to a common base (e.g., per
100 Million VMT or per 100,000 population) so the results can be directly comparable
regardless of to whom, where, and when the event occurred. Below is an example equation
of how rates are calculated, using data from Table 1 and Table 77. Table 77 presents the
denominators used in calculating different traffic crash rates. Depending on the context,
crash rates can be expressed in any of the following ways: number of crashes per 100
million vehicle miles traveled (VMT), number of crashes per 100,000 people, number of
drivers in crashes per 10,000 licensed drivers, or number of vehicles in crashes per 10,000
registered vehicles.
𝑪𝒓𝒂𝒔𝒉 𝑹𝒂𝒕𝒆 = 𝑪𝒓𝒂𝒔𝒉 𝑭𝒓𝒆𝒒𝒖𝒆𝒏𝒄𝒚 𝒊𝒏 𝒂 𝑷𝒆𝒓𝒊𝒐𝒅
𝑬𝒙𝒑𝒐𝒔𝒖𝒓𝒆 𝒊𝒏 𝑺𝒂𝒎𝒆 𝑷𝒆𝒓𝒊𝒐𝒅=
𝟐,𝟐𝟑𝟕 𝐚𝐥𝐜𝐨𝐡𝐨𝐥 𝐜𝐫𝐚𝐬𝐡𝐞𝐬 𝐢𝐧 𝟐𝟎𝟏𝟗
𝟐𝟕𝟕.𝟕𝟑 𝟏𝟎𝟎𝐌 𝐕𝐌𝐓 𝐢𝐧 𝟐𝟎𝟏𝟗= 𝟖. 𝟏 𝐚𝐥𝐜𝐨𝐡𝐨𝐥 𝐜𝐫𝐚𝐬𝐡𝐞𝐬 𝐩𝐞𝐫 𝟏𝟎𝟎𝐌 𝐕𝐌𝐓
Year
New Mexico
Population1,3
(U.S. Census,
July 1 Estimates)
New Mexico
Vehicle Miles
Traveled
(100M VMT)2,3
New Mexico
Licensed
Drivers3
New Mexico
Motor Vehicle
Registrations3
2010 2,064,552 241.77 1,442,737 1,665,882
2011 2,080,450 258.89 1,455,481 1,772,040
2012 2,087,309 257.85 1,493,766 1,805,790
2013 2,092,273 256.82 1,478,868 1,882,466
2014 2,089,568 265.50 1,487,472 1,930,706
2015 2,089,291 302.92 1,502,279 1,823,445
2016 2,091,630 278.09 1,524,177 1,823,961
2017 2,091,784 278.36 1,504,433 1,740,002
2018 2,092,741 272.88 1,482,149 1,824,217
2019 2,096,829 277.73 1,487,486 1,825,4211
Each year, the U.S. Census publishes revisions to previous population estimates. Therefore, rates
based on population in this publication are not comparable to rates published in prior years. 2
100M VMT = 100 million vehicle miles traveled. The calculation method for VMT was revised by
NMDOT beginning in 2011.3 Detailed source information is in the Sources section at the end of this publication.
Rates
Table 77: Rate Denominators: Population, Vehicle Miles Traveled, Licensed Drivers, and Motor Vehicle Registrations, 2010 - 2019
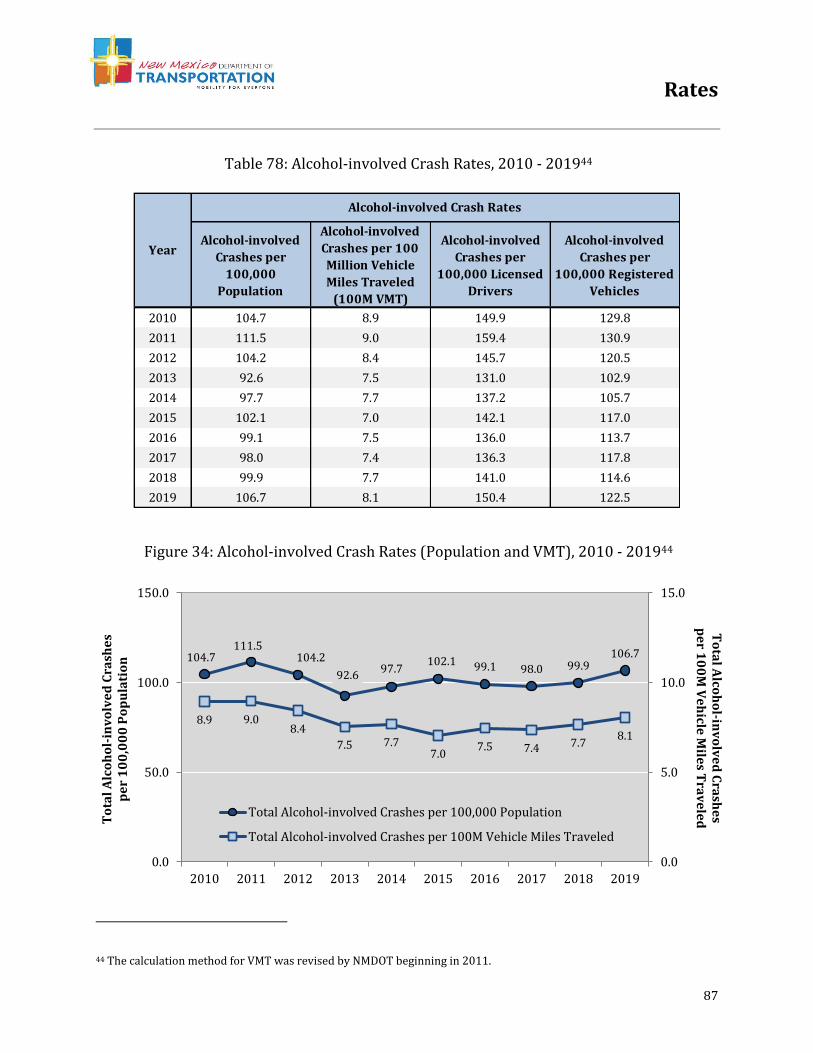
Rates
87
44 The calculation method for VMT was revised by NMDOT beginning in 2011.
Alcohol-involved
Crashes per
100,000
Population
Alcohol-involved
Crashes per 100
Million Vehicle
Miles Traveled
(100M VMT)
Alcohol-involved
Crashes per
100,000 Licensed
Drivers
Alcohol-involved
Crashes per
100,000 Registered
Vehicles
2010 104.7 8.9 149.9 129.8
2011 111.5 9.0 159.4 130.9
2012 104.2 8.4 145.7 120.5
2013 92.6 7.5 131.0 102.9
2014 97.7 7.7 137.2 105.7
2015 102.1 7.0 142.1 117.0
2016 99.1 7.5 136.0 113.7
2017 98.0 7.4 136.3 117.8
2018 99.9 7.7 141.0 114.6
2019 106.7 8.1 150.4 122.5
Year
Alcohol-involved Crash Rates
104.7111.5
104.2
92.697.7
102.1 99.1 98.0 99.9106.7
8.9 9.08.4
7.5 7.77.0
7.5 7.4 7.78.1
0.0
5.0
10.0
15.0
0.0
50.0
100.0
150.0
2010 2011 2012 2013 2014 2015 2016 2017 2018 2019
To
tal A
lcoh
ol-in
vo
lve
d C
rash
es
pe
r 10
0M
Ve
hicle
Mile
s Tra
ve
ledT
ota
l A
lco
ho
l-in
vo
lve
d C
rash
es
pe
r 1
00
,00
0 P
op
ula
tio
n
Total Alcohol-involved Crashes per 100,000 Population
Total Alcohol-involved Crashes per 100M Vehicle Miles Traveled
Table 78: Alcohol-involved Crash Rates, 2010 - 201944
Figure 34: Alcohol-involved Crash Rates (Population and VMT), 2010 - 201944
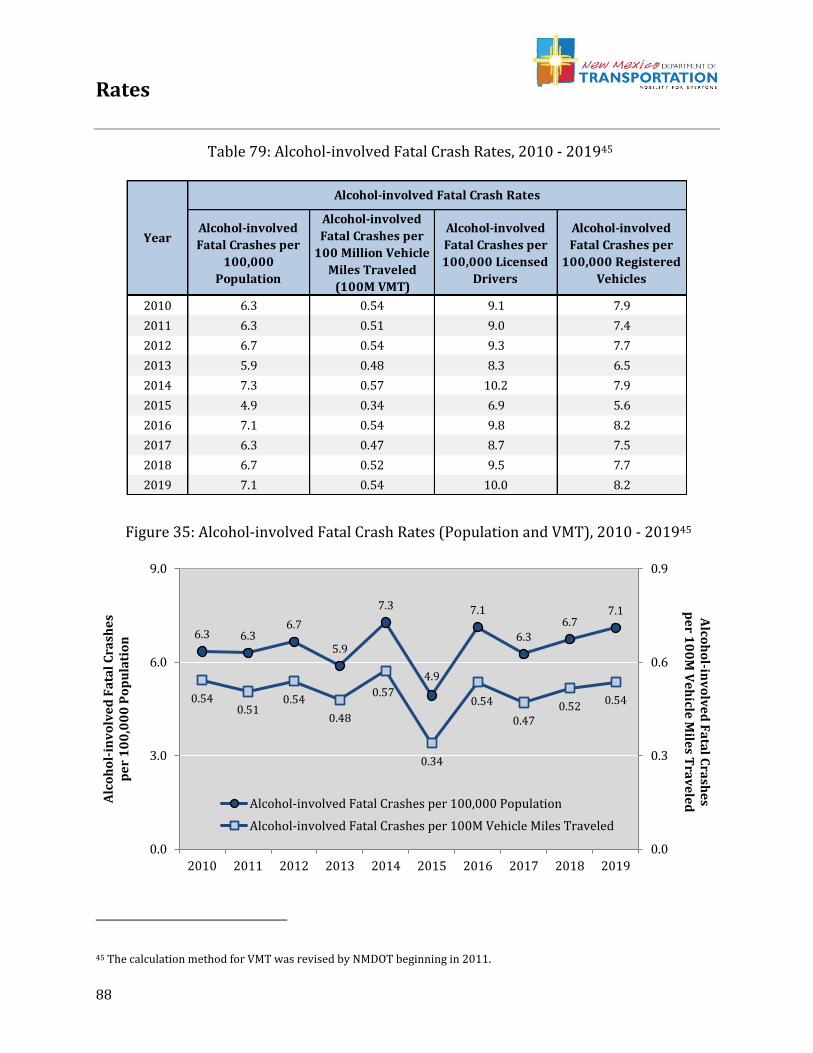
Rates
88
45 The calculation method for VMT was revised by NMDOT beginning in 2011.
Alcohol-involved
Fatal Crashes per
100,000
Population
Alcohol-involved
Fatal Crashes per
100 Million Vehicle
Miles Traveled
(100M VMT)
Alcohol-involved
Fatal Crashes per
100,000 Licensed
Drivers
Alcohol-involved
Fatal Crashes per
100,000 Registered
Vehicles
2010 6.3 0.54 9.1 7.9
2011 6.3 0.51 9.0 7.4
2012 6.7 0.54 9.3 7.7
2013 5.9 0.48 8.3 6.5
2014 7.3 0.57 10.2 7.9
2015 4.9 0.34 6.9 5.6
2016 7.1 0.54 9.8 8.2
2017 6.3 0.47 8.7 7.5
2018 6.7 0.52 9.5 7.7
2019 7.1 0.54 10.0 8.2
Year
Alcohol-involved Fatal Crash Rates
6.3 6.36.7
5.9
7.3
4.9
7.1
6.36.7
7.1
0.540.51
0.54
0.48
0.57
0.34
0.54
0.470.52
0.54
0.0
0.3
0.6
0.9
0.0
3.0
6.0
9.0
2010 2011 2012 2013 2014 2015 2016 2017 2018 2019
Alco
ho
l-inv
olv
ed
Fa
tal C
rash
es
pe
r 10
0M
Ve
hicle
Mile
s Tra
ve
ledA
lco
ho
l-in
vo
lve
d F
ata
l C
rash
es
pe
r 1
00
,00
0 P
op
ula
tio
n
Alcohol-involved Fatal Crashes per 100,000 Population
Alcohol-involved Fatal Crashes per 100M Vehicle Miles Traveled
Table 79: Alcohol-involved Fatal Crash Rates, 2010 - 201945
Figure 35: Alcohol-involved Fatal Crash Rates (Population and VMT), 2010 - 201945
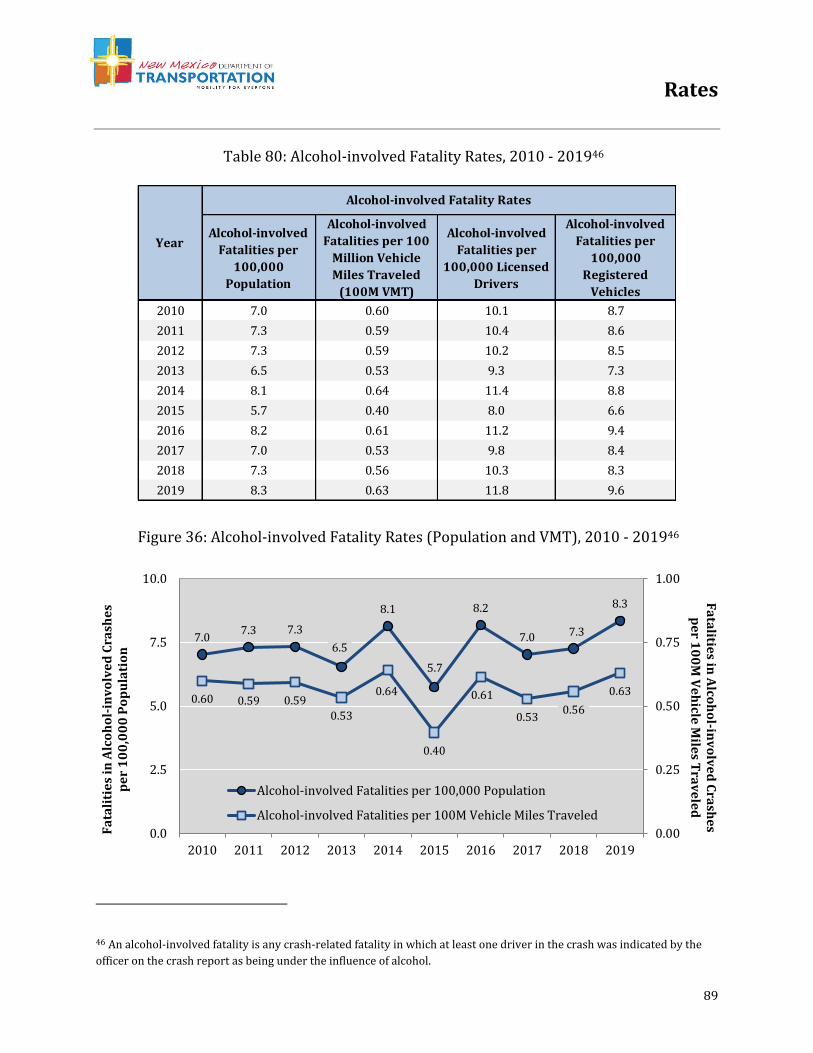
Rates
89
46 An alcohol-involved fatality is any crash-related fatality in which at least one driver in the crash was indicated by the
officer on the crash report as being under the influence of alcohol.
Alcohol-involved
Fatalities per
100,000
Population
Alcohol-involved
Fatalities per 100
Million Vehicle
Miles Traveled
(100M VMT)
Alcohol-involved
Fatalities per
100,000 Licensed
Drivers
Alcohol-involved
Fatalities per
100,000
Registered
Vehicles
2010 7.0 0.60 10.1 8.7
2011 7.3 0.59 10.4 8.6
2012 7.3 0.59 10.2 8.5
2013 6.5 0.53 9.3 7.3
2014 8.1 0.64 11.4 8.8
2015 5.7 0.40 8.0 6.6
2016 8.2 0.61 11.2 9.4
2017 7.0 0.53 9.8 8.4
2018 7.3 0.56 10.3 8.3
2019 8.3 0.63 11.8 9.6
Alcohol-involved Fatality Rates
Year
7.07.3 7.3
6.5
8.1
5.7
8.2
7.0 7.3
8.3
0.60 0.59 0.59
0.53
0.64
0.40
0.61
0.530.56
0.63
0.00
0.25
0.50
0.75
1.00
0.0
2.5
5.0
7.5
10.0
2010 2011 2012 2013 2014 2015 2016 2017 2018 2019
Fa
talitie
s in A
lcoh
ol-in
vo
lve
d C
rash
es
pe
r 10
0M
Ve
hicle
Mile
s Tra
ve
led
Fa
tali
tie
s in
Alc
oh
ol-
inv
olv
ed
Cra
she
s p
er
10
0,0
00
Po
pu
lati
on
Alcohol-involved Fatalities per 100,000 Population
Alcohol-involved Fatalities per 100M Vehicle Miles Traveled
Table 80: Alcohol-involved Fatality Rates, 2010 - 201946
Figure 36: Alcohol-involved Fatality Rates (Population and VMT), 2010 - 201946
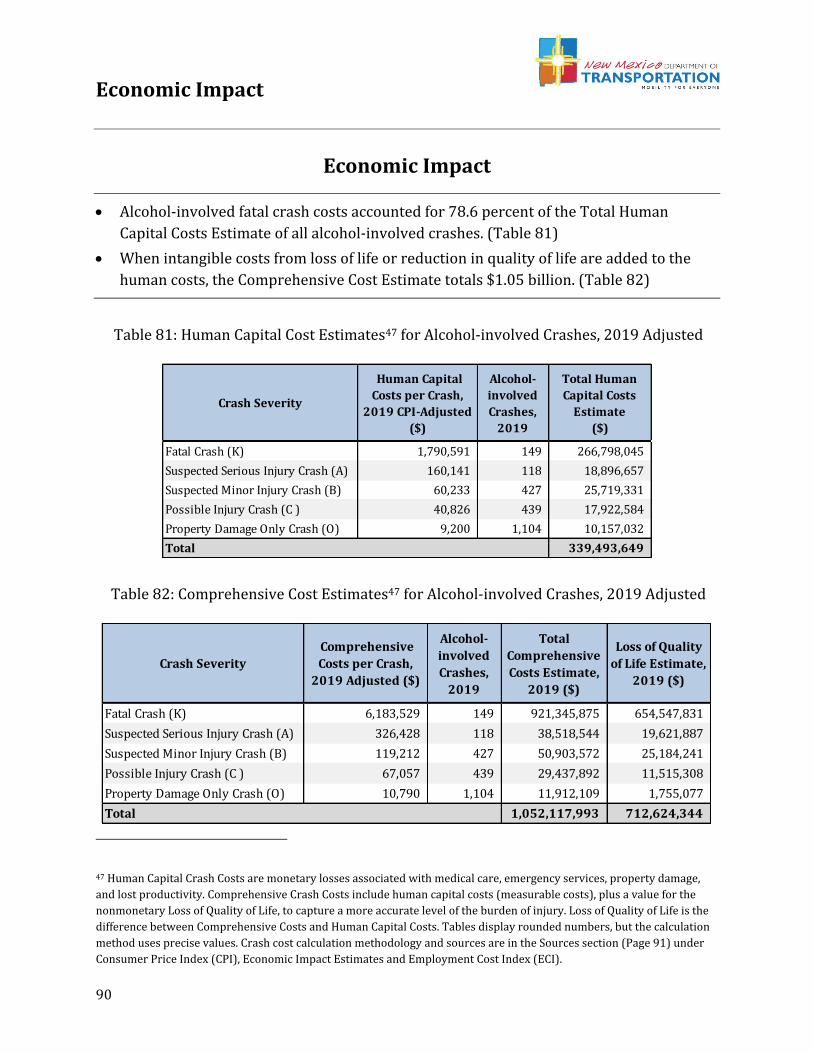
Economic Impact
90
• Alcohol-involved fatal crash costs accounted for 78.6 percent of the Total Human
Capital Costs Estimate of all alcohol-involved crashes. (Table 81)
• When intangible costs from loss of life or reduction in quality of life are added to the
human costs, the Comprehensive Cost Estimate totals $1.05 billion. (Table 82)
47 Human Capital Crash Costs are monetary losses associated with medical care, emergency services, property damage,
and lost productivity. Comprehensive Crash Costs include human capital costs (measurable costs), plus a value for the
nonmonetary Loss of Quality of Life, to capture a more accurate level of the burden of injury. Loss of Quality of Life is the
difference between Comprehensive Costs and Human Capital Costs. Tables display rounded numbers, but the calculation
method uses precise values. Crash cost calculation methodology and sources are in the Sources section (Page 91) under
Consumer Price Index (CPI), Economic Impact Estimates and Employment Cost Index (ECI).
Crash Severity
Human Capital
Costs per Crash,
2019 CPI-Adjusted
($)
Alcohol-
involved
Crashes,
2019
Total Human
Capital Costs
Estimate
($)
Fatal Crash (K) 1,790,591 149 266,798,045
Suspected Serious Injury Crash (A) 160,141 118 18,896,657
Suspected Minor Injury Crash (B) 60,233 427 25,719,331
Possible Injury Crash (C ) 40,826 439 17,922,584
Property Damage Only Crash (O) 9,200 1,104 10,157,032
339,493,649 Total
Crash Severity
Comprehensive
Costs per Crash,
2019 Adjusted ($)
Alcohol-
involved
Crashes,
2019
Total
Comprehensive
Costs Estimate,
2019 ($)
Loss of Quality
of Life Estimate,
2019 ($)
Fatal Crash (K) 6,183,529 149 921,345,875 654,547,831
Suspected Serious Injury Crash (A) 326,428 118 38,518,544 19,621,887
Suspected Minor Injury Crash (B) 119,212 427 50,903,572 25,184,241
Possible Injury Crash (C ) 67,057 439 29,437,892 11,515,308
Property Damage Only Crash (O) 10,790 1,104 11,912,109 1,755,077
1,052,117,993 712,624,344 Total
Economic Impact
Table 81: Human Capital Cost Estimates47 for Alcohol-involved Crashes, 2019 Adjusted
Table 82: Comprehensive Cost Estimates47 for Alcohol-involved Crashes, 2019 Adjusted
Sources
91
Consumer Price Index (CPI) – U.S. Department of Labor, Bureau of Labor Statistics.
Historical Consumer Price Index for All Urban Consumers (CPI-U): U.S. City average, all
items, by month (Supplemental File: Historical CPI-U, January 2021). Data for January
2019, Accessed March 2, 2021: https://www.bls.gov/cpi/tables/supplemental-
files/historical-cpi-u-202101.pdf.
Crash Data – Crash data are from the NMDOT Uniform Crash Reports (UCR), submitted by
law enforcement agencies in the state, for any incident on a public roadway involving
one or more motor vehicles that resulted in death, injury, or at least $500 in property
damage. These reports are processed by the NMDOT Traffic Records Program, and
analyzed by the University of New Mexico, Geospatial and Population Studies (GPS),
Traffic Research Unit (TRU).
In addition, during cleaning of crash-related fatalities, drivers, pedestrians and
pedalcyclists are identified as alcohol-involved or drug-involved if they are identified as
such in the NMDOT Traffic Records Program Fatallog database, which contains data
supplied by the Office of the Medical Investigator for crash-related fatalities.
NMDOT crash data is protected by the federal mandate Title 23 U.S.C. Section 409,
which forbids the discovery and admission into evidence of reports, data, or other
information compiled or collected for activities required pursuant to Federal highway
safety programs, or for the purpose of developing any highway safety construction
improvement project, which may be implemented utilizing federal-aid highway funds,
in tort litigation arising from occurrences at the locations addressed in such documents
or data.
DWI Database – New Mexico Taxation and Revenue Department (NM TRD) Motor Vehicle
Division (MVD), DWI Database, as of October 2020. Arrests and convictions include
both DWI and aggravated DWI. Repeat offenders are identified by the combination of
account key, arrest date, and citation number. The DWI database is regularly updated
by MVD, and numbers in this publication for any given year will be more accurate than
numbers in prior publications.
Sources
Sources
92
Economic Impact Estimates – American Association of State Highway and Transportation
Officials Highway Safety Manual, First Edition, Volume 1, 2010, Appendix 4A, pp. 4-84
to 4-88. AASHTO HSM cost estimate calculations are based on the Crash Cost Estimates
by Maximum Police-Reported Injury Severity Within Selected Crash Geometries, FHWA-
HRT-05-051: October 2005.
Employment Cost Index (ECI) – U.S. Department of Labor, Bureau of Labor Statistics.
Employment Cost Index Historical Listing – Volume III, January 2021. Table 5:
Employment Cost Index for total compensation, for private industry workers, by
occupational group and industry, not seasonally adjusted. Section: All workers. June
2019. Accessed March 2, 2021: http://www.bls.gov/web/eci/echistrynaics.pdf.
Licensed Drivers – New Mexico Taxation and Revenue Department (NM TRD), Motor
Vehicle Division (MVD), 2015 – 2019. April data for 2015; July data for all other years.
Population – U.S. Census Bureau, Population Division. Annual Estimates of the Resident
Population: April 1, 2010, to July 1, 2019. Release dates: For counties, March 2020 (CO-
EST2019-ANNRES-35). For cities and towns (incorporated places and minor civil
divisions), May 2020 (SUB-EST2019_35). For 2010 population only: New Mexico: 2010
Population and Housing Counts, released September 2012
(https://www2.census.gov/library/publications/decennial/2010/cph-2/cph-2-33.pdf).
Registered Motor Vehicles and Motorcycles
▪ U.S. Department of Transportation, Federal Highway Administration, Office of
Highway Policy Information. Highway Statistics Series, Vehicles. Table MV-1 (2015
published Jan. 2017; 2016, Nov. 2017; 2017, Jan. 2019; 2018, Dec. 2019; 2019, Nov.
2020). Accessed March 3, 2021.
https://www.fhwa.dot.gov/policyinformation/statistics/2019/mv1.cfm
Urban Areas – New Mexico Department of Transportation, Asset Management and
Planning. 2010 U.S. Census Urbanized Area Boundaries, NMDOT-Adjusted, and U.S.
Census Urban Clusters. Aug. 21, 2013. Urban areas for crash years 2013-2017 include a
½-mile buffer extending out from those urban boundaries. Urban areas for crash years
2018 and after do not include a buffer, which decreases the number of crashes
classified as urban. In crashes before 2013, “urban” was defined as a town or city with a
population of at least 2,500 people.
Sources
93
Vehicle Miles Traveled (VMT) – New Mexico Department of Transportation, Asset
Management and Planning Division, Data Management Bureau. Extent and Travel
Report, 2019, generated on May 1, 2020. DVMT by County, 2019, personal
communication from Sean Noonen, generated on April 15, 2020. VMT (reported in units
of 100 million vehicle miles traveled) are based on the daily average vehicle miles
traveled.
Index
94
Age (and/or Sex) 43-46
Alcohol-involved Drivers 67-70
DWI Arrests 75-76
DWI Convictions 80, 82-83
Motorcyclists 57-58
Pedalcyclists 66
Pedestrians 62
Seat Position 71
Teens 47-50
Young Adults 51-54
Belt Use 72
Cities 31-32, 74
Classification 34, 39-40
Counties 20, 26-30
Court Dispositions 84
DWI Arrests 73
DWI Convictions 77-79, 81
Motorcyclists 56
Pedalcyclists 65
Pedestrians 61
Day of the Week 36-38
Drivers, Alcohol-involved 67-70
Motorcyclists 57-58
Pedalcyclists 65-66
Pedestrians 59-62
Teens 47-50
Young Adults 52-54
DWI Enforcement 73-85
Economic Impact 90
Hour of Day 37-38
Teens 50
Young Adults 54
Light 34
Maps 20-25
Month 35
Motorcyclists 42, 55-58
Pedalcyclists 42, 63-66, 71
Classification 39-40
Pedestrians 42, 57-62, 71
Classification 39-40
Rates 86-89
Age 69
Cities 31-32
Counties 27-30, 56, 61, 65, 78
Crashes 27-28
DWI Convictions 78
Fatal Crashes 29-30
Motorcyclists 56
Pedalcyclists 65
Pedestrians 61
Motorcycle Drivers 57
Teens 48
Young Adults 52
Rural Roadways 33-34
Seat Position 71
Sex (Gender), see Age
Teens 47-50
Time of Day, See Hour of Day
Urban Roadways 33-34
Vehicles 41-42
Young Adults 51-54
Index