new mexico dwi offender characteristics and...
TRANSCRIPT
1
New Mexico DWI Offender Characteristics
and Recidivism Report 2000 - 2007
Substance Abuse Epidemiology Section
Injury and Behavioral Epidemiology Bureau Epidemiology and Response Division
November 2009

2
Table of Contents
Executive Summary ...................................................................................................................... 3 Recommendations ......................................................................................................................... 5 Introduction ................................................................................................................................... 6
Total & Alcohol-Involved Crash Deaths and Legislative and Administrative Actions in New Mexico, 1980 - 2007 ................................................................................................................... 6
Methods .......................................................................................................................................... 8 New Mexico DWI Screening and Tracking System and Citation Tracking System ............... 9
Number of DWI Convictions and Screenings in New Mexico, 2000 - 2007.............................. 9 County DWI Screenings ............................................................................................................. 10
Percentage of DWI Convictions Screened in New Mexico, 2000 – 2006 ................................ 10 DWI Screenings by County in New Mexico, 2000 – 2006....................................................... 11 Percentage of DWI Convictions Screened by County in New Mexico, 2000 – 2006 .............. 12
DWI Offender Characteristics ................................................................................................... 13
Gender of DWI Offenders......................................................................................................... 13 Race/Ethnicity of DWI Offenders............................................................................................. 14 Age Distribution of DWI Offenders . ....................................................................................... 15 Highest Grade Completed by DWI Offenders .......................................................................... 16 Marital Status of DWI Offenders.............................................................................................. 17 Employment Status of DWI Offenders . ................................................................................... 18
Substance Abuse Information .................................................................................................... 19
Blood Alcohol Content (BAC) Levels .................................................................................... 19 Source of Alcohol Before Arrest............................................................................................... 20 Primary Drug Used by DWI Offenders .................................................................................... 21 Age of Initial Monthly Alcohol Use among DWI Offenders.................................................... 22
Sentencing Information .............................................................................................................. 23
Sanctions Assigned to DWI Offenders in New Mexico, 2000-2006 ........................................ 23 Treatment Information ............................................................................................................... 24
Treatment Levels Recommended by Screening in New Mexico, 2006 .................................... 24 Recidivism .................................................................................................................................... 25 DWI Re-Arrest Rates, New Mexico, 2000 – 2007.................................................................... 25
Re-Arrest by County of Conviction, New Mexico, 2000 – 2007.............................................. 26 Re-Arrest by Race/Ethnicity, New Mexico, 2000 – 2007......................................................... 27 Re-Arrest by Gender, New Mexico, 2000 – 2007..................................................................... 28 Re-Arrest by Age Group, New Mexico, 2000 – 2007 .............................................................. 29 Re-Arrest by the Number of Prior DWI Convictions, New Mexico, 2000 – 2007................... 30 Re-Arrest by Source of Alcohol before Arrest, New Mexico, 2000 – 2007............................. 31
Acknowledgements ...................................................................................................................... 32 Appendix ...................................................................................................................................... 33

3
Executive Summary As recently as 1996, New Mexico had the highest rate of alcohol-related motor vehicle crash (AR-MVC) deaths in the United States. However, New Mexico’s AR-MVC death rates and its rank in the nation have dropped considerably in recent years. In 2002, New Mexico’s rate was 0.96 deaths per 100 million vehicle miles traveled, fifth in the United States and more than twice the national rate. By 2006, New Mexico’s rate had dropped twenty-five percent, to 0.72 deaths per 100 million vehicle miles traveled, which was fourteenth in the nation and only 1.2 times the national rate. Many factors have likely been involved in this decline, including a six-county DWI prevention project that has been in place since 2005, funded by the National Highway Traffic Safety Administration (NHTSA); and ongoing DWI prevention programs administered by the Department of Finance and Administration, Department of Transportation, Department of Health, the Children Youth and Families Department, and the Human Services Department. This report is a periodic report that describes aspects of the DWI problem that can best be monitored by combining DWI citation data with screening and tracking information on DWI offenders. Information for this report was drawn from the NM DWI Screening and Tracking System maintained by the Department of Finance and Administration as part of its Local DWI (LDWI) Program. The LDWI Program provides oversight to the 33 county DWI programs. The county DWI programs collect alcohol screening information on DWI offenders using a standard screening instrument; track completion of sanctions by these offenders (including probation, DWI school, victim impact panel, treatment, community service, jail, and ignition interlock); and enter these data into the NM DWI Screening and Tracking System, which is housed at ADE Incorporated of Clarkston, Michigan. For the purposes of this report, this screening and tracking information was linked to data from the Citation Tracking System (CTS), which is a database maintained by the Motor Vehicle Division of the New Mexico Tax and Revenue Department. The CTS contains arrest and conviction records of all DWI offenders in New Mexico since July 1984. Linking the two databases creates a more complete profile of convicted DWI offenders in New Mexico. The major findings from 2000-2007 from these linked data sources are:
• Over the 8 years from 2000-2007, 74% of DWI offenders were screened. The screening rate increased from 68% in 2000 to 81% in 2006 (2007 conviction and screening results are not yet complete).
• Characteristics of DWI offenders
o Males are much more likely to be DWI offenders than females. o The proportions of both Hispanics and American Indians among DWI
offenders were higher than their proportion in the New Mexico population.
o By age, the largest group of offenders was between 21-29 years old. This age group comprised 40% of offenders, while they made up only 17% of

4
the general population. The age groups 18-20 years and 30-39 years were also over-represented among DWI offenders relative to their presence in the general population of New Mexico. Ages 50-59 years and 60 years and over were under-represented among DWI offenders.
o DWI offenders were more likely to have never been married than the New Mexico population.
o DWI offenders were less likely to have completed post-high school education than the NM population.
o 72% of DWI offenders were employed. o Bars were the most frequent source of alcohol for DWI offenders, the
reported source for almost a third (32.2%) of offenders. • Probation and ignition interlock are the two most frequently utilized DWI
sanctions. o Community service, ignition interlock, and driver’s license revocation
have been increasing in frequency of utilization in recent years.
• Characteristics of DWI offenders that have been re-arrested (recidivists): o American Indians were the most likely to be re-arrested, with a risk of re-
arrest 1.8 times that of Non-Hispanic Whites. Blacks and Hispanics both had a 50% higher risk of re-arrest than Non-Hispanic Whites.
o Males had a higher risk of re-arrest than females. o There was a clear association between offender’s age and risk of re-arrest,
with younger offenders having a higher risk of re-arrest during the 8-year follow-up period analyzed for this report. For example, the 8-year re-arrest rate was 29.2% among 18-20 year-olds, 20.2% among 40-49 year olds, and 12.0% among offenders aged 60 and over.
o First-time DWI offenders were less likely to be re-arrested than were those with prior convictions. Risk of re-arrest increased with the number of prior convictions, with risk particularly elevated among offenders with three or more prior convictions.
o DWI offenders who obtained the alcohol consumed before their initial (reference) arrest at a grocery, convenience, or liquor store were more likely to be re-arrested than those who obtained alcohol from other sources.

5
Recommendations • The percentage of convicted DWI offenders who were screened has increased
steadily over the last 8 years, from 68% in 2000 to 81% in 2006. Even with this clear improvement, more needs to be done to encourage the judiciary and other agencies to more fully comply with the requirement to screen and track DWI offenders.
• The Screening and Tracking System should continue to be improved to support reporting and program evaluation. The addition of standard excessive drinking indicators (e.g., for binge and chronic heavy drinking and alcohol-impaired driving) as well as a more standard alcohol problem screening instrument (e.g., the CAGE or AUDIT screening instrument) will increase the understanding of DWI offenders and how they compare to the general population; and help inform selection of the most appropriate prevention strategies for reducing DWI-related problems.
• Prevention interventions should primarily target males, people under age 40
(especially young adults aged 21-29), American Indians and Hispanics.
• Because younger age groups have high rates of arrest and re-arrest, because one-third of offenders began drinking monthly between 12 and 18 years of age, and because early initiation of alcohol use is strongly associated with the development of alcohol dependence among adults, DWI prevention efforts should include a focus on reducing underage drinking. Evidence suggests that a comprehensive set of strategies will be most successful in achieving this goal. While education alone has been shown to be effective in changing knowledge and attitudes, it is less effective in changing drinking behavior. For this reason, educational efforts should be complemented by efforts to reduce the availability of alcohol to underage drinkers, using recommended strategies such as enforcement of minimum drinking age laws (through compliance checks and shoulder tap operations), keg registration, social host liability laws, and party patrols.
• Increasing the price of alcoholic beverages is an effective strategy for reducing alcohol-related harm. Evidence suggests that this strategy especially impacts the consumption of high risk groups including underage and chronic heavy drinkers. Comprehensive drinking-driving counter-measures such as increased DWI law enforcement coupled with a mass media campaign are effective in reducing alcohol-related motor vehicle crash deaths. Minimum drinking age laws and their enforcement, as well as stronger liquor control regulations (e.g., prohibiting sales and service to underage and intoxicated persons) and their enforcement are also effective in reducing negative consequences of excessive drinking. Finally, screening and brief intervention for problem drinkers is an effective evidence-based prevention strategy that should be more broadly deployed in New Mexico. The local DWI programs can help advocate for these strategies at the state and local level.
• The DFA Local Government Division should continue to work with the state Tribal
DWI Task Force, the Office of the Governor, and New Mexico tribal governments to provide DWI prevention programs and services in tribal areas and to tribal members.

6
Introduction
New Mexico has made substantial progress in reducing alcohol-related crash deaths over the last two decades. DWI legislation and programs have contributed to this decline.
Total and Alcohol-Involved Crash Deaths, Legislative and Administrative Actions in New Mexico, 1980-2007
In 1993, the State of New Mexico Legislature enacted the Local DWI Program Act and established the Local DWI Grant Fund. The Local Government Division (LGD) of the Department of Finance and Administration administers the Fund. All appropriations are awarded upon DWI Grant Council approval in accordance with the program established under the Local DWI Grant Program Act. Since 1997, the LGD has had an agreement with the Epidemiology and Response Division of the New Mexico Department of Health to analyze and report DWI-related data for the 33-county Local DWI Program. This reporting is based on data from the NM DWI Screening and Tracking System linked with data from the Motor Vehicle Division’s Citation Tracking System (CTS). The CTS has all arrest and conviction information on all offenders but lacks the demographic and sanction information that is captured by the NM DWI Screening and Tracking System. Linking the two databases creates a more complete profile of offenders convicted of DWI in New Mexico. The NM DWI Screening and Tracking System consists of a database used to monitor

7
DWI offenders after sentencing. Since 1997, all 33 county local DWI programs have used the system to collect alcohol screening information and to track the completion of court-ordered DWI sanctions by DWI offenders within their counties. Local DWI program staffs in each county enter all information into the system. The system contains DWI offender data such as name, social security number, birth date, and address. It also contains screening information self-reported by offenders during a screening session conducted by the local DWI program staff following (or in some rare cases preceding) conviction. This screening information is collected via the offender’s written responses to the NEEDS Survey instrument, an alcohol and substance abuse screening instrument developed and maintained by ADE, Inc. This instrument includes one-hundred-and-thirty questions designed to assess the offender’s severity of substance abuse, emotional stability, personal support system, criminal history, and overall need for services. In addition to this screening information, the system also captures each offender’s DWI sanctions from the court’s Judgement and Sentencing (J&S) document. These J&S data include the sentencing judge, sanction start and completion dates, and information about where the offender is sent for a particular sanction, and how many sessions or days were assigned for each specific sanction. Through 2002 five penalties or sanctions were monitored. These were: a) DWI School, a required class on driver safety for first offenders, b) Alcohol and Substance Abuse Treatment, either inpatient, outpatient or self-help
groups such as Alcoholics Anonymous, c) Probation, either supervised or unsupervised, d) Community Service, requiring time spent at a community activity such as collecting
trash along roadways, e) Victim Impact Panel, attending a meeting with victims of DWI crashes. In 2003, two sanctions, Jail and Ignition Interlock, were added. The Citation Tracking System is the repository for information on all DWI citations in the state, dating back to July 1984. The CTS is a tracking system used by the Motor Vehicle Division of the New Mexico Taxation and Revenue Department to support the administrative revocation of drivers' licenses for DWI under the implied consent act (statutes 66-8-107 to 66-8-112). Licenses may be revoked for refusal to submit to a chemical test, or for BAC levels of .08 or higher. The CTS is also used to schedule and track the results of hearings requested by revoked drivers. Additionally, the CTS is used to record the results of court action on DWI citations. The only New Mexico DWI citation data not captured in the CTS during the time covered by this report is data pertaining to arrests by tribal law enforcement agencies.

8
Methods
Person-based NM DWI Screening and Tracking System data were linked with person-based CTS data to provide a more complete arrest and conviction record for all offenders in the participating 33 county DWI programs. Offenders in both databases were linked probabilistically using Link Plus software. Personal identifiers used in the linkage process included social security number, date of birth, first name, last name, middle initial, sex, and driver’s license number. Social security number, date of birth, last name, and first name were used to block the two data files. Matching variables were compared between the records only within these blocks. The linkage process calculates a total score that indicates, for any pair of records, how likely it is that they both refer to the same person. The total score for a linkage between any two records is the sum of the scores generated from matching individual fields. Any linkages with scores that are over the cut off value were selected into the linked result. However, the final linked dataset was decided after the uncertain matches were manually reviewed. Ninety-seven percent of the persons in the NM DWI Screening and Tracking System dataset were matched with one or more records in the CTS. Once DWI arrests and NM DWI Screening and Tracking System individual’s cases were matched, the DWI citation that led to the first conviction with a corresponding screening and tracking record was identified as the reference case. The identification of a reference case enabled categorization of prior DWIs and re-arrests relative to that case. The linked dataset was used to describe DWI offender characteristics, including race/ethnicity, age, education, marital status and employment, for all DWI offenders arrested in 2006 and subsequently convicted and screened. Substance abuse information was also described, including blood alcohol concentration, source of alcohol before arrest, primary drug used and age of initial monthly alcohol use; as were DWI sanctions and recommended treatment levels. The linked dataset was also used to assess rates of DWI recidivism and to identify characteristics of DWI offenders that are associated with re-arrest, including race/ethnicity, gender, age group, prior DWI convictions and source of alcohol before arrest. Recidivism was analyzed using survival analysis techniques. These techniques are useful for tracking “time to failure”, which is the time elapsed between an initial event (in this case the reference case DWI conviction described above) and a follow-up event (in this case, the first DWI re-arrest following this reference case conviction). For purposes of this report, recidivism was defined as having at least one DWI re-arrest following the reference case conviction. Re-arrest rates were calculated among the cohort of DWI offenders with a reference case conviction, as the percent of such offenders with at least one DWI re-arrest during the follow-up period. One of the survival analysis techniques, Cox Regression, enables comparison of the risk of failure (i.e., first re-arrest) between population sub-groups (e.g., by sex). This comparison is reported as a relative risk, also known as a hazard ratio. In this report, survival (time to re-arrest, re-arrest rates, hazard ratios) was compared one characteristic at a time (e.g., by sex or race; but not by sex and race together). Confidence intervals for parameter estimates were calculated.

9
New Mexico DWI Screening and Tracking System and Citation Tracking System
Number of DWI Convictions and Screenings
in New Mexico, 2000 - 2007
13,774 13,64513,052 13,134 13,339
12,772 12,758
11,044
8,380
10,3339,92910,0729,558
9,1259,3589,336
0
2,000
4,000
6,000
8,000
10,000
12,000
14,000
16,000
2000 2001 2002 2003 2004 2005 2006 2007
DWI ConvictionsScreenings
Sources: Citation Tracking System (CTS), New Mexico Taxation and Revenue Department NM Screening & Tracking System, New Mexico Department of Finance and Administration
This figure provides the annual number of offenders who have been screened by the NM DWI Screening and Tracking System, compared to the number of convictions reported by the Citation Tracking System (CTS). In 2000, there were 9,336 offenders screened by the NM DWI Screening and Tracking System, and 13,774 convictions reported in the CTS. In 2003, there were 9,558 offenders screened and 13,134 convictions reported; and in 2006 there were 10,333 offenders screened and 12,758 convictions reported in the CTS. During the period 2000-2006 the average time from arrest to conviction remained stable at about five months. During this period the annual number of offenders screened as a proportion of the annual number of convictions increased steadily from 67.8% in 2000 to 81.0% in 2006. The time required for the judicial and screening processes to be completed, and for the county DWI programs to enter data into the ADE system introduces time lags into this reporting. As a result, numbers of convictions and screenings can be expected to increase with time (i.e., when these data are reported next year, the numbers of convictions and screenings for 2007 will be substantially higher than they are in this report).

10
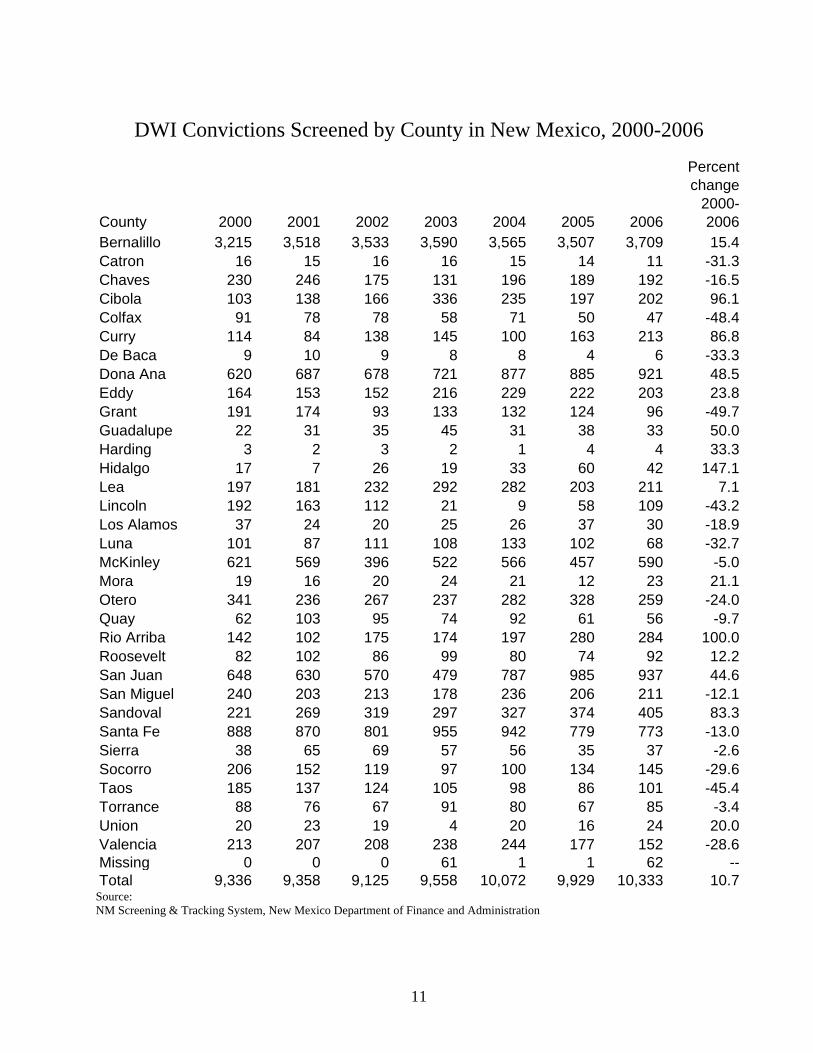
County DWI Screenings The following chart shows percentage of convicted DWI offenders screened by the NM DWI Screening and Tracking System for seven years, 2000-2006. For these seven years, all 33 counties were included. The percentage of those screened has increased steadily since 2000. From 2000 to 2006, total annual screenings in New Mexico increased by more than 10% from 9,336 to 10,271; 15 counties increased the number of screenings provided for DWI offenders, and 18 counties decreased the number of screenings. Hidalgo, Rio Arriba, Cibola, Curry, and Sandoval had the greatest percentage increases in the number of screenings.
Percentage of DWI Convictions Screened
in New Mexico, 2000 - 2006
67.8 68.6 69.972.8 75.5 77.7
81.0
0
20
40
60
80
100
2000 2001 2002 2003 2004 2005 2006
Per
cent
(%)
Source: Linked NM DWI Screening and Tracking System and CTS convicted DWI offenders, 2000-2006
The percentage of DWI offenders screened from 2000 to 2006 increased substantially, from 67.8% to 81.0%. The counties with the highest average annual DWI screening percentages during 2000-2006 were Harding (90.0%), Quay (89%), Bernalillo (88.5%), Los Alamos (84.5%), and Socorro (83.9%). The counties with the lowest average DWI screening percentages were Lincoln (46.1%), San Juan (47.2%), Curry (48.4%), Hidalgo (48.8%), and Sierra (56.6%); although it should be noted that rates have been improving considerably in most of these counties in recent years.
The five counties that saw the biggest increase in the percentage of DWI offenders that were screened from 2000 to 2006 were Sandoval (increased from 48.0% to 99.8%), Hidalgo (37.8% to 84.0%), Eddy (44.0% to 87.9%), Valencia (59.7% to 100.0%), and Rio Arriba (43.4% to 82.6%). Harding and Taos counties saw the largest decreases in the percentage of DWI offenders screened from 2000 to 2006.
11
DWI Convictions Screened by County in New Mexico, 2000-2006
County 2000 2001 2002 2003 2004 2005 2006
Percent change
2000-2006
Bernalillo 3,215 3,518 3,533 3,590 3,565 3,507 3,709 15.4Catron 16 15 16 16 15 14 11 -31.3Chaves 230 246 175 131 196 189 192 -16.5Cibola 103 138 166 336 235 197 202 96.1Colfax 91 78 78 58 71 50 47 -48.4Curry 114 84 138 145 100 163 213 86.8De Baca 9 10 9 8 8 4 6 -33.3Dona Ana 620 687 678 721 877 885 921 48.5Eddy 164 153 152 216 229 222 203 23.8Grant 191 174 93 133 132 124 96 -49.7Guadalupe 22 31 35 45 31 38 33 50.0Harding 3 2 3 2 1 4 4 33.3Hidalgo 17 7 26 19 33 60 42 147.1Lea 197 181 232 292 282 203 211 7.1Lincoln 192 163 112 21 9 58 109 -43.2Los Alamos 37 24 20 25 26 37 30 -18.9Luna 101 87 111 108 133 102 68 -32.7McKinley 621 569 396 522 566 457 590 -5.0Mora 19 16 20 24 21 12 23 21.1Otero 341 236 267 237 282 328 259 -24.0Quay 62 103 95 74 92 61 56 -9.7Rio Arriba 142 102 175 174 197 280 284 100.0Roosevelt 82 102 86 99 80 74 92 12.2San Juan 648 630 570 479 787 985 937 44.6San Miguel 240 203 213 178 236 206 211 -12.1Sandoval 221 269 319 297 327 374 405 83.3Santa Fe 888 870 801 955 942 779 773 -13.0Sierra 38 65 69 57 56 35 37 -2.6Socorro 206 152 119 97 100 134 145 -29.6Taos 185 137 124 105 98 86 101 -45.4Torrance 88 76 67 91 80 67 85 -3.4Union 20 23 19 4 20 16 24 20.0Valencia 213 207 208 238 244 177 152 -28.6Missing 0 0 0 61 1 1 62 --Total 9,336 9,358 9,125 9,558 10,072 9,929 10,333 10.7
Source: NM Screening & Tracking System, New Mexico Department of Finance and Administration

12
Percentage of DWI Convictions Screened by County
in New Mexico, 2000 - 2006
County 2000 2001 2002 2003 2004 2005 2006Bernalillo 81.2% 84.8% 89.7% 100.0% 93.2% 84.8% 85.9%Catron 61.5% 75.0% 80.0% 69.6% 68.2% 48.3% 55.0%Chaves 78.2% 76.6% 76.4% 73.2% 75.7% 84.4% 100.0%Cibola 41.5% 67.3% 81.0% 79.2% 76.8% 74.1% 78.9%Colfax 55.2% 62.4% 67.8% 59.2% 60.2% 61.7% 66.2%Curry 39.9% 28.7% 42.1% 46.9% 41.0% 67.4% 72.7%De Baca 60.0% 76.9% 60.0% 80.0% 100.0% 80.0% 75.0%Dona Ana 71.2% 72.7% 59.4% 59.8% 67.4% 70.8% 70.5%Eddy 44.0% 55.2% 62.8% 70.4% 77.1% 84.7% 87.9%Grant 79.6% 78.7% 67.4% 78.2% 71.7% 72.5% 71.1%Guadalupe 57.9% 72.1% 89.7% 73.8% 75.6% 90.5% 82.5%Harding 100.0% 100.0% 100.0% 50.0% 100.0% 100.0% 80.0%Hidalgo 37.8% 14.0% 40.6% 28.4% 60.0% 76.9% 84.0%Lea 56.3% 56.6% 66.9% 78.1% 76.2% 82.9% 76.2%Lincoln 72.5% 79.5% 57.1% 9.1% 4.8% 29.7% 69.9%Los Alamos 88.1% 80.0% 80.0% 96.2% 70.3% 86.0% 90.9%Luna 57.4% 60.0% 68.1% 77.1% 75.6% 69.4% 54.8%McKinley 73.3% 66.2% 61.4% 69.9% 62.6% 76.0% 83.2%Mora 46.3% 39.0% 48.8% 72.7% 63.6% 52.2% 85.2%Otero 70.2% 63.1% 68.6% 64.6% 70.1% 92.9% 87.5%Quay 84.9% 88.8% 86.4% 83.1% 94.8% 100.0% 84.8%Rio Arriba 43.4% 40.8% 62.5% 73.1% 81.1% 83.6% 82.6%Roosevelt 49.7% 67.1% 71.1% 79.2% 82.5% 69.8% 69.7%San Juan 43.5% 35.4% 31.9% 29.2% 53.9% 66.2% 70.4%San Miguel 81.9% 86.4% 75.0% 65.2% 71.1% 86.6% 82.7%Sandoval 48.0% 64.0% 88.9% 80.5% 86.7% 89.5% 99.8%Santa Fe 81.2% 81.1% 79.8% 81.5% 80.7% 79.9% 82.9%Sierra 37.6% 55.6% 72.6% 42.9% 67.5% 53.8% 66.1%Socorro 83.4% 78.8% 84.4% 83.6% 77.5% 83.2% 96.7%Taos 86.9% 75.3% 77.5% 71.9% 77.8% 58.9% 69.2%Torrance 68.8% 70.4% 84.8% 75.2% 73.4% 68.4% 75.9%Union 66.7% 85.2% 65.5% 50.0% 80.0% 84.2% 100.0%Valencia 59.7% 66.3% 72.0% 71.9% 78.7% 85.9% 100.0%Total 67.8% 68.6% 69.9% 72.8% 75.5% 77.7% 81.0%
Sources: Citation Tracking System (CTS), New Mexico Taxation and Revenue Department NM Screening & Tracking System, New Mexico Department of Finance and Administration

13
DWI Offender Characteristics
Gender of the DWI Offender Population in New Mexico (2006) and the New Mexico Adult Population (2006, ages 18+)
76.0
24.0
48.651.4
0
10
20
30
40
50
60
70
80
90
Male Female
Per
cent
(%)
DWI OffendersNM Population
Sources: Citation Tracking System (CTS), New Mexico Taxation and Revenue Department NM Screening & Tracking System, New Mexico Department of Finance and Administration Bureau of Business and Economic Research, UNM
This section reports characteristics of all DWI offenders arrested in 2006, convicted, and screened by local DWI programs. DWI offender characteristics were self-reported using the screening questionnaire for convicted DWI offenders; or reported from the CTS if these data were available in that system. These sources showed that there was a much higher proportion of males and a much lower proportion of females among DWI offenders than in New Mexico adult population. In other words, males are over-represented in the New Mexico DWI offender population and females are under-represented.

14
Race/Ethnicity of the DWI Offender Population in New Mexico (2006)
and the New Mexico Adult Population (2006, ages 18+)
50.0
26.3
21.5
38.8
47.2
9.8
2.5 1.71.80.4
0
10
20
30
40
50
60
Hispanic White American Indian Black Asian
Perc
ent (
%)
DWI OffendersNM Population
Sources: Citation Tracking System (CTS), New Mexico Taxation and Revenue Department NM Screening & Tracking System, New Mexico Department of Finance and Administration Bureau of Business and Economic Research, UNM
There were a disproportionate number of Hispanics and American Indians convicted of DWI compared to their proportions in the New Mexico adult population.

15
Age Distribution of DWI Offenders in New Mexico (2006)
and the New Mexico Adult Population (2006, ages 18+)
10.6
39.6
22.3
17.9
7.5
2.2
6.1
16.9 16.1
19.718.4
22.9
0
5
10
15
20
25
30
35
40
45
50
18-20 years old 21-29 years old 30-39 years old 40-49 years old 50-59 years old 60+ years old
Per
cent
(%)
DWI OffendersNM Population
Sources: Citation Tracking System (CTS), New Mexico Taxation and Revenue Department NM Screening & Tracking System, New Mexico Department of Finance and Administration Bureau of Business and Economic Research, UNM
In general, the age distribution of offenders convicted of DWI in 2006 was younger than the New Mexico population. Persons 18 - 39 years of age were over-represented in the DWI offender population. Persons in New Mexico 40 years of age and older were underrepresented in the DWI offender population.
16
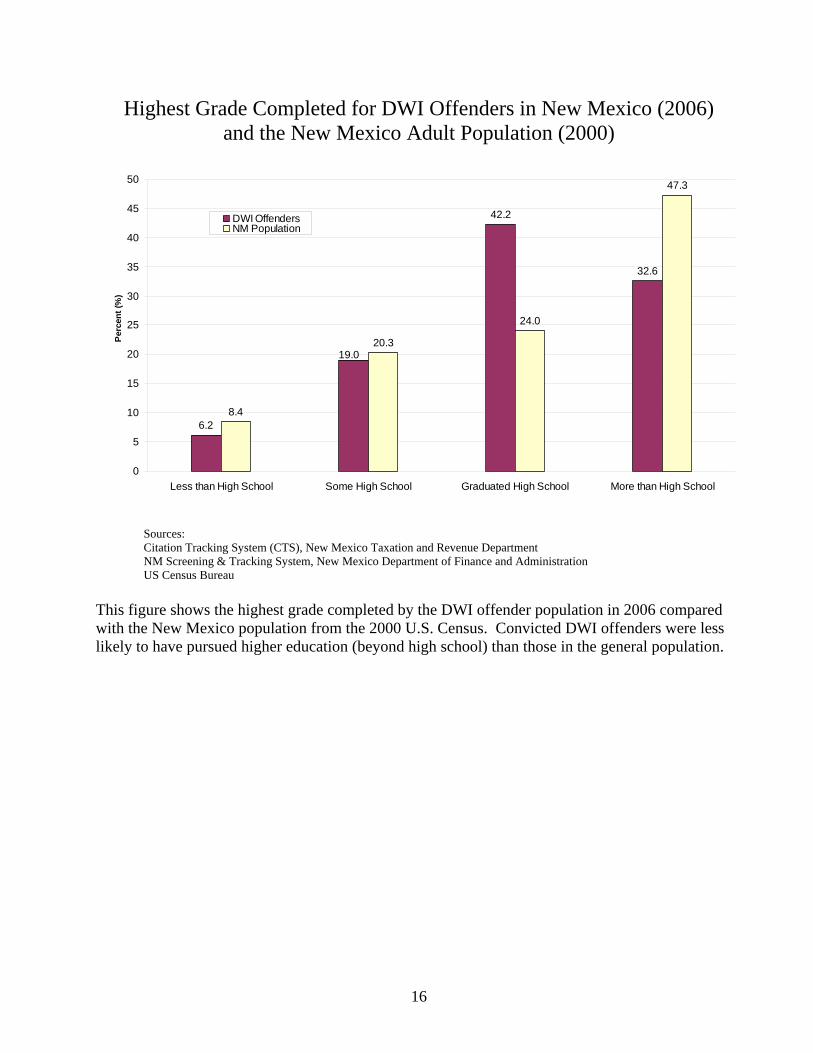
Highest Grade Completed for DWI Offenders in New Mexico (2006) and the New Mexico Adult Population (2000)
6.2
42.2
32.6
8.4
20.3
24.0
47.3
19.0
0
5
10
15
20
25
30
35
40
45
50
Less than High School Some High School Graduated High School More than High School
Perc
ent (
%)
DWI OffendersNM Population
Sources: Citation Tracking System (CTS), New Mexico Taxation and Revenue Department NM Screening & Tracking System, New Mexico Department of Finance and Administration US Census Bureau
This figure shows the highest grade completed by the DWI offender population in 2006 compared with the New Mexico population from the 2000 U.S. Census. Convicted DWI offenders were less likely to have pursued higher education (beyond high school) than those in the general population.

17
Marital Status of DWI Offenders in New Mexico (2006) and the New Mexico Adult Population (2000)
33.8
5.8
13.1
1.3
45.9
50.5
6.1
27.5
11.6
4.3
0
10
20
30
40
50
60
Married Separated Divorced Widow/Widower Never Married
Perc
ent (
%)
DWI OffendersNM Population
Sources: Citation Tracking System (CTS), New Mexico Taxation and Revenue Department NM Screening & Tracking System, New Mexico Department of Finance and Administration US Census Bureau
This figure shows the marital status of offenders screened by the NM DWI Screening and Tracking System in 2006, compared to the marital status of the NM adult population from the 2000 U.S. Census. Convicted DWI offenders were less likely to be married than the general NM population. Convicted DWI offenders were more likely than others to have never been married. This may be partially due to the fact that the DWI offender population was younger than the general NM population.
18
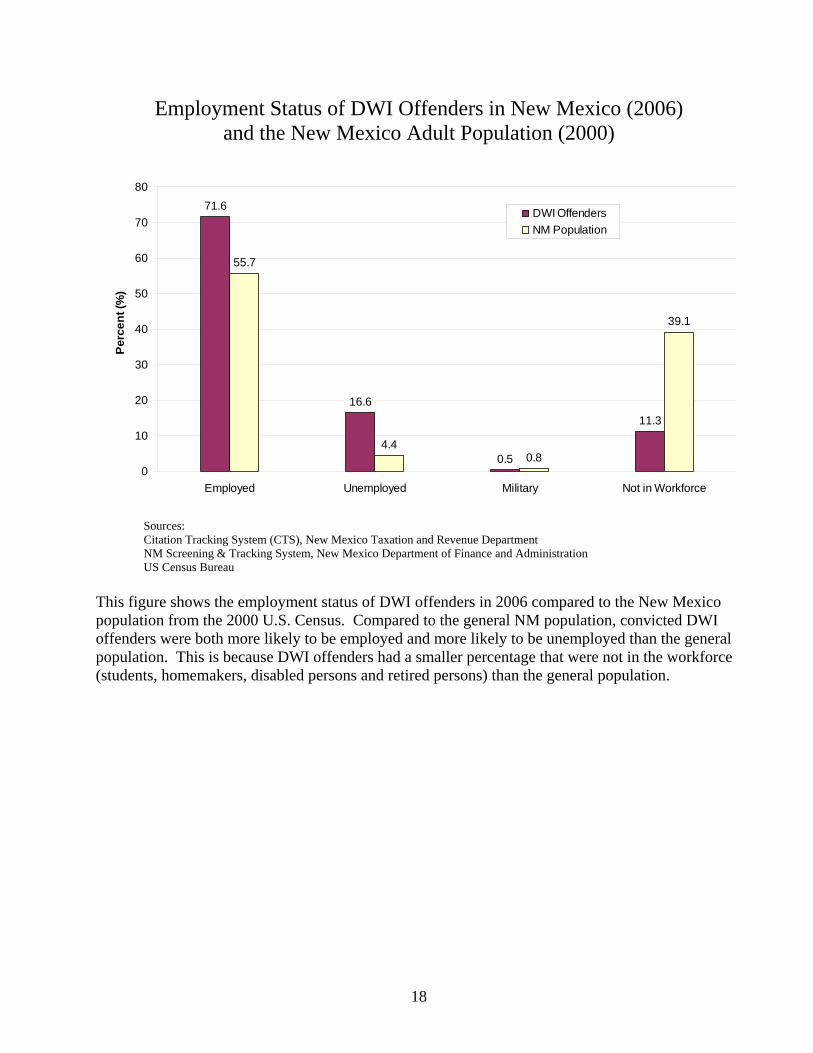
Employment Status of DWI Offenders in New Mexico (2006) and the New Mexico Adult Population (2000)
71.6
16.6
0.5
11.3
55.7
4.40.8
39.1
0
10
20
30
40
50
60
70
80
Employed Unemployed Military Not in Workforce
Perc
ent (
%)
DWI OffendersNM Population
Sources: Citation Tracking System (CTS), New Mexico Taxation and Revenue Department NM Screening & Tracking System, New Mexico Department of Finance and Administration US Census Bureau
This figure shows the employment status of DWI offenders in 2006 compared to the New Mexico population from the 2000 U.S. Census. Compared to the general NM population, convicted DWI offenders were both more likely to be employed and more likely to be unemployed than the general population. This is because DWI offenders had a smaller percentage that were not in the workforce (students, homemakers, disabled persons and retired persons) than the general population.

19
Substance Abuse Information
Blood Alcohol Content (BAC) Levels Among Convicted DWI Offenders in New Mexico, 2006
1.6
20.9
34.9
40.4
2.2
0 5 10 15 20 25 30 35 40 45 50
BAC 0.30+
BAC 0.20-<0.30
BAC 0.15-<0.20
BAC 0.08-<0.15
BAC <0.08
Percent (%)
Sources: Citation Tracking System (CTS), New Mexico Taxation and Revenue Department NM Screening & Tracking System, New Mexico Department of Finance and Administration
The alcohol and substance abuse information shown in this section came from both the screening and tracking self-administered screening questionnaire and from the CTS record of BAC testing. With regard to BAC test results, a substantial number of offenders (19%) were missing BAC test data from either source, due to refusal to be tested or to incomplete or missing test results (CTS); or to refusal to self-report test results (Screening and Tracking System). For those offenders with reported results, if the BAC in the CTS file was greater than 0 then that BAC was reported (94% of reported BACs); if the BAC in the CTS file was missing or 0, but the BAC in the screening and tracking file was greater than 0, then that BAC was reported (6% of reported BACs). This figure shows the distribution of actual BAC levels based on these data sources, for offenders convicted in 2006. The mean BAC level was 0.16 g/dl.

20
Source of Alcohol before Arrest among Convicted DWI Offenders New Mexico, 2006
Liquor Source Number PercentBar 3,191 32.2Other Person’s Home 1,350 13.6Social Gathering/Party 1,258 12.7Your Home 991 10.0Grocery/Convenience Store 957 9.7Other 948 9.6Liquor Store 717 7.2Restaurant 506 5.1Total 9,918 100.0
Source: NM DWI Screening and Tracking System.
Source of Alcohol before Arrest among Convicted DWI Offenders by Year of Reference Violation, New Mexico, 2000-2006
0
5
10
15
20
25
30
35
40
2000 2001 2002 2003 2004 2005 2006Year
Perc
ent (
%)
Bar
Other Person's Home
Social Gathering/Party
Grocery/ConvenienceStore Your Home
Other
Liquor Store
Restaurant
Drive up
Source: NM DWI Screening and Tracking System.
In 2006, bars continued to be the most frequent source of alcohol prior to arrest. Note that while bars are by far the most frequently reported liquor source by DWI offenders, bars and restaurants are the least frequently reported liquor source among offenders who have been re-arrested (see page 31). In 2006, another person’s home and social gatherings or parties were each source of alcohol for approximately 13-14% of DWI offenders. Bars, restaurants and other places where alcohol can be purchased (i.e., establishments regulated by government) were the source of alcohol for the majority (54.2%) of DWI convictions in 2006.

21
Primary Substance Used by DWI Offenders* in New Mexico, 2006
All other Drugs, 3.8
Sedatives & Hypnotics,
1.2
Marijuana, 7.5
None, 8.5
Alcohol, 79.0
* The substance “tried or used most often” during the three years prior to arrest. Source: NM DWI Screening and Tracking System
This chart shows the primary drug used by DWI offenders in the NM DWI Screening and Tracking System. Alcohol was the primary substance used by 79.0% of offenders. Marijuana was the second most common primary substance identified (7.5%).
22
Age of Initial Monthly Alcohol Use among DWI Offenders
in New Mexico, 2006
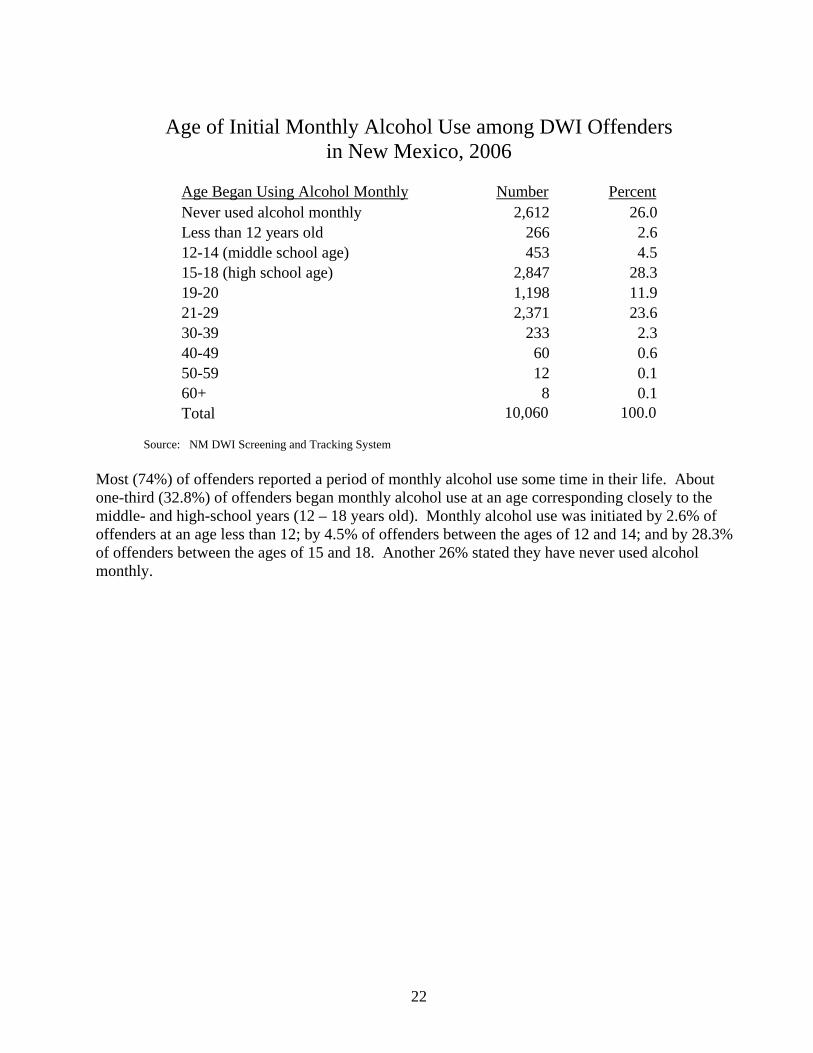
Age Began Using Alcohol Monthly Number PercentNever used alcohol monthly 2,612 26.0Less than 12 years old 266 2.612-14 (middle school age) 453 4.515-18 (high school age) 2,847 28.319-20 1,198 11.921-29 2,371 23.630-39 233 2.340-49 60 0.650-59 12 0.160+ 8 0.1Total 10,060 100.0
Source: NM DWI Screening and Tracking System
Most (74%) of offenders reported a period of monthly alcohol use some time in their life. About one-third (32.8%) of offenders began monthly alcohol use at an age corresponding closely to the middle- and high-school years (12 – 18 years old). Monthly alcohol use was initiated by 2.6% of offenders at an age less than 12; by 4.5% of offenders between the ages of 12 and 14; and by 28.3% of offenders between the ages of 15 and 18. Another 26% stated they have never used alcohol monthly.

23
Sentencing Information
Sanctions Assigned to DWI Offenders By Year of Reference Violation, New Mexico, 2000-2006
0
10
20
30
40
50
60
70
80
90
100
2000 2001 2002 2003 2004 2005 2006Year
Per
cent
(%)
Probation
Ignition Interlock
Community Service
DWI School
Victim Impact Panel
Treatment
Jail
Driver's LicenceRevoked
Note: DWI offenders can be assigned to more than one sanction per conviction. Percentages total to more than 100% because a single offender may receive multiple sanctions. Source: NM DWI Screening and Tracking System
This sentencing information represents data entered into the NM DWI Screening and Tracking System by LDWI Program staff. This information is most often entered from a copy of the court Judgement and Sentencing (J&S) document. This information is not based on actual J&S data from the Administrative Office of the Courts (e.g., a dataset recording actual J&S sanctions). Offenders are sentenced to one or more of several different sanctions for each DWI conviction. The most common sanction for DWI offenders in 2006 was probation (87% of all offenders). Other common sanctions in 2006 included community service (72%), ignition interlock (70%), DWI school (69%), participation in a victim impact panel (63%), outpatient or inpatient treatment (43%), and jail (30%). Driver’s licenses were revoked for 11% of offenders. Probation, DWI school, and victim impact panels have historically been the most frequently assigned sanctions. In the past several years, however, new sanctions have emerged. Since 2002, ignition interlock, and, since 2004, community service have been used with increasing frequency, and are now among the most common sanctions. Also starting in 2004 driver’s license revocation began a more gradual increase in use as a sanction, and in 2006 was used for 11% of offenders.
24
Treatment Information Treatment Levels Recommended by Screening
in New Mexico, 2006
Medically Managed IP
Care0.2%
Residential Treatment
6.1%No Referral
or Referral to Education
19.9%
Outpatient Treatment *
73.9%
* Includes outpatient care and intensive outpatient care Source: NM DWI Screening and Tracking System
• No Referral or Referral to Education - recommended for individuals who may have had a substance abuse problem
at one time, but report no use for at least one year. • Outpatient Treatment - recommended for individuals who report abstinence but their current attitude and/or high risk
behavior suggests further investigation is needed. Includes some individuals who report a history of substance abuse but report recent abstinence.
• Intensive Outpatient Treatment beyond Detoxification - although this person may not require medical monitoring, his emotional and environmental circumstances may be too unstable for him to function without close monitoring.
• Inpatient Treatment - recommended because of a person’s apparent cross addiction history of substance abuse treatment, and current emotional and environmental vulnerability.
• Medical Monitoring - recommended because of an individual’s apparent substance abuse addiction, history of substance abuse treatment, and other medical problems which may relate to substance abuse and current emotional and/or environmental vulnerability.
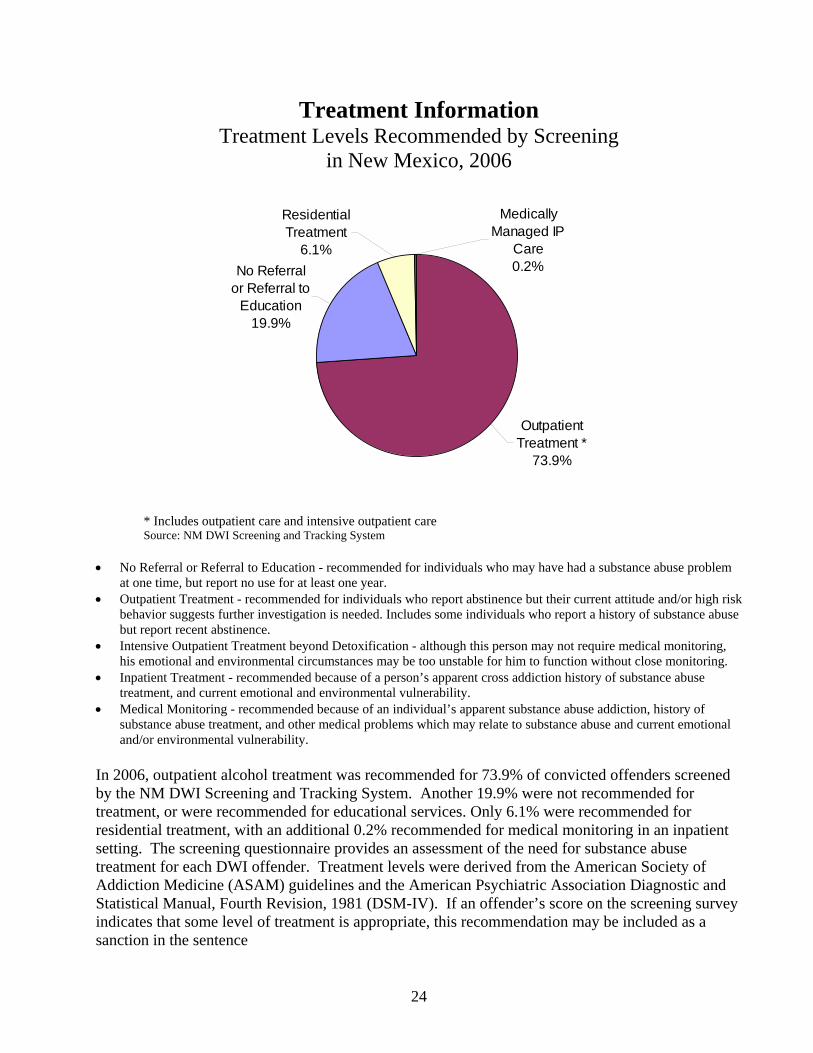
In 2006, outpatient alcohol treatment was recommended for 73.9% of convicted offenders screened by the NM DWI Screening and Tracking System. Another 19.9% were not recommended for treatment, or were recommended for educational services. Only 6.1% were recommended for residential treatment, with an additional 0.2% recommended for medical monitoring in an inpatient setting. The screening questionnaire provides an assessment of the need for substance abuse treatment for each DWI offender. Treatment levels were derived from the American Society of Addiction Medicine (ASAM) guidelines and the American Psychiatric Association Diagnostic and Statistical Manual, Fourth Revision, 1981 (DSM-IV). If an offender’s score on the screening survey indicates that some level of treatment is appropriate, this recommendation may be included as a sanction in the sentence
25
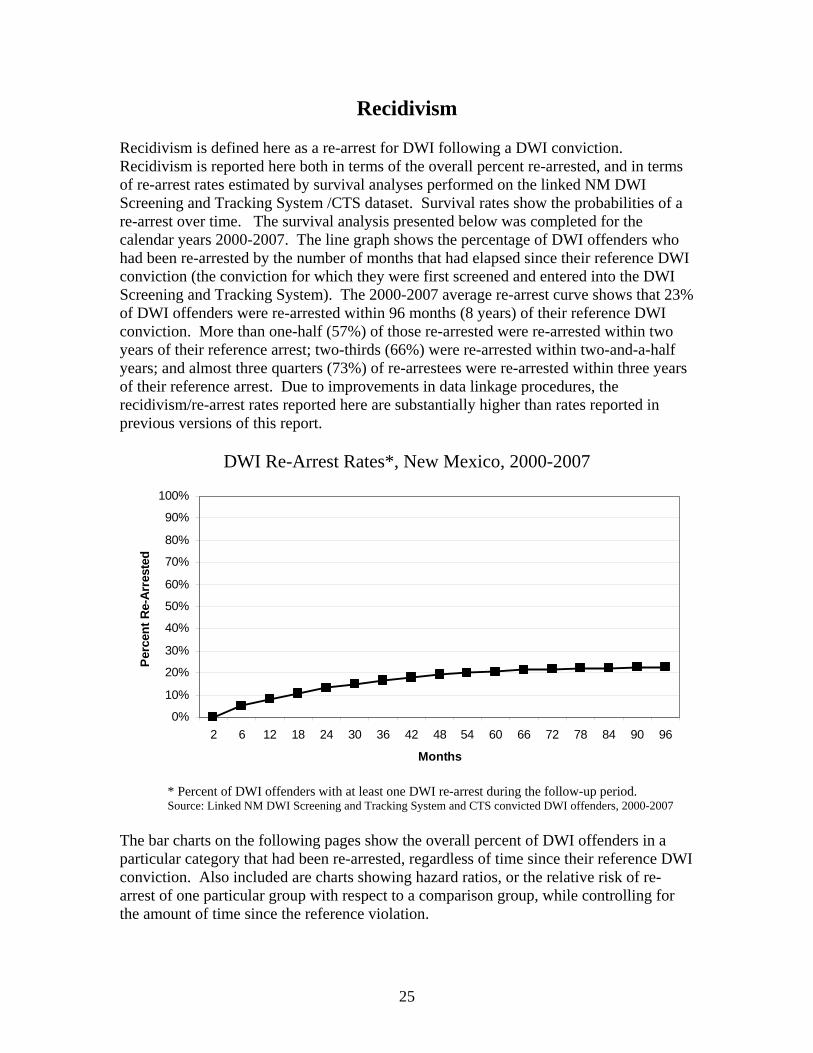
Recidivism Recidivism is defined here as a re-arrest for DWI following a DWI conviction. Recidivism is reported here both in terms of the overall percent re-arrested, and in terms of re-arrest rates estimated by survival analyses performed on the linked NM DWI Screening and Tracking System /CTS dataset. Survival rates show the probabilities of a re-arrest over time. The survival analysis presented below was completed for the calendar years 2000-2007. The line graph shows the percentage of DWI offenders who had been re-arrested by the number of months that had elapsed since their reference DWI conviction (the conviction for which they were first screened and entered into the DWI Screening and Tracking System). The 2000-2007 average re-arrest curve shows that 23% of DWI offenders were re-arrested within 96 months (8 years) of their reference DWI conviction. More than one-half (57%) of those re-arrested were re-arrested within two years of their reference arrest; two-thirds (66%) were re-arrested within two-and-a-half years; and almost three quarters (73%) of re-arrestees were re-arrested within three years of their reference arrest. Due to improvements in data linkage procedures, the recidivism/re-arrest rates reported here are substantially higher than rates reported in previous versions of this report.
DWI Re-Arrest Rates*, New Mexico, 2000-2007
0%
10%
20%
30%
40%
50%
60%
70%
80%
90%
100%
2 6 12 18 24 30 36 42 48 54 60 66 72 78 84 90 96
Months
Perc
ent R
e-Ar
rest
ed
* Percent of DWI offenders with at least one DWI re-arrest during the follow-up period. Source: Linked NM DWI Screening and Tracking System and CTS convicted DWI offenders, 2000-2007
The bar charts on the following pages show the overall percent of DWI offenders in a particular category that had been re-arrested, regardless of time since their reference DWI conviction. Also included are charts showing hazard ratios, or the relative risk of re-arrest of one particular group with respect to a comparison group, while controlling for the amount of time since the reference violation.
26
Overall Percent of Convicted DWI Offenders with a Re-Arrest by County of Conviction, New Mexico, 2000-2007
6.813.814.1
15.315.715.816.216.316.6
17.617.7
18.619.419.419.820
20.620.720.9
22.422.623.1
23.824.424.6
25.325.7
27.128.228.2
30.131.331.3
0 5 10 15 20 25 30 35
UnionCurry
HidalgoColfax
De BacaLea
CatronEddy
ChavesRoosevelt
SierraGuadalupeDona Ana
LincolnLos Alamos
HardingOtero
TorranceQuay
BernalilloLunaTaos
Santa FeGrant
ValenciaSandovalSan Juan
San MiguelCibola
Rio ArribaSocorro
McKinleyMora
Percent (%)
Source: Linked NM DWI Screening and Tracking System and CTS convicted DWI offenders, 2000-2007
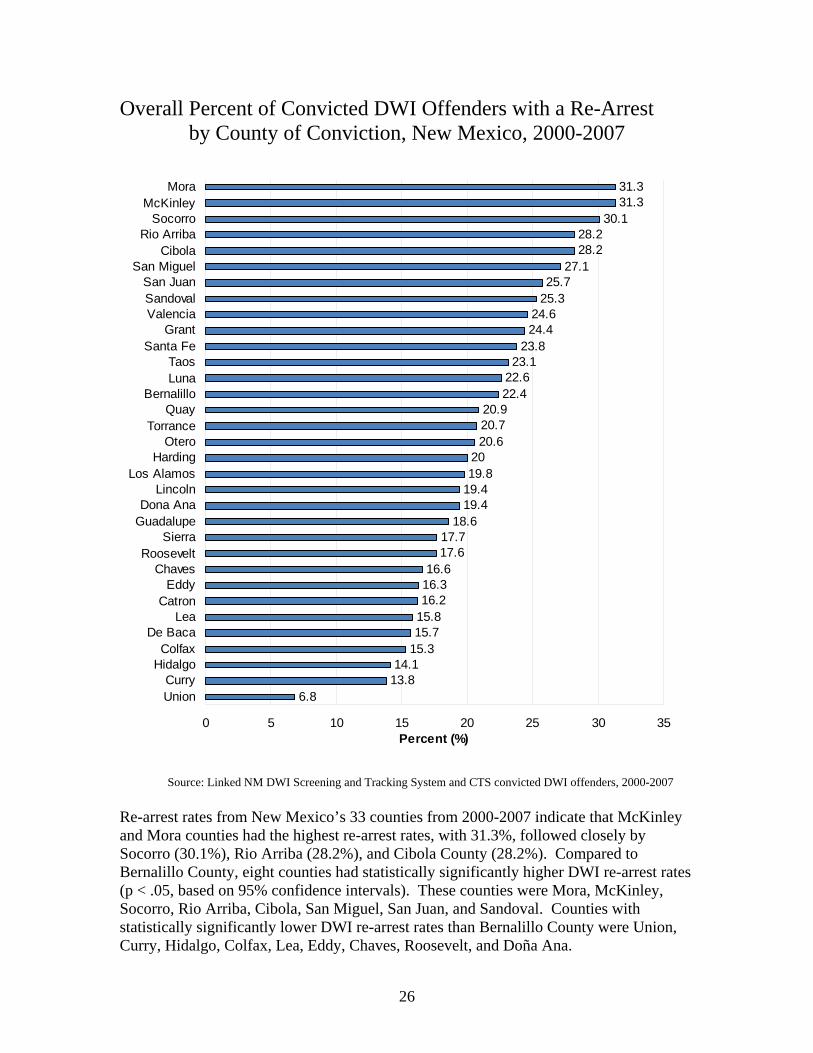
Re-arrest rates from New Mexico’s 33 counties from 2000-2007 indicate that McKinley and Mora counties had the highest re-arrest rates, with 31.3%, followed closely by Socorro (30.1%), Rio Arriba (28.2%), and Cibola County (28.2%). Compared to Bernalillo County, eight counties had statistically significantly higher DWI re-arrest rates (p < .05, based on 95% confidence intervals). These counties were Mora, McKinley, Socorro, Rio Arriba, Cibola, San Miguel, San Juan, and Sandoval. Counties with statistically significantly lower DWI re-arrest rates than Bernalillo County were Union, Curry, Hidalgo, Colfax, Lea, Eddy, Chaves, Roosevelt, and Doña Ana.

27
Overall Percent of Convicted DWI Offenders with a Re-Arrest by Race/Ethnicity, New Mexico, 2000-2007
18.0
22.9
29.5
23.0
14.8
0 5 10 15 20 25 30 35
White
Hispanic
American Indian
Black
Asian/Pacific Islander
Percent (%)
Source: Linked NM DWI Screening and Tracking System and CTS convicted DWI offenders, 2000-2007
Relative Risk of Re-Arrest by Race/Ethnicity, New Mexico, 2000–2007
1.0
1.3
1.8
1.3
0.8
0 0.5 1 1.5 2
White
Hispanic
American Indian
Black
Asian/Pacific Islander
Risk
The brackets on the bars represent the 95th confidence interval around the relative risk estimate. Source: Linked NM DWI Screening and Tracking System and CTS convicted DWI offenders, 2000-2007
For the period 2000-2007, almost 30% of American Indian, 23% of Hispanic and African American, and 18% of White DWI offenders were re-arrested after their reference arrest. American Indians were 1.8 times more likely than White, non-Hispanics to be re-arrested for DWI. Hispanics and African-Americans were 1.3 times more likely to be re-arrested than White, non-Hispanics. Re-arrest rates by race/ethnicity are shown in the appendix on page 33.
28
Overall Percent of Convicted DWI Offenders with a Re-Arrest by Gender, New Mexico, 2000-2007
18.3
24.1
0 5 10 15 20 25 30
Female
Male
Percent (%)
Source: Linked NM DWI Screening and Tracking System and CTS convicted DWI offenders, 2000–2007
Relative Risk of Re-Arrest by Gender, New Mexico, 2000–2007
1.0
0.7
0 0.2 0.4 0.6 0.8 1 1.2
Female
Male
Risk
The brackets on the Female bar represent the 95th confidence interval around the relative risk estimate. Source: Linked NM DWI Screening and Tracking System and CTS convicted DWI offenders, 2000-2007
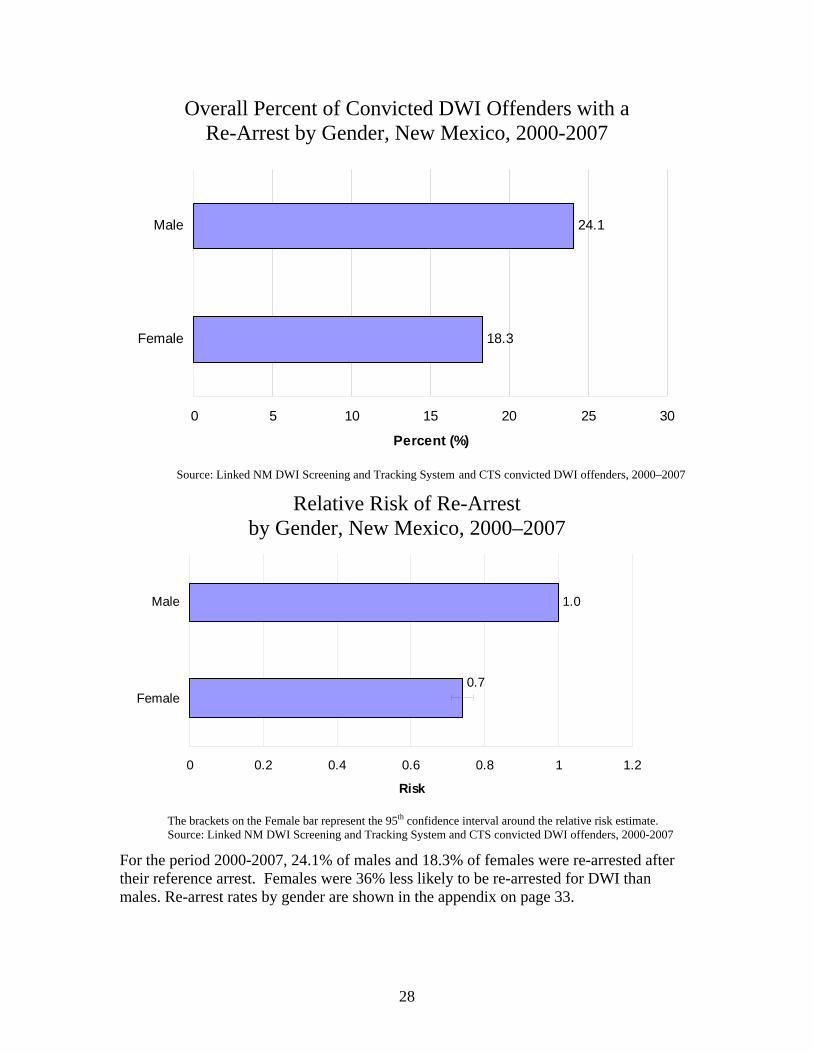
For the period 2000-2007, 24.1% of males and 18.3% of females were re-arrested after their reference arrest. Females were 36% less likely to be re-arrested for DWI than males. Re-arrest rates by gender are shown in the appendix on page 33.
29
Overall Percent of Convicted DWI Offenders with a Re-Arrest by Age Group, New Mexico, 2000-2007
12.0
15.5
20.2
22.8
24.4
29.2
0 5 10 15 20 25 30 35
60+
50-59
40-49
30-39
21-29
18-20
Percent (%)
Source: Linked NM DWI Screening and Tracking System and CTS convicted DWI offenders, 2000–2007
Relative Risk of Re-Arrest by Age Group, New Mexico, 2000-2007
1.0
0.4
0.5
0.7
0.8
0.8
0 0.2 0.4 0.6 0.8 1 1.2
60+
50-59
40-49
30-39
21-29
18-20
Risk
The brackets on the age group bars represent the 95th confidence interval around the relative risk estimate. Source: Linked NM DWI Screening and Tracking System and CTS convicted DWI offenders, 2000–2007
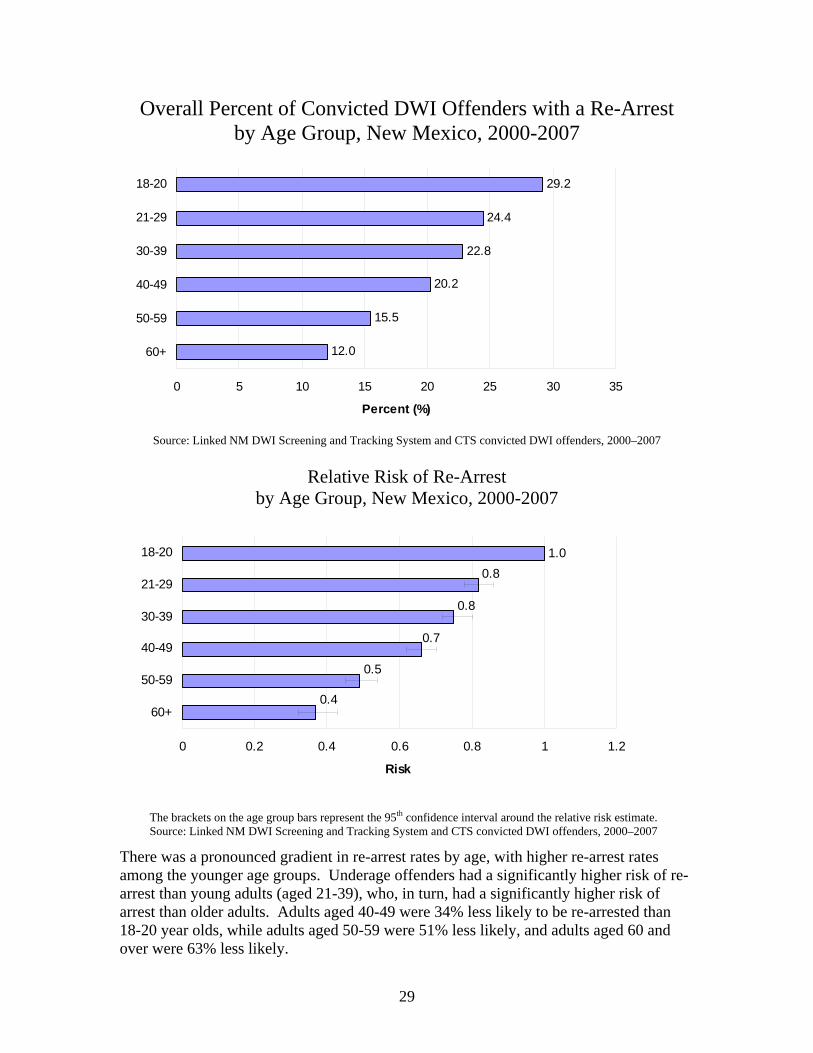
There was a pronounced gradient in re-arrest rates by age, with higher re-arrest rates among the younger age groups. Underage offenders had a significantly higher risk of re-arrest than young adults (aged 21-39), who, in turn, had a significantly higher risk of arrest than older adults. Adults aged 40-49 were 34% less likely to be re-arrested than 18-20 year olds, while adults aged 50-59 were 51% less likely, and adults aged 60 and over were 63% less likely.
30
Overall Percent of Convicted DWI Offenders with a Re-Arrest by the Number of Prior DWI Convictions
New Mexico, 2000-2007
33.8
29.1
27.2
19.6
0 5 10 15 20 25 30 35 40
3+
2
1
0
Percent (%)
Source: Linked NM DWI Screening and Tracking System and CTS convicted DWI offenders, 2000-2007
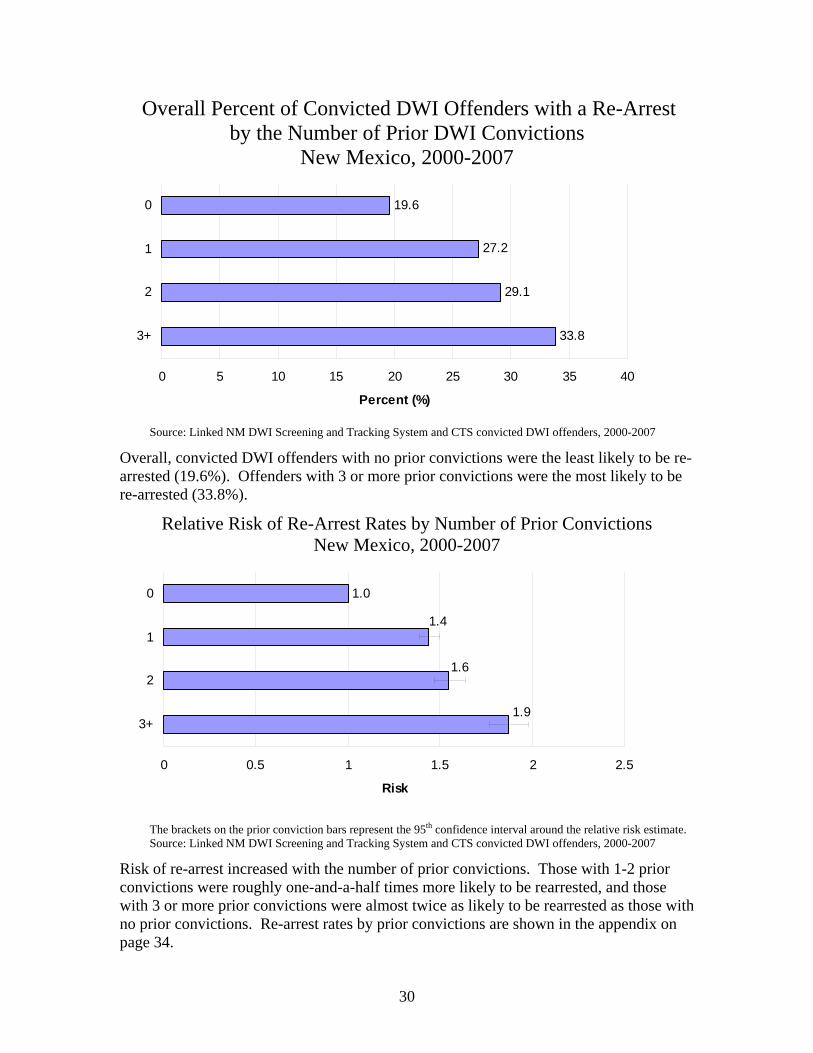
Overall, convicted DWI offenders with no prior convictions were the least likely to be re-arrested (19.6%). Offenders with 3 or more prior convictions were the most likely to be re-arrested (33.8%).
Relative Risk of Re-Arrest Rates by Number of Prior Convictions New Mexico, 2000-2007
1.0
1.9
1.6
1.4
0 0.5 1 1.5 2 2.5
3+
2
1
0
Risk
The brackets on the prior conviction bars represent the 95th confidence interval around the relative risk estimate. Source: Linked NM DWI Screening and Tracking System and CTS convicted DWI offenders, 2000-2007
Risk of re-arrest increased with the number of prior convictions. Those with 1-2 prior convictions were roughly one-and-a-half times more likely to be rearrested, and those with 3 or more prior convictions were almost twice as likely to be rearrested as those with no prior convictions. Re-arrest rates by prior convictions are shown in the appendix on page 34.

31
Overall Percent of Convicted DWI Offenders with a Re-Arrest by Source of Alcohol before Arrest, New Mexico, 2000-2007
25.8
24.1
23.2
20.5
0 5 10 15 20 25 30
Grocery/Convenience/Liquor Stores
Own Home/OtherHome
Social Gathering
Bar/Restaurant
Percent (%)
Source: Linked NM DWI Screening and Tracking System and CTS convicted DWI offenders, 2000-2007
Offenders convicted of DWI who obtained their alcohol at a grocery store, a convenience store, or a liquor store had the highest rate of re-arrest (25.8%). Relative Risk of Re-Arrest by Source of Alcohol before Arrest New Mexico, 2000-2007
1.0
1.3
1.2
1.1
0 0.2 0.4 0.6 0.8 1 1.2 1.4 1.6
Grocery/Convenience/Liquor Stores
Own Home/OtherHome
Social Gathering
Bar/Restaurant
Risk
The brackets on the source bars represent the 95th confidence interval around the relative risk estimate. Source: Linked NM DWI Screening and Tracking System and CTS convicted DWI offenders, 2000-2007
Compared to DWI offenders who obtained their alcohol from a bar or restaurant, those who obtained alcohol at a grocery, convenience, or liquor store were 30% more likely to be re-arrested; those who obtained alcohol at their own home or at someone else’s home were 19% more likely to be re-arrested; and those who obtained alcohol at a social gathering were 14% more likely to be rearrested.
32
Acknowledgements
This report was prepared by the Substance Abuse Epidemiology Section, Injury and Behavioral Epidemiology Bureau. We acknowledge assistance from the DWI Coordinators in each county in New Mexico and the screeners and trackers from the county DWI programs who provided the data for this report. We would also like to thank Dona Cook and Jacque Geoffrion of the New Mexico Taxation and Revenue Department (NM-TRD) for allowing the use of the statewide Citation Tracking System, and Rao Chad of NM-TRD for providing the Citation Tracking System files. We also acknowledge members of the Local Government Division, Department of Finance and Administration with whom we have a cooperative agreement to produce this report. They are Joyce Johnson, Liza Luboff, Julie Krupcale, Michael Baldwin, Jonathan Fernandez, Ruth Luthi, Theresa Trujillo, and Daniel Montoya. Finally, we acknowledge personnel from ADE, Inc. who provide the software for the screening and tracking program to the State of New Mexico. They include Bryan Ellis, Jill Cubba, Mary Jo Reed, Terry Kennedy, James Haggerty and Craig Vallelunga.

33
APPENDIX
DWI Re-Arrest Rates* by Race/Ethnicity New Mexico, 2000-2007
05
101520253035404550
0 6 12 18 24 30 36 42 48 54 60 66 72 78 84 90 96
Months following conviction
Per
cent
(%)
American IndianBlackHispanicWhiteAsian
* Percent of DWI offenders with at least one DWI re-arrest during the follow-up period. Source: Linked NM DWI Screening and Tracking System and CTS convicted DWI offenders, 2000-2007
American Indian offenders have a DWI re-arrest rate of 17.5% at 24 months, 25% at 48 months, 28.2% at 72 months, 29.1% at 84 months, and 29.5% at 96 months. The rate among Hispanics is 12.8% after 24 months, 19% after 48 months, 21.8% after 72 months, 22.5% after 84 months and 22.9% at 96 months. The rate among Whites rises more gradually, with rates of 10.6%, 15.4%, 17.4%, 17.8%, and 18% at 24, 48, 72, 84, and 96 months, respectively. The rate among Blacks is similar to that of Hispanics.
DWI Re-Arrest Rates* by Gender, New Mexico, 2000-2007
05
101520253035404550
0 6 12 18 24 30 36 42 48 54 60 66 72 78 84 90 96
Months following conviction
Perc
ent (
%)
MaleFemale
* Percent of DWI offenders with at least one DWI re-arrest during the follow-up period. Source: Linked NM DWI Screening and Tracking System and CTS convicted DWI offenders, 2000-2007
This graph presents male and female DWI re-arrest rates. Convicted male DWI offenders had re-arrest rates about 20-30% higher than female offenders over the entire 8 years. After 96 months, 24.1% of males had been re-arrested for DWI while only 18.3% of females had been re-arrested for DWI.
34
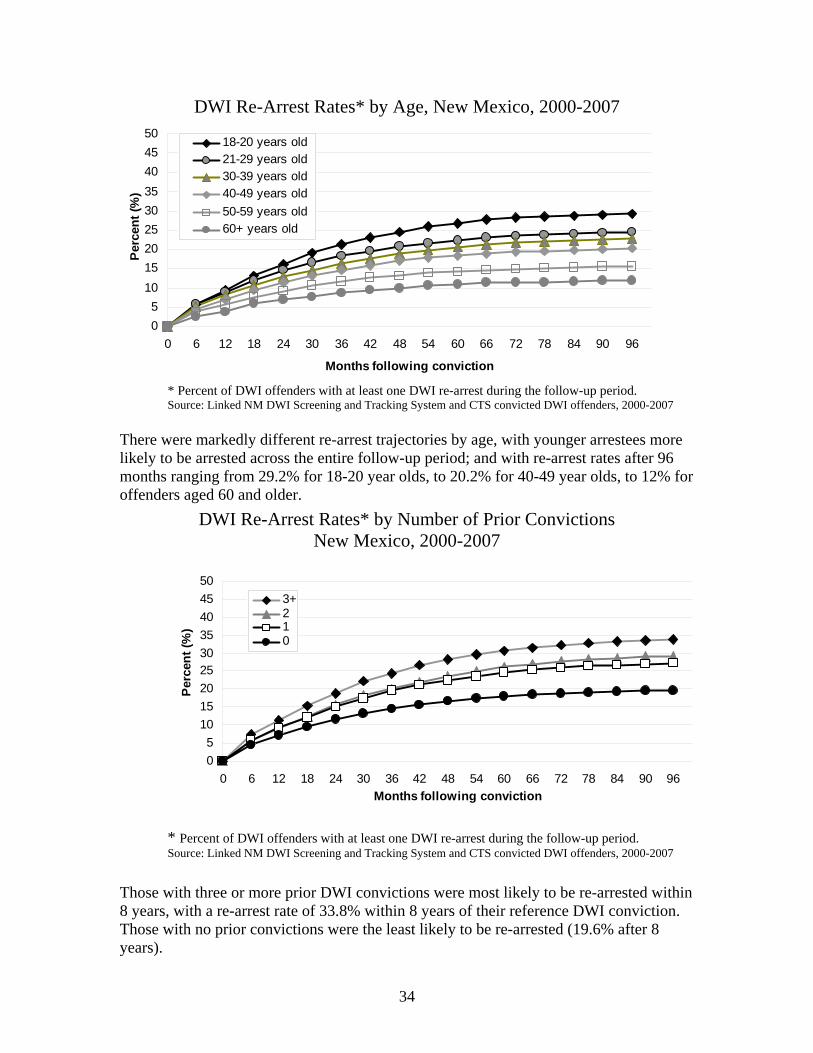
DWI Re-Arrest Rates* by Age, New Mexico, 2000-2007
05
101520253035404550
0 6 12 18 24 30 36 42 48 54 60 66 72 78 84 90 96
Months following conviction
Perc
ent (
%)
18-20 years old21-29 years old30-39 years old40-49 years old50-59 years old60+ years old
* Percent of DWI offenders with at least one DWI re-arrest during the follow-up period. Source: Linked NM DWI Screening and Tracking System and CTS convicted DWI offenders, 2000-2007
There were markedly different re-arrest trajectories by age, with younger arrestees more likely to be arrested across the entire follow-up period; and with re-arrest rates after 96 months ranging from 29.2% for 18-20 year olds, to 20.2% for 40-49 year olds, to 12% for offenders aged 60 and older.
DWI Re-Arrest Rates* by Number of Prior Convictions New Mexico, 2000-2007
05
101520253035404550
0 6 12 18 24 30 36 42 48 54 60 66 72 78 84 90 96Months following conviction
Perc
ent (
%)
3+210
* Percent of DWI offenders with at least one DWI re-arrest during the follow-up period. Source: Linked NM DWI Screening and Tracking System and CTS convicted DWI offenders, 2000-2007
Those with three or more prior DWI convictions were most likely to be re-arrested within 8 years, with a re-arrest rate of 33.8% within 8 years of their reference DWI conviction. Those with no prior convictions were the least likely to be re-arrested (19.6% after 8 years).

35
DWI Re-Arrest Rates* by Source of Alcohol before Arrest New Mexico, 2000 - 2007
0
5
10
15
20
25
30
35
40
45
50
0 6 12 18 24 30 36 42 48 54 60 66 72 78 84 90 96
Months following conviction
Per
cent
(%)
Grocery/Conven/Drive-up/Liquor
Owen Home/Other Home
Social Gathering/Party
Bar/Restaurant
* Percent of DWI offenders with at least one DWI re-arrest during the follow-up period. Source: Linked NM DWI Screening and Tracking System and CTS convicted DWI offenders, 2000–2007
Offenders whose source of alcohol for their reference arrest was a grocery store, a convenience store, or a liquor store had the highest rate of re-arrest (25.8%) when compared to those with other sources of alcohol, although the difference in re-arrest rates between these sources wasn’t as pronounced as for some of the other categories presented above. Those who obtained their alcohol at a bar or restaurant were the least likely to be re-arrested (20.5%) after 96 months.