2019 annual report - fortis inc
TRANSCRIPT

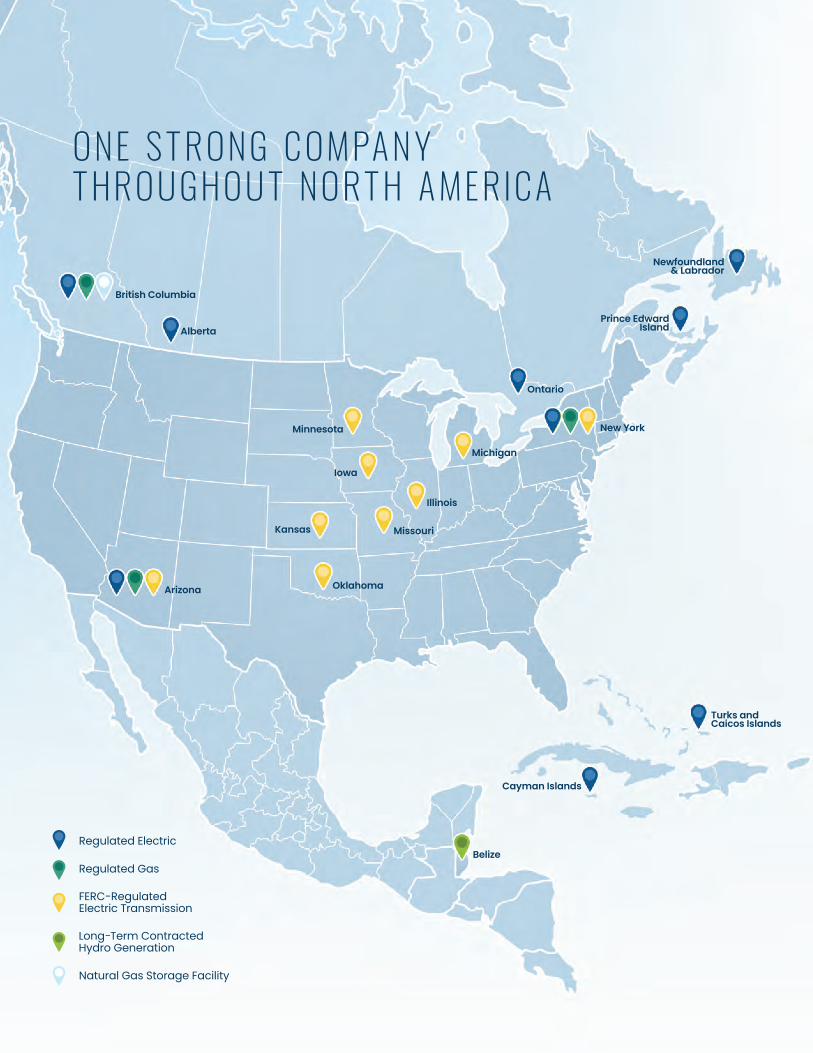
Regulated Electric
Regulated Gas
Long-Term Contracted Hydro Generation
FERC-RegulatedElectric Transmission
Natural Gas Storage Facility
British Columbia
Alberta
Minnesota
Iowa
Illinois
MissouriKansas
Arizona Oklahoma
Michigan
New York
Turks andCaicos Islands
Cayman Islands
Belize
Ontario
Prince Edward Island
Newfoundland& Labrador
ONE S T RONG C OMPA N YT HROUGHOU T NOR T H A ME RIC A
1R E P O R T T O S H A R E H O L D E R S
First, we are an energy delivery business.
Electricity poles, wires and natural gas lines comprise 93% of our total assets. Our focus on energy delivery is foundational to Fortis. We invest in transmission and distribution infrastructure to safely deliver energy from cleaner sources to customers.
Second, we are diverse from a regulatory and a geographic perspective.
Fortis is virtually 100% regulated and we operate in 17 jurisdictions. We are one of the most geographically diverse utility businesses on the continent, with each of our utilities operating under distinct regulatory regimes. We touch nearly every corner of North America.
Third, our utility leadership is local.
Fortis utilities operate close to their customers and regulators. Our local teams have the authority and independence to deliver what’s most important in their communities. While our utilities operate separately, together as a larger family of companies we drive operational excellence, innovation and sustainability.
Together, these three defining characteristics form a company that:
• is flexible and responsive to customers;
• minimizes overall business risk;
• delivers financial scale and strategic direction while empowering our utilities to innovate and grow; and,
• creates a durable competitive advantage that supports the growth of long-term shareholder value.
FOR T IS H A S T HRE E DIS T INC T CH A R AC T E RIS T IC S

Unless otherwise specified, all financial information is referenced in Canadian dollars.
10 9,000 $53
OPERATIONS
ST. JOHN’S
UTILITY
MILLION
BILLIONCONSECUTIVE YEARS
Based in
Newfoundland & Labrador
in Canada, the U.S. and the Caribbean
gas utility customers
T S X / N Y S E : F T S
(as of December 31, 2019)market cap
EMPLOYEES STRONG
in total assets
FORTIS QUICK FAC T S
1.3 MILLIONelectric utility customers2
BILLION
$25 46 of dividend payment increases
REP ORT TO SH A REHOL DERSAt Fortis we leverage the experience of our group of utilities to improve service for our customers, deliver superior financial performance for our shareholders and drive sustainability for the communities we serve. Our industry is evolving rapidly and our utilities are finding innovative ways to ensure they deliver cleaner energy to customers in a safe, reliable and affordable manner.
The strong operational and financial performance of your company in 2019 is evidence that our strategy is working.
The key to a successful year is making careful decisions every day.
Choices that make sense – not just for now, but for the future.
At Fortis, tomorrow is our responsibility today.

F O R T I S I N C . 2 0 1 9 A N N U A L R E P O R T4
average at Fortis was 1.84 hours, outperforming the Canadian and U.S. combined industry average of 3.65 hours.
Fortis has developed a cybersecurity strategy based on the fundamental pillars of a cyber risk management program, increased information sharing and building an enhanced culture of security. The program mirrors the structure of our enterprise risk management framework and focuses on key risks including: asset and identity management, threat and vulnerability analysis, situational awareness, information sharing, incident response, and supply chain and insider threats. Through board and management oversight, this strategy results in effective enterprise risk management and protects customers and stakeholders.
Fortis continues to outperform industry averages for safety and reliability. The all-injury frequency rate (“AIFR”) is an indicator of safety performance and represents the number of injuries for every 200,000 hours worked. In 2019 the Fortis AIFR was 1.45, while the Canadian and U.S. comparable industry average rates were 1.59 and 1.78, respectively.
Our culture of safety is embedded in our operations and we consistently seek opportunities to improve. Fortis utilities regularly develop and share best practices with each other to support a healthy and safe workplace.
Fortis measures electricity reliability and uses the average hours of interruption per customer served as an indicator of performance. In 2019 the
A N INDU S T RY L E A DER IN S A F E T Y, REL I A BIL I T Y A ND S ECURI T Y
ELECTRICITY CUSTOMERAVERAGE OUTAGE DURATION (2)ALL-INJURY FREQUENCY RATE (1)
(2) Based on weighted average of Fortis’ customer count in each jurisdiction(3) 2019 industry comparator will be available later in 2020.(1) Injuries per 200,000 hours worked
FortisU.S. Bureau of Labor Statistics Average(for the period 2015-2018)
Canadian Electricity Association Average(for the period 2015-2018)
2 .0
1 .0
02015 20172016 20192018
1 .781 .59
ELECTRICITY CUSTOMERAVERAGE OUTAGE DURATION
FortisCanadian Electricity Association & U.S. Energy Information Administration Average(3)
HOURS
5 .0
4 .0
3 .0
2 .0
1 .0
02016 20172015 20192018
5R E P O R T T O S H A R E H O L D E R S
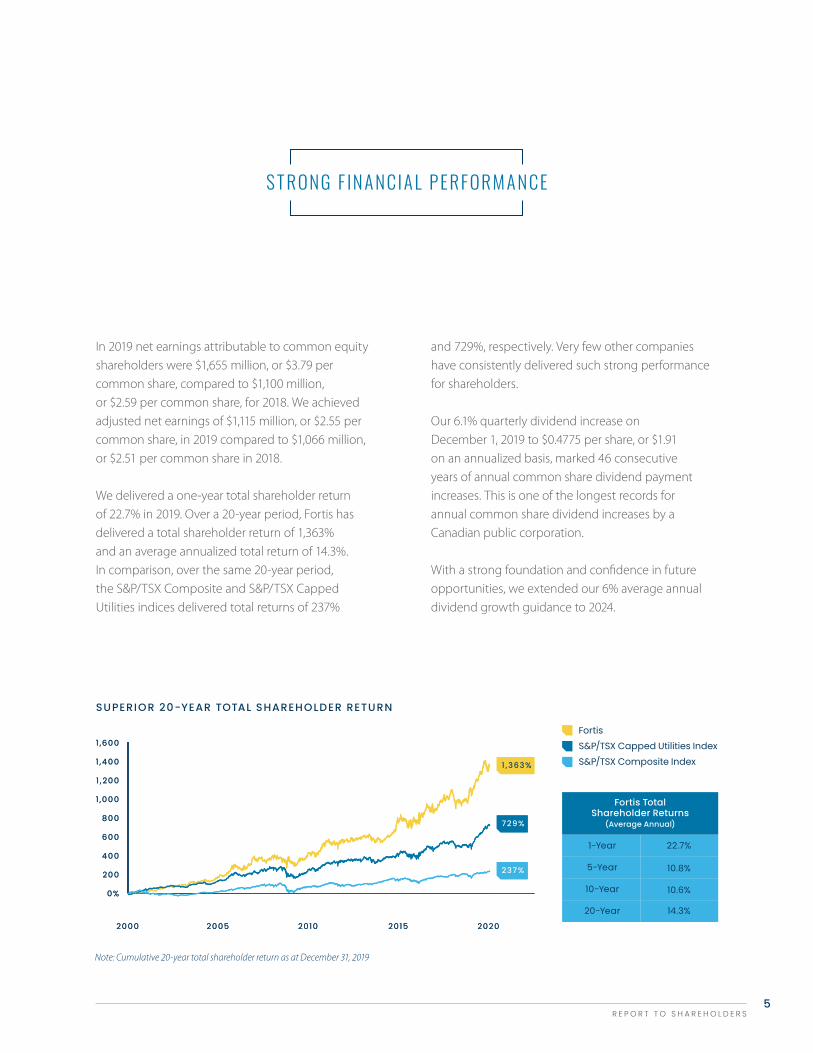
and 729%, respectively. Very few other companies have consistently delivered such strong performance for shareholders.
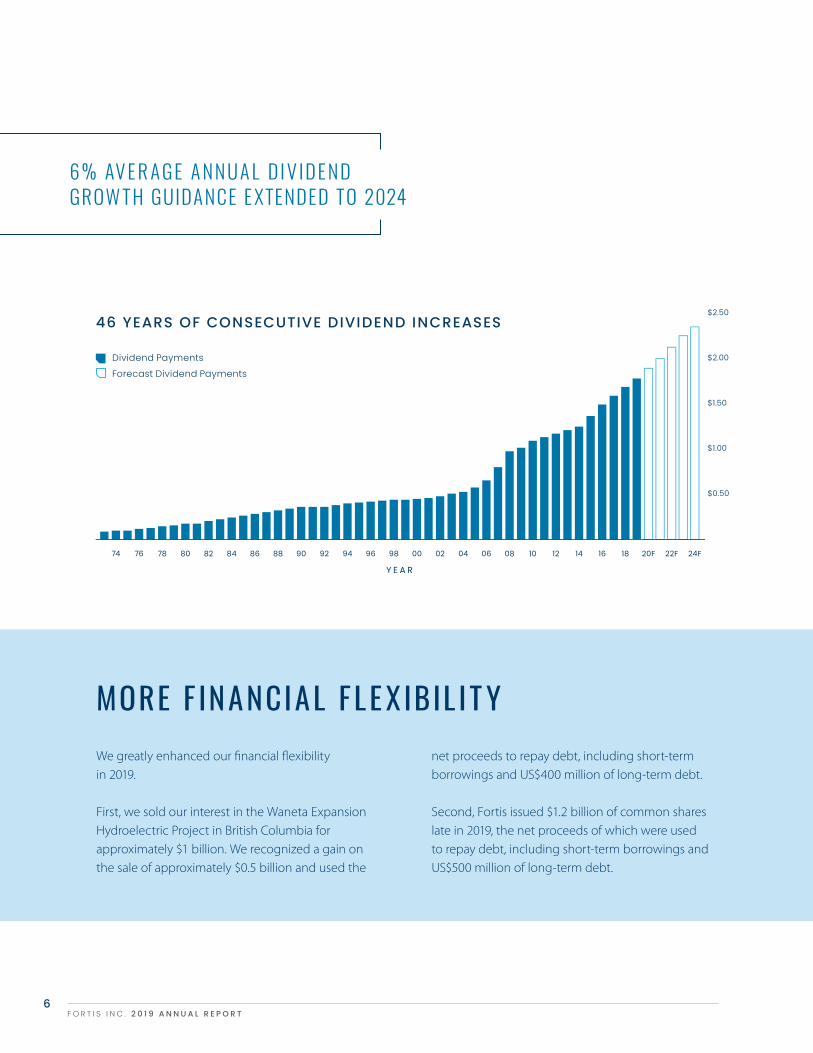
Our 6.1% quarterly dividend increase on December 1, 2019 to $0.4775 per share, or $1.91 on an annualized basis, marked 46 consecutive years of annual common share dividend payment increases. This is one of the longest records for annual common share dividend increases by a Canadian public corporation.
With a strong foundation and confidence in future opportunities, we extended our 6% average annual dividend growth guidance to 2024.
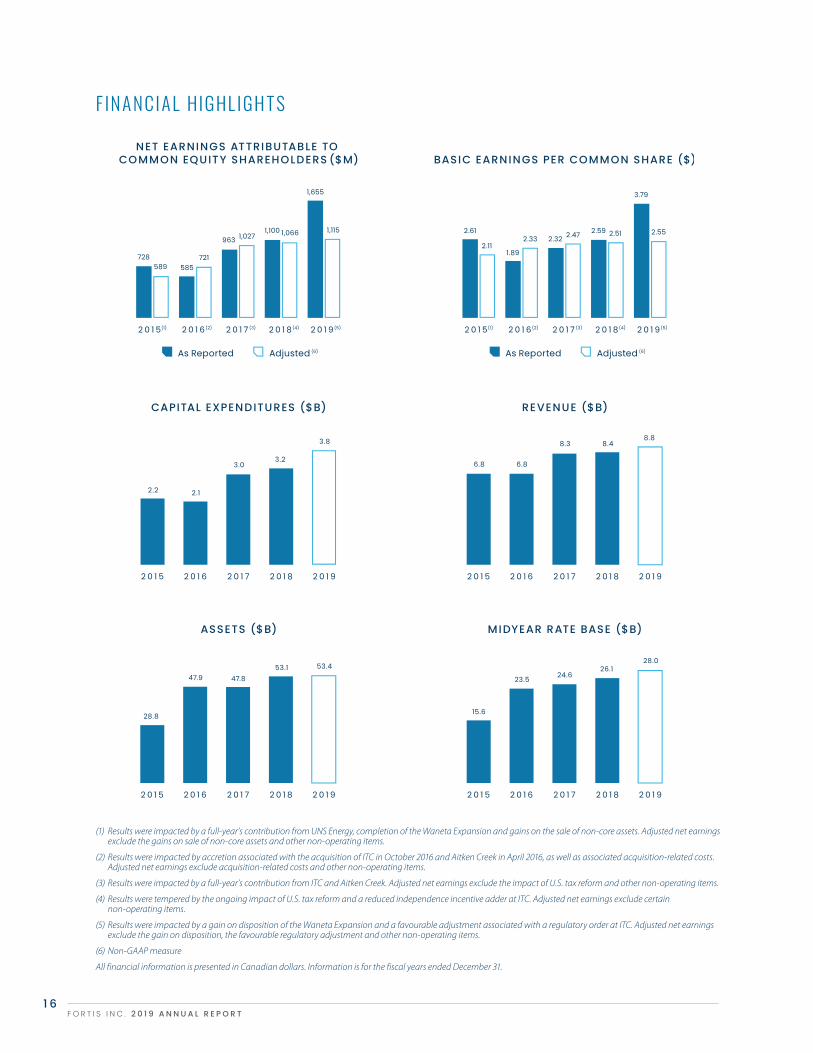
In 2019 net earnings attributable to common equity shareholders were $1,655 million, or $3.79 per common share, compared to $1,100 million, or $2.59 per common share, for 2018. We achieved adjusted net earnings of $1,115 million, or $2.55 per common share, in 2019 compared to $1,066 million, or $2.51 per common share in 2018.
We delivered a one-year total shareholder return of 22.7% in 2019. Over a 20-year period, Fortis has delivered a total shareholder return of 1,363% and an average annualized total return of 14.3%. In comparison, over the same 20-year period, the S&P/TSX Composite and S&P/TSX Capped Utilities indices delivered total returns of 237%
S T RONG F IN A NCI A L P ERFORM A NCE
SUPERIOR 20-YEAR TOTAL SHAREHOLDER RETURN
Note: Cumulative 20-year total shareholder return as at December 31, 2019
FortisS&P/TSX Capped Utilities IndexS&P/TSX Composite Index
Fortis TotalShareholder Returns
(Average Annual)
F O R T I S I N C . 2 0 1 9 A N N U A L R E P O R T6
6 % AV E R A GE A NNU A L D I V ID E ND GROW TH GUIDANCE E XTENDED TO 2024
net proceeds to repay debt, including short-term borrowings and US$400 million of long-term debt. Second, Fortis issued $1.2 billion of common shares late in 2019, the net proceeds of which were used to repay debt, including short-term borrowings and US$500 million of long-term debt.
We greatly enhanced our financial flexibilityin 2019.
First, we sold our interest in the Waneta Expansion Hydroelectric Project in British Columbia for approximately $1 billion. We recognized a gain on the sale of approximately $0.5 billion and used the
MORE F INANCIAL FLE X IBIL IT Y
46 YEARS OF CONSECUTIVE DIVIDEND INCREASES
Dividend PaymentsForecast Dividend Payments
$2.50
$2.00
$1.50
$1.00
$0.50
7R E P O R T T O S H A R E H O L D E R S
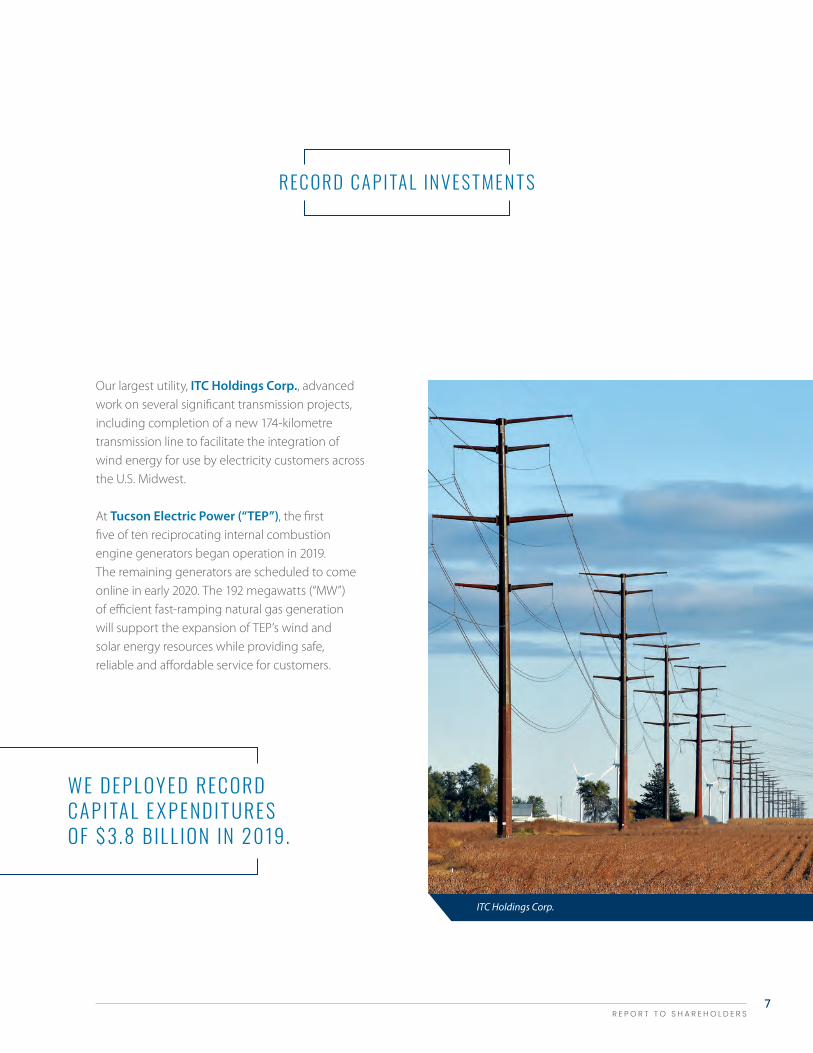
ITC Holdings Corp.
WE DEP L OY ED REC ORD CA P I TA L E X P ENDI T URE S OF $ 3 .8 B IL L ION IN 2019.
REC ORD CA P I TA L IN V E S T MEN T S
Our largest utility, ITC Holdings Corp., advanced work on several significant transmission projects, including completion of a new 174-kilometre transmission line to facilitate the integration of wind energy for use by electricity customers across the U.S. Midwest.
At Tucson Electric Power (“TEP”), the first five of ten reciprocating internal combustion engine generators began operation in 2019. The remaining generators are scheduled to come online in early 2020. The 192 megawatts (“MW”) of efficient fast-ramping natural gas generation will support the expansion of TEP’s wind and solar energy resources while providing safe, reliable and affordable service for customers.

F O R T I S I N C . 2 0 1 9 A N N U A L R E P O R T8
2019 marked another year of important milestones for the Wataynikaneyap Transmission Power Project in Northwestern Ontario. This project is 51% owned by our First Nations partners and will see the construction of approximately 1,800 kilometres of transmission lines to connect 17 remote First Nations communities to the Ontario power grid for the first time.
The engineering, procurement and construction contract was awarded, the project achieved financial close and the Notice to Proceed was issued. In addition, Wataynikaneyap Power celebrated the graduation of the fourth round of Line Crew Ground Support Training. The 15-week certificate program prepares Indigenous students for employment opportunities with the Wataynikaneyap Transmission Power Project.
The Fortis $18.8 billion five-year capital plan for the period 2020 to 2024 is driven by grid modernization, delivering cleaner energy to customers, electrification, and the expansion of our natural gas operations at FortisBC. Over the past five years, our midyear utility rate base has grown to $28 billion, representing average annual growth of 7%, excluding utility acquisitions. Over the next five years we expect similar growth, with midyear rate base to increase by about $10 billion to over $38 billion by 2024.
FortisBC is poised to be our fastest-growing Canadian utility in the coming years. The utility has more than one million natural gas customers and is the largest distributor of natural gas in British Columbia. It has earmarked $1.1 billion in its five-year capital plan for major integrity projects, including two significant system upgrades to its natural gas infrastructure. The utility also plans to spend $100 million on renewable gas projects and to encourage the use of natural gas for transportation.
Tucson Electric Power employees

9R E P O R T T O S H A R E H O L D E R S
Throughout our group of utilities, our teams are collectively accelerating the pace of innovation. Our investment in Energy Impact Partners (“EIP”)is one of the ways we are embracing new ideas and leading the way in our sector. EIP is a sizeable strategic investment fund that brings together a global coalition of utilities and emerging technology companies that are shaping the future of our industry. Through EIP, we have access to the latest innovations, positioning us to better serve customers.
We have leveraged the EIP relationship across our family of utilities. As an example, Maritime Electric, our utility in Prince Edward Island, is collaborating with Urbint, an emerging technology company identified through EIP. They are using artificial intelligence to prioritize the replacement of higher-risk electricity poles, creating efficiencies and improving safety and reliability.
FortisBC supplies the marine industry with natural gas.
T HROUGHOU T OUR GROUP OF U T IL I T IE S , OUR T E A MS A RE C OL L EC T I V ELY AC CEL ER AT ING T HE PACE OF INNOVAT ION.

At Fortis, sustainability and reducing our carbon footprint are at the forefront of everything we do. Our assets primarily consist of electricity poles, wires and natural gas lines. We own a small amount of fossil fuel-based generation, limiting our impact on the environment. We remain focused on a cleaner energy future through delivery of more renewable energy to our customers. The generation owned by Fortis is primarily within the operations of TEP. The utility is taking great strides in reducing its carbon intensity and recently announced the construction of the 250 MW Oso Grande Wind Project, which will become TEP’s largest renewable energy resource. In 2021 TEP will have enough renewable energy resources on its system to supply nearly 30% of its retail sales – almost a decade ahead of its 2030 goal.
Our team in Arizona is not stopping there. TEP is now collaborating with the University of Arizona and the local community to set new carbon emission reduction goals in line with the Paris Agreement on climate change. TEP’s coal-based generation now represents less than 5% of the total rate base of all Fortis utilities, far less than many other utilities in our sector.
FortisBC has set a goal to reduce greenhouse gas emissions associated with customers’ energy use by 30% by the year 2030. To achieve this objective, FortisBC will triple investment in energy efficiency projects, increase renewable gas supply, and focus on low and zero-carbon vehicles and transportation infrastructure. The utility is targeting to have 15% of its gas supply from renewable sources by 2030, and recently participated at the United Nations Climate Change Conference as part of the Canadian delegation.
ITC sets the standard for how an energy delivery company can combat climate change. ITC is a large transmission company and a central player in the shift to renewables that is occurring in the U.S. The utility has already connected over 6,800 MW of wind energy and over the next five years expects to connect another 2,000 MW of wind and 600 MW of solar energy across its footprint.
REDUCING CA RB ON E MIS S IONS

The increased use of renewable energy is driving innovation and growth. At Fortis we remain steadfast in our commitment to reducing our carbon footprint as we realize the full potential of the cleaner energy transformation that is taking place.
In 2019 we expanded our sustainability disclosure and reported new indicators related to employees, natural gas operations and water use. We also provided information on our efforts to support the United Nations Sustainable Development Goals.
Fortis is recognized as a leader in sustainability and was named one of the Best 50 Corporate Citizens in Canada by Corporate Knights, an organization dedicated to encouraging responsible business practices. Additionally, Fortis ranked number one in terms of having the largest three-year carbon emissions reduction and 24th overall out of 242 companies surveyed.
As well, Fortis received an upgraded rating of AA from MSCI, a leading environmental, social and corporate governance (“ESG”) advisory group that rates a company’s ability to manage ESG risks relative to its peers. The current AA rating is up three levels from the company’s initial rating of BB in 2015.
I N 2 0 2 1 T U C S O N E L E C T R I C P O W E R W I L L H AV E E N O U G H R E N E WA B L E E N E R GY R E S O U R C E S O N I T S S Y S T E M T O S U P P LY N E A R LY 3 0 % O F I T S R E TA I L SALES – ALMOST A DECADE AHEAD OF ITS 2030 GOAL.

F O R T I S I N C . 2 0 1 9 A N N U A L R E P O R T1 2
INCL U SION A ND DI V ER SI T Y
FortisAlberta employees showing their support for inclusion and diversity.
head office, 42% of our directors elected in 2019 and approximately one-third of executives throughout the Fortis group of companies.
Work on our inclusion and diversity efforts will continue in 2020 and beyond.
There was a purposeful effort in 2019 to advance inclusion and diversity across the entire Fortis group of companies. We believe in employees feeling comfortable coming to work and doing their jobs, free from any form of judgment. When people can be their authentic selves they are happier, and that allows them to reach their full potential. An inclusion and diversity framework was finalized and CEOs at all Fortis companies signed a declaration committing to inclusion and diversity efforts.
An area we have focused on in recent years is gender diversity. Females represent 60% of employees at

1 3R E P O R T T O S H A R E H O L D E R S
Over the past several years, Fortis and our utilities have placed significant focus on talent management and the development of our leadership team, and 2019 was no exception. During the year we broadened the responsibilities of the following executives.
James P. Laurito’s role was expanded to Executive Vice President, Business Development and Chief Technology Officer. Jim has extensive knowledge of the North American utility business, including the latest technology and innovation trends and opportunities. Jim assumed responsibility for technology after the retirement of Phonse J. Delaney as Executive Vice President, Chief Information Officer. Phonse’s career with the Fortis group of companies spanned more than 30 years and included his role as President and Chief Executive Officer of FortisAlberta. We thank Phonse for his expertise and we wish him well in retirement.
David G. Hutchens’ role was also expanded with his appointment as Chief Operating Officer. He was previously Executive Vice President, Western Utility Operations. In this newly created role, Dave’s responsibilities have been broadened to include operational oversight of our 10 utilities across Canada, the United States and the Caribbean as we execute on our large capital plan. He also continues to serve as Chief Executive Officer of UNS Energy Corporation in Arizona.
Remembering Ida J. Goodreau We are deeply saddened by the passing of Ida J. Goodreau in 2019. Ida served as Chair of the Governance and Nominating Committee of the Fortis Board of Directors and Chair of the Board of Directors of FortisBC. She was an international business leader, a mentor and a cherished colleague who provided years of thoughtful leadership to Fortis. She is greatly missed by the Fortis family.
Our decentralized model supports Fortis utilities being heavily involved in their local communities. They are leaders in the communities in which they operate, with their efforts focused on the areas most needed in their local communities. Total community investments attributed to Fortis and our utilities in 2019 were more than $12 million.
A great example of community support comes from our utility Central Hudson Gas & Electric, which provided nearly $900,000 to fund community initiatives in 2019. Activities included an employee-led campaign for the local agencies of the United Way and sponsorship of community events that support non-profit programs and promote the local economy. During the past decade, Central Hudson has contributed approximately $10 million to local community groups.
OUR COMMUNI T Y ROOT S RUN DEEP
E X ECU T I V E T E A M CH A NGE S
Central Hudson employees pull a Boeing 757 12 feet in 10.36 seconds at New York Stewart International Airport. The Pull the Plane competition, hosted by the
United Way of the Dutchess-Orange Region, raised approximately US$50,000.


1 5R E P O R T T O S H A R E H O L D E R S
Thank you to our 9,000 employees for continuing to work safely and for delivering exceptional service to our customers. The success of Fortis is the result of your hard work.
We also thank our shareholders for your continued support. We will continue to be a champion of progress, realizing the full potential of the move to cleaner energy while remaining steadfast in our commitment to deliver safe, reliable and secure energy.
We believe Fortis is getting stronger. We are thinking long term as we drive your company forward, ensuring a successful Fortis for years to come.
On behalf of the Board of Directors,
P O SI T IONED FOR F U T URE S UC CE S S
Douglas J. HaugheyChair of the BoardFortis Inc.
Barry V. PerryPresident and CEOFortis Inc.
Left to right: Douglas Haughey, Chair of the Board, and Barry Perry, President and CEO
F O R T I S I N C . 2 0 1 9 A N N U A L R E P O R T1 6
(1) Results were impacted by a full-year’s contribution from UNS Energy, completion of the Waneta Expansion and gains on the sale of non-core assets. Adjusted net earnings exclude the gains on sale of non-core assets and other non-operating items.
(2) Results were impacted by accretion associated with the acquisition of ITC in October 2016 and Aitken Creek in April 2016, as well as associated acquisition-related costs. Adjusted net earnings exclude acquisition-related costs and other non-operating items.
(3) Results were impacted by a full-year’s contribution from ITC and Aitken Creek. Adjusted net earnings exclude the impact of U.S. tax reform and other non-operating items.
(4) Results were tempered by the ongoing impact of U.S. tax reform and a reduced independence incentive adder at ITC. Adjusted net earnings exclude certain non-operating items.
(5) Results were impacted by a gain on disposition of the Waneta Expansion and a favourable adjustment associated with a regulatory order at ITC. Adjusted net earnings exclude the gain on disposition, the favourable regulatory adjustment and other non-operating items.
(6) Non-GAAP measure
All financial information is presented in Canadian dollars. Information is for the fiscal years ended December 31.
F IN A NCI A L HIGHL IGH T S
1 7R E P O R T T O S H A R E H O L D E R S
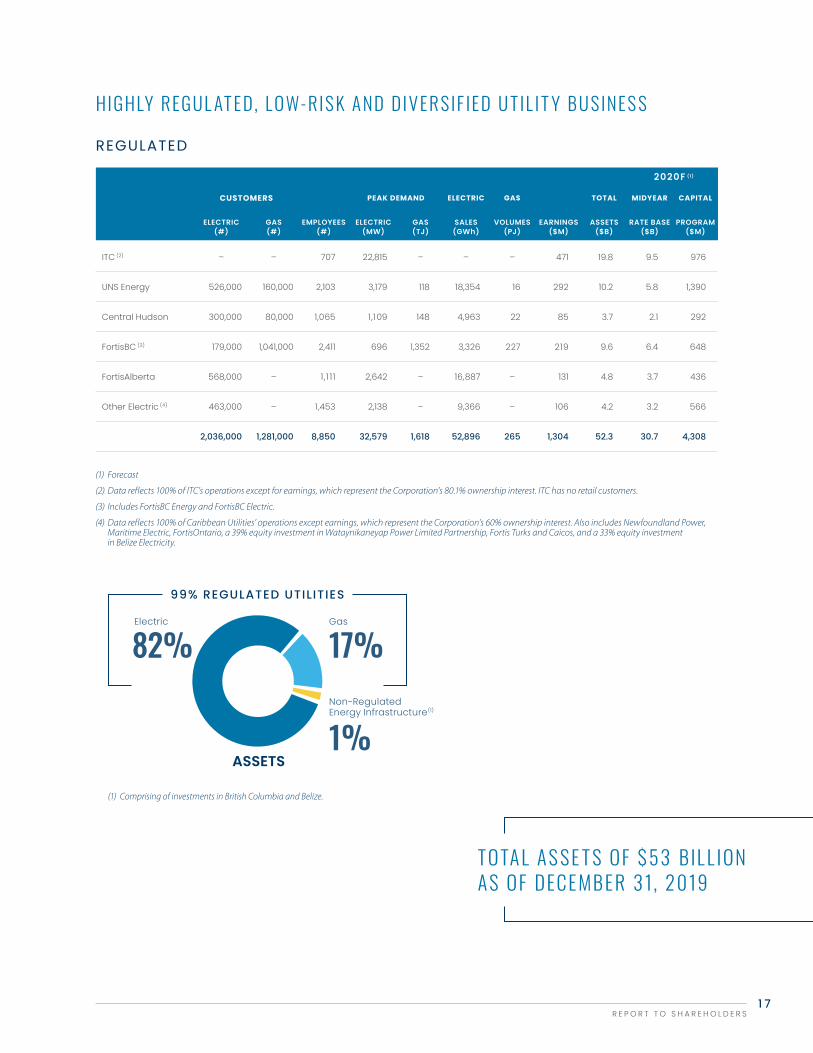
HIGHLY REGUL AT ED, L OW-RIS K A ND DI V ER SIF IED U T IL I T Y B U SINE S S
2020F (1)
CUSTOMERS PEAK DEMAND ELECTRIC GAS TOTAL MIDYEAR CAPITAL
ELECTRIC(#)
GAS(#)
EMPLOYEES(#)
ELECTRIC(MW)
GAS(TJ)
SALES(GWh)
VOLUMES(PJ)
EARNINGS($M)
ASSETS($B)
RATE BASE($B)
PROGRAM($M)
ITC (2) – – 707 22,815 – – – 471 19.8 9.5 976
UNS Energy 526,000 160,000 2,103 3,179 118 18,354 16 292 10.2 5.8 1,390
Central Hudson 300,000 80,000 1,065 1,109 148 4,963 22 85 3.7 2.1 292
FortisBC (3) 179,000 1,041,000 2,411 696 1,352 3,326 227 219 9.6 6.4 648
FortisAlberta 568,000 – 1,1 11 2,642 – 16,887 – 131 4.8 3.7 436
Other Electric (4) 463,000 – 1,453 2,138 – 9,366 – 106 4.2 3.2 566
2,036,000 1,281,000 8,850 32,579 1,618 52,896 265 1,304 52.3 30.7 4,308
(1) Forecast
(2) Data reflects 100% of ITC’s operations except for earnings, which represent the Corporation’s 80.1% ownership interest. ITC has no retail customers.
(3) Includes FortisBC Energy and FortisBC Electric.
(4) Data reflects 100% of Caribbean Utilities’ operations except earnings, which represent the Corporation’s 60% ownership interest. Also includes Newfoundland Power, Maritime Electric, FortisOntario, a 39% equity investment in Wataynikaneyap Power Limited Partnership, Fortis Turks and Caicos, and a 33% equity investment in Belize Electricity.
TOTA L AS S E T S OF $ 53 B IL L IONAS OF DECE MBER 3 1, 2019
REGULATED
99% REGULATED UTILITIES
Electric Gas
Non-Regulated Energy Infrastructure(1)
1%ASSETS
82% 17%
(1) Comprising of investments in British Columbia and Belize.

FORTIS INC. 2019 ANNUAL REPORT18
Dated February 12, 2020
This MD&A has been prepared in accordance with National Instrument 51-102 – Continuous Disclosure Obligations. It should be read in conjunction with the 2019 Annual Financial Statements and is subject to the cautionary statement and disclaimer provided under “Forward-Looking Information” on page 58. Further information about Fortis, including its Annual Information Form filed on SEDAR, can be accessed at www.fortisinc.com, www.sedar.com, or www.sec.gov.
Financial information herein has been prepared in accordance with US GAAP (except for indicated Non-US GAAP Financial Measures) and, unless otherwise specified, is presented in Canadian dollars based, as applicable, on the following US-to-Canadian dollar exchange rates: (i) average of 1.33 and 1.30 for the years ended December 31, 2019 and 2018, respectively; (ii) 1.30 and 1.36 as at December 31, 2019 and 2018, respectively; and (iii) 1.32 for all forecast periods. Certain terms used in this MD&A are defined in the “Glossary” on page 59.
ABOUT FORTIS Fortis (TSX/NYSE: FTS) is a well-diversified leader in the North American regulated electric and gas utility industry, with revenue of $8.8 billion and total assets of $53 billion as at December 31, 2019.
Regulated utilities account for 99% of the Corporation’s assets with the remainder primarily attributable to non- regulated energy infrastructure. The Corporation’s 9,000 employees serve 3.3 million utility customers in five Canadian provinces, nine US states and three Caribbean countries. As at December 31, 2019, 66% of the Corporation’s assets were located outside Canada and 60% of 2019 revenue was derived from foreign operations.
Contents
About Fortis ....................................................................................................................... 18
Significant Items.............................................................................................................. 20
Performance at a Glance ........................................................................................... 20
The Industry ....................................................................................................................... 23
Operating Results ........................................................................................................... 24
Business Unit Performance ...................................................................................... 25
ITC ...................................................................................................................................... 25
UNS Energy .................................................................................................................. 26
Central Hudson ......................................................................................................... 26
FortisBC Energy ......................................................................................................... 27
FortisAlberta ................................................................................................................ 27
FortisBC Electric ........................................................................................................ 28
Other Electric .............................................................................................................. 28
Energy Infrastructure ............................................................................................. 28
Corporate and Other ............................................................................................. 29
Non-US GAAP Financial Measures ....................................................................... 29
Regulatory Highlights .................................................................................................. 30
Financial Position ............................................................................................................ 32
Liquidity and Capital Resources ............................................................................ 33
Cash Flow Requirements .................................................................................... 33
Cash Flow Summary .............................................................................................. 34
Contractual Obligations....................................................................................... 36
Capital Structure and Credit Ratings ........................................................... 36
Capital Plan .................................................................................................................. 37
Business Risks .................................................................................................................... 40
Accounting Matters ...................................................................................................... 48
Financial Instruments ................................................................................................... 51
Long-term Debt and Other ............................................................................... 51
Derivatives .................................................................................................................... 52
Selected Annual Financial Information ............................................................ 54
Fourth Quarter Results ................................................................................................ 55
Summary of Quarterly Results ............................................................................... 56
Related-Party Transactions........................................................................................ 57
Management’s Evaluation of Controls and Procedures ......................... 57
Outlook ................................................................................................................................. 58
Forward-Looking Information ................................................................................ 58
Glossary ................................................................................................................................ 59
Condensed Consolidated Financial Statements ........................................ 61
Management Discussion and Analysis
Jocelyn Perry, EVP, CFO, Fortis

FORTIS INC. 2019 ANNUAL REPORT 19
Management Discussion and Analysis
Fortis is principally an energy delivery company, with 93% of its assets related to transmission and distribution. The business is characterized by low-risk, stable and predictable earnings and cash flows. EPS and TSR are the primary measures of financial performance.
Fortis’ regulated utility businesses are: ITC (electric transmission – Michigan, Iowa, Minnesota, Illinois, Missouri, Kansas and Oklahoma); UNS Energy (integrated electric and natural gas distribution – Arizona); Central Hudson (electric transmission and distribution, and natural gas distribution – New York); FortisBC Energy (natural gas transmission and distribution – British Columbia); FortisAlberta (electric distribution – Alberta); FortisBC Electric (integrated electric – British Columbia); Newfoundland Power (integrated electric – Newfoundland and Labrador); Maritime Electric (integrated electric – Prince Edward Island); FortisOntario (integrated electric – Ontario); Caribbean Utilities (integrated electric – Grand Cayman); and FortisTCI (integrated electric – Turks and Caicos Islands). Fortis also holds equity investments in the Wataynikaneyap Partnership (electric transmission – Ontario) and Belize Electricity (integrated electric – Belize).
Non-regulated energy infrastructure is comprised of Aitken Creek (natural gas storage facility – British Columbia), BECOL (three hydroelectric generation facilities – Belize) and the Waneta Expansion up to its disposition in April 2019 (see “Significant Items” on page 20).
Fortis has a unique operating model with a small head office in St. John’s, Newfoundland and Labrador and business units that operate on a substantially autonomous basis. Each utility has its own management team and most have a board of directors with a majority of independent members, which provides effective oversight within the broad parameters of Fortis policies and best practices. Subsidiary autonomy supports constructive relationships with regulators, policy makers, customers and communities. Fortis believes this model enhances accountability, opportunity and performance across the Corporation’s businesses, and positions Fortis well for future investment opportunities.
Fortis strives to provide safe, reliable and cost-effective energy service to customers using sustainable practices while delivering long-term profitable growth to shareholders. Management is focused on achieving growth through the execution of the consolidated capital plan and the pursuit of additional investment opportunities within and proximate to existing service territories (see “Capital Plan” on page 37).
Additional information about the Corporation’s business and reporting units is provided in Note 1 in the 2019 Annual Financial Statements.
Electric82%
US63%
Non-RegulatedEnergyInfrastructure1%
Gas17%
Caribbean3%
Canada34%
Total Assets at December 31, 2019
FORTIS INC. 2019 ANNUAL REPORT20
Management Discussion and Analysis
SIGNIFICANT ITEMSDispositionOn April 16, 2019, Fortis sold its 51% ownership interest in the 335-MW Waneta Expansion for proceeds of $995 million. A gain on disposition of $577 million ($484 million after tax), net of expenses, was recognized in the Corporate and Other segment.
Fortis used the net proceeds to repay credit facility borrowings and repurchase, via a tender offer, US$400 million of its outstanding 3.055% unsecured senior notes due in 2026. The reduced earnings from the Waneta Expansion were offset by lower finance charges and a gain on repayment of the 3.055% notes.
Common Equity OfferingIn the fourth quarter of 2019, the Corporation issued approximately 22.8 million common shares at a price of $52.15 per share for gross proceeds of $1,190 million ($1,167 million net of commissions). The net proceeds were used to redeem US$500 million of its outstanding 2.10% unsecured senior notes due October 4, 2021, to repay credit facility borrowings and for general corporate purposes.
November 2019 FERC OrderIn November 2019 FERC issued an order reducing the base ROE for ITC’s MISO Subsidiaries to 9.88%, up to a maximum of 12.24% with incentive adders. Including incentive adders, this implies an all-in ROE for ITC’s MISO Subsidiaries of 10.63% compared to the previous all-in ROE of 11.07%. The net impact was a $63 million increase in earnings, comprised of $83 million related to the net reversal of liabilities established in prior periods, partially offset by $20 million related to the 2019 impact of the reduced ROE. See “Regulatory Highlights” on page 30 for further information.
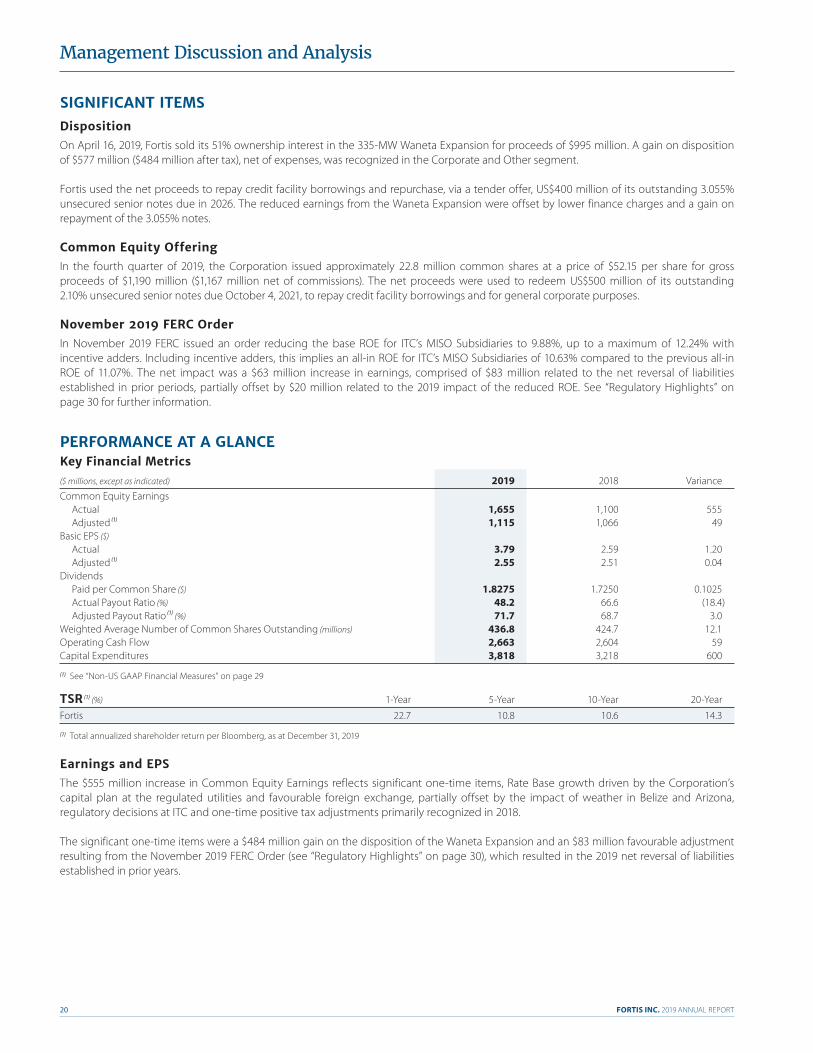
PERFORMANCE AT A GLANCEKey Financial Metrics($ millions, except as indicated) 2019 2018 Variance Common Equity Earnings Actual 1,655 1,100 555 Adjusted (1) 1,115 1,066 49Basic EPS ($) Actual 3.79 2.59 1.20 Adjusted (1) 2.55 2.51 0.04Dividends Paid per Common Share ($) 1.8275 1.7250 0.1025 Actual Payout Ratio (%) 48.2 66.6 (18.4) Adjusted Payout Ratio (1) (%) 71.7 68.7 3.0Weighted Average Number of Common Shares Outstanding (millions) 436.8 424.7 12.1Operating Cash Flow 2,663 2,604 59Capital Expenditures 3,818 3,218 600
(1) See “Non-US GAAP Financial Measures” on page 29
TSR (1) (%) 1-Year 5-Year 10-Year 20-Year
Fortis 22.7 10.8 10.6 14.3
(1) Total annualized shareholder return per Bloomberg, as at December 31, 2019
Earnings and EPSThe $555 million increase in Common Equity Earnings reflects significant one-time items, Rate Base growth driven by the Corporation’s capital plan at the regulated utilities and favourable foreign exchange, partially offset by the impact of weather in Belize and Arizona, regulatory decisions at ITC and one-time positive tax adjustments primarily recognized in 2018.
The significant one-time items were a $484 million gain on the disposition of the Waneta Expansion and an $83 million favourable adjustment resulting from the November 2019 FERC Order (see “Regulatory Highlights” on page 30), which resulted in the 2019 net reversal of liabilities established in prior years.
FORTIS INC. 2019 ANNUAL REPORT 21
Management Discussion and Analysis
The regulated utilities delivered positive financial results reflecting Rate Base growth, driven by ITC, lower operating expenses, primarily at FortisAlberta, and favourable foreign exchange. This growth was tempered by: (i) a lower ROE at ITC due to the November 2019 FERC Order and lower ROE incentive adders effective April 2018; (ii) lower earnings contribution from UNS Energy due to lower retail sales, driven by cooler weather, and higher costs associated with Rate Base growth not yet reflected in rates; and (iii) lower earnings contribution from the Energy Infrastructure segment due to lower hydroelectric production in Belize and lower realized margins at Aitken Creek.
The one-time positive tax adjustments recognized in 2018 related to an election to file a consolidated state tax return and the designation of net assets related to the Waneta Expansion as held for sale totalling $30 million and $14 million, respectively. In addition, the finalization of US tax reform regulations associated with base-erosion and anti-abuse tax resulted in the recognition of income tax expense of $12 million in 2019.
Finally, a 12.1 million increase in the weighted average number of common shares outstanding associated with the Corporation’s (i) $1.2 billion common equity issuance in the fourth quarter of 2019 (see “Significant Items” on page 20), (ii) ATM Program, and (iii) DRIP and share purchase plan, resulted in a $0.07 decrease in basic EPS.
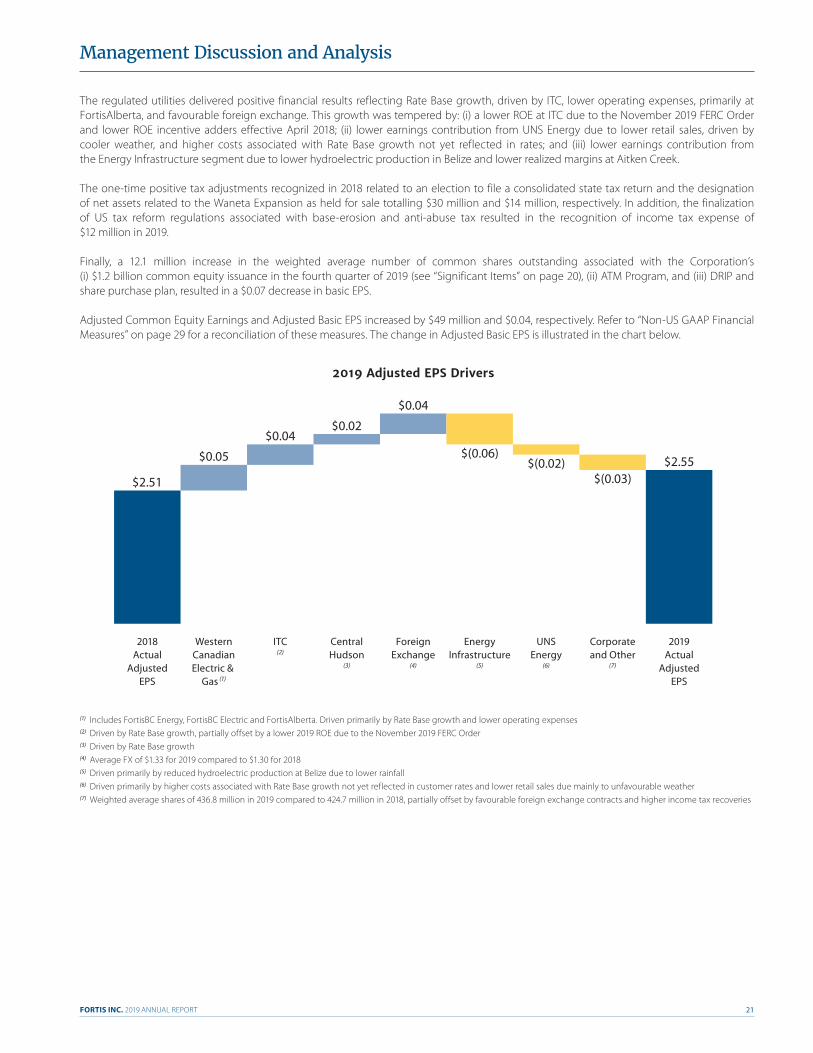
Adjusted Common Equity Earnings and Adjusted Basic EPS increased by $49 million and $0.04, respectively. Refer to “Non-US GAAP Financial Measures” on page 29 for a reconciliation of these measures. The change in Adjusted Basic EPS is illustrated in the chart below.
(1) Includes FortisBC Energy, FortisBC Electric and FortisAlberta. Driven primarily by Rate Base growth and lower operating expenses(2) Driven by Rate Base growth, partially offset by a lower 2019 ROE due to the November 2019 FERC Order(3) Driven by Rate Base growth(4) Average FX of $1.33 for 2019 compared to $1.30 for 2018(5) Driven primarily by reduced hydroelectric production at Belize due to lower rainfall(6) Driven primarily by higher costs associated with Rate Base growth not yet reflected in customer rates and lower retail sales due mainly to unfavourable weather(7) Weighted average shares of 436.8 million in 2019 compared to 424.7 million in 2018, partially offset by favourable foreign exchange contracts and higher income tax recoveries
$0.05 $2.55
$0.04
$0.04
$0.02
$2.51$(0.02)
$(0.03)
$(0.06)
2019Actual
AdjustedEPS
Corporateand Other
(7)
UNSEnergy
(6)
EnergyInfrastructure
(5)
ForeignExchange
(4)
CentralHudson
(3)
ITC(2)
WesternCanadianElectric &
Gas (1)
2018Actual
AdjustedEPS
2019 Adjusted EPS Drivers
FORTIS INC. 2019 ANNUAL REPORT22
Management Discussion and Analysis
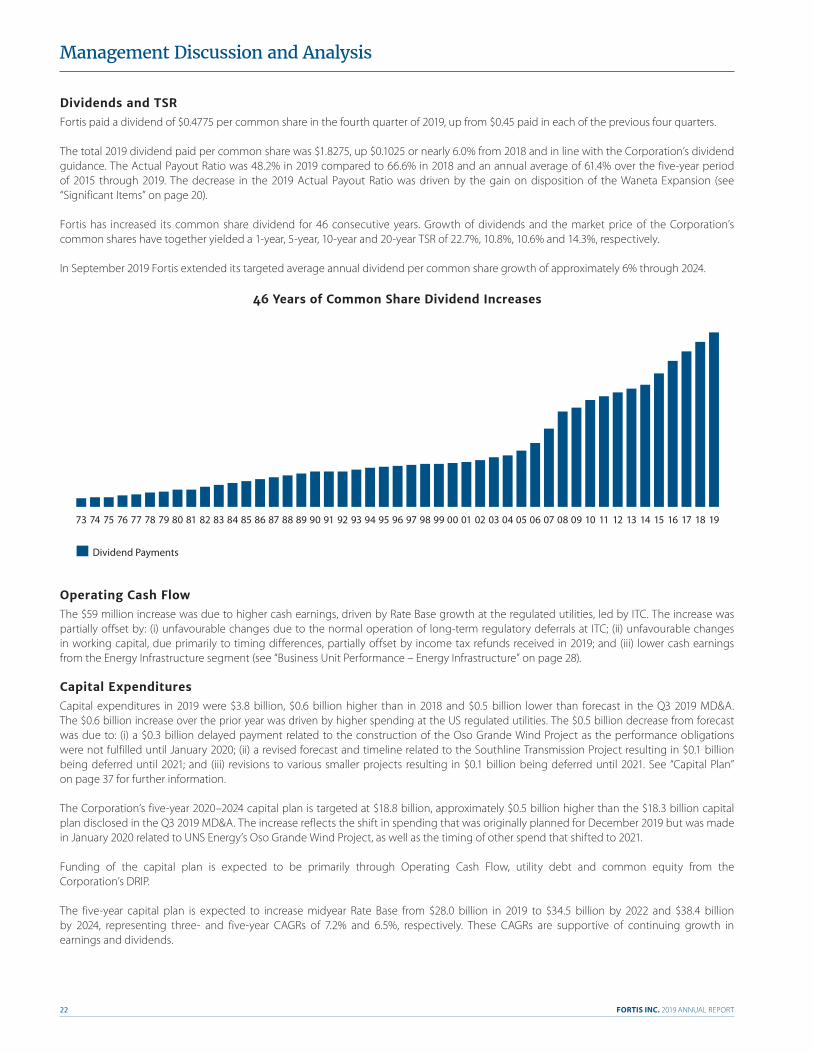
Dividends and TSRFortis paid a dividend of $0.4775 per common share in the fourth quarter of 2019, up from $0.45 paid in each of the previous four quarters.
The total 2019 dividend paid per common share was $1.8275, up $0.1025 or nearly 6.0% from 2018 and in line with the Corporation’s dividend guidance. The Actual Payout Ratio was 48.2% in 2019 compared to 66.6% in 2018 and an annual average of 61.4% over the five-year period of 2015 through 2019. The decrease in the 2019 Actual Payout Ratio was driven by the gain on disposition of the Waneta Expansion (see “Significant Items” on page 20).
Fortis has increased its common share dividend for 46 consecutive years. Growth of dividends and the market price of the Corporation’s common shares have together yielded a 1-year, 5-year, 10-year and 20-year TSR of 22.7%, 10.8%, 10.6% and 14.3%, respectively.
In September 2019 Fortis extended its targeted average annual dividend per common share growth of approximately 6% through 2024.
1918171615141312111009080706050403020100999897969594939291908988878685848382818079787776757473
46 Years of Common Share Dividend Increases
Dividend Payments
Operating Cash FlowThe $59 million increase was due to higher cash earnings, driven by Rate Base growth at the regulated utilities, led by ITC. The increase was partially offset by: (i) unfavourable changes due to the normal operation of long-term regulatory deferrals at ITC; (ii) unfavourable changes in working capital, due primarily to timing differences, partially offset by income tax refunds received in 2019; and (iii) lower cash earnings from the Energy Infrastructure segment (see “Business Unit Performance – Energy Infrastructure” on page 28).
Capital ExpendituresCapital expenditures in 2019 were $3.8 billion, $0.6 billion higher than in 2018 and $0.5 billion lower than forecast in the Q3 2019 MD&A. The $0.6 billion increase over the prior year was driven by higher spending at the US regulated utilities. The $0.5 billion decrease from forecast was due to: (i) a $0.3 billion delayed payment related to the construction of the Oso Grande Wind Project as the performance obligations were not fulfilled until January 2020; (ii) a revised forecast and timeline related to the Southline Transmission Project resulting in $0.1 billion being deferred until 2021; and (iii) revisions to various smaller projects resulting in $0.1 billion being deferred until 2021. See “Capital Plan” on page 37 for further information.
The Corporation’s five-year 2020–2024 capital plan is targeted at $18.8 billion, approximately $0.5 billion higher than the $18.3 billion capital plan disclosed in the Q3 2019 MD&A. The increase reflects the shift in spending that was originally planned for December 2019 but was made in January 2020 related to UNS Energy’s Oso Grande Wind Project, as well as the timing of other spend that shifted to 2021.
Funding of the capital plan is expected to be primarily through Operating Cash Flow, utility debt and common equity from the Corporation’s DRIP.
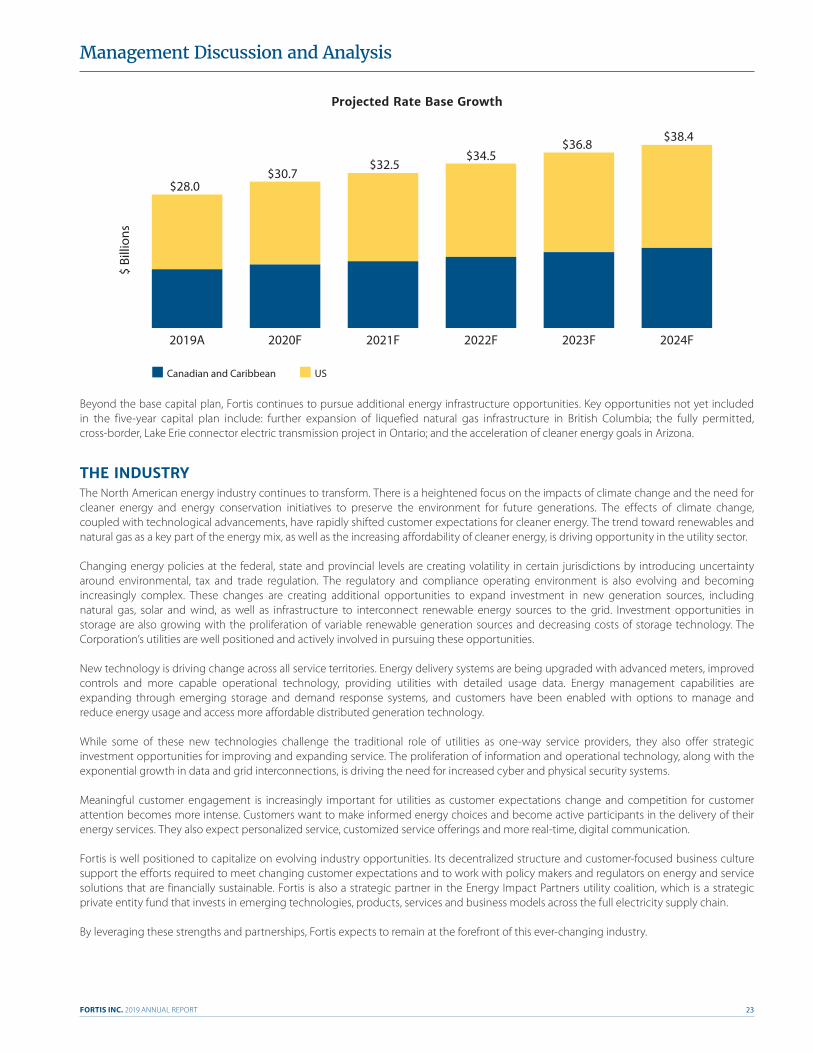
The five-year capital plan is expected to increase midyear Rate Base from $28.0 billion in 2019 to $34.5 billion by 2022 and $38.4 billion by 2024, representing three- and five-year CAGRs of 7.2% and 6.5%, respectively. These CAGRs are supportive of continuing growth in earnings and dividends.
FORTIS INC. 2019 ANNUAL REPORT 23
Management Discussion and Analysis
Beyond the base capital plan, Fortis continues to pursue additional energy infrastructure opportunities. Key opportunities not yet included in the five-year capital plan include: further expansion of liquefied natural gas infrastructure in British Columbia; the fully permitted, cross-border, Lake Erie connector electric transmission project in Ontario; and the acceleration of cleaner energy goals in Arizona.
THE INDUSTRYThe North American energy industry continues to transform. There is a heightened focus on the impacts of climate change and the need for cleaner energy and energy conservation initiatives to preserve the environment for future generations. The effects of climate change, coupled with technological advancements, have rapidly shifted customer expectations for cleaner energy. The trend toward renewables and natural gas as a key part of the energy mix, as well as the increasing affordability of cleaner energy, is driving opportunity in the utility sector.
Changing energy policies at the federal, state and provincial levels are creating volatility in certain jurisdictions by introducing uncertainty around environmental, tax and trade regulation. The regulatory and compliance operating environment is also evolving and becoming increasingly complex. These changes are creating additional opportunities to expand investment in new generation sources, including natural gas, solar and wind, as well as infrastructure to interconnect renewable energy sources to the grid. Investment opportunities in storage are also growing with the proliferation of variable renewable generation sources and decreasing costs of storage technology. The Corporation’s utilities are well positioned and actively involved in pursuing these opportunities.
New technology is driving change across all service territories. Energy delivery systems are being upgraded with advanced meters, improved controls and more capable operational technology, providing utilities with detailed usage data. Energy management capabilities are expanding through emerging storage and demand response systems, and customers have been enabled with options to manage and reduce energy usage and access more affordable distributed generation technology.
While some of these new technologies challenge the traditional role of utilities as one-way service providers, they also offer strategic investment opportunities for improving and expanding service. The proliferation of information and operational technology, along with the exponential growth in data and grid interconnections, is driving the need for increased cyber and physical security systems.
Meaningful customer engagement is increasingly important for utilities as customer expectations change and competition for customer attention becomes more intense. Customers want to make informed energy choices and become active participants in the delivery of their energy services. They also expect personalized service, customized service offerings and more real-time, digital communication.
Fortis is well positioned to capitalize on evolving industry opportunities. Its decentralized structure and customer-focused business culture support the efforts required to meet changing customer expectations and to work with policy makers and regulators on energy and service solutions that are financially sustainable. Fortis is also a strategic partner in the Energy Impact Partners utility coalition, which is a strategic private entity fund that invests in emerging technologies, products, services and business models across the full electricity supply chain.
By leveraging these strengths and partnerships, Fortis expects to remain at the forefront of this ever-changing industry.
2024F2023F2022F2021F2020F2019A
$ Bi
llion
s
$28.0
$38.4
$30.7$32.5
$34.5$36.8
Projected Rate Base Growth
Canadian and Caribbean US

FORTIS INC. 2019 ANNUAL REPORT24
Management Discussion and Analysis
OPERATING RESULTS Variance
($ millions) 2019 2018 FX Other Revenue 8,783 8,390 113 280Energy Supply Costs 2,520 2,495 30 (5)Operating Expenses 2,452 2,287 34 131Depreciation and Amortization 1,350 1,243 14 93Gain on Disposition 577 – – 577Other Income, Net 138 60 1 77Finance Charges 1,035 974 10 51Income Tax Expense 289 165 4 120
Net Earnings 1,852 1,286 22 544
Net Earnings Attributable to: Non-Controlling Interests 130 120 2 8 Preference Equity Shareholders 67 66 – 1 Common Equity Shareholders 1,655 1,100 20 535
Net Earnings 1,852 1,286 22 544
RevenueThe increase was due primarily to: (i) Rate Base growth at the regulated utilities, led by ITC; (ii) overall higher flow-through costs in customer rates; (iii) favourable foreign exchange of $113 million; and (iv) a $91 million favourable adjustment associated with the November 2019 FERC Order (see “Regulatory Highlights” on page 30). The increase was partially offset by: (i) lower revenue contribution from the Energy Infrastructure segment due primarily to the disposition of the Waneta Expansion and reduced hydroelectric production in Belize due to lower rainfall; and (ii) lower retail sales at UNS Energy due to weather.
Energy Supply CostsEnergy supply costs were comparable to 2018. A reclassification of finance lease costs of $29 million from energy supply costs to finance charges, due to the adoption of a new lease standard (see “Accounting Matters – New Accounting Policies” on page 48), was offset by overall higher commodity costs.
Operating ExpensesThe increase was due primarily to general inflationary and employee-related cost increases, including higher stock-based compensation costs driven by an increase in the Corporation’s share price and overall performance.
Depreciation and AmortizationThe increase was due primarily to continued investment in energy infrastructure at the Corporation’s regulated utilities.
Gain on DispositionSee “Significant Items” on page 20.
Other Income, NetThe increase was due primarily to: (i) favourable foreign exchange contracts; (ii) higher AFUDC equity earnings at UNS Energy; and (iii) an $11 million gain on the repayment of US$400 million of debt via a tender offer (see “Significant Items” on page 20).
Finance ChargesThe increase was due primarily to: (i) overall higher operating utility debt levels to support the capital plan; and (ii) the reclassification of finance lease interest of $29 million to finance charges from energy supply costs. The increase was partially offset by: (i) lower finance charges due to the repayment of debt (see “Significant Items” on page 20); and (ii) the reversal of interest of $16 million as a result of the November 2019 FERC Order (see “Regulatory Highlights” on page 30).
FORTIS INC. 2019 ANNUAL REPORT 25
Management Discussion and Analysis
Income Tax ExpenseThe increase was driven by: (i) tax on the disposition of the Waneta Expansion (see “Significant Items” on page 20); (ii) $44 million of favourable deferred income tax liability remeasurements in 2018 arising from an election to file a consolidated state income tax return and the designation of net assets related to the Waneta Expansion as held for sale; and (iii) the recognition of income tax expense of $12 million in 2019 related to the finalization of US tax reform regulations associated with base-erosion and anti-abuse tax, partially offset by higher valuation allowances released in 2019 compared to 2018.
Net EarningsSee “Performance at a Glance – Earnings and EPS” on page 20.
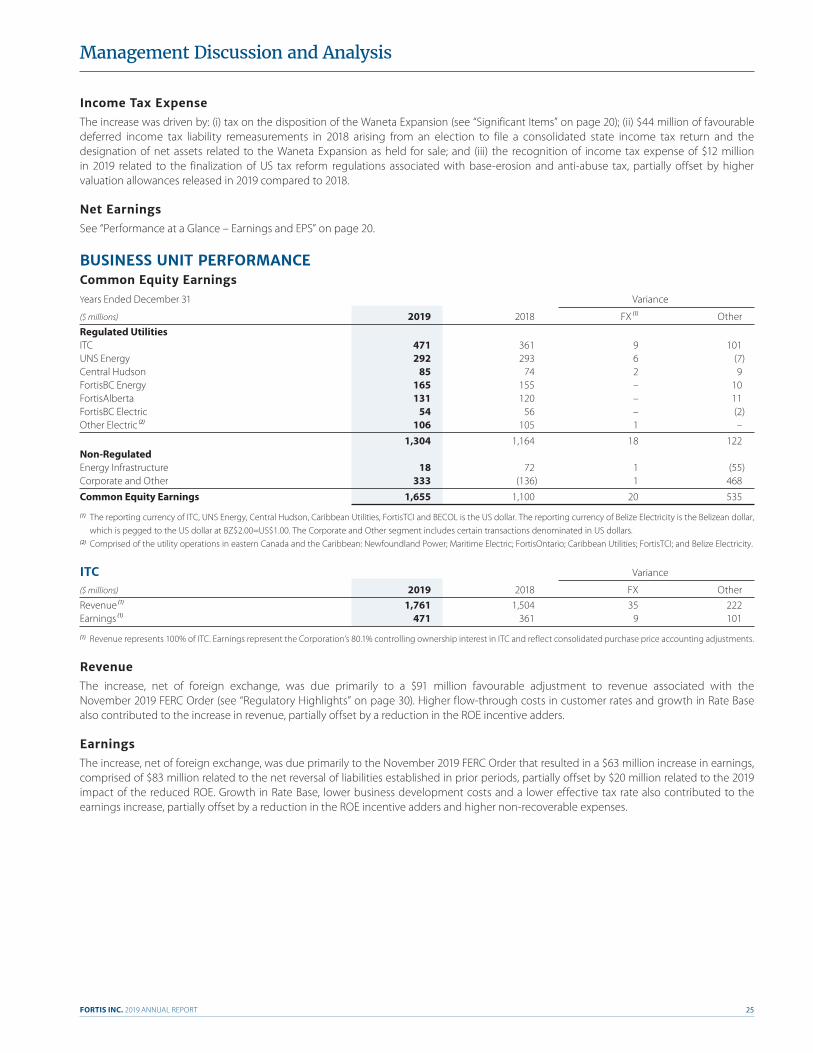
BUSINESS UNIT PERFORMANCECommon Equity EarningsYears Ended December 31 Variance
($ millions) 2019 2018 FX (1) Other Regulated UtilitiesITC 471 361 9 101UNS Energy 292 293 6 (7)Central Hudson 85 74 2 9FortisBC Energy 165 155 – 10FortisAlberta 131 120 – 11FortisBC Electric 54 56 – (2)Other Electric (2) 106 105 1 –
1,304 1,164 18 122Non-RegulatedEnergy Infrastructure 18 72 1 (55)Corporate and Other 333 (136) 1 468
Common Equity Earnings 1,655 1,100 20 535
(1) The reporting currency of ITC, UNS Energy, Central Hudson, Caribbean Utilities, FortisTCI and BECOL is the US dollar. The reporting currency of Belize Electricity is the Belizean dollar, which is pegged to the US dollar at BZ$2.00=US$1.00. The Corporate and Other segment includes certain transactions denominated in US dollars.
(2) Comprised of the utility operations in eastern Canada and the Caribbean: Newfoundland Power; Maritime Electric; FortisOntario; Caribbean Utilities; FortisTCI; and Belize Electricity.
ITC Variance
($ millions) 2019 2018 FX Other Revenue (1) 1,761 1,504 35 222Earnings (1) 471 361 9 101
(1) Revenue represents 100% of ITC. Earnings represent the Corporation’s 80.1% controlling ownership interest in ITC and reflect consolidated purchase price accounting adjustments.
RevenueThe increase, net of foreign exchange, was due primarily to a $91 million favourable adjustment to revenue associated with the November 2019 FERC Order (see “Regulatory Highlights” on page 30). Higher flow-through costs in customer rates and growth in Rate Base also contributed to the increase in revenue, partially offset by a reduction in the ROE incentive adders.
EarningsThe increase, net of foreign exchange, was due primarily to the November 2019 FERC Order that resulted in a $63 million increase in earnings, comprised of $83 million related to the net reversal of liabilities established in prior periods, partially offset by $20 million related to the 2019 impact of the reduced ROE. Growth in Rate Base, lower business development costs and a lower effective tax rate also contributed to the earnings increase, partially offset by a reduction in the ROE incentive adders and higher non-recoverable expenses.
FORTIS INC. 2019 ANNUAL REPORT26
Management Discussion and Analysis
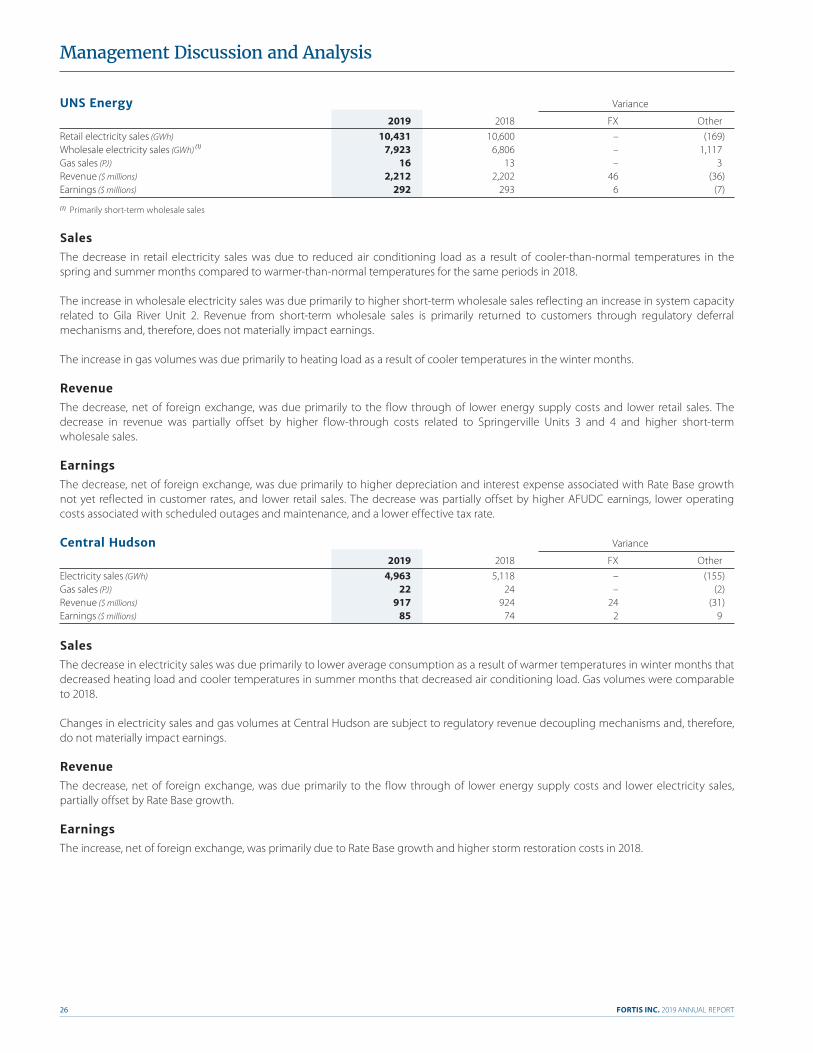
UNS Energy Variance
2019 2018 FX Other Retail electricity sales (GWh) 10,431 10,600 – (169)Wholesale electricity sales (GWh) (1) 7,923 6,806 – 1,117Gas sales (PJ) 16 13 – 3Revenue ($ millions) 2,212 2,202 46 (36)Earnings ($ millions) 292 293 6 (7)
(1) Primarily short-term wholesale sales
SalesThe decrease in retail electricity sales was due to reduced air conditioning load as a result of cooler-than-normal temperatures in the spring and summer months compared to warmer-than-normal temperatures for the same periods in 2018.
The increase in wholesale electricity sales was due primarily to higher short-term wholesale sales reflecting an increase in system capacity related to Gila River Unit 2. Revenue from short-term wholesale sales is primarily returned to customers through regulatory deferral mechanisms and, therefore, does not materially impact earnings.
The increase in gas volumes was due primarily to heating load as a result of cooler temperatures in the winter months.
RevenueThe decrease, net of foreign exchange, was due primarily to the flow through of lower energy supply costs and lower retail sales. The decrease in revenue was partially offset by higher flow-through costs related to Springerville Units 3 and 4 and higher short-term wholesale sales.
EarningsThe decrease, net of foreign exchange, was due primarily to higher depreciation and interest expense associated with Rate Base growth not yet reflected in customer rates, and lower retail sales. The decrease was partially offset by higher AFUDC earnings, lower operating costs associated with scheduled outages and maintenance, and a lower effective tax rate.
Central Hudson Variance
2019 2018 FX Other Electricity sales (GWh) 4,963 5,118 – (155)Gas sales (PJ) 22 24 – (2)Revenue ($ millions) 917 924 24 (31)Earnings ($ millions) 85 74 2 9
SalesThe decrease in electricity sales was due primarily to lower average consumption as a result of warmer temperatures in winter months that decreased heating load and cooler temperatures in summer months that decreased air conditioning load. Gas volumes were comparable to 2018.
Changes in electricity sales and gas volumes at Central Hudson are subject to regulatory revenue decoupling mechanisms and, therefore, do not materially impact earnings.
RevenueThe decrease, net of foreign exchange, was due primarily to the flow through of lower energy supply costs and lower electricity sales, partially offset by Rate Base growth.
EarningsThe increase, net of foreign exchange, was primarily due to Rate Base growth and higher storm restoration costs in 2018.
FORTIS INC. 2019 ANNUAL REPORT 27
Management Discussion and Analysis
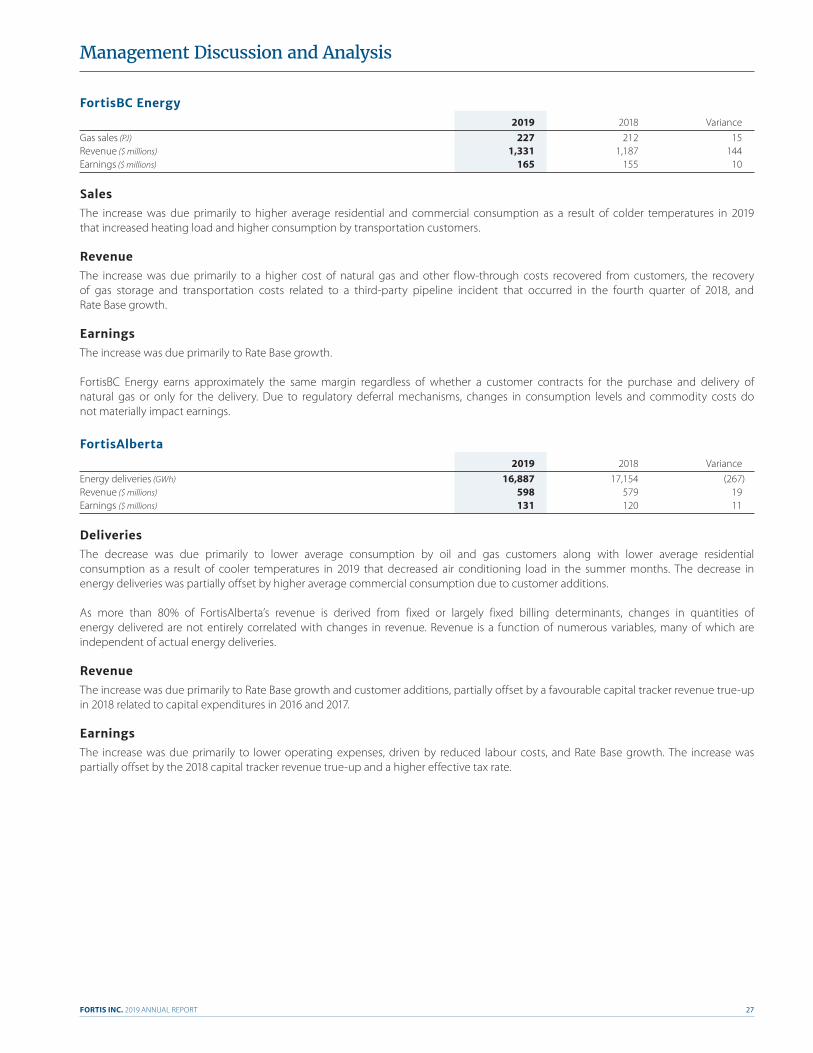
FortisBC Energy 2019 2018 VarianceGas sales (PJ) 227 212 15Revenue ($ millions) 1,331 1,187 144Earnings ($ millions) 165 155 10
SalesThe increase was due primarily to higher average residential and commercial consumption as a result of colder temperatures in 2019 that increased heating load and higher consumption by transportation customers.
RevenueThe increase was due primarily to a higher cost of natural gas and other flow-through costs recovered from customers, the recovery of gas storage and transportation costs related to a third-party pipeline incident that occurred in the fourth quarter of 2018, and Rate Base growth.
EarningsThe increase was due primarily to Rate Base growth.
FortisBC Energy earns approximately the same margin regardless of whether a customer contracts for the purchase and delivery of natural gas or only for the delivery. Due to regulatory deferral mechanisms, changes in consumption levels and commodity costs do not materially impact earnings.
FortisAlberta 2019 2018 VarianceEnergy deliveries (GWh) 16,887 17,154 (267)Revenue ($ millions) 598 579 19Earnings ($ millions) 131 120 11
DeliveriesThe decrease was due primarily to lower average consumption by oil and gas customers along with lower average residential consumption as a result of cooler temperatures in 2019 that decreased air conditioning load in the summer months. The decrease in energy deliveries was partially offset by higher average commercial consumption due to customer additions.
As more than 80% of FortisAlberta’s revenue is derived from fixed or largely fixed billing determinants, changes in quantities of energy delivered are not entirely correlated with changes in revenue. Revenue is a function of numerous variables, many of which are independent of actual energy deliveries.
RevenueThe increase was due primarily to Rate Base growth and customer additions, partially offset by a favourable capital tracker revenue true-up in 2018 related to capital expenditures in 2016 and 2017.
EarningsThe increase was due primarily to lower operating expenses, driven by reduced labour costs, and Rate Base growth. The increase was partially offset by the 2018 capital tracker revenue true-up and a higher effective tax rate.
FORTIS INC. 2019 ANNUAL REPORT28
Management Discussion and Analysis
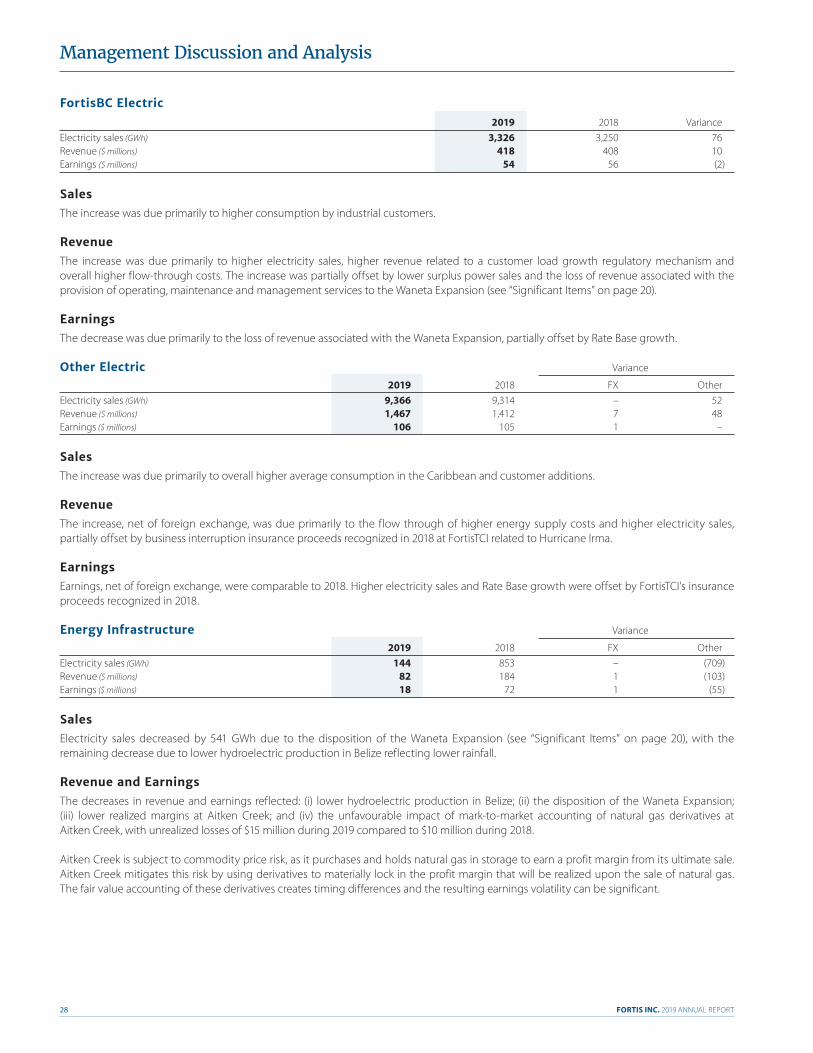
FortisBC Electric 2019 2018 VarianceElectricity sales (GWh) 3,326 3,250 76Revenue ($ millions) 418 408 10Earnings ($ millions) 54 56 (2)
SalesThe increase was due primarily to higher consumption by industrial customers.
RevenueThe increase was due primarily to higher electricity sales, higher revenue related to a customer load growth regulatory mechanism and overall higher flow-through costs. The increase was partially offset by lower surplus power sales and the loss of revenue associated with the provision of operating, maintenance and management services to the Waneta Expansion (see “Significant Items” on page 20).
EarningsThe decrease was due primarily to the loss of revenue associated with the Waneta Expansion, partially offset by Rate Base growth.
Other Electric Variance
2019 2018 FX Other Electricity sales (GWh) 9,366 9,314 – 52Revenue ($ millions) 1,467 1,412 7 48Earnings ($ millions) 106 105 1 –
SalesThe increase was due primarily to overall higher average consumption in the Caribbean and customer additions.
RevenueThe increase, net of foreign exchange, was due primarily to the flow through of higher energy supply costs and higher electricity sales, partially offset by business interruption insurance proceeds recognized in 2018 at FortisTCI related to Hurricane Irma.
EarningsEarnings, net of foreign exchange, were comparable to 2018. Higher electricity sales and Rate Base growth were offset by FortisTCI’s insurance proceeds recognized in 2018.
Energy Infrastructure Variance
2019 2018 FX Other Electricity sales (GWh) 144 853 – (709)Revenue ($ millions) 82 184 1 (103)Earnings ($ millions) 18 72 1 (55)
SalesElectricity sales decreased by 541 GWh due to the disposition of the Waneta Expansion (see “Significant Items” on page 20), with the remaining decrease due to lower hydroelectric production in Belize reflecting lower rainfall.
Revenue and EarningsThe decreases in revenue and earnings reflected: (i) lower hydroelectric production in Belize; (ii) the disposition of the Waneta Expansion; (iii) lower realized margins at Aitken Creek; and (iv) the unfavourable impact of mark-to-market accounting of natural gas derivatives at Aitken Creek, with unrealized losses of $15 million during 2019 compared to $10 million during 2018.
Aitken Creek is subject to commodity price risk, as it purchases and holds natural gas in storage to earn a profit margin from its ultimate sale. Aitken Creek mitigates this risk by using derivatives to materially lock in the profit margin that will be realized upon the sale of natural gas. The fair value accounting of these derivatives creates timing differences and the resulting earnings volatility can be significant.
FORTIS INC. 2019 ANNUAL REPORT 29
Management Discussion and Analysis
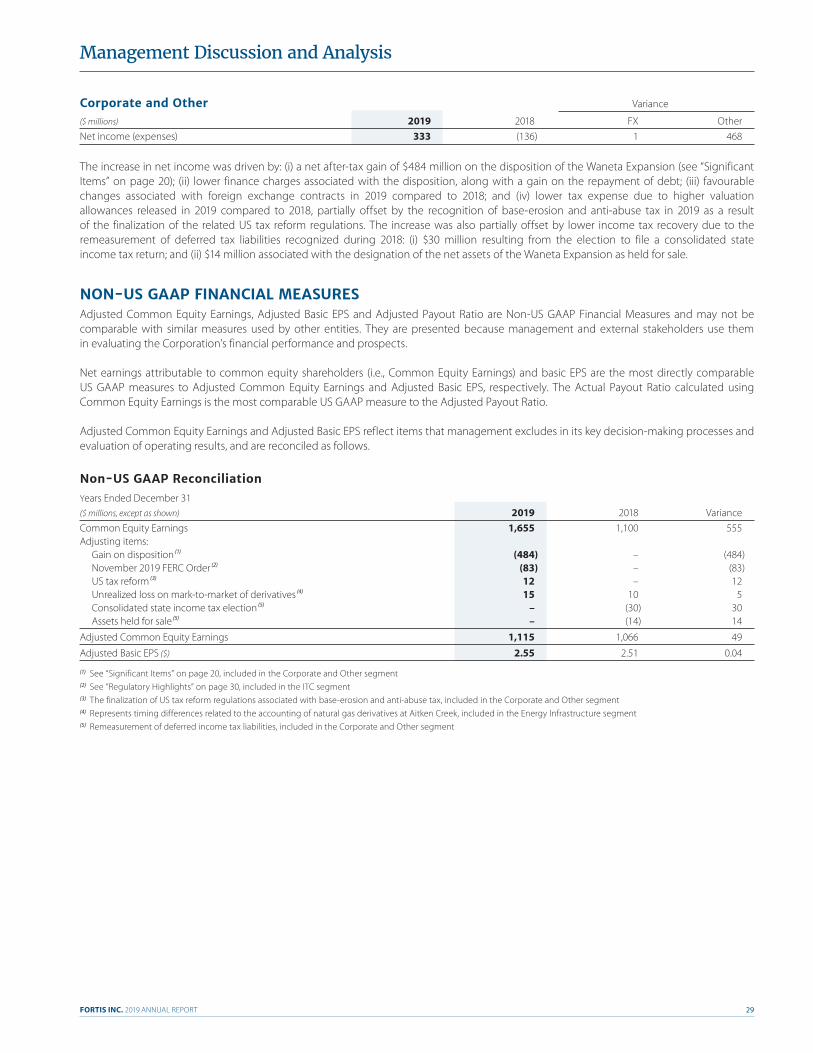
Corporate and Other Variance
($ millions) 2019 2018 FX Other Net income (expenses) 333 (136) 1 468
The increase in net income was driven by: (i) a net after-tax gain of $484 million on the disposition of the Waneta Expansion (see “Significant Items” on page 20); (ii) lower finance charges associated with the disposition, along with a gain on the repayment of debt; (iii) favourable changes associated with foreign exchange contracts in 2019 compared to 2018; and (iv) lower tax expense due to higher valuation allowances released in 2019 compared to 2018, partially offset by the recognition of base-erosion and anti-abuse tax in 2019 as a result of the finalization of the related US tax reform regulations. The increase was also partially offset by lower income tax recovery due to the remeasurement of deferred tax liabilities recognized during 2018: (i) $30 million resulting from the election to file a consolidated state income tax return; and (ii) $14 million associated with the designation of the net assets of the Waneta Expansion as held for sale.
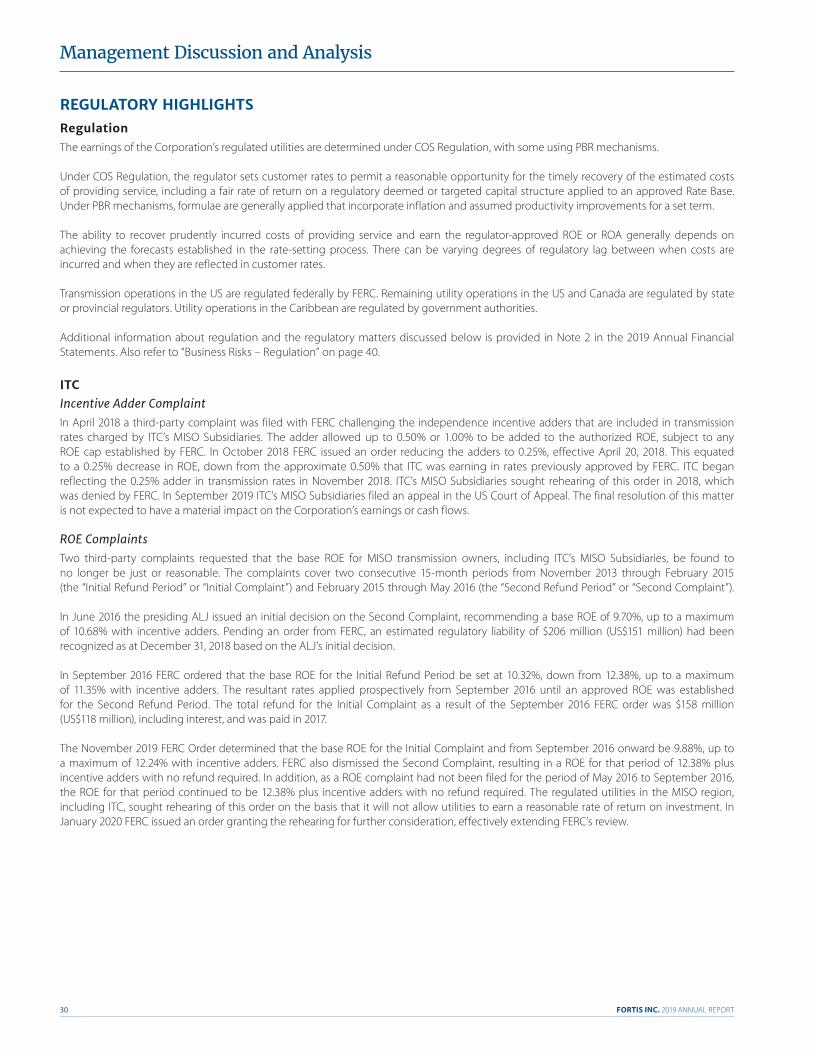
NON-US GAAP FINANCIAL MEASURESAdjusted Common Equity Earnings, Adjusted Basic EPS and Adjusted Payout Ratio are Non-US GAAP Financial Measures and may not be comparable with similar measures used by other entities. They are presented because management and external stakeholders use them in evaluating the Corporation’s financial performance and prospects.
Net earnings attributable to common equity shareholders (i.e., Common Equity Earnings) and basic EPS are the most directly comparable US GAAP measures to Adjusted Common Equity Earnings and Adjusted Basic EPS, respectively. The Actual Payout Ratio calculated using Common Equity Earnings is the most comparable US GAAP measure to the Adjusted Payout Ratio.
Adjusted Common Equity Earnings and Adjusted Basic EPS reflect items that management excludes in its key decision-making processes and evaluation of operating results, and are reconciled as follows.
Non-US GAAP ReconciliationYears Ended December 31($ millions, except as shown) 2019 2018 VarianceCommon Equity Earnings 1,655 1,100 555Adjusting items: Gain on disposition (1) (484) – (484) November 2019 FERC Order (2) (83) – (83) US tax reform (3) 12 – 12 Unrealized loss on mark-to-market of derivatives (4) 15 10 5 Consolidated state income tax election (5) – (30) 30 Assets held for sale (5) – (14) 14
Adjusted Common Equity Earnings 1,115 1,066 49
Adjusted Basic EPS ($) 2.55 2.51 0.04
(1) See “Significant Items” on page 20, included in the Corporate and Other segment(2) See “Regulatory Highlights” on page 30, included in the ITC segment(3) The finalization of US tax reform regulations associated with base-erosion and anti-abuse tax, included in the Corporate and Other segment(4) Represents timing differences related to the accounting of natural gas derivatives at Aitken Creek, included in the Energy Infrastructure segment(5) Remeasurement of deferred income tax liabilities, included in the Corporate and Other segment
FORTIS INC. 2019 ANNUAL REPORT30
Management Discussion and Analysis
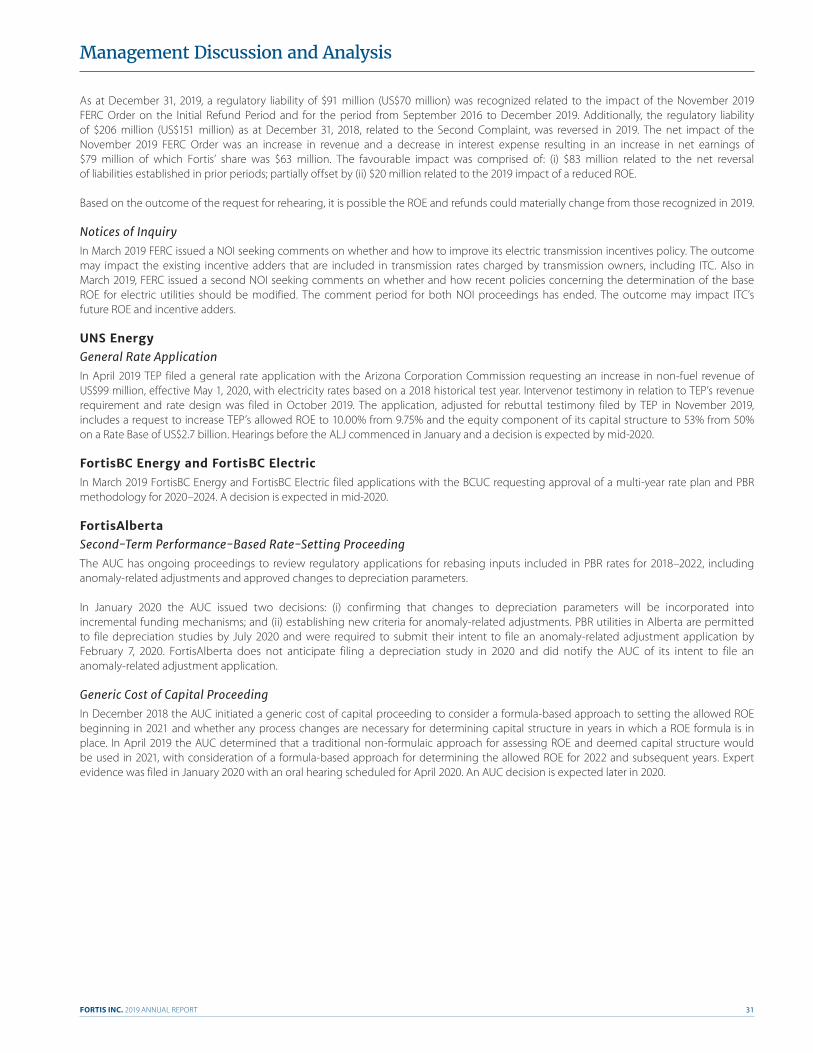
REGULATORY HIGHLIGHTSRegulationThe earnings of the Corporation’s regulated utilities are determined under COS Regulation, with some using PBR mechanisms.
Under COS Regulation, the regulator sets customer rates to permit a reasonable opportunity for the timely recovery of the estimated costs of providing service, including a fair rate of return on a regulatory deemed or targeted capital structure applied to an approved Rate Base. Under PBR mechanisms, formulae are generally applied that incorporate inflation and assumed productivity improvements for a set term.
The ability to recover prudently incurred costs of providing service and earn the regulator-approved ROE or ROA generally depends on achieving the forecasts established in the rate-setting process. There can be varying degrees of regulatory lag between when costs are incurred and when they are reflected in customer rates.
Transmission operations in the US are regulated federally by FERC. Remaining utility operations in the US and Canada are regulated by state or provincial regulators. Utility operations in the Caribbean are regulated by government authorities.
Additional information about regulation and the regulatory matters discussed below is provided in Note 2 in the 2019 Annual Financial Statements. Also refer to “Business Risks – Regulation” on page 40.
ITCIncentive Adder ComplaintIn April 2018 a third-party complaint was filed with FERC challenging the independence incentive adders that are included in transmission rates charged by ITC’s MISO Subsidiaries. The adder allowed up to 0.50% or 1.00% to be added to the authorized ROE, subject to any ROE cap established by FERC. In October 2018 FERC issued an order reducing the adders to 0.25%, effective April 20, 2018. This equated to a 0.25% decrease in ROE, down from the approximate 0.50% that ITC was earning in rates previously approved by FERC. ITC began reflecting the 0.25% adder in transmission rates in November 2018. ITC’s MISO Subsidiaries sought rehearing of this order in 2018, which was denied by FERC. In September 2019 ITC’s MISO Subsidiaries filed an appeal in the US Court of Appeal. The final resolution of this matter is not expected to have a material impact on the Corporation’s earnings or cash flows.
ROE ComplaintsTwo third-party complaints requested that the base ROE for MISO transmission owners, including ITC’s MISO Subsidiaries, be found to no longer be just or reasonable. The complaints cover two consecutive 15-month periods from November 2013 through February 2015 (the “Initial Refund Period” or “Initial Complaint”) and February 2015 through May 2016 (the “Second Refund Period” or “Second Complaint”).
In June 2016 the presiding ALJ issued an initial decision on the Second Complaint, recommending a base ROE of 9.70%, up to a maximum of 10.68% with incentive adders. Pending an order from FERC, an estimated regulatory liability of $206 million (US$151 million) had been recognized as at December 31, 2018 based on the ALJ’s initial decision.
In September 2016 FERC ordered that the base ROE for the Initial Refund Period be set at 10.32%, down from 12.38%, up to a maximum of 11.35% with incentive adders. The resultant rates applied prospectively from September 2016 until an approved ROE was established for the Second Refund Period. The total refund for the Initial Complaint as a result of the September 2016 FERC order was $158 million (US$118 million), including interest, and was paid in 2017.
The November 2019 FERC Order determined that the base ROE for the Initial Complaint and from September 2016 onward be 9.88%, up to a maximum of 12.24% with incentive adders. FERC also dismissed the Second Complaint, resulting in a ROE for that period of 12.38% plus incentive adders with no refund required. In addition, as a ROE complaint had not been filed for the period of May 2016 to September 2016, the ROE for that period continued to be 12.38% plus incentive adders with no refund required. The regulated utilities in the MISO region, including ITC, sought rehearing of this order on the basis that it will not allow utilities to earn a reasonable rate of return on investment. In January 2020 FERC issued an order granting the rehearing for further consideration, effectively extending FERC’s review.
FORTIS INC. 2019 ANNUAL REPORT 31
Management Discussion and Analysis
As at December 31, 2019, a regulatory liability of $91 million (US$70 million) was recognized related to the impact of the November 2019 FERC Order on the Initial Refund Period and for the period from September 2016 to December 2019. Additionally, the regulatory liability of $206 million (US$151 million) as at December 31, 2018, related to the Second Complaint, was reversed in 2019. The net impact of the November 2019 FERC Order was an increase in revenue and a decrease in interest expense resulting in an increase in net earnings of $79 million of which Fortis’ share was $63 million. The favourable impact was comprised of: (i) $83 million related to the net reversal of liabilities established in prior periods; partially offset by (ii) $20 million related to the 2019 impact of a reduced ROE.
Based on the outcome of the request for rehearing, it is possible the ROE and refunds could materially change from those recognized in 2019.
Notices of InquiryIn March 2019 FERC issued a NOI seeking comments on whether and how to improve its electric transmission incentives policy. The outcome may impact the existing incentive adders that are included in transmission rates charged by transmission owners, including ITC. Also in March 2019, FERC issued a second NOI seeking comments on whether and how recent policies concerning the determination of the base ROE for electric utilities should be modified. The comment period for both NOI proceedings has ended. The outcome may impact ITC’s future ROE and incentive adders.
UNS EnergyGeneral Rate ApplicationIn April 2019 TEP filed a general rate application with the Arizona Corporation Commission requesting an increase in non-fuel revenue of US$99 million, effective May 1, 2020, with electricity rates based on a 2018 historical test year. Intervenor testimony in relation to TEP’s revenue requirement and rate design was filed in October 2019. The application, adjusted for rebuttal testimony filed by TEP in November 2019, includes a request to increase TEP’s allowed ROE to 10.00% from 9.75% and the equity component of its capital structure to 53% from 50% on a Rate Base of US$2.7 billion. Hearings before the ALJ commenced in January and a decision is expected by mid-2020.
FortisBC Energy and FortisBC ElectricIn March 2019 FortisBC Energy and FortisBC Electric filed applications with the BCUC requesting approval of a multi-year rate plan and PBR methodology for 2020–2024. A decision is expected in mid-2020.
FortisAlbertaSecond-Term Performance-Based Rate-Setting ProceedingThe AUC has ongoing proceedings to review regulatory applications for rebasing inputs included in PBR rates for 2018–2022, including anomaly-related adjustments and approved changes to depreciation parameters.
In January 2020 the AUC issued two decisions: (i) confirming that changes to depreciation parameters will be incorporated into incremental funding mechanisms; and (ii) establishing new criteria for anomaly-related adjustments. PBR utilities in Alberta are permitted to file depreciation studies by July 2020 and were required to submit their intent to file an anomaly-related adjustment application by February 7, 2020. FortisAlberta does not anticipate filing a depreciation study in 2020 and did notify the AUC of its intent to file an anomaly-related adjustment application.
Generic Cost of Capital ProceedingIn December 2018 the AUC initiated a generic cost of capital proceeding to consider a formula-based approach to setting the allowed ROE beginning in 2021 and whether any process changes are necessary for determining capital structure in years in which a ROE formula is in place. In April 2019 the AUC determined that a traditional non-formulaic approach for assessing ROE and deemed capital structure would be used in 2021, with consideration of a formula-based approach for determining the allowed ROE for 2022 and subsequent years. Expert evidence was filed in January 2020 with an oral hearing scheduled for April 2020. An AUC decision is expected later in 2020.
FORTIS INC. 2019 ANNUAL REPORT32
Management Discussion and Analysis
2018 Alberta Independent System Operator Tariff ApplicationIn September 2019 the AUC issued a decision that addressed, among other things, a proposal to change how the AESO’s customer contribution policy is accounted for between distribution facility owners, such as FortisAlberta, and transmission facility owners. The decision prevents any future investment by FortisAlberta under the policy and directs that the unamortized customer contributions of approximately $400 million as at December 31, 2017, which form part of FortisAlberta’s Rate Base, be transferred to the incumbent transmission facility owner in FortisAlberta’s service area.
In October 2019 FortisAlberta filed evidence to oppose the decision. Implementation of the order has been suspended and the decision remains under review by the AUC. It is expected that the decision will remain under review through the first quarter of 2020. The likely outcome of this process and potential impacts, if any, cannot be determined at this time.
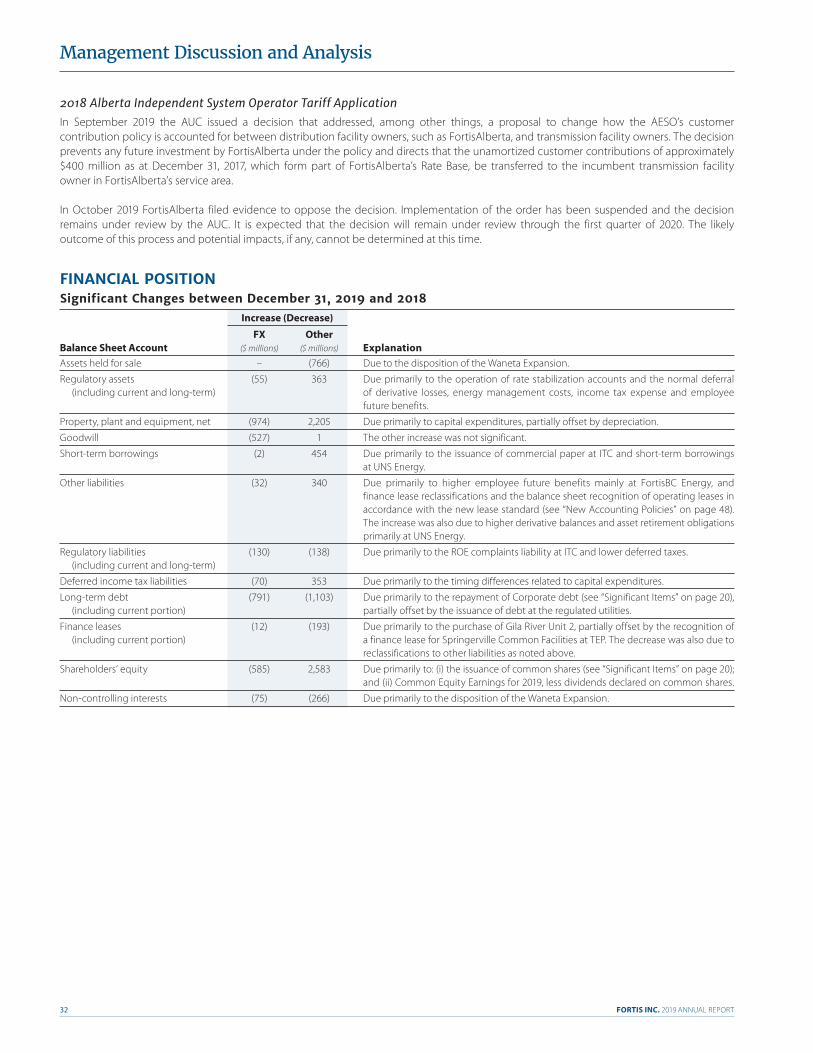
FINANCIAL POSITIONSignificant Changes between December 31, 2019 and 2018 Increase (Decrease)
FX Other Balance Sheet Account ($ millions) ($ millions) ExplanationAssets held for sale – (766) Due to the disposition of the Waneta Expansion.
Regulatory assets (55) 363 Due primarily to the operation of rate stabilization accounts and the normal deferral (including current and long-term) of derivative losses, energy management costs, income tax expense and employee future benefits.
Property, plant and equipment, net (974) 2,205 Due primarily to capital expenditures, partially offset by depreciation.
Goodwill (527) 1 The other increase was not significant.
Short-term borrowings (2) 454 Due primarily to the issuance of commercial paper at ITC and short-term borrowings at UNS Energy.
Other liabilities (32) 340 Due primarily to higher employee future benefits mainly at FortisBC Energy, and finance lease reclassifications and the balance sheet recognition of operating leases in accordance with the new lease standard (see “New Accounting Policies” on page 48). The increase was also due to higher derivative balances and asset retirement obligations primarily at UNS Energy.
Regulatory liabilities (130) (138) Due primarily to the ROE complaints liability at ITC and lower deferred taxes. (including current and long-term)
Deferred income tax liabilities (70) 353 Due primarily to the timing differences related to capital expenditures.
Long-term debt (791) (1,103) Due primarily to the repayment of Corporate debt (see “Significant Items” on page 20), (including current portion) partially offset by the issuance of debt at the regulated utilities.
Finance leases (12) (193) Due primarily to the purchase of Gila River Unit 2, partially offset by the recognition of (including current portion) a finance lease for Springerville Common Facilities at TEP. The decrease was also due to
reclassifications to other liabilities as noted above.
Shareholders’ equity (585) 2,583 Due primarily to: (i) the issuance of common shares (see “Significant Items” on page 20); and (ii) Common Equity Earnings for 2019, less dividends declared on common shares.
Non-controlling interests (75) (266) Due primarily to the disposition of the Waneta Expansion.
FORTIS INC. 2019 ANNUAL REPORT 33
Management Discussion and Analysis
LIQUIDITY AND CAPITAL RESOURCES
Cash Flow RequirementsAt the subsidiary level, it is expected that operating and interest costs will be paid from Operating Cash Flows, with varying levels of residual cash flows available for capital expenditures and/or dividend payments to Fortis. Capital expenditures are expected to be financed primarily from borrowings under credit facilities, long-term debt offerings and equity injections from Fortis. Borrowings under credit facilities may be required periodically to support seasonal working capital requirements.
Cash required of Fortis to support subsidiary capital expenditures is expected to be derived from borrowings under the Corporation’s committed credit facility, proceeds from the DRIP and issuances of common shares, preference shares and long-term debt. Depending on the timing of subsidiary dividend receipts, borrowings under the Corporation’s credit facility may be required periodically to support debt servicing and dividend payments.
Within this dynamic, the subsidiaries pay dividends to Fortis and receive equity injections from Fortis when required, and both Fortis and its subsidiaries initially borrow through their committed credit facilities and periodically replace these borrowings with long-term debt. Financing needs also arise periodically for acquisitions.
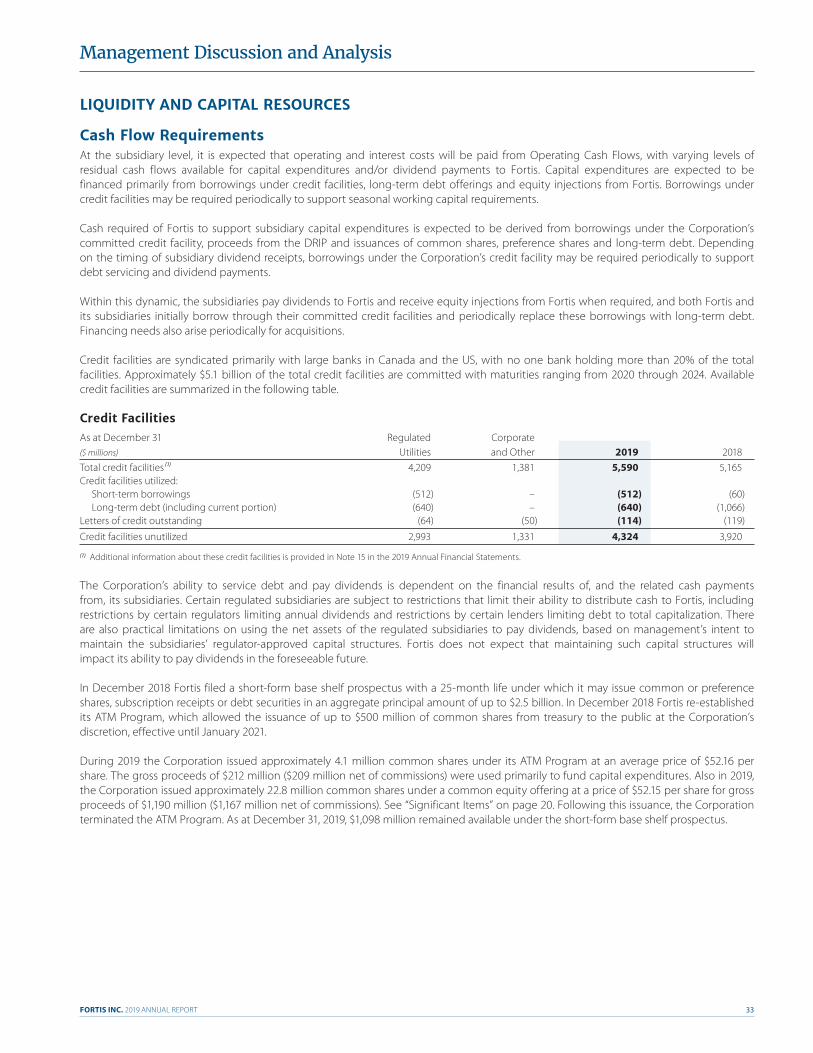
Credit facilities are syndicated primarily with large banks in Canada and the US, with no one bank holding more than 20% of the total facilities. Approximately $5.1 billion of the total credit facilities are committed with maturities ranging from 2020 through 2024. Available credit facilities are summarized in the following table.
Credit FacilitiesAs at December 31 Regulated Corporate ($ millions) Utilities and Other 2019 2018 Total credit facilities (1) 4,209 1,381 5,590 5,165Credit facilities utilized: Short-term borrowings (512) – (512) (60) Long-term debt (including current portion) (640) – (640) (1,066)Letters of credit outstanding (64) (50) (114) (119)
Credit facilities unutilized 2,993 1,331 4,324 3,920
(1) Additional information about these credit facilities is provided in Note 15 in the 2019 Annual Financial Statements.
The Corporation’s ability to service debt and pay dividends is dependent on the financial results of, and the related cash payments from, its subsidiaries. Certain regulated subsidiaries are subject to restrictions that limit their ability to distribute cash to Fortis, including restrictions by certain regulators limiting annual dividends and restrictions by certain lenders limiting debt to total capitalization. There are also practical limitations on using the net assets of the regulated subsidiaries to pay dividends, based on management’s intent to maintain the subsidiaries’ regulator-approved capital structures. Fortis does not expect that maintaining such capital structures will impact its ability to pay dividends in the foreseeable future.
In December 2018 Fortis filed a short-form base shelf prospectus with a 25-month life under which it may issue common or preference shares, subscription receipts or debt securities in an aggregate principal amount of up to $2.5 billion. In December 2018 Fortis re-established its ATM Program, which allowed the issuance of up to $500 million of common shares from treasury to the public at the Corporation’s discretion, effective until January 2021.
During 2019 the Corporation issued approximately 4.1 million common shares under its ATM Program at an average price of $52.16 per share. The gross proceeds of $212 million ($209 million net of commissions) were used primarily to fund capital expenditures. Also in 2019, the Corporation issued approximately 22.8 million common shares under a common equity offering at a price of $52.15 per share for gross proceeds of $1,190 million ($1,167 million net of commissions). See “Significant Items” on page 20. Following this issuance, the Corporation terminated the ATM Program. As at December 31, 2019, $1,098 million remained available under the short-form base shelf prospectus.

FORTIS INC. 2019 ANNUAL REPORT34
Management Discussion and Analysis
As at December 31, 2019: (i) consolidated fixed-term debt maturities/repayments are expected to average $945 million annually over the next five years; (ii) approximately 80% of the Corporation’s consolidated long-term debt, excluding credit facility borrowings, had maturities beyond five years; and (iii) available credit facilities were $5.6 billion with $4.3 billion unutilized.
This combination of available credit facilities and manageable annual debt maturities/repayments provides flexibility in the timing of access to capital markets. Given current credit ratings and capital structures, the Corporation and its subsidiaries expect to continue to have reasonable access to long-term capital in 2020.
Fortis and its subsidiaries were in compliance with debt covenants as at December 31, 2019 and are expected to remain compliant in 2020.
Cash Flow Summary Summary of Cash FlowsYears Ended December 31($ millions) 2019 2018 Variance
Cash, beginning of year 332 327 5Cash provided by (used in): Operating activities 2,663 2,604 59 Investing activities (2,768) (3,252) 484 Financing activities 154 644 (490)Effect of exchange rate changes on cash and cash equivalents (26) 24 (50)Cash and change in cash associated with assets held for sale 15 (15) 30
Cash, end of year 370 332 38
Operating ActivitiesSee “Performance at a Glance – Operating Cash Flow” on page 22.
Investing ActivitiesCash used in investing activities reflects a higher capital spending level in 2019. See “Performance at a Glance – Capital Expenditures” on page 22 and “Capital Plan” on page 37. Cash used in investing activities was partially offset by proceeds from the disposition of the Waneta Expansion.
Financing ActivitiesCash flows related to financing activities will fluctuate from year to year as a result of changes in the subsidiaries’ capital expenditures, the amount of Operating Cash Flows available to fund those capital expenditures and the amount of funding required from debt and common equity issuances.
In the fourth quarter of 2019, the Corporation issued approximately 22.8 million common shares at a price of $52.15 per share for gross proceeds of $1,190 million ($1,167 million net of commissions). The net proceeds were used to redeem US$500 million of its outstanding 2.10% unsecured senior notes due October 4, 2021, to repay credit facility borrowings and for general corporate purposes.
Net proceeds from the disposition of the Waneta Expansion were used to repay credit facility borrowings and repurchase, via a tender offer, US$400 million of its outstanding 3.055% unsecured senior notes due in 2026.

FORTIS INC. 2019 ANNUAL REPORT 35
Management Discussion and Analysis
Debt Financing Long-Term Debt Issuances Interest Year ended December 31, 2019 Month Rate Use of ($ millions, except %) Issued (%) Maturity Amount ProceedsITC Secured notes January 4.55 2049 US 50 (1) (2) (3)
Unsecured term loan credit agreement (4) June (5) 2021 US 200 (6)
Secured notes July 4.65 2049 US 50 (1) (2) (3)
First mortgage bonds August 3.30 2049 US 75 (1) (2) (3)
Central Hudson Unsecured notes October 3.89 2049 US 50 (2) (3) (6)
Unsecured notes October 3.99 2059 US 50 (2) (3) (6)
FortisBC Energy Unsecured debentures August 2.82 2049 200 (1)
FortisTCI Unsecured non-revolving term loan February (7) 2025 US 5 (2) (3)
Caribbean Utilities Unsecured notes May 4.14 2049 US 40 (1) (3) (6)
Unsecured notes August 4.14 2049 US 20 (2) (3) (6)
Unsecured notes August 3.83 2039 US 20 (2) (3) (6)
(1) Repay credit facility borrowings(2) Finance capital expenditures(3) General corporate purposes(4) Maximum amount of borrowings under this agreement was US$400 million; in January 2020 the remaining US$200 million was drawn to repay outstanding commercial
paper balances(5) Floating rate of a one-month LIBOR plus a spread of 0.60%(6) Repay maturing long-term debt(7) Floating rate of a one-month LIBOR plus a spread of 1.75%
In January 2020 ITC entered into an unsecured term loan credit agreement, due in January 2021, under which the maximum amount of US$75 million was borrowed. The proceeds were used to repay credit facility borrowings.
Common Equity FinancingCommon Equity Issuances and Dividends PaidYears Ended December 31($ millions, except as indicated) 2019 2018 Variance
Number of common shares issued (1) (# millions) 34.8 7.4 27.4
Amount of common shares issued (2) 1,756 307 1,449Non-cash issuances (3) (314) (273) (41)
Cash proceeds from common shares issued 1,442 34 1,408
Dividends paid per common share ($) 1.8275 1.7250 0.1025
Total dividends paid 793 731 62Non-cash DRIP (299) (272) (27)
Cash dividends paid 494 459 35
(1) Mainly related to the Corporation’s issuance of shares in the fourth quarter of 2019, DRIP and ATM Program(2) Net of commissions of $26 million (2018 – $nil)(3) Related to DRIP and stock options
On February 12, 2020, Fortis declared a dividend of $0.4775 per common share payable on June 1, 2020. The payment of dividends is at the discretion of the Board of Directors and depends on the Corporation’s financial condition and other factors.
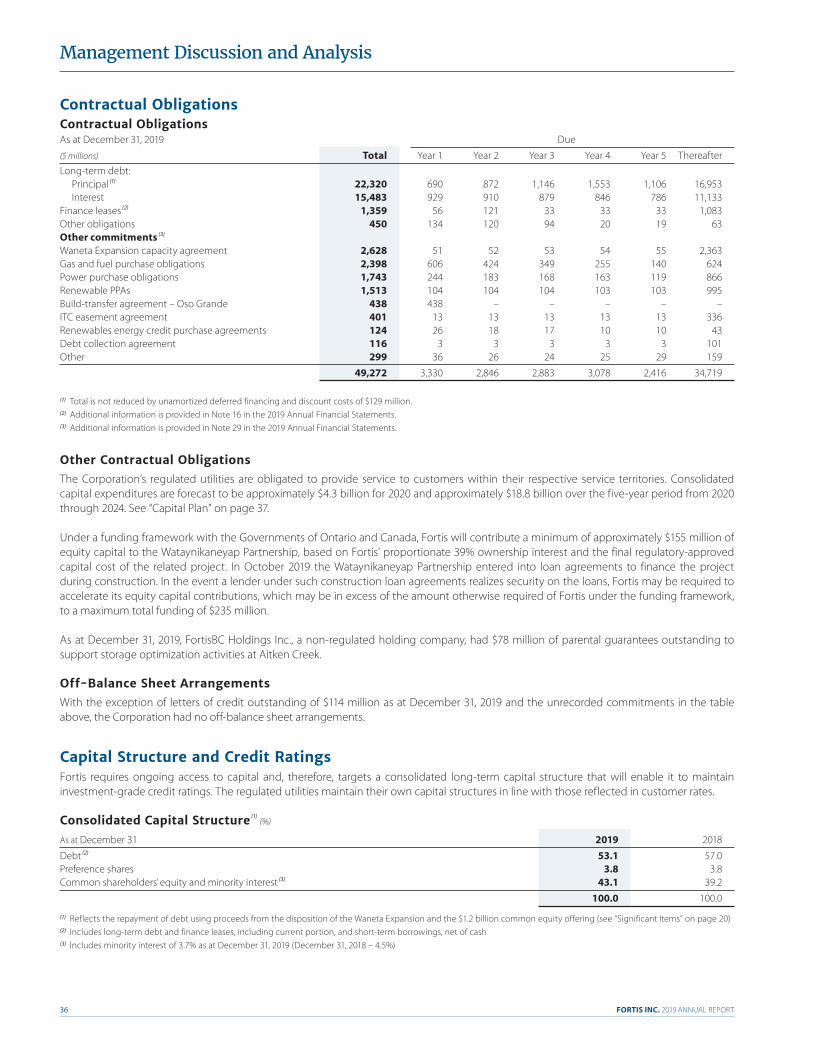
FORTIS INC. 2019 ANNUAL REPORT36
Management Discussion and Analysis
Contractual ObligationsContractual Obligations As at December 31, 2019 Due
($ millions) Total Year 1 Year 2 Year 3 Year 4 Year 5 ThereafterLong-term debt: Principal (1) 22,320 690 872 1,146 1,553 1,106 16,953 Interest 15,483 929 910 879 846 786 11,133Finance leases (2) 1,359 56 121 33 33 33 1,083Other obligations 450 134 120 94 20 19 63Other commitments (3)
Waneta Expansion capacity agreement 2,628 51 52 53 54 55 2,363Gas and fuel purchase obligations 2,398 606 424 349 255 140 624Power purchase obligations 1,743 244 183 168 163 119 866Renewable PPAs 1,513 104 104 104 103 103 995Build-transfer agreement – Oso Grande 438 438 – – – – –ITC easement agreement 401 13 13 13 13 13 336Renewables energy credit purchase agreements 124 26 18 17 10 10 43Debt collection agreement 116 3 3 3 3 3 101Other 299 36 26 24 25 29 159
49,272 3,330 2,846 2,883 3,078 2,416 34,719
(1) Total is not reduced by unamortized deferred financing and discount costs of $129 million.(2) Additional information is provided in Note 16 in the 2019 Annual Financial Statements.(3) Additional information is provided in Note 29 in the 2019 Annual Financial Statements.
Other Contractual ObligationsThe Corporation’s regulated utilities are obligated to provide service to customers within their respective service territories. Consolidated capital expenditures are forecast to be approximately $4.3 billion for 2020 and approximately $18.8 billion over the five-year period from 2020 through 2024. See “Capital Plan” on page 37.
Under a funding framework with the Governments of Ontario and Canada, Fortis will contribute a minimum of approximately $155 million of equity capital to the Wataynikaneyap Partnership, based on Fortis’ proportionate 39% ownership interest and the final regulatory-approved capital cost of the related project. In October 2019 the Wataynikaneyap Partnership entered into loan agreements to finance the project during construction. In the event a lender under such construction loan agreements realizes security on the loans, Fortis may be required to accelerate its equity capital contributions, which may be in excess of the amount otherwise required of Fortis under the funding framework, to a maximum total funding of $235 million.
As at December 31, 2019, FortisBC Holdings Inc., a non-regulated holding company, had $78 million of parental guarantees outstanding to support storage optimization activities at Aitken Creek.
Off-Balance Sheet ArrangementsWith the exception of letters of credit outstanding of $114 million as at December 31, 2019 and the unrecorded commitments in the table above, the Corporation had no off-balance sheet arrangements.
Capital Structure and Credit RatingsFortis requires ongoing access to capital and, therefore, targets a consolidated long-term capital structure that will enable it to maintain investment-grade credit ratings. The regulated utilities maintain their own capital structures in line with those reflected in customer rates.
Consolidated Capital Structure (1) (%)
As at December 31 2019 2018
Debt (2) 53.1 57.0Preference shares 3.8 3.8Common shareholders’ equity and minority interest (3) 43.1 39.2
100.0 100.0
(1) Reflects the repayment of debt using proceeds from the disposition of the Waneta Expansion and the $1.2 billion common equity offering (see “Significant Items” on page 20)(2) Includes long-term debt and finance leases, including current portion, and short-term borrowings, net of cash(3) Includes minority interest of 3.7% as at December 31, 2019 (December 31, 2018 – 4.5%)
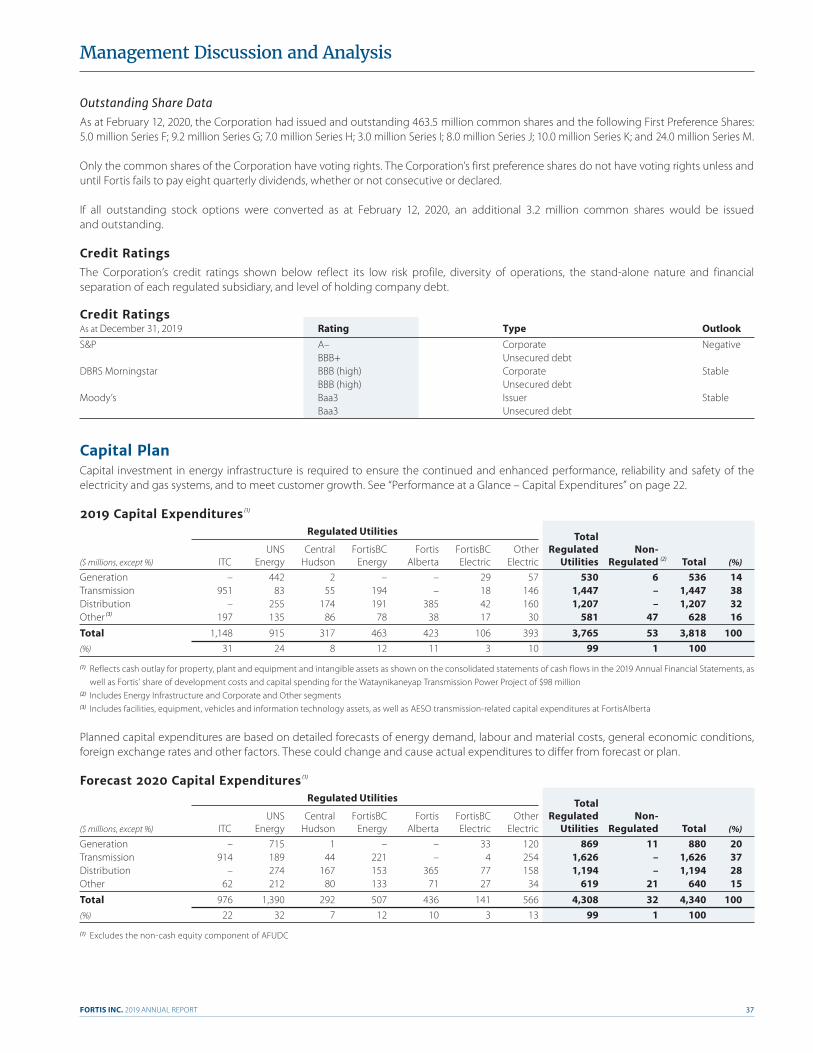
FORTIS INC. 2019 ANNUAL REPORT 37
Management Discussion and Analysis
Outstanding Share DataAs at February 12, 2020, the Corporation had issued and outstanding 463.5 million common shares and the following First Preference Shares: 5.0 million Series F; 9.2 million Series G; 7.0 million Series H; 3.0 million Series I; 8.0 million Series J; 10.0 million Series K; and 24.0 million Series M.
Only the common shares of the Corporation have voting rights. The Corporation’s first preference shares do not have voting rights unless and until Fortis fails to pay eight quarterly dividends, whether or not consecutive or declared.
If all outstanding stock options were converted as at February 12, 2020, an additional 3.2 million common shares would be issued and outstanding.
Credit RatingsThe Corporation’s credit ratings shown below reflect its low risk profile, diversity of operations, the stand-alone nature and financial separation of each regulated subsidiary, and level of holding company debt.
Credit Ratings As at December 31, 2019 Rating Type OutlookS&P A– Corporate Negative BBB+ Unsecured debt DBRS Morningstar BBB (high) Corporate Stable BBB (high) Unsecured debt Moody’s Baa3 Issuer Stable Baa3 Unsecured debt
Capital PlanCapital investment in energy infrastructure is required to ensure the continued and enhanced performance, reliability and safety of the electricity and gas systems, and to meet customer growth. See “Performance at a Glance – Capital Expenditures” on page 22.
2019 Capital Expenditures (1)
Regulated Utilities Total UNS Central FortisBC Fortis FortisBC Other Regulated Non- ($ millions, except %) ITC Energy Hudson Energy Alberta Electric Electric Utilities Regulated (2) Total (%)
Generation – 442 2 – – 29 57 530 6 536 14Transmission 951 83 55 194 – 18 146 1,447 – 1,447 38Distribution – 255 174 191 385 42 160 1,207 – 1,207 32Other (3) 197 135 86 78 38 17 30 581 47 628 16Total 1,148 915 317 463 423 106 393 3,765 53 3,818 100(%) 31 24 8 12 11 3 10 99 1 100
(1) Reflects cash outlay for property, plant and equipment and intangible assets as shown on the consolidated statements of cash flows in the 2019 Annual Financial Statements, as well as Fortis’ share of development costs and capital spending for the Wataynikaneyap Transmission Power Project of $98 million
(2) Includes Energy Infrastructure and Corporate and Other segments(3) Includes facilities, equipment, vehicles and information technology assets, as well as AESO transmission-related capital expenditures at FortisAlberta
Planned capital expenditures are based on detailed forecasts of energy demand, labour and material costs, general economic conditions, foreign exchange rates and other factors. These could change and cause actual expenditures to differ from forecast or plan.
Forecast 2020 Capital Expenditures (1)
Regulated Utilities Total UNS Central FortisBC Fortis FortisBC Other Regulated Non- ($ millions, except %) ITC Energy Hudson Energy Alberta Electric Electric Utilities Regulated Total (%)
Generation – 715 1 – – 33 120 869 11 880 20Transmission 914 189 44 221 – 4 254 1,626 – 1,626 37Distribution – 274 167 153 365 77 158 1,194 – 1,194 28Other 62 212 80 133 71 27 34 619 21 640 15Total 976 1,390 292 507 436 141 566 4,308 32 4,340 100(%) 22 32 7 12 10 3 13 99 1 100
(1) Excludes the non-cash equity component of AFUDC
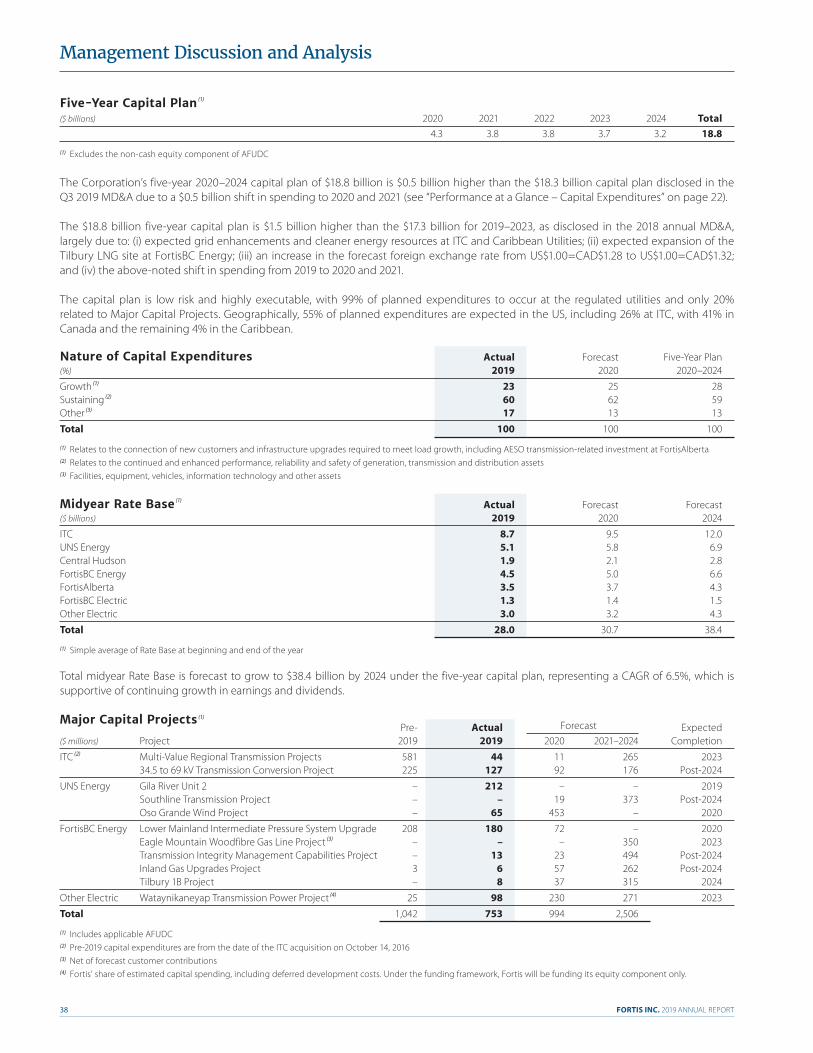
FORTIS INC. 2019 ANNUAL REPORT38
Management Discussion and Analysis
Five-Year Capital Plan (1)
($ billions) 2020 2021 2022 2023 2024 Total 4.3 3.8 3.8 3.7 3.2 18.8
(1) Excludes the non-cash equity component of AFUDC
The Corporation’s five-year 2020–2024 capital plan of $18.8 billion is $0.5 billion higher than the $18.3 billion capital plan disclosed in the Q3 2019 MD&A due to a $0.5 billion shift in spending to 2020 and 2021 (see “Performance at a Glance – Capital Expenditures” on page 22).
The $18.8 billion five-year capital plan is $1.5 billion higher than the $17.3 billion for 2019–2023, as disclosed in the 2018 annual MD&A, largely due to: (i) expected grid enhancements and cleaner energy resources at ITC and Caribbean Utilities; (ii) expected expansion of the Tilbury LNG site at FortisBC Energy; (iii) an increase in the forecast foreign exchange rate from US$1.00=CAD$1.28 to US$1.00=CAD$1.32; and (iv) the above-noted shift in spending from 2019 to 2020 and 2021.
The capital plan is low risk and highly executable, with 99% of planned expenditures to occur at the regulated utilities and only 20% related to Major Capital Projects. Geographically, 55% of planned expenditures are expected in the US, including 26% at ITC, with 41% in Canada and the remaining 4% in the Caribbean.
Nature of Capital Expenditures Actual Forecast Five-Year Plan (%) 2019 2020 2020–2024
Growth (1) 23 25 28Sustaining (2) 60 62 59Other (3) 17 13 13
Total 100 100 100
(1) Relates to the connection of new customers and infrastructure upgrades required to meet load growth, including AESO transmission-related investment at FortisAlberta(2) Relates to the continued and enhanced performance, reliability and safety of generation, transmission and distribution assets(3) Facilities, equipment, vehicles, information technology and other assets
Midyear Rate Base (1) Actual Forecast Forecast ($ billions) 2019 2020 2024
ITC 8.7 9.5 12.0UNS Energy 5.1 5.8 6.9Central Hudson 1.9 2.1 2.8FortisBC Energy 4.5 5.0 6.6FortisAlberta 3.5 3.7 4.3FortisBC Electric 1.3 1.4 1.5Other Electric 3.0 3.2 4.3
Total 28.0 30.7 38.4
(1) Simple average of Rate Base at beginning and end of the year
Total midyear Rate Base is forecast to grow to $38.4 billion by 2024 under the five-year capital plan, representing a CAGR of 6.5%, which is supportive of continuing growth in earnings and dividends.
Major Capital Projects (1)
Forecast Pre- Actual Expected($ millions) Project 2019 2019 2020 2021–2024 Completion
ITC (2) Multi-Value Regional Transmission Projects 581 44 11 265 2023 34.5 to 69 kV Transmission Conversion Project 225 127 92 176 Post-2024
UNS Energy Gila River Unit 2 – 212 – – 2019 Southline Transmission Project – – 19 373 Post-2024 Oso Grande Wind Project – 65 453 – 2020
FortisBC Energy Lower Mainland Intermediate Pressure System Upgrade 208 180 72 – 2020 Eagle Mountain Woodfibre Gas Line Project (3) – – – 350 2023 Transmission Integrity Management Capabilities Project – 13 23 494 Post-2024 Inland Gas Upgrades Project 3 6 57 262 Post-2024 Tilbury 1B Project – 8 37 315 2024
Other Electric Wataynikaneyap Transmission Power Project (4) 25 98 230 271 2023
Total 1,042 753 994 2,506
(1) Includes applicable AFUDC(2) Pre-2019 capital expenditures are from the date of the ITC acquisition on October 14, 2016(3) Net of forecast customer contributions(4) Fortis’ share of estimated capital spending, including deferred development costs. Under the funding framework, Fortis will be funding its equity component only.
FORTIS INC. 2019 ANNUAL REPORT 39
Management Discussion and Analysis
Multi-Value Regional Transmission ProjectsConsists of four regional electric transmission projects that have been identified by MISO to address system capacity needs and reliability in various states. Three projects have been completed, one in 2018 and two in 2019. The fourth project is expected to be placed in service in 2023.
34.5 to 69kV Transmission Conversion ProjectConsists of multiple capital initiatives designed to construct new 69-kV lines, and upgrade existing 34.5-kV lines to 69 kV, with in-service dates ranging from 2019 to post-2024.
Gila River Unit 2In 2017 UNS Energy entered into a 20-year tolling PPA that included a three-year option to purchase Gila River Unit 2. The purchase of Gila River Unit 2 was completed in December 2019 and replaces the early retirement of coal-fired generation.
Southline Transmission ProjectUNS Energy continues to evaluate the cost and timelines associated with the different phases of this project. The first phase, referred to as “Vail-to-Tortolita”, is a joint effort between Western Area Power Administration and TEP that will result in new construction and upgrades to connect existing TEP substations. Construction of this phase is expected to commence in 2020.
The second phase of the project relates to the construction of a 600-MW transmission line across southern New Mexico and southern Arizona. The line will improve regional reliability and facilitate the connection of renewable energy resources to the grid, including the Oso Grande Wind Project. UNS Energy expects to purchase a 250-MW ownership in the project. The timing, share and cost of this phase of the project will depend on subscription of the remaining wind available at Oso Grande.
Oso Grande Wind ProjectRelates to the construction of a 750-MW wind-powered electric generating facility that will complement UNS Energy’s existing renewable solar generation portfolio, of which UNS Energy will own 250 MW. Construction on Oso Grande commenced in the third quarter of 2019 and in January 2020 UNS Energy took ownership of its share under a build-transfer contract. Construction is expected to be completed for operation by December 2020.
Lower Mainland Intermediate Pressure System UpgradeAddresses system capacity and pipeline condition issues for the gas supply system in the Lower Mainland of British Columbia. The Burnaby and Coquitlam sections of the project were gasified during 2018 and 2019. A short pipeline segment in South Vancouver will be replaced in 2020. Final allowable project costs are subject to review by the BCUC.
Eagle Mountain Woodfibre Gas Line ProjectConsists of a pipeline expansion to a proposed LNG site in Squamish, British Columbia. Cost estimates are subject to final project scoping and determination of customer capital contributions. An Order in Council from the Government of British Columbia effectively exempts the project from further regulatory approval. FortisBC Energy and Woodfibre LNG Limited have entered into a pre-execution work agreement enabling FortisBC Energy to incur project feasibility and development costs.
Transmission Integrity Management Capabilities ProjectProject to improve gas line safety and transmission system integrity, including gas line modifications and looping. In December 2018 a regulatory deferral account was approved by the BCUC to capture approximately $40 million of development costs to be incurred through 2020 to enable the filing for a CPCN.
Inland Gas Upgrades ProjectRelates to gas line modifications and replacements to enable in-line integrity inspection capabilities. In January 2020 the CPCN application was approved by the BCUC.
Tilbury 1B ProjectConsists of construction of additional liquefaction and dispensing in support of optimizing the existing investment in Tilbury Phase 1A Expansion Project. The project has received an Order in Council from the Government of British Columbia. Pre-front-end engineering design and related studies will continue in 2020.
FORTIS INC. 2019 ANNUAL REPORT40
Management Discussion and Analysis
Wataynikaneyap Transmission Power ProjectConsists of the construction of a $1.6 billion, 1,800 kilometre, OEB-regulated transmission line to connect 17 remote First Nations communities in Northwestern Ontario to the main electricity grid. FortisOntario is responsible for construction management and operation of the transmission line. The initial phase to connect the Pikangikum First Nation was fully funded by the Canadian government and completed in late 2018. In the fourth quarter of 2019, the project received financial close and a notice to proceed for construction was issued. The project is targeted for completion by the end of 2023.
Additional Investment OpportunitiesFortis is pursuing additional investment opportunities within existing service territories that are not yet included in the base five-year capital plan.
ITC – Lake Erie ConnectorRelates to a proposed 1,000 MW, bi-directional, high-voltage direct current underwater transmission line to directly link the markets of the Ontario Independent Electricity System Operator and PJM Interconnection, LLC. The project would enable transmission customers to more efficiently access energy, capacity and renewable energy credit opportunities in both markets. The major application process is complete. The project continues to advance through regulatory, operational and economic milestones. Ongoing activities include completing project cost refinements and securing transmission service agreements. Completion would take approximately three years from the commencement of construction.
FortisBC Energy – LNGRelates to FortisBC’s pursuit of additional LNG infrastructure opportunities in British Columbia, including further expansion of the Tilbury LNG facility, which is uniquely positioned to meet customer demand for clean-burning natural gas. The site is scalable and can accommodate additional storage and liquefaction equipment and is relatively close to international shipping lanes. Fortis continues to have discussions with potential export customers.
Other OpportunitiesIncludes incremental regulated transmission investment, contracted transmission and grid modernization projects at ITC; renewable energy investments, energy storage projects, grid modernization, infrastructure resiliency, and transmission investments at UNS Energy; and further gas infrastructure opportunities at FortisBC Energy.
BUSINESS RISKSFortis has established an ERM process to help identify and evaluate risks by both severity of impact and probability of occurrence. Materiality thresholds are reviewed and, if necessary, updated annually. Non-financial risks that may impact the safety of employees, customers or the general public, as well as reputational risks, are also evaluated. Systems of internal controls are established to monitor and manage identified risks. The ERM process at the subsidiary level is overseen by each subsidiary’s board and any material risks identified are communicated to Fortis management and form part of Fortis’ ERM program. The Fortis board, through the audit committee, oversees Fortis’ ERM program, ensuring strategic objectives are achieved.
A summary of the Corporation’s current significant business risks follows.
RegulationRegulated utility assets represented approximately 99% of the Corporation’s total assets as at December 31, 2019. Regulatory jurisdictions include five Canadian provinces, nine US states and three Caribbean countries, as well as FERC regulation for transmission assets in the US.
Regulators administer legislation covering material aspects of the utilities’ business, including: customer rates and the underlying allowed ROEs and deemed capital structures; capital expenditures; the terms and conditions for the provision of energy and capacity, ancillary services and affiliate services; securities issuances; and certain accounting matters. Regulatory or legislative changes and decisions, and delays in the recovery of costs in rates due to regulatory lag, could have a Material Adverse Effect. The risk of regulatory lag is particularly significant for UNS Energy given the use of historical test years in setting rates.
FORTIS INC. 2019 ANNUAL REPORT 41
Management Discussion and Analysis
The ability to recover the actual cost of service and earn the approved ROE or ROA typically depends on achieving the forecasts established in the rate-setting process. Failure to do so could have a Material Adverse Effect. For those utilities subject to PBR mechanisms, rates reflect assumed inflation rates and productivity improvement factors, and variances therefrom could have a Material Adverse Effect. Under FortisAlberta’s PBR mechanism there is an added risk that incremental incurred capital expenditures may not be approved for recovery in rates.
For transmission operations, the underlying elements of FERC-established formula rates can be, and have been, challenged by third parties which could result in, and has resulted in, lowered rates and customer refunds. These underlying elements include the assumed ROE and deemed capital structure as well as operating and capital expenditures. These challenges could have a Material Adverse Effect. Recent challenges are described under “Regulatory Highlights – ITC” on page 30.
Additionally, the US Congress periodically considers enacting energy legislation that could assign new responsibilities to FERC, modify provisions of the U.S. Federal Power Act or the Natural Gas Act, or provide FERC or another entity with increased authority to regulate US federal energy matters. Such changes could have a Material Adverse Effect.
The political and economic environments as well as their effect on energy laws and governmental energy policies have had, and may continue to have, negative impacts on regulatory decisions. While Fortis is well positioned to maintain constructive regulatory relationships through local management teams and boards comprised mostly of independent local members, it cannot predict future legislative or regulatory changes, whether caused by economic, political or other factors, or its ability to respond thereto in an effective and timely manner, or resulting compliance costs. These dynamics could have a Material Adverse Effect.
Climate Change and Physical RisksThe provision of electric and gas service is subject to customary industry risks, including severe weather and natural disasters, wars, terrorism, critical equipment failure and other catastrophic events within and outside the Corporation’s service territories. Resultant service disruption and repair and replacement costs could have a Material Adverse Effect if not resolved in a timely and effective manner and/or mitigated through insurance policies or regulatory cost recovery.
Climate change is predicted to lead to more frequent and intense weather events, changing air temperatures, changing seasonal variations, and regulatory responses (see “Environmental Matters” on page 46), each of which could have a Material Adverse Effect. Severe weather impacts the Corporation’s service territories, primarily when thunderstorms, flooding, wildfires, hurricanes and snow or ice storms occur. Increased frequency of extreme weather events could increase the cost of providing service. Changes in precipitation that result in droughts could increase the risk of wildfire caused by the Corporation’s electricity assets or may cause water shortages that could adversely affect operations. Extreme weather conditions in general require system backup and can contribute to increased system stress, including service interruptions. Changing air temperatures could also result in system stress and decreased efficiencies over time to operating facilities. Longer-term climate change impacts, such as sustained higher temperatures, higher sea levels and larger storm surges, could result in service disruption, repair and replacement costs, and costs associated with strengthened design standards and systems, each of which could have a Material Adverse Effect if not resolved in a timely and effective manner and/or mitigated through insurance policies or regulatory cost recovery.
Generating equipment and facilities are subject to risks, including equipment breakdown and flood and fire damage, that may result in the uncontrolled release of water, interruption of fuel supply, lower-than-expected operational efficiency or performance, and service disruption. There is no assurance that generating equipment and facilities will continue to operate in accordance with expectations.
The operation of transmission and distribution assets is subject to risks, including the potential to cause fires, mainly as a result of equipment failure, falling trees and lightning strikes to lines or equipment. Certain utilities operate in remote and mountainous terrain that can be difficult to access for timely repairs and maintenance, or otherwise face risk of loss or damage from forest fires, floods, washouts, landslides, earthquakes, avalanches and other acts of nature with a potential Material Adverse Effect.
The gas utilities are exposed to operational risks associated with natural gas, including fires, explosions, pipeline corrosion and leaks, accidental damage to mains and service lines, equipment failure, damage and destruction from earthquakes, fires, floods and other natural disasters, and other accidents and issues that can lead to service disruption, spills and commensurate environmental liability, or other liability with a Material Adverse Effect.

FORTIS INC. 2019 ANNUAL REPORT42
Management Discussion and Analysis
Risks associated with fire damage vary depending on weather, forestation, the proximity of habitation and third-party facilities to utility facilities, and other factors. The utilities may become liable for fire-suppression costs, regeneration and timber value costs, and third-party claims if their facilities are held responsible for a fire, and such claims, if successful, could have a Material Adverse Effect.
Electricity and gas systems require ongoing maintenance, improvement and replacement. Service disruption, other effects and liability caused by the failure to properly implement or complete approved maintenance and capital expenditures, or the occurrence of significant unforeseen equipment failures despite maintenance programs, or the inability to recover requisite costs in customer rates, could have a Material Adverse Effect.
The electricity and gas systems are designed to service customers under various contingencies in accordance with good utility practice. The utilities are responsible for operating and maintaining their assets in a safe manner, including the development and application of appropriate standards, system processes and/or procedures to ensure the safety of employees, contractors and the general public. The impacts of climate change may necessitate the acceleration of these standards, processes and procedures. Failure to do so may disrupt the ability of the utilities to safely provide service, which could cause reputational harm and other impacts with a Material Adverse Effect.
Interest RatesThe market price of the Corporation’s common shares is inversely sensitive to interest rate changes.
Additionally, allowed ROEs are exposed to changes in long-term interest rates. A low interest rate environment could reduce allowed ROEs. Alternatively, if interest rates rise, regulatory lag may cause delays in any compensatory ROE increases. Borrowings under variable-rate credit facilities and long-term debt, as well as new debt issuances, are also exposed to interest rate changes.
Weather Variability and SeasonalityElectricity consumption varies significantly in response to climate change and seasonal weather changes. In central and western Canada, Arizona and New York State, cool summers may reduce the use of air conditioning and other cooling equipment, while less severe winters may reduce heating load. Alternatively, severe weather could unexpectedly increase heating and cooling loads, negatively impacting system reliability.
Weather and seasonality have a significant impact on gas distribution volumes as a major portion of the gas is used for space heating by residential customers. The earnings of the Corporation’s gas utilities and Aitken Creek are typically highest in the first and fourth quarters.
Hydroelectric generation is sensitive to rainfall levels.
Regulatory deferral and revenue decoupling mechanisms are in place at certain of the Corporation’s utilities to minimize the volatility in earnings that would otherwise be caused by variations in weather conditions. Both the discontinuance of key regulatory mechanisms and their absence at other Fortis entities could result in significant and prolonged weather variations from seasonal norms having a Material Adverse Effect.
GrowthFortis has a history of growth through acquisitions and organic growth from capital expenditures in existing service territories. Acquisitions include inherent risks that some or all of the expected benefits may fail to materialize, or may not occur within the time periods anticipated, and material unexpected costs may arise.
The Corporation’s dividend growth guidance is significantly dependent upon achieving the Rate Base growth expected from the execution of the five-year capital plan described under “Capital Plan” on page 37. Projects, particularly Major Capital Projects, are subject to risks of delay and cost overruns during construction caused by inflation, supply and labour costs, supplier non-performance, weather, geologic conditions or other factors beyond the Corporation’s control. There is no assurance that regulators will approve (i) all of the planned projects or their amounts or timing, (ii) permits in a timely manner, or with reasonable terms and conditions, or (iii) the recovery of overruns in customer rates. These risks could impact the successful execution of a project by preventing the project from proceeding, delaying its completion, increasing its projected costs or negatively impacting its financing.
FORTIS INC. 2019 ANNUAL REPORT 43
Management Discussion and Analysis
Talent ManagementThe delivery of safe, reliable and cost-effective service depends on the attraction, development and retention of skilled workforces. Like its peers, Fortis faces demographic challenges and competitive markets relating to trades, technical and professional staff, particularly considering its significant consolidated capital plan. ITC relies heavily on agreements with third parties to provide services for the construction, maintenance and operation of certain aspects of its business. Although Fortis has a robust talent management program, there is no assurance it will be able to continue to attract sufficient and appropriate talent. Significant failures in these regards could have a Material Adverse Effect.
Tax LawsFortis and its subsidiaries are subject to changes in income tax rates and other tax legislation in Canada, the US and other international jurisdictions. These changes could have a Material Adverse Effect. Although income taxes at the regulated utilities are generally recovered in customer rates, regulatory lag can result in recovery delays or non-recovery for certain periods. A variety of other impacts are also possible. At the non-regulated level, changes in income tax rates and other tax legislation could materially affect the after-tax cost of existing and future debt which is not recoverable in customer rates.
The nature, timing or impact of any future changes in tax laws cannot be predicted. Additionally, certain aspects of US tax reform are still subject to interpretation and clarification, including proposed regulations regarding certain hybrid arrangements.
CybersecurityAs operators of critical energy infrastructure, the Corporation’s utilities face the risk of cybercrime, which has increased in frequency, scope and potential impact in recent years. Their ability to operate effectively is dependent upon developing and maintaining complex information systems and infrastructure that support the operation of electric generation, transmission and distribution facilities, including gas facilities; provide customers with billing, consumption and load settlement information, where applicable; and support financial and general operations.
Despite risk-based cybersecurity programs that have been implemented and are continuously monitored for effectiveness, information and operations technology systems may be vulnerable to unauthorized access due to hacking, viruses, acts of war or terrorism, acts of vandalism and other causes. This can result in the disruption of energy service and other business operations, system failures and grid disturbances, property damage, corruption or unavailability of critical data, and the misappropriation and/or disclosure of sensitive, confidential and proprietary business, customer and employee information.
A material breach could adversely affect the financial performance of the Corporation, its reputation and standing with customers, regulators and financial markets, and expose it to claims for third-party damage. The resultant financial impacts may not be fully covered by insurance policies or, in the case of utilities, through regulatory cost recovery, and could have a Material Adverse Effect.
Technology AdvancesThe emergence of initiatives designed to reduce GHG emissions and control or limit the effects of climate change has increased the incentive for the development of new technologies that produce power, enable more efficient storage of energy or reduce power consumption.
New technology developments in distributed generation, particularly solar, and energy efficiency products and services, as well as the implementation of renewable energy and energy efficiency standards, will continue to impact retail sales. Heightened awareness of energy costs and environmental concerns have increased demand for products that reduce energy consumption. The Corporation’s utilities are also promoting demand-side management programs.
New technologies include energy derived from renewable sources, customer-owned generation, energy-efficient appliances, battery storage and control systems. Advances in these or other technologies could have a significant impact on retail sales with a potential Material Adverse Effect.
FORTIS INC. 2019 ANNUAL REPORT44
Management Discussion and Analysis
Foreign Exchange ExposureThe reporting currency of ITC, UNS Energy, Central Hudson, Caribbean Utilities, FortisTCI, BECOL and Belize Electricity is, or is pegged to, the US dollar. The earnings and cash flows from, and net investments in, these entities are exposed to fluctuations in the US dollar-to-Canadian dollar exchange rate.
Fortis has limited this exposure through hedging. As at December 31, 2019, US$2.2 billion (December 31, 2018 – US$3.4 billion) of corporately issued US dollar-denominated long-term debt had been designated as an effective hedge of foreign net investments, leaving US$9.7 billion (December 31, 2018 – US$8.0 billion) in foreign net investments unhedged. Fortis has also entered into foreign exchange contracts to manage a portion of its exposure to foreign currency risk.
Given only partial hedging, consolidated earnings and cash flows continue to be impacted by exchange rate fluctuations. On average, Fortis estimates that a five-cent increase or decrease in the US dollar relative to the Canadian dollar exchange rate of US$1.00=CAD$1.33 as at December 31, 2019 would increase or decrease annual EPS by approximately six cents, which reflects the Corporation’s hedging program.
There is no assurance that existing hedging strategies will continue to be effective. They could also have the effect of limiting or reducing the Corporation’s total returns if management’s expectations concerning future events or market conditions prove to be incorrect, in which case the costs associated with the hedging strategies may outweigh their benefits.
Natural Gas CompetitivenessApproximately 19% of the Corporation’s revenue is derived from natural gas. A decrease in the competitiveness of natural gas due to pricing or other factors could have a Material Adverse Effect.
In British Columbia, which accounts for 79% of the Corporation’s natural gas revenue, natural gas primarily competes with electricity for space and hot water heating. Upfront capital costs for gas service continue to present competitive challenges for natural gas compared to electricity service. If gas becomes less competitive, the ability to add new customers could be impaired. Existing customers could also reduce their consumption or switch to electricity, placing further pressure on rates, whereby system costs must be recovered from a smaller customer and sales base, and leading to further reductions in competitiveness.
Government policy could also impact the competitiveness of natural gas in British Columbia. The provincial government has introduced changes to energy policy, including GHG emission reduction targets and a consumption tax on carbon-based fuels, but has not yet introduced a carbon tax on imported electricity generated through the combustion of carbon-based fuels. The impact of these changes to energy policy may have a material impact on the competitiveness of natural gas relative to non-carbon based energy sources or other energy sources.
In addition, all levels of government have become more active in the development of policies to address climate change. For example, municipal governments have developed policies and bylaws to support the transition to a lower-carbon economy. Government policy may put upward pressure on the cost of natural gas and potentially affect its competitiveness. Government policy may also impose limitations on energy sources permitted to be used in new and existing developments.
Reliability StandardsThe Energy Policy Act requires owners, operators and users of the bulk electric system in the US to meet mandatory reliability standards developed by the North American Electric Reliability Corporation and its regional entities, which are approved and enforced by FERC. Many of these, or similar, standards have been adopted in certain Canadian provinces including British Columbia, Alberta and Ontario. The failure to develop, implement and maintain appropriate operating practices/systems and capital plans to address reliability obligations could lead to compliance violations and a Material Adverse Effect, such as the exclusion from customer rates of related costs including potentially significant penalties.
General Economic ConditionsFluctuations in general economic conditions, energy prices, employment levels, personal disposable incomes, housing starts, industrial activity and other factors may lower energy demand and reduce sales both directly and through reduced capital spending, particularly that related to new customer growth, which would affect Rate Base growth. A severe and prolonged economic downturn could have a Material Adverse Effect despite compensatory regulatory measures, including making it more difficult for customers to pay their bills.

FORTIS INC. 2019 ANNUAL REPORT 45
Management Discussion and Analysis
Access to CapitalOngoing access to cost-effective capital is required to fund, among other things, capital expenditures and the repayment of maturing debt.
Operating Cash Flows may not be sufficient to fund the repayment of all outstanding liabilities when due or anticipated capital expenditures. The ability to meet long-term debt repayments is dependent upon obtaining sufficient and cost-effective financing to replace maturing indebtedness.
The ability to arrange such financing is subject to numerous factors, including the results of operations and financial condition of Fortis and its subsidiaries, the regulatory environments including regulatory decisions regarding capital structure and allowed ROEs, capital market conditions, general economic conditions and credit ratings. Changes in credit ratings could affect credit risk spreads on new long-term debt and credit facilities, as well as their availability.
There is no assurance that sufficient capital will continue to be available on acceptable terms. For further information see “Liquidity and Capital Resources” on page 33.
Commodity Price VolatilityPurchased power and generation fuel costs are subject to commodity price volatility, which is managed through regulator-approved: (i) mechanisms that permit the flow through in customer rates of commodity price changes and/or that provide for rate-stabilization and other deferral accounts (see “Business Unit Performance” on page 25); and (ii) price-risk management strategies such as the use of derivative contracts that effectively fix costs (see “Financial Instruments – Derivatives” on page 52).
There is no assurance that current regulator-approved mechanisms will continue to exist in the future. Additionally, despite these mechanisms, severe and prolonged commodity price increases could result in rates that customers are unable to pay and/or could affect consumption and thus sales growth. These could have a Material Adverse Effect.
Counterparty Credit RiskITC has a concentration of credit risk as approximately 70% of its revenue is derived from three customers. These customers have investment-grade credit ratings and credit risk is further managed by requiring a letter of credit or cash deposit equal to the credit exposure, which is determined by a credit-scoring model and other factors.
FortisAlberta has a concentration of credit risk as its distribution service billings are to a relatively small group of retailers. Credit risk is managed by obtaining from the retailers either a cash deposit, letter of credit, an investment-grade credit rating, or a financial guarantee from an entity with an investment-grade credit rating.
UNS Energy, Central Hudson, FortisBC Energy, Aitken Creek and Fortis may be exposed to credit risk from non-performance by counterparties to derivatives. Credit risk is managed by net settling payments, when possible, and dealing only with counterparties that have investment-grade credit ratings. At UNS Energy and Central Hudson, certain contractual arrangements require counterparties to post collateral.
There is no assurance that management strategies will continue to be effective. Significant counterparty defaults could have a Material Adverse Effect.
Purchased Power SupplyA significant portion of electricity and gas sold by the Corporation’s utilities is purchased through the wholesale energy markets or pursuant to contracts with energy suppliers rather than being generated. A disruption in the wholesale energy markets, or a failure on the part of energy or fuel suppliers or operators of energy delivery systems that connect to the Corporation’s utilities, could have a Material Adverse Effect.
FORTIS INC. 2019 ANNUAL REPORT46
Management Discussion and Analysis
Post-Retirement ObligationsFortis and most of its subsidiaries maintain a combination of defined benefit pension and/or OPEB plans for certain employees and retirees. The most significant cost drivers for these plans are investment performance and interest rates, which are affected by global financial markets. Market disruptions, significant declines in the market values of investments held to meet plan obligations, discount rate changes, participant demographics, and changes in laws and regulations may require additional plan funding. Significant increases in plan expenses and funding could have a Material Adverse Effect.
Joint-Ownership Interests and Third-Party OperatorsCertain generating facilities from which TEP receives power are jointly owned with, or are operated by, third parties. TEP may not have sole discretion or any ability to affect the management or operations of such facilities, including how to best address changing economic conditions or environmental requirements that may affect the facilities. A divergence in the interests of TEP and those of the joint owners or operators could have a Material Adverse Effect.
Wataynikaneyap Partnership is a partnership, owned 51% by 24 First Nations communities and 49% by a partnership between Fortis (80%) and Algonquin Power & Utilities Corp. (20%), responsible for the Wataynikaneyap Transmission Power Project. Fortis does not have sole discretion on decisions for the project and divergence in the interest of Fortis and the other partners could delay the project’s completion, increase its anticipated cost, or adversely affect the reputation of Fortis.
Environmental MattersThe Corporation’s businesses are subject to environmental risks and environmental laws and regulations, including those which: (i) impose limitations or restrictions on the discharge of pollutants into the air, soil and water; (ii) establish standards for the management, treatment, storage, transportation and disposal of hazardous wastes; and/or (iii) impose obligations to investigate and remediate contamination.
The risk of contamination of air, soil and water at the electric businesses primarily relates to: (i) the transportation, handling, storage and combustion of fuel; (ii) the use of petroleum-based products, mainly transformer and lubricating oil; (iii) the management and disposal of coal combustion residuals and other wastes; and (iv) accidents resulting in hazardous release at or from coal mines that supply generating facilities. Contamination risks at the gas businesses primarily relate to gas and propane leaks and other accidents involving these substances. The key environmental risks for hydroelectric generation operations include the creation of artificial water flows that may disrupt natural habitats and dam failures.
Liabilities relating to contamination investigation and remediation, and claims for personal injury or property damage, may arise at many locations, including formerly and currently owned/operated properties and waste treatment or disposal sites, and regardless of whether such contamination was caused by the business at the time it owned the property or whether it resulted from non-compliance with applicable environmental laws. Under some environmental laws, such liabilities may be joint and several, meaning that a party can be held responsible for more than its share of the liability involved or even the entire liability. These liabilities could lead to litigation and administrative proceedings that could result in substantial monetary judgments for clean-up costs, damages, fines and/or penalties. To the extent not fully covered by insurance, these costs could have a Material Adverse Effect.
The Corporation’s businesses have incurred substantial expenses for environmental compliance, and they anticipate continuing to do so in the future. In particular, the management of GHG emissions is a major concern due to new and emerging federal, state and provincial GHG laws, regulations and guidelines.
The Corporation’s businesses continue to develop compliance strategies and assess the impact of emerging legislative changes, but significant uncertainties remain. Increased compliance costs or additional operating restrictions from revised or additional regulation could have a Material Adverse Effect.
Some coal-fired generation facilities utilized by UNS Energy have closed before the end of their useful lives due to economic conditions and/or recent or expected changes in environmental regulations, including those relating to GHG emissions. Early closures have necessitated regulatory relief to recover any remaining net book values and decommissioning costs, and potential accelerated depreciation could cause rate pressure. Significant unrecovered costs or rate pressures could have a Material Adverse Effect.
FORTIS INC. 2019 ANNUAL REPORT 47
Management Discussion and Analysis
InsuranceInsurance is maintained with reputable industry insurers for property damage, potential liabilities and business interruption for coverage considered appropriate and in accordance with industry practice.
A significant portion of transmission and distribution assets is uninsured, as is customary in North America, as the cost is prohibitive. Insurance is subject to coverage limits and deductibles as well as time-sensitive claims discovery and reporting provisions. There is no assurance that: (i) the amounts and types of actual damage, liabilities or business interruption will be fully covered; (ii) regulatory relief would be obtained for coverage shortfalls; (iii) adequate insurance at reasonable rates will continue to be available; or (iv) insurers will fulfill their obligations. Significant actual shortfalls could have a Material Adverse Effect.
Required ApprovalsThe acquisition, ownership and operation of electric and gas businesses require numerous licences, permits, agreements, orders, certificates and other approvals from various levels of government, regulators, government agencies and/or third parties. There is no assurance that: (i) all of these will be obtained, continuously maintained or renewed without delay; and (ii) the terms and conditions thereof will be fully complied with at all times and will not change in a material adverse manner. Significant failures in these regards could prevent the operation of the businesses and have a Material Adverse Effect.
Reputation, Relationships and Stakeholder ActivismThe Corporation’s operations and growth prospects require strong relationships with key stakeholders, including governments and agencies, Indigenous communities, landowners, and environmental organizations. Inadequately managing expectations and issues important to stakeholders, including those arising during construction, could affect the Corporation’s reputation as well as have a significant impact on its operations and infrastructure development.
Additionally, external stakeholders are increasingly challenging utilities regarding climate change, sustainability, diversity, returns including ROEs, executive compensation and other matters. Public opposition to larger infrastructure projects is becoming increasingly common, which can challenge capital plans and resultant organic growth. While the Corporation actively monitors such activism and is committed to developing stronger relationships with its external stakeholders, failure to effectively maintain or respond to stakeholder activism could have a Material Adverse Effect.
Indigenous Peoples’ Land ClaimsThe Corporation’s British Columbia utilities provide service to customers on Indigenous Peoples’ lands and maintain facilities on lands that are subject to Indigenous Peoples’ land claims. A treaty negotiation process involving Indigenous Peoples and the Governments of British Columbia and Canada is underway, but the basis for potential settlements is unclear and not all Indigenous Peoples are participating in the process. To date, the policy of the Government of British Columbia has been to structure settlements without prejudicing existing third-party rights. However, there is no assurance that the settlement process will not have a Material Adverse Effect.
FortisAlberta has distribution assets on Indigenous Peoples’ lands in Alberta with access permits held by TransAlta Utilities Corporation. To acquire these permits, FortisAlberta requires approval from First Nations and Crown-Indigenous Relations and Northern Affairs Canada. FortisAlberta may be unable to obtain such approvals or negotiate land-use agreements with reasonable terms. Significant failures in these regards could have a Material Adverse Effect.
Labour RelationsMost of the Corporation’s utilities employ members of labour unions or associations under collective bargaining agreements. Fortis considers its labour relationships to be satisfactory but there is no assurance that this will continue or that existing collective bargaining agreements will be renewed on reasonable terms without work disruption or other job action. Significant failures in these regards could cause service interruptions and/or labour cost increases for which the regulator disallows full recovery in rates, and could have a Material Adverse Effect.
Legal, Administrative and Other ProceedingsThese proceedings arise in the ordinary course of business and may include environmental claims, employment-related claims, securities-based litigation, contractual disputes, personal injury or property damage claims, actions by regulatory or tax authorities, and other matters. Unfavourable outcomes such as judgments or settlements for monetary or other damages, injunctions, denial or revocation of permits, reputational harm, and other results could have a Material Adverse Effect.
FORTIS INC. 2019 ANNUAL REPORT48
Management Discussion and Analysis
ACCOUNTING MATTERSNew Accounting PoliciesLeasesEffective January 1, 2019, the Corporation adopted ASU No. 2016-02, Leases, that requires lessees to recognize a right-of-use asset and lease liability for all leases with a lease term greater than 12 months, along with additional disclosures.
At lease inception, the right-of-use asset and liability are both measured at the present value of future lease payments, excluding variable payments that are based on usage or performance. Future lease payments include both lease components (e.g., rent, real estate taxes and insurance costs) and non-lease components (e.g., common area maintenance costs), which Fortis accounts for as a single lease component. The present value is calculated using the rate implicit in the lease or a lease-specific secured interest rate based on the remaining lease term. Renewal options are included in the lease term when it is reasonably certain that the option will be exercised.
Finance leases are depreciated over the lease term, except where: (i) ownership of the asset is transferred at the end of the lease term, in which case depreciation is over the estimated service life of the underlying asset; and (ii) the regulator has approved a different recovery methodology for rate-setting purposes, in which case the timing of the expense recognition will conform to the regulator’s requirements.
Fortis applied the transition provisions of the new standard as of the adoption date and did not retrospectively adjust prior periods in accordance with the modified retrospective approach. Fortis elected a package of implementation options, referred to as practical expedients, that allowed it to not reassess: (i) whether existing contracts, including land easements, are or contain a lease; (ii) the classification of existing leases; or (iii) the initial direct costs for existing leases. Fortis also utilized the hindsight practical expedient to determine the lease term. Upon adoption, Fortis did not identify or record an adjustment to the opening balance of retained earnings, and there was no impact on net earnings or cash flows.
HedgingEffective January 1, 2019, the Corporation adopted ASU No. 2017-12, Targeted Improvements to Accounting for Hedging Activities, which better aligns risk management activities and financial reporting for hedging relationships through changes to designation, measurement, presentation and disclosure guidance. Adoption did not have a material impact on the 2019 Annual Financial Statements.
Fair Value Measurement DisclosuresEffective January 1, 2019, the Corporation adopted ASU No. 2018-13, Changes to the Disclosure Requirements for Fair Value Measurement, which improves the effectiveness of financial statement note disclosures by clarifying what is required and important to users of the financial statements. The adoption of this ASU removed the following disclosures for all periods presented: (i) the amount of, and reasons for, transfers between level 1 and level 2 of the fair value hierarchy; (ii) the policy for the timing of transfers between levels; and (iii) the valuation processes for level 3 fair value measurements.
Pensions and Other Post-Retirement Plan DisclosuresEffective December 31, 2019, the Corporation early adopted, on a retrospective basis, ASU No. 2018-14, Changes to the Disclosure Requirements for Defined Benefit Plans, which modifies the disclosure requirements for employers with defined pension or other post-retirement plans and clarifies disclosure requirements. In particular, it removed the following disclosures: (i) the amounts in accumulated other comprehensive income expected to be recognized as components of net period benefit costs over the next fiscal period; and (ii) the effects of a one-percentage-point change on the assumed health care costs and the change in rates on service cost, interest cost and the benefit obligation for post-retirement health care benefits.
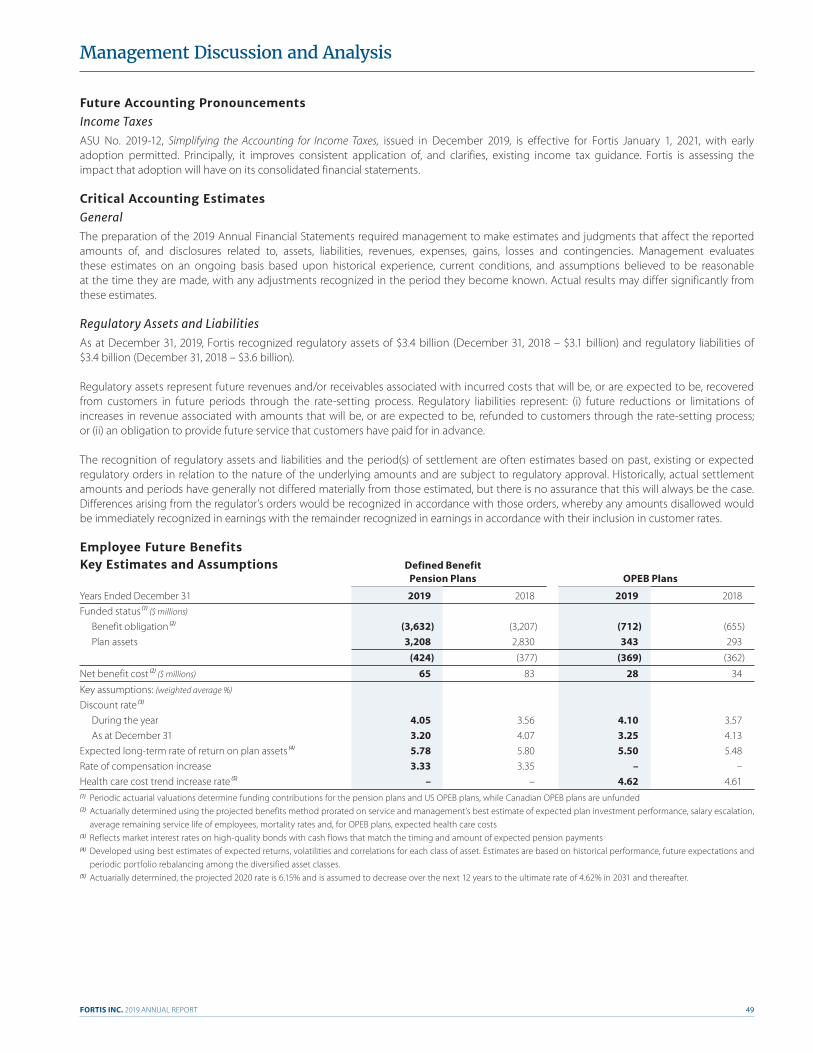
FORTIS INC. 2019 ANNUAL REPORT 49
Management Discussion and Analysis
Future Accounting PronouncementsIncome TaxesASU No. 2019-12, Simplifying the Accounting for Income Taxes, issued in December 2019, is effective for Fortis January 1, 2021, with early adoption permitted. Principally, it improves consistent application of, and clarifies, existing income tax guidance. Fortis is assessing the impact that adoption will have on its consolidated financial statements.
Critical Accounting EstimatesGeneralThe preparation of the 2019 Annual Financial Statements required management to make estimates and judgments that affect the reported amounts of, and disclosures related to, assets, liabilities, revenues, expenses, gains, losses and contingencies. Management evaluates these estimates on an ongoing basis based upon historical experience, current conditions, and assumptions believed to be reasonable at the time they are made, with any adjustments recognized in the period they become known. Actual results may differ significantly from these estimates.
Regulatory Assets and LiabilitiesAs at December 31, 2019, Fortis recognized regulatory assets of $3.4 billion (December 31, 2018 – $3.1 billion) and regulatory liabilities of $3.4 billion (December 31, 2018 – $3.6 billion).
Regulatory assets represent future revenues and/or receivables associated with incurred costs that will be, or are expected to be, recovered from customers in future periods through the rate-setting process. Regulatory liabilities represent: (i) future reductions or limitations of increases in revenue associated with amounts that will be, or are expected to be, refunded to customers through the rate-setting process; or (ii) an obligation to provide future service that customers have paid for in advance.
The recognition of regulatory assets and liabilities and the period(s) of settlement are often estimates based on past, existing or expected regulatory orders in relation to the nature of the underlying amounts and are subject to regulatory approval. Historically, actual settlement amounts and periods have generally not differed materially from those estimated, but there is no assurance that this will always be the case. Differences arising from the regulator’s orders would be recognized in accordance with those orders, whereby any amounts disallowed would be immediately recognized in earnings with the remainder recognized in earnings in accordance with their inclusion in customer rates.
Employee Future BenefitsKey Estimates and Assumptions Defined Benefit Pension Plans OPEB Plans
Years Ended December 31 2019 2018 2019 2018
Funded status (1) ($ millions)
Benefit obligation (2) (3,632) (3,207) (712) (655) Plan assets 3,208 2,830 343 293
(424) (377) (369) (362)
Net benefit cost (2) ($ millions) 65 83 28 34
Key assumptions: (weighted average %)
Discount rate (3)
During the year 4.05 3.56 4.10 3.57 As at December 31 3.20 4.07 3.25 4.13Expected long-term rate of return on plan assets (4) 5.78 5.80 5.50 5.48Rate of compensation increase 3.33 3.35 – –Health care cost trend increase rate (5) – – 4.62 4.61(1) Periodic actuarial valuations determine funding contributions for the pension plans and US OPEB plans, while Canadian OPEB plans are unfunded(2) Actuarially determined using the projected benefits method prorated on service and management’s best estimate of expected plan investment performance, salary escalation,
average remaining service life of employees, mortality rates and, for OPEB plans, expected health care costs(3) Reflects market interest rates on high-quality bonds with cash flows that match the timing and amount of expected pension payments(4) Developed using best estimates of expected returns, volatilities and correlations for each class of asset. Estimates are based on historical performance, future expectations and
periodic portfolio rebalancing among the diversified asset classes.(5) Actuarially determined, the projected 2020 rate is 6.15% and is assumed to decrease over the next 12 years to the ultimate rate of 4.62% in 2031 and thereafter.
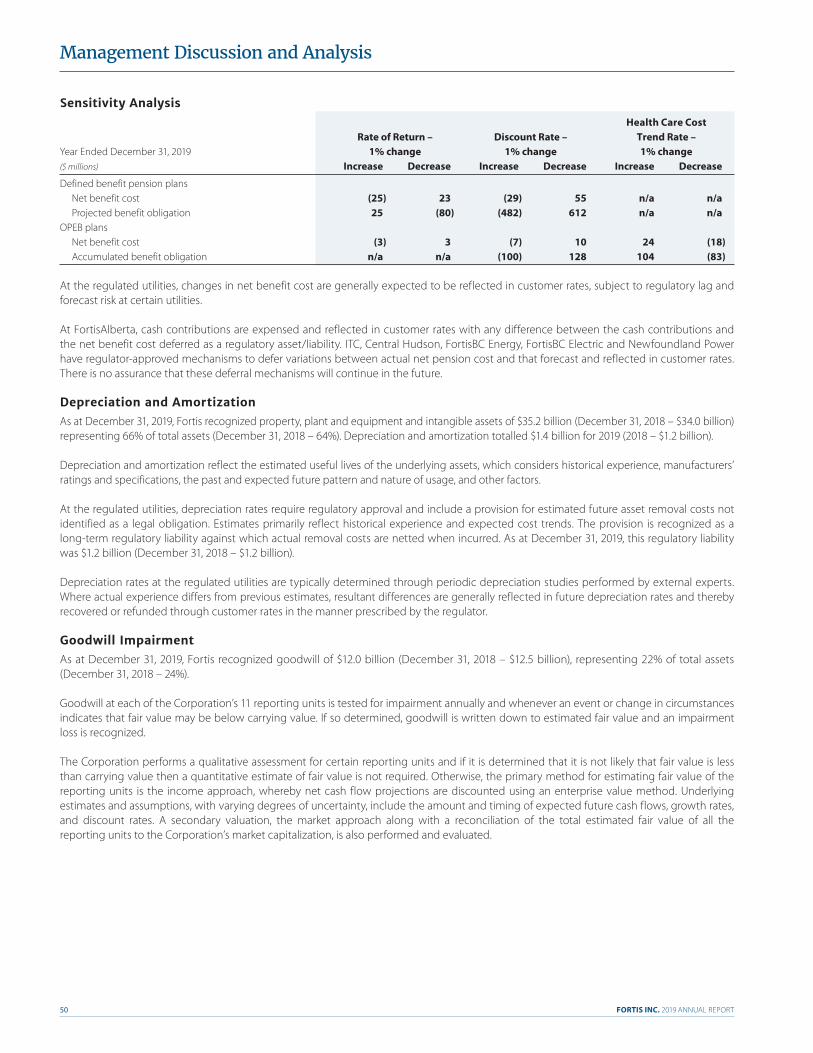
FORTIS INC. 2019 ANNUAL REPORT50
Management Discussion and Analysis
Sensitivity Analysis Health Care Cost Rate of Return – Discount Rate – Trend Rate – Year Ended December 31, 2019 1% change 1% change 1% change($ millions) Increase Decrease Increase Decrease Increase Decrease
Defined benefit pension plans Net benefit cost (25) 23 (29) 55 n/a n/a Projected benefit obligation 25 (80) (482) 612 n/a n/aOPEB plans Net benefit cost (3) 3 (7) 10 24 (18) Accumulated benefit obligation n/a n/a (100) 128 104 (83)
At the regulated utilities, changes in net benefit cost are generally expected to be reflected in customer rates, subject to regulatory lag and forecast risk at certain utilities.
At FortisAlberta, cash contributions are expensed and reflected in customer rates with any difference between the cash contributions and the net benefit cost deferred as a regulatory asset/liability. ITC, Central Hudson, FortisBC Energy, FortisBC Electric and Newfoundland Power have regulator-approved mechanisms to defer variations between actual net pension cost and that forecast and reflected in customer rates. There is no assurance that these deferral mechanisms will continue in the future.
Depreciation and AmortizationAs at December 31, 2019, Fortis recognized property, plant and equipment and intangible assets of $35.2 billion (December 31, 2018 – $34.0 billion) representing 66% of total assets (December 31, 2018 – 64%). Depreciation and amortization totalled $1.4 billion for 2019 (2018 – $1.2 billion).
Depreciation and amortization reflect the estimated useful lives of the underlying assets, which considers historical experience, manufacturers’ ratings and specifications, the past and expected future pattern and nature of usage, and other factors.
At the regulated utilities, depreciation rates require regulatory approval and include a provision for estimated future asset removal costs not identified as a legal obligation. Estimates primarily reflect historical experience and expected cost trends. The provision is recognized as a long-term regulatory liability against which actual removal costs are netted when incurred. As at December 31, 2019, this regulatory liability was $1.2 billion (December 31, 2018 – $1.2 billion).
Depreciation rates at the regulated utilities are typically determined through periodic depreciation studies performed by external experts. Where actual experience differs from previous estimates, resultant differences are generally reflected in future depreciation rates and thereby recovered or refunded through customer rates in the manner prescribed by the regulator.
Goodwill ImpairmentAs at December 31, 2019, Fortis recognized goodwill of $12.0 billion (December 31, 2018 – $12.5 billion), representing 22% of total assets (December 31, 2018 – 24%).
Goodwill at each of the Corporation’s 11 reporting units is tested for impairment annually and whenever an event or change in circumstances indicates that fair value may be below carrying value. If so determined, goodwill is written down to estimated fair value and an impairment loss is recognized.
The Corporation performs a qualitative assessment for certain reporting units and if it is determined that it is not likely that fair value is less than carrying value then a quantitative estimate of fair value is not required. Otherwise, the primary method for estimating fair value of the reporting units is the income approach, whereby net cash flow projections are discounted using an enterprise value method. Underlying estimates and assumptions, with varying degrees of uncertainty, include the amount and timing of expected future cash flows, growth rates, and discount rates. A secondary valuation, the market approach along with a reconciliation of the total estimated fair value of all the reporting units to the Corporation’s market capitalization, is also performed and evaluated.

FORTIS INC. 2019 ANNUAL REPORT 51
Management Discussion and Analysis
The recognition of impairment losses could have a Material Adverse Effect. Such losses are not recoverable in regulated utility rates. To the extent impairment losses signal lower expected future cash flows to support interest payments on unregulated holding company debt and dividends on common shares, they could adversely affect the future cost of such capital, expressed as higher interest rates on such debt, which is not recoverable in regulated utility rates, and lower common share market prices.
Income TaxAs at December 31, 2019, deferred income tax liabilities, current income tax receivable included in accounts receivable, deferred income taxes included in regulatory assets, and deferred income taxes included in regulatory liabilities totalled $3.0 billion, $35 million, $1.6 billion and $1.4 billion, respectively (December 31, 2018 – $2.7 billion, $91 million, $1.5 billion and $1.6 billion, respectively). Income tax expense was $289 million in 2019 (2018 – $165 million).
Current income taxes reflect the estimated taxes payable/receivable in the current year based on enacted tax rates and laws, and the estimated proportion of taxable earnings/loss attributable to various jurisdictions.
Deferred income tax assets/liabilities reflect temporary differences between the tax and accounting basis of assets/liabilities. A deferred income tax asset or liability is determined for each temporary difference based on enacted income tax rates and laws in effect when the temporary differences are expected to be recovered or settled. To the extent future tax recovery is not assessed as “more likely than not”, a valuation allowance is recognized in earnings when created or adjusted.
At the regulated utilities, differences between the tax expense/recovery normally recognized under US GAAP and that reflected in customer rates, which is expected to be recovered from/refunded to customers in future rates, are recognized as regulatory assets/liabilities. These regulatory assets/liabilities are subsequently amortized to earnings in accordance with their inclusion in customer rates pursuant to the regulator’s orders. Otherwise, changes in expectations and resultant estimates arising from changes in tax rates, tax laws, jurisdictional earnings allocations and other factors are recognized in earnings upon occurrence.
DerivativesThe fair values of derivatives are based on estimates that cannot be determined with precision as they involve uncertainties and matters of judgment and, therefore, may not be relevant in predicting future earnings or cash flows. See “Financial Instruments – Derivatives” on page 52.
ContingenciesThe Corporation and its subsidiaries are subject to various legal proceedings and claims arising in the ordinary course of business, including those generally described under “Business Risks – Indigenous Peoples’ Land Claims” on page 47, for which no amounts have been accrued because the outcomes currently cannot be reasonably determined. Further information is provided in Note 29 in the 2019 Annual Financial Statements.
While Fortis currently believes that these matters are unlikely to have a Material Adverse Effect, there is no assurance that this will be the case.
FINANCIAL INSTRUMENTSLong-Term Debt and OtherAs at December 31, 2019, the carrying value of long-term debt, including the current portion, was $22.3 billion (December 31, 2018 – $24.2 billion) compared to an estimated fair value of $25.3 billion (December 31, 2018 – $25.1 billion). Since Fortis does not intend to settle long-term debt prior to maturity, the excess of fair value over carrying value does not represent an actual liability.
The consolidated carrying value of the remaining financial instruments, other than derivatives, approximates fair value, reflecting their short-term maturity, normal trade credit terms and/or nature.
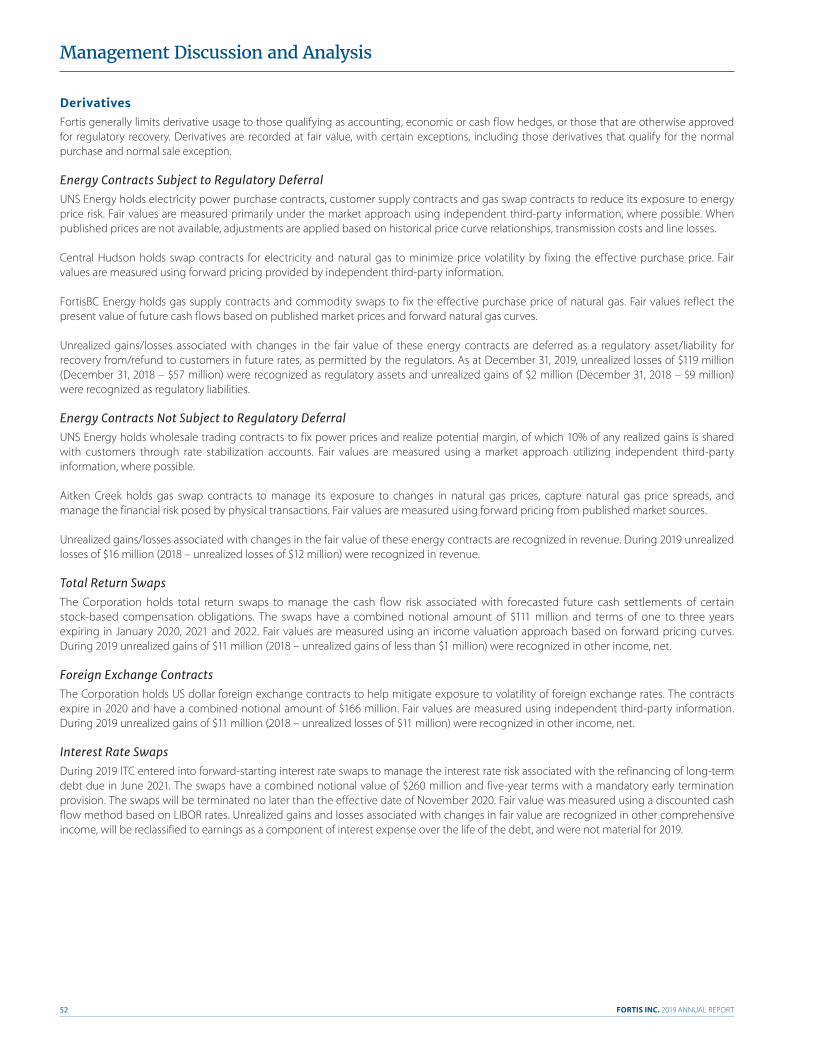
FORTIS INC. 2019 ANNUAL REPORT52
Management Discussion and Analysis
DerivativesFortis generally limits derivative usage to those qualifying as accounting, economic or cash flow hedges, or those that are otherwise approved for regulatory recovery. Derivatives are recorded at fair value, with certain exceptions, including those derivatives that qualify for the normal purchase and normal sale exception.
Energy Contracts Subject to Regulatory DeferralUNS Energy holds electricity power purchase contracts, customer supply contracts and gas swap contracts to reduce its exposure to energy price risk. Fair values are measured primarily under the market approach using independent third-party information, where possible. When published prices are not available, adjustments are applied based on historical price curve relationships, transmission costs and line losses.
Central Hudson holds swap contracts for electricity and natural gas to minimize price volatility by fixing the effective purchase price. Fair values are measured using forward pricing provided by independent third-party information.
FortisBC Energy holds gas supply contracts and commodity swaps to fix the effective purchase price of natural gas. Fair values reflect the present value of future cash flows based on published market prices and forward natural gas curves.
Unrealized gains/losses associated with changes in the fair value of these energy contracts are deferred as a regulatory asset/liability for recovery from/refund to customers in future rates, as permitted by the regulators. As at December 31, 2019, unrealized losses of $119 million (December 31, 2018 – $57 million) were recognized as regulatory assets and unrealized gains of $2 million (December 31, 2018 – $9 million) were recognized as regulatory liabilities.
Energy Contracts Not Subject to Regulatory DeferralUNS Energy holds wholesale trading contracts to fix power prices and realize potential margin, of which 10% of any realized gains is shared with customers through rate stabilization accounts. Fair values are measured using a market approach utilizing independent third-party information, where possible.
Aitken Creek holds gas swap contracts to manage its exposure to changes in natural gas prices, capture natural gas price spreads, and manage the financial risk posed by physical transactions. Fair values are measured using forward pricing from published market sources.
Unrealized gains/losses associated with changes in the fair value of these energy contracts are recognized in revenue. During 2019 unrealized losses of $16 million (2018 – unrealized losses of $12 million) were recognized in revenue.
Total Return SwapsThe Corporation holds total return swaps to manage the cash flow risk associated with forecasted future cash settlements of certain stock-based compensation obligations. The swaps have a combined notional amount of $111 million and terms of one to three years expiring in January 2020, 2021 and 2022. Fair values are measured using an income valuation approach based on forward pricing curves. During 2019 unrealized gains of $11 million (2018 – unrealized gains of less than $1 million) were recognized in other income, net.
Foreign Exchange ContractsThe Corporation holds US dollar foreign exchange contracts to help mitigate exposure to volatility of foreign exchange rates. The contracts expire in 2020 and have a combined notional amount of $166 million. Fair values are measured using independent third-party information. During 2019 unrealized gains of $11 million (2018 – unrealized losses of $11 million) were recognized in other income, net.
Interest Rate SwapsDuring 2019 ITC entered into forward-starting interest rate swaps to manage the interest rate risk associated with the refinancing of long-term debt due in June 2021. The swaps have a combined notional value of $260 million and five-year terms with a mandatory early termination provision. The swaps will be terminated no later than the effective date of November 2020. Fair value was measured using a discounted cash flow method based on LIBOR rates. Unrealized gains and losses associated with changes in fair value are recognized in other comprehensive income, will be reclassified to earnings as a component of interest expense over the life of the debt, and were not material for 2019.

FORTIS INC. 2019 ANNUAL REPORT 53
Management Discussion and Analysis
Other InvestmentsITC, UNS Energy and Central Hudson hold investments in trust associated with supplemental retirement benefit plans for select employees. These investments consist of mutual funds and money market accounts, which are recorded at fair value based on quoted market prices in active markets. Gains/losses on these funds are recognized in other income, net and were not material for 2019 and 2018.
Derivative Fair Values($ millions) Level 1(1) Level 2(1) Level 3(1) Total
As at December 31, 2019 Assets (2)
Energy contracts subject to regulatory deferral – 22 – 22 Energy contracts not subject to regulatory deferral – 8 – 8 Foreign exchange contracts, interest rate and total return swaps 14 4 – 18 Other investments 121 – – 121 135 34 – 169Liabilities (3)
Energy contracts subject to regulatory deferral (1) (138) – (139) Energy contracts not subject to regulatory deferral – (12) – (12) (1) (150) – (151)As at December 31, 2018Assets (2)
Energy contracts subject to regulatory deferral – 33 8 41 Energy contracts not subject to regulatory deferral – 13 3 16 Other investments 155 – – 155
155 46 11 212
Liabilities (3)
Energy contracts subject to regulatory deferral – (86) (3) (89) Energy contracts not subject to regulatory deferral – (1) – (1) Foreign exchange contracts, interest rate and total return swaps (8) (1) – (9)
(8) (88) (3) (99)
(1) Under the hierarchy, fair value is determined using: (i) level 1 – unadjusted quoted prices in active markets; (ii) level 2 – other pricing inputs directly or indirectly observable in the marketplace; and (iii) level 3 – unobservable inputs, used when observable inputs are not available. Classifications reflect the lowest level of input that is significant to the measurement. At December 31, 2019, all level 3 assets and liabilities transferred to level 2 because observable market data became available.
(2) Current portion is included in accounts receivable and other current assets, with the remainder included in other assets.(3) Current portion is included in accounts payable and other current liabilities, with the remainder included in other liabilities.
Derivative Volumes (1)
As at December 31 2019 2018Energy contracts subject to regulatory deferral Electricity swap contracts (GWh) 628 774 Electricity power purchase contracts (GWh) 3,198 651 Gas swap contracts (PJ) 168 203 Gas supply contract premiums (PJ) 241 266Energy contracts not subject to regulatory deferral Wholesale trading contracts (GWh) 1,855 1,440 Gas swap contracts (PJ) 43 37
(1) Energy contracts settle on various dates through 2029.
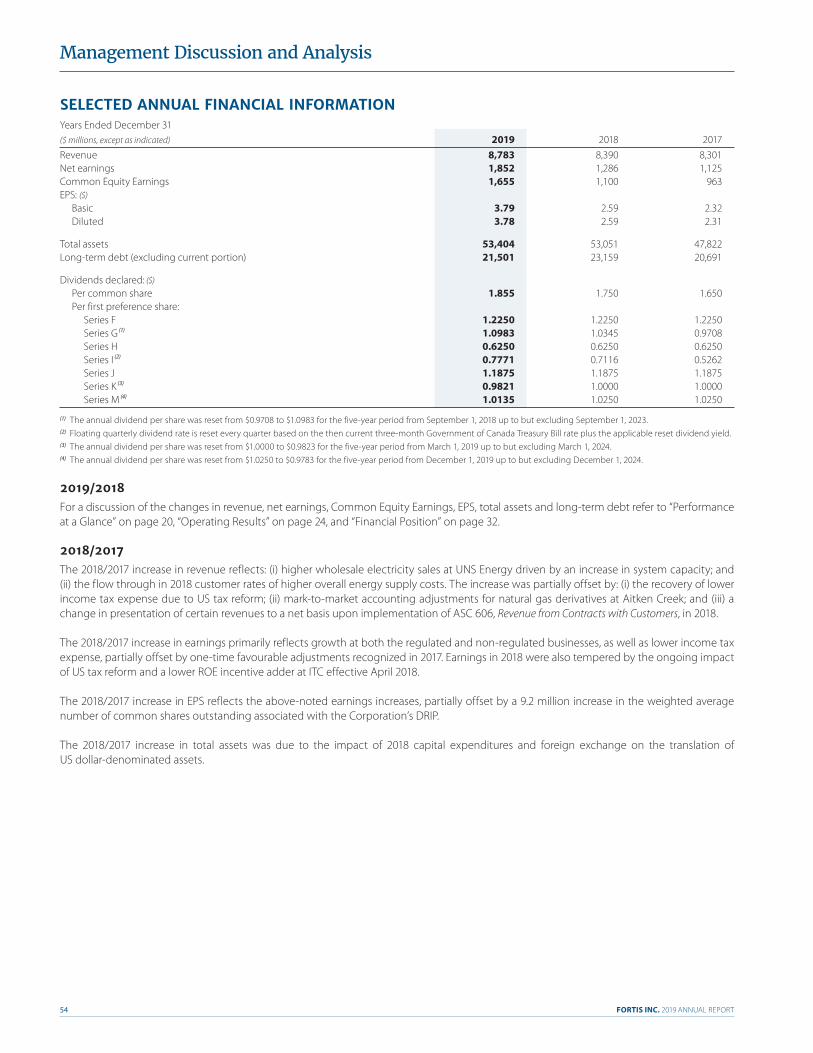
FORTIS INC. 2019 ANNUAL REPORT54
Management Discussion and Analysis
SELECTED ANNUAL FINANCIAL INFORMATIONYears Ended December 31($ millions, except as indicated) 2019 2018 2017Revenue 8,783 8,390 8,301Net earnings 1,852 1,286 1,125Common Equity Earnings 1,655 1,100 963EPS: ($) Basic 3.79 2.59 2.32 Diluted 3.78 2.59 2.31
Total assets 53,404 53,051 47,822Long-term debt (excluding current portion) 21,501 23,159 20,691
Dividends declared: ($) Per common share 1.855 1.750 1.650 Per first preference share: Series F 1.2250 1.2250 1.2250 Series G (1) 1.0983 1.0345 0.9708 Series H 0.6250 0.6250 0.6250 Series I (2) 0.7771 0.7116 0.5262 Series J 1.1875 1.1875 1.1875 Series K (3) 0.9821 1.0000 1.0000 Series M (4) 1.0135 1.0250 1.0250
(1) The annual dividend per share was reset from $0.9708 to $1.0983 for the five-year period from September 1, 2018 up to but excluding September 1, 2023.(2) Floating quarterly dividend rate is reset every quarter based on the then current three-month Government of Canada Treasury Bill rate plus the applicable reset dividend yield.(3) The annual dividend per share was reset from $1.0000 to $0.9823 for the five-year period from March 1, 2019 up to but excluding March 1, 2024.(4) The annual dividend per share was reset from $1.0250 to $0.9783 for the five-year period from December 1, 2019 up to but excluding December 1, 2024.
2019/2018For a discussion of the changes in revenue, net earnings, Common Equity Earnings, EPS, total assets and long-term debt refer to “Performance at a Glance” on page 20, “Operating Results” on page 24, and “Financial Position” on page 32.
2018/2017The 2018/2017 increase in revenue reflects: (i) higher wholesale electricity sales at UNS Energy driven by an increase in system capacity; and (ii) the flow through in 2018 customer rates of higher overall energy supply costs. The increase was partially offset by: (i) the recovery of lower income tax expense due to US tax reform; (ii) mark-to-market accounting adjustments for natural gas derivatives at Aitken Creek; and (iii) a change in presentation of certain revenues to a net basis upon implementation of ASC 606, Revenue from Contracts with Customers, in 2018.
The 2018/2017 increase in earnings primarily reflects growth at both the regulated and non-regulated businesses, as well as lower income tax expense, partially offset by one-time favourable adjustments recognized in 2017. Earnings in 2018 were also tempered by the ongoing impact of US tax reform and a lower ROE incentive adder at ITC effective April 2018.
The 2018/2017 increase in EPS reflects the above-noted earnings increases, partially offset by a 9.2 million increase in the weighted average number of common shares outstanding associated with the Corporation’s DRIP.
The 2018/2017 increase in total assets was due to the impact of 2018 capital expenditures and foreign exchange on the translation of US dollar-denominated assets.

FORTIS INC. 2019 ANNUAL REPORT 55
Management Discussion and Analysis
FOURTH QUARTER RESULTSSalesFourth quarters ended December 31 2019 2018 VarianceRegulated Utilities UNS Energy Retail electricity (GWh) 2,223 2,225 (2) Wholesale electricity (GWh) 1,814 2,526 (712) Gas (PJ) 5 5 –Central Hudson Electricity (GWh) 1,188 1,250 (62) Gas (PJ) 6 7 (1)FortisBC Energy (PJ) 71 63 8FortisAlberta (GWh) 4,279 4,343 (64)FortisBC Electric (GWh) 888 839 49Other Electric (GWh) 2,427 2,450 (23)Non-Regulated Energy Infrastructure (GWh) 14 85 (71)
The decrease in wholesale electricity sales was due primarily to a decrease in system capacity at Gila River Unit 2 resulting from an outage. The increase in gas volumes at FortisBC Energy was due to higher average consumption by residential and commercial customers due to colder temperatures that increased heating load and higher consumption by transportation customers.
Revenue and Common Equity EarningsFourth quarters ended December 31 Revenue Common Equity Earnings ($ millions, except as indicated) 2019 2018 Variance 2019 2018 VarianceRegulated Utilities ITC 500 390 110 171 92 79 UNS Energy 510 541 (31) 38 27 11 Central Hudson 226 234 (8) 30 24 6 FortisBC Energy 428 371 57 77 72 5 FortisAlberta 150 140 10 33 22 11 FortisBC Electric 112 111 1 12 13 (1) Other Electric 381 372 9 22 22 –Non-Regulated Energy Infrastructure 19 50 (31) 6 22 (16) Corporate and Other – – – (43) (33) (10)Inter-segment eliminations – (3) 3 – – –
Total 2,326 2,206 120 346 261 85
Weighted average number of common shares outstanding (millions) 447.1 427.5 19.6Basic EPS ($) 0.77 0.61 0.16
The increase in revenue was driven by the $91 million favourable adjustment to revenue at ITC associated with the November 2019 FERC Order (see “Regulatory Highlights” on page 30) and higher revenue at FortisBC Energy due to overall higher flow-through costs. The increase was partially offset by lower revenue at UNS Energy due to lower short-term wholesale sales and lower revenue in the Energy Infrastructure segment due to the disposition of the Waneta Expansion in April 2019 (see “Significant Items” on page 20) and lower hydroelectric production in Belize.
The increase in Common Equity Earnings was due primarily to the November 2019 FERC Order at ITC, along with Rate Base growth at the regulated utilities.
The increase in basic EPS reflects higher Common Equity Earnings, partially offset by a 19.6 million increase in the weighted average number of common shares outstanding associated with the Corporation’s common equity offering (see “Significant Items” on page 20), DRIP and ATM Program.
FORTIS INC. 2019 ANNUAL REPORT56
Management Discussion and Analysis
Cash FlowsFourth quarters ended December 31($ millions) 2019 2018 VarianceCash, beginning of period 228 195 33Cash provided by (used in): Operating activities 634 537 97 Investing activities (1,104) (999) (105) Financing activities 627 598 29Foreign exchange (15) 16 (31)Cash associated with assets held for sale – (15) 15
Cash, end of period 370 332 38
Operating ActivitiesThe variance was due to higher cash earnings at the regulated subsidiaries, led by ITC, partially offset by unfavourable changes in working capital due primarily to timing differences.
Investing ActivitiesThe variance reflects higher capital spending, mainly at UNS Energy, in accordance with the Corporation’s capital plan.
Financing ActivitiesThe variance reflects the issuance of common shares and redemption of Corporate debt (see “Cash Flow Summary” on page 34).
SUMMARY OF QUARTERLY RESULTS Common Equity Revenue Earnings Basic EPS Diluted EPSQuarter Ended ($ millions) ($ millions) ($) ($)
December 31, 2019 2,326 346 0.77 0.77September 30, 2019 2,051 278 0.64 0.63June 30, 2019 1,970 720 1.66 1.66March 31, 2019 2,436 311 0.72 0.72December 31, 2018 2,206 261 0.61 0.61September 30, 2018 2,040 276 0.65 0.65June 30, 2018 1,947 240 0.57 0.57March 31, 2018 2,197 323 0.77 0.76
Generally, within each calendar year, quarterly results fluctuate primarily in accordance with seasonality. Given the diversified nature of the Corporation’s subsidiaries, seasonality varies. Most of the annual earnings of the gas utilities are realized in the first and fourth quarters due to space-heating requirements. Earnings for the electric distribution utilities in the US are generally highest in the second and third quarters due to the use of air conditioning and other cooling equipment.
Generally, from one calendar year to the next, quarterly results reflect: (i) continued organic growth driven by the Corporation’s capital plan; (ii) acquisitions and dispositions; (iii) any significant temperature fluctuations from seasonal norms; (iv) the timing and significance of any regulatory decisions; (v) for revenue, the flow through in customer rates of commodity costs; and (vi) for EPS, increases in the weighted average number of common shares outstanding.
December 2019/December 2018See “Fourth Quarter Results” on page 55.
September 2019/September 2018Common Equity Earnings increased by $2 million and basic EPS decreased by $0.01, due mainly to Rate Base growth at the regulated utilities, led by ITC, tempered by: (i) the unfavourable impact of the mark-to-market accounting of natural gas derivatives at Aitken Creek; (ii) lower hydroelectric production in Belize; and (iii) for EPS, an 11.8 million increase in the weighted average number of common shares outstanding due to the ATM Program and DRIP.
FORTIS INC. 2019 ANNUAL REPORT 57
Management Discussion and Analysis
June 2019/June 2018Common Equity Earnings increased by $480 million and basic EPS increased by $1.09, due mainly to: (i) a $484 million gain on the disposition of the Waneta Expansion; (ii) the favourable impact of the mark-to-market accounting of natural gas derivatives at Aitken Creek; (iii) Rate Base growth at the regulated utilities, led by ITC; and (iv) favourable foreign exchange of $7 million. The increase was tempered by: (i) lower retail sales, driven by weather, and higher depreciation and interest expense at UNS Energy; (ii) lower earnings contribution from the Energy Infrastructure segment due to lower hydroelectric production in Belize; (iii) lower realized margins at Aitken Creek; and (iv) for EPS, a 9.3 million increase in the weighted average number of common shares outstanding due to the ATM Program and DRIP.
March 2019/March 2018Common Equity Earnings decreased by $12 million and basic EPS decreased by $0.05, due mainly to: (i) a favourable $30 million remeasurement of deferred income tax liabilities in 2018 resulting from an election to file a consolidated state income tax return, which offset earnings growth in 2019. Earnings growth was driven by: (i) strong performance at the regulated utilities due primarily to Rate Base growth; (ii) increased earnings at Central Hudson associated with its rate order effective July 1, 2018; (iii) higher electricity and gas sales at UNS Energy due largely to weather; and (iv) favourable foreign exchange of $9 million. The increase was tempered by: (i) lower earnings contribution from the Energy Infrastructure segment due to lower realized margins and higher unrealized losses on the mark-to-market accounting of natural gas derivatives at Aitken Creek, along with lower hydroelectric production in Belize; (ii) a lower ROE incentive adder at ITC; and (iii) for EPS, a 7.5 million increase in the weighted average number of common shares outstanding due mainly to the DRIP.
RELATED-PARTY TRANSACTIONSRelated-party transactions are in the normal course of operations and are measured at the amount of consideration agreed to by the related parties. There were no material related-party transactions in 2019 or 2018. Inter-company balances, transactions and profit are eliminated on consolidation, except for certain inter-company transactions between non-regulated and regulated entities in accordance with accounting standards for rate-regulated entities. These related-party transactions include: (i) the lease of gas storage capacity and gas sales by Aitken Creek to FortisBC Energy; and (ii) the sale of capacity by the Waneta Expansion to FortisBC Electric up to the April 16, 2019 disposition of the Waneta Expansion. These transactions, which are not eliminated on consolidation, did not have a material impact on consolidated earnings, financial position or cash flows.
The Corporation periodically provides short-term financing to subsidiaries to support capital expenditures, acquisitions and seasonal working capital requirements. As at December 31, 2019, there were inter-segment loans outstanding of $279 million (December 31, 2018 – $nil), payable on demand with a weighted average interest rate of 2.48%. Total interest charged in 2019 was $2 million.
MANAGEMENT’S EVALUATION OF CONTROLS AND PROCEDURESDisclosure Controls and ProceduresDCP are designed to provide reasonable assurance that information required to be disclosed in reports filed with, or submitted to, securities regulatory authorities is recorded, processed, summarized and reported within the time periods specified under Canadian and US securities laws. As of December 31, 2019, an evaluation was carried out under the supervision of, and with the participation of, the Corporation’s management, including the CEO and CFO, of the effectiveness of the Corporation’s DCP, as defined in the applicable Canadian and United States securities laws. Based on that evaluation, the CEO and CFO concluded that such DCP are effective as of December 31, 2019.
Internal Control over Financial ReportingICFR is designed by, or under the supervision of, the Corporation’s CEO and CFO and effected by the Corporation’s board of directors, management and other personnel to provide reasonable assurance regarding the reliability of financial reporting and the preparation of financial statements for external purposes in accordance with US GAAP. Because of its inherent limitations, ICFR may not prevent or detect misstatements. Also, projections of any evaluation of effectiveness to future periods are subject to the risk that controls may become inadequate because of changes in conditions, or that the degree of compliance with the policies or procedures may deteriorate.
The Corporation’s management, including the Corporation’s CEO and CFO, assessed the effectiveness of the Corporation’s ICFR as of December 31, 2019, based on the criteria set forth in Internal Control – Integrated Framework (2013) issued by the Committee of Sponsoring Organizations of the Treadway Commission. Based on this assessment, management concluded that, as of December 31, 2019, the Corporation’s ICFR was effective.
During the year ended December 31, 2019, there have been no changes in the Corporation’s ICFR that have materially affected, or are reasonably likely to materially affect, the Corporation’s ICFR.
FORTIS INC. 2019 ANNUAL REPORT58
Management Discussion and Analysis
OUTLOOKOver the long term, Fortis is well positioned to enhance shareholder value through the execution of its capital plan, the balance and strength of its diversified portfolio of utility businesses, and growth opportunities within and proximate to its service territories.
The Corporation’s $18.8 billion five-year capital plan is expected to increase Rate Base from $28.0 billion in 2019 to $34.5 billion by 2022 and $38.4 billion by 2024, translating into three- and five-year CAGRs of 7.2% and 6.5%, respectively. The five-year capital plan reflects the continuation of key industry trends including grid modernization and the delivery of cleaner energy. Beyond the base capital plan, Fortis continues to pursue additional energy infrastructure opportunities. Key opportunities not yet included in the five-year capital plan include: further expansion of LNG infrastructure in British Columbia; the fully permitted, cross-border, Lake Erie connector electric transmission project in Ontario; and the acceleration of cleaner energy goals in Arizona.
Fortis expects long-term growth in Rate Base to support continuing growth in earnings and dividends. Fortis is targeting average annual dividend growth of approximately 6% through 2024. This dividend guidance takes into account many factors, including the expectation of reasonable outcomes for regulatory proceedings at the Corporation’s utilities, the successful execution of the five-year capital plan, and management’s continued confidence in the strength of the Corporation’s diversified portfolio of utilities and record of operational excellence.
FORWARD-LOOKING INFORMATIONFortis includes forward-looking information in the MD&A within the meaning of applicable Canadian securities laws and forward-looking statements within the meaning of the U.S. Private Securities Litigation Reform Act of 1995, (collectively referred to as “forward-looking information”). Forward-looking information reflects expectations of Fortis management regarding future growth, results of operations, performance, business prospects and opportunities. Wherever possible, words such as anticipates, believes, budgets, could, estimates, expects, forecasts, intends, may, might, plans, projects, schedule, should, target, will, would and the negative of these terms and other similar terminology or expressions have been used to identify the forward-looking information, which includes, without limitation: targeted average annual dividend growth through 2024; forecast capital expenditures for 2020 and the period 2020 through 2024, and potential funding sources for the capital plan; forecast Rate Base for 2020 and 2024; the expectation that Fortis will remain at the forefront of the industry by leveraging its strengths and partnerships; expected timing, outcome and impact of regulatory filings and decisions; expected or potential funding sources for operating expenses, interest costs and capital plans; the expectation that maintaining the targeted capital structure of the regulated operating subsidiaries will not have an impact on its ability to pay dividends in the foreseeable future; expected consolidated fixed-term debt maturities and repayments over the next five years; the expectation that the Corporation and its subsidiaries will continue to have access to long-term capital and will remain compliant with debt covenants throughout 2020; the nature, timing, benefits and expected costs of certain capital projects including the Multi-Value Regional Transmission Projects, Transmission Conversion Project, Southline Transmission Project, Oso Grande Wind Project, Transmission Integrity Management Capabilities Project, Inland Gas Upgrades Project, Wataynikaneyap Transmission Power Project and additional opportunities beyond the base plan, including the Lake Erie Connector Project; the expectation that the adoption of future accounting pronouncements will not have a material adverse impact; and the expectation that capital investment will support growth in earnings and dividends.
Certain material factors or assumptions have been applied in drawing the conclusions contained in the forward-looking information, including, without limitation: reasonable regulatory decisions and the expectation of regulatory stability; the implementation of the five-year capital plan; no material capital project or financing cost overruns; sufficient human resources to deliver service and execute the capital plan; the realization of additional opportunities; the Board exercising its discretion to declare dividends, taking into account the financial performance and condition of the Corporation; no significant variability in interest rates; no significant operational disruptions or environmental liability or upset; the continued ability to maintain the performance of the electricity and gas systems; no severe and prolonged economic downturn; sufficient liquidity and capital resources; the ability to hedge exposures to fluctuations in foreign exchange rates, natural gas prices and electricity prices; the continued availability of natural gas, fuel, coal and electricity supply; continuation of power supply and capacity purchase contracts; no significant changes in government energy plans, environmental laws and regulations that could have a material negative impact; maintenance of adequate insurance coverage; the ability to obtain and maintain licences and permits; retention of existing service areas; no significant changes in tax laws and the continued tax deferred treatment of earnings from the Corporation’s foreign operations; continued maintenance of information technology infrastructure and no material breach of cybersecurity; continued favourable relations with Indigenous Peoples; and favourable labour relations.
Forward-looking information involves significant risks, uncertainties and assumptions. Fortis cautions readers that a number of factors could cause actual results, performance or achievements to differ materially from those discussed or implied in the forward-looking information. These factors should be considered carefully and undue reliance should not be placed on the forward-looking information. Risk factors which could cause results or events to differ from current expectations are detailed under the heading “Business Risks” in this MD&A and in other continuous disclosure materials filed from time to time with Canadian securities regulatory authorities and the Securities and Exchange Commission. Key risk factors for 2020 include, but are not limited to: uncertainty regarding the outcome of regulatory proceedings at the Corporation’s utilities; risks associated with climate change and physical risks; the impact of fluctuations in interest rates; the impact of weather variability and seasonality on heating and cooling loads, gas distribution volumes and hydroelectric generation; and risks associated with acquisitions and capital projects.
All forward-looking information herein is given as of February 12, 2020. Fortis disclaims any intention or obligation to update or revise any forward-looking information, whether as a result of new information, future events or otherwise.
FORTIS INC. 2019 ANNUAL REPORT 59
Management Discussion and Analysis
GLOSSARY
2019 Annual Financial Statements: the Corporation’s audited consolidated financial statements and notes thereto for the year ended December 31, 2019
Actual Payout Ratio: dividends per common share divided by basic EPS
Adjusted Basic EPS: Adjusted Common Equity Earnings divided by the basic weighted average number of common shares outstanding
Adjusted Common Equity Earnings: net earnings attributable to common equity shareholders adjusted as shown under “Non-US GAAP Financial Measures” on page 29
Adjusted Payout Ratio: dividends per common share divided by Adjusted Basic EPS as shown under “Non-US GAAP Financial Measures” on page 29
AESO: Alberta Electric System Operator
AFUDC: allowance for funds used during construction
Aitken Creek: Aitken Creek Gas Storage ULC, a direct 93.8%-owned subsidiary of FortisBC Holdings Inc.
ALJ: administrative law judge
ASU: Accounting Standards Update
ATM Program: at-the-market common equity program
AUC: Alberta Utilities Commission
BCUC: British Columbia Utilities Commission
BECOL: Belize Electric Company Limited, an indirect wholly owned subsidiary of Fortis
Belize Electricity: Belize Electricity Limited, in which Fortis indirectly holds a 33% equity interest
CAGR(s): compound average growth rate of a particular item. CAGR = (EV/BV)1–N–1, where: (i) EV is the ending value of the item; (ii) BV is the beginning value of the item; and (iii) N is the number of periods
Caribbean Utilities: Caribbean Utilities Company, Ltd., an indirect approximately 60%-owned (as at December 31, 2019) subsidiary of Fortis, together with its subsidiary
Central Hudson: CH Energy Group Inc., an indirect wholly owned subsidiary of Fortis, together with its subsidiaries, including Central Hudson Gas & Electric Corporation
CEO: Chief Executive Officer of Fortis
CFO: Chief Financial Officer of Fortis
Common Equity Earnings: net earnings attributable to common equity shareholders
Corporation: Fortis Inc.
COS Regulation: cost of service regulation
CPCN: Certificate of Public Convenience and Necessity
DBRS Morningstar: DBRS Limited
DCP: disclosure controls and procedures
DRIP: dividend reinvestment plan
EPS: earnings per common share
ERM: enterprise risk management
EVP: executive vice president
FERC: Federal Energy Regulatory Commission
Fortis: Fortis Inc.
FortisAlberta: FortisAlberta Inc., an indirect wholly owned subsidiary of Fortis
FortisBC Electric: FortisBC Inc., an indirect wholly owned subsidiary of Fortis, together with its subsidiaries
FortisBC Energy: FortisBC Energy Inc., an indirect wholly owned subsidiary of Fortis, together with its subsidiaries
FortisOntario: FortisOntario Inc., a direct wholly owned subsidiary of Fortis, together with its subsidiaries
FortisTCI: FortisTCI Limited, an indirect wholly owned subsidiary of Fortis, together with its subsidiary
FX: foreign exchange associated with the translation of US dollar-denominated amounts
GHG: greenhouse gas
Gila River Unit 2: UNS Energy’s Gila River natural gas generation station unit 2
GWh: gigawatt hour(s)
ICFR: internal controls over financial reporting
ITC: ITC Investment Holdings Inc., an indirect 80.1%-owned subsidiary of Fortis, together with its subsidiaries, including International Transmission Company, Michigan Electric Transmission Company, LLC, ITC Midwest LLC, and ITC Great Plains, LLC
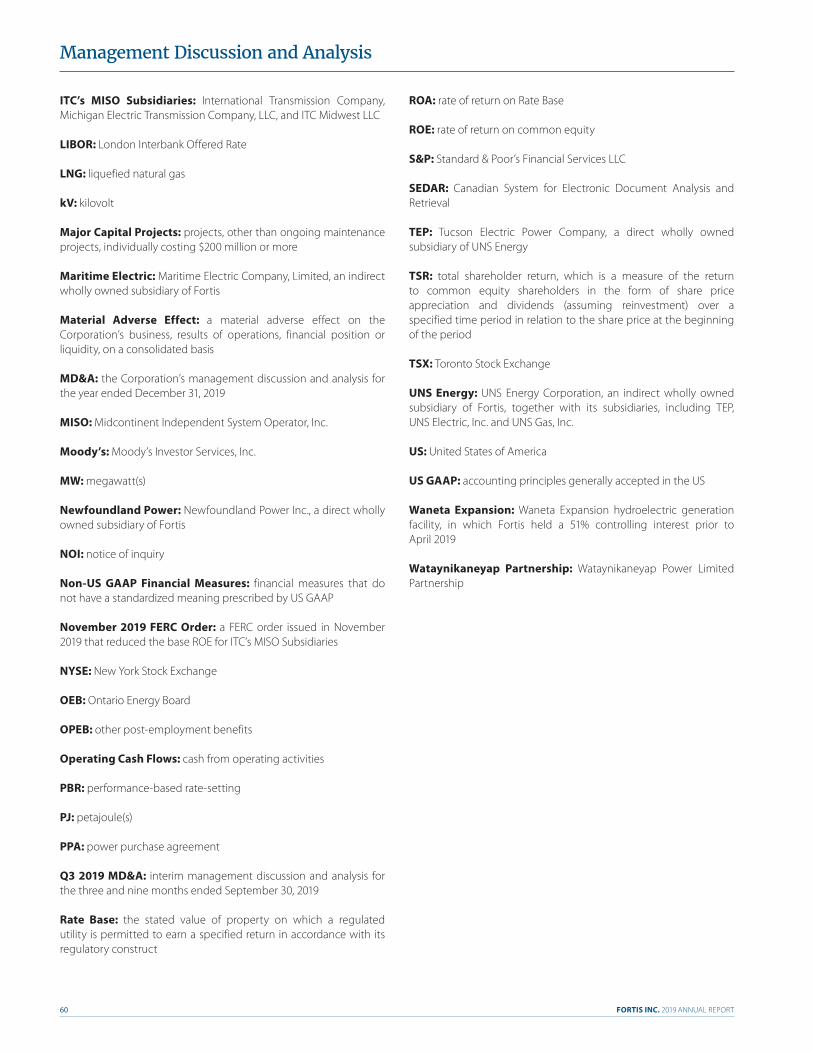
FORTIS INC. 2019 ANNUAL REPORT60
Management Discussion and Analysis
ITC’s MISO Subsidiaries: International Transmission Company, Michigan Electric Transmission Company, LLC, and ITC Midwest LLC
LIBOR: London Interbank Offered Rate
LNG: liquefied natural gas
kV: kilovolt
Major Capital Projects: projects, other than ongoing maintenance projects, individually costing $200 million or more
Maritime Electric: Maritime Electric Company, Limited, an indirect wholly owned subsidiary of Fortis
Material Adverse Effect: a material adverse effect on the Corporation’s business, results of operations, financial position or liquidity, on a consolidated basis
MD&A: the Corporation’s management discussion and analysis for the year ended December 31, 2019
MISO: Midcontinent Independent System Operator, Inc.
Moody’s: Moody’s Investor Services, Inc.
MW: megawatt(s)
Newfoundland Power: Newfoundland Power Inc., a direct wholly owned subsidiary of Fortis
NOI: notice of inquiry
Non-US GAAP Financial Measures: financial measures that do not have a standardized meaning prescribed by US GAAP
November 2019 FERC Order: a FERC order issued in November 2019 that reduced the base ROE for ITC’s MISO Subsidiaries
NYSE: New York Stock Exchange
OEB: Ontario Energy Board
OPEB: other post-employment benefits
Operating Cash Flows: cash from operating activities
PBR: performance-based rate-setting
PJ: petajoule(s)
PPA: power purchase agreement
Q3 2019 MD&A: interim management discussion and analysis for the three and nine months ended September 30, 2019
Rate Base: the stated value of property on which a regulated utility is permitted to earn a specified return in accordance with its regulatory construct
ROA: rate of return on Rate Base
ROE: rate of return on common equity
S&P: Standard & Poor’s Financial Services LLC
SEDAR: Canadian System for Electronic Document Analysis and Retrieval
TEP: Tucson Electric Power Company, a direct wholly owned subsidiary of UNS Energy
TSR: total shareholder return, which is a measure of the return to common equity shareholders in the form of share price appreciation and dividends (assuming reinvestment) over a specified time period in relation to the share price at the beginning of the period
TSX: Toronto Stock Exchange
UNS Energy: UNS Energy Corporation, an indirect wholly owned subsidiary of Fortis, together with its subsidiaries, including TEP, UNS Electric, Inc. and UNS Gas, Inc.
US: United States of America
US GAAP: accounting principles generally accepted in the US
Waneta Expansion: Waneta Expansion hydroelectric generation facility, in which Fortis held a 51% controlling interest prior to April 2019
Wataynikaneyap Partnership: Wataynikaneyap Power Limited Partnership
FORTIS INC. 2019 ANNUAL REPORT 61
Management’s Report on Internal Control over Financial Reporting ..............................................................................................61
Report of Independent Registered Public Accounting Firm – Opinion on the Financial Statements ..................................................................62
Report of Independent Registered Public Accounting Firm – Opinion on Internal Control over Financial Reporting .............................64
Consolidated Balance Sheets ..........................................................................................65
Consolidated Statements of Earnings ........................................................................66
Consolidated Statements of Comprehensive Income ....................................66
Consolidated Statements of Cash Flows ..................................................................67
Consolidated Statements of Changes in Equity ..................................................68
Notes to Consolidated Financial Statements
NOTE 1 Description of Business .............................................................................69
NOTE 2 Regulation ..........................................................................................................70
NOTE 3 Summary of Significant Accounting Policies ...............................74
NOTE 4 Future Accounting Pronouncements ...............................................80
NOTE 5 Segmented Information............................................................................80
NOTE 6 Revenue ...............................................................................................................82
NOTE 7 Accounts Receivable and Other Current Assets ........................83
NOTE 8 Inventories .........................................................................................................83
NOTE 9 Regulatory Assets and Liabilities .........................................................84
NOTE 10 Other Assets ......................................................................................................86
NOTE 11 Property, Plant and Equipment ............................................................86
NOTE 12 Intangible Assets ............................................................................................88
NOTE 13 Goodwill ..............................................................................................................88
NOTE 14 Accounts Payable and Other Current Liabilities ........................88
NOTE 15 Long-Term Debt .............................................................................................89
NOTE 16 Leases ....................................................................................................................92
NOTE 17 Other Liabilities ...............................................................................................94
NOTE 18 Common Shares.............................................................................................95
NOTE 19 Earnings Per Common Share .................................................................95
NOTE 20 Preference Shares ..........................................................................................95
NOTE 21 Accumulated Other Comprehensive Income .............................97
NOTE 22 Stock-Based Compensation Plans ......................................................98
NOTE 23 Disposition ......................................................................................................100
NOTE 24 Other Income, Net .....................................................................................101
NOTE 25 Income Taxes .................................................................................................101
NOTE 26 Employee Future Benefits .....................................................................103
NOTE 27 Supplementary Cash Flow Information .......................................108
NOTE 28 Fair Value of Financial Instruments and Risk Management ......................................................................108
NOTE 29 Commitments and Contingencies ..................................................112
Table of Contents
Financials
MANAGEMENT’S REPORT ON INTERNAL CONTROL OVER FINANCIAL REPORTINGManagement of Fortis Inc. and its subsidiaries (the “Corporation”) is responsible for establishing and maintaining adequate internal control over financial reporting (“ICFR”). The Corporation’s ICFR is designed by, or under the supervision of, the Corporation’s President and Chief Executive Officer (“CEO”) and Executive Vice President, Chief Financial Officer (“CFO”) and effected by the Corporation’s board of directors, management and other personnel to provide reasonable assurance regarding the reliability of financial reporting and the preparation of financial statements for external purposes in accordance with accounting principles generally accepted in the United States of America. Because of its inherent limitations, ICFR may not prevent or detect misstatements. Also, projections of any evaluation of effectiveness to future periods are subject to risk that controls may become inadequate because of changes in conditions, or that the degree of compliance with the policies or procedures may deteriorate.
The Corporation’s management, including its CEO and CFO, assessed the effectiveness of the Corporation’s ICFR as of December 31, 2019, based on the criteria set forth in Internal Control – Integrated Framework (2013) issued by the Committee of Sponsoring Organizations of the Treadway Commission. Based on this assessment, management concluded that, as of December 31, 2019, the Corporation’s ICFR was effective.
The Corporation’s ICFR as of December 31, 2019 has been audited by Deloitte LLP, an Independent Registered Public Accounting Firm, which also audited the Corporation’s consolidated financial statements for the year ended December 31, 2019. Deloitte LLP issued an unqualified opinion for both audits.
February 12, 2020
Barry V. Perry Jocelyn H. Perry President and Chief Executive Officer, Fortis Inc. Executive Vice President, Chief Financial Officer, Fortis Inc.
St. John’s, Canada
FORTIS INC. 2019 ANNUAL REPORT62
Financials
REPORT OF INDEPENDENT REGISTERED PUBLIC ACCOUNTING FIRMTo the Shareholders and the Board of Directors of Fortis Inc.
Opinion on the Financial Statements
We have audited the accompanying consolidated balance sheets of Fortis Inc. and subsidiaries (the “Corporation”) as of December 31, 2019 and 2018, the related consolidated statements of earnings, comprehensive income, cash flows and changes in equity for each of the two years in the period ended December 31, 2019, and the related notes (collectively referred to as the “financial statements”). In our opinion, the financial statements present fairly, in all material respects, the financial position of the Corporation as of December 31, 2019 and 2018, and the results of its operations and its cash flows for each of the two years in the period ended December 31, 2019, in conformity with accounting principles generally accepted in the United States of America.
We have also audited, in accordance with the standards of the Public Company Accounting Oversight Board (United States) (PCAOB), the Corporation’s internal control over financial reporting as of December 31, 2019, based on criteria established in Internal Control – Integrated Framework (2013) issued by the Committee of Sponsoring Organizations of the Treadway Commission and our report dated February 12, 2020, expressed an unqualified opinion on the Corporation’s internal control over financial reporting.
Basis for Opinion
These financial statements are the responsibility of the Corporation’s management. Our responsibility is to express an opinion on the Corporation’s financial statements based on our audits. We are a public accounting firm registered with the PCAOB and are required to be independent with respect to the Corporation in accordance with the U.S. federal securities laws and the applicable rules and regulations of the Securities and Exchange Commission and the PCAOB.
We conducted our audits in accordance with the standards of the PCAOB. Those standards require that we plan and perform the audit to obtain reasonable assurance about whether the financial statements are free of material misstatement, whether due to error or fraud. Our audits included performing procedures to assess the risks of material misstatement of the financial statements, whether due to error or fraud, and performing procedures that respond to those risks. Such procedures included examining, on a test basis, evidence regarding the amounts and disclosures in the financial statements. Our audits also included evaluating the accounting principles used and significant estimates made by management, as well as evaluating the overall presentation of the financial statements. We believe that our audits provide a reasonable basis for our opinion.
Critical Audit Matters
The critical audit matters communicated below are matters arising from the current-period audit of the financial statements that were communicated or required to be communicated to the audit committee and that (1) relate to accounts or disclosures that are material to the financial statements and (2) involved our especially challenging, subjective, or complex judgments. The communication of critical audit matters does not alter in any way our opinion on the financial statements, taken as a whole, and we are not, by communicating the critical audit matters below, providing separate opinions on the critical audit matters or on the accounts or disclosures to which they relate.
Assessment for Impairment of Goodwill – Refer to Notes 3 and 13 to the financial statements
Critical Audit Matter DescriptionThe Corporation assesses goodwill for impairment annually as well as whenever any event or other change indicates that the fair value of a reporting unit may be below its carrying value. Management has determined that there is no impairment based on its current annual assessment.
Management’s assessment utilizes the income approach which is based on underlying estimates and assumptions with varying degrees of uncertainty. Those with the highest degree of subjectivity and impact are the assumed growth rates and discount rates. Auditing these estimates and assumptions required a high degree of audit judgment and effort, including the need to involve a fair value specialist.
How the Critical Audit Matter was Addressed in the AuditOur audit procedures related to the growth rate and discount rate used by management to estimate the fair value of the reporting units included the following, among others:
• Evaluating the effectiveness of controls over the estimated fair value of the reporting units, including the review and approval of the growth rate and discount rate selected by management.
• Evaluating management’s ability to accurately forecast the growth rate by: • Assessing the methodology used in management’s determination of the growth rate and,• Comparing management’s assumptions to historical data and available market trends.
• With the assistance of a fair value specialist, evaluating the reasonableness of the discount rate by:• Testing the source information underlying the determination of the discount rate and,• Developing a range of independent estimates and comparing those to the discount rate selected by management.
FORTIS INC. 2019 ANNUAL REPORT 63
Financials
Impact of Rate Regulation on the Financial Statements – Refer to Notes 2, 3 and 9 to the Financial Statements
Critical Audit Matter DescriptionThe Corporation’s regulated utilities are subject to rate regulation and annual earnings oversight by various federal, state and provincial regulatory authorities who have jurisdiction in the United States and Canada. Rates and resultant earnings of the Corporation’s regulated utilities are determined under cost of service regulation, with some using performance-based rate-setting mechanisms. The regulation of rates is premised on the full recovery of prudently incurred costs and a reasonable rate of return on asset value (ROA) or common shareholders’ equity (ROE). Regulatory decisions can have an impact on the timely recovery of costs and the regulator-approved ROE and/or ROA. Accounting for the economics of rate regulation impacts multiple financial statement line items and disclosures, such as property, plant, and equipment; regulatory assets and liabilities; operating revenues and expenses; income taxes; and depreciation expense.
We identified the impact of rate regulation as a critical audit matter due to the significant judgments made by management to support its assertions about impacted account balances and disclosures and the high degree of subjectivity involved in assessing the potential impact of future regulatory orders on the financial statements. Management judgments include assessing the likelihood of recovery of costs incurred or a refund to customers through the rate-setting process. While the Corporation’s regulated utilities have indicated they expect to recover costs from customers through regulated rates, there is a risk that the respective regulatory authority will not approve full recovery of the costs incurred and a reasonable ROE and/or ROA. Auditing these matters required especially subjective judgment and specialized knowledge of accounting for rate regulation due its inherent complexities across different jurisdictions.
How the Critical Audit Matter was Addressed in the AuditOur audit procedures related to the likelihood of recovery of costs incurred or a refund to customers through the rate-setting process, included the following, among others:
• Evaluating the effectiveness of controls over the monitoring and evaluation of regulatory developments that may affect the likelihood of recovering costs in future rates or of a future reduction in rates.
• Assessing relevant regulatory orders, regulatory statutes and interpretations as well as procedural memorandums, utility and intervener filings, and other publicly available information to evaluate the likelihood of recovery in future rates or of a future reduction in rates and the ability to earn a reasonable ROA or ROE.
• For regulatory matters in progress, inspecting the regulated utilities’ filings for any evidence that might contradict management’s assertions. We obtained an analysis from management and letters from internal and external legal counsel, as appropriate, regarding cost recoveries or a future reduction in rates.
• Evaluating the Corporation’s disclosures related to the impacts of rate regulation, including the balances recorded and regulatory developments.
Deloitte LLPChartered Professional Accountants
St. John’s, Canada February 12, 2020
We have served as the Corporation’s auditor since 2017.
FORTIS INC. 2019 ANNUAL REPORT64
Financials
REPORT OF INDEPENDENT REGISTERED PUBLIC ACCOUNTING FIRMTo the Shareholders and the Board of Directors of Fortis Inc.
Opinion on Internal Control over Financial Reporting
We have audited the internal control over financial reporting of Fortis Inc. and subsidiaries (the “Corporation”) as of December 31, 2019, based on criteria established in Internal Control – Integrated Framework (2013) issued by the Committee of Sponsoring Organizations of the Treadway Commission (COSO). In our opinion, the Corporation maintained, in all material respects, effective internal control over financial reporting as of December 31, 2019, based on criteria established in Internal Control – Integrated Framework (2013) issued by COSO.
We have also audited, in accordance with the standards of the Public Company Accounting Oversight Board (United States) (PCAOB), the consolidated financial statements as at and for the year ended December 31, 2019, of the Corporation and our report dated February 12, 2020, expressed an unqualified opinion on those financial statements.
Basis for Opinion
The Corporation’s management is responsible for maintaining effective internal control over financial reporting and for its assessment of the effectiveness of internal control over financial reporting, included in the accompanying Management’s Report on Internal Control over Financial Reporting. Our responsibility is to express an opinion on the Corporation’s internal control over financial reporting based on our audit. We are a public accounting firm registered with the PCAOB and are required to be independent with respect to the Corporation in accordance with the U.S. federal securities laws and the applicable rules and regulations of the Securities and Exchange Commission and the PCAOB.
We conducted our audit in accordance with the standards of the PCAOB. Those standards require that we plan and perform the audit to obtain reasonable assurance about whether effective internal control over financial reporting was maintained in all material respects. Our audit included obtaining an understanding of internal control over financial reporting, assessing the risk that a material weakness exists, testing and evaluating the design and operating effectiveness of internal control based on the assessed risk, and performing such other procedures as we considered necessary in the circumstances. We believe that our audit provides a reasonable basis for our opinion.
Definition and Limitations of Internal Control over Financial Reporting
A company’s internal control over financial reporting is a process designed to provide reasonable assurance regarding the reliability of financial reporting and the preparation of financial statements for external purposes in accordance with generally accepted accounting principles. A company’s internal control over financial reporting includes those policies and procedures that (1) pertain to the maintenance of records that, in reasonable detail, accurately and fairly reflect the transactions and dispositions of the assets of the company; (2) provide reasonable assurance that transactions are recorded as necessary to permit preparation of financial statements in accordance with generally accepted accounting principles, and that receipts and expenditures of the company are being made only in accordance with authorizations of management and directors of the company; and (3) provide reasonable assurance regarding prevention or timely detection of unauthorized acquisition, use, or disposition of the company’s assets that could have a material effect on the financial statements.
Because of its inherent limitations, internal control over financial reporting may not prevent or detect misstatements. Also, projections of any evaluation of effectiveness to future periods are subject to the risk that controls may become inadequate because of changes in conditions, or that the degree of compliance with the policies or procedures may deteriorate.
Deloitte LLPChartered Professional Accountants
St. John’s, Canada February 12, 2020
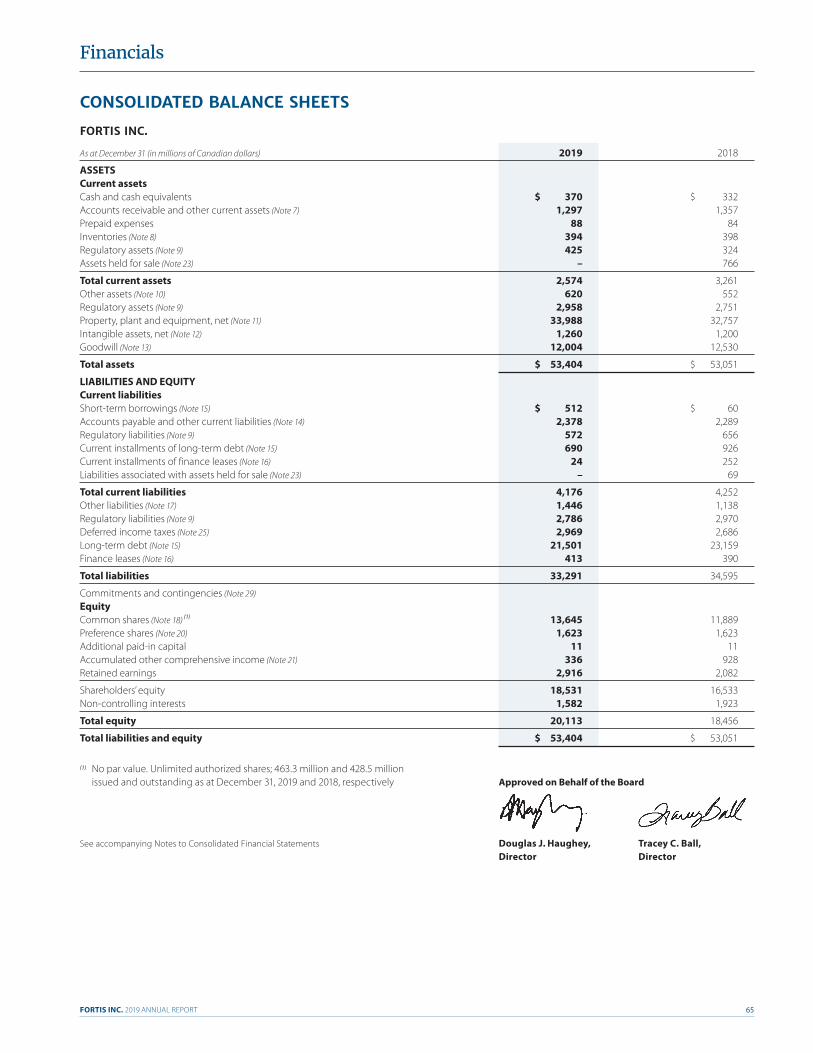
FORTIS INC. 2019 ANNUAL REPORT 65
Financials
CONSOLIDATED BALANCE SHEETS
FORTIS INC.
As at December 31 (in millions of Canadian dollars) 2019 2018
ASSETS Current assetsCash and cash equivalents $ 370 $ 332Accounts receivable and other current assets (Note 7) 1,297 1,357Prepaid expenses 88 84Inventories (Note 8) 394 398Regulatory assets (Note 9) 425 324Assets held for sale (Note 23) – 766
Total current assets 2,574 3,261Other assets (Note 10) 620 552Regulatory assets (Note 9) 2,958 2,751Property, plant and equipment, net (Note 11) 33,988 32,757Intangible assets, net (Note 12) 1,260 1,200Goodwill (Note 13) 12,004 12,530
Total assets $ 53,404 $ 53,051
LIABILITIES AND EQUITYCurrent liabilitiesShort-term borrowings (Note 15) $ 512 $ 60Accounts payable and other current liabilities (Note 14) 2,378 2,289Regulatory liabilities (Note 9) 572 656Current installments of long-term debt (Note 15) 690 926Current installments of finance leases (Note 16) 24 252Liabilities associated with assets held for sale (Note 23) – 69
Total current liabilities 4,176 4,252Other liabilities (Note 17) 1,446 1,138Regulatory liabilities (Note 9) 2,786 2,970Deferred income taxes (Note 25) 2,969 2,686Long-term debt (Note 15) 21,501 23,159Finance leases (Note 16) 413 390
Total liabilities 33,291 34,595
Commitments and contingencies (Note 29)EquityCommon shares (Note 18) (1) 13,645 11,889Preference shares (Note 20) 1,623 1,623Additional paid-in capital 11 11Accumulated other comprehensive income (Note 21) 336 928Retained earnings 2,916 2,082
Shareholders’ equity 18,531 16,533Non-controlling interests 1,582 1,923
Total equity 20,113 18,456
Total liabilities and equity $ 53,404 $ 53,051
(1) No par value. Unlimited authorized shares; 463.3 million and 428.5 million issued and outstanding as at December 31, 2019 and 2018, respectively Approved on Behalf of the Board
See accompanying Notes to Consolidated Financial Statements Douglas J. Haughey, Tracey C. Ball, Director Director
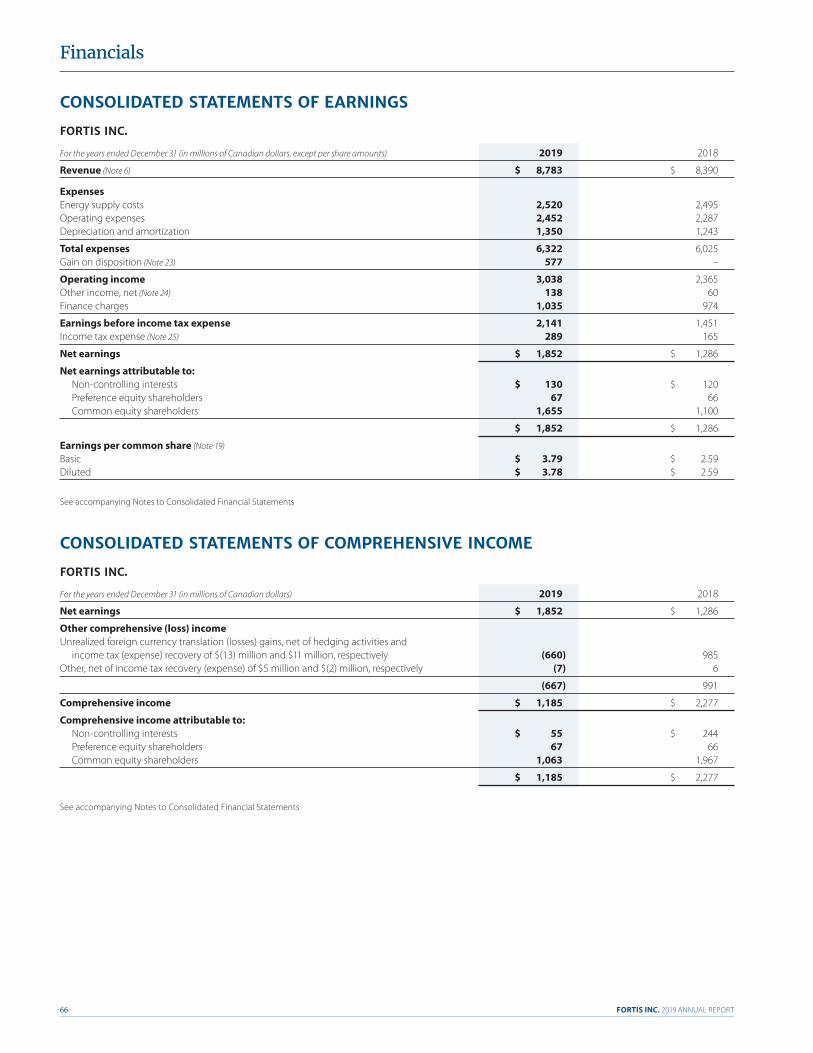
FORTIS INC. 2019 ANNUAL REPORT66
Financials
CONSOLIDATED STATEMENTS OF EARNINGS
FORTIS INC.
For the years ended December 31 (in millions of Canadian dollars, except per share amounts) 2019 2018
Revenue (Note 6) $ 8,783 $ 8,390
Expenses Energy supply costs 2,520 2,495Operating expenses 2,452 2,287Depreciation and amortization 1,350 1,243
Total expenses 6,322 6,025Gain on disposition (Note 23) 577 –
Operating income 3,038 2,365Other income, net (Note 24) 138 60Finance charges 1,035 974
Earnings before income tax expense 2,141 1,451Income tax expense (Note 25) 289 165
Net earnings $ 1,852 $ 1,286
Net earnings attributable to: Non-controlling interests $ 130 $ 120 Preference equity shareholders 67 66 Common equity shareholders 1,655 1,100
$ 1,852 $ 1,286
Earnings per common share (Note 19) Basic $ 3.79 $ 2.59Diluted $ 3.78 $ 2.59
See accompanying Notes to Consolidated Financial Statements
CONSOLIDATED STATEMENTS OF COMPREHENSIVE INCOME
FORTIS INC.
For the years ended December 31 (in millions of Canadian dollars) 2019 2018
Net earnings $ 1,852 $ 1,286
Other comprehensive (loss) incomeUnrealized foreign currency translation (losses) gains, net of hedging activities and income tax (expense) recovery of $(13) million and $11 million, respectively (660) 985Other, net of income tax recovery (expense) of $5 million and $(2) million, respectively (7) 6
(667) 991
Comprehensive income $ 1,185 $ 2,277
Comprehensive income attributable to: Non-controlling interests $ 55 $ 244 Preference equity shareholders 67 66 Common equity shareholders 1,063 1,967
$ 1,185 $ 2,277
See accompanying Notes to Consolidated Financial Statements
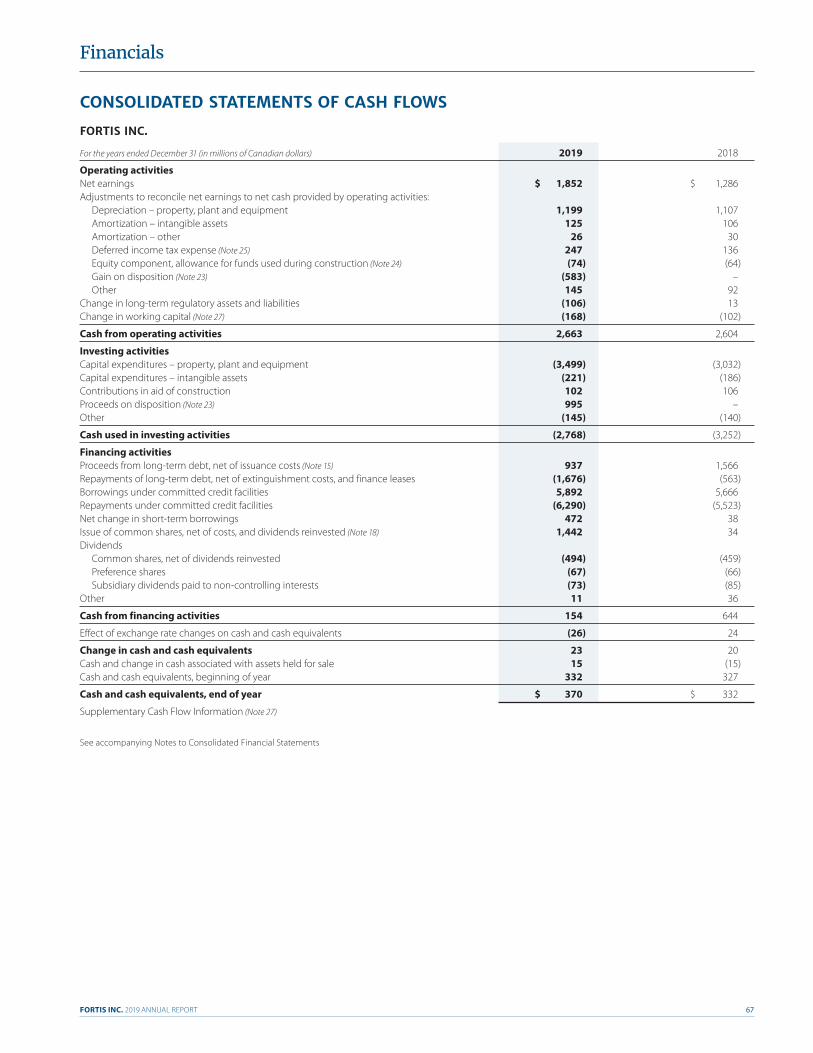
FORTIS INC. 2019 ANNUAL REPORT 67
Financials
CONSOLIDATED STATEMENTS OF CASH FLOWS
FORTIS INC.
For the years ended December 31 (in millions of Canadian dollars) 2019 2018
Operating activities Net earnings $ 1,852 $ 1,286Adjustments to reconcile net earnings to net cash provided by operating activities: Depreciation – property, plant and equipment 1,199 1,107 Amortization – intangible assets 125 106 Amortization – other 26 30 Deferred income tax expense (Note 25) 247 136 Equity component, allowance for funds used during construction (Note 24) (74) (64) Gain on disposition (Note 23) (583) – Other 145 92Change in long-term regulatory assets and liabilities (106) 13Change in working capital (Note 27) (168) (102)
Cash from operating activities 2,663 2,604
Investing activitiesCapital expenditures – property, plant and equipment (3,499) (3,032)Capital expenditures – intangible assets (221) (186)Contributions in aid of construction 102 106Proceeds on disposition (Note 23) 995 –Other (145) (140)
Cash used in investing activities (2,768) (3,252)
Financing activitiesProceeds from long-term debt, net of issuance costs (Note 15) 937 1,566Repayments of long-term debt, net of extinguishment costs, and finance leases (1,676) (563)Borrowings under committed credit facilities 5,892 5,666Repayments under committed credit facilities (6,290) (5,523)Net change in short-term borrowings 472 38Issue of common shares, net of costs, and dividends reinvested (Note 18) 1,442 34Dividends Common shares, net of dividends reinvested (494) (459) Preference shares (67) (66) Subsidiary dividends paid to non-controlling interests (73) (85)Other 11 36
Cash from financing activities 154 644
Effect of exchange rate changes on cash and cash equivalents (26) 24
Change in cash and cash equivalents 23 20Cash and change in cash associated with assets held for sale 15 (15)Cash and cash equivalents, beginning of year 332 327
Cash and cash equivalents, end of year $ 370 $ 332
Supplementary Cash Flow Information (Note 27)
See accompanying Notes to Consolidated Financial Statements
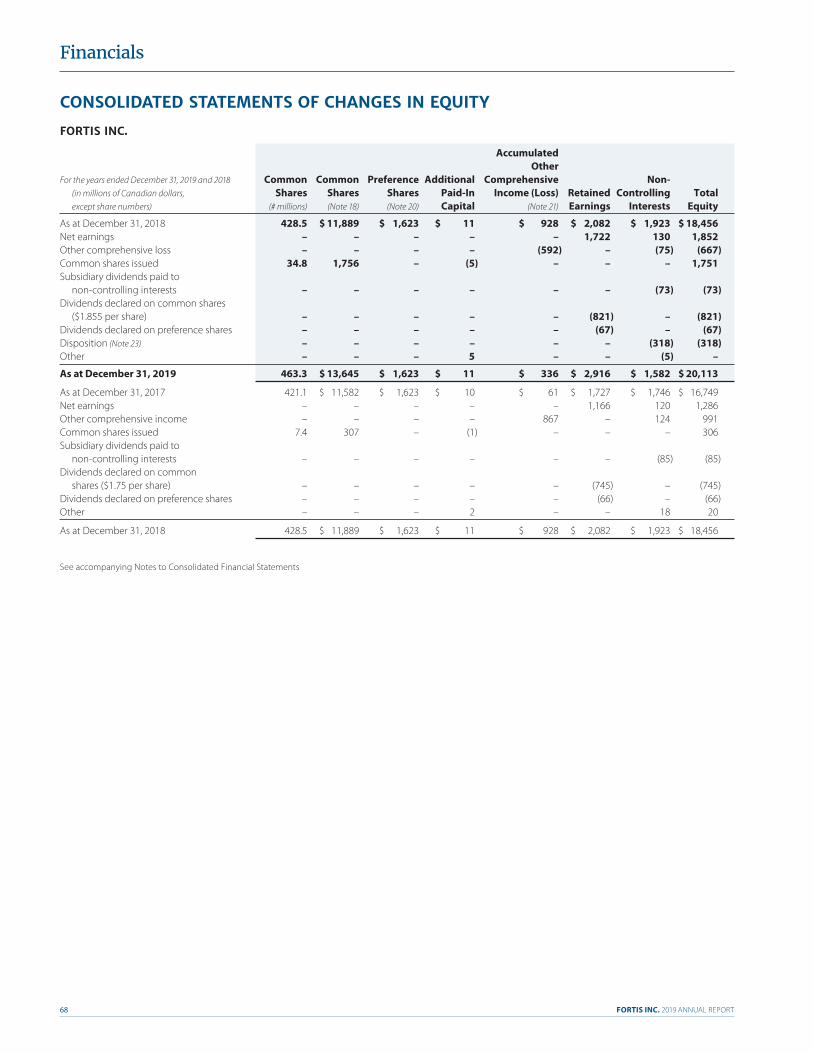
FORTIS INC. 2019 ANNUAL REPORT68
Financials
CONSOLIDATED STATEMENTS OF CHANGES IN EQUITY
FORTIS INC.
Accumulated Other For the years ended December 31, 2019 and 2018 Common Common Preference Additional Comprehensive Non- (in millions of Canadian dollars, Shares Shares Shares Paid-In Income (Loss) Retained Controlling Total except share numbers) (# millions) (Note 18) (Note 20) Capital (Note 21) Earnings Interests Equity
As at December 31, 2018 428.5 $ 11,889 $ 1,623 $ 11 $ 928 $ 2,082 $ 1,923 $ 18,456Net earnings – – – – – 1,722 130 1,852Other comprehensive loss – – – – (592) – (75) (667)Common shares issued 34.8 1,756 – (5) – – – 1,751Subsidiary dividends paid to
non-controlling interests – – – – – – (73) (73)Dividends declared on common shares
($1.855 per share) – – – – – (821) – (821)Dividends declared on preference shares – – – – – (67) – (67)Disposition (Note 23) – – – – – – (318) (318)Other – – – 5 – – (5) –
As at December 31, 2019 463.3 $ 13,645 $ 1,623 $ 11 $ 336 $ 2,916 $ 1,582 $ 20,113
As at December 31, 2017 421.1 $ 11,582 $ 1,623 $ 10 $ 61 $ 1,727 $ 1,746 $ 16,749Net earnings – – – – – 1,166 120 1,286Other comprehensive income – – – – 867 – 124 991Common shares issued 7.4 307 – (1) – – – 306Subsidiary dividends paid to
non-controlling interests – – – – – – (85) (85)Dividends declared on common
shares ($1.75 per share) – – – – – (745) – (745)Dividends declared on preference shares – – – – – (66) – (66)Other – – – 2 – – 18 20
As at December 31, 2018 428.5 $ 11,889 $ 1,623 $ 11 $ 928 $ 2,082 $ 1,923 $ 18,456
See accompanying Notes to Consolidated Financial Statements
FORTIS INC. 2019 ANNUAL REPORT 69
1. DESCRIPTION OF BUSINESS
Fortis Inc. (“Fortis” or the “Corporation”) is principally a North American regulated electric and gas utility holding company. Entities within the reporting segments that follow operate with substantial autonomy.
Regulated Utilities
ITC
Comprised of ITC Investment Holdings Inc., ITC Holdings Corp. and the electric transmission operations of its regulated operating subsidiaries, which include International Transmission Company (“ITCTransmission”), Michigan Electric Transmission Company, LLC (“METC”), ITC Midwest LLC (“ITC Midwest”), and ITC Great Plains, LLC. Fortis owns 80.1% of ITC and an affiliate of GIC Private Limited owns a 19.9% minority interest.
ITC owns and operates high-voltage transmission lines in Michigan’s lower peninsula and portions of Iowa, Minnesota, Illinois, Missouri, Kansas and Oklahoma.
UNS Energy
Comprised of UNS Energy Corporation, which primarily includes Tucson Electric Power Company (“TEP”), UNS Electric, Inc. (“UNS Electric”) and UNS Gas, Inc. (“UNS Gas”).
UNS Energy’s largest operating subsidiary, TEP, and UNS Electric are vertically integrated regulated electric utilities. They generate, transmit and distribute electricity to retail customers in southeastern Arizona, including the greater Tucson metropolitan area in Pima County and parts of Cochise County, as well as in Santa Cruz and Mohave counties. TEP also sells wholesale electricity to other entities in the western United States. Together they own generating capacity of 3,143 megawatts (“MW”), including 59 MW of solar capacity. Several generating assets in which they have an interest are jointly owned.
UNS Gas is a regulated gas distribution utility serving retail customers in Arizona’s Mohave, Yavapai, Coconino, Navajo and Santa Cruz counties.
Central Hudson
CH Energy Group, Inc., which includes primarily Central Hudson Gas & Electric Corporation. Central Hudson is a regulated electric and gas transmission and distribution utility that serves portions of New York State’s Mid-Hudson River Valley and owns gas-fired and hydroelectric generating capacity totalling 65 MW.
FortisBC Energy
Comprised of FortisBC Energy Inc., which is the largest regulated distributor of natural gas in British Columbia, providing transmission and distribution services in over 135 communities. FortisBC Energy obtains natural gas supplies primarily from northeastern British Columbia and Alberta on behalf of most customers.
FortisAlberta
FortisAlberta Inc. is a regulated electricity distribution utility operating in a substantial portion of southern and central Alberta. It is not involved in the direct sale of electricity.
FortisBC Electric
Comprised of FortisBC Inc., an integrated regulated electric utility operating in the southern interior of British Columbia. It owns four hydroelectric generating facilities with a combined capacity of 225 MW. It also provides operating, maintenance and management services relating to five hydroelectric generating facilities in British Columbia that are owned by third parties.
Other Electric
Comprised of utilities in eastern Canada and the Caribbean, as follows: Newfoundland Power Inc. (“Newfoundland Power”); Maritime Electric Company, Limited (“Maritime Electric”); FortisOntario Inc. (“FortisOntario”); a 39% equity investment in Wataynikaneyap Power Limited Partnership (“Wataynikaneyap Partnership”) (Note 10); an approximate 60% controlling interest in Caribbean Utilities Company, Ltd. (“Caribbean Utilities”); FortisTCI Limited and Turks and Caicos Utilities Limited (collectively, “FortisTCI”); and a 33% equity investment in Belize Electricity Limited (“Belize Electricity”) (Note 10).
Notes to Consolidated Financial Statements
For the years ended December 31, 2019 and 2018
For the years ended December 31, 2019 and 2018
FORTIS INC. 2019 ANNUAL REPORT70
Notes to Consolidated Financial Statements
Newfoundland Power is an integrated regulated electric utility and the principal distributor of electricity on the island portion of Newfoundland and Labrador with a generating capacity of 143 MW, of which 97 MW is hydroelectric. Maritime Electric is an integrated regulated electric utility and the principal distributor of electricity on Prince Edward Island (“PEI”) with on-Island generating capacity of 140 MW. FortisOntario is comprised of three regulated electric utilities that provide service to customers in Fort Erie, Cornwall, Gananoque, Port Colborne and the District of Algoma in Ontario with a generating capacity of 5 MW. Wataynikaneyap Partnership is a partnership between 24 First Nations communities, Fortis and Algonquin Power & Utilities Corp. with a mandate of connecting remote First Nations communities to the electricity grid in Ontario through the development of new transmission lines.
In January 2019 Fortis reduced its equity investment in Wataynikaneyap Partnership from 49% to 39% to facilitate the inclusion of two additional First Nations communities into the partnership.
Caribbean Utilities is an integrated regulated electric utility and the sole electricity provider on Grand Cayman with a diesel-powered generating capacity of 161 MW. FortisTCI is comprised of two integrated regulated electric utilities that provide electricity to certain Turks and Caicos Islands and has a diesel-powered generating capacity of 91 MW. Belize Electricity is an integrated electric utility and the principal distributor of electricity in Belize.
Non-Regulated
Energy Infrastructure
Comprised of long-term contracted generation assets in Belize and the Aitken Creek natural gas storage facility (“Aitken Creek”) in British Columbia. Generation assets in Belize consist of three hydroelectric generating facilities with a combined capacity of 51 MW, held through the Corporation’s indirectly wholly-owned subsidiary Belize Electric Company Limited (“BECOL”). The output is sold to Belize Electricity under 50-year power purchase agreements (“PPAs”). Fortis indirectly owns 93.8% of Aitken Creek, with the remainder owned by BP Canada Energy Company. Aitken Creek is the only underground natural gas storage facility in British Columbia and has a working gas capacity of 77 billion cubic feet. The long-term contracted generation assets in British Columbia, the Waneta Expansion hydroelectric generating facility (“Waneta Expansion”), were sold on April 16, 2019 (Note 23).
Corporate and Other
Captures expenses and revenues not specifically related to any reportable segment and those business operations that are below the required threshold for segmented reporting, including net corporate expenses of Fortis.
2. REGULATION
General
The earnings of the Corporation’s regulated utilities are determined under cost of service (“COS”) regulation, with some using performance-based rate setting (“PBR”) mechanisms.
Under COS regulation, the regulator sets customer rates to permit a reasonable opportunity for the timely recovery of the estimated costs of providing service, including a fair rate of return on a regulatory deemed or targeted capital structure applied to an approved regulatory asset value (“rate base”). Under PBR mechanisms, formulae are generally applied that incorporate inflation and assumed productivity improvements for a set term.
The ability to recover prudently incurred costs of providing service and earn the regulator-approved rate of return on common shareholders’ equity (“ROE”) and/or rate of return on rate base assets (“ROA”) may depend on achieving the forecasts established in the rate-setting process. There can be varying degrees of regulatory lag between when costs are incurred and when they are reflected in customer rates.
The Corporation’s regulated utilities, where applicable, are permitted by their respective regulators to flow through to customers, without markup, the cost of natural gas, fuel and/or purchased power through base customer rates and/or the use of rate stabilization and other mechanisms (Note 9).
ITC
ITC is regulated by the Federal Energy Regulatory Commission (“FERC”) under the Federal Power Act (United States). Rates are set annually, using FERC-approved cost-based formula rate templates, and remain in effect for one year, which provides timely cost recovery. An annual true-up mechanism compares actual revenue requirements to billed revenues, and any variances are accrued and reflected in future rates within a two-year period. The formula rates do not require annual FERC approvals, although inputs remain subject to legal challenge by customers with FERC. ITC’s allowed ROE ranged from 9.88% up to a maximum of 12.24% with incentive adders on a capital structure of 60% common equity for 2019 and 2018, reflecting the impact of a November 2019 order discussed below under “ROE Complaints”.
1. DESCRIPTION OF BUSINESS (cont’d)
Regulated Utilities (cont’d)
Other Electric (cont’d)
FORTIS INC. 2019 ANNUAL REPORT 71
Notes to Consolidated Financial Statements
Incentive Adder Complaint
In April 2018 a third-party complaint was filed with FERC challenging the independence incentive adders that are included in transmission rates charged by ITCTransmission, METC and ITC Midwest (collectively, “ITC’s MISO Subsidiaries”), which operate in the Midcontinent Independent System Operator (“MISO”) region. The adder allowed up to 0.50% or 1.00% to be added to the authorized ROE, subject to any ROE cap established by FERC. In October 2018 FERC issued an order reducing the adders to 0.25%, effective April 20, 2018. This equated to a 0.25% decrease in ROE, down from the approximate 0.50% that ITC was earning in rates previously approved by FERC. ITC began reflecting the 0.25% adder in transmission rates in November 2018. ITC’s MISO Subsidiaries sought rehearing of this order in 2018, which was denied by FERC. In September 2019 ITC’s MISO Subsidiaries filed an appeal in the U.S. Court of Appeal. The final resolution of this matter is not expected to have a material impact on the Corporation’s earnings or cash flows.
ROE Complaints
Two third-party complaints requested that the base ROE for MISO transmission owners, including ITC’s MISO Subsidiaries, be found to no longer be just or reasonable. The complaints cover two consecutive 15-month periods from November 2013 through February 2015 (the “Initial Refund Period” or “Initial Complaint”) and February 2015 through May 2016 (the “Second Refund Period” or “Second Complaint”).
In June 2016 the presiding Administrative Law Judge (“ALJ”) issued an initial decision on the Second Complaint, recommending a base ROE of 9.70%, up to a maximum of 10.68% with incentive adders. Pending an order from FERC, an estimated regulatory liability of $206 million (US$151 million) had been recognized as at December 31, 2018 based on the ALJ’s initial decision (Note 9).
In September 2016 FERC ordered that the base ROE for the Initial Refund Period be set at 10.32%, down from 12.38%, up to a maximum of 11.35% with incentive adders. The resultant rates applied prospectively from September 2016 until an approved ROE was established for the Second Refund Period. The total refund for the Initial Complaint as a result of the September 2016 FERC order was $158 million (US$118 million), including interest, and was paid in 2017.
In November 2019 FERC issued a decision on ITC’s ROE Complaints (“November 2019 FERC Order”), which determined that the base ROE for the Initial Complaint and from September 2016 onward be 9.88%, up to a maximum of 12.24% with incentive adders. FERC also dismissed the Second Complaint, resulting in a ROE for that period of 12.38% plus incentive adders with no refund required. In addition, as a ROE complaint had not been filed for the period of May 2016 to September 2016, the ROE for that period continued to be 12.38% plus incentive adders with no refund required. The regulated utilities in the MISO region, including ITC, sought rehearing of this order on the basis that it will not allow utilities to earn a reasonable rate of return on investment. In January 2020 FERC issued an order granting the rehearing for further consideration, effectively extending FERC’s review.
As at December 31, 2019, a regulatory liability of $91 million (US$70 million) was recognized related to the impact of the November 2019 FERC Order on the Initial Refund Period and for the period from September 2016 to December 2019 (Note 9). Additionally, the regulatory liability of $206 million (US$151 million) as at December 31, 2018 (Note 9), related to the Second Complaint, was reversed in 2019. The net impact of the November 2019 FERC Order was an increase in revenue and a decrease in interest expense resulting in an increase in net earnings of $79 million of which Fortis’ share was $63 million. The favourable impact was comprised of: (i) $83 million related to the net reversal of liabilities established in prior periods; partially offset by (ii) $20 million related to the 2019 impact of a reduced ROE.
Based on the outcome of the request for rehearing, it is possible the ROE and refunds could materially change from those recognized in 2019.
Notices of Inquiry
In March 2019 FERC issued a notice of inquiry (“NOI”) seeking comments on whether and how to improve its electric transmission incentives policy. The outcome may impact the existing incentive adders that are included in transmission rates charged by transmission owners, including ITC. Also in March 2019, FERC issued a second NOI seeking comments on whether and how recent policies concerning the determination of the base ROE for electric utilities should be modified. The comment period for both NOI proceedings has ended. The outcome may impact ITC’s future ROE and incentive adders.
UNS Energy
UNS Energy is regulated by the Arizona Corporation Commission (“ACC”) and certain activities are subject to regulation by FERC under the Federal Power Act (United States). UNS Energy uses a historical test year to establish retail electricity and gas rates.
TEP’s rates reflect an allowed ROE of 9.75% on a capital structure of approximately 50% common equity. Effective August 1, 2016, UNS Electric’s rates reflect an allowed ROE of 9.5% on a capital structure of 52.8% common equity. Effective May 1, 2012, UNS Gas’ rates reflect an allowed ROE of 9.75% on a capital structure of 50.8% common equity.
For the years ended December 31, 2019 and 2018
FORTIS INC. 2019 ANNUAL REPORT72
Notes to Consolidated Financial Statements
General Rate Application
In April 2019 TEP filed a general rate application with the ACC requesting an increase in non-fuel revenue of US$99 million, effective May 1, 2020, with electricity rates based on a 2018 historical test year. Intervenor testimony in relation to TEP’s revenue requirement and rate design was filed in October 2019. The application, adjusted for rebuttal testimony filed by TEP in November 2019, includes a request to increase TEP’s allowed ROE to 10.00% from 9.75% and the equity component of its capital structure to 53% from 50% on a rate base of US$2.7 billion. Hearings before the ALJ commenced in January and a decision is expected by mid-2020.
Central Hudson
Central Hudson is regulated by the New York State Public Service Commission (“PSC”) and certain activities are subject to regulation by FERC under the Federal Power Act (United States). Central Hudson uses a future test year to establish rates.
Pursuant to a three-year settlement agreement arising from a 2017 general rate application, Central Hudson’s rates reflect an allowed ROE of 8.8% on a capital structure of 48%, 49% and 50% common equity as of July 1, 2018, 2019 and 2020, respectively. Prior thereto, effective July 1, 2015, Central Hudson’s allowed ROE was 9.0% on a capital structure of 48% common equity.
Central Hudson is also subject to an earnings sharing mechanism whereby the Company and its customers share equally earnings between 50 and 100 basis points above the allowed ROE. Earnings beyond that are primarily returned to customers.
FortisBC Energy and FortisBC Electric
FortisBC Energy and FortisBC Electric are regulated by the British Columbia Utilities Commission (“BCUC”) pursuant to the Utilities Commission Act (British Columbia), and are subject to multi-year PBR plans whereby a going-in revenue requirement is first established and used to set initial rates and thereafter a prescribed formula is applied annually to the previous year’s rates to establish new rates for the remainder of the multi-year period.
The PBR plans for the most recent term of 2014 through 2019 incorporate incentive mechanisms for improving operating and capital expenditure efficiencies. Operation and maintenance expenses and base capital expenditures during the PBR period are subject to an incentive formula reflecting incremental costs for inflation and half of customer growth, less a fixed productivity adjustment factor of 1.1% for FortisBC Energy and 1.03% for FortisBC Electric each year. The approved PBR plans also include a 50/50 sharing of variances from the formula-driven operation and maintenance expenses and capital expenditures over the PBR period, and a number of service quality measures designed to ensure FortisBC Energy and FortisBC Electric maintain specified service levels.
FortisBC Energy is the benchmark utility in British Columbia, as designated by the BCUC, and effective January 1, 2016, its rates reflected an allowed ROE of 8.75% on a capital structure of 38.5% common equity. Effective January 1, 2016, FortisBC Electric’s rates reflected an allowed ROE of 9.15% on a capital structure of 40% common equity.
In March 2019 FortisBC Energy and FortisBC Electric filed applications with the BCUC requesting approval of a multi-year rate plan and PBR methodology for 2020–2024. A decision is expected in mid-2020.
FortisAlberta
FortisAlberta is regulated by the Alberta Utilities Commission (“AUC”) pursuant to the Electric Utilities Act (Alberta), the Public Utilities Act (Alberta), the Hydro and Electric Energy Act (Alberta) and the Alberta Utilities Commission Act (Alberta). FortisAlberta is subject to multi-year PBR plans for 2018–2022 whereby a going-in revenue requirement is first established and used to set initial rates and thereafter a prescribed formula is applied annually to the previous year’s rates to establish new rates for the remainder of the multi-year period.
The PBR plans include mechanisms for the recovery or settlement of items determined to flow through directly to customers (“Y factor”) and the recovery of costs related to capital expenditures that are not being recovered through the formula (“capital tracker” or “K-bar”). It also includes a Z factor, a PBR re-opener, and an efficiency carry-over mechanism. The Z factor permits an application for recovery of costs, subject to certain thresholds, related to significant unforeseen events. The PBR re-opener permits, subject to certain thresholds, an application to re-open and review the PBR plan to address specific problems with its design or operation. The efficiency carry-over mechanism provides an efficiency incentive by permitting the Company to continue to benefit from any efficiency gains achieved during the PBR term for two years following the end of that term.
Pursuant to generic cost of capital proceedings completed in 2018, FortisAlberta’s rates reflect an allowed ROE of 8.5% on a capital structure of 37% common equity for 2018–2020, unchanged from 2017.
2. REGULATION (cont’d)
UNS Energy (cont’d)

FORTIS INC. 2019 ANNUAL REPORT 73
Notes to Consolidated Financial Statements
Second-Term Performance-Based Rate-Setting Proceeding
The AUC has ongoing proceedings to review regulatory applications for rebasing inputs included in PBR rates for 2018–2022, including anomaly-related adjustments and approved changes to depreciation parameters.
In January 2020 the AUC issued two decisions: (i) confirming that changes to depreciation parameters will be incorporated into incremental funding mechanisms; and (ii) establishing new criteria for anomaly-related adjustments. PBR utilities in Alberta are permitted to file depreciation studies by July 2020 and were required to submit their intent to file an anomaly-related adjustment application by February 7, 2020. FortisAlberta does not anticipate filing a depreciation study in 2020 and did notify the AUC of its intent to file an anomaly-related adjustment application.
Generic Cost of Capital Proceeding
In December 2018 the AUC initiated a generic cost of capital proceeding to consider a formula-based approach to setting the allowed ROE beginning in 2021 and whether any process changes are necessary for determining capital structure in years in which a ROE formula is in place. In April 2019 the AUC determined that a traditional non-formulaic approach for assessing ROE and deemed capital structure would be used in 2021, with consideration of a formula-based approach for determining the allowed ROE for 2022 and subsequent years. Expert evidence was filed in January 2020 with an oral hearing scheduled for April 2020. An AUC decision is expected later in 2020.
2018 Alberta Independent System Operator Tariff Application
In September 2019 the AUC issued a decision that addressed, among other things, a proposal to change how the Alberta Electric System Operator’s customer contribution policy is accounted for between distribution facility owners, such as FortisAlberta, and transmission facility owners (“TFO”). The decision prevents any future investment by FortisAlberta under the policy and directs that the unamortized customer contributions of approximately $400 million as at December 31, 2017, which form part of FortisAlberta’s rate base, be transferred to the incumbent TFO in FortisAlberta’s service area.
In October 2019 FortisAlberta filed evidence to oppose the decision. Implementation of the order has been suspended and the decision remains under review by the AUC. It is expected that the decision will remain under review through the first quarter of 2020. The likely outcome of this process and potential impacts, if any, cannot be determined at this time.
Other Electric
Newfoundland Power is regulated by the Newfoundland and Labrador Board of Commissioners of Public Utilities under the Public Utilities Act (Newfoundland and Labrador) and uses a future test year to establish rates. Effective 2019 to 2020, and consistent with 2018, Newfoundland Power’s rates reflect an allowed ROE of 8.5% on a capital structure of 45% common equity.
Maritime Electric is regulated by the Island Regulatory and Appeals Commission under the provisions of the Electric Power Act (PEI), the Renewable Energy Act (PEI) and the Electric Power (Electricity Rate-Reduction) Amendment Act (PEI), and uses a future test year to establish rates. Effective March 1, 2019 for a three-year period, and consistent with 2018, Maritime Electric’s rates reflect an allowed ROE of 9.35% on a capital structure of 40% common equity.
FortisOntario’s three electric utilities are regulated by the Ontario Energy Board under the Electricity Act (Ontario) and the Ontario Energy Board Act (Ontario). Two of FortisOntario’s utilities use a future test year to establish rates under five-year PBR plans whereby a going-in revenue requirement is first established and used to set initial rates and thereafter a prescribed formula using inflationary factors less an efficiency target is applied annually to the previous year’s rates to establish new rates for the remainder of the five-year period. The allowed ROEs ranged from 8.78% to 9.30% for both 2019 and 2018, on a capital structure of 40% common equity. FortisOntario’s remaining utility is subject to a 35-year franchise agreement, expiring in 2033, whereby rates are based on a price cap with commodity cost flow through and with the base revenue requirement adjusted annually for inflation, load growth and customer growth.
Caribbean Utilities operates under licences from the Government of the Cayman Islands. Its exclusive transmission and distribution licence is for an initial 20-year period, expiring in April 2028, with a provision for automatic renewal. Its non-exclusive generation licence is for a 25-year term, expiring in November 2039. It is regulated under a rate-cap adjustment mechanism based on published consumer price indices. The licences detail the role of the Cayman Islands Utility Regulation and Competition Office, which oversees all licences, establishes and enforces licence standards, reviews the rate-cap adjustment mechanism, and annually approves capital expenditures. Its allowed ROA for 2019 was in the range of 7.50% to 9.50% (7.00% to 9.00% for 2018).
FortisTCI operates under 50-year licences from the Government of the Turks and Caicos Islands, which expire in 2036 and 2037. Rates reflect a historical test year and a targeted allowed ROA of between 15.0% and 17.5% (the “Allowable Operating Profit”). The Allowable Operating Profit is based on a calculated rate base, including interest on the cumulative amount by which actual operating profits fall short of the Allowable Operating Profit (the “Cumulative Shortfall”). The calculated Allowable Operating Profit and Cumulative Shortfall are submitted to the Government annually. The recovery of the Cumulative Shortfall is dependent on future sales volumes and expenses. The achieved ROAs at the utilities have been significantly lower than those allowed as a result of the inability, due to economic and political factors, to increase rates to support significant capital investment in recent years.
For the years ended December 31, 2019 and 2018
FORTIS INC. 2019 ANNUAL REPORT74
Notes to Consolidated Financial Statements
3. SUMMARY OF SIGNIFICANT ACCOUNTING POLICIES
Basis of Presentation
These consolidated financial statements have been prepared and presented in accordance with accounting principles generally accepted in the United States of America (“US GAAP”) for rate-regulated entities, and are in Canadian dollars unless otherwise indicated.
These consolidated financial statements include the accounts of the Corporation and its subsidiaries, and a controlled variable interest entity up to the date of its disposition on April 16, 2019 (Note 23). They reflect the equity method of accounting for entities in which Fortis has significant influence, but not control, and proportionate consolidation for assets that are jointly owned with non-affiliated entities. Intercompany transactions have been eliminated, except for transactions between non-regulated and regulated entities in accordance with US GAAP for rate-regulated entities.
Cash and Cash Equivalents
Cash and cash equivalents include cash, cash held in margin accounts, and short-term deposits with initial maturities of three months or less from the date of deposit.
Allowance for Doubtful Accounts
Fortis and each subsidiary, other than ITC, maintain an allowance for doubtful accounts that is estimated based on a variety of factors, including receivables aging, historical experience, specific events such as customer bankruptcy and economic conditions. ITC recognizes losses for uncollectible accounts based upon their specific identification. Accounts receivable are written off in the period in which they are deemed uncollectible.
Inventories
Inventories, consisting of materials and supplies, gas, fuel and coal in storage, are measured at the lower of weighted average cost and net realizable value.
Regulatory Assets and Liabilities
Regulatory assets and liabilities arise as a result of the utility rate-setting process and are subject to regulatory approval. Regulatory assets represent future revenues and/or receivables associated with certain costs incurred that will be, or are expected to be, recovered from customers in future periods through the rate-setting process. Regulatory liabilities represent: (i) future reductions or limitations of increases in revenue associated with amounts that will be, or are expected to be, refunded to customers through the rate-setting process; or (ii) an obligation to provide future service that customers have paid for in advance.
Certain remaining recovery and settlement periods are those expected by management and the actual periods could differ based on regulatory approval.
Investments
Investments accounted for using the equity method are reviewed annually for potential impairment in value. Impairments are recognized when identified.
Property, Plant and Equipment
Property, plant and equipment (“PPE”) are recognized at cost less accumulated depreciation. Contributions in aid of construction by customers and governments are recognized as a reduction in the cost of, and are amortized in a manner consistent with, the related PPE.
Depreciation rates of the Corporation’s regulated utilities include a provision for estimated future asset removal costs not identified as a legal obligation. The provision is recognized as a long-term regulatory liability (Note 9) against which actual asset removal costs are netted when incurred.
Most of the Corporation’s regulated utilities derecognize PPE on disposal or when no future economic benefits are expected from their use. Upon derecognition, any difference between cost and accumulated depreciation, net of salvage proceeds, is charged to accumulated depreciation. No gain or loss is recognized.
Through methodologies established by their respective regulators, the Corporation’s regulated utilities capitalize: (i) overhead costs that are not directly attributable to specific PPE but relate to the overall capital expenditure plan; and (ii) an allowance for funds used during construction (“AFUDC”). The debt component of AFUDC totalling $40 million (2018 – $31 million) is reported as a reduction of finance charges and the equity component is reported as other income (Note 24). Both components are charged to earnings through depreciation expense over the estimated service lives of the applicable PPE.
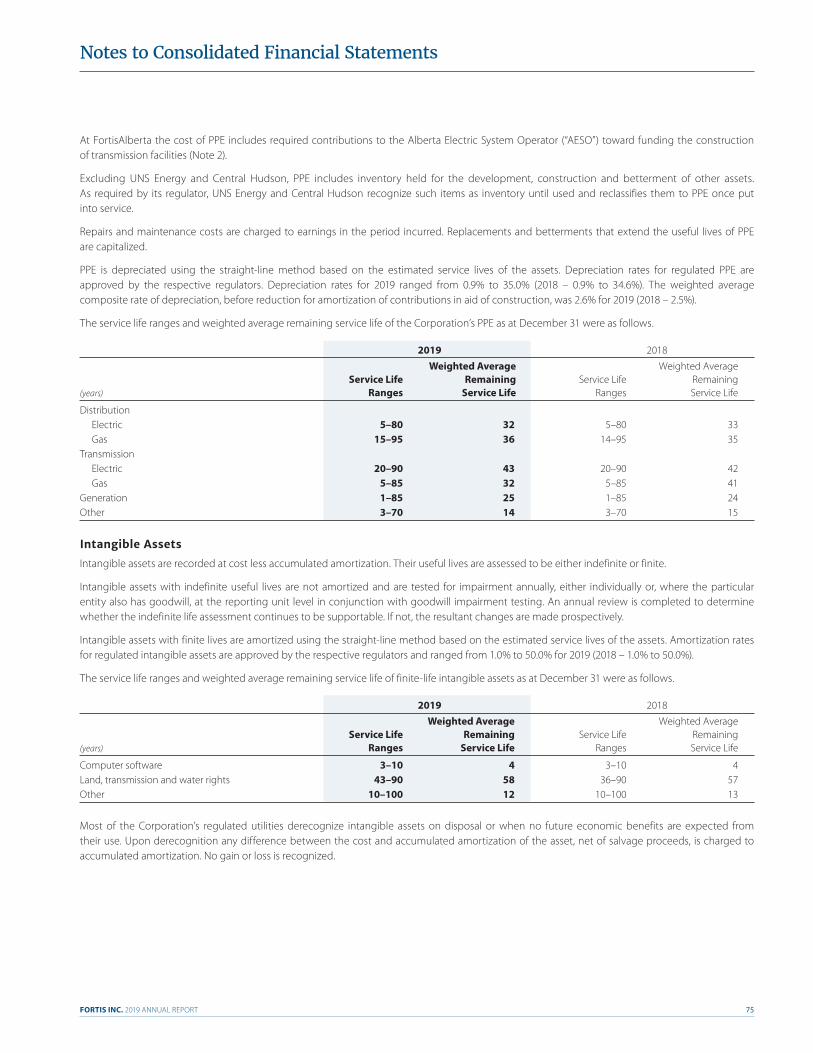
FORTIS INC. 2019 ANNUAL REPORT 75
Notes to Consolidated Financial Statements
At FortisAlberta the cost of PPE includes required contributions to the Alberta Electric System Operator (“AESO”) toward funding the construction of transmission facilities (Note 2).
Excluding UNS Energy and Central Hudson, PPE includes inventory held for the development, construction and betterment of other assets. As required by its regulator, UNS Energy and Central Hudson recognize such items as inventory until used and reclassifies them to PPE once put into service.
Repairs and maintenance costs are charged to earnings in the period incurred. Replacements and betterments that extend the useful lives of PPE are capitalized.
PPE is depreciated using the straight-line method based on the estimated service lives of the assets. Depreciation rates for regulated PPE are approved by the respective regulators. Depreciation rates for 2019 ranged from 0.9% to 35.0% (2018 – 0.9% to 34.6%). The weighted average composite rate of depreciation, before reduction for amortization of contributions in aid of construction, was 2.6% for 2019 (2018 – 2.5%).
The service life ranges and weighted average remaining service life of the Corporation’s PPE as at December 31 were as follows.
2019 2018
Weighted Average Weighted Average Service Life Remaining Service Life Remaining (years) Ranges Service Life Ranges Service Life
Distribution Electric 5–80 32 5–80 33 Gas 15–95 36 14–95 35Transmission Electric 20–90 43 20–90 42 Gas 5–85 32 5–85 41Generation 1–85 25 1–85 24Other 3–70 14 3–70 15
Intangible Assets
Intangible assets are recorded at cost less accumulated amortization. Their useful lives are assessed to be either indefinite or finite.
Intangible assets with indefinite useful lives are not amortized and are tested for impairment annually, either individually or, where the particular entity also has goodwill, at the reporting unit level in conjunction with goodwill impairment testing. An annual review is completed to determine whether the indefinite life assessment continues to be supportable. If not, the resultant changes are made prospectively.
Intangible assets with finite lives are amortized using the straight-line method based on the estimated service lives of the assets. Amortization rates for regulated intangible assets are approved by the respective regulators and ranged from 1.0% to 50.0% for 2019 (2018 – 1.0% to 50.0%).
The service life ranges and weighted average remaining service life of finite-life intangible assets as at December 31 were as follows.
2019 2018
Weighted Average Weighted Average Service Life Remaining Service Life Remaining (years) Ranges Service Life Ranges Service Life
Computer software 3–10 4 3–10 4Land, transmission and water rights 43–90 58 36–90 57Other 10–100 12 10–100 13
Most of the Corporation’s regulated utilities derecognize intangible assets on disposal or when no future economic benefits are expected from their use. Upon derecognition any difference between the cost and accumulated amortization of the asset, net of salvage proceeds, is charged to accumulated amortization. No gain or loss is recognized.
For the years ended December 31, 2019 and 2018
FORTIS INC. 2019 ANNUAL REPORT76
Notes to Consolidated Financial Statements
Impairment of Long-Lived Assets
The Corporation reviews the valuation of PPE, intangible assets with finite lives, and other long-term assets when events or changes in circumstances indicate that the carrying value may not exceed the total undiscounted cash flows expected to be generated by the asset. If that is determined to be the case, the asset is written down to estimated fair value and an impairment loss is recognized.
Goodwill
Goodwill represents the excess of the purchase price over the fair value of the identifiable net assets related to business acquisitions.
Impairment testing is performed if an event or change in circumstances indicates that the fair value of a reporting unit may be below its carrying value. If so determined, goodwill is written down to estimated fair value and an impairment loss is recognized.
Otherwise, Fortis performs an annual assessment for each of the 11 reporting units having goodwill. The Corporation performs a qualitative assessment for certain reporting units and if it is determined that it is not likely that fair value is less than carrying value then a quantitative estimate of the fair value is not required. Otherwise, the primary method for estimating the fair value of the reporting units is the income approach, whereby net cash flow projections are discounted using an enterprise value method. Underlying estimates and assumptions, with varying degrees of uncertainty, include the amount and timing of expected future cash flows, growth rates, and discount rates.
A secondary valuation method, the market approach along with a reconciliation of the total estimated fair value of all reporting units to the Corporation’s market capitalization, is also performed and evaluated.
Deferred Financing Costs
Issue costs, discounts and premiums are recognized against, and amortized over the life of, the related long-term debt.
Employee Future Benefits
Fortis and each subsidiary maintain one or a combination of defined benefit pension plans and defined contribution pension plans, as well as other post-employment benefit (“OPEB”) plans, including certain health and dental coverage and life insurance benefits, for qualifying members. The costs of defined contribution pension plans are expensed as incurred.
For defined benefit pension and OPEB plans, the projected or accumulated benefit obligation and net benefit costs are actuarially determined using the projected benefits method prorated on service and management’s best estimate of expected plan investment performance, salary escalation, retirement ages of employees and, for OPEB plans, expected health care costs. Discount rates reflect market interest rates on high-quality bonds with cash flows that match the timing and amount of expected pension or OPEB payments.
Defined benefit pension and OPEB plan assets are recognized at fair value. For the purpose of determining defined benefit pension cost, FortisBC Energy and Newfoundland Power use the market-related value whereby investment returns in excess of, or below, expected returns are recognized in the asset value over a period of three years.
The excess of any cumulative net actuarial gain or loss over 10% of the greater of: (i) the projected or accumulated benefit obligation; and (ii) the fair value or market-related value, as applicable, of plan assets at the beginning of the fiscal year, along with unamortized past service costs, are deferred and amortized over the average remaining service period of active employees.
The net funded or unfunded status of defined benefit pension and OPEB plans, measured as the difference between the fair value of the plan assets and the projected or accumulated benefit obligation, is recognized on the Corporation’s consolidated balance sheets.
For most of the Corporation’s regulated utilities, any difference between defined benefit pension or OPEB plan costs ordinarily recognized under US GAAP and those recovered from customers in current rates is subject to deferral account treatment and is expected to be recovered from, or refunded to, customers in future rates (Note 9).
For most of the Corporation’s regulated utilities, any unamortized balances related to net actuarial gains and losses, past service costs and transitional obligations associated with defined benefit pension or OPEB plans, as applicable, which would otherwise be recognized in accumulated other comprehensive income, are subject to deferral account treatment (Note 9).
Revenue Recognition
Most revenue is derived from energy sales and the provision of transmission services to customers based on regulator-approved tariff rates. Most contracts have a single performance obligation, being the delivery of energy or the provision of transmission services. No component of the transaction price is allocated to unsatisfied performance obligations. Revenue is generally measured in kilowatt hours, gigajoules or transmission load delivered. The billing of energy sales is based on customer meter readings, which occur systematically throughout each month. The billing of transmission services at ITC is based on peak monthly load.
3. SUMMARY OF SIGNIFICANT ACCOUNTING POLICIES (cont’d)
FORTIS INC. 2019 ANNUAL REPORT 77
Notes to Consolidated Financial Statements
FortisAlberta is a distribution company and is required by its regulator to arrange and pay for transmission services with the AESO. This includes the collection of transmission revenue from its customers, which occurs through the transmission component of its regulator-approved rates. FortisAlberta reports transmission revenue and expenses on a net basis.
Electricity, gas and transmission service revenue includes an estimate for unbilled energy consumed or service provided since the last meter reading that has not been billed at the end of the reporting period. Sales estimates generally reflect an analysis of historical consumption in relation to key inputs, such as current energy prices, population growth, economic activity, weather conditions and system losses. Unbilled revenue accruals are adjusted in the periods actual consumption becomes known.
Generation revenue from non-regulated operations is recognized on delivery at contracted fixed or market rates.
Variable consideration is estimated at the most likely amount and reassessed at each reporting date until the amount is known. Variable consideration, including amounts subject to a future regulatory decision, is recognized as a refund liability until entitlement is certain.
Revenue excludes sales and municipal taxes collected from customers.
The Corporation has elected not to assess or account for any significant financing components associated with revenue billed in accordance with equal payment plans as the period between the transfer of energy to customers and the customers’ payment is less than one year.
Revenue is disaggregated by geography, regulatory status, and substantially autonomous utility operations (Note 6). This represents the level of disaggregation used by the Corporation’s President and Chief Executive Officer (“CEO”) to allocate resources and evaluate performance.
Stock-Based Compensation
Compensation expense related to stock options is measured at the grant date using the Black-Scholes fair value option-pricing model and each grant is amortized to compensation expense as a single award evenly over the four-year vesting period, with the offsetting entry to additional paid-in capital.
Fortis satisfies stock option exercises by issuing common shares from treasury. Upon exercise, proceeds are credited to capital stock at the option prices and the fair value of the options, as previously recognized, is reclassified from additional paid-in capital to capital stock.
Fortis recognizes liabilities associated with its Directors’ Deferred Share Unit (“DSU”), Performance Share Unit (“PSU”) and Restricted Share Unit (“RSU”) Plans, all representing cash-settled awards, at fair value at each reporting date until settlement. The fair value of these liabilities is based on the five-day volume weighted average price (“VWAP”) of the Corporation’s common shares at the end of each reporting period. The VWAP as at December 31, 2019 was $53.97 (December 31, 2018 – $45.14). The fair value of the PSU liability is also based on the expected payout probability, based on historical performance in accordance with the defined metrics of each grant and management’s best estimate.
Compensation expense is recognized on a straight-line basis over the vesting period, which for the PSU and RSU Plans is over the lesser of three years or the period to retirement eligibility and for the DSU Plan is at the time of grant. Forfeitures are accounted for as they occur.
Foreign Currency Translation
Assets and liabilities of the Corporation’s foreign operations, all of which have a US dollar functional currency, are translated at the exchange rate in effect at the balance sheet date and the resultant unrealized translation gains and losses are recognized in accumulated other comprehensive income. The exchange rate as at December 31, 2019 was US$1.00=CAD$1.30 (December 31, 2018 – US$1.00=CAD$1.36).
Revenue and expenses of the Corporation’s foreign operations are translated at the average exchange rate for the reporting period, which was US$1.00=CAD$1.33 for 2019 (2018 – US$1.00=CAD$1.30).
Monetary assets and liabilities denominated in foreign currencies are translated at the exchange rate prevailing at the balance sheet date. Revenue and expenses denominated in foreign currencies are translated at the exchange rate prevailing at the transaction date. Translation gains and losses are recognized in earnings.
Translation gains and losses on foreign currency-denominated debt that is designated as an effective hedge of foreign net investments are recognized in other comprehensive income.
Derivatives and Hedging
Derivatives Not Designated as Hedges
Derivatives not designated as hedges are used by: (i) Fortis, to manage cash flow risk associated with forecast US dollar cash inflows and forecast future cash settlements of DSU, PSU and RSU obligations; (ii) UNS Energy, to meet forecast load and reserve requirements; and (iii) Aitken Creek, to manage commodity price risk, capture natural gas price spreads, and manage the financial risk of physical transactions. These derivatives are measured at fair value with changes thereto recognized in earnings.
For the years ended December 31, 2019 and 2018
FORTIS INC. 2019 ANNUAL REPORT78
Notes to Consolidated Financial Statements
Derivatives not designated as hedges are also used by UNS Energy, Central Hudson and FortisBC Energy to reduce energy price risk associated with purchased power and gas requirements. The settled amounts of these derivatives are generally included in regulated rates, as permitted by the respective regulators. These derivatives are measured at fair value with changes thereto recognized as regulatory assets or liabilities for recovery from, or refund to, customers in future rates (Note 9).
Derivatives that meet the normal purchase or normal sale scope exception are not measured at fair value and settled amounts are recognized in earnings as energy supply costs.
Derivatives Designated as Hedges
The Corporation, ITC and UNS Energy use cash flow hedges to manage interest rate risk. Unrealized gains and losses are initially recognized in accumulated other comprehensive income and reclassified to earnings when the underlying hedged transaction affects earnings. Any hedge ineffectiveness is immediately recognized in earnings.
The Corporation’s earnings from, and net investments in, foreign subsidiaries and equity-accounted investments are exposed to fluctuations in the US dollar-to-Canadian dollar exchange rate. The Corporation has hedged a portion of this exposure through US dollar-denominated debt at the corporate level. Exchange rate fluctuations associated with the translation of this debt and the foreign net investments are recognized in accumulated other comprehensive income.
Presentation of Derivatives
The fair values of derivatives are recognized as current or long-term assets and liabilities depending on the timing of settlements and resulting cash flows. Derivatives under master netting agreements and collateral positions are presented on a gross basis. Cash flows associated with the settlement of all derivatives are presented in operating activities in the consolidated statements of cash flows.
Income Taxes
The Corporation and its taxable subsidiaries follow the asset and liability method of accounting for income taxes. Current income tax expense or recovery is recognized for the estimated income taxes payable or receivable in the current year.
Deferred income tax assets and liabilities are recognized for temporary differences between the tax and accounting basis of assets and liabilities, as well as for the benefit of losses available to be carried forward to future years for tax purposes that are “more likely than not” to be realized. They are measured using enacted income tax rates and laws in effect when the temporary differences are expected to be recovered or settled. The effect of a change in income tax rates on deferred income tax assets and liabilities is recognized in earnings in the period when the change occurs. Valuation allowances are recognized when it is “more likely than not” that all, or a portion of, a deferred income tax asset will not be realized.
Customer rates at ITC, UNS Energy, Central Hudson and Maritime Electric reflect current and deferred income tax. Customer rates at FortisAlberta reflect current income tax. Customer rates at FortisBC Energy, FortisBC Electric, Newfoundland Power and FortisOntario reflect current income tax and, for certain regulatory balances, deferred income tax. Caribbean Utilities, FortisTCI and, for the 50-year term of its PPAs, BECOL are not subject to income tax.
Differences between the income tax expense or recovery recognized under US GAAP and that reflected in current customer rates, which is expected to be recovered from, or refunded to, customers in future rates, are recognized as regulatory assets or liabilities (Note 9).
At FortisAlberta the capital cost allowance pool for certain PPE for rate-setting purposes is different from that prescribed for Canadian tax filing purposes. In a future reporting period yet to be determined, the difference may result in reported income tax expense exceeding that reflected in customer rates.
Fortis does not recognize deferred income taxes on temporary differences related to investments in foreign subsidiaries where it intends to indefinitely reinvest earnings. The difference between the carrying values of these foreign investments and their tax bases, resulting from unrepatriated earnings and currency translation adjustments, is approximately $2.8 billion as at December 31, 2019 (December 31, 2018 – $2.3 billion). If such earnings are repatriated, the Corporation may be subject to income taxes and foreign withholding taxes. The determination of the amount of unrecognized deferred income tax liabilities on such amounts is impractical.
Tax benefits associated with actual or expected income tax positions are recognized when the “more likely than not” recognition threshold is met. The tax benefits are measured at the largest amount of benefit that is greater than 50% likely to be realized upon settlement.
Income tax interest and penalties are recognized as income tax expense when incurred.
3. SUMMARY OF SIGNIFICANT ACCOUNTING POLICIES (cont’d)
Derivatives and Hedging (cont’d)
Derivatives Not Designated as Hedges (cont’d)
FORTIS INC. 2019 ANNUAL REPORT 79
Notes to Consolidated Financial Statements
Asset Retirement Obligations
The Corporation’s subsidiaries have asset retirement obligations (“AROs”) associated with certain generation, transmission, distribution and interconnection assets, including land and environmental remediation and/or asset removal. These assets and related licences, permits, right-of-ways and agreements are reasonably expected to effectively exist and operate in perpetuity due to their nature. Consequently, where the final date and cost of remediation and/or removal of the noted assets cannot be reasonably determined, AROs have not been recognized.
Otherwise, AROs are recognized at fair value in the period incurred as an increase in PPE and long-term other liabilities (Note 17) if a reasonable estimate of fair value can be determined. Fair value is estimated as the present value of expected future cash outlays, discounted at a credit-adjusted risk-free interest rate. The increase in the liability due to the passage of time is recognized through accretion and the capitalized cost is depreciated over the useful life of the asset. Accretion and depreciation expense are deferred as a regulatory asset or liability based on regulatory recovery of these costs. Actual settlement costs are recognized as a reduction in the accrued liability.
Contingencies
Fortis and its subsidiaries are subject to various legal proceedings and claims that arise in the normal course of business. Management makes judgments regarding the future outcome of contingent events and recognizes a loss based on its best estimate when it is determined that such loss, or range of loss, is probable and can be reasonably estimated. Legal fees are expensed as incurred. When a loss is recoverable in future rates, a regulatory asset is also recognized.
Management regularly reviews current information to determine whether recognized provisions should be adjusted and new provisions are required. However, estimating probable losses requires considerable judgment about potential actions by third parties and matters are often resolved over long periods of time. Actual outcomes may differ materially from the amounts recognized.
New Accounting Policies
Leases
Effective January 1, 2019, the Corporation adopted Accounting Standards Update (“ASU”) No. 2016-02, Leases, that requires lessees to recognize a right-of-use asset and lease liability for all leases with a lease term greater than 12 months, along with additional disclosures (Note 16).
At lease inception, the right-of-use asset and liability are both measured at the present value of future lease payments, excluding variable payments that are based on usage or performance. Future lease payments include both lease components (e.g., rent, real estate taxes and insurance costs) and non-lease components (e.g., common area maintenance costs), which Fortis accounts for as a single lease component. The present value is calculated using the rate implicit in the lease or a lease-specific secured interest rate based on the remaining lease term. Renewal options are included in the lease term when it is reasonably certain that the option will be exercised.
Finance leases are depreciated over the lease term, except where: (i) ownership of the asset is transferred at the end of the lease term, in which case depreciation is over the estimated service life of the underlying asset; and (ii) the regulator has approved a different recovery methodology for rate-setting purposes, in which case the timing of the expense recognition will conform to the regulator’s requirements.
Fortis applied the transition provisions of the new standard as of the adoption date and did not retrospectively adjust prior periods in accordance with the modified retrospective approach. Fortis elected a package of implementation options, referred to as practical expedients, that allowed it to not reassess: (i) whether existing contracts, including land easements, are or contain a lease; (ii) the classification of existing leases; or (iii) the initial direct costs for existing leases. Fortis also utilized the hindsight practical expedient to determine the lease term. Upon adoption, Fortis did not identify or record an adjustment to the opening balance of retained earnings, and there was no impact on net earnings or cash flows.
Hedging
Effective January 1, 2019, the Corporation adopted ASU No. 2017-12, Targeted Improvements to Accounting for Hedging Activities, which better aligns risk management activities and financial reporting for hedging relationships through changes to designation, measurement, presentation and disclosure guidance. Adoption did not have a material impact on the consolidated financial statements and related disclosures.
Fair Value Measurement Disclosures
Effective January 1, 2019, the Corporation adopted ASU No. 2018-13, Changes to the Disclosure Requirements for Fair Value Measurement, which improves the effectiveness of financial statement note disclosures by clarifying what is required and important to users of the financial statements. The adoption of this ASU removed the following disclosures for all periods presented: (i) the amount of, and reasons for, transfers between level 1 and level 2 of the fair value hierarchy; (ii) the policy for the timing of transfers between levels; and (iii) the valuation processes for level 3 fair value measurements.
For the years ended December 31, 2019 and 2018
FORTIS INC. 2019 ANNUAL REPORT80
Notes to Consolidated Financial Statements
Pensions and Other Post-Retirement Plan Disclosures
Effective December 31, 2019, the Corporation early adopted, on a retrospective basis, ASU No. 2018-14, Changes to the Disclosure Requirements for Defined Benefit Plans, which modifies the disclosure requirements for employers with defined pension or other post-retirement plans and clarifies disclosure requirements. In particular, it removed the following disclosures: (i) the amounts in accumulated other comprehensive income expected to be recognized as components of net period benefit costs over the next fiscal period; and (ii) the effects of a one-percentage-point change on the assumed health care costs and the change in rates on service cost, interest cost and the benefit obligation for post-retirement health care benefits (Note 26).
Use of Accounting Estimates
The preparation of these consolidated financial statements in accordance with US GAAP requires management to make estimates and judgments, including those arising from matters dependent upon the finalization of regulatory proceedings, that affect the reported amounts of assets, liabilities, revenues, expenses, gains and losses. Management evaluates these estimates on an ongoing basis based upon historical experience, current conditions, and assumptions believed to be reasonable at the time they are made, with any adjustments being recognized in the period they become known. Actual results may differ significantly from these estimates.
4. FUTURE ACCOUNTING PRONOUNCEMENTS
Income Taxes
ASU No. 2019-12, Simplifying the Accounting for Income Taxes, issued in December 2019, is effective for Fortis January 1, 2021, with early adoption permitted. Principally, it improves consistent application of, and clarifies, existing income tax guidance. Fortis is assessing the impact that adoption will have on its consolidated financial statements.
5. SEGMENTED INFORMATION
General
Fortis segments its business based on regulatory status, service territory, and the information used by its President and CEO in deciding how to allocate resources. Segment performance is evaluated primarily on net earnings attributable to common equity shareholders.
Related-Party and Inter-Company Transactions
Related-party transactions are in the normal course of operations and are measured at the amount of consideration agreed to by the related parties. There were no material related-party transactions in 2019 or 2018.
Inter-company balances, transactions and profit are eliminated on consolidation, except for certain inter-company transactions between non-regulated and regulated entities in accordance with accounting standards for rate-regulated entities, which are summarized below.
(in millions) 2019 2018
Sale of capacity from Waneta Expansion to FortisBC Electric (1) $ 17 $ 47Lease of gas storage capacity and gas sales from Aitken Creek to FortisBC Energy 23 25(1) Reflects amounts to the April 16, 2019 disposition of the Waneta Expansion (Note 23)
As at December 31, 2019, accounts receivable included approximately $8 million due from Belize Electricity (December 31, 2018 – $16 million).
The Corporation periodically provides short-term financing to subsidiaries to support capital expenditures, acquisitions and seasonal working capital requirements. As at December 31, 2019, there were inter-segment loans outstanding of $279 million (December 31, 2018 – $nil), payable on demand with a weighted average interest rate of 2.48%. Total interest charged in 2019 was $2 million.
3. SUMMARY OF SIGNIFICANT ACCOUNTING POLICIES (cont’d)
New Accounting Policies (cont’d)
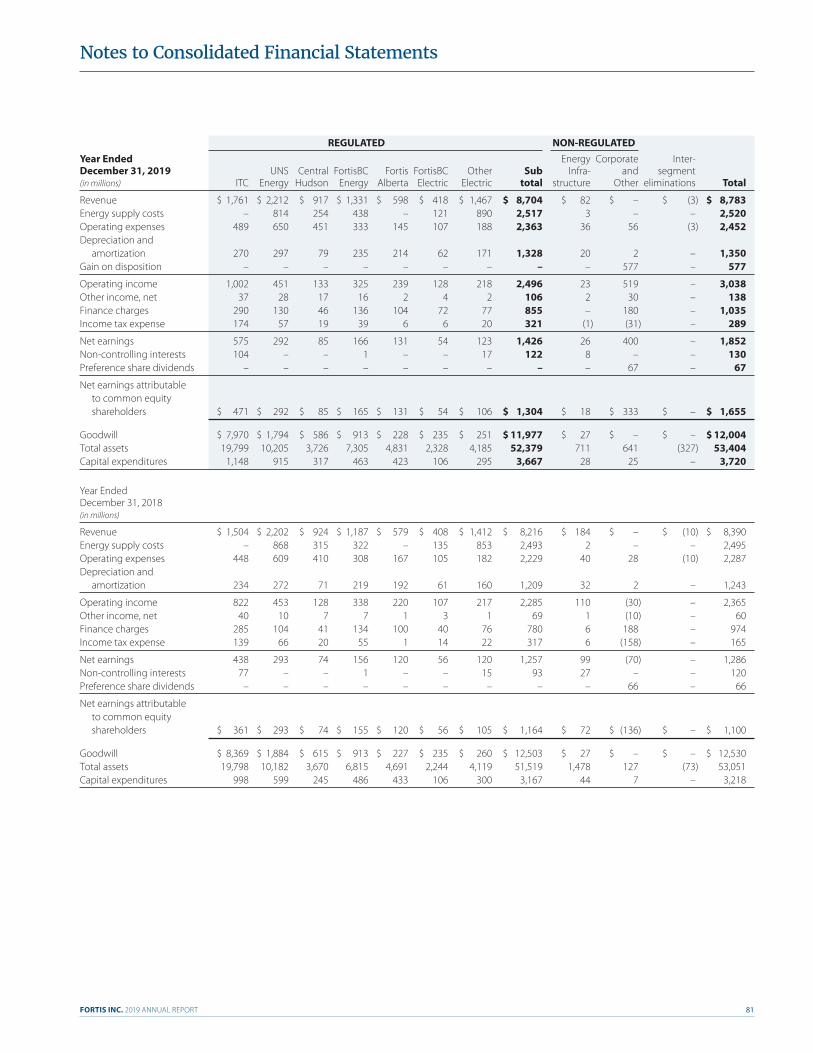
FORTIS INC. 2019 ANNUAL REPORT 81
Notes to Consolidated Financial Statements
REGULATED NON-REGULATED
Year Ended Energy Corporate Inter-December 31, 2019 UNS Central FortisBC Fortis FortisBC Other Sub Infra- and segment (in millions) ITC Energy Hudson Energy Alberta Electric Electric total structure Other eliminations Total
Revenue $ 1,761 $ 2,212 $ 917 $ 1,331 $ 598 $ 418 $ 1,467 $ 8,704 $ 82 $ – $ (3) $ 8,783Energy supply costs – 814 254 438 – 121 890 2,517 3 – – 2,520Operating expenses 489 650 451 333 145 107 188 2,363 36 56 (3) 2,452Depreciation and
amortization 270 297 79 235 214 62 171 1,328 20 2 – 1,350Gain on disposition – – – – – – – – – 577 – 577
Operating income 1,002 451 133 325 239 128 218 2,496 23 519 – 3,038Other income, net 37 28 17 16 2 4 2 106 2 30 – 138Finance charges 290 130 46 136 104 72 77 855 – 180 – 1,035Income tax expense 174 57 19 39 6 6 20 321 (1) (31) – 289
Net earnings 575 292 85 166 131 54 123 1,426 26 400 – 1,852Non-controlling interests 104 – – 1 – – 17 122 8 – – 130Preference share dividends – – – – – – – – – 67 – 67
Net earnings attributable to common equity shareholders $ 471 $ 292 $ 85 $ 165 $ 131 $ 54 $ 106 $ 1,304 $ 18 $ 333 $ – $ 1,655
Goodwill $ 7,970 $ 1,794 $ 586 $ 913 $ 228 $ 235 $ 251 $ 11,977 $ 27 $ – $ – $ 12,004Total assets 19,799 10,205 3,726 7,305 4,831 2,328 4,185 52,379 711 641 (327) 53,404Capital expenditures 1,148 915 317 463 423 106 295 3,667 28 25 – 3,720
Year Ended December 31, 2018 (in millions)
Revenue $ 1,504 $ 2,202 $ 924 $ 1,187 $ 579 $ 408 $ 1,412 $ 8,216 $ 184 $ – $ (10) $ 8,390Energy supply costs – 868 315 322 – 135 853 2,493 2 – – 2,495Operating expenses 448 609 410 308 167 105 182 2,229 40 28 (10) 2,287Depreciation and
amortization 234 272 71 219 192 61 160 1,209 32 2 – 1,243
Operating income 822 453 128 338 220 107 217 2,285 110 (30) – 2,365Other income, net 40 10 7 7 1 3 1 69 1 (10) – 60Finance charges 285 104 41 134 100 40 76 780 6 188 – 974Income tax expense 139 66 20 55 1 14 22 317 6 (158) – 165
Net earnings 438 293 74 156 120 56 120 1,257 99 (70) – 1,286Non-controlling interests 77 – – 1 – – 15 93 27 – – 120Preference share dividends – – – – – – – – – 66 – 66
Net earnings attributable to common equity shareholders $ 361 $ 293 $ 74 $ 155 $ 120 $ 56 $ 105 $ 1,164 $ 72 $ (136) $ – $ 1,100
Goodwill $ 8,369 $ 1,884 $ 615 $ 913 $ 227 $ 235 $ 260 $ 12,503 $ 27 $ – $ – $ 12,530Total assets 19,798 10,182 3,670 6,815 4,691 2,244 4,119 51,519 1,478 127 (73) 53,051Capital expenditures 998 599 245 486 433 106 300 3,167 44 7 – 3,218
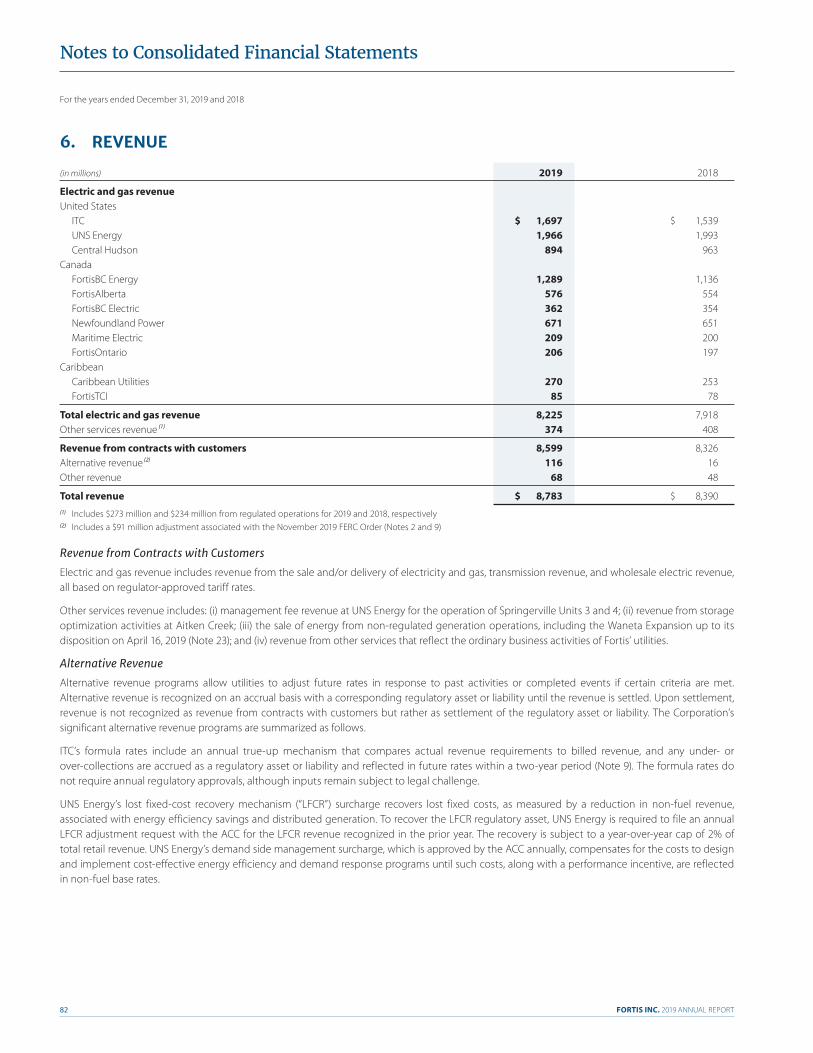
For the years ended December 31, 2019 and 2018
FORTIS INC. 2019 ANNUAL REPORT82
Notes to Consolidated Financial Statements
6. REVENUE
(in millions) 2019 2018
Electric and gas revenue United States ITC $ 1,697 $ 1,539 UNS Energy 1,966 1,993 Central Hudson 894 963Canada FortisBC Energy 1,289 1,136 FortisAlberta 576 554 FortisBC Electric 362 354 Newfoundland Power 671 651 Maritime Electric 209 200 FortisOntario 206 197Caribbean Caribbean Utilities 270 253 FortisTCI 85 78
Total electric and gas revenue 8,225 7,918Other services revenue (1) 374 408
Revenue from contracts with customers 8,599 8,326Alternative revenue (2) 116 16Other revenue 68 48
Total revenue $ 8,783 $ 8,390(1) Includes $273 million and $234 million from regulated operations for 2019 and 2018, respectively(2) Includes a $91 million adjustment associated with the November 2019 FERC Order (Notes 2 and 9)
Revenue from Contracts with Customers
Electric and gas revenue includes revenue from the sale and/or delivery of electricity and gas, transmission revenue, and wholesale electric revenue, all based on regulator-approved tariff rates.
Other services revenue includes: (i) management fee revenue at UNS Energy for the operation of Springerville Units 3 and 4; (ii) revenue from storage optimization activities at Aitken Creek; (iii) the sale of energy from non-regulated generation operations, including the Waneta Expansion up to its disposition on April 16, 2019 (Note 23); and (iv) revenue from other services that reflect the ordinary business activities of Fortis’ utilities.
Alternative Revenue
Alternative revenue programs allow utilities to adjust future rates in response to past activities or completed events if certain criteria are met. Alternative revenue is recognized on an accrual basis with a corresponding regulatory asset or liability until the revenue is settled. Upon settlement, revenue is not recognized as revenue from contracts with customers but rather as settlement of the regulatory asset or liability. The Corporation’s significant alternative revenue programs are summarized as follows.
ITC’s formula rates include an annual true-up mechanism that compares actual revenue requirements to billed revenue, and any under- or over-collections are accrued as a regulatory asset or liability and reflected in future rates within a two-year period (Note 9). The formula rates do not require annual regulatory approvals, although inputs remain subject to legal challenge.
UNS Energy’s lost fixed-cost recovery mechanism (“LFCR”) surcharge recovers lost fixed costs, as measured by a reduction in non-fuel revenue, associated with energy efficiency savings and distributed generation. To recover the LFCR regulatory asset, UNS Energy is required to file an annual LFCR adjustment request with the ACC for the LFCR revenue recognized in the prior year. The recovery is subject to a year-over-year cap of 2% of total retail revenue. UNS Energy’s demand side management surcharge, which is approved by the ACC annually, compensates for the costs to design and implement cost-effective energy efficiency and demand response programs until such costs, along with a performance incentive, are reflected in non-fuel base rates.
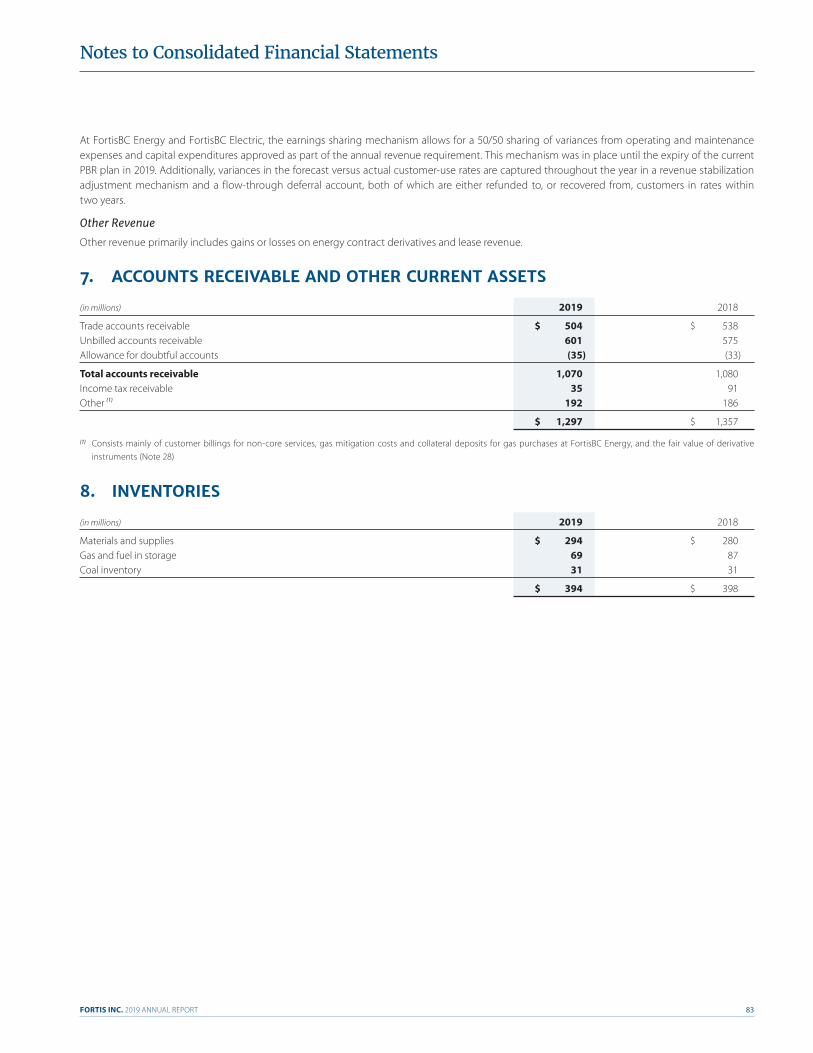
FORTIS INC. 2019 ANNUAL REPORT 83
Notes to Consolidated Financial Statements
At FortisBC Energy and FortisBC Electric, the earnings sharing mechanism allows for a 50/50 sharing of variances from operating and maintenance expenses and capital expenditures approved as part of the annual revenue requirement. This mechanism was in place until the expiry of the current PBR plan in 2019. Additionally, variances in the forecast versus actual customer-use rates are captured throughout the year in a revenue stabilization adjustment mechanism and a flow-through deferral account, both of which are either refunded to, or recovered from, customers in rates within two years.
Other Revenue
Other revenue primarily includes gains or losses on energy contract derivatives and lease revenue.
7. ACCOUNTS RECEIVABLE AND OTHER CURRENT ASSETS
(in millions) 2019 2018
Trade accounts receivable $ 504 $ 538Unbilled accounts receivable 601 575Allowance for doubtful accounts (35) (33)
Total accounts receivable 1,070 1,080Income tax receivable 35 91Other (1) 192 186
$ 1,297 $ 1,357
(1) Consists mainly of customer billings for non-core services, gas mitigation costs and collateral deposits for gas purchases at FortisBC Energy, and the fair value of derivative instruments (Note 28)
8. INVENTORIES
(in millions) 2019 2018
Materials and supplies $ 294 $ 280Gas and fuel in storage 69 87Coal inventory 31 31
$ 394 $ 398
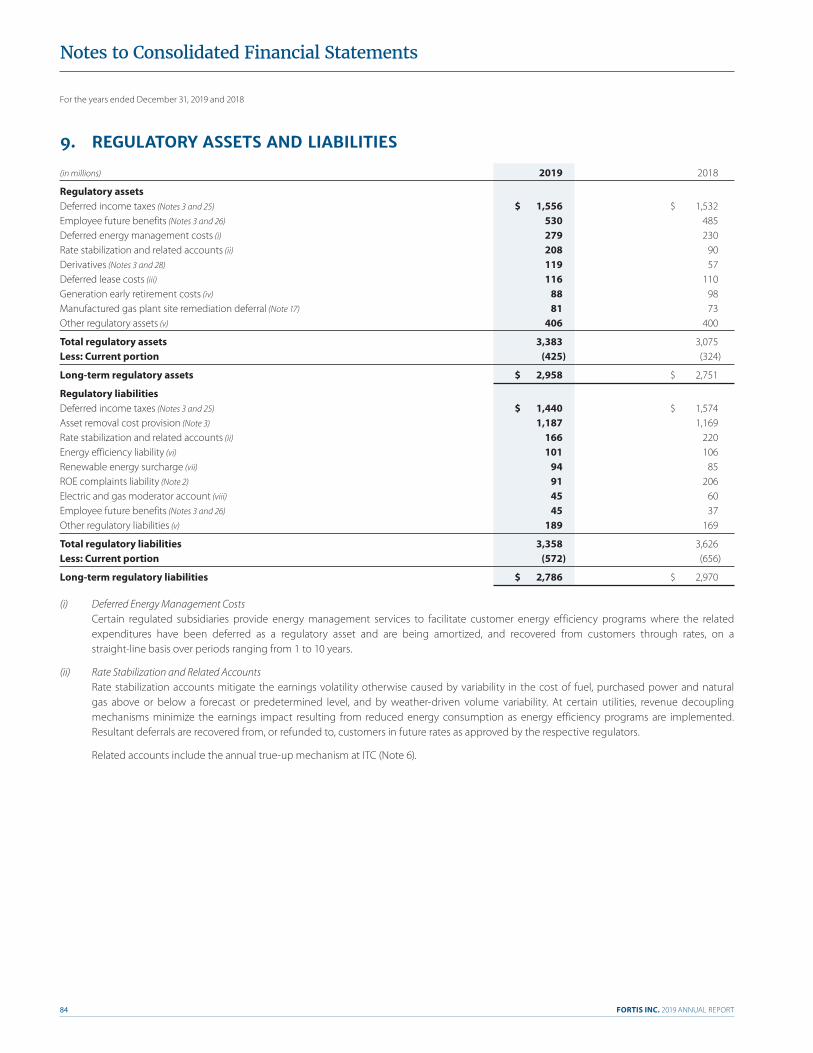
For the years ended December 31, 2019 and 2018
FORTIS INC. 2019 ANNUAL REPORT84
Notes to Consolidated Financial Statements
9. REGULATORY ASSETS AND LIABILITIES
(in millions) 2019 2018
Regulatory assetsDeferred income taxes (Notes 3 and 25) $ 1,556 $ 1,532Employee future benefits (Notes 3 and 26) 530 485Deferred energy management costs (i) 279 230Rate stabilization and related accounts (ii) 208 90Derivatives (Notes 3 and 28) 119 57Deferred lease costs (iii) 116 110Generation early retirement costs (iv) 88 98Manufactured gas plant site remediation deferral (Note 17) 81 73Other regulatory assets (v) 406 400
Total regulatory assets 3,383 3,075Less: Current portion (425) (324)
Long-term regulatory assets $ 2,958 $ 2,751
Regulatory liabilitiesDeferred income taxes (Notes 3 and 25) $ 1,440 $ 1,574Asset removal cost provision (Note 3) 1,187 1,169Rate stabilization and related accounts (ii) 166 220Energy efficiency liability (vi) 101 106Renewable energy surcharge (vii) 94 85ROE complaints liability (Note 2) 91 206Electric and gas moderator account (viii) 45 60Employee future benefits (Notes 3 and 26) 45 37Other regulatory liabilities (v) 189 169
Total regulatory liabilities 3,358 3,626Less: Current portion (572) (656)
Long-term regulatory liabilities $ 2,786 $ 2,970
(i) Deferred Energy Management CostsCertain regulated subsidiaries provide energy management services to facilitate customer energy efficiency programs where the related expenditures have been deferred as a regulatory asset and are being amortized, and recovered from customers through rates, on a straight-line basis over periods ranging from 1 to 10 years.
(ii) Rate Stabilization and Related AccountsRate stabilization accounts mitigate the earnings volatility otherwise caused by variability in the cost of fuel, purchased power and natural gas above or below a forecast or predetermined level, and by weather-driven volume variability. At certain utilities, revenue decoupling mechanisms minimize the earnings impact resulting from reduced energy consumption as energy efficiency programs are implemented. Resultant deferrals are recovered from, or refunded to, customers in future rates as approved by the respective regulators.
Related accounts include the annual true-up mechanism at ITC (Note 6).
FORTIS INC. 2019 ANNUAL REPORT 85
Notes to Consolidated Financial Statements
(iii) Deferred Lease CostsDeferred lease costs at FortisBC Electric primarily relate to the Brilliant Power Purchase Agreement (“BPPA”) (Note 16). The depreciation of the asset under finance lease and interest expense on the finance lease obligation are not being fully recovered in current customer rates since these rates only reflect the cash payments required under the BPPA. The annual differences are being deferred as a regulatory asset, which is expected to be recovered from customers in future rates over the term of the lease, which expires in 2056.
(iv) Generation Early Retirement CostsUNS Energy holds an undivided interest in the jointly owned Navajo Generating Station (“Navajo”), located on a site leased from the Navajo Nation with an initial lease term through December 2019. In June 2017 the Navajo Nation approved a land-lease extension that allowed TEP and the co-owners of Navajo to continue operations through December 2019 and begin decommissioning activities thereafter. TEP and the co-owners retired Navajo in November 2019, with related decommissioning activities continuing through 2054, and the capital and operating costs are being recovered through 2030.
UNS Energy owns the Sundt Generating Facility (“Sundt”) and was required to retire Sundt Units 1 and 2 in November 2019. Capital and operating costs related to Sundt Units 1 and 2 are being recovered through 2028 and 2030, respectively.
Due to the early retirement of Navajo and Sundt, TEP requested recovery of final retirement costs over a 10-year period in the 2019 general rate application.
(v) Other Regulatory Assets and LiabilitiesThese balances are comprised of regulatory assets and liabilities individually less than $40 million.
(vi) Energy Efficiency LiabilityThe energy efficiency liability primarily relates to Central Hudson’s Energy Efficiency Program, established to fund environmental policies associated with energy conservation programs as approved by its regulator.
(vii) Renewable Energy SurchargeUnder the ACC’s Renewable Energy Standard (“RES”), UNS Energy is required to increase its use of renewable energy each year until it represents at least 15% of its total annual retail energy requirements by 2025. The cost of carrying out the plan is recovered from retail customers through a RES surcharge. Any RES surcharge collections above or below the costs incurred to implement the plans are deferred as a regulatory liability or asset.
The ACC measures RES compliance through Renewable Energy Credits (“REC”). Each REC represents one kilowatt hour generated from renewable resources. When UNS Energy purchases renewable energy, the premium paid above the market cost of conventional power equals the REC recoverable through the RES surcharge. When RECs are purchased, UNS Energy records their cost as long-term other assets (Note 10) with a corresponding regulatory liability to reflect the obligation to use the RECs for future RES compliance. When RECs are reported to the ACC for compliance with RES requirements, energy supply costs and revenue are recognized in an equal amount.
(viii) Electric and Gas Moderator AccountUnder Central Hudson’s 2018 three-year rate order certain regulatory assets and liabilities were approved by the PSC for offset and an electric and gas moderator account was established, which will be used for future customer rate moderation.
Regulatory assets not earning a return: (i) totalled $1,510 million and $1,490 million as at December 31, 2019 and 2018, respectively; (ii) are primarily related to deferred income taxes and employee future benefits; and (iii) generally do not represent a past cash outlay as they are offset by related liabilities that, likewise, do not incur a carrying cost for rate-making purposes. Recovery periods vary or are yet to be determined by the respective regulators.
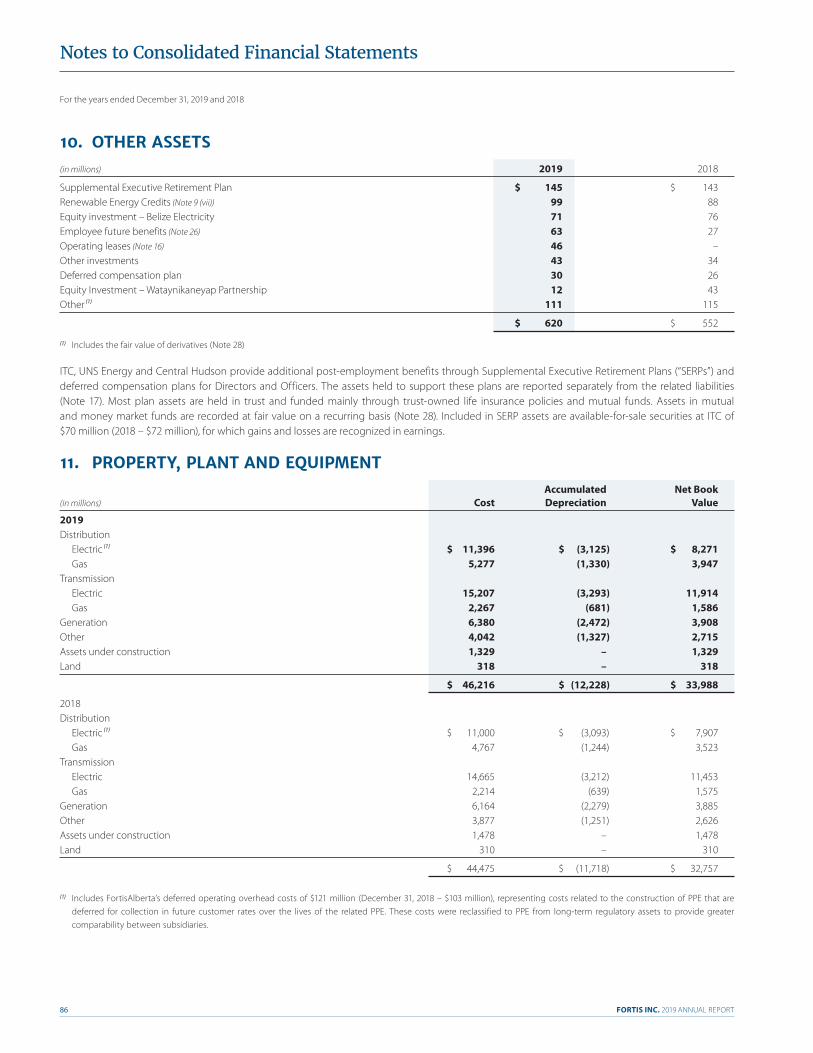
For the years ended December 31, 2019 and 2018
FORTIS INC. 2019 ANNUAL REPORT86
Notes to Consolidated Financial Statements
10. OTHER ASSETS(in millions) 2019 2018
Supplemental Executive Retirement Plan $ 145 $ 143Renewable Energy Credits (Note 9 (vii)) 99 88Equity investment – Belize Electricity 71 76Employee future benefits (Note 26) 63 27Operating leases (Note 16) 46 –Other investments 43 34Deferred compensation plan 30 26Equity Investment – Wataynikaneyap Partnership 12 43Other (1) 111 115
$ 620 $ 552
(1) Includes the fair value of derivatives (Note 28)
ITC, UNS Energy and Central Hudson provide additional post-employment benefits through Supplemental Executive Retirement Plans (“SERPs”) and deferred compensation plans for Directors and Officers. The assets held to support these plans are reported separately from the related liabilities (Note 17). Most plan assets are held in trust and funded mainly through trust-owned life insurance policies and mutual funds. Assets in mutual and money market funds are recorded at fair value on a recurring basis (Note 28). Included in SERP assets are available-for-sale securities at ITC of $70 million (2018 – $72 million), for which gains and losses are recognized in earnings.
11. PROPERTY, PLANT AND EQUIPMENT Accumulated Net Book (in millions) Cost Depreciation Value
2019Distribution Electric (1) $ 11,396 $ (3,125) $ 8,271 Gas 5,277 (1,330) 3,947Transmission Electric 15,207 (3,293) 11,914 Gas 2,267 (681) 1,586Generation 6,380 (2,472) 3,908Other 4,042 (1,327) 2,715Assets under construction 1,329 – 1,329Land 318 – 318
$ 46,216 $ (12,228) $ 33,988
2018Distribution Electric (1) $ 11,000 $ (3,093) $ 7,907 Gas 4,767 (1,244) 3,523Transmission Electric 14,665 (3,212) 11,453 Gas 2,214 (639) 1,575Generation 6,164 (2,279) 3,885Other 3,877 (1,251) 2,626Assets under construction 1,478 – 1,478Land 310 – 310
$ 44,475 $ (11,718) $ 32,757
(1) Includes FortisAlberta’s deferred operating overhead costs of $121 million (December 31, 2018 – $103 million), representing costs related to the construction of PPE that are deferred for collection in future customer rates over the lives of the related PPE. These costs were reclassified to PPE from long-term regulatory assets to provide greater comparability between subsidiaries.

FORTIS INC. 2019 ANNUAL REPORT 87
Notes to Consolidated Financial Statements
Electric distribution assets are those used to distribute electricity at lower voltages (generally below 69 kilovolts (“kV”)). These assets include poles, towers and fixtures, low-voltage wires, transformers, overhead and underground conductors, street lighting, meters, metering equipment and other related equipment. Gas distribution assets are those used to transport natural gas at low pressures (generally below 2,070 kilopascals (“kPa”)) or a hoop stress of less than 20% of standard minimum yield strength. These assets include distribution stations, telemetry, distribution pipe for mains and services, meter sets and other related equipment.
Electric transmission assets are those used to transmit electricity at higher voltages (generally at 69 kV and higher). These assets include poles, wires, switching equipment, transformers, support structures and other related equipment. Gas transmission assets are those used to transport natural gas at higher pressures (generally at 2,070 kPa and higher) or a hoop stress of 20% or more of standard minimum yield strength. These assets include transmission stations, telemetry, transmission pipe and other related equipment.
Generation assets are those used to generate electricity. These assets include hydroelectric and thermal generation stations, gas and combustion turbines, coal-fired generating stations, dams, reservoirs, photovoltaic systems, wind resources and other related equipment.
Other assets include buildings, equipment, vehicles, inventory, information technology assets and the Aitken Creek natural gas storage facility.
As at December 31, 2019 and 2018, assets under construction were primarily associated with ongoing transmission projects at ITC and the addition of gas-fired generating capacity at UNS Energy.
The cost of PPE under finance lease as at December 31, 2019 was $514 million (December 31, 2018 – $656 million) and related accumulated depreciation was $206 million (December 31, 2018 – $203 million) (Note 16).
Jointly Owned Facilities
UNS Energy and ITC hold undivided interests in jointly owned generating facilities and transmission systems, are entitled to their pro rata share of the PPE, and are proportionately liable for the associated operating costs and liabilities. As at December 31, 2019, interests in jointly owned facilities consisted of the following.
Ownership Accumulated Net Book (in millions, except as noted) (%) Cost Depreciation Value
San Juan Unit 1 50.0 $ 377 $ (251) $ 126Four Corners Units 4 and 5 7.0 234 (100) 134Luna Energy Facility 33.3 74 (1) 73Gila River Common Facilities 50.0 105 (35) 70Springerville Coal Handling Facilities 83.0 270 (117) 153Transmission Facilities 1.0–80.0 982 (384) 598
$ 2,042 $ (888) $ 1,154
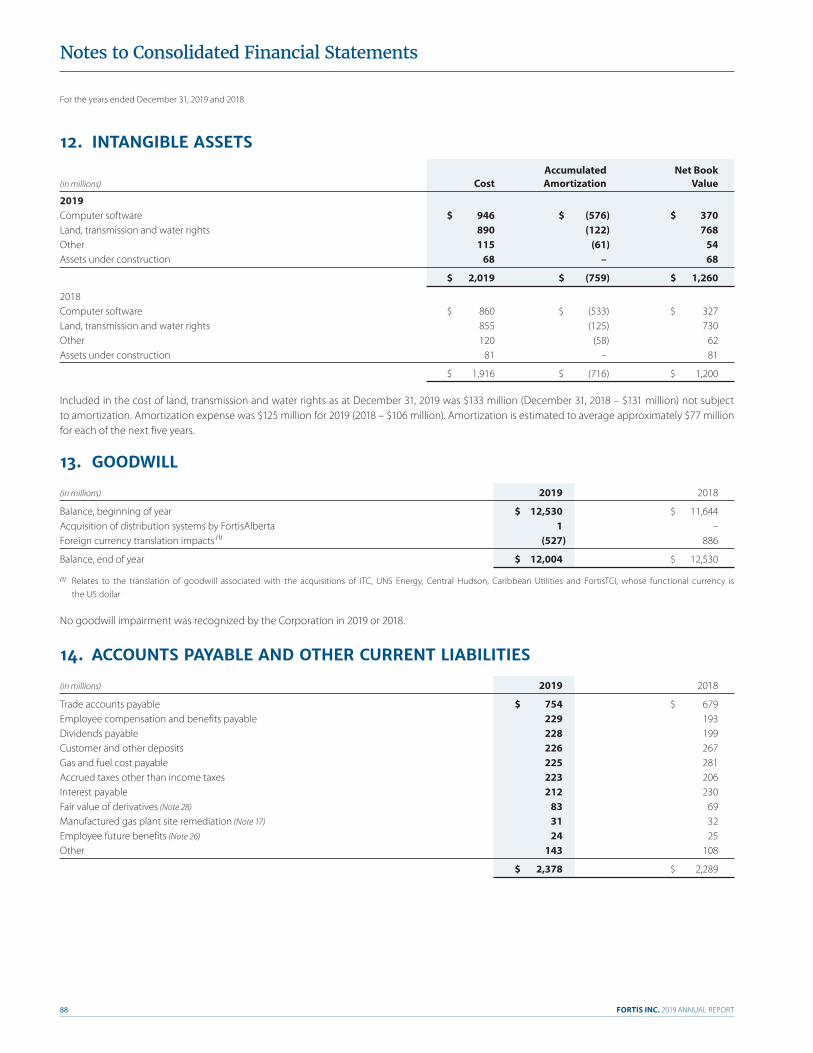
For the years ended December 31, 2019 and 2018
FORTIS INC. 2019 ANNUAL REPORT88
Notes to Consolidated Financial Statements
12. INTANGIBLE ASSETS
Accumulated Net Book (in millions) Cost Amortization Value
2019Computer software $ 946 $ (576) $ 370Land, transmission and water rights 890 (122) 768Other 115 (61) 54Assets under construction 68 – 68
$ 2,019 $ (759) $ 1,260
2018 Computer software $ 860 $ (533) $ 327Land, transmission and water rights 855 (125) 730Other 120 (58) 62Assets under construction 81 – 81
$ 1,916 $ (716) $ 1,200
Included in the cost of land, transmission and water rights as at December 31, 2019 was $133 million (December 31, 2018 – $131 million) not subject to amortization. Amortization expense was $125 million for 2019 (2018 – $106 million). Amortization is estimated to average approximately $77 million for each of the next five years.
13. GOODWILL
(in millions) 2019 2018
Balance, beginning of year $ 12,530 $ 11,644Acquisition of distribution systems by FortisAlberta 1 –Foreign currency translation impacts (1) (527) 886
Balance, end of year $ 12,004 $ 12,530
(1) Relates to the translation of goodwill associated with the acquisitions of ITC, UNS Energy, Central Hudson, Caribbean Utilities and FortisTCI, whose functional currency is the US dollar
No goodwill impairment was recognized by the Corporation in 2019 or 2018.
14. ACCOUNTS PAYABLE AND OTHER CURRENT LIABILITIES
(in millions) 2019 2018
Trade accounts payable $ 754 $ 679Employee compensation and benefits payable 229 193Dividends payable 228 199Customer and other deposits 226 267Gas and fuel cost payable 225 281Accrued taxes other than income taxes 223 206Interest payable 212 230Fair value of derivatives (Note 28) 83 69Manufactured gas plant site remediation (Note 17) 31 32Employee future benefits (Note 26) 24 25Other 143 108
$ 2,378 $ 2,289
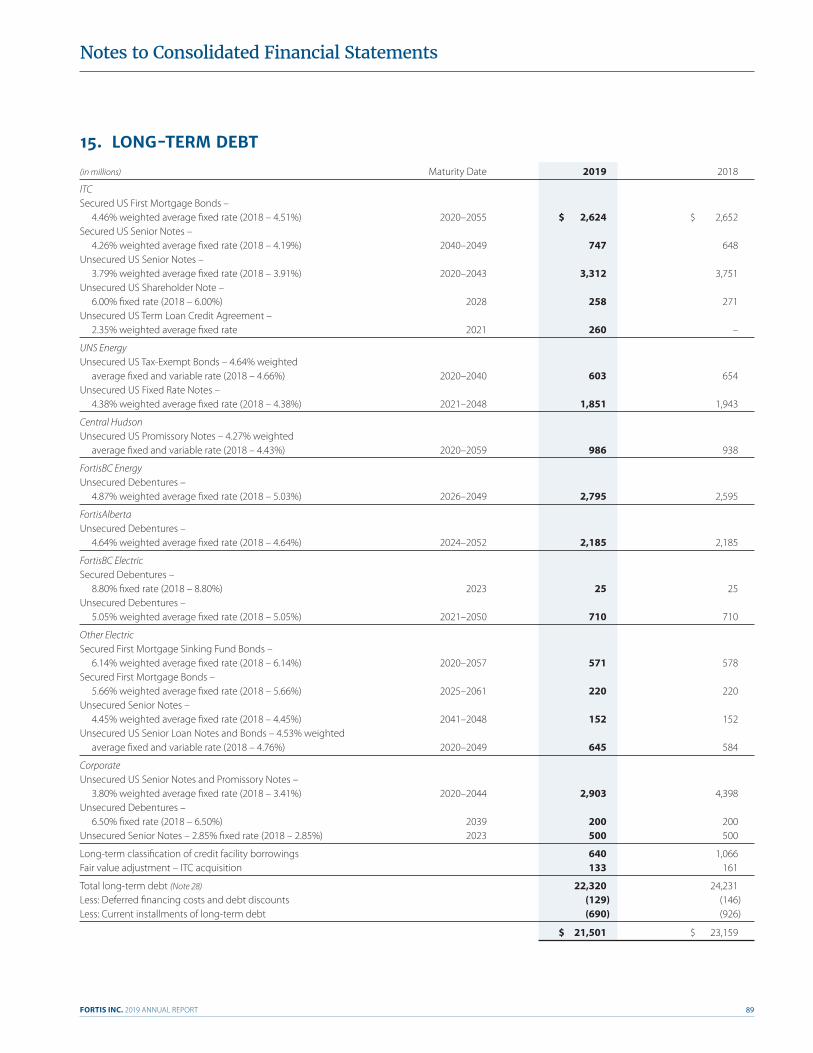
FORTIS INC. 2019 ANNUAL REPORT 89
Notes to Consolidated Financial Statements
15. LONG-TERM DEBT
(in millions) Maturity Date 2019 2018
ITC Secured US First Mortgage Bonds – 4.46% weighted average fixed rate (2018 – 4.51%) 2020–2055 $ 2,624 $ 2,652 Secured US Senior Notes – 4.26% weighted average fixed rate (2018 – 4.19%) 2040–2049 747 648 Unsecured US Senior Notes – 3.79% weighted average fixed rate (2018 – 3.91%) 2020–2043 3,312 3,751 Unsecured US Shareholder Note – 6.00% fixed rate (2018 – 6.00%) 2028 258 271 Unsecured US Term Loan Credit Agreement – 2.35% weighted average fixed rate 2021 260 –
UNS Energy Unsecured US Tax-Exempt Bonds – 4.64% weighted average fixed and variable rate (2018 – 4.66%) 2020–2040 603 654 Unsecured US Fixed Rate Notes – 4.38% weighted average fixed rate (2018 – 4.38%) 2021–2048 1,851 1,943
Central Hudson Unsecured US Promissory Notes – 4.27% weighted average fixed and variable rate (2018 – 4.43%) 2020–2059 986 938
FortisBC Energy Unsecured Debentures – 4.87% weighted average fixed rate (2018 – 5.03%) 2026–2049 2,795 2,595
FortisAlberta Unsecured Debentures – 4.64% weighted average fixed rate (2018 – 4.64%) 2024–2052 2,185 2,185
FortisBC Electric Secured Debentures – 8.80% fixed rate (2018 – 8.80%) 2023 25 25 Unsecured Debentures – 5.05% weighted average fixed rate (2018 – 5.05%) 2021–2050 710 710
Other Electric Secured First Mortgage Sinking Fund Bonds – 6.14% weighted average fixed rate (2018 – 6.14%) 2020–2057 571 578 Secured First Mortgage Bonds – 5.66% weighted average fixed rate (2018 – 5.66%) 2025–2061 220 220 Unsecured Senior Notes – 4.45% weighted average fixed rate (2018 – 4.45%) 2041–2048 152 152 Unsecured US Senior Loan Notes and Bonds – 4.53% weighted average fixed and variable rate (2018 – 4.76%) 2020–2049 645 584
Corporate Unsecured US Senior Notes and Promissory Notes – 3.80% weighted average fixed rate (2018 – 3.41%) 2020–2044 2,903 4,398 Unsecured Debentures – 6.50% fixed rate (2018 – 6.50%) 2039 200 200 Unsecured Senior Notes – 2.85% fixed rate (2018 – 2.85%) 2023 500 500
Long-term classification of credit facility borrowings 640 1,066 Fair value adjustment – ITC acquisition 133 161
Total long-term debt (Note 28) 22,320 24,231 Less: Deferred financing costs and debt discounts (129) (146) Less: Current installments of long-term debt (690) (926)
$ 21,501 $ 23,159
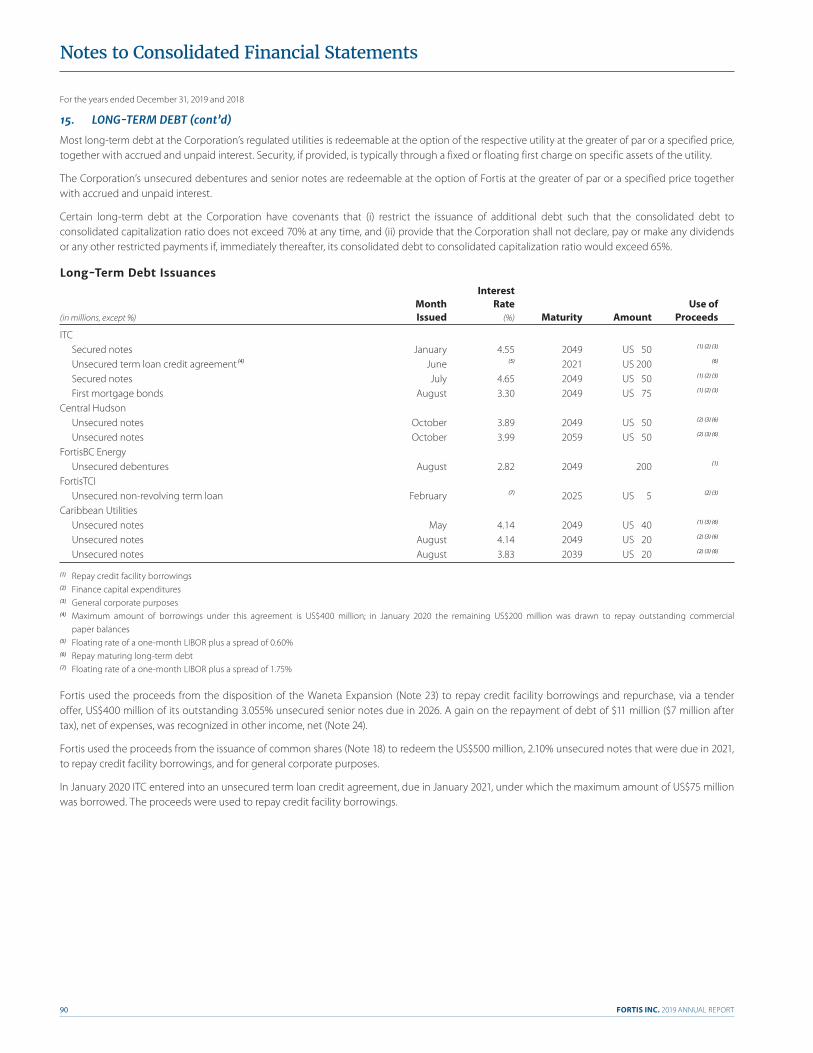
For the years ended December 31, 2019 and 2018
FORTIS INC. 2019 ANNUAL REPORT90
Notes to Consolidated Financial Statements
Most long-term debt at the Corporation’s regulated utilities is redeemable at the option of the respective utility at the greater of par or a specified price, together with accrued and unpaid interest. Security, if provided, is typically through a fixed or floating first charge on specific assets of the utility.
The Corporation’s unsecured debentures and senior notes are redeemable at the option of Fortis at the greater of par or a specified price together with accrued and unpaid interest.
Certain long-term debt at the Corporation have covenants that (i) restrict the issuance of additional debt such that the consolidated debt to consolidated capitalization ratio does not exceed 70% at any time, and (ii) provide that the Corporation shall not declare, pay or make any dividends or any other restricted payments if, immediately thereafter, its consolidated debt to consolidated capitalization ratio would exceed 65%.
Long-Term Debt Issuances Interest Month Rate Use of (in millions, except %) Issued (%) Maturity Amount Proceeds
ITC Secured notes January 4.55 2049 US 50 (1) (2) (3)
Unsecured term loan credit agreement (4) June (5) 2021 US 200 (6)
Secured notes July 4.65 2049 US 50 (1) (2) (3)
First mortgage bonds August 3.30 2049 US 75 (1) (2) (3)
Central Hudson Unsecured notes October 3.89 2049 US 50 (2) (3) (6)
Unsecured notes October 3.99 2059 US 50 (2) (3) (6)
FortisBC Energy Unsecured debentures August 2.82 2049 200 (1)
FortisTCI Unsecured non-revolving term loan February (7) 2025 US 5 (2) (3)
Caribbean Utilities Unsecured notes May 4.14 2049 US 40 (1) (3) (6)
Unsecured notes August 4.14 2049 US 20 (2) (3) (6)
Unsecured notes August 3.83 2039 US 20 (2) (3) (6)
(1) Repay credit facility borrowings(2) Finance capital expenditures(3) General corporate purposes(4) Maximum amount of borrowings under this agreement is US$400 million; in January 2020 the remaining US$200 million was drawn to repay outstanding commercial
paper balances(5) Floating rate of a one-month LIBOR plus a spread of 0.60%(6) Repay maturing long-term debt(7) Floating rate of a one-month LIBOR plus a spread of 1.75%
Fortis used the proceeds from the disposition of the Waneta Expansion (Note 23) to repay credit facility borrowings and repurchase, via a tender offer, US$400 million of its outstanding 3.055% unsecured senior notes due in 2026. A gain on the repayment of debt of $11 million ($7 million after tax), net of expenses, was recognized in other income, net (Note 24).
Fortis used the proceeds from the issuance of common shares (Note 18) to redeem the US$500 million, 2.10% unsecured notes that were due in 2021, to repay credit facility borrowings, and for general corporate purposes.
In January 2020 ITC entered into an unsecured term loan credit agreement, due in January 2021, under which the maximum amount of US$75 million was borrowed. The proceeds were used to repay credit facility borrowings.
15. LONG-TERM DEBT (cont’d)
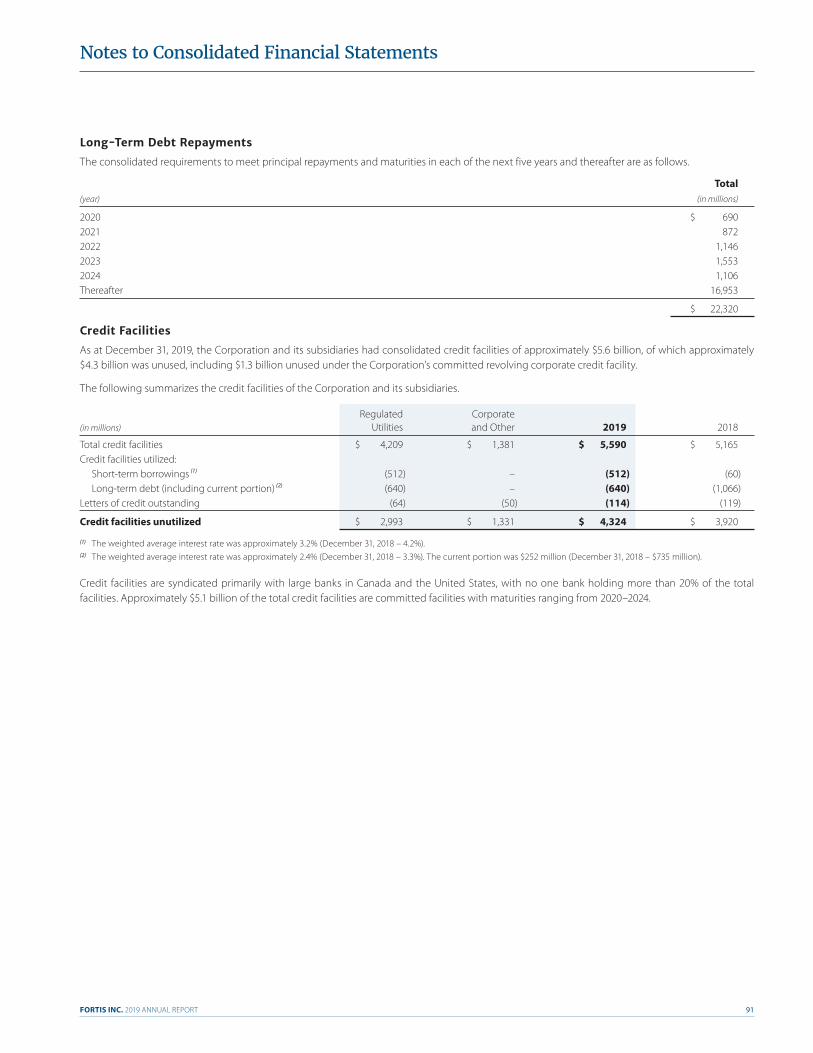
FORTIS INC. 2019 ANNUAL REPORT 91
Notes to Consolidated Financial Statements
Long-Term Debt Repayments
The consolidated requirements to meet principal repayments and maturities in each of the next five years and thereafter are as follows.
Total (year) (in millions)
2020 $ 6902021 8722022 1,1462023 1,5532024 1,106Thereafter 16,953
$ 22,320
Credit Facilities
As at December 31, 2019, the Corporation and its subsidiaries had consolidated credit facilities of approximately $5.6 billion, of which approximately $4.3 billion was unused, including $1.3 billion unused under the Corporation’s committed revolving corporate credit facility.
The following summarizes the credit facilities of the Corporation and its subsidiaries.
Regulated Corporate (in millions) Utilities and Other 2019 2018
Total credit facilities $ 4,209 $ 1,381 $ 5,590 $ 5,165Credit facilities utilized: Short-term borrowings (1) (512) – (512) (60) Long-term debt (including current portion) (2) (640) – (640) (1,066)Letters of credit outstanding (64) (50) (114) (119)
Credit facilities unutilized $ 2,993 $ 1,331 $ 4,324 $ 3,920
(1) The weighted average interest rate was approximately 3.2% (December 31, 2018 – 4.2%).(2) The weighted average interest rate was approximately 2.4% (December 31, 2018 – 3.3%). The current portion was $252 million (December 31, 2018 – $735 million).
Credit facilities are syndicated primarily with large banks in Canada and the United States, with no one bank holding more than 20% of the total facilities. Approximately $5.1 billion of the total credit facilities are committed facilities with maturities ranging from 2020–2024.
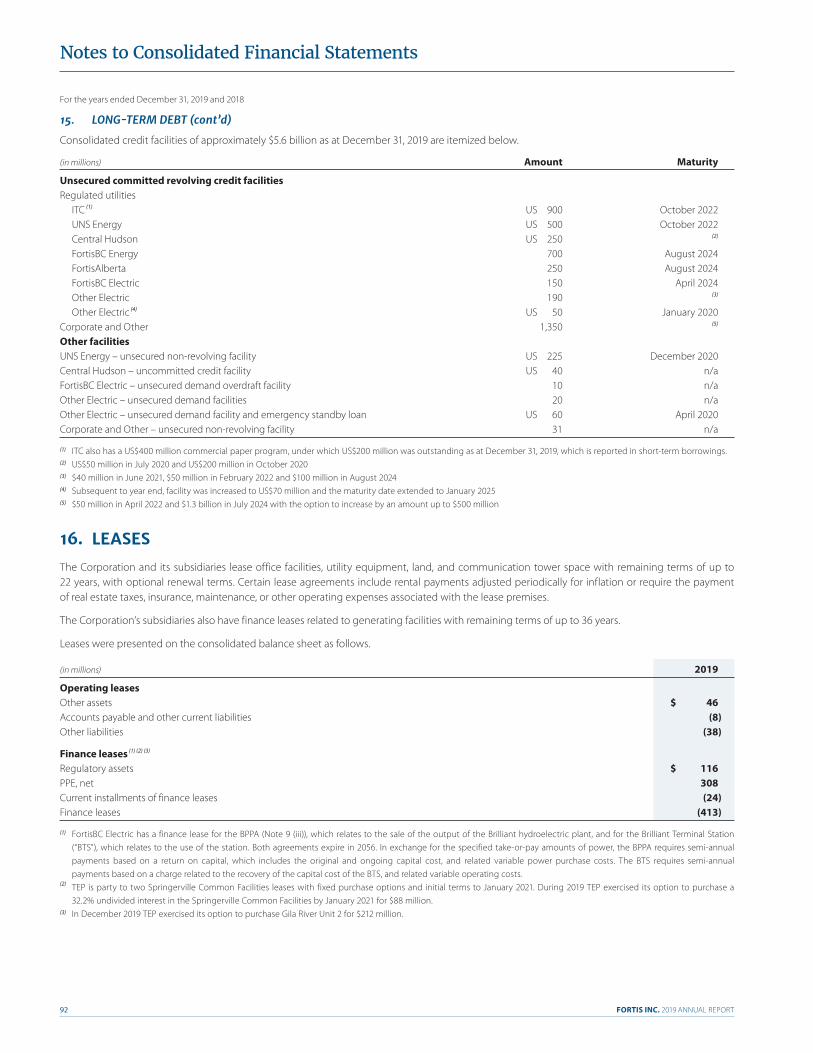
For the years ended December 31, 2019 and 2018
FORTIS INC. 2019 ANNUAL REPORT92
Notes to Consolidated Financial Statements
Consolidated credit facilities of approximately $5.6 billion as at December 31, 2019 are itemized below.
(in millions) Amount Maturity
Unsecured committed revolving credit facilitiesRegulated utilities ITC (1) US 900 October 2022 UNS Energy US 500 October 2022 Central Hudson US 250 (2)
FortisBC Energy 700 August 2024 FortisAlberta 250 August 2024 FortisBC Electric 150 April 2024 Other Electric 190 (3)
Other Electric (4) US 50 January 2020Corporate and Other 1,350 (5)
Other facilities UNS Energy – unsecured non-revolving facility US 225 December 2020Central Hudson – uncommitted credit facility US 40 n/aFortisBC Electric – unsecured demand overdraft facility 10 n/aOther Electric – unsecured demand facilities 20 n/aOther Electric – unsecured demand facility and emergency standby loan US 60 April 2020Corporate and Other – unsecured non-revolving facility 31 n/a
(1) ITC also has a US$400 million commercial paper program, under which US$200 million was outstanding as at December 31, 2019, which is reported in short-term borrowings.(2) US$50 million in July 2020 and US$200 million in October 2020(3) $40 million in June 2021, $50 million in February 2022 and $100 million in August 2024(4) Subsequent to year end, facility was increased to US$70 million and the maturity date extended to January 2025(5) $50 million in April 2022 and $1.3 billion in July 2024 with the option to increase by an amount up to $500 million
16. LEASES
The Corporation and its subsidiaries lease office facilities, utility equipment, land, and communication tower space with remaining terms of up to 22 years, with optional renewal terms. Certain lease agreements include rental payments adjusted periodically for inflation or require the payment of real estate taxes, insurance, maintenance, or other operating expenses associated with the lease premises.
The Corporation’s subsidiaries also have finance leases related to generating facilities with remaining terms of up to 36 years.
Leases were presented on the consolidated balance sheet as follows.
(in millions) 2019
Operating leasesOther assets $ 46Accounts payable and other current liabilities (8)Other liabilities (38)
Finance leases (1) (2) (3)
Regulatory assets $ 116PPE, net 308Current installments of finance leases (24)Finance leases (413)
(1) FortisBC Electric has a finance lease for the BPPA (Note 9 (iii)), which relates to the sale of the output of the Brilliant hydroelectric plant, and for the Brilliant Terminal Station (“BTS”), which relates to the use of the station. Both agreements expire in 2056. In exchange for the specified take-or-pay amounts of power, the BPPA requires semi-annual payments based on a return on capital, which includes the original and ongoing capital cost, and related variable power purchase costs. The BTS requires semi-annual payments based on a charge related to the recovery of the capital cost of the BTS, and related variable operating costs.
(2) TEP is party to two Springerville Common Facilities leases with fixed purchase options and initial terms to January 2021. During 2019 TEP exercised its option to purchase a 32.2% undivided interest in the Springerville Common Facilities by January 2021 for $88 million.
(3) In December 2019 TEP exercised its option to purchase Gila River Unit 2 for $212 million.
15. LONG-TERM DEBT (cont’d)
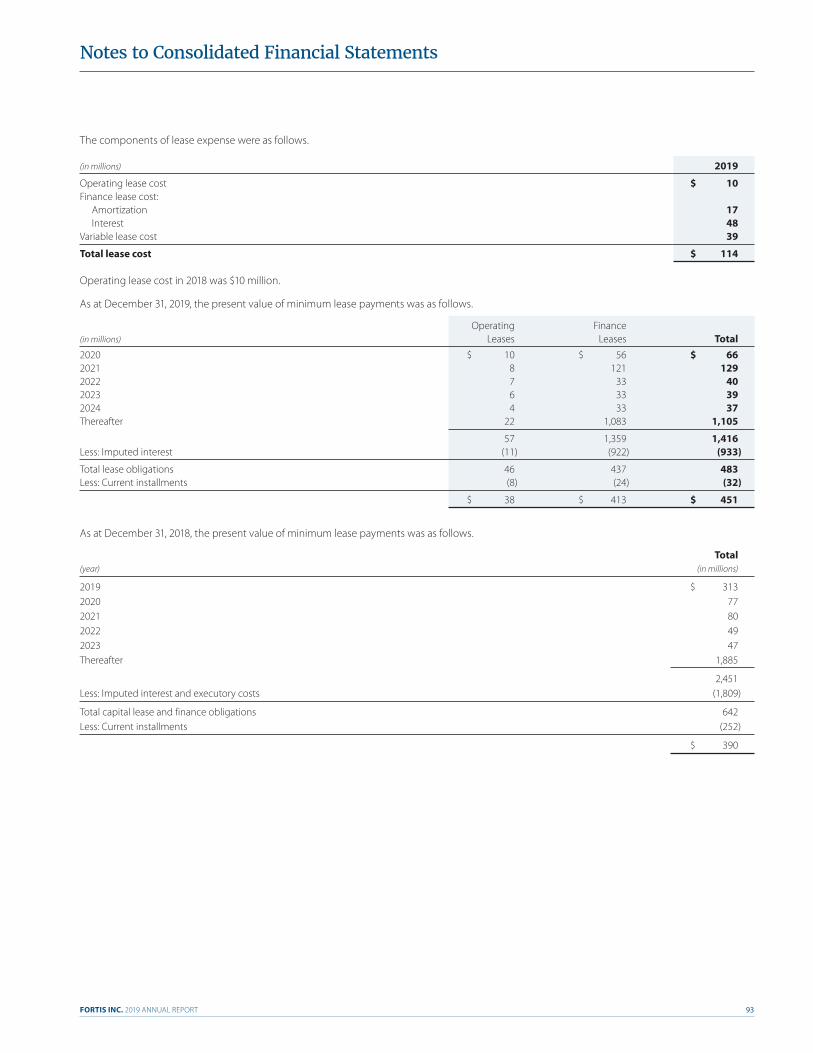
FORTIS INC. 2019 ANNUAL REPORT 93
Notes to Consolidated Financial Statements
The components of lease expense were as follows.
(in millions) 2019
Operating lease cost $ 10Finance lease cost: Amortization 17 Interest 48Variable lease cost 39
Total lease cost $ 114
Operating lease cost in 2018 was $10 million.
As at December 31, 2019, the present value of minimum lease payments was as follows.
Operating Finance (in millions) Leases Leases Total2020 $ 10 $ 56 $ 662021 8 121 1292022 7 33 402023 6 33 392024 4 33 37Thereafter 22 1,083 1,105
57 1,359 1,416Less: Imputed interest (11) (922) (933)
Total lease obligations 46 437 483Less: Current installments (8) (24) (32)
$ 38 $ 413 $ 451
As at December 31, 2018, the present value of minimum lease payments was as follows.
Total (year) (in millions)
2019 $ 3132020 772021 802022 492023 47Thereafter 1,885
2,451Less: Imputed interest and executory costs (1,809)
Total capital lease and finance obligations 642Less: Current installments (252)
$ 390
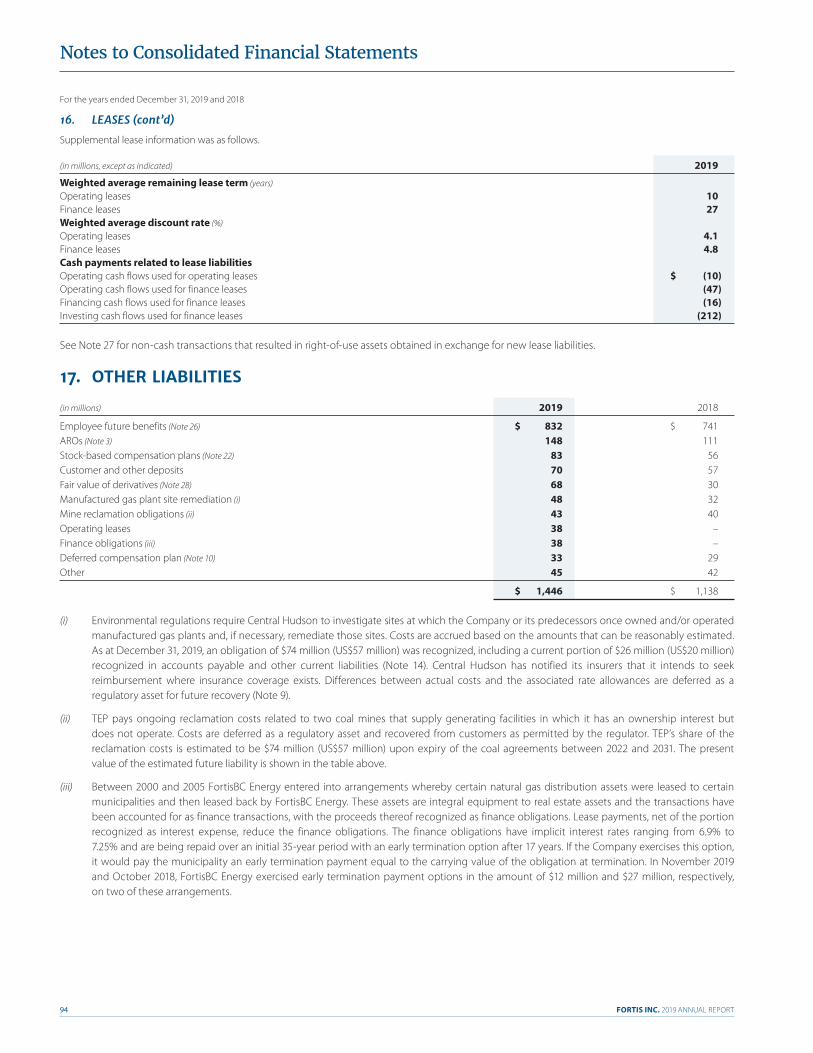
For the years ended December 31, 2019 and 2018
FORTIS INC. 2019 ANNUAL REPORT94
Notes to Consolidated Financial Statements
Supplemental lease information was as follows.
(in millions, except as indicated) 2019
Weighted average remaining lease term (years)Operating leases 10Finance leases 27Weighted average discount rate (%)Operating leases 4.1Finance leases 4.8Cash payments related to lease liabilitiesOperating cash flows used for operating leases $ (10)Operating cash flows used for finance leases (47)Financing cash flows used for finance leases (16)Investing cash flows used for finance leases (212)
See Note 27 for non-cash transactions that resulted in right-of-use assets obtained in exchange for new lease liabilities.
17. OTHER LIABILITIES
(in millions) 2019 2018
Employee future benefits (Note 26) $ 832 $ 741AROs (Note 3) 148 111Stock-based compensation plans (Note 22) 83 56Customer and other deposits 70 57Fair value of derivatives (Note 28) 68 30Manufactured gas plant site remediation (i) 48 32Mine reclamation obligations (ii) 43 40Operating leases 38 –Finance obligations (iii) 38 –Deferred compensation plan (Note 10) 33 29Other 45 42
$ 1,446 $ 1,138
(i) Environmental regulations require Central Hudson to investigate sites at which the Company or its predecessors once owned and/or operated manufactured gas plants and, if necessary, remediate those sites. Costs are accrued based on the amounts that can be reasonably estimated. As at December 31, 2019, an obligation of $74 million (US$57 million) was recognized, including a current portion of $26 million (US$20 million) recognized in accounts payable and other current liabilities (Note 14). Central Hudson has notified its insurers that it intends to seek reimbursement where insurance coverage exists. Differences between actual costs and the associated rate allowances are deferred as a regulatory asset for future recovery (Note 9).
(ii) TEP pays ongoing reclamation costs related to two coal mines that supply generating facilities in which it has an ownership interest but does not operate. Costs are deferred as a regulatory asset and recovered from customers as permitted by the regulator. TEP’s share of the reclamation costs is estimated to be $74 million (US$57 million) upon expiry of the coal agreements between 2022 and 2031. The present value of the estimated future liability is shown in the table above.
(iii) Between 2000 and 2005 FortisBC Energy entered into arrangements whereby certain natural gas distribution assets were leased to certain municipalities and then leased back by FortisBC Energy. These assets are integral equipment to real estate assets and the transactions have been accounted for as finance transactions, with the proceeds thereof recognized as finance obligations. Lease payments, net of the portion recognized as interest expense, reduce the finance obligations. The finance obligations have implicit interest rates ranging from 6.9% to 7.25% and are being repaid over an initial 35-year period with an early termination option after 17 years. If the Company exercises this option, it would pay the municipality an early termination payment equal to the carrying value of the obligation at termination. In November 2019 and October 2018, FortisBC Energy exercised early termination payment options in the amount of $12 million and $27 million, respectively, on two of these arrangements.
16. LEASES (cont’d)
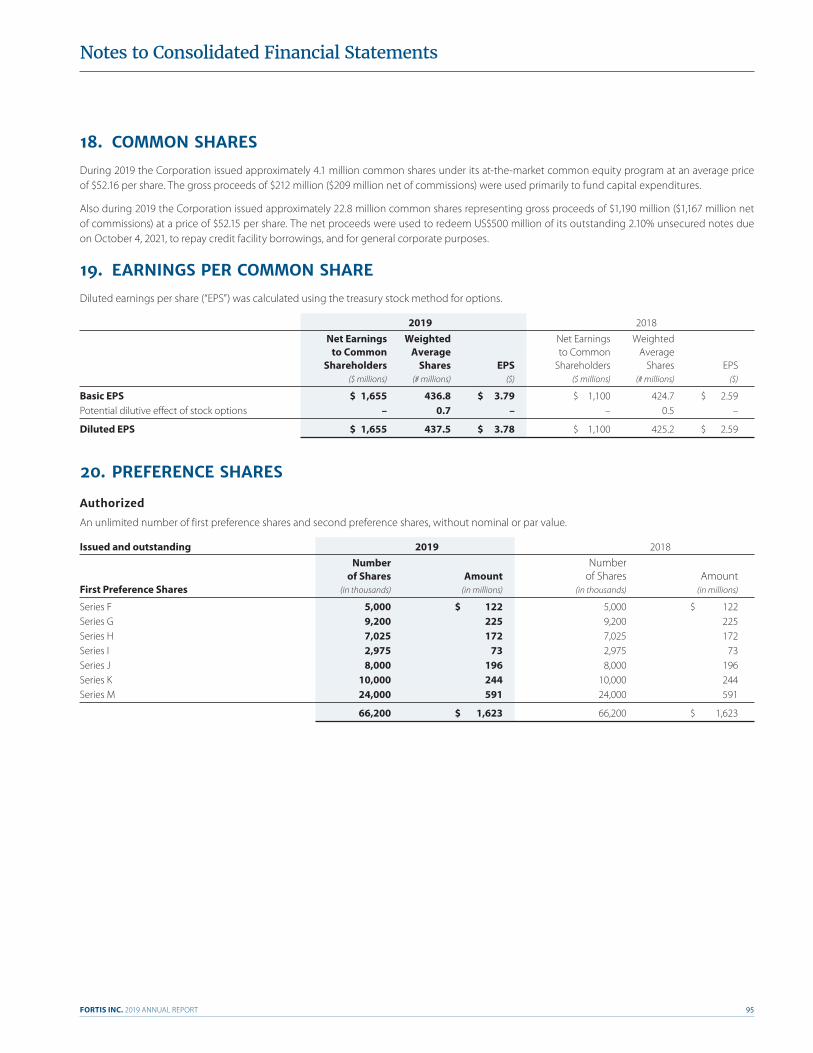
FORTIS INC. 2019 ANNUAL REPORT 95
Notes to Consolidated Financial Statements
18. COMMON SHARES
During 2019 the Corporation issued approximately 4.1 million common shares under its at-the-market common equity program at an average price of $52.16 per share. The gross proceeds of $212 million ($209 million net of commissions) were used primarily to fund capital expenditures.
Also during 2019 the Corporation issued approximately 22.8 million common shares representing gross proceeds of $1,190 million ($1,167 million net of commissions) at a price of $52.15 per share. The net proceeds were used to redeem US$500 million of its outstanding 2.10% unsecured notes due on October 4, 2021, to repay credit facility borrowings, and for general corporate purposes.
19. EARNINGS PER COMMON SHARE
Diluted earnings per share (“EPS”) was calculated using the treasury stock method for options.
2019 2018
Net Earnings Weighted Net Earnings Weighted to Common Average to Common Average Shareholders Shares EPS Shareholders Shares EPS ($ millions) (# millions) ($) ($ millions) (# millions) ($)
Basic EPS $ 1,655 436.8 $ 3.79 $ 1,100 424.7 $ 2.59 Potential dilutive effect of stock options – 0.7 – – 0.5 –
Diluted EPS $ 1,655 437.5 $ 3.78 $ 1,100 425.2 $ 2.59
20. PREFERENCE SHARES
Authorized
An unlimited number of first preference shares and second preference shares, without nominal or par value.
Issued and outstanding 2019 2018
Number Number of Shares Amount of Shares Amount First Preference Shares (in thousands) (in millions) (in thousands) (in millions)
Series F 5,000 $ 122 5,000 $ 122Series G 9,200 225 9,200 225Series H 7,025 172 7,025 172Series I 2,975 73 2,975 73Series J 8,000 196 8,000 196Series K 10,000 244 10,000 244Series M 24,000 591 24,000 591
66,200 $ 1,623 66,200 $ 1,623
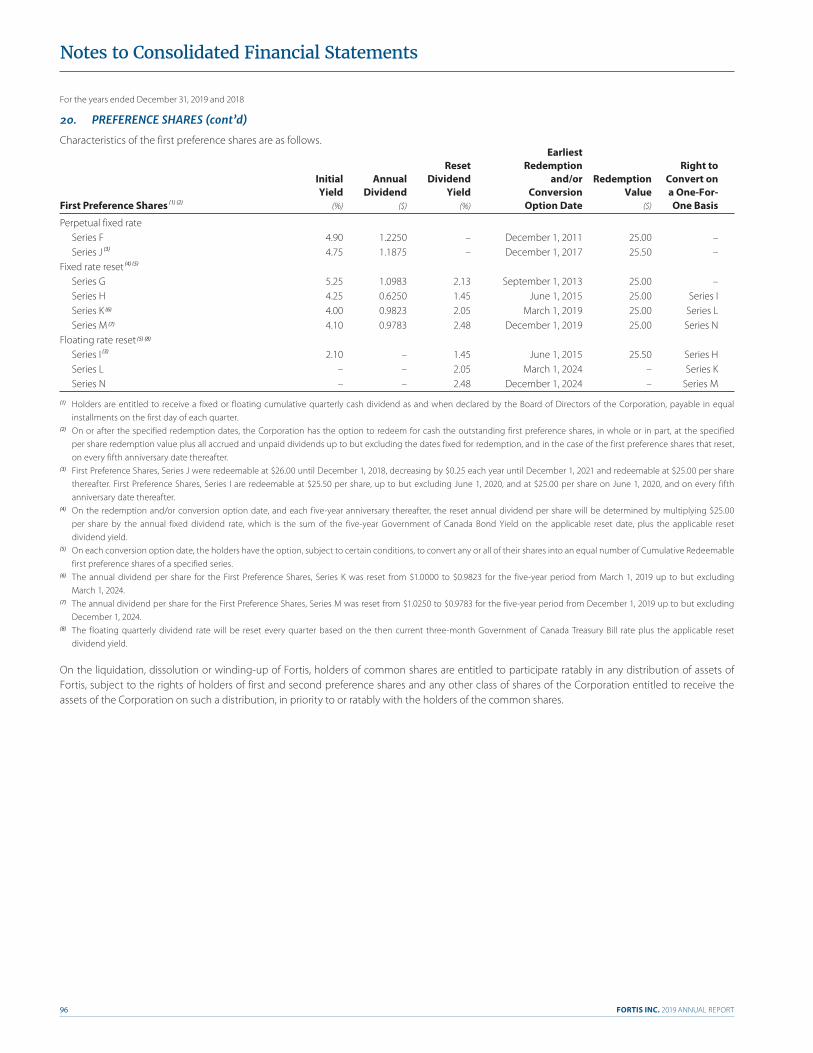
For the years ended December 31, 2019 and 2018
FORTIS INC. 2019 ANNUAL REPORT96
Notes to Consolidated Financial Statements
Characteristics of the first preference shares are as follows. Earliest Reset Redemption Right to Initial Annual Dividend and/or Redemption Convert on Yield Dividend Yield Conversion Value a One-For-First Preference Shares (1) (2) (%) ($) (%) Option Date ($) One Basis
Perpetual fixed rate Series F 4.90 1.2250 – December 1, 2011 25.00 – Series J (3) 4.75 1.1875 – December 1, 2017 25.50 –Fixed rate reset (4) (5) Series G 5.25 1.0983 2.13 September 1, 2013 25.00 – Series H 4.25 0.6250 1.45 June 1, 2015 25.00 Series I Series K (6) 4.00 0.9823 2.05 March 1, 2019 25.00 Series L Series M (7) 4.10 0.9783 2.48 December 1, 2019 25.00 Series NFloating rate reset (5) (8)
Series I (3) 2.10 – 1.45 June 1, 2015 25.50 Series H Series L – – 2.05 March 1, 2024 – Series K Series N – – 2.48 December 1, 2024 – Series M
(1) Holders are entitled to receive a fixed or floating cumulative quarterly cash dividend as and when declared by the Board of Directors of the Corporation, payable in equal installments on the first day of each quarter.
(2) On or after the specified redemption dates, the Corporation has the option to redeem for cash the outstanding first preference shares, in whole or in part, at the specified per share redemption value plus all accrued and unpaid dividends up to but excluding the dates fixed for redemption, and in the case of the first preference shares that reset, on every fifth anniversary date thereafter.
(3) First Preference Shares, Series J were redeemable at $26.00 until December 1, 2018, decreasing by $0.25 each year until December 1, 2021 and redeemable at $25.00 per share thereafter. First Preference Shares, Series I are redeemable at $25.50 per share, up to but excluding June 1, 2020, and at $25.00 per share on June 1, 2020, and on every fifth anniversary date thereafter.
(4) On the redemption and/or conversion option date, and each five-year anniversary thereafter, the reset annual dividend per share will be determined by multiplying $25.00 per share by the annual fixed dividend rate, which is the sum of the five-year Government of Canada Bond Yield on the applicable reset date, plus the applicable reset dividend yield.
(5) On each conversion option date, the holders have the option, subject to certain conditions, to convert any or all of their shares into an equal number of Cumulative Redeemable first preference shares of a specified series.
(6) The annual dividend per share for the First Preference Shares, Series K was reset from $1.0000 to $0.9823 for the five-year period from March 1, 2019 up to but excluding March 1, 2024.
(7) The annual dividend per share for the First Preference Shares, Series M was reset from $1.0250 to $0.9783 for the five-year period from December 1, 2019 up to but excluding December 1, 2024.
(8) The floating quarterly dividend rate will be reset every quarter based on the then current three-month Government of Canada Treasury Bill rate plus the applicable reset dividend yield.
On the liquidation, dissolution or winding-up of Fortis, holders of common shares are entitled to participate ratably in any distribution of assets of Fortis, subject to the rights of holders of first and second preference shares and any other class of shares of the Corporation entitled to receive the assets of the Corporation on such a distribution, in priority to or ratably with the holders of the common shares.
20. PREFERENCE SHARES (cont’d)

FORTIS INC. 2019 ANNUAL REPORT 97
Notes to Consolidated Financial Statements
21. ACCUMULATED OTHER COMPREHENSIVE INCOME
(in millions) Opening Balance Net Change Ending Balance
2019Unrealized foreign currency translation gains (losses)Net investments in foreign operations $ 1,470 $ (757) $ 713Hedges of net investments in foreign operations (544) 185 (359)Income tax recovery (expense) 10 (13) (3)
936 (585) 351
Other Cash flow hedges (Note 28) 11 6 17Unrealized employee future benefits losses (Note 26) (20) (18) (38)Income tax recovery 1 5 6
(8) (7) (15)
Accumulated other comprehensive income $ 928 $ (592) $ 336
2018 Unrealized foreign currency translation gains (losses) Net investments in foreign operations $ 247 $ 1,223 $ 1,470Hedges of net investments in foreign operations (172) (372) (544)Income tax (expense) recovery (1) 11 10
74 862 936
OtherCash flow hedges (Note 28) 10 1 11Unrealized employee future benefits (losses) gains (Note 26) (26) 6 (20)Income tax recovery (expense) 3 (2) 1
(13) 5 (8)
Accumulated other comprehensive income $ 61 $ 867 $ 928
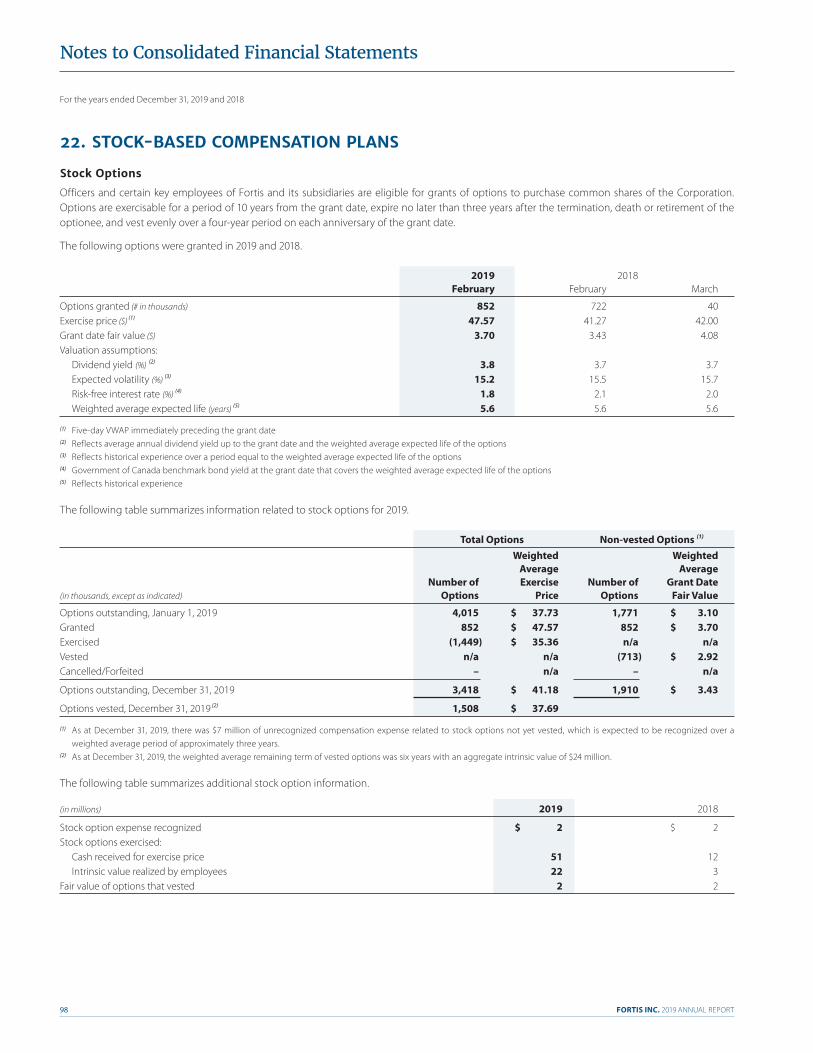
For the years ended December 31, 2019 and 2018
FORTIS INC. 2019 ANNUAL REPORT98
Notes to Consolidated Financial Statements
22. STOCK-BASED COMPENSATION PLANS
Stock Options
Officers and certain key employees of Fortis and its subsidiaries are eligible for grants of options to purchase common shares of the Corporation. Options are exercisable for a period of 10 years from the grant date, expire no later than three years after the termination, death or retirement of the optionee, and vest evenly over a four-year period on each anniversary of the grant date.
The following options were granted in 2019 and 2018.
2019 2018 February February March
Options granted (# in thousands) 852 722 40Exercise price ($) (1) 47.57 41.27 42.00Grant date fair value ($) 3.70 3.43 4.08Valuation assumptions: Dividend yield (%) (2) 3.8 3.7 3.7 Expected volatility (%) (3) 15.2 15.5 15.7 Risk-free interest rate (%) (4) 1.8 2.1 2.0 Weighted average expected life (years) (5) 5.6 5.6 5.6
(1) Five-day VWAP immediately preceding the grant date(2) Reflects average annual dividend yield up to the grant date and the weighted average expected life of the options(3) Reflects historical experience over a period equal to the weighted average expected life of the options(4) Government of Canada benchmark bond yield at the grant date that covers the weighted average expected life of the options(5) Reflects historical experience
The following table summarizes information related to stock options for 2019.
Total Options Non-vested Options (1)
Weighted Weighted Average Average Number of Exercise Number of Grant Date (in thousands, except as indicated) Options Price Options Fair Value
Options outstanding, January 1, 2019 4,015 $ 37.73 1,771 $ 3.10Granted 852 $ 47.57 852 $ 3.70Exercised (1,449) $ 35.36 n/a n/aVested n/a n/a (713) $ 2.92Cancelled/Forfeited – n/a – n/a
Options outstanding, December 31, 2019 3,418 $ 41.18 1,910 $ 3.43
Options vested, December 31, 2019 (2) 1,508 $ 37.69
(1) As at December 31, 2019, there was $7 million of unrecognized compensation expense related to stock options not yet vested, which is expected to be recognized over a weighted average period of approximately three years.
(2) As at December 31, 2019, the weighted average remaining term of vested options was six years with an aggregate intrinsic value of $24 million.
The following table summarizes additional stock option information.
(in millions) 2019 2018
Stock option expense recognized $ 2 $ 2Stock options exercised: Cash received for exercise price 51 12 Intrinsic value realized by employees 22 3Fair value of options that vested 2 2
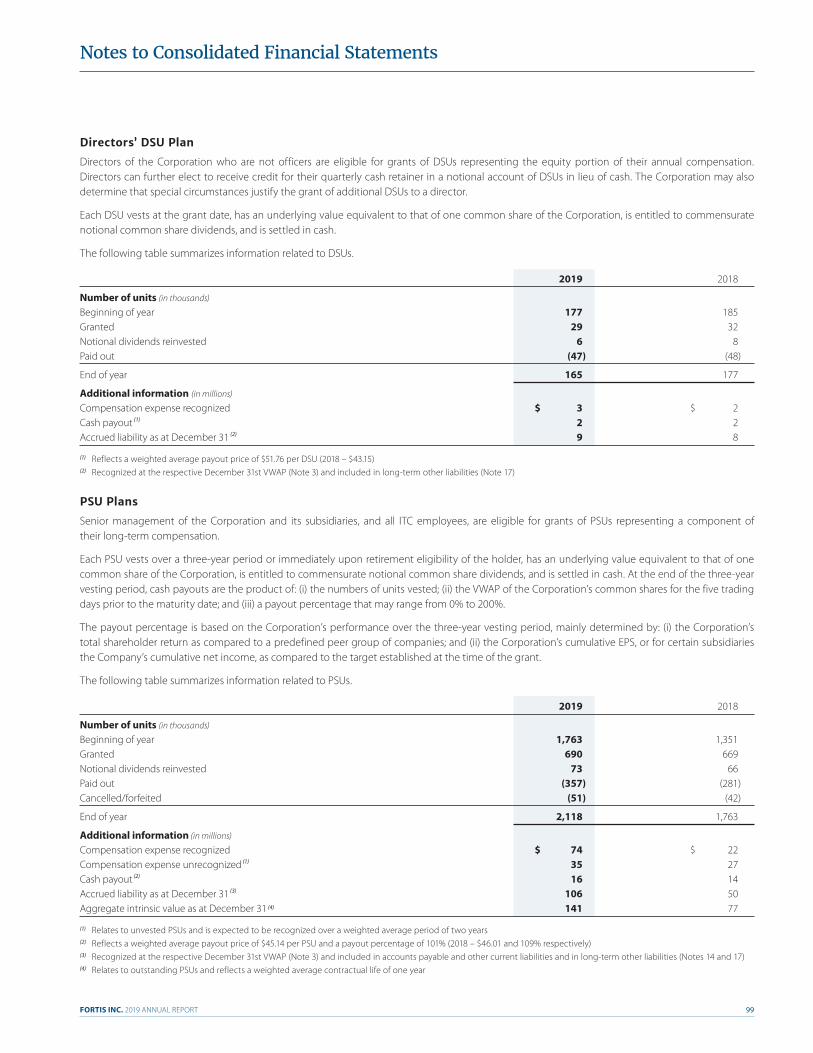
FORTIS INC. 2019 ANNUAL REPORT 99
Notes to Consolidated Financial Statements
Directors’ DSU Plan
Directors of the Corporation who are not officers are eligible for grants of DSUs representing the equity portion of their annual compensation. Directors can further elect to receive credit for their quarterly cash retainer in a notional account of DSUs in lieu of cash. The Corporation may also determine that special circumstances justify the grant of additional DSUs to a director.
Each DSU vests at the grant date, has an underlying value equivalent to that of one common share of the Corporation, is entitled to commensurate notional common share dividends, and is settled in cash.
The following table summarizes information related to DSUs.
2019 2018
Number of units (in thousands)
Beginning of year 177 185Granted 29 32Notional dividends reinvested 6 8Paid out (47) (48)
End of year 165 177
Additional information (in millions)
Compensation expense recognized $ 3 $ 2Cash payout (1) 2 2Accrued liability as at December 31 (2) 9 8
(1) Reflects a weighted average payout price of $51.76 per DSU (2018 – $43.15)(2) Recognized at the respective December 31st VWAP (Note 3) and included in long-term other liabilities (Note 17)
PSU Plans
Senior management of the Corporation and its subsidiaries, and all ITC employees, are eligible for grants of PSUs representing a component of their long-term compensation.
Each PSU vests over a three-year period or immediately upon retirement eligibility of the holder, has an underlying value equivalent to that of one common share of the Corporation, is entitled to commensurate notional common share dividends, and is settled in cash. At the end of the three-year vesting period, cash payouts are the product of: (i) the numbers of units vested; (ii) the VWAP of the Corporation’s common shares for the five trading days prior to the maturity date; and (iii) a payout percentage that may range from 0% to 200%.
The payout percentage is based on the Corporation’s performance over the three-year vesting period, mainly determined by: (i) the Corporation’s total shareholder return as compared to a predefined peer group of companies; and (ii) the Corporation’s cumulative EPS, or for certain subsidiaries the Company’s cumulative net income, as compared to the target established at the time of the grant.
The following table summarizes information related to PSUs.
2019 2018
Number of units (in thousands)
Beginning of year 1,763 1,351Granted 690 669Notional dividends reinvested 73 66Paid out (357) (281)Cancelled/forfeited (51) (42)
End of year 2,118 1,763
Additional information (in millions)
Compensation expense recognized $ 74 $ 22Compensation expense unrecognized (1) 35 27Cash payout (2) 16 14Accrued liability as at December 31 (3) 106 50Aggregate intrinsic value as at December 31 (4) 141 77
(1) Relates to unvested PSUs and is expected to be recognized over a weighted average period of two years(2) Reflects a weighted average payout price of $45.14 per PSU and a payout percentage of 101% (2018 – $46.01 and 109% respectively)(3) Recognized at the respective December 31st VWAP (Note 3) and included in accounts payable and other current liabilities and in long-term other liabilities (Notes 14 and 17)(4) Relates to outstanding PSUs and reflects a weighted average contractual life of one year
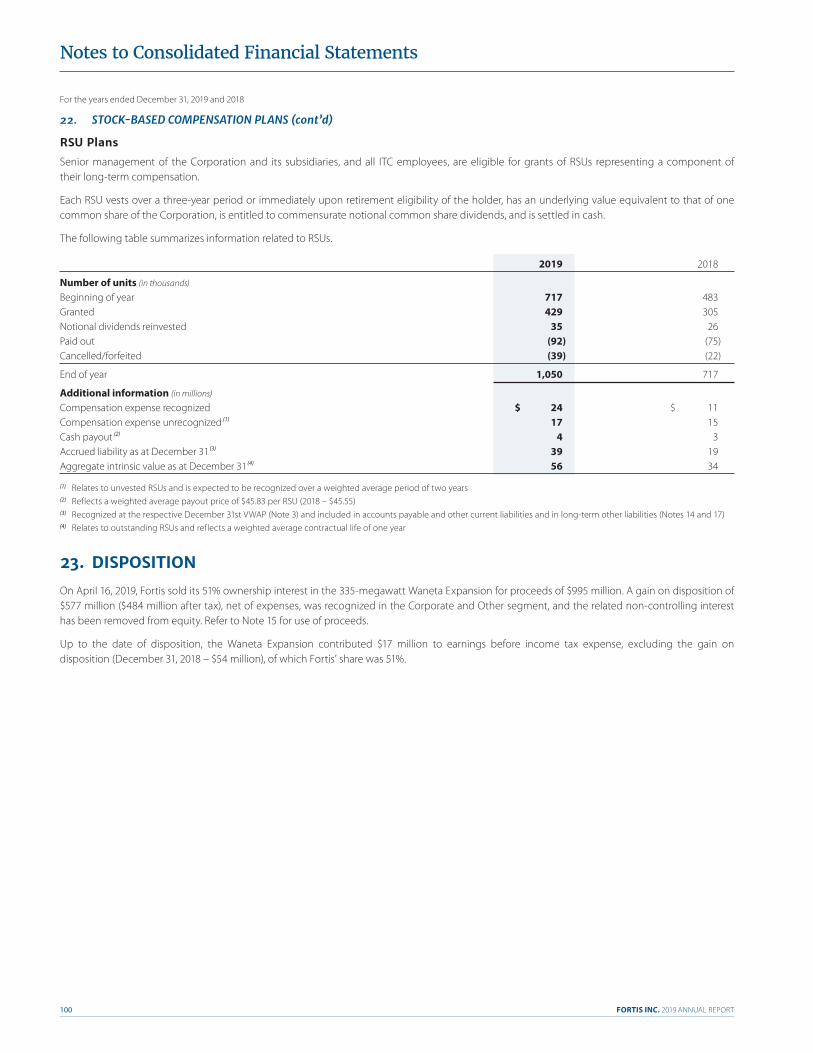
For the years ended December 31, 2019 and 2018
FORTIS INC. 2019 ANNUAL REPORT100
Notes to Consolidated Financial Statements
RSU Plans
Senior management of the Corporation and its subsidiaries, and all ITC employees, are eligible for grants of RSUs representing a component of their long-term compensation.
Each RSU vests over a three-year period or immediately upon retirement eligibility of the holder, has an underlying value equivalent to that of one common share of the Corporation, is entitled to commensurate notional common share dividends, and is settled in cash.
The following table summarizes information related to RSUs.
2019 2018
Number of units (in thousands) Beginning of year 717 483Granted 429 305Notional dividends reinvested 35 26Paid out (92) (75)Cancelled/forfeited (39) (22)
End of year 1,050 717
Additional information (in millions)
Compensation expense recognized $ 24 $ 11Compensation expense unrecognized (1) 17 15Cash payout (2) 4 3Accrued liability as at December 31 (3) 39 19Aggregate intrinsic value as at December 31 (4) 56 34
(1) Relates to unvested RSUs and is expected to be recognized over a weighted average period of two years(2) Reflects a weighted average payout price of $45.83 per RSU (2018 – $45.55)(3) Recognized at the respective December 31st VWAP (Note 3) and included in accounts payable and other current liabilities and in long-term other liabilities (Notes 14 and 17)(4) Relates to outstanding RSUs and reflects a weighted average contractual life of one year
23. DISPOSITION
On April 16, 2019, Fortis sold its 51% ownership interest in the 335-megawatt Waneta Expansion for proceeds of $995 million. A gain on disposition of $577 million ($484 million after tax), net of expenses, was recognized in the Corporate and Other segment, and the related non-controlling interest has been removed from equity. Refer to Note 15 for use of proceeds.
Up to the date of disposition, the Waneta Expansion contributed $17 million to earnings before income tax expense, excluding the gain on disposition (December 31, 2018 – $54 million), of which Fortis’ share was 51%.
22. STOCK-BASED COMPENSATION PLANS (cont’d)
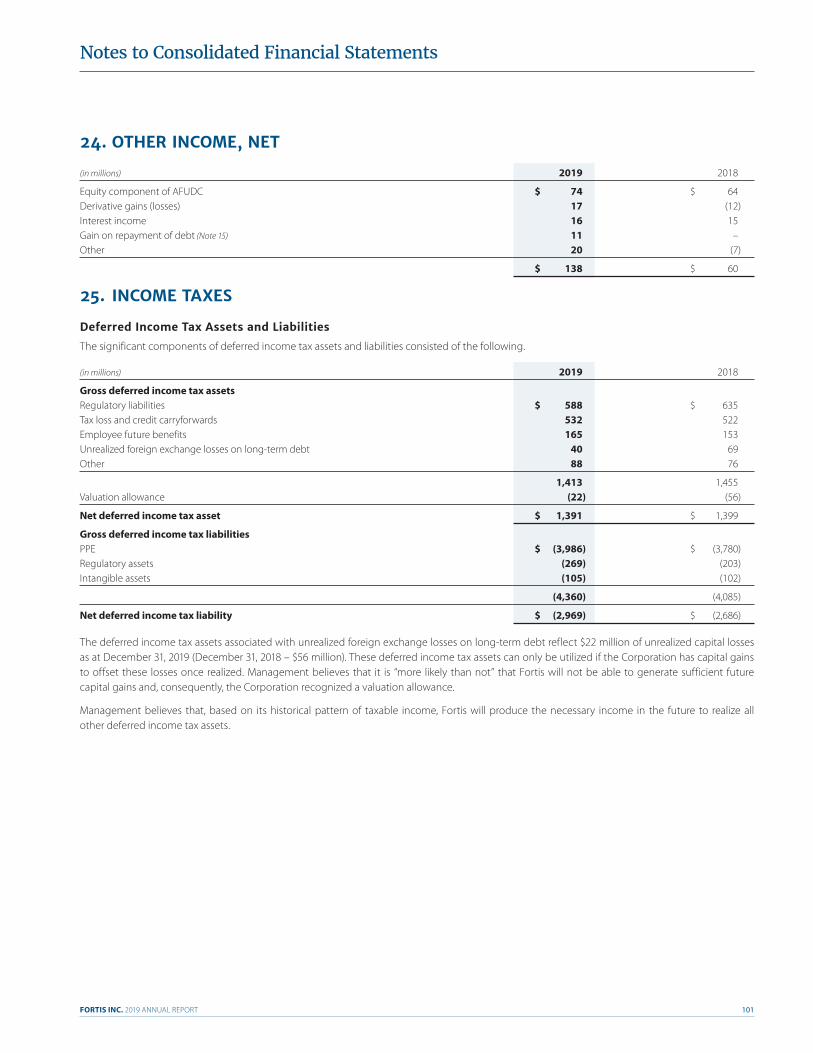
FORTIS INC. 2019 ANNUAL REPORT 101
Notes to Consolidated Financial Statements
24. OTHER INCOME, NET
(in millions) 2019 2018
Equity component of AFUDC $ 74 $ 64Derivative gains (losses) 17 (12)Interest income 16 15Gain on repayment of debt (Note 15) 11 –Other 20 (7)
$ 138 $ 60
25. INCOME TAXES
Deferred Income Tax Assets and Liabilities
The significant components of deferred income tax assets and liabilities consisted of the following.
(in millions) 2019 2018
Gross deferred income tax assets Regulatory liabilities $ 588 $ 635Tax loss and credit carryforwards 532 522Employee future benefits 165 153Unrealized foreign exchange losses on long-term debt 40 69Other 88 76
1,413 1,455Valuation allowance (22) (56)
Net deferred income tax asset $ 1,391 $ 1,399
Gross deferred income tax liabilitiesPPE $ (3,986) $ (3,780)Regulatory assets (269) (203)Intangible assets (105) (102)
(4,360) (4,085)
Net deferred income tax liability $ (2,969) $ (2,686)
The deferred income tax assets associated with unrealized foreign exchange losses on long-term debt reflect $22 million of unrealized capital losses as at December 31, 2019 (December 31, 2018 – $56 million). These deferred income tax assets can only be utilized if the Corporation has capital gains to offset these losses once realized. Management believes that it is “more likely than not” that Fortis will not be able to generate sufficient future capital gains and, consequently, the Corporation recognized a valuation allowance.
Management believes that, based on its historical pattern of taxable income, Fortis will produce the necessary income in the future to realize all other deferred income tax assets.
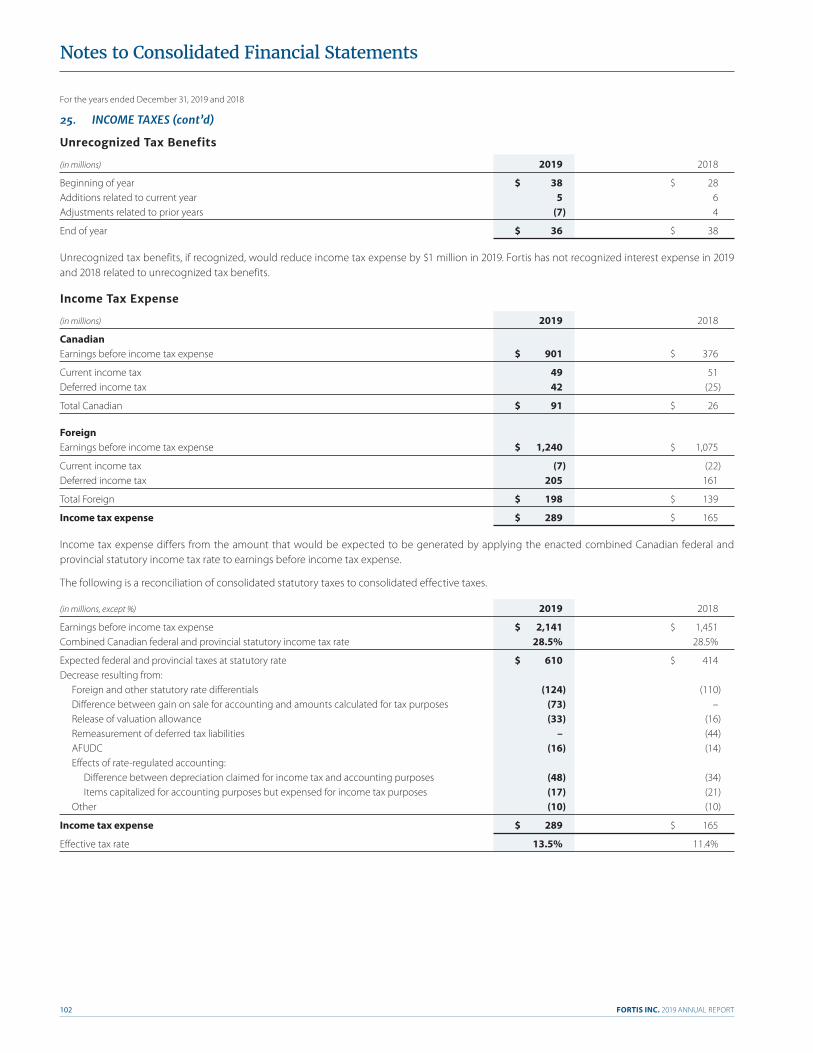
For the years ended December 31, 2019 and 2018
FORTIS INC. 2019 ANNUAL REPORT102
Notes to Consolidated Financial Statements
Unrecognized Tax Benefits
(in millions) 2019 2018
Beginning of year $ 38 $ 28Additions related to current year 5 6Adjustments related to prior years (7) 4
End of year $ 36 $ 38
Unrecognized tax benefits, if recognized, would reduce income tax expense by $1 million in 2019. Fortis has not recognized interest expense in 2019 and 2018 related to unrecognized tax benefits.
Income Tax Expense
(in millions) 2019 2018
CanadianEarnings before income tax expense $ 901 $ 376
Current income tax 49 51Deferred income tax 42 (25)
Total Canadian $ 91 $ 26
ForeignEarnings before income tax expense $ 1,240 $ 1,075
Current income tax (7) (22)Deferred income tax 205 161
Total Foreign $ 198 $ 139
Income tax expense $ 289 $ 165
Income tax expense differs from the amount that would be expected to be generated by applying the enacted combined Canadian federal and provincial statutory income tax rate to earnings before income tax expense.
The following is a reconciliation of consolidated statutory taxes to consolidated effective taxes. (in millions, except %) 2019 2018
Earnings before income tax expense $ 2,141 $ 1,451Combined Canadian federal and provincial statutory income tax rate 28.5% 28.5%
Expected federal and provincial taxes at statutory rate $ 610 $ 414Decrease resulting from: Foreign and other statutory rate differentials (124) (110) Difference between gain on sale for accounting and amounts calculated for tax purposes (73) – Release of valuation allowance (33) (16) Remeasurement of deferred tax liabilities – (44) AFUDC (16) (14) Effects of rate-regulated accounting: Difference between depreciation claimed for income tax and accounting purposes (48) (34) Items capitalized for accounting purposes but expensed for income tax purposes (17) (21) Other (10) (10)
Income tax expense $ 289 $ 165
Effective tax rate 13.5% 11.4%
25. INCOME TAXES (cont’d)

FORTIS INC. 2019 ANNUAL REPORT 103
Notes to Consolidated Financial Statements
Income Tax Carryforwards
(in millions) Expiring Year 2019
CanadianCapital loss n/a $ 19Non-capital loss 2028–2039 110Other tax credits 2026–2038 2
131Unrecognized (14)
117
ForeignFederal and state net operating loss 2020–2039 2,929Other tax credits 2023–2039 74
3,003
Total income tax carryforwards recognized as at December 31 $ 3,120
The Corporation and certain of its subsidiaries are subject to taxation in Canada, the United States and other foreign jurisdictions. The material jurisdictions in which the Corporation is subject to potential income tax compliance examinations include the United States (Federal, Arizona, Kansas, Iowa, Michigan, Minnesota and New York) and Canada (Federal and British Columbia). The Corporation’s 2013 to 2019 taxation years are still open for audit in Canadian jurisdictions and its 2016 to 2019 taxation years are still open for audit in United States jurisdictions.
26. EMPLOYEE FUTURE BENEFITS
For defined benefit pension and OPEB plans, the benefit obligation and fair value of plan assets are measured as at December 31.
For the Corporation’s Canadian and Caribbean subsidiaries, actuarial valuations to determine funding contributions for pension plans are required at least every three years. The most recent valuations were as of December 31, 2016 for FortisBC Electric and FortisBC Energy (plans covering unionized employees); December 31, 2017 for Newfoundland Power, FortisAlberta, FortisOntario and the Corporation; December 31, 2018 for FortisBC Energy (plan covering non-unionized employees); and December 31, 2019 for Caribbean Utilities.
ITC, UNS Energy and Central Hudson perform annual actuarial valuations as their funding requirements are based on maintaining minimum annual targets, all of which have been met.
The Corporation’s investment policy is to ensure that the defined benefit pension and OPEB plan assets, together with expected contributions, are invested in a prudent and cost-effective manner to optimally meet the liabilities of the plans. The investment objective is to maximize returns in order to manage the funded status of the plans and minimize the Corporation’s cost over the long term, as measured by both cash contributions and recognized expense.
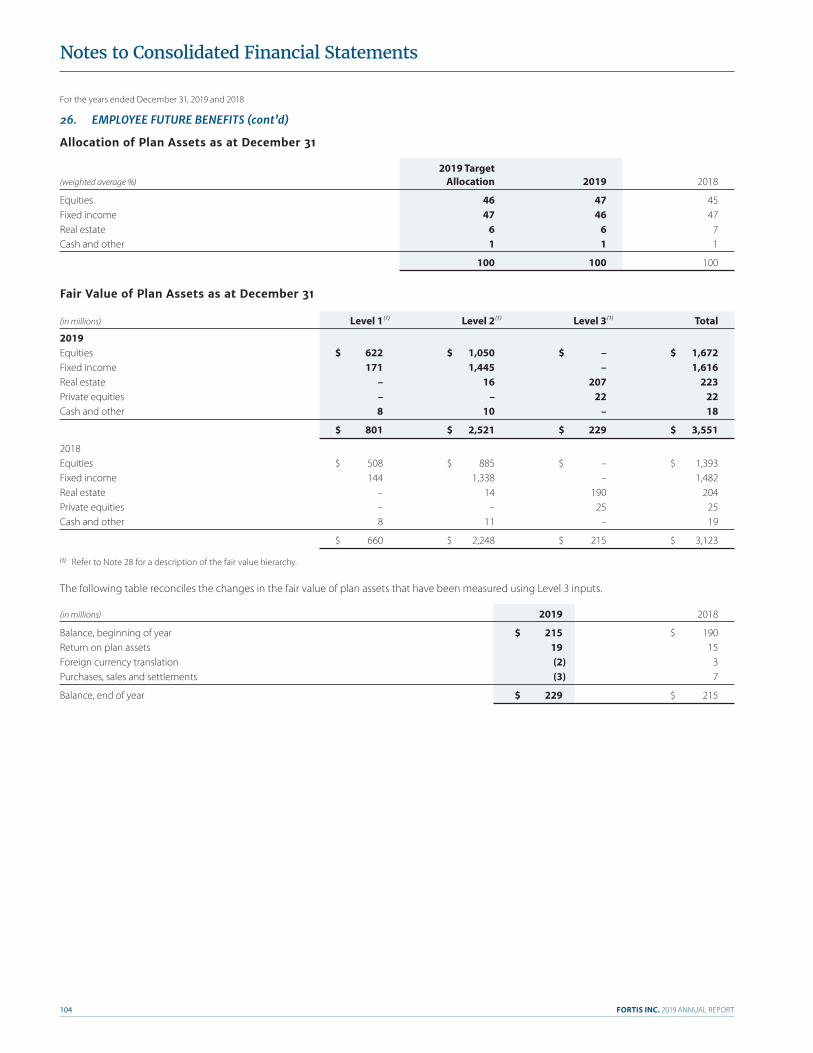
For the years ended December 31, 2019 and 2018
FORTIS INC. 2019 ANNUAL REPORT104
Notes to Consolidated Financial Statements
Allocation of Plan Assets as at December 31
2019 Target (weighted average %) Allocation 2019 2018
Equities 46 47 45Fixed income 47 46 47Real estate 6 6 7Cash and other 1 1 1
100 100 100
Fair Value of Plan Assets as at December 31
(in millions) Level 1 (1) Level 2 (1) Level 3 (1) Total
2019Equities $ 622 $ 1,050 $ – $ 1,672Fixed income 171 1,445 – 1,616Real estate – 16 207 223Private equities – – 22 22Cash and other 8 10 – 18
$ 801 $ 2,521 $ 229 $ 3,551
2018Equities $ 508 $ 885 $ – $ 1,393Fixed income 144 1,338 – 1,482Real estate – 14 190 204Private equities – – 25 25Cash and other 8 11 – 19
$ 660 $ 2,248 $ 215 $ 3,123
(1) Refer to Note 28 for a description of the fair value hierarchy.
The following table reconciles the changes in the fair value of plan assets that have been measured using Level 3 inputs.
(in millions) 2019 2018
Balance, beginning of year $ 215 $ 190Return on plan assets 19 15Foreign currency translation (2) 3Purchases, sales and settlements (3) 7
Balance, end of year $ 229 $ 215
26. EMPLOYEE FUTURE BENEFITS (cont’d)
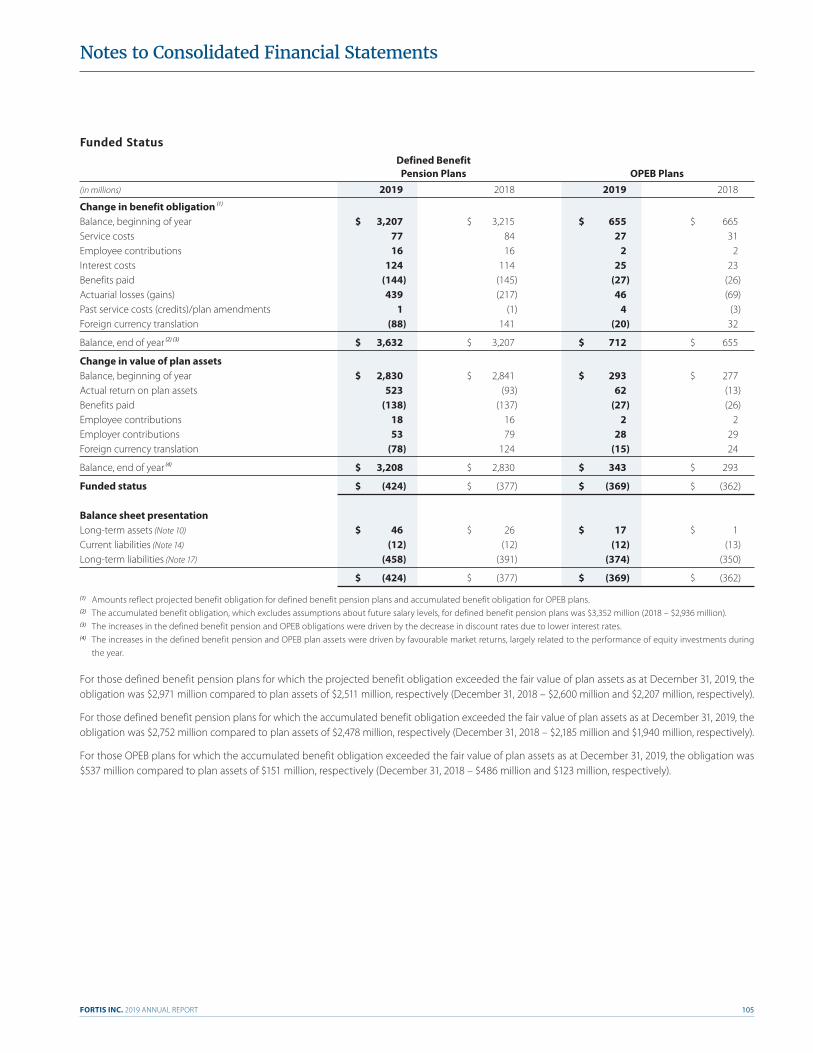
FORTIS INC. 2019 ANNUAL REPORT 105
Notes to Consolidated Financial Statements
Funded Status Defined Benefit Pension Plans OPEB Plans (in millions) 2019 2018 2019 2018
Change in benefit obligation (1)
Balance, beginning of year $ 3,207 $ 3,215 $ 655 $ 665Service costs 77 84 27 31Employee contributions 16 16 2 2Interest costs 124 114 25 23Benefits paid (144) (145) (27) (26)Actuarial losses (gains) 439 (217) 46 (69)Past service costs (credits)/plan amendments 1 (1) 4 (3)Foreign currency translation (88) 141 (20) 32
Balance, end of year (2) (3) $ 3,632 $ 3,207 $ 712 $ 655
Change in value of plan assetsBalance, beginning of year $ 2,830 $ 2,841 $ 293 $ 277Actual return on plan assets 523 (93) 62 (13)Benefits paid (138) (137) (27) (26)Employee contributions 18 16 2 2Employer contributions 53 79 28 29Foreign currency translation (78) 124 (15) 24
Balance, end of year (4) $ 3,208 $ 2,830 $ 343 $ 293
Funded status $ (424) $ (377) $ (369) $ (362) Balance sheet presentationLong-term assets (Note 10) $ 46 $ 26 $ 17 $ 1Current liabilities (Note 14) (12) (12) (12) (13)Long-term liabilities (Note 17) (458) (391) (374) (350)
$ (424) $ (377) $ (369) $ (362)
(1) Amounts reflect projected benefit obligation for defined benefit pension plans and accumulated benefit obligation for OPEB plans.(2) The accumulated benefit obligation, which excludes assumptions about future salary levels, for defined benefit pension plans was $3,352 million (2018 – $2,936 million).(3) The increases in the defined benefit pension and OPEB obligations were driven by the decrease in discount rates due to lower interest rates.(4) The increases in the defined benefit pension and OPEB plan assets were driven by favourable market returns, largely related to the performance of equity investments during
the year.
For those defined benefit pension plans for which the projected benefit obligation exceeded the fair value of plan assets as at December 31, 2019, the obligation was $2,971 million compared to plan assets of $2,511 million, respectively (December 31, 2018 – $2,600 million and $2,207 million, respectively).
For those defined benefit pension plans for which the accumulated benefit obligation exceeded the fair value of plan assets as at December 31, 2019, the obligation was $2,752 million compared to plan assets of $2,478 million, respectively (December 31, 2018 – $2,185 million and $1,940 million, respectively).
For those OPEB plans for which the accumulated benefit obligation exceeded the fair value of plan assets as at December 31, 2019, the obligation was $537 million compared to plan assets of $151 million, respectively (December 31, 2018 – $486 million and $123 million, respectively).
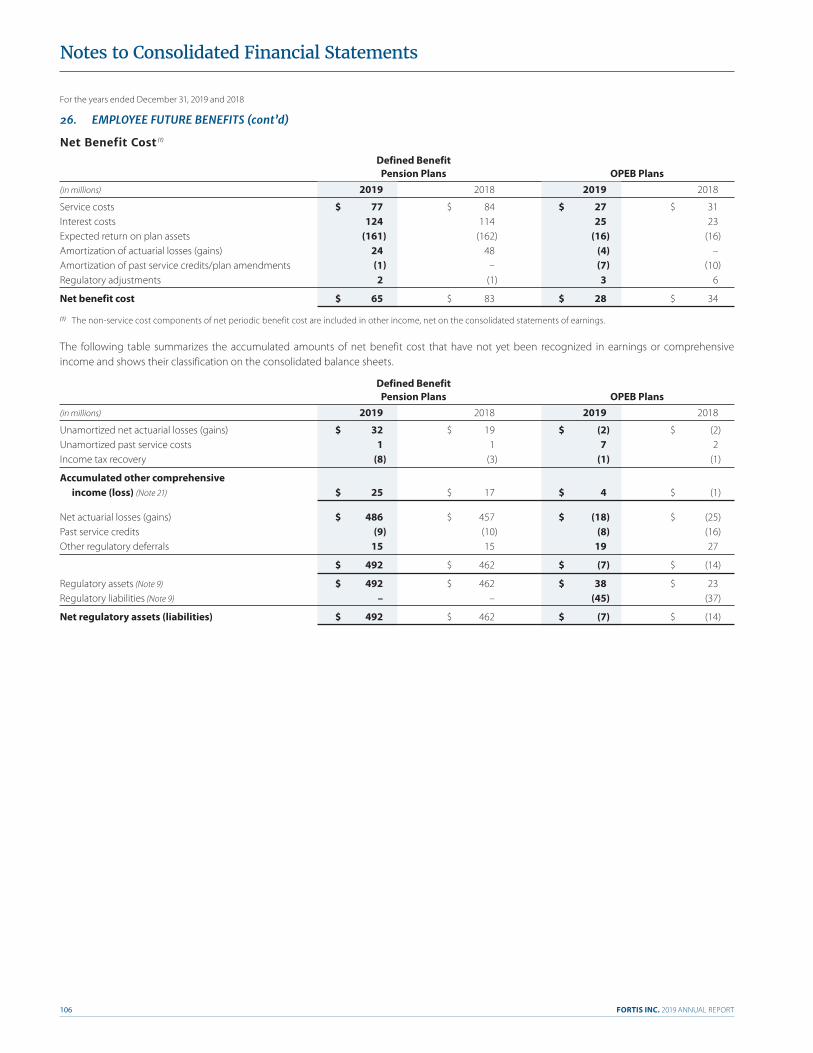
For the years ended December 31, 2019 and 2018
FORTIS INC. 2019 ANNUAL REPORT106
Notes to Consolidated Financial Statements
Net Benefit Cost (1)
Defined Benefit Pension Plans OPEB Plans (in millions) 2019 2018 2019 2018
Service costs $ 77 $ 84 $ 27 $ 31Interest costs 124 114 25 23Expected return on plan assets (161) (162) (16) (16)Amortization of actuarial losses (gains) 24 48 (4) –Amortization of past service credits/plan amendments (1) – (7) (10)Regulatory adjustments 2 (1) 3 6
Net benefit cost $ 65 $ 83 $ 28 $ 34
(1) The non-service cost components of net periodic benefit cost are included in other income, net on the consolidated statements of earnings.
The following table summarizes the accumulated amounts of net benefit cost that have not yet been recognized in earnings or comprehensive income and shows their classification on the consolidated balance sheets.
Defined Benefit Pension Plans OPEB Plans (in millions) 2019 2018 2019 2018
Unamortized net actuarial losses (gains) $ 32 $ 19 $ (2) $ (2)Unamortized past service costs 1 1 7 2Income tax recovery (8) (3) (1) (1)
Accumulated other comprehensive income (loss) (Note 21) $ 25 $ 17 $ 4 $ (1)
Net actuarial losses (gains) $ 486 $ 457 $ (18) $ (25)Past service credits (9) (10) (8) (16)Other regulatory deferrals 15 15 19 27
$ 492 $ 462 $ (7) $ (14)
Regulatory assets (Note 9) $ 492 $ 462 $ 38 $ 23Regulatory liabilities (Note 9) – – (45) (37)
Net regulatory assets (liabilities) $ 492 $ 462 $ (7) $ (14)
26. EMPLOYEE FUTURE BENEFITS (cont’d)
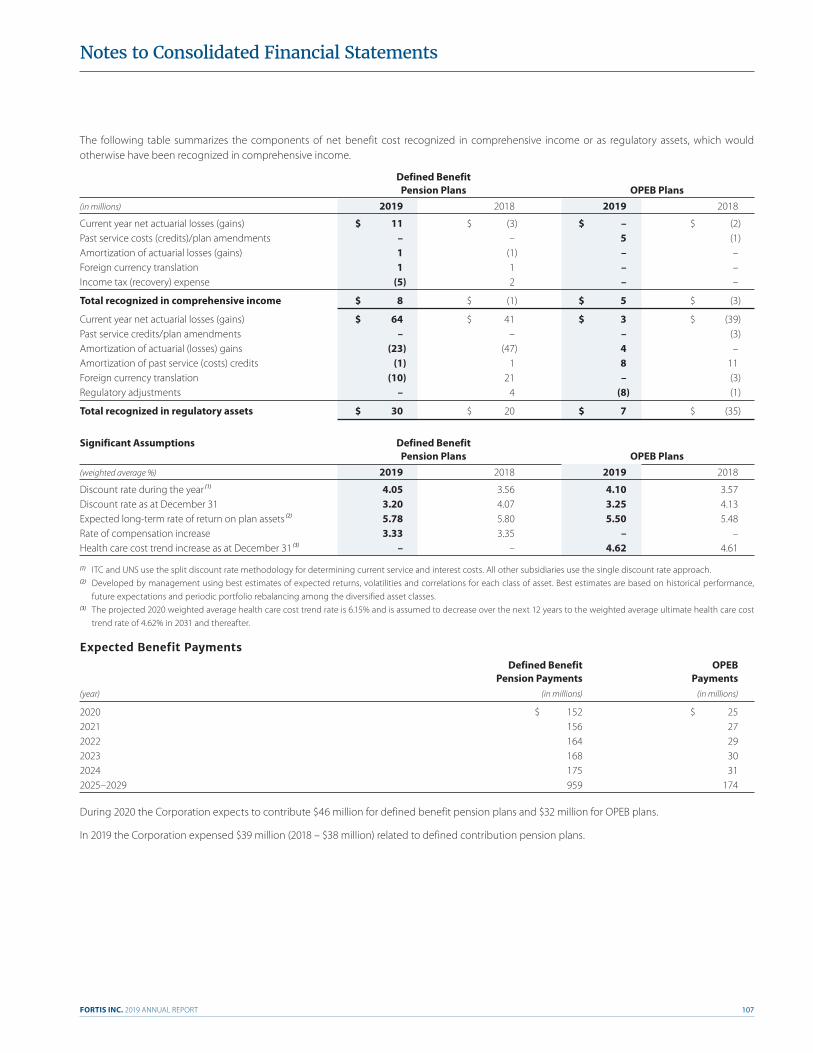
FORTIS INC. 2019 ANNUAL REPORT 107
Notes to Consolidated Financial Statements
The following table summarizes the components of net benefit cost recognized in comprehensive income or as regulatory assets, which would otherwise have been recognized in comprehensive income.
Defined Benefit Pension Plans OPEB Plans (in millions) 2019 2018 2019 2018
Current year net actuarial losses (gains) $ 11 $ (3) $ – $ (2)Past service costs (credits)/plan amendments – – 5 (1)Amortization of actuarial losses (gains) 1 (1) – –Foreign currency translation 1 1 – –Income tax (recovery) expense (5) 2 – –
Total recognized in comprehensive income $ 8 $ (1) $ 5 $ (3)
Current year net actuarial losses (gains) $ 64 $ 41 $ 3 $ (39)Past service credits/plan amendments – – – (3)Amortization of actuarial (losses) gains (23) (47) 4 –Amortization of past service (costs) credits (1) 1 8 11Foreign currency translation (10) 21 – (3)Regulatory adjustments – 4 (8) (1)
Total recognized in regulatory assets $ 30 $ 20 $ 7 $ (35)
Significant Assumptions Defined Benefit Pension Plans OPEB Plans (weighted average %) 2019 2018 2019 2018
Discount rate during the year (1) 4.05 3.56 4.10 3.57Discount rate as at December 31 3.20 4.07 3.25 4.13Expected long-term rate of return on plan assets (2) 5.78 5.80 5.50 5.48Rate of compensation increase 3.33 3.35 – –Health care cost trend increase as at December 31 (3) – – 4.62 4.61
(1) ITC and UNS use the split discount rate methodology for determining current service and interest costs. All other subsidiaries use the single discount rate approach.(2) Developed by management using best estimates of expected returns, volatilities and correlations for each class of asset. Best estimates are based on historical performance,
future expectations and periodic portfolio rebalancing among the diversified asset classes.(3) The projected 2020 weighted average health care cost trend rate is 6.15% and is assumed to decrease over the next 12 years to the weighted average ultimate health care cost
trend rate of 4.62% in 2031 and thereafter.
Expected Benefit Payments Defined Benefit OPEB Pension Payments Payments (year) (in millions) (in millions)
2020 $ 152 $ 252021 156 272022 164 292023 168 302024 175 312025–2029 959 174
During 2020 the Corporation expects to contribute $46 million for defined benefit pension plans and $32 million for OPEB plans.
In 2019 the Corporation expensed $39 million (2018 – $38 million) related to defined contribution pension plans.
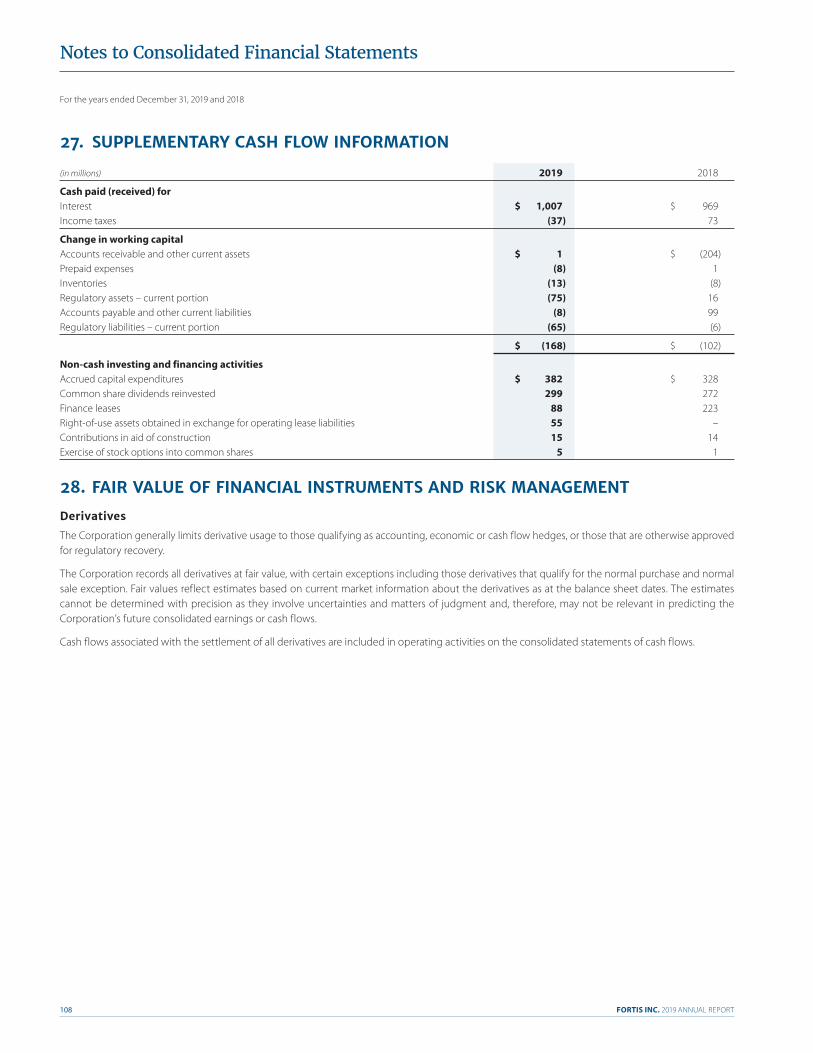
For the years ended December 31, 2019 and 2018
FORTIS INC. 2019 ANNUAL REPORT108
Notes to Consolidated Financial Statements
27. SUPPLEMENTARY CASH FLOW INFORMATION
(in millions) 2019 2018
Cash paid (received) forInterest $ 1,007 $ 969Income taxes (37) 73
Change in working capitalAccounts receivable and other current assets $ 1 $ (204)Prepaid expenses (8) 1Inventories (13) (8)Regulatory assets – current portion (75) 16Accounts payable and other current liabilities (8) 99Regulatory liabilities – current portion (65) (6)
$ (168) $ (102)
Non-cash investing and financing activitiesAccrued capital expenditures $ 382 $ 328Common share dividends reinvested 299 272Finance leases 88 223Right-of-use assets obtained in exchange for operating lease liabilities 55 –Contributions in aid of construction 15 14Exercise of stock options into common shares 5 1
28. FAIR VALUE OF FINANCIAL INSTRUMENTS AND RISK MANAGEMENT
Derivatives
The Corporation generally limits derivative usage to those qualifying as accounting, economic or cash flow hedges, or those that are otherwise approved for regulatory recovery.
The Corporation records all derivatives at fair value, with certain exceptions including those derivatives that qualify for the normal purchase and normal sale exception. Fair values reflect estimates based on current market information about the derivatives as at the balance sheet dates. The estimates cannot be determined with precision as they involve uncertainties and matters of judgment and, therefore, may not be relevant in predicting the Corporation’s future consolidated earnings or cash flows.
Cash flows associated with the settlement of all derivatives are included in operating activities on the consolidated statements of cash flows.

FORTIS INC. 2019 ANNUAL REPORT 109
Notes to Consolidated Financial Statements
Energy Contracts Subject to Regulatory Deferral
UNS Energy holds electricity power purchase contracts, customer supply contracts and gas swap contracts to reduce its exposure to energy price risk. Fair values were measured primarily under the market approach using independent third-party information, where possible. When published prices are not available, adjustments are applied based on historical price curve relationships, transmission costs and line losses.
Central Hudson holds swap contracts for electricity and natural gas to minimize price volatility by fixing the effective purchase price. Fair values were measured using forward pricing provided by independent third-party information.
FortisBC Energy holds gas supply contracts and commodity swaps to fix the effective purchase price of natural gas. Fair values reflect the present value of future cash flows based on published market prices and forward natural gas curves.
Unrealized gains or losses associated with changes in the fair value of these energy contracts are deferred as a regulatory asset or liability for recovery from, or refund to, customers in future rates, as permitted by the regulators. As at December 31, 2019, unrealized losses of $119 million (December 31, 2018 – $57 million) were recognized as regulatory assets and unrealized gains of $2 million (December 31, 2018 – $9 million) were recognized as regulatory liabilities.
Energy Contracts Not Subject to Regulatory Deferral
UNS Energy holds wholesale trading contracts to fix power prices and realize potential margin, of which 10% of any realized gains is shared with customers through rate stabilization accounts. Fair values were measured using a market approach utilizing independent third-party information, where possible.
Aitken Creek holds gas swap contracts to manage its exposure to changes in natural gas prices, capture natural gas price spreads, and manage the financial risk posed by physical transactions. Fair values were measured using forward pricing from published market sources.
Unrealized gains or losses associated with changes in the fair value of these energy contracts are recognized in revenue. During 2019 unrealized losses of $16 million (2018 – unrealized losses of $12 million) were recognized in revenue.
Total Return Swaps
The Corporation holds total return swaps to manage the cash flow risk associated with forecasted future cash settlements of certain stock-based compensation obligations. The swaps have a combined notional amount of $111 million and terms of one to three years expiring in January 2020, 2021 and 2022. Fair value was measured using an income valuation approach based on forward pricing curves. During 2019 unrealized gains of $11 million (2018 – unrealized gains of less than $1 million) were recognized in other income, net.
Foreign Exchange Contracts
The Corporation holds US dollar foreign exchange contracts to help mitigate exposure to volatility of foreign exchange rates. The contracts expire in 2020 and have a combined notional amount of $166 million. Fair value was measured using independent third-party information. During 2019 unrealized gains of $11 million (2018 – unrealized losses of $11 million) were recognized in other income, net.
Interest Rate Swaps
During 2019 ITC entered into forward-starting interest rate swaps to manage the interest rate risk associated with the refinancing of long-term debt due in June 2021. The swaps have a combined notional value of $260 million and five-year terms with a mandatory early termination provision. The swaps will be terminated no later than the effective date of November 2020. Fair value was measured using a discounted cash flow method based on LIBOR rates. Unrealized gains and losses associated with changes in fair value are recognized in other comprehensive income, will be reclassified to earnings as a component of interest expense over the life of the debt, and were not material for 2019 and 2018.
Other Investments
ITC, UNS Energy and Central Hudson hold investments in trust associated with supplemental retirement benefit plans for select employees. These investments consist of mutual funds and money market accounts, which are recorded at fair value based on quoted market prices in active markets. Gains and losses on these funds are recognized in other income, net and were not material for 2019 and 2018.
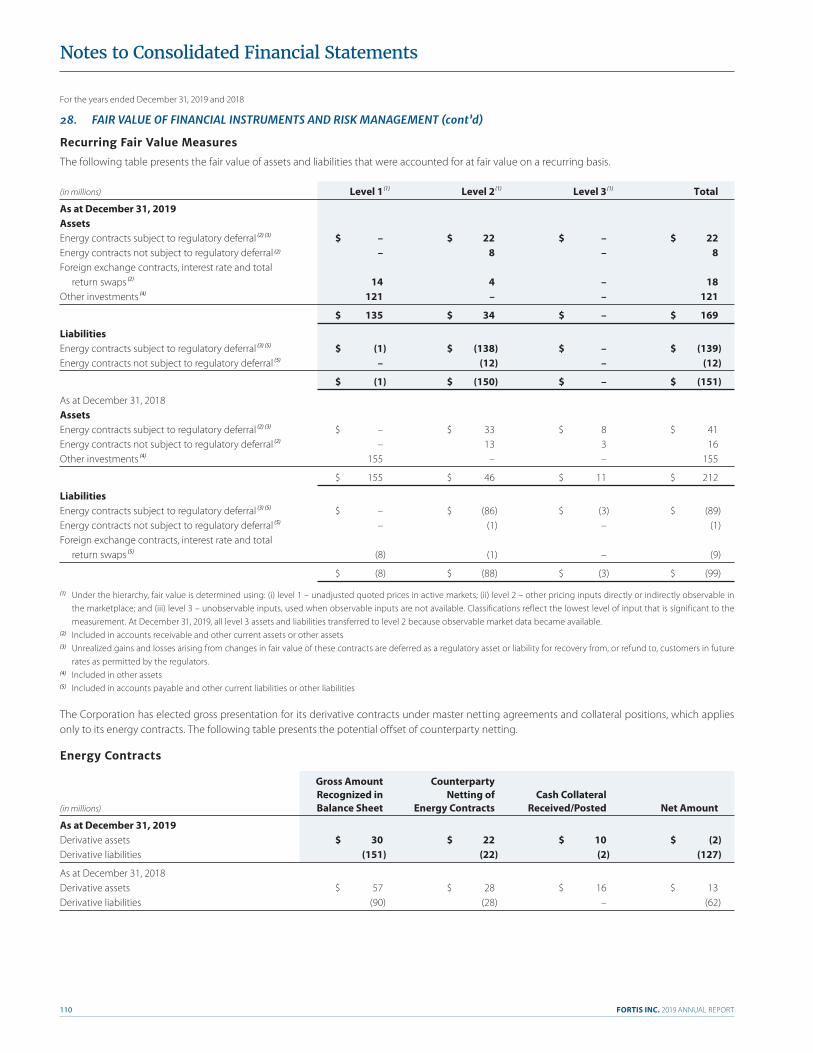
For the years ended December 31, 2019 and 2018
FORTIS INC. 2019 ANNUAL REPORT110
Notes to Consolidated Financial Statements
Recurring Fair Value Measures
The following table presents the fair value of assets and liabilities that were accounted for at fair value on a recurring basis.
(in millions) Level 1 (1) Level 2 (1) Level 3 (1) Total
As at December 31, 2019AssetsEnergy contracts subject to regulatory deferral (2) (3) $ – $ 22 $ – $ 22Energy contracts not subject to regulatory deferral (2) – 8 – 8Foreign exchange contracts, interest rate and total return swaps (2) 14 4 – 18Other investments (4) 121 – – 121
$ 135 $ 34 $ – $ 169
LiabilitiesEnergy contracts subject to regulatory deferral (3) (5) $ (1) $ (138) $ – $ (139)Energy contracts not subject to regulatory deferral (5) – (12) – (12)
$ (1) $ (150) $ – $ (151)
As at December 31, 2018AssetsEnergy contracts subject to regulatory deferral (2) (3) $ – $ 33 $ 8 $ 41Energy contracts not subject to regulatory deferral (2) – 13 3 16Other investments (4) 155 – – 155
$ 155 $ 46 $ 11 $ 212
LiabilitiesEnergy contracts subject to regulatory deferral (3) (5) $ – $ (86) $ (3) $ (89)Energy contracts not subject to regulatory deferral (5) – (1) – (1)Foreign exchange contracts, interest rate and total return swaps (5) (8) (1) – (9)
$ (8) $ (88) $ (3) $ (99)
(1) Under the hierarchy, fair value is determined using: (i) level 1 – unadjusted quoted prices in active markets; (ii) level 2 – other pricing inputs directly or indirectly observable in the marketplace; and (iii) level 3 – unobservable inputs, used when observable inputs are not available. Classifications reflect the lowest level of input that is significant to the measurement. At December 31, 2019, all level 3 assets and liabilities transferred to level 2 because observable market data became available.
(2) Included in accounts receivable and other current assets or other assets(3) Unrealized gains and losses arising from changes in fair value of these contracts are deferred as a regulatory asset or liability for recovery from, or refund to, customers in future
rates as permitted by the regulators.(4) Included in other assets(5) Included in accounts payable and other current liabilities or other liabilities
The Corporation has elected gross presentation for its derivative contracts under master netting agreements and collateral positions, which applies only to its energy contracts. The following table presents the potential offset of counterparty netting.
Energy Contracts
Gross Amount Counterparty Recognized in Netting of Cash Collateral (in millions) Balance Sheet Energy Contracts Received/Posted Net Amount
As at December 31, 2019Derivative assets $ 30 $ 22 $ 10 $ (2)Derivative liabilities (151) (22) (2) (127)
As at December 31, 2018Derivative assets $ 57 $ 28 $ 16 $ 13Derivative liabilities (90) (28) – (62)
28. FAIR VALUE OF FINANCIAL INSTRUMENTS AND RISK MANAGEMENT (cont’d)
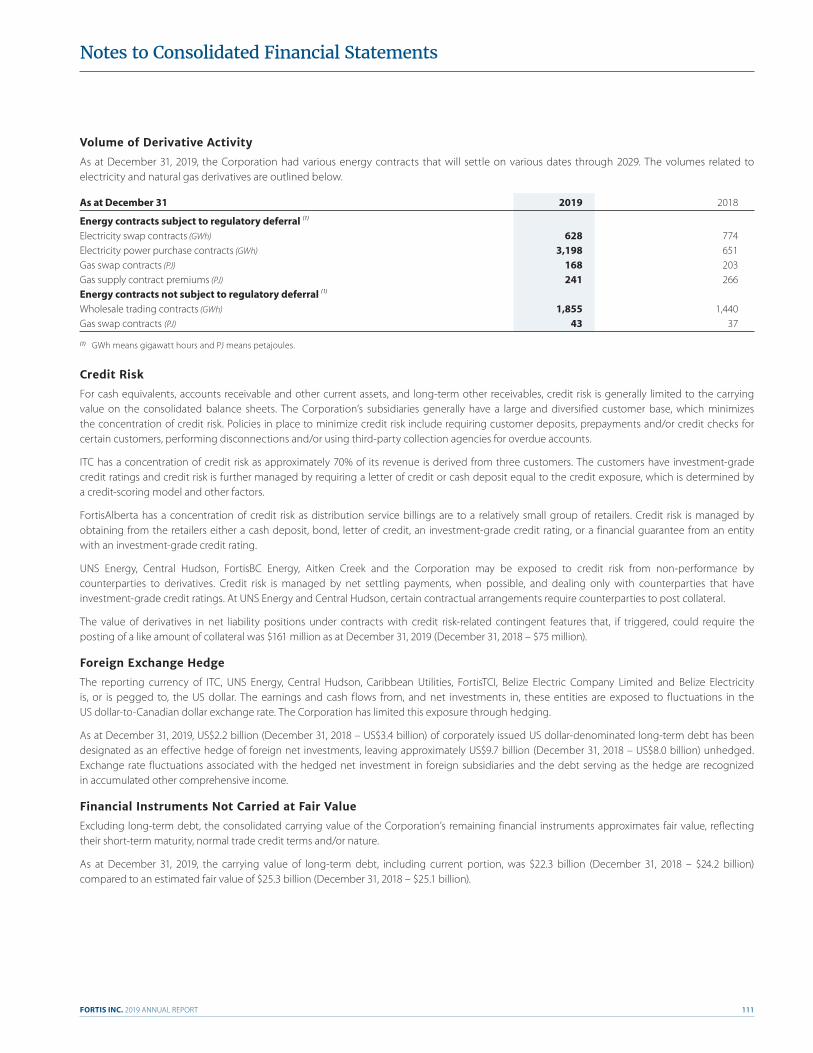
FORTIS INC. 2019 ANNUAL REPORT 111
Notes to Consolidated Financial Statements
Volume of Derivative Activity
As at December 31, 2019, the Corporation had various energy contracts that will settle on various dates through 2029. The volumes related to electricity and natural gas derivatives are outlined below.
As at December 31 2019 2018
Energy contracts subject to regulatory deferral (1)
Electricity swap contracts (GWh) 628 774Electricity power purchase contracts (GWh) 3,198 651Gas swap contracts (PJ) 168 203Gas supply contract premiums (PJ) 241 266Energy contracts not subject to regulatory deferral (1) Wholesale trading contracts (GWh) 1,855 1,440Gas swap contracts (PJ) 43 37
(1) GWh means gigawatt hours and PJ means petajoules.
Credit Risk
For cash equivalents, accounts receivable and other current assets, and long-term other receivables, credit risk is generally limited to the carrying value on the consolidated balance sheets. The Corporation’s subsidiaries generally have a large and diversified customer base, which minimizes the concentration of credit risk. Policies in place to minimize credit risk include requiring customer deposits, prepayments and/or credit checks for certain customers, performing disconnections and/or using third-party collection agencies for overdue accounts.
ITC has a concentration of credit risk as approximately 70% of its revenue is derived from three customers. The customers have investment-grade credit ratings and credit risk is further managed by requiring a letter of credit or cash deposit equal to the credit exposure, which is determined by a credit-scoring model and other factors.
FortisAlberta has a concentration of credit risk as distribution service billings are to a relatively small group of retailers. Credit risk is managed by obtaining from the retailers either a cash deposit, bond, letter of credit, an investment-grade credit rating, or a financial guarantee from an entity with an investment-grade credit rating.
UNS Energy, Central Hudson, FortisBC Energy, Aitken Creek and the Corporation may be exposed to credit risk from non-performance by counterparties to derivatives. Credit risk is managed by net settling payments, when possible, and dealing only with counterparties that have investment-grade credit ratings. At UNS Energy and Central Hudson, certain contractual arrangements require counterparties to post collateral.
The value of derivatives in net liability positions under contracts with credit risk-related contingent features that, if triggered, could require the posting of a like amount of collateral was $161 million as at December 31, 2019 (December 31, 2018 – $75 million).
Foreign Exchange Hedge
The reporting currency of ITC, UNS Energy, Central Hudson, Caribbean Utilities, FortisTCI, Belize Electric Company Limited and Belize Electricity is, or is pegged to, the US dollar. The earnings and cash flows from, and net investments in, these entities are exposed to fluctuations in the US dollar-to-Canadian dollar exchange rate. The Corporation has limited this exposure through hedging.
As at December 31, 2019, US$2.2 billion (December 31, 2018 – US$3.4 billion) of corporately issued US dollar-denominated long-term debt has been designated as an effective hedge of foreign net investments, leaving approximately US$9.7 billion (December 31, 2018 – US$8.0 billion) unhedged. Exchange rate fluctuations associated with the hedged net investment in foreign subsidiaries and the debt serving as the hedge are recognized in accumulated other comprehensive income.
Financial Instruments Not Carried at Fair Value
Excluding long-term debt, the consolidated carrying value of the Corporation’s remaining financial instruments approximates fair value, reflecting their short-term maturity, normal trade credit terms and/or nature.
As at December 31, 2019, the carrying value of long-term debt, including current portion, was $22.3 billion (December 31, 2018 – $24.2 billion) compared to an estimated fair value of $25.3 billion (December 31, 2018 – $25.1 billion).
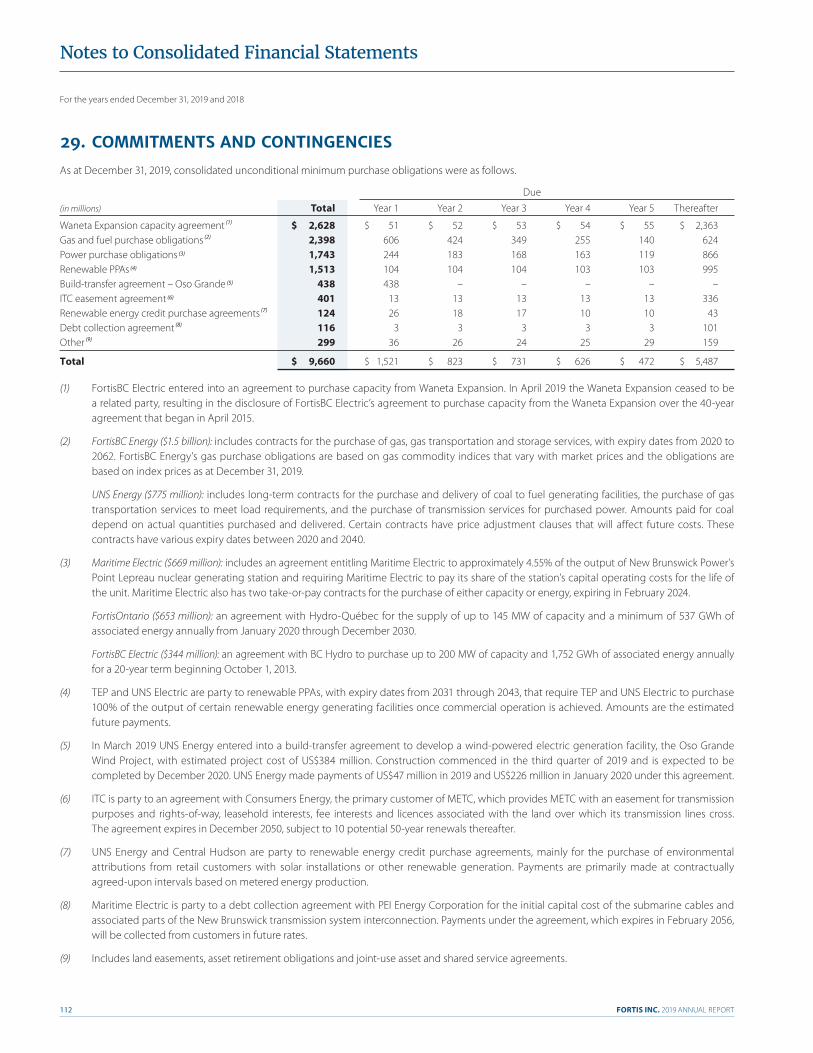
For the years ended December 31, 2019 and 2018
FORTIS INC. 2019 ANNUAL REPORT112
Notes to Consolidated Financial Statements
29. COMMITMENTS AND CONTINGENCIES
As at December 31, 2019, consolidated unconditional minimum purchase obligations were as follows.
Due
(in millions) Total Year 1 Year 2 Year 3 Year 4 Year 5 Thereafter
Waneta Expansion capacity agreement (1) $ 2,628 $ 51 $ 52 $ 53 $ 54 $ 55 $ 2,363Gas and fuel purchase obligations (2) 2,398 606 424 349 255 140 624Power purchase obligations (3) 1,743 244 183 168 163 119 866Renewable PPAs (4) 1,513 104 104 104 103 103 995Build-transfer agreement – Oso Grande (5) 438 438 – – – – –ITC easement agreement (6) 401 13 13 13 13 13 336Renewable energy credit purchase agreements (7) 124 26 18 17 10 10 43Debt collection agreement (8) 116 3 3 3 3 3 101Other (9) 299 36 26 24 25 29 159
Total $ 9,660 $ 1,521 $ 823 $ 731 $ 626 $ 472 $ 5,487
(1) FortisBC Electric entered into an agreement to purchase capacity from Waneta Expansion. In April 2019 the Waneta Expansion ceased to be a related party, resulting in the disclosure of FortisBC Electric’s agreement to purchase capacity from the Waneta Expansion over the 40-year agreement that began in April 2015.
(2) FortisBC Energy ($1.5 billion): includes contracts for the purchase of gas, gas transportation and storage services, with expiry dates from 2020 to 2062. FortisBC Energy’s gas purchase obligations are based on gas commodity indices that vary with market prices and the obligations are based on index prices as at December 31, 2019.
UNS Energy ($775 million): includes long-term contracts for the purchase and delivery of coal to fuel generating facilities, the purchase of gas transportation services to meet load requirements, and the purchase of transmission services for purchased power. Amounts paid for coal depend on actual quantities purchased and delivered. Certain contracts have price adjustment clauses that will affect future costs. These contracts have various expiry dates between 2020 and 2040.
(3) Maritime Electric ($669 million): includes an agreement entitling Maritime Electric to approximately 4.55% of the output of New Brunswick Power’s Point Lepreau nuclear generating station and requiring Maritime Electric to pay its share of the station’s capital operating costs for the life of the unit. Maritime Electric also has two take-or-pay contracts for the purchase of either capacity or energy, expiring in February 2024.
FortisOntario ($653 million): an agreement with Hydro-Québec for the supply of up to 145 MW of capacity and a minimum of 537 GWh of associated energy annually from January 2020 through December 2030.
FortisBC Electric ($344 million): an agreement with BC Hydro to purchase up to 200 MW of capacity and 1,752 GWh of associated energy annually for a 20-year term beginning October 1, 2013.
(4) TEP and UNS Electric are party to renewable PPAs, with expiry dates from 2031 through 2043, that require TEP and UNS Electric to purchase 100% of the output of certain renewable energy generating facilities once commercial operation is achieved. Amounts are the estimated future payments.
(5) In March 2019 UNS Energy entered into a build-transfer agreement to develop a wind-powered electric generation facility, the Oso Grande Wind Project, with estimated project cost of US$384 million. Construction commenced in the third quarter of 2019 and is expected to be completed by December 2020. UNS Energy made payments of US$47 million in 2019 and US$226 million in January 2020 under this agreement.
(6) ITC is party to an agreement with Consumers Energy, the primary customer of METC, which provides METC with an easement for transmission purposes and rights-of-way, leasehold interests, fee interests and licences associated with the land over which its transmission lines cross. The agreement expires in December 2050, subject to 10 potential 50-year renewals thereafter.
(7) UNS Energy and Central Hudson are party to renewable energy credit purchase agreements, mainly for the purchase of environmental attributions from retail customers with solar installations or other renewable generation. Payments are primarily made at contractually agreed-upon intervals based on metered energy production.
(8) Maritime Electric is party to a debt collection agreement with PEI Energy Corporation for the initial capital cost of the submarine cables and associated parts of the New Brunswick transmission system interconnection. Payments under the agreement, which expires in February 2056, will be collected from customers in future rates.
(9) Includes land easements, asset retirement obligations and joint-use asset and shared service agreements.

FORTIS INC. 2019 ANNUAL REPORT 113
Notes to Consolidated Financial Statements
Other Commitments
Under a funding framework with the Governments of Ontario and Canada, Fortis will contribute a minimum of approximately $155 million of equity capital to the Wataynikaneyap Partnership, based on Fortis’ proportionate 39% ownership interest and the final regulatory-approved capital cost of the related project. In October 2019 the Wataynikaneyap Partnership entered into loan agreements to finance the project during construction (“construction loan agreements”). In the event a lender under the construction loan agreements realizes security on the loans, Fortis may be required to accelerate its equity capital contributions, which may be in excess of the amount otherwise required of Fortis under the funding framework, to a maximum total funding of $235 million.
Central Hudson is a participant in an investment with other utilities to jointly develop, own and operate electric transmission projects in New York State. In December 2014 an application was filed with FERC for the recovery of the cost of and return on five high-voltage transmission projects totalling $2.2 billion (US$1.7 billion). Central Hudson’s maximum commitment is $236 million (US$182 million), for which it has issued a parental guarantee. As at December 31, 2019, there was no obligation under this guarantee.
As at December 31, 2019, FortisBC Holdings Inc. had $78 million (December 31, 2018 – $77 million) of parental guarantees outstanding to support storage optimization activities at Aitken Creek.
Contingency
In April 2013 FHI and Fortis were named as defendants in an action in the British Columbia Supreme Court by the Coldwater Indian Band (“Band”) regarding interests in a pipeline right of way on reserve lands. The pipeline was transferred by FHI (then Terasen Inc.) to Kinder Morgan Inc. in 2007. The Band seeks cancellation of the right of way and damages for wrongful interference with the Band’s use and enjoyment of reserve lands. In May 2016 the Federal Court dismissed the Band’s application for judicial review of the ministerial consent. In September 2017 the Federal Court of Appeal set aside the Minister’s consent and returned the matter to the Minister for redetermination. No amount has been accrued as the outcome cannot yet be reasonably determined.
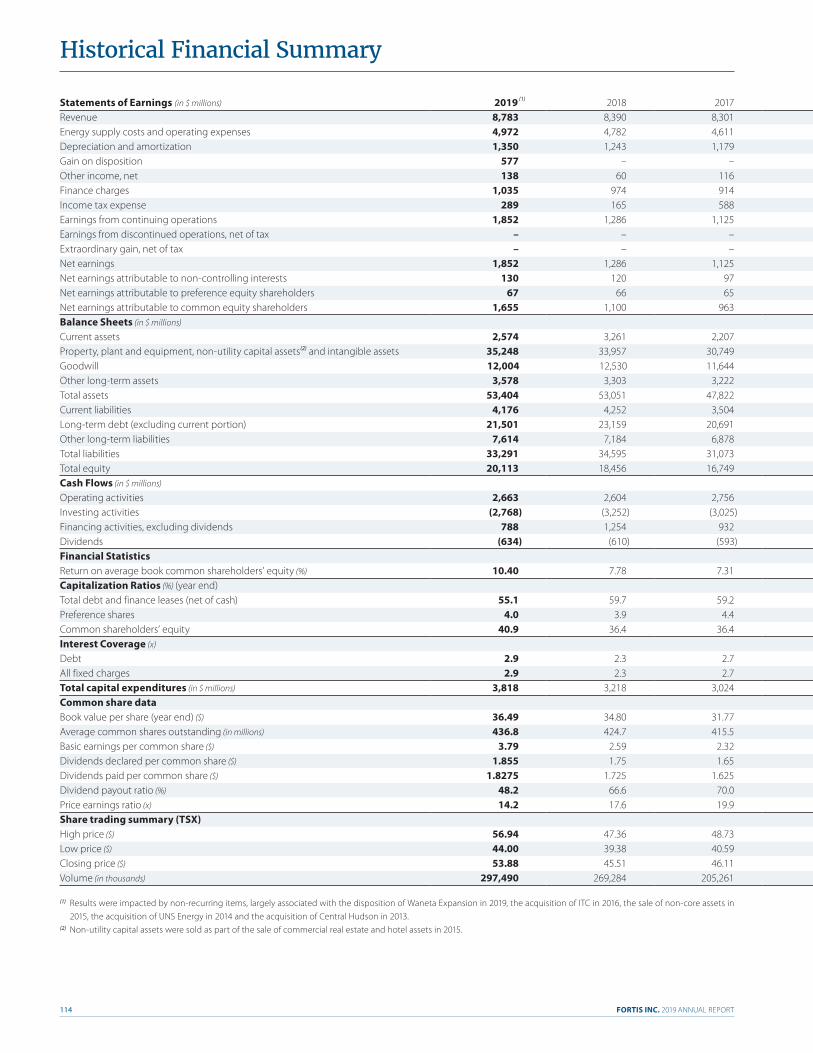
FORTIS INC. 2019 ANNUAL REPORT114
Historical Financial Summary
Statements of Earnings (in $ millions) 2019 (1) 2018 2017 2016 (1) 2015 (1) 2014 (1) 2013 (1) 2012 2011 2010
Revenue 8,783 8,390 8,301 6,838 6,757 5,401 4,047 3,654 3,738 3,647Energy supply costs and operating expenses 4,972 4,782 4,611 4,372 4,465 3,690 2,654 2,390 2,547 2,448Depreciation and amortization 1,350 1,243 1,179 983 873 688 541 470 416 406Gain on disposition 577 – – – – – – – – –Other income, net 138 60 116 53 197 (25) (31) 4 38 13Finance charges 1,035 974 914 678 553 547 389 366 363 359Income tax expense 289 165 588 145 223 66 32 61 84 72Earnings from continuing operations 1,852 1,286 1,125 713 840 385 400 371 366 375Earnings from discontinued operations, net of tax – – – – – 5 – – – –Extraordinary gain, net of tax – – – – – – 20 – – –Net earnings 1,852 1,286 1,125 713 840 390 420 371 366 375Net earnings attributable to non-controlling interests 130 120 97 53 35 11 10 9 9 10Net earnings attributable to preference equity shareholders 67 66 65 75 77 62 57 47 46 45Net earnings attributable to common equity shareholders 1,655 1,100 963 585 728 317 353 315 311 320Balance Sheets (in $ millions)
Current assets 2,574 3,261 2,207 2,166 1,857 1,787 1,296 1,093 1,132 1,205Property, plant and equipment, non-utility capital assets(2) and intangible assets 35,248 33,957 30,749 30,348 20,136 18,304 12,612 10,574 9,937 9,336Goodwill 12,004 12,530 11,644 12,364 4,173 3,732 2,075 1,568 1,565 1,561Other long-term assets 3,578 3,303 3,222 3,026 2,638 2,410 1,925 1,715 1,580 1,309Total assets 53,404 53,051 47,822 47,904 28,804 26,233 17,908 14,950 14,214 13,411Current liabilities 4,176 4,252 3,504 3,944 2,638 2,676 2,084 1,350 1,305 1,491Long-term debt (excluding current portion) 21,501 23,159 20,691 20,817 10,784 9,911 6,424 5,741 5,685 5,616Other long-term liabilities 7,614 7,184 6,878 6,693 5,029 4,534 3,024 2,449 2,281 1,977Total liabilities 33,291 34,595 31,073 31,454 18,451 17,121 11,532 9,540 9,271 9,084Total equity 20,113 18,456 16,749 16,450 10,353 9,112 6,376 5,410 4,943 4,327Cash Flows (in $ millions)
Operating activities 2,663 2,604 2,756 1,884 1,673 982 899 992 915 742Investing activities (2,768) (3,252) (3,025) (6,891) (1,368) (4,199) (2,164) (1,096) (1,115) (980)Financing activities, excluding dividends 788 1,254 932 5,491 (14) 3,627 1,434 396 386 451Dividends (634) (610) (593) (441) (332) (266) (248) (225) (206) (189)Financial StatisticsReturn on average book common shareholders’ equity (%) 10.40 7.78 7.31 5.56 9.75 5.45 8.06 8.06 8.79 10.06Capitalization Ratios (%) (year end)Total debt and finance leases (net of cash) 55.1 59.7 59.2 60.6 54.8 56.4 56.2 55.3 57.1 60.4Preference shares 4.0 3.9 4.4 4.4 8.3 9.1 9.0 9.7 8.3 8.7Common shareholders’ equity 40.9 36.4 36.4 35.0 36.9 34.5 34.8 35.0 34.6 30.9Interest Coverage (x)
Debt 2.9 2.3 2.7 2.1 2.7 1.6 1.9 2.0 2.0 2.0All fixed charges 2.9 2.3 2.7 2.1 2.7 1.6 1.9 2.0 2.0 2.0Total capital expenditures (in $ millions) 3,818 3,218 3,024 2,061 2,243 1,725 1,175 1,146 1,171 1,071Common share dataBook value per share (year end) ($) 36.49 34.80 31.77 32.31 28.62 24.89 22.38 20.84 20.25 18.65Average common shares outstanding (in millions) 436.8 424.7 415.5 308.9 278.6 225.6 202.5 190.0 181.6 172.9Basic earnings per common share ($) 3.79 2.59 2.32 1.89 2.61 1.41 1.74 1.66 1.71 1.85Dividends declared per common share ($) 1.855 1.75 1.65 1.55 1.43 1.30 1.25 1.21 1.17 1.41Dividends paid per common share ($) 1.8275 1.725 1.625 1.525 1.40 1.28 1.24 1.20 1.16 1.12Dividend payout ratio (%) 48.2 66.6 70.0 80.7 53.6 90.8 71.3 72.3 67.8 60.5Price earnings ratio (x) 14.2 17.6 19.9 21.9 14.3 27.6 17.5 20.6 19.5 18.4Share trading summary (TSX)High price ($) 56.94 47.36 48.73 44.87 42.23 40.83 35.14 34.98 35.45 34.54Low price ($) 44.00 39.38 40.59 35.53 34.16 29.78 29.51 31.70 28.24 21.60Closing price ($) 53.88 45.51 46.11 41.46 37.41 38.96 30.45 34.22 33.37 33.98Volume (in thousands) 297,490 269,284 205,261 293,991 172,038 174,566 120,470 115,962 126,341 120,855
(1) Results were impacted by non-recurring items, largely associated with the disposition of Waneta Expansion in 2019, the acquisition of ITC in 2016, the sale of non-core assets in 2015, the acquisition of UNS Energy in 2014 and the acquisition of Central Hudson in 2013.
(2) Non-utility capital assets were sold as part of the sale of commercial real estate and hotel assets in 2015.
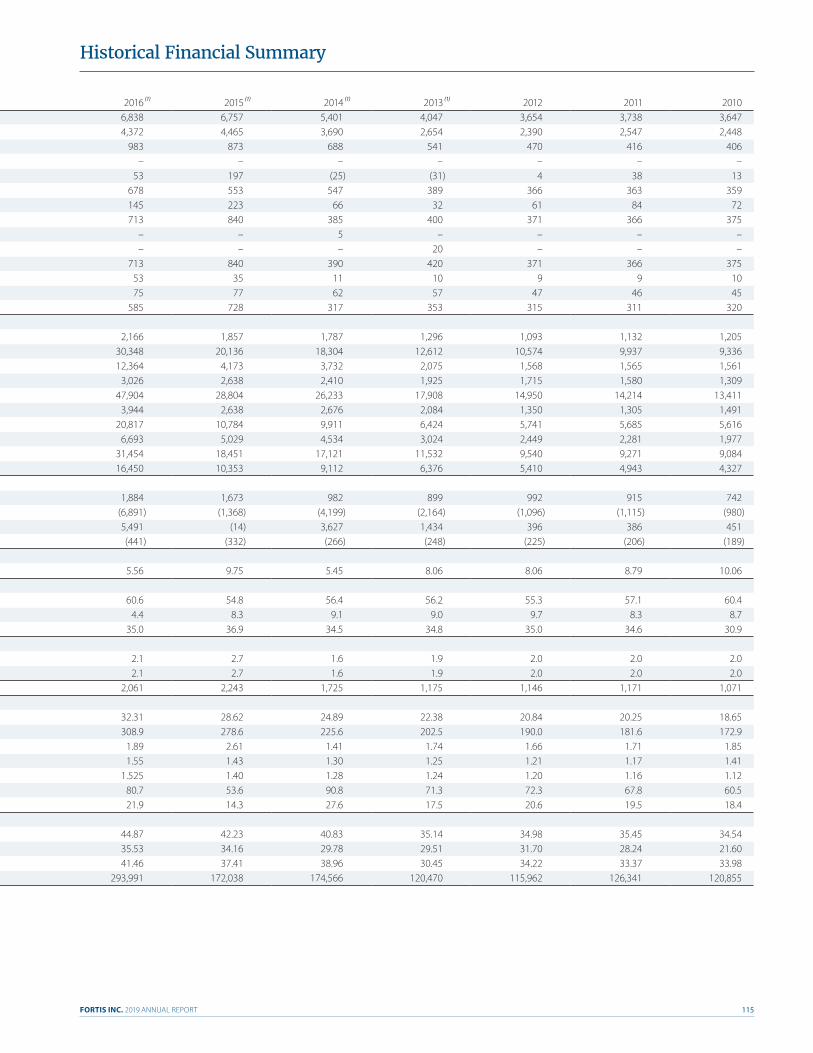
FORTIS INC. 2019 ANNUAL REPORT 115
Historical Financial Summary
Statements of Earnings (in $ millions) 2019 (1) 2018 2017 2016 (1) 2015 (1) 2014 (1) 2013 (1) 2012 2011 2010
Revenue 8,783 8,390 8,301 6,838 6,757 5,401 4,047 3,654 3,738 3,647Energy supply costs and operating expenses 4,972 4,782 4,611 4,372 4,465 3,690 2,654 2,390 2,547 2,448Depreciation and amortization 1,350 1,243 1,179 983 873 688 541 470 416 406Gain on disposition 577 – – – – – – – – –Other income, net 138 60 116 53 197 (25) (31) 4 38 13Finance charges 1,035 974 914 678 553 547 389 366 363 359Income tax expense 289 165 588 145 223 66 32 61 84 72Earnings from continuing operations 1,852 1,286 1,125 713 840 385 400 371 366 375Earnings from discontinued operations, net of tax – – – – – 5 – – – –Extraordinary gain, net of tax – – – – – – 20 – – –Net earnings 1,852 1,286 1,125 713 840 390 420 371 366 375Net earnings attributable to non-controlling interests 130 120 97 53 35 11 10 9 9 10Net earnings attributable to preference equity shareholders 67 66 65 75 77 62 57 47 46 45Net earnings attributable to common equity shareholders 1,655 1,100 963 585 728 317 353 315 311 320Balance Sheets (in $ millions)
Current assets 2,574 3,261 2,207 2,166 1,857 1,787 1,296 1,093 1,132 1,205Property, plant and equipment, non-utility capital assets(2) and intangible assets 35,248 33,957 30,749 30,348 20,136 18,304 12,612 10,574 9,937 9,336Goodwill 12,004 12,530 11,644 12,364 4,173 3,732 2,075 1,568 1,565 1,561Other long-term assets 3,578 3,303 3,222 3,026 2,638 2,410 1,925 1,715 1,580 1,309Total assets 53,404 53,051 47,822 47,904 28,804 26,233 17,908 14,950 14,214 13,411Current liabilities 4,176 4,252 3,504 3,944 2,638 2,676 2,084 1,350 1,305 1,491Long-term debt (excluding current portion) 21,501 23,159 20,691 20,817 10,784 9,911 6,424 5,741 5,685 5,616Other long-term liabilities 7,614 7,184 6,878 6,693 5,029 4,534 3,024 2,449 2,281 1,977Total liabilities 33,291 34,595 31,073 31,454 18,451 17,121 11,532 9,540 9,271 9,084Total equity 20,113 18,456 16,749 16,450 10,353 9,112 6,376 5,410 4,943 4,327Cash Flows (in $ millions)
Operating activities 2,663 2,604 2,756 1,884 1,673 982 899 992 915 742Investing activities (2,768) (3,252) (3,025) (6,891) (1,368) (4,199) (2,164) (1,096) (1,115) (980)Financing activities, excluding dividends 788 1,254 932 5,491 (14) 3,627 1,434 396 386 451Dividends (634) (610) (593) (441) (332) (266) (248) (225) (206) (189)Financial StatisticsReturn on average book common shareholders’ equity (%) 10.40 7.78 7.31 5.56 9.75 5.45 8.06 8.06 8.79 10.06Capitalization Ratios (%) (year end)Total debt and finance leases (net of cash) 55.1 59.7 59.2 60.6 54.8 56.4 56.2 55.3 57.1 60.4Preference shares 4.0 3.9 4.4 4.4 8.3 9.1 9.0 9.7 8.3 8.7Common shareholders’ equity 40.9 36.4 36.4 35.0 36.9 34.5 34.8 35.0 34.6 30.9Interest Coverage (x)
Debt 2.9 2.3 2.7 2.1 2.7 1.6 1.9 2.0 2.0 2.0All fixed charges 2.9 2.3 2.7 2.1 2.7 1.6 1.9 2.0 2.0 2.0Total capital expenditures (in $ millions) 3,818 3,218 3,024 2,061 2,243 1,725 1,175 1,146 1,171 1,071Common share dataBook value per share (year end) ($) 36.49 34.80 31.77 32.31 28.62 24.89 22.38 20.84 20.25 18.65Average common shares outstanding (in millions) 436.8 424.7 415.5 308.9 278.6 225.6 202.5 190.0 181.6 172.9Basic earnings per common share ($) 3.79 2.59 2.32 1.89 2.61 1.41 1.74 1.66 1.71 1.85Dividends declared per common share ($) 1.855 1.75 1.65 1.55 1.43 1.30 1.25 1.21 1.17 1.41Dividends paid per common share ($) 1.8275 1.725 1.625 1.525 1.40 1.28 1.24 1.20 1.16 1.12Dividend payout ratio (%) 48.2 66.6 70.0 80.7 53.6 90.8 71.3 72.3 67.8 60.5Price earnings ratio (x) 14.2 17.6 19.9 21.9 14.3 27.6 17.5 20.6 19.5 18.4Share trading summary (TSX)High price ($) 56.94 47.36 48.73 44.87 42.23 40.83 35.14 34.98 35.45 34.54Low price ($) 44.00 39.38 40.59 35.53 34.16 29.78 29.51 31.70 28.24 21.60Closing price ($) 53.88 45.51 46.11 41.46 37.41 38.96 30.45 34.22 33.37 33.98Volume (in thousands) 297,490 269,284 205,261 293,991 172,038 174,566 120,470 115,962 126,341 120,855
(1) Results were impacted by non-recurring items, largely associated with the disposition of Waneta Expansion in 2019, the acquisition of ITC in 2016, the sale of non-core assets in 2015, the acquisition of UNS Energy in 2014 and the acquisition of Central Hudson in 2013.
(2) Non-utility capital assets were sold as part of the sale of commercial real estate and hotel assets in 2015.
FORTIS INC. 2019 ANNUAL REPORT116
IN V E S TOR INFORM AT ION
Expected Dividend* and Earnings Release Dates
Dividend Record DatesMay 15, 2020 August 19, 2020 November 18, 2020 February 12, 2021
Dividend Payment Dates June 1, 2020 September 1, 2020 December 1, 2020 March 1, 2021
Earnings Release DatesMay 6, 2020 July 30, 2020 October 30, 2020 February 12, 2021
* The setting of dividend record dates and the declaration and payment of dividends are subject to the Board of Directors’ approval.
Transfer Agent and RegistrarComputershare Trust Company of Canada (“Computershare” or “Transfer Agent”) is responsible for the maintenance of shareholder records and the issuance, transfer and cancellation of stock certificates. Transfers can be effected at its Montreal and Toronto offices in Canada and at the co-transfer agent’s Canton, MA, Jersey City, NJ, and Louisville, KY offices in the United States. Computershare also distributes dividends and shareholder communications. Inquiries with respect to these matters and corrections to shareholder information should be addressed to the Transfer Agent.
Computershare Trust Company of Canada 8th Floor, 100 University Avenue, Toronto, ON M5J 2Y1 T: 514.982.7555 or 1.866.586.7638 F: 416.263.9394 or 1.888.453.0330 W: www.investorcentre.com/fortisinc
Computershare Trust Company N.A.Attn: Stock Transfer DepartmentOvernight Mail Delivery: 462 South 4th Street, Louisville, KY 40202Regular Mail Delivery: P.O. Box 505005, Louisville, KY 40233-5005
Direct Deposit of Dividends Shareholders may arrange for automatic electronic deposit of dividends to their designated Canadian and U.S. financial institutions by contacting the Transfer Agent.
Duplicate Annual ReportsWhile every effort is made to avoid duplications, some shareholders may receive extra reports as a result of multiple share registrations. Shareholders wishing to consolidate these accounts should contact the Transfer Agent.
Eligible Dividend DesignationFor purposes of the enhanced dividend tax credit rules contained in the Income Tax Act (Canada) and any corresponding provincial and territorial tax legislation, all dividends paid on common and preferred shares after December 31, 2005 by Fortis to Canadian residents are designated as “eligible dividends.” Unless stated otherwise, all dividends paid by Fortis hereafter are designated as “eligible dividends” for the purposes of such rules.
Annual MeetingThursday, May 7, 2020 – 10:30 a.m.
Holiday Inn St. John’s, 180 Portugal Cove Road,
St. John’s, NL, Canada
Dividend Reinvestment Plan Fortis offers a Dividend Reinvestment Plan (“DRIP”) as a convenient method for Common Shareholders to increase their investments in Fortis. Participants have dividends plus any optional contributions (minimum of $100, maximum of $30,000 annually) automatically deposited in the plan to purchase additional Common Shares. Shares can be purchased quarterly on March 1, June 1, September 1 and December 1 at the average market price then prevailing on the Toronto Stock Exchange. Inquiries should be directed to the Transfer Agent.
Share ListingsThe Common Shares; First Preference Shares, Series F; First Preference Shares, Series G; First Preference Shares, Series H; First Preference Shares, Series I; First Preference Shares, Series J; First Preference Shares, Series K; and First Preference Shares, Series M of Fortis Inc. are listed on the Toronto Stock Exchange and trade under the ticker symbols FTS, FTS.PR.F, FTS.PR.G, FTS.PR.H, FTS.PR.I, FTS.PR.J, FTS.PR.K and FTS.PR.M, respectively. The Common Shares are also listed on the New York Stock Exchange and trade under the ticker symbol FTS.
Valuation DayFor capital gains purposes, the valuation day prices are as follows:
December 22, 1971 $1.531
February 22, 1994 $7.156
Analyst and Investor InquiriesT: 709.737.2900
F: 709.737.5307
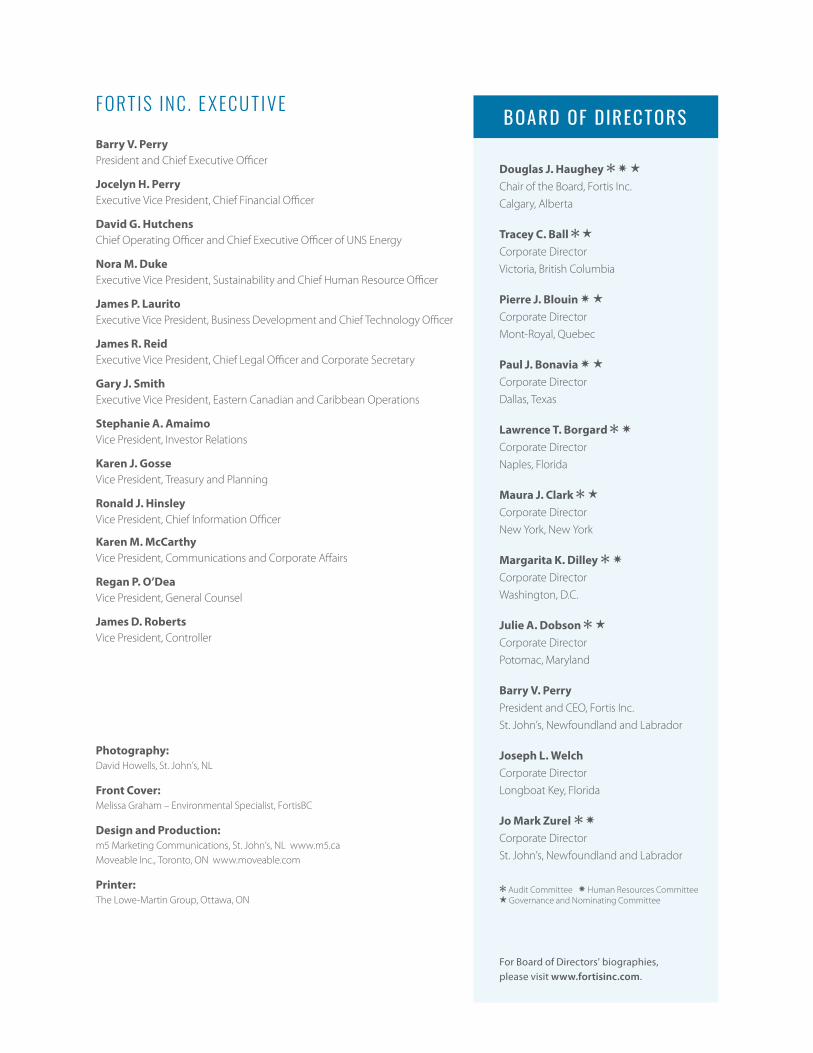
FORT IS INC . E X ECU T I V E
Barry V. Perry President and Chief Executive Officer
Jocelyn H. Perry Executive Vice President, Chief Financial Officer
David G. Hutchens Chief Operating Officer and Chief Executive Officer of UNS Energy
Nora M. Duke Executive Vice President, Sustainability and Chief Human Resource Officer
James P. Laurito Executive Vice President, Business Development and Chief Technology Officer
James R. Reid Executive Vice President, Chief Legal Officer and Corporate Secretary
Gary J. Smith Executive Vice President, Eastern Canadian and Caribbean Operations
Stephanie A. Amaimo Vice President, Investor Relations
Karen J. Gosse Vice President, Treasury and Planning
Ronald J. Hinsley Vice President, Chief Information Officer
Karen M. McCarthy Vice President, Communications and Corporate Affairs
Regan P. O’Dea Vice President, General Counsel
James D. Roberts Vice President, Controller
BOARD OF DIRECTORS
For Board of Directors’ biographies, please visit www.fortisinc.com.
Q Audit Committee X Human Resources Committee H Governance and Nominating Committee
Photography:David Howells, St. John’s, NL
Front Cover: Melissa Graham – Environmental Specialist, FortisBC
Design and Production: m5 Marketing Communications, St. John’s, NL www.m5.caMoveable Inc., Toronto, ON www.moveable.com
Printer: The Lowe-Martin Group, Ottawa, ON
Douglas J. Haughey Q X H Chair of the Board, Fortis Inc. Calgary, Alberta
Tracey C. Ball Q H Corporate Director Victoria, British Columbia
Pierre J. Blouin X H Corporate Director Mont-Royal, Quebec
Paul J. Bonavia X H Corporate DirectorDallas, Texas
Lawrence T. Borgard Q X Corporate Director Naples, Florida
Maura J. Clark Q H Corporate Director New York, New York
Margarita K. Dilley Q X Corporate Director Washington, D.C.
Julie A. Dobson Q H Corporate DirectorPotomac, Maryland
Barry V. Perry President and CEO, Fortis Inc. St. John’s, Newfoundland and Labrador
Joseph L. Welch Corporate Director Longboat Key, Florida
Jo Mark Zurel Q X Corporate Director St. John’s, Newfoundland and Labrador

Fortis Place | Suite 1100, 5 Springdale Street | PO Box 8837 | St. John’s, NL, Canada A1B 3T2T: 709.737.2800 | F: 709.737.5307 | www.fortisinc.com | TSX NYSE: [email protected] | @Fortis_NA | Fortis Inc.