2018 municipal screening board data · xiii. st. paul paul kurtz . all members were present, as...
TRANSCRIPT

2018 MUNICIPAL SCREENING
BOARD DATA
Spring 2018
UNIT PRICES


January
February
July
March
April
May
June August
September
October
November
December CEAM
Conf.
March 1st Deadline for System Revision Requests
Request Pop. Estimates
Notify DSAE’s to schedule prescreening meetings
Fall Screening Board Mtg
Notify cities for Maintenance
requests
Notify cities to update certs.
Start preparing Fall book
FALL PRESCREENING BOARD MEETINGS
MSASMSASMSAS
CALENDARCALENDARCALENDAR
January book (on line)
Notify DSAE’s to schedule
prescreening meetings
NSS meeting
May 1st HARD deadline for system revisions, CC
resolutions & Needs Updates.
December 15th Maintenance Requests Due
January 15th deadline for Annual Certification
of Mileage
Request Storm Sewer letter/Bridge Data
SPRING PRESCREENING BOARD MEETINGS
Mail out Spring Books
Prepare NSS book
Start preparing Spring book
Mail out Fall books
City tasks
State Aid tasks
March 31st Deadline for
Needs Updates without any
System Revision Requests
Spring Screening Board Mtg
Start preparing Jan. book
Ongoing Processes
Highway User Tax Distribution Fund
NEEDS RESET 1) Back up current Needs 2) Reset 3) Notify cities to begin updating
Send Finance allotments

The State Aid Program Mission Study
Mission Statement: The purpose of the state-aid program is to provide resources, from the Highway Users Tax Distribution Fund, to assist local governments with the construction and maintenance of community-interest highways and streets on the state-aid system.
Program Goals: The goals of the state-aid program are to provide users of secondary highways and streets with:
Safe highways and streets; Adequate mobility and structural capacity on highways and streets; and An integrated transportation network.
Key Program Concepts:
Highways and streets of community interest are those highways and streets that function as an integrated network and provide more than only local access. Secondary highways and streets are those routes of community interest that are not on the Trunk Highway system. A community interest highway or street may be selected for the state-aid system if it:
A. Is projected to carry a relatively heavier traffic volume or is functionally classified as collector or arterial B. Connects towns, communities, shipping points, and markets within a county or in adjacent counties; provides access to rural churches, schools, community meeting halls, industrial areas, state institutions, and recreational areas; serves as a principal rural mail route and school bus route; or connects the points of major traffic interest, parks, parkways, or recreational areas within an urban municipality. C. Provides an integrated and coordinated highway and street system affording, within practical limits, a state-aid highway network consistent with projected traffic demands. The function of a road may change over time requiring periodic revisions to the state-aid highway and street network.
State-aid funds are the funds collected by the state according to the constitution and law, distributed from the Highway Users Tax Distribution Fund, apportioned among the counties and cities, and used by the counties and cities for aid in the construction, improvement and maintenance of county state-aid highways and municipal state-aid streets. The Needs component of the distribution formula estimates the relative cost to build county highways or build and maintain city streets designated as state-aid routes.

TABLE OF CONTENTS
INTRODUCTORY INFORMATION
Maps of Highway Districts and Urban Municipalities.......................................................... 2-3
2018 Municipal Screening Board........................................................................................... 4
2018 Subcommittees of the Municipal Screening Board..................................................... 5
Minutes of Fall Screening Board Meeting - October 24 & 25, 2017.................................... 6-10
Minutes from the UCFS Meeting - December 1, 2017 ……………………………………… 11
Traffic Counting....................................................................................................................... 13-17
MSAS Urban ADT Groups for Needs Purposes………………………………………………… 18
Sample Segment……………………………………………………………………………………… 19
UNIT PRICES AND GRAPHS 20
2018 Unit Price Study Explanation........................................................................................ 21
Unit Price Study Data ……………………………………………………………………………… 22-25
Minutes from the NSS Meeting - April 17,2017 ………………………………………………. 26-27
2018 Unit Price Recommendations………………………………………………………………… 28
Percentage Change of Unit Costs, 2009-2018…………………………………………………… 29
Percentage Comparisons 2016 Needs to 2017 Needs / Pie Charts………………………… 30
Grading/Excavation................................................................................................................. 31-33
Aggregate Base ...................................................................................................................... 34-36
All Bituminous Base & Surface…………………………………………………………………… 37-39
Sidewalk Construction ........................................................................................................... 40-42
Curb & Gutter Construction .................................................................................................. 43-45
Unit Prices by District / Graphs …………………………………………………………………… 46
Storm Sewer / Lighting / Signals: History & Recommendations …………………………… 47-49
Storm Sewer letter showing Construction Costs for 2017.................................................. 50
Storm Sewer Costs ................................................................................................................. 51
Traffic Signals ......................................................................................................................... 52-53
Lighting ………………………………………………………………………………………………… 54
2017 Calendar Year - Bridge Cost Report………………………………………………………… 55-58
All Bridges Graphs ………………………………………………………………………………… 59-60
NSS Recommendation on Structure Unit Cost ………………………………………………. 61
OTHER TOPICS 63
Reminder of 2015 UCFS Recommendation on Signals....................................................... 64Reminder of 2016 UCFS Recommendation on Roundabouts............................................. 65Local Road Research Board................................................................................................... 66-67County Highway Turnback Policy.......................................................................................... 68-69Advance Guidelines................................................................................................................ 70-72Current Resolutions of the Municipal Screening Board...................................................... 73-83

State of Minnesota Metro District & Urban Municipalities (Population over 5000) 35 Metro East Cities 49 Metro West Cities
N. Branch
Wyoming
St. Francis
Oak Grove
E. Bethel
Ramsey Ham Lake
Andover
Anoka
Coon Rapids
Blaine
Lino Lakes
Circle Pines
Columbia Heights
Fridley
Spring Lake Park
Forest Lake
Hugo
Mahtomedi
Lake Elmo
Oakdale
Woodbury
St. Paul Park
Cottage Grove
Stillwater
Burnsville
Eagan
Mendota Heights
W. St. Paul
S. St. Paul
Apple Valley
Lakeville
Farmington
Hastings
Inver Grove Heights
Rosemount Jordan
Shakopee
Belle Plaine
Savage
Prior Lake
Chanhassen
Chaska
Waconia
Victoria Eden Prairie
Minneapolis
Bloomington
Richfield Edina
Hopkins Minnetonka Shorewood
Minnetrista
Mound
St. Louis Park
Orono
Medina
Corcoran
Rogers
Brooklyn Park
Brooklyn Center
Maple Grove
Champlin
Dayton
Plymouth
Golden Valley
New Hope
Robbinsdale Crystal
Mounds View
New Brighton
Roseville
Little Canada
Falcon Heights
St. Paul
Arden Hills
White Bear Lake
Vadnais Heights
N. St. Paul
Maplewood
Shoreview
Metro West
Metro East
Updated 12/9/14
Chisago City
St. Anthony
2

State of Minnesota MnDOT Districts & Urban Municipalities (Population over 5000)
64 Greater MN Cities
International Falls
Virginia Chisholm
Hibbing
Hermantown Duluth
Grand Rapids
Bemidji
Thief River Falls
Crookston
E. Grand Forks
Cloquet
Moorhead
Detroit Lakes
Fergus Falls
Morris
Alexandria
Brainerd
Baxter
Little Falls
Worthington
Marshall
Redwood Falls
Montevideo Willmar
Hutchinson
Glencoe
Litchfield
Fairmont Albert Lea
Austin
La Crescent
Winona
Lake City
Red Wing
Northfield
Faribault
Stewartville
Rochester Byron
Kasson Owatonna
Waseca
Mankato N. Mankato
St. Peter New Ulm
New Prague
St. Joseph Waite Park
Sartell
Sauk Rapids Cambridge
Isanti Zimmerman
Elk River
St. Cloud
Big Lake
Monticello
Buffalo
Delano
Albertville Otsego
St. Michael
District 1
District 2
District 3 District 4
District 8
District 7
District 6
Metro *see Metro District map
Updated 1/8/14
3

19-Apr-18
Chair Glenn Olson Marshall (507) 537-6774 Vice Chair John Gorder Eagan (651) 675-5645 Secretary Justin Femrite Elk River (763) 635-1051
District Years Served Representative City Phone 1 2017-2019 Matt Wegwerth Grand Rapids (218) 326-7625
2 2018-2020 Rich Clauson Crookston (218) 281-6522
3 2018-2020 Adam Nafstad Albertville (763) 497-3384
4 2016-2018 Jeff Kuhn Morris (320) 762-8149
Metro-West 2016-2018 Steve Lillehaug Shakopee (952) 233-9361
6 2016-2018 Jay Owens Red Wing (651) 385-3625
7 2017-2019 Chris Cavett* New Prague (507) 388-1989
8 2018-2020 Andy Kehren Redwood Falls (507) 794-5541
Metro-East 2018-2019 Tom Wesolowski Shoreview (651) 490-4652
Cities Permanent Cindy Voigt Duluth (218) 730-5200
of the Permanent Don Elwood Minneapolis (612) 673-3622
First Permanent Richard Freese Rochester (507) 328-2426
Class Permanent Paul Kurtz Saint Paul (651) 266-6203
District Year Beginning City Phone 1 2020 Caleb Peterson Cloquet (218) 879-6758
2 2021 Steve Emery East Grand Forks (218) 773-5626
3 2021 Layne Otteson Big Lake (763) 251-2984
4 2019 Brian Yavarow Fergus Falls (218) 332-5413
Metro-West 2019 Chad Milner Edina (952) 826-0318
6 2019 Kyle Skov Owatonna (507) 444-4350
7 2020 Chris Cavett New Prague (507) 388-1989
8 2021 Brad DeWolf Litchfield (320) 231-3956
Metro-East 2020 Brian Erickson Rosemount (651) 322-2025
* Seat was vacated in 2018. Chris Cavett finishing out term.
Alternates
2018 MUNICIPAL SCREENING BOARD
Officers
Members
N:\MSAS\Books\2018 June Book\Screening Board Members 2018.xlsx
4

Jon Pratt Klayton EcklesDetroit Lakes Woodbury(218) 847-5607 (651) 714-3593Expires after 2018 Expires after 2018
Jeff Johnson Jeff JohnsonMankato Mankato(507) 387-8640 (507) 387-8640 Expires after 2019 Expires after 2019
Sean Christensen Marc CulverWillmar Roseville(320) 235-4202 (651) 792-7041Expires after 2020 Expires after 2020
2018 SUBCOMMITTEES
Needs Study SubcommitteeUnencumbered Construction Funds
Subcommittee
The Screening Board Chair appoints one city Engineer, who has served on the Screening Board, to serve a three year term on the Needs Study Subcommittee.
The past Chair of the Screening Board is appointed to serve a three year term on the Unencumbered Construction Fund Subcommittee.
N:\MSAS\Books\2018 June Book\Subcommittee Members 2018.xlsx
5

MUNICIPAL SCREENING BOARD MEETING MINUTES
October 24-25, 2017 Ruttger’s Bay Lodge – Isle of Pines Meeting Room, Deerwood, MN
Tuesday Session, October 24, 2017 – 1:00 p.m.
I. Call to Order and Welcome
a. Introduction of the Head Table, Subcommittee Chairs and Past Chairs of the Municipal Screening Board (MSB) by Chair Marc Culver i. Mitch Rasmussen, MnDOT – State Aid Engineer ii. Bill Lanoux, MnDOT – Manager, Municipal State Aid Needs Unit iii. Glenn Olson, Marshall – Vice Chair, MSB iv. Rich Clauson, Crookston – Chair, Needs Study Subcommittee v. Steve Bot, St. Michael – Chair, Unencumbered Construction Funds Subcommittee & Past
Chair, MSB vi. Jeff Johnson, Mankato – Past Chair, MSB
b. Introduction of John Gorder, Eagan – Secretary, MSB, who then conducted the roll call of the screening board members:
i. District 1 Matt Wegwerth, Grand Rapids ii. District 2 Craig Gray, Bemidji iii. District 3 Steve Bot, (St. Michael) (representing Justin Femrite, Elk River) iv. District 4 Jeff Kuhn, Morris v. Metro East Brian Erickson, Rosemount vi. Metro West Steve Lillehaug, Shakopee vii. District 6 Jay Owens, Red Wing viii. District 7 Mark DuChene, Waseca ix. District 8 Sean Christensen, Willmar x. Duluth Cindy Voigt xi. Minneapolis Don Elwood xii. Rochester Doug Nelson xiii. St. Paul Paul Kurtz
All members were present, as noted.
c. Screening Board Alternates, not in attendance, were recognized:
i. District 3 Adam Nafstad, Albertville ii. District 8 Any Kehren, Redwood Falls
d. Department of Transportation personnel in attendance were recognized: i. Ted Schoenecker Deputy State Aid Engineer ii. Patti Loken State Aid Programs Engineer iii. John McDonald District 1 State Aid Engineer iv. Lou Tasa District 2 State Aid Engineer v. Kelvin Howieson District 3 State Aid Engineer vi. Nathan Gannon District 4 State Aid Engineer vii. Fausto Cabral District 6 State Aid Engineer viii. Gordy Regenscheid District 7 State Aid Engineer
6

ix. Todd Broadwell District 8 State Aid Engineer x. Dan Erickson Metro State Aid Engineer xi. Julie Dresel Assistant Metro State Aid Engineer
e. Recognition of others in attendance: i. Dave Sonnenberg Chair, CEAM Legislative Committee ii. Larry Veek , Minneapolis iii. Mike Van Beusekom, St Paul iv. Greg Coughlin, State Aid
II. 2017 Municipal State Aid Street Needs Report Review
a. Lanoux reviewed the minutes and actions approved at the May Screening Board meeting. A motion was made by Lillehaug, and seconded by Duchene, to approve the minutes as presented. Motion carried.
b. Lanoux reviewed the remainder of the Needs Report, including Needs Data and Apportionment, cities with complete MSA systems, the proposed MSB research account resolution, and MSB resolutions.
When Lanoux finished his review, Kurtz raised a question concerning ATF ROW Needs Adjustments: Can a city request an ATF ROW Needs adjustment when spending their state aid money on a CSAH project – and if not why not? Lanoux acknowledged that currently cities can’t get this adjustment. Kurtz pointed out that the CSAH system is also the State-aid system, and questioned the logic of why you couldn’t get an ATF adjustment if you’re spending city state aid dollars on the State Aid System, regardless of whether it’s spent on MSAS or CSAH. Chair Culver mentioned that this has been discussed before and that issue has been that cities don’t have a roadway segment on a CSAH system to apply the ATF Needs to, and added that maybe it can be discussed further. Voight raised a similar question for the scenario of State Aid money spent on a match on a Trunk Hwy. Kurtz commented that the TH system would be a different system than the state aid system, then reiterated his original question: if we’re spending state-aid dollars on a state-aid system, regardless of its spent on MSAS or CSAH, shouldn’t the city get an after-the-fact ROW needs adjustment. Kurtz felt that administratively, it wouldn’t be difficult. He also added that Ramsey County has changed their cost share participation policy – which requires a 50-50 match from the city, if the county is doing a project in that city and the project involves acquiring ROW. Olson asked Lanoux to clarify current policy regarding ROW Needs, stating that the issue as to why money spent on CSAH system isn’t eligible for the ATF Needs appears to be because it’s not on the city’s system – or part of the city’s mileage. Lanoux concurred – saying State Aid only gives the adjustment for ROW purchases on the Municipal State Aid System. The main question, as discussion closed for the session: if a city assists in funding with their state-aid dollars, no matter the jurisdiction, can it /should it be included in the Needs?
III. Other Discussion Items a. Sonnenberg provided a preview of numerous potential Legislatives items for the upcoming
2018 session. Handouts were provided detailing the items.
7

b. Rasmussen mentioned State Aid’s position on conditional use permits (CUP) for private facilities located within private property and State right-of-way, such as outdoor restaurant patios. The State will support the cities’ action on CUP’s for both the private property and the right-of-way, provided they have appropriate ordinances in place. Rasmussen also mentioned the success of the “idea-mining” process at the pre-screening meetings this Fall.
c. Other i. Olson questioned whether the item regarding private welling drilling (Item #5) on the
Legislative update applied to potable water supply only. Gray provided clarification that it was for potable water only, and continues the cities’ ability to adopt ordinances prohibiting private wells within municipal water service boundaries
ii. Lillehaug questioned the proposed City Engineers of MN opposition to the potential speed limit control authority proposed by Metro Cities. Lillehaug and Bot mentioned previous CEAM Traffic Safety Committee discussion and work on this topic in 2014, and requested asks that Executive Committee be neutral until the CEAM Traffic Safety Committee revisited this topic. Culver concurred, and also proposed there be discussion at the 2018 CEAM annual meeting. Gray opposition to ambiguous language on speed limit controls for different scenarios. This item will be directed to the CEAM Traffic Safety Committee for recommendations.
IV. A motion was made by Voigt, and seconded by Wegwerth, to adjourn until 8:30 AM Wednesday morning. The motion passed unanimously. The meeting adjourned at 2:45 PM.
8

WEDNESDAY MORNING SESSION – October 25
Additional attendance: Justin Femrite, Elk River (District 3) Chair Culver reconvened the meeting at 8:40 AM. I. Review Tuesday’s Subjects and Take Action a. A motion was made by Voigt, seconded by Kuhn, to approve the original letter to the
Minnesota Department of Transportation Commissioner, recommending approval of the Needs and Apportionment Data, as shown on pages 61-62 of the Needs Report. The motion passed unanimously.
b. A motion was made by Nelson, seconded by Wegwerth, to approve the resolution “Be it
resolved that an amount of $866,092 (not to exceed ½ of 1% of the 2017 MSAS Apportionment sum of $173,218,364) shall be set aside from the 2018 Apportionment fund and be credited to the research account.” The motion passed unanimously.
III. Other Discussion Topics
Kurtz reviewed yesterday’s topic of cities spending their State Aid dollars on ROW for County
State Aid Highway Projects. Asking again why they can’t draw ATF ROW Needs for those purchases. Lanoux mentioned that cities currently don’t draw needs on streets that aren’t theirs, but that State Aid could check on how definitive that is and see if it’s possible that cities could draw Needs on anything other than the Municipal State Aid System. Culver noted that in addition to ROW, cities participate on other elements of County Projects that they can’t draw Needs on. Kurtz felt ROW was different in that ROW wasn’t a “core Needs item” because it gets treated as an adjustment. Kurtz also noted that at the time of purchase, ROW isn’t on either the Municipal or County State Aid System, so in the case of 50-50 participation, he felt a ROW purchase on an eventual County State Aid Hwy was still partly the city’s designation, so the city should draw ATF Needs on it. Kurtz acknowledged that not every city has cost participation with their county. Elwood noted that cost participation policies are often a percentage, making it difficult to know just how much Curb & Gutter you might be paying for on a project, but that ROW participation is much more clear an easier to qualify than other project elements. Voigt said this deserves attention, for county and state joint projects as well. (Nelson asked about ROW purchases when they result in CSAH Turnbacks. Would ROW purchased by the city before a Turnback become eligible at the time of Turnback? Lanoux thought it was likely wasn’t sure. Culver suggested this item be referred refer to Unencumbered Construction Funds Subcommittee for a recommendation. A motion was made by Voigt, seconded by Elwood to refer this to the UCFS for recommendation. Further discussion occurred. Kurtz asked if this was the something the Board would take action and asked State Aid if it says anywhere we can’t do this. He also questioned how administratively this would be handled. Rasmussen said State Aid would need time to look into their authority to administer this, and to determine legally that this could not be done. But he reminded the Board that when it comes to Needs Calculations and the methodology of those Needs, that this is the Board’s responsibility. Lillehaug voiced opposition to this motion, stating this would go away from the simplicity of the system we have now and that this may possibly skew money
9

towards cities that have a unique relationship with their county. He also questioned cities and counties drawing Needs off the same system. Gray agreed with Lillehaug. He acknowledged that cities can use their State-Aid money for off system expenditures, but questioned getting Needs for something not on the city’s system. He also stated that not all counties are making cities pay for half the ROW costs, and that this proposal could move money towards cities that have to pay ROW costs and take money away from cities that don’t have to. Gray also added that counties may find out cities can get these Needs, and then start requesting cities pay 100% of the costs. The discussion ended. The motion carried 8-5 in favor.
III. Thank
a. Culver recognized and thanked the outgoing members of the Screening Board – Craig Gray, Justin Femrite and Sean Christiansen
b. Culver thanked Bill Lanoux and all State Aid staff for all their work in coordinating the Screening Board meetings.
IV. Culver reminded the group of the Spring Screening Board meeting scheduled for May 22 & 23,
2018 at Maddens on Gull Lake. V. Culver mentioned expense report forms were available, hard copy in the meeting room, and
available on the MSAS website.
VI. A motion was made by Kuhn, and seconded by Gray, to adjourn. The motion passed unanimously. The meeting adjourned at 9:00 AM.
Respectfully submitted, John Gorder CEAM Secretary-Treasurer City of Eagan
10

Unencumbered Construction Funds Subcommittee
Meeting Minutes: December 1st, 2017
Attendees Klayton Eckles, Woodbury Jeff Johnson, Mankato Marc Culver, Roseville
Meeting Agenda Discussion The UCFS met on Friday December 1st to discuss a question brought up by the screening board concerning the use of MSA funds to do “after the fact” right of way purchases on CSAH projects. Here are the talking points/minutes of that discussion:
1) We have a set pot of money…our rules are a distribution method—more for ROW means less for other items
2) We did spend 3 years and 4 more adapting new rules to simplify….the idea is that this is about spreading money to build roads to meet larger transportation goals…the actual cost of individual roadway elements had grown to be too cumbersome, so we drastically reduced the elements, and focused more on actual traffic volume served and roadway construction items
3) ROW purchasing has a full of gamut of perspectives and issues…platting process, planning process, county/city agreements or policies, are there other funding sources (state or fed), easements vs ROW, public/private agreements, development deals with private parties.
4) Could ATF expenditures encourage counties to crank the screws on their cost participation policies? (they can pay, so we will charge)…the thought was that although some counties do have some policies that require cities participate at a high level in ROW acquisition, it is highly variable. And the policies themselves are debatable, and MSA monies are not well spent “enabling” the stricter county policies. Given the sporadic nature of the various policies, allowing ATF would provide more benefit to some than to others…which is counter to some of the base philosophies of the simplification effort.
5) Based on the general philosophy that this is meant to be a simple method of equitably distributing SA monies between eligible cities, the idea of ATF ROW needs does not fit. ATF would be more complicated, not always equitable, and doesn’t improve the Municipal transportation system. Therefore the UCFS recommends that off system expenditures on CSAH for ATF right of way be deemed an ineligible expense. IE, no change from the current practice.
Motion carried unanimously. Respectfully Submitted, Klayton Eckles UCFS Chair
11

12

TRAFFIC COUNTING &
ADT GROUPS
http://www.dot.state.mn.us/traffic/data/index.html
13

See Metro and Outstate counting schedules below(Note that Chisago County MSAS are grouped with the Outstate schedule)
Municipal (MSAS) Traffic Counting
The current Municipal State Aid Traffic Counting resolution reads:
That future traffic data for State Aid Needs Studies be developed as follows:
1. The municipalities in the metropolitan area cooperate with the State by agreeing to participate in counting traffic every two or four years at the discretion of the city.
2. The cities in the outstate area may have their traffic counted and maps prepared by State forces every four years, or may elect to continue the present procedure of taking their own counts and have state forces prepare the maps.
3. Any city may count traffic with their own forces every two years at their discretion and expense, unless the municipality has made arrangements with the Mn/DOT district to do the count.
In 1998, cities were given the option of counting on a 2 or 4 year cycle. In 2008, cities were given the option to revise their 2 or 4 year cycle as well as the count year. In 2009, cities were given the option to move to a 4 year cycle with the option to count a subset of locations in the “off cycle” or 2nd
year of a 4 year cycle (they will only recieve new count materials if these choose to count)
14

MnDOT Traffic Volume Program 1/24/2018
2016 2017 2018 2019 2020 2021 2022Anoka (4) Arden Hills (4) Andover (4) Blaine (2) Anoka (4) Arden Hills (4) Andover (4)Columbia Heights (4) Blaine (2) Apple Valley (4) Brooklyn Center (4) Columbia Heights (4) Blaine (2) Apple Valley (4)Coon Rapids (4) Brooklyn Park (2) Belle Plaine (4) Brooklyn Park (2) Coon Rapids (4) Brooklyn Park (2) Belle Plaine (4)Crystal (4) Chanhassen (2) Bloomington (4*) Chanhassen (2) Crystal (4) Chanhassen (2) Bloomington (4*)Dayton (2) Cottage Grove (2) Burnsville (4) Circle Pine (4) Dayton (2) Coon Rapids (4*) Burnsville (4)Eden Prairie (4) East Bethel (2) Champlin (4) Cottage Grove (2) Eden Prairie (4) Cottage Grove (2) Champlin (4)Hopkins (4) Edina (4*) Chaska (4) East Bethel (2) Hopkins (4) East Bethel (2) Chaska (4)Minneapolis (4*) Falcon Heights (4) Corcoran (4) Farmington (4) Minneapolis (4*) Edina (4*) Corcoran (4)Mound (4) Fridley (4) Dayton (2) Ham Lake (4) Mound (4) Falcon Heights (4) Dayton (2)Shakopee (4*) Golden Valley (4) Eagan (4) Hastings (4) Shakopee (4*) Fridley (4) Eagan (4)South St. Paul (4) Lake Elmo (2) Forest Lake (4) Lake Elmo (2) South St. Paul (4) Golden Valley (4) Forest Lake (4)Spring Lake Park (4) Mahtomedi (4) Hugo (4) Lakeville (4*) Spring Lake Park (4) Lake Elmo (2) Hugo (4)St. Paul (4*) Maplewood (4) Inver Grove Heights (4) Mounds View (4) St. Paul (4*) Mahtomedi (4) Inver Grove Heights (4)
Medina (4) Jordan (4) Orono (4) Maplewood (4) Jordan (4)New Brighton (4) Lino Lakes (4) Prior Lake (2) Medina (4) Lino Lakes (4)New Hope (4) Little Canada (4) Ramsey (2) New Brighton (4) Little Canada (4)North St. Paul (4) Maple Grove (4*) Rogers (4^) New Hope (4) Maple Grove (4*)Oak Grove (4) Mendota Heights (4) Savage (4) North St. Paul (4) Mendota Heights (4)Plymouth (4^) Minnetonka (4*) Shoreview (2) Oak Grove (4) Minnetonka (4*)Prior Lake (2) Minnetrista (4) St. Anthony (4) Plymouth (4^) Minnetrista (4)Ramsey (2) Oakdale (4) Victoria (2) Prior Lake (2) Oakdale (4)Richfield (4) Rosemount (4) Woodbury (4^) Ramsey (2) Rosemount (4)Robbinsdale (4) St. Francis (4^) Richfield (4) St. Francis (4^)Roseville (4) Vadnais Heights (4) Robbinsdale (4) Vadnais Heights (4)Shoreview (2) Waconia (4) Roseville (4) Waconia (4)Shorewood (4) Shoreview (2)St. Louis Park (4) Shorewood (4)St. Paul Park (4) St. Louis Park (4)Stillwater (4) St. Paul Park (4)Victoria (2) Stillwater (4)West St. Paul (4) Victoria (2)White Bear Lake (4) West St. Paul (4)
White Bear Lake (4)
^May choose to have a select set updated every 2 years (Rogers, Woodbury, Plymouth, St. Francis)
Metro Municipal Traffic Counting Schedule (publication year, city name, two or four year cycle)
*Takes counts over several years rather than just the publication year, year listed is the last year of the cycle (Bloomington, Coon Rapids, Duluth, Edina, Lakeville, Maple Grove, Minneapolis, Minnetonka, St. Paul, Shakopee)
15

Outstate Municipal Traffic Counting Schedule (publication year, city name, four year cycle)2016 2017 2018 2019 2020 2021 2022
Albertville Albert Lea Alexandria Baxter Albertville Albert Lea AlexandriaAustin Crookston Bemidji Brainerd Austin Crookston BemidjiBuffalo Chisago City Big Lake Chisholm Buffalo Chisago City Big LakeCambridge East Grand Forks Byron Duluth* (year 4) Cambridge East Grand Forks ByronDelano Glencoe Cloquet Fergus Falls Delano Glencoe CloquetDetroit Lakes Grand Rapids Elk River Hermantown Detroit Lakes Grand Rapids Elk RiverFaribault Hutchinson Fairmont Hibbing Faribault Hutchinson FairmontInternational Falls Kasson Lake City Litchfield International Falls Kasson Lake CityIsanti Little Falls Marshall North Mankato Isanti Little Falls MarshallLa Crescent Mankato New Ulm Owatonna La Crescent Mankato New UlmMontevideo Moorhead Rochester ** Red Wing Montevideo Moorhead Rochester **Monticello Morris Stewartville Redwood Falls Monticello Morris StewartvilleNorthfield New Prague Willmar Saint Peter Northfield New Prague WillmarOtsego North Branch Zimmerman Sauk Rapids Otsego North Branch ZimmermanRochester ** Saint Joseph Thief River Falls Saint Michael Saint JosephSaint Michael Sartell Virginia Waseca SartellWaseca St. Cloud Worthington St. Cloud
Waite Park Winona Waite ParkWyoming Wyoming
* Duluth counts approximately 1/4 of the city each year ** Up until 2012 Rochester was counted every two years (rotating between the city and MnDOT); 2016 city choose to count*** No longer a city over 5000Portions of St. Cloud are always being counting due to it crossing into 3 different counties
16

CURRENT SCREENING BOARD RESOLUTION ON TRAFFIC
TRAFFIC - June 1971 (Revised May 2014)
Beginning in 1965 and for all future Municipal State Aid Street Needs Studies, the Needs Study procedure will utilize traffic data developed according the Traffic Forecasting and Analysis web site at http://www.dot.state.mn.us/traffic/data/coll-methods.html#TCS
Traffic Counting - Sept. 1973 (Revised June 1987, 1997, 1999, Oct. 2014)
Traffic data for State Aid Needs Studies will be developed as follows:
1) The municipalities in the metropolitan area cooperate with the State by agreeing to participate in counting traffic every two or four years at the discretion of the city.
2) The cities in the outstate area may have their traffic counted and maps prepared by State forces every four years, or may elect to continue the present procedure of taking their own counts and have state forces prepare the maps.
3) Any city may count traffic with their own forces every two years at their discretion and expense, unless the municipality has made arrangements with the Mn/DOT district to do the count.
4) On new MSAS routes, the ADT will be determined by the City with the concurrence of the District State Aid Engineer until such time the roadway is counted in the standard MnDOT count rotation.
17

26 FOOT
ROADBED
WIDTH 2,917
2 11' TRAFFIC LANES
0 PARKING LANES
2 2' CURB REACTION
28' FOOT
ROADBED
WIDTH 3,182
2 12' TRAFFIC LANES
0 PARKING LANES
2 2' CURB REACTION
34 FOOT
ROADBED
WIDTH 3,978
2 12' TRAFFIC LANES
1 8' PARKING LANE
1 2' CURB REACTION
40 FOOT
ROADBED
WIDTH 4,773
2 12' TRAFFIC LANES
2 8' PARKING LANE
48 FOOT
ROADBED
WIDTH 5,834
4 11' TRAFFIC LANES
2 2' CURB REACTION
54 FOOT
ROADBED
WIDTH 8,287
4 11' TRAFFIC LANES
1 8' PARKING LANE
1 2' CURB REACTION
62 FOOT
ROADBED
WIDTH 11,535
4 11' TRAFFIC LANES
1 14' CENTER TURN
2 2' CURB REACTION
70 FOOT
ROADBED
WIDTH 13,126
6 11' TRAFFIC LANES
0 PARKING LANES
2 2' CURB REACTION
MSAS URBAN ADT GROUPS FOR NEEDS PURPOSES
Quantities Based on a One Mile Section
0 EXISTING ADT
& NON
EXISTING
22 INCHES 11,655 6 INCHES
EXISTING ADTNEEDS
WIDTH
NEEDS GENERATION
DATA
GRADING
DEPTH
(inches)
GRADING
QUANTITY
(cubic yards)
31,460
500 1999
EXISTING ADT26 INCHES 17,698 10 INCHES 10,176
4 INCHES
1 499 EXISTING
ADT22 INCHES 12,496 6 INCHES 4,691
4 INCHES
5000 8999
EXISTING ADT35 INCHES 32,795 19 INCHES 27,907
4 INCHES
2000 4999
EXISTING ADT32 INCHES 25,188 16 INCHES 19,628
GT 25,000
EXISTING ADT39 INCHES 53,172 21 INCHES 44,776
6 INCHES
5 INCHES
38 INCHES 45,838 20 INCHES 38,049
9000 13,999
EXISTING ADT36 INCHES 37,918 19 INCHES
14,000 24,999
EXISTING ADT
6 INCHES
4 INCHES
4,346
4 INCHES
CLASS 5
GRAVEL BASE
DEPTH (inches)
CLASS 5 GRAVEL
BASE QUANTITY
(Tons)
TOTAL
BITUMINOUS
QUANTITY (TONS)
18

SANEEDS - MSAS - Segment Report
Roadway SegmentInformation
Status : Original
City Name : DETROIT LAKES Segment Nbr : 117-120-010
Original Current
NORTH SHORE DRIVE Street Name NORTH SHORE DRIVE
CORBETT ROAD TO TH 10 Termini CORBETT ROAD TO TH 10
0.55 Length 0.55
Improved Existing Roadway Type Improved
Undivided Existing Lane Description Undivided
0 Existing Number of Signal Legs 0
1350 Present AADT 1350
3 ( 500 - 1999 ) Traffic Group Code 3 ( 500 - 1999 )
2016 Year of AADT Count 2016
N Common Boundary Designation N
Y Turnback Mileage Y
N Outside City Limit N
2001 Year of Latest SA Fund 2001
CONSTRUCTED UNDER PLAN #SAP 117-120-001
Comments CONSTRUCTED UNDER PLAN #SAP 117-120-001
Segment Override
Culvert Information Status: Original
Original Current
03J19 Structure Number 03J19
0.22 Milepoint 0.22
PELICAN RIVER Feature Crossed PELICAN RIVER
2 Barrels 2
5 Culvert Height 5
10 Culvert Width 10
2001 Year Built 2001
Comments
3 ( 500 - 1999 ) Culvert Group Code 3 ( 500 - 1999 )
Segment CostInformation
Cost Factor Unit Cost ComputationFormula or Rule
Equation Result
Gravel MSAS Gravel CostGroup 3
Length * Quantity *UnitCost
0.55 * 10176 * 14.9 $83,392
Bituminous MSAS BituminousCost Group 3
Length * Quantity *UnitCost
0.55 * 3978 * 69.6 $152,278
Excavation MSAS ExcavationCost Group 3
Length * Quantity *UnitCost
0.55 * 17698 * 7.95 $77,385
Storm Sewer MSAS Storm SewerCost Group 3
Length * UnitCost 0.55 * 168400 $92,620
Sidewalk MSAS Sidewalk CostGroup 3
Length * UnitCost *FeetPerMile *SidewalkWidth
0.55 * 4.75 * 5280 *10
$137,940
Street Lighting MSAS StreetLighting Cost Group3
Length * UnitCost 0.55 * 100000 $55,000
Curb and Gutter MSAS Curb AndGutter Cost Group 3
Length * UnitCost *FeetPerMile *NumberOfCurbs
0.55 * 14.55 * 5280 *2
$84,506
Signal Leg MSAS TrafficSignals Cost Group3
NumOfSignals *UnitCost / 4
0 * 195000 / 4 $0
Culvert MSAS Culvert TGCGroup 3
CulvertWidth *NeedsWidth *UnitCost *NumOfBarrels
10 * 34 * 90 * 2 $61,200
Engineering Cost Percent of costs 744321 * 0.220 $163,751
Total $908,072
0.55
3 ( 500 - 1999 )3 ( 500 - 1999
34
10176
3978
17698
segment
lengthquantity
from chart
unit
cost
19

UNIT PRICES
AND GRAPHS 20

N:\MSAS\Books\2018 June Book\Unit Price Study Introduction 2018.docx
UNIT PRICE STUDY HISTORY An annual unit price study was conducted until 1997. In 1996, the Municipal Screening Board made a motion to conduct the Unit Price study every two years, with the ability to adjust significant unit price changes on a yearly basis. There were no changes in the unit prices in 1997. In 1999 and 2001, a construction cost index was applied to the 1998 and 2000 contract prices. In 2003, the Screening Board directed the Needs Study Subcommittee to use the percent of increase in the annual National Engineering News Record Construction Cost Index to recommend Unit Costs to the Screening Board. In 2007, the Municipal Screening Board made a motion to conduct the Unit Price study every three years with the option to request a Unit Price study on individual items in “off years”. INTRODUCTION Unit Prices are applied against the quantities in the Needs Study computation program to compute the construction (money) needs apportionment. For this year, the 5 year average of State Aid bridge costs, from 2014 to 2017, are used to determine the unit price for structures. MN/DOT’s hydraulic office furnished a recommendation of costs for storm sewer construction and adjustment based on 2017 construction costs. The SALT Program Support Engineer supplied a recommendation for Traffic Signals. This year, the Municipal State Aid Needs Unit conducted a Unit Price Study, based on the project costs of on system MSAS projects for Excavation, Aggregate Base, Bituminous, Sidewalk Construction and Curb & Gutter Construction. These project costs are used to calculate a statewide average cost for these items. 158 on-system projects were incuded in the study.
21

Printed: 03/30/18
CO. Unit Unit Unit Unit Unit
NO. QTY. AMOUNT Price QTY. AMOUNT Price QTY. AMOUNT Price QTY. AMOUNT Price QTY. AMOUNT PriceDISTRICT 1 Chisholm SAP 111-236-003 1 69 0 0 0 0 500 $32,150 $64.30 0 0 0 0 Chisholm SAP 111-239-003 1 69 0 0 0 0 402 25,850 64.30 0 0 0 0 Chisholm SAP 111-243-007 1 69 896 $11,200 $12.50 886 $14,539 $16.40 277 17,459 63.03 0 0 760 $15,200 $20.00Chisholm SAP 111-248-004 1 69 0 0 0 0 122 7,840 64.26 0 0 0 0 Chisholm SAP 111-250-001 1 69 0 0 0 0 400 25,725 64.31 0 0 0 0 Duluth SAP 118-132-010 1 69 0 0 0 0 4,145 267,353 64.50 4,899 $33,606 $6.86 659 22,406 34.00Duluth SAP 118-140-032 1 69 0 0 0 0 1,020 53,307 52.26 0 0 0 0 Duluth SAP 118-151-013 1 69 234 6,552 28.00 217 4,370 20.11 966 77,280 80.00 4,656 32,592 7.00 1,147 34,059 29.69Hibbing SAP 131-182-001 1 69 0 0 0 0 495 25,874 52.27 0 0 0 0 Hibbing SAP 131-191-001 1 69 0 0 0 0 585 30,583 52.28 0 0 0 0 Hibbing SAP 131-192-001 1 69 0 0 0 0 1,020 53,307 52.26 0 0 0 0 Hibbing SAP 131-201-004 1 69 0 0 0 0 4,310 163,797 38.00 0 0 0 0 Hibbing SAP 131-203-004 1 69 0 0 0 0 4,160 157,939 37.97 0 0 0 0 Hibbing SAP 131-207-002 1 69 0 0 0 0 5,180 196,705 37.97 0 0 0 0 Hibbing SAP 131-213-004 1 69 0 0 0 0 5,820 221,051 37.98 0 0 0 0 Hibbing SAP 131-216-005 1 69 0 0 0 0 2,240 85,010 37.95 0 0 0 0 Hibbing SAP 131-234-001 1 69 0 0 0 0 525 27,465 52.31 0 0 0 0 International Falls SAP 134-122-005 1 36 3,668 14,672 4.00 4,651 41,837 8.99 1,788 117,780 65.87 0 0 1,856 38,976 21.00Virginia SAP 171-217-008 1 69 0 0 0 0 1,225 64,702 52.82 0 0 0 0 Virginia SAP 171-222-004 1 69 0 0 0 0 855 45,158 52.82 0 0 0 0 Hermantown SAP 202-106-002 1 69 2,940 47,040 16.00 3,404 61,082 17.94 1,894 93,970 49.61 5,795 26,060 4.50 2,371 34,380 14.50Hermantown SAP 202-107-003 1 69 4,847 77,552 16.00 4,326 76,698 17.73 2,346 116,395 49.61 13,228 47,638 3.60 2,962 44,031 14.87DISTRICT 1 TOTALS 0 12,585 $157,016 $12.48 13,485 $198,526 $14.72 40,275 $1,906,699 $47.34 28,578 $139,896 $4.90 9,755 $189,051 $19.38
DISTRICT 2 0 0 0 0 0 0 #DIV/0! 0 0 #DIV/0! 0 0 #DIV/0! 0 0 #DIV/0!Bemidji SAP 105-141-001 2 4 2,798 $13,990 $5.00 4,620 53,130 $11.50 1,981 $118,844 $59.99 12,445 $47,284 $3.80 5,817 $66,933 $11.51Crookston SP 115-115-010 2 60 1,437 31,614 $22.00 2,674 57,308 21.43 2,379 139,192 58.51 24,387 108,522 4.45 2,413 71,184 29.50Crookston SP 115-126-010 2 60 78 3,588 $46.00 113 2,430 21.43 340 20,105 59.13 1,289 5,736 4.45 204 6,018 29.50Crookston SP 115-126-011 2 60 20 920 $46.00 28 608 21.43 156 9,222 59.12 450 2,003 4.45 56 1,652 29.50Crookston SP 115-146-001 2 60 0 0 0 0 851 49,870 58.60 0 0 0 0DISTRICT 2 TOTALS 4,333 $50,112 $11.57 7,436 $113,475 $15.26 5,707 $337,234 $59.09 38,571 $163,545 $4.24 8,490 $145,786 $17.17
DISTRICT 3 0 0 0 0 0 0 #DIV/0! 0 0 #DIV/0! 0 0 #DIV/0! 0 0 #DIV/0! 0 0 #DIV/0!Brainerd SAP 108-113-007 3 18 537 $6,444 $12.00 240 $3,600 $15.00 5,068 $222,992 $44.00 8,082 $46,267 $5.72 2,204 $50,692 $23.00Brainerd SAP 108-129-002 3 18 1,932 13,524 7.00 2,464 32,032 13.00 1,886 82,104 43.53 6,098 31,207 5.12 930 20,460 22.00Brainerd SAP 108-136-003 3 18 1,747 12,229 7.00 3,259 45,626 14.00 2,661 117,084 44.00 1,460 7,676 5.26 1,273 28,006 22.00St. Cloud SAP 162-108-018 3 73 1,754 21,048 12.00 3,680 56,755 15.42 1,114 70,379 63.18 25,938 268,779 10.36 1,521 34,466 22.66St. Cloud SAP 162-118-009 3 73 882 10,584 12.00 1,126 17,373 15.42 450 27,875 61.95 6,828 72,727 10.65 730 16,542 22.66St. Cloud SAP 162-134-009 3 73 0 0 0 0 1,809 107,973 59.69 54 379 7.02 80 3,025 37.81St. Cloud SAP 162-140-011 3 73 0 0 0 0 2,213 132,257 59.76 27 190 7.02 147 5,558 37.81St. Cloud SAP 162-145-013 3 73 0 0 83 2,733 32.87 3,346 200,412 59.90 0 0 0 0Sauk Rapids SAP 191-102-006 3 5 885 6,155 6.95 1,223 16,946 13.86 455 29,568 64.98 2,998 15,098 5.04 630 7,560 12.00Sauk Rapids SAP 191-104-005 3 5 4,862 33,874 6.97 5,028 69,632 13.85 1,873 121,414 64.82 14,656 61,981 4.23 2,497 29,964 12.00Elk River SAP 204-113-016 3 71 160 1,877 11.73 0 0 4,463 200,908 45.02 1,085 7,666 7.07 4,730 60,497 12.79Elk River SAP 204-129-001 3 71 870 17,017 19.56 0 0 4,766 211,309 44.34 2,927 19,902 6.80 5,215 66,700 12.79Elk River SAP 204-131-003 3 71 2,167 40,176 18.54 0 0 5,877 257,791 43.86 2,468 15,967 6.47 3,490 44,637 12.79Elk River SAP 204-149-001 3 71 676 8,470 12.53 0 0 1,455 65,477 44.99 0 0 3,511 41,149 11.72Elk River SAP 204-154-001 3 71 0 0 0 0 1,530 75,457 49.32 2,270 15,391 6.78 2,160 27,626 12.79Sartell SP 220-117-004 3 73 18,666 110,396 5.91 10,342 109,440 10.58 5,030 269,830 53.64 176 1,584 9.00 7,760 97,000 12.50St. Michael SAP 227-114-001 3 86 0 0 76 1,280 16.93 5,100 267,750 52.50 0 0 0 0St. Michael SAP 227-116-001 3 86 2,350 32,430 13.80 28 480 16.93 4,780 251,575 52.63 0 0 395 6,320 16.00St. Michael SAP 227-124-001 3 86 8,070 88,770 11.00 1,304 22,080 16.93 645 33,800 52.40 3,930 25,545 6.50 1,430 22,880 16.00St. Michael SAP 227-127-001 3 86 570 6,270 11.00 1,021 17,280 16.93 840 44,450 52.92 6,580 42,770 6.50 1,390 22,680 16.32Isanti SAP 245-108-001 3 30 604 9,060 15.00 0 0 1,676 101,727 60.68 10,875 43,500 4.00 2,350 41,445 17.64Zimmerman SAP 251-104-001 3 71 1,210 11,435 9.45 1,940 25,414 13.10 630 34,426 54.64 4,430 19,271 4.35 1,450 17,400 12.00Zimmerman SAP 251-117-002 3 71 1,950 18,428 9.45 3,930 51,483 13.10 1,290 70,480 54.64 6,690 29,102 4.35 1,880 22,560 12.00DISTRICT 3 TOTALS 49,892 $448,186 $8.98 35,744 $472,155 $13.21 58,958 $2,997,037 $50.83 107,572 $725,000 $6.74 45,773 $667,167 $14.58
AGGREGATE BASE2018 Unit Price Study EXCAVATION
CITY NAME PROJECT #DIST NO.SAP/SP
Excavation - CY Sidewalk Const.-Sq Ft
CURB & GUTTER
C & G Const. - LF
ALL BITUMINOUS SIDEWALK
All Bit. - TonBase 2211 - Ton
22

Printed: 03/30/18
CO. Unit Unit Unit Unit Unit
NO. QTY. AMOUNT Price QTY. AMOUNT Price QTY. AMOUNT Price QTY. AMOUNT Price QTY. AMOUNT Price
AGGREGATE BASE2018 Unit Price Study EXCAVATION
CITY NAME PROJECT #DIST NO.SAP/SP
Excavation - CY Sidewalk Const.-Sq Ft
CURB & GUTTER
C & G Const. - LF
ALL BITUMINOUS SIDEWALK
All Bit. - TonBase 2211 - Ton
DISTRICT 4 0 0 0 0 #DIV/0! 0 0 #DIV/0! 0 0 0 0 #DIV/0! 0 0 #DIV/0!Alexandria SP 102-103-002 4 21 0 0 0 0 2,923 $149,105 $51.01 0 0 0 0Alexandria SP 102-144-001 4 21 7,350 $69,263 $9.42 7,152 $94,600 $13.23 3,532 $180,141 51.00 8,554 $36,711 $4.29 3,113 $35,544 $11.42Fergus Falls SAP 126-132-004 4 56 0 0 0 0 806 $55,807 69.24 2,694 20,212 7.50 407 17,094 42.00DISTRICT 4 TOTALS 7,350 $69,263 $9.42 7,152 $94,600 $13.23 7,261 $385,054 $53.03 11,248 $56,923 $5.06 3,520 $52,638 $14.95
DISTRICT 6 0 0 0 0 0 0 #DIV/0! 0 0 0 0 0 0 #DIV/0! 0 0 #DIV/0!Albert Lea SAP 101-120-005 6 24 139 $6,255 $45.00 87 $2,610 $30.00 0 0 7,958 $34,793 $4.37 40 $1,600 $40.00Albert Lea SAP 101-128-005 6 24 6,468 63,063 9.75 4,133 67,797 16.40 113 $22,056 $196.00 9,868 52,888 5.36 4,204 76,796 18.27Albert Lea SAP 101-134-003 6 24 427 5,551 13.00 2,306 29,978 13.00 1,228 86,660 70.57 0 0 0 0Austin SAP 104-104-004 6 50 4,740 34,994 7.38 5,885 80,919 13.75 121 14,640 121.21 9,517 71,957 7.56 265 7,553Austin SAP 104-112-006 6 50 0 0 0 0 588 38,320 65.14 643 6,383 9.93 202 8,686 43.00Rochester SAP 159-113-018 6 55 0 0 0 0 2,130 119,737 56.21 0 0 0 0Rochester SAP 159-130-008 6 55 0 0 0 0 1,362 79,677 58.50 0 0 0 0Winona SAP 176-116-002 6 85 2,740 23,290 8.50 4,044 59,649 14.75 1,820 155,547 85.47 11,362 55,403 4.88 3,032 44,722 14.75DISTRICT 6 TOTALS 14,514 $133,153 $9.17 16,455 $240,953 $14.64 7,362 $516,637 $70.18 39,348 $221,424 $5.63 7,743 $139,357 $18.00
DISTRICT 7 0 0 0 0 0 0 #DIV/0! 0 0 #DIV/0! 0 0 #DIV/0! 0 0 #DIV/0! 0 0 #DIV/0!Fairmont SP 123-112-001 7 46 18,619 $183,066 $9.83 13,215 $208,136 $15.75 5,900 $388,248 $65.80 1,927 $26,593 $13.80 7,761 $103,609 $13.35Mankato SAP 137-107-001 7 7 7,268 63,958 8.80 5,871 74,865 12.75 1,755 113,701 64.77 19,669 105,315 5.35 3,376 54,323 16.09St. Peter SAP 165-101-006 7 52 1,278 5,879 4.60 2,054 25,307 12.32 1,186 79,968 67.45 10,263 38,486 3.75 2,102 31,110 14.80St. Peter SAP 165-592-001 7 52 3,721 17,604 4.73 3,757 44,289 11.79 1,967 133,311 67.77 0 0 0 0Worthington SAP 177-103-007 7 53 4,082 49,184 12.05 1,969 41,349 21.00 1,190 117,477 98.72 18,072 109,057 6.03 2,826 64,715Worthington SAP 177-105-007 7 53 134 1,340 10.00 225 4,185 18.61 0 0 1,369 10,678 7.80 25 625 25.00Worthington SAP 177-110-004 7 53 515 5,150 10.00 263 4,865 18.52 0 0 2,730 21,294 7.80 0 0Worthington SAP 177-118-002 7 53 584 7,008 12.00 158 3,318 21.00 0 0 9,813 48,195 4.91 548 12,549 22.90DISTRICT 7 TOTALS 36,201 $333,190 $9.20 27,513 $406,314 $14.77 11,998 $832,705 $69.40 63,843 $359,617 $5.63 16,638 $266,932 $16.04
DISTRICT 8 0Hutchinson SAP 133-116-003 8 43 1,839 $22,590 $12.28 597 $7,982 $13.37 1,879 $143,450 $76.35 1,407 $15,885 $11.29 2,621 $30,666 $11.70Hutchinson SAP 133-117-014 8 43 8,050 99,119 12.31 7,858 106,794 13.59 3,389 249,125 73.51 285 1,525 5.35 4,671 54,651 11.70Litchfield SAP 135-107-004 8 47 0 0 0 0 496 23,693 47.73 0 0 100 3,300 33.00Litchfield SAP 135-108-006 8 47 0 0 0 0 582 27,788 47.73 0 0 100 3,300 33.00Litchfield SAP 135-109-007 8 47 0 0 0 0 1,232 59,667 48.42 0 0 200 6,600 33.00Litchfield SAP 135-111-002 8 47 0 0 0 0 1,142 54,521 47.73 0 0 0 0Marshall SAP 139-129-002 8 42 1,984 11,904 6.00 945 5,500 5.82 8,170 547,390 67.00 0 0 4,400 49,060 11.15Montevideo SAP 143-106-004 8 12 3,500 40,425 11.55 4,550 65,975 14.50 2,260 130,000 57.52 3,832 21,675 5.66 2,016 32,256 16.00Willmar SAP 175-152-007 8 34 956 10,516 11.00 646 8,618 13.33 4,227 288,815 68.33 2,312 22,324 9.66 3,152 60,518 19.20Willmar SAP 175-153-021 8 34 60 2,100 35.00 0 0 1,932 182,883 94.66 2,511 21,926 8.73 457 13,253 29.00Redwood Falls SP 207-105-006 8 64 9,010 98,156 10.89 11,128 184,925 16.62 4,078 310,095 76.04 9,188 50,534 5.50 4,143 60,488 14.60DISTRICT 8 TOTALS 25,399 $284,810 $11.21 25,725 $379,794 $14.76 29,388 $2,017,428 $68.65 19,535 $133,868 $6.85 21,860 $314,092 $14.37
23

Printed: 03/30/18
CO. Unit Unit Unit Unit Unit
NO. QTY. AMOUNT Price QTY. AMOUNT Price QTY. AMOUNT Price QTY. AMOUNT Price QTY. AMOUNT Price
AGGREGATE BASE2018 Unit Price Study EXCAVATION
CITY NAME PROJECT #DIST NO.SAP/SP
Excavation - CY Sidewalk Const.-Sq Ft
CURB & GUTTER
C & G Const. - LF
ALL BITUMINOUS SIDEWALK
All Bit. - TonBase 2211 - Ton
METRO EAST 0 0 0 0 0 0 #DIV/0! 0 0 #DIV/0! 0 0 #DIV/0! 0 0 #DIV/0!Hastings SAP 130-122-013 ME 19 0 0 0 0 1,345 $78,594 $58.43 824 $9,120 $11.07 300 $6,504 $21.68Hastings SAP 130-137-005 ME 19 0 0 0 0 210 12,219 58.19 270 $3,037 11.25 100 2,168 21.68Mendota Heights SAP 140-103-020 ME 19 10,630 $174,606 $16.43 250 $4,500 $18.00 12,102 651,427 53.83 351 $3,159 9.00 6,198 129,515 20.90Mendota Heights SP 140-103-019 ME 19 2,802 51,837 18.50 932 15,844 17.00 1,256 86,897 69.19 2,159 $22,279 10.32 2,072 35,224 17.00Roseville SAP 160-219-012 ME 62 75 2,828 37.70 189 4,270 22.59 474 46,010 97.07 1,221 9,707 7.95 151 5,059 33.50Roseville SAP 160-221-009 ME 62 0 0 0 0 1,385 76,348 55.12 0 0 61 1,174 19.25Roseville SAP 160-225-006 ME 62 0 0 0 0 816 45,325 55.55 226 1,921 8.50 253 4,870 19.25Roseville SAP 160-227-012 ME 62 0 0 0 0 210 20,414 97.21 163 1,467 9.00 12 402 33.50Roseville SAP 160-235-003 ME 62 0 0 0 0 465 25,888 55.67 114 969 8.50 191 4,059 21.25Roseville SAP 160-249-002 ME 62 0 0 0 0 1,137 62,538 55.00 390 3,315 8.50 251 4,832 19.25Roseville SAP 160-250-002 ME 62 0 0 0 0 696 38,285 55.01 264 2,244 8.50 34 655 19.25Roseville SAP 160-261-001 ME 62 0 0 0 0 526 28,933 55.01 0 0 124 2,636 21.26St. Paul SAP 164-121-007 ME 62 7,680 161,280 21.00 12,852 210,800 16.40 4,392 265,163 60.38 22,340 125,785 5.63 3,930 70,968 18.06St. Paul SAP 164-269-001 ME 62 6,738 33,780 5.01 1,833 29,560 16.13 2,587 146,473 56.62 7,317 45,225 6.18 3,314 62,966 19.00St. Paul SP 164-270-003 ME 62 3,416 37,576 11.00 6,933 113,708 16.40 2,728 157,288 57.66 12,648 89,486 7.08 2,552 49,764 19.50South St. Paul SAP 168-160-005 ME 19 160 2,160 13.50 150 2,565 17.10 1,070 52,791 49.34 0 0 150 3,120 20.80South St. Paul SAP 168-163-004 ME 19 470 6,345 13.50 220 3,762 17.10 2,390 117,986 49.37 0 0 170 3,536 20.80West St. Paul SAP 173-123-006 ME 19 12,042 169,551 14.08 5,445 74,488 13.68 3,485 155,698 44.68 4,608 22,742 4.94 5,781 68,505 11.85Burnsville SAP 179-114-006 ME 19 0 0 43 849 19.75 590 30,259 51.29 800 5,529 6.91 400 10,160 25.40Burnsville SAP 179-132-001 ME 19 0 0 19 375 19.75 420 21,550 51.31 110 506 4.60 210 5,334 25.40Cottage Grove SAP 180-112-011 ME 82 0 0 0 0 0 0 0 0 0 0Oakdale SAP 185-121-021 ME 82 0 0 0 0 0 0 300 2,220 7.40 220 4,796 21.80Oakdale SAP 185-234-007 ME 82 0 0 0 0 25 1,790 71.60 430 3,156 7.34 300 6,540 21.80Lakeville SAP 188-121-003 ME 19 0 0 0 0 0 0 843 9,821 11.65 66 2,063 31.25Eagan SAP 195-122-011 ME 19 1,444 43,698 30.26 752 21,357 28.40 311 33,899 109.00 1,148 13,317 11.60 605 15,518 25.65Forest Lake SAP 214-110-002 ME 82 6,300 31,017 4.92 6,320 72,643 11.49 2,180 120,251 55.16 2,360 15,364 6.51 5,855 82,777 14.14Forest Lake SAP 214-126-001 ME 82 8,170 42,764 5.23 9,740 110,993 11.40 3,750 206,100 54.96 2,475 16,112 6.51 8,735 123,183 14.10Hugo SAP 224-109-001 ME 82 25 254 10.18 556 1,472 2.65 3,995 189,737 47.49 0 0 0 0Hugo SAP 224-123-001 ME 82 12 117 9.71 253 672 2.66 1,998 97,008 48.54 0 0 0 0North Branch SAP 225-104-004 ME 13 20 480 24.00 0 0 1,140 47,880 42.00 0 0 0 0North Branch SAP 225-105-001 ME 13 25 600 24.00 0 0 2,164 90,888 42.00 0 0 0 0North Branch SAP 225-123-001 ME 13 0 0 0 0 634 26,628 42.00 0 0 0 0North Branch SAP 225-124-001 ME 13 0 0 0 0 2,098 88,116 42.00 0 0 0 0North Branch SAP 225-133-001 ME 13 0 0 0 0 808 33,936 42.00 0 0 0 0Wyoming SAP 248-116-002 ME 13 39,637 260,420 6.57 12,357 130,760 10.58 7,432 348,517 46.89 2,300 26,500 11.52 250 5,038 20.15Wyoming SAP 248-117-002 ME 13 11,952 79,146 6.62 3,498 37,020 10.58 2,266 109,853 48.48 0 0 300 6,045 20.15Chisago City SAP 252-116-001 ME 13 245 3,014 12.30 0 0 563 35,518 63.09 159 5,600 35.22 72 5,705 79.24Chisago City SAP 252-117-001 ME 13 350 4,305 12.30 0 0 541 35,022 64.73 126 4,438 35.22 0 0METRO EAST TOTALS 112,193 $1,105,776 $9.86 62,342 $835,638 $13.40 68,189 $3,585,227 $52.58 63,946 $443,017 $6.93 42,657 $723,114 $16.95
24

Printed: 03/30/18
CO. Unit Unit Unit Unit Unit
NO. QTY. AMOUNT Price QTY. AMOUNT Price QTY. AMOUNT Price QTY. AMOUNT Price QTY. AMOUNT Price
AGGREGATE BASE2018 Unit Price Study EXCAVATION
CITY NAME PROJECT #DIST NO.SAP/SP
Excavation - CY Sidewalk Const.-Sq Ft
CURB & GUTTER
C & G Const. - LF
ALL BITUMINOUS SIDEWALK
All Bit. - TonBase 2211 - Ton
METRO WEST SAP 0 MW 0 0 0 0Blaine SAP 106-147-001 MW 2 21,768 $207,948 $9.55 24,208 $159,474 $6.59 12,250 $771,750 $63.00 49,680 $205,336 $4.13 22,750 $286,887 $12.61Bloomington SAP 107-129-025 MW 27 98 1,960 20.00 141 2,115 15.00 1,459 76,254 52.26 5,534 33,656 6.08 1,273 24,951 19.60Bloomington SAP 107-136-012 MW 27 43 860 20.00 50 750 15.00 629 32,687 51.97 1,284 9,423 7.34 326 6,390 19.60Bloomington SAP 107-414-006 MW 27 43 860 20.00 51 765 15.00 298 16,488 55.33 2,055 12,644 6.15 345 6,762 19.60Bloomington SAP 107-422-016 MW 27 184 3,680 20.00 227 3,405 15.00 2,768 144,954 52.37 5,255 31,374 5.97 2,201 43,140 19.60Bloomington SAP 107-440-002 MW 27 1,397 27,940 20.00 103 1,545 15.00 1,060 54,853 51.75 8,221 47,578 5.79 1,347 25,471 18.91Bloomington SAP 107-442-006 MW 27 131 2,620 20.00 143 2,145 15.00 1,397 75,052 53.72 944 6,626 7.02 827 $16,209 19.60Brooklyn Park SAP 110-101-015 MW 27 334 4,876 14.60 669 11,045 16.51 3,071 174,241 56.74 9,160 72,333 7.90 5,179 88,719 17.13Brooklyn Park SAP 110-102-014 MW 27 121 1,767 14.60 234 3,869 16.51 927 52,667 56.79 4,253 28,354 6.67 624 13,087 20.97Brooklyn Park SAP 110-103-013 MW 27 558 8,147 14.60 1,015 16,754 16.51 2,746 153,196 55.79 16,289 100,735 6.18 4,857 101,530 20.90Coon Rapids SAP 114-102-018 MW 2 405 7,493 18.50 0 0 5,500 289,528 52.64 6,200 28,875 4.66 4,900 90,190 18.41Coon Rapids SAP 114-121-015 MW 2 0 0 0 0 529 33,075 62.52 0 0 134 3,399 25.37Coon Rapids SAP 114-128-005 MW 2 740 13,690 18.50 0 0 4,470 240,051 53.71 6,490 28,858 4.45 4,086 48,429 11.85Coon Rapids SAP 114-129-012 MW 2 75 1,388 18.51 0 0 2,373 124,222 52.35 3,000 13,130 4.38 1,100 19,850 18.05Edina SAP 120-170-001 MW 27 999 11,990 12.00 3,102 41,096 13.25 2,080 109,268 52.53 5,754 25,803 4.48 5,104 82,976 16.26Fridley SAP 127-321-004 MW 2 0 0 0 0 643 35,156 54.67 27 177 6.54 318 6,758 21.25Fridley SAP 127-338-004 MW 2 0 0 0 0 1,117 61,070 54.67 0 0 20 425 21.25Fridley SAP 127-350-002 MW 2 0 0 0 0 177 9,678 54.68 0 0 0 0Fridley SAP 127-351-002 MW 2 0 0 0 0 421 23,019 54.68 0 0 30 638 21.25Fridley SAP 127-357-001 MW 2 261 2,753 10.55 0 0 529 28,858 54.55 0 0 80 1,700 21.25Golden Valley SAP 128-389-010 MW 27 0 0 0 0 0 0 2,941 15,440 5.25 511 16,012 31.33Golden Valley SAP 128-412-009 MW 27 7,171 43,026 6.00 679 13,580 20.00 1,398 106,326 76.06 1,910 9,550 5.00 797 26,983 33.86Minneapolis SAP 141-284-005 MW 27 4,779 83,468 17.47 5,061 97,211 19.21 8,687 539,157 62.06 21,865 156,049 7.14 6,928 155,332 22.42Mound SAP 145-103-004 MW 27 5,080 51,952 10.23 7,371 77,220 10.48 1,980 124,050 62.66 0 0 0 0Mound SAP 145-104-004 MW 27 4,490 45,720 10.18 4,914 51,480 10.48 1,648 103,230 62.65 0 0 0 0Mound SAP 145-109-007 MW 27 1,630 16,607 10.19 1,814 19,008 10.48 560 35,104 62.65 0 0 0 0Mound SAP 145-109-006 MW 27 1,720 17,537 10.20 1,909 19,998 10.48 625 39,152 62.64 0 0 0 0Robbinsdale SAP 158-298-009 MW 27 2,556 35,401 13.85 4,997 70,296 14.07 4,480 244,350 54.55 16,026 62,009 3.87 5,271 61,144 11.60St. Louis Park SAP 163-275-019 MW 27 7,571 101,583 13.42 11,000 189,200 17.20 6,500 392,130 60.33 34,020 164,877 4.85 5,530 133,628 24.16Chanhassen SAP 194-127-001 MW 27 0 0 450 8,010 17.80 3,401 205,348 60.37 5,000 33,750 6.75 1,825 36,956 20.25Ham Lake SAP 197-125-004 MW 2 3,069 32,225 10.50 2,837 35,277 12.43 2,462 141,197 57.36 71 568 8.00 2,619 27,211 10.39Andover SAP 198-116-004 MW 2 280 3,848 13.74 610 8,619 14.13 3,900 216,239 55.45 90 803 8.92 10,500 117,285 11.17East Bethel SAP 203-111-004 MW 2 15,192 43,297 2.85 9,470 125,478 13.25 6,484 320,179 49.38 0 0 10,374 121,261 11.69Savage SAP 211-103-003 MW 70 0 0 76 975 12.90 0 0 1,171 10,995 9.39 233 3,495 15.00Savage SAP 211-106-009 MW 70 6,000 112,200 18.70 16,300 242,695 14.89 12,471 599,097 48.04 25,200 138,899 5.51 4,630 95,378 20.60Savage SAP 211-127-001 MW 70 2,350 37,600 16.00 1,713 30,900 18.03 844 54,312 64.32 324 3,005 9.27 1,520 22,800 15.00Waconia SAP 231-124-001 MW 10 35,910 204,687 5.70 7,488 110,144 14.71 1,505 96,121 63.87 0 0 1,956 23,879 12.21Rogers SAP 238-110-001 MW 27 1,995 24,319 12.19 611 9,312 15.24 477 32,170 67.44 0 0 976 17,500 17.93Minnetrista SAP 243-101-001 MW 27 44,930 226,772 5.05 13,910 274,234 19.71 8,263 517,700 62.66 2,710 18,157 6.70 1,930 33,941 17.59Medina SP 250-118-001 MW 27 0 0 0 0 0 0 0 0 296 4,631 15.64METRO WEST TOTALS 171,880 $1,378,214 $8.02 121,155 $1,626,600 $13.43 110,129 $6,271,930 $56.95 235,474 $1,259,003 $5.35 111,397 $1,764,946 $15.84
STATE TOTAL 434,347 $3,959,719 317,006 $4,368,054 339,266 $18,849,950 608,114 $3,502,293 267,833 $4,263,081
AVERAGE UNIT PRICE $9.12 $13.78 $55.56 $5.76 $15.92
25

NEEDS STUDY SUBCOMMITTEE MEETING MINUTES
The Needs Study Subcommittee meeting was held on April 16, 2018 at MnDOT’s Central Office located
at 395 John Ireland Blvd in St. Paul, MN.
NSS members present were Jon Pratt (Detroit Lakes / Chair), and Sean Christensen (Willmar). Also in
attendance were: Bill Lanoux (MSAS Needs Manager), Patti Loken (State Aid Program Engineer).
A 2018 Needs Study Subcommittee Report was sent to all members prior to the meeting. Bill Lanoux noted that, for 2018, recommendations will be based off a full Unit Cost Study (For the previous two years, recommendations were based off an inflation factor). Before the Unit Cost discussion, Bill reviewed several pages with other information, including the MSB meeting minutes from October 2017 and the recent UCFS recommendation on After‐the‐fact Right of Way Needs. Bill also commented on the significance of the 8 Urban ADT Groups for Needs Purposes. Bill Lanoux reviewed the Unit Cost Items that were part of this year’s Unit Cost Study. The NSS made recommendations for the following items. Grading/Excavation: Price used in 2017 Needs ‐ $7.95 Cu. Yd. Avg. Contract Price 2017 ‐ $9.12 Cu. Yd. Committee’s Recommendation for 2018 Needs ‐ $9.10 Cu. Yd. Aggregate Base: Price used in 2017 Needs ‐ $14.90 Ton Avg. Contract Price 2017 ‐ $13.78 Ton Committee’s Recommendation for 2018 Needs ‐ $13.78 Ton NOTE: committee felt the decrease from last year’s cost could be due to a high unit cost for this item during the 2015 Unit Cost Study. The figure of
$13.78 appears right and corresponds to long term trends. Committee is comfortable with the 2017 Avg. Contract price.
All Bituminous: Price used in 2017 Needs ‐ $69.60 Ton Avg. Contract Price 2017 ‐ $55.56 Ton Committee’s Recommendation for 2018 Needs ‐ $60.00 Ton NOTE: the contract price showed a 20% decrease from last year’s Needs Price. The committee felt with current oil prices, this decline in the bituminous unit cost was possible. Sidewalk: Price used in 2017 Needs ‐ $4.75 Sq. Ft. Avg. Contract Price 2017 ‐ $5.76 Sq. Ft Committee’s Recommendation for 2018 Needs ‐ $5.50 per Sq. Ft. NOTE: This cost has seen large increases in recent years. Rounding to $5.50 still makes this a 15.8% increase from last year’s cost.
26

N:msas/Books/2018 June Book/NSS Minutes Final.docs
Curb and Gutter: Price used in 2017 Needs ‐ $14.55 Lin. Ft. Avg. Contract Price 2017 – $15.92 Lin. Ft. Committee’s Recommendation for 2018 Needs ‐ $15.90 Lin. Ft. Storm Sewer: The MnDOT Hydraulics Unit performed an analysis of storm sewer
Costs for 2017 (172 Storm Sewer Plans were submitted). Costs are $346,066 for new construction, and $106,075 for adjustments of existing systems. This is an average of $226,071 per mile. Committee makes recommendation for the highest of eight sections. Committee’s Recommendation for 2018 Needs ‐ $226,100 Per Mile
The recommendation of $226,100 per mile is for a 70 foot section. The cost per mile will be prorated down through the other ADT groups.
Street Lighting: Price used in 2017 Needs ‐ $100,000 per mile Committee’s Recommendation for 2018 Needs ‐ $100,000 Per Mile Traffic Signals: Price used in 2017 Needs ‐ $195,000 per Signal Committee’s Recommendation for 2018 Needs ‐ $201,850 Per Signal Engineering: Price used in 2017 Needs – 22% Committee’s Recommendation for 2018 Needs – 22% Structures: Price used in 2017 Needs ‐ $90.00 Sq. Ft. Committee’s Recommendation for 2018 Needs ‐ $87.55 Sq. Ft The Committee reviewed the following direction from the May 2017 Municipal Screening Meeting Minutes: “motion that the NSS meet to further study ways to reduce the large fluctuations in the Structures Unit Prices from year to year”. Since 2014, this Unit Cost has been determined annually by using the previous year’s information provided by the MnDOT State Aid Bridge Office. (MSB Resolutions state that ½ of the statewide average bridge cost is used as the structure cost in the Needs). Using this method this year (using bridge costs from 2017) would yield a recommendation of $77.81. The committee eventually decided to base the upcoming recommendation ($87.55) on “one‐half the five year
average” … taking the TOTAL COST for the last 5 years of projects……… divided by the TOTAL AREA for the last 5
years of projects. The committee determined that had we be using this method since the new Needs were
implemented, we wouldn’t have seen large fluctuations in the unit cost.
Meeting adjourned. Minutes submitted by Sean Christensen
27

Needs ItemGrading (Excavation) Cu. Yd. $7.95 $9.10Aggregate Base Ton 14.90 13.78All Bituminous Ton 69.60 60.00
Sidewalk Construction Sq. Ft. 4.75 5.50Curb and Gutter Construction Lin.Ft. 14.55 15.90
Traffic Signals * Per Sig 195,000 201,850Street Lighting Mile 100,000 100,000Engineering Percent 22 22
All Structures (includes both bridges and box culverts)Sq. Ft. 90.00 87.55
Storm Sewer (based on ADT) Per Mile 0 ADT & Non Existing 156,500 159,500 1-499 159,500 162,500 500-1,999 168,400 171,600 2,000-4,999 177,300 180,700 5,000-8,999 189,200 192,800 9,000-13,999 198,100 201,900 14,000-24,999 210,000 214,000 25,000 and over 221,900 226,100
N:\MSAS\Books\June 2018 Book\UNIT PRICE RECOMMENDATIONS.XLXS
2017 MSB Approved Prices
for the 2018 Distribution
2018 UNIT PRICE RECOMMENDATIONSfor the January 2019 distribution (FULL UNIT COST STUDY THIS YEAR)
2018 NSS Recommended Prices for 2019
Distribution
2018 MSB Approved Prices
for the 2019 Distribution
28

sidewalk $ $ % Change aggregate base $ $ % Change
from 2009 to 2010 $3.00 $3.09 3.0 from 2009 to 2010 $9.81 $10.10 3.0
from 2010 to 2011 $3.09 $3.18 2.9 from 2010 to 2011 $10.10 $10.40 3.0
from 2011 to 2012 $3.18 $3.17 ‐0.3 from 2011 to 2012 $10.40 $10.65 2.4
from 2012 to 2013 $3.17 $3.25 2.5 from 2012 to 2013 $10.65 $10.90 2.3
from 2013 to 2014 $3.25 $3.50 7.7 from 2013 to 2014 $10.90 $11.25 3.2
from 2014 to 2015 $3.50 $4.25 21.4 from 2014 to 2015 $11.25 $14.00 24.4
from 2015 to 2016 $4.25 $4.35 2.4 from 2015 to 2016 $14.00 $14.30 2.1
from 2016 to 2017 $4.35 $4.75 9.2 from 2016 to 2017 $14.30 $14.90 4.2
from 2017 to 2018 $4.75 $5.50 15.8 from 2017 to 2018 $14.90 $13.78 ‐7.5
curb & gutter all bituminous
from 2009 to 2010 $10.70 $11.00 2.8 from 2009 to 2010 $55.00 $56.75 3.2
from 2010 to 2011 $11.00 $11.30 2.7 from 2010 to 2011 $56.75 $60.00 5.7
from 2011 to 2012 $11.30 $11.15 ‐1.3 from 2011 to 2012 $60.00 $58.00 ‐3.3
from 2012 to 2013 $11.15 $11.45 2.7 from 2012 to 2013 $58.00 $59.50 2.6
from 2013 to 2014 $11.45 $11.75 2.6 from 2013 to 2014 $59.50 $61.25 2.9
from 2014 to 2015 $11.75 $13.75 17.0 from 2014 to 2015 $61.25 $65.50 6.9
from 2015 to 2016 $13.75 $14.00 1.8 from 2015 to 2016 $65.50 $66.80 2.0
from 2016 to 2017 $14.00 $14.55 3.9 from 2016 to 2017 $66.80 $69.60 4.2
from 2017 to 2018 $14.55 $15.90 9.3 from 2017 to 2018 $69.60 $60.00 ‐13.8
grading/excavtion structures
from 2009 to 2010 $4.75 $4.90 3.2 from 2009 to 2010 $115.00 $120.00 4.3
from 2010 to 2011 $4.90 $5.05 3.1 from 2010 to 2011 $120.00 $115.00 ‐4.2
from 2011 to 2012 $5.05 $6.60 30.7 from 2011 to 2012 $115.00 $125.00 8.7
from 2012 to 2013 $6.60 $6.75 2.3 from 2012 to 2013 $125.00 $120.00 ‐4.0
from 2013 to 2014 $6.75 $7.00 3.7 from 2013 to 2014 $120.00 $72.00 ‐40.0
from 2014 to 2015 $7.00 $7.50 7.1 from 2014 to 2015 $72.00 $96.50 34.0
from 2015 to 2016 $7.50 $7.65 2.0 from 2015 to 2016 $96.50 $120.00 24.4
from 2016 to 2017 $7.65 $7.95 3.9 from 2016 to 2017 $120.00 $90.00 ‐25.0
from 2017 to 2018 $7.95 $9.10 14.5 from 2017 to 2018 $90.00 $87.55 ‐2.7
*All costs shown are actual costs used in Needs. 2018 figures (in blue) show tenative prices.
*Since 2014 cost for structures have been calculated by dividing the yearly contract price by 2.
*Underlined are years of a Full Unit Cost Study
Annual Percentage Change of Unit Costs, 2009 ‐ 2018
29

PERCENTAGE OF NEEDS FOR UNIT COST ITEMSfor 2016 and 2017
13.07
17.02
9.51
8.1611.143.92
5.15
8.93
18.03
5.07
2016Gravel Base
Bituminous
Excavation
Curb & Gutter
Sidewalk
Traffic Signal legs
Street Lighting
Storm Sewer
Engineering
Structures
13.29
17.27
9.64
8.2711.873.96
5.02
8.87
18.03
3.78
2017Gravel Base
Bituminous
Excavation
Curb & Gutter
Sidewalk
Traffic Signal legs
Street Lighting
Storm Sewer
Engineering
Structures
30

CITY NO. OF TOTAL TOTAL AVERAGENAME PROJECTS QUANTITY COST UNIT PRICE
Chisholm 1 896 $11,200 $12.50Duluth 1 234 6,552 28.00International Falls 1 3,668 14,672 4.00Hermantown 2 7,787 124,592 16.00
District 1 Total 5 12,585 $157,016 $12.48
Bemidji 1 2,798 $13,990 $5.00Crookston 3 1,535 36,122 23.53
District 2 Total 4 4,333 $50,112 $11.57
Brainerd 3 4,216 $32,197 $7.64St. Cloud 2 2,636 31,632 12.00Sauk Rapids 2 5,747 40,029 6.97Elk River 4 3,873 67,540 17.44Sartell 1 18,666 110,396 5.91St. Michael 3 10,990 127,470 11.60Isanti 1 604 9,060 15.00Zimmerman 2 3,160 29,862 9.45
District 3 Total 18 49,892 $448,186 $8.98
Alexandria 1 7,350 $69,263 $9.42District 4 Total 1 7,350 $69,263 $9.42
Albert Lea 3 7,034 $74,869 $10.64Austin 1 4,740 34,994 7.38Winona 1 2,740 23,290 8.50
District 6 Total 5 14,514 $133,153 $9.17
Fairmont 1 18,619 $183,066 $9.83Mankato 1 7,268 63,958 8.80St. Peter 2 4,999 23,483 4.70Worthington 4 5,315 62,682 11.79
District 7 Total 8 36,201 $333,190 $9.20
Hutchinson 2 9,889 $121,709 $12.31Marshall 1 1,984 11,904 6.00Montevideo 1 3,500 40,425 11.55Willmar 2 1,016 12,616 12.42Redwood Falls 1 9,010 98,156 10.89
District 8 Total 7 25,399 $284,810 $11.21
MSAS UNIT PRICE STUDYEXCAVATION - CUBIC YARD
District 7
District 8
District 6
District 3
District 2
District 1
District 4
31

CITY NO. OF TOTAL TOTAL AVERAGENAME PROJECTS QUANTITY COST UNIT PRICE
MSAS UNIT PRICE STUDYEXCAVATION - CUBIC YARD
Mendota Heights 2 13,432 $226,443 $16.86Roseville 1 75 2,828 37.70St. Paul 3 17,834 232,636 13.04South St. Paul 2 630 8,505 13.50West St. Paul 1 12,042 169,551 14.08Eagan 1 1,444 43,698 30.26Forest Lake 2 14,470 73,781 5.10Hugo 2 37 371 10.03North Branch 2 45 1,080 24.00Wyoming 2 51,589 339,566 6.58Chisago City 2 595 7,319 12.30
Metro East Total 20 112,193 $1,105,776 $9.86
Blaine 1 21,768 $207,948 $9.55Bloomington 6 1,896 37,920 20.00Brooklyn Park 3 1,013 14,790 14.60Coon Rapids 3 1,220 22,571 18.50Edina 1 999 11,990 12.00Fridley 1 261 2,753 10.55Golden Valley 1 7,171 43,026 6.00Minneapolis 1 4,779 83,468 17.47Mound 4 12,920 131,815 10.20Robbinsdale 1 2,556 35,401 13.85St. Louis Park 1 7,571 101,583 13.42Ham Lake 1 3,069 32,225 10.50Andover 1 280 3,848 13.74East Bethel 1 15,192 43,297 2.85Savage 2 8,350 149,800 17.94Waconia 1 35,910 204,687 5.70Rogers 1 1,995 24,319 12.19Minnetrista 1 44,930 226,772 5.05
Metro West Total 31 171,880 $1,378,214 $8.02
District 1 Total 5 12,585 $157,016 $12.48District 2 Total 4 4,333 50,112 11.57District 3 Total 18 49,892 448,186 0.00District 4 Total 1 7,350 69,263 0.00District 6 Total 5 14,514 133,153 7.64District 7 Total 8 36,201 333,190 12.00District 8 Total 7 25,399 284,810 6.97Metro East Total 20 112,193 1,105,776 17.44Metro West Total 31 171,880 1,378,214 5.91STATE TOTAL 99 434,347 $3,959,719 $9.12
N:\MSAS\UNIT COST STUDY\2018\UNIT PRICE BREAK OUT 2018.xls EXCAVATION
District Totals
Metro East
Metro West
32

2003 $3.75 $3.80 2011 5.03 $5.052004 56 1,018,912 $4,523,089 4.44 4.00 2012 56 689,502 4,521,435 $6.56 6.602005 4.65 4.25 2013 6.77 6.752006 48 587,442 3,152,838 5.37 4.75 2014 6.93 7.002007 5.59 4.95 2015 40 472,486 $3,627,575 $7.68 7.502008 5.74 5.10 2016 7.65 7.652009 47 1,334,769 6,052,005 4.53 4.75 2017 7.95 7.952010 4.90 4.90 2018 56 434,347 3,959,719 9.12
Since 2011, this Unit Cost has increased by an average of $0.58 (note $1.17 increase this year)Yearly Contract Price of $9.12 is a 14.7% increase from "Price used in Needs" last year ($7.95) (Last Year - this increase was 3.9%)
Price Used in Needs
(For this Unit Cost Study, there were 99 projects in 56 cities)
SUBCOMMITTEE'S RECOMMENDED PRICE FOR THE 2018 NEEDS STUDY IS $9.10 PER CUBIC YARD
GRADING/EXCAVATION
Needs Year
Number of Cities
Quantity (Cu.Yd)
Total Cost
Yearly Average Contract
Price
Engineering News Record Construction
Cost Index
Price Used in Needs
Needs Year
Number of Cities
Quantity (Cu. Yd.)
Total Cost
Yearly Average Contract
Price
Engineering News Record Construction
Cost Index
$2.50
$3.00
$3.50
$4.00
$4.50
$5.00
$5.50
$6.00
$6.50
$7.00
$7.50
$8.00
$8.50
$9.00
$9.50
2003 2004 2005 2006 2007 2008 2009 2010 2011 2012 2013 2014 2015 2016 2017 2018
UN
IT P
RIC
E \
CU
BIC
YA
RD
YEARLY CONTRACT AVERAGE ENR CCI NEEDS PRICE
33

CITY NO. OF TOTAL TOTAL AVERAGE
NAME PROJECTS QUANTITY COST UNIT PRICE
Chisholm 1 886 $14,539 $16.40Duluth 1 217 $4,370 20.11International Falls 1 4,651 $41,837 8.99Hermantown 2 7,730 $137,780 17.82
District 1 Total 1 13,485 $198,526 $14.72
Bemidji 1 4,620 $53,130 $11.50Crookston 3 2,816 60,345 21.43
District 2 Total 4 7,436 $113,475 $15.26
Brainerd 3 5,963 $81,258 $13.63St. Cloud 3 4,889 76,862 15.72Sauk Rapids 2 6,250 86,578 13.85Sartell 1 10,342 109,440 10.58St. Michael 4 2,429 41,120 16.93Zimmerman 2 5,870 76,897 13.10
District 3 Total 7 35,744 $472,155 $13.21
Alexandria 1 7,152 $94,600 $13.23District 4 Total 1 7,152 $94,600 $13.23
Albert Lea 3 6,526 $100,385 $15.38Austin 1 5,885 80,919 13.75Winona 1 4,044 59,649 14.75
District 6 Total 5 16,455 $240,953 $14.64
Fairmont 1 13,215 $208,136 $15.75Mankato 1 5,871 74,865 12.75St. Peter 2 5,812 69,596 11.97Worthington 4 2,615 53,717 20.54
District 7 Total 8 27,513 $406,314 $14.77
Hutchinson 2 8,455 $114,776 $13.57Marshall 1 945 5,500 5.82Montevideo 1 4,550 65,975 14.50Willmar 1 646 8,618 13.33Redwood Falls 1 11,128 184,925 16.62
District 8 Total 6 25,725 $379,794 $14.76
District 3
District 4
District 6
District 7
District 8
MSAS UNIT PRICE STUDYAGGREGATE BASE - TONS
District 1
District 2
34

CITY NO. OF TOTAL TOTAL AVERAGE
NAME PROJECTS QUANTITY COST UNIT PRICE
MSAS UNIT PRICE STUDYAGGREGATE BASE - TONS
Mendota Heights 2 1,182 $20,344 $17.21Roseville 1 189 4,270 22.59St. Paul 3 21,618 354,068 16.38South St. Paul 2 370 6,327 17.10West St. Paul 1 5,445 74,488 13.68Burnsville 2 62 1,225 19.75Eagan 1 752 21,357 28.40Forest Lake 2 16,060 183,636 11.43Hugo 2 809 2,144 2.65Wyoming 2 15,855 167,780 10.58
Metro East Total 18 62,342 $835,638 $13.40
Blaine 1 24,208 $159,474 $6.59Bloomington 6 715 10,725 15.00Brooklyn Park 3 1,918 31,668 16.51Edina 1 3,102 41,096 13.25Golden Valley 1 679 13,580 20.00Minneapolis 1 5,061 97,211 19.21Mound 4 16,008 167,706 10.48Robbinsdale 1 4,997 70,296 14.07St. Louis Park 1 11,000 189,200 17.20Chanhassen 1 450 8,010 17.80Ham Lake 1 2,837 35,277 12.43Andover 1 610 8,619 14.13East Bethel 1 9,470 125,478 13.25Savage 3 18,089 274,570 15.18Waconia 1 7,488 110,144 14.71Rogers 1 611 9,312 15.24Minnetrista 1 13,910 274,234 19.71
Metro West Total 29 121,155 $1,626,600 $13.43
District 1 Total 1 13,485 $198,526 $14.72District 2 Total 4 7,436 113,475 15.26District 3 Total 7 35,744 472,155 13.21District 4 Total 1 7,152 94,600 13.23District 6 Total 5 16,455 240,953 14.64District 7 Total 8 27,513 406,314 14.77District 8 Total 6 25,725 379,794 14.76Metro East Total 18 62,342 835,638 13.40Metro West Total 29 121,155 1,626,600 13.43STATE TOTAL 79 317,006 $4,368,054 $13.78
N:\MSAS\UNIT COST STUDY\2015\UNIT PRICE BREAK OUT 2018.xls Agg Base
Metro West
District Totals
Metro East
35

2003 $7.53 $7.30 2011 10.37 $10.402004 58 573,153 $5,252,804 9.16 7.65 2012 57 416,725 4,409,415 $10.58 10.652005 9.59 8.15 2013 10.93 10.902006 46 355,866 3,000,906 8.43 8.40 2014 11.19 11.252007 8.78 8.78 2015 40 199,868 $2,880,423 $14.41 14.002008 9.02 9.00 2016 14.28 14.302009 45 436,802 4,284,174 9.81 9.81 2017 14.86 14.902010 10.12 10.10 2018 52 317,006 4,368,054 13.78
Quantity (Ton)
Total Cost
Yearly Average Contract
Price
AGGREGATE BASE
Yearly Average Contract
Price
Engineering News Record Construction
Cost Index
Price Used in Needs
SUBCOMMITTEE'S RECOMMENDED PRICE FOR THE 2018 NEEDS STUDY IS $ 13.78 PER TON
Engineering News Record Construction
Cost Index
Price Used in Needs
Needs Year
Number of Cities
Quantity (Ton)
Total CostNeeds Year
Number of Cities
Yearly Contract Price of $13.78 is a -7.5% decrease from "Price used in Needs" last year ($14.90) (Previous year saw an increase of 4.2%)Since 2011, this Unit Cost has increased by an average of $0.48 (note -$1.12 decrease this year)
(For this Unit Cost Study, there were 79 projects in 52 cities)
$6.00
$7.00
$8.00
$9.00
$10.00
$11.00
$12.00
$13.00
$14.00
$15.00
$16.00
2003 2004 2005 2006 2007 2008 2009 2010 2011 2012 2013 2014 2015 2016 2017 2018
UN
IT P
RIC
E P
ER
TO
N
YEARLY CONTRACT AVERAGE ENR CCI NEEDS PRICE
36

CITY NO. OF TOTAL TOTAL AVERAGENAME PROJECTS QUANTITY COST UNIT PRICE
Chisholm 5 1,701 $109,024 $64.09Duluth 3 6,131 397,940 64.91Hibbing 9 24,335 961,731 39.52International Falls 1 1,788 117,780 65.87Virginia 2 2,080 109,860 52.82Hermantown 2 4,240 210,365 49.61
District 1 Total 22 40,275 $1,906,699 $47.34
Bemidji 1 1,981 $118,844 $59.99Crookston 4 3,726 218,390 58.61
District 2 Total 5 5,707 $337,234 $59.09
Brainerd 3 9,615 $422,180 $43.91St. Cloud 5 8,932 538,895 60.33Sauk Rapids 2 2,328 150,982 64.85Elk River 5 18,091 810,942 44.82Sartell 1 5,030 269,830 53.64St. Michael 4 11,365 597,575 52.58Isanti 1 1,676 101,727 60.68Zimmerman 2 1,920 104,906 54.64
District 3 Total 23 58,958 $2,997,037 $50.83
Alexandria 2 6,455 $329,247 $51.01Fergus Falls 1 806 55,807 69.24
District 4 Total 3 7,261 $385,054 $53.03
Albert Lea 2 1,341 $108,716 $81.10Austin 2 709 52,960 74.69Rochester 2 3,492 199,414 57.11Winona 1 1,820 155,547 85.47
District 6 Total 7 7,362 $516,637 $70.18
Fairmont 1 5,900 $388,248 $65.80Mankato 1 1,755 113,701 64.77St. Peter 2 3,153 213,280 67.65Worthington 1 1,190 117,477 98.72
District 7 Total 5 11,998 $832,705 $69.40
Hutchinson 1 5,268 $392,574 $74.52Litchfield 4 3,453 165,670 47.97Marshall 1 8,170 547,390 67.00Montevideo 1 2,260 130,000 57.52Willmar 2 6,159 471,698 76.59Redwood Falls 1 4,078 310,095 76.04
District 8 Total 10 29,388 $2,017,428 $68.65
MSAS UNIT PRICE STUDY
District 1
BITUMINOUS
District 6
District 7
District 8
District 2
District 3
District 4
37

CITY NO. OF TOTAL TOTAL AVERAGENAME PROJECTS QUANTITY COST UNIT PRICE
MSAS UNIT PRICE STUDYBITUMINOUS
Hastings 2 1,555 $90,813 $58.40Mendota Heights 2 13,358 738,324 55.27Roseville 8 5,709 343,741 60.21St. Paul 3 9,706 568,924 58.61South St. Paul 2 3,460 170,777 49.36West St. Paul 1 3,485 155,698 44.68Burnsville 2 1,010 51,809 51.30Oakdale 2 25 1,790 71.60Eagan 1 311 33,899 109.00Forest Lake 2 5,930 326,351 55.03Hugo 2 5,993 286,744 47.84North Branch 5 6,844 287,448 42.00Wyoming 2 9,698 458,370 47.26Chisago City 2 1,104 70,539 63.89
Metro East Total 36 68,189 $3,585,227 $52.58
Blaine 1 12,250 $771,750 $63.00Bloomington 6 7,611 400,288 52.59Brooklyn Park 3 6,744 380,105 56.36Coon Rapids 4 12,872 686,876 53.36Edina 1 2,080 109,268 52.53Fridley 5 2,887 157,780 54.65Golden Valley 1 1,398 106,326 76.06Minneapolis 1 8,687 539,157 62.06Mound 4 4,813 301,536 62.66Robbinsdale 1 4,480 244,350 54.55St. Louis Park 1 6,500 392,130 60.33Chanhassen 1 3,401 205,348 60.37Ham Lake 1 2,462 141,197 57.36Andover 1 3,900 216,239 55.45East Bethel 1 6,484 320,179 49.38Savage 2 13,315 653,409 49.07Waconia 1 1,505 96,121 63.87Rogers 1 477 32,170 67.44Minnetrista 1 8,263 517,700 62.66
Metro West Total 37 110,129 $6,271,930 $56.95
District 1 Total 22 40,275 $1,906,699 $47.34District 2 Total 5 5,707 337,234 59.09District 3 Total 23 58,958 2,997,037 50.83District 4 Total 3 7,261 385,054 53.03District 6 Total 7 7,362 516,637 70.18District 7 Total 5 11,998 832,705 69.40District 8 Total 10 29,388 2,017,428 68.65Metro East Total 36 68,189 3,585,227 52.58Metro West Total 37 110,129 6,271,930 56.95STATE TOTAL 148 339,266 $18,849,950 $55.56
N:\MSAS\UNIT COST STUDY\2018\UNIT PRICE BREAK OUT 2018.xls Bituminous
District Totals
Metro East
Metro West
38

2003 $30.31 $31.00 2011 58.27 $60.002004 60 459,606 $15,229,960 33.14 33.00 2012 65 317,687 $18,334,854 $57.71 58.002005 34.68 35.00 2013 59.51 59.502006 51 305,073 11,524,574 37.78 38.00 2014 61.11 61.252007 39.33 42.00 2015 48 226,676 14,843,126 $65.48 65.502008 40.42 45.00 2016 66.81 66.802009 44 277,797 15,744,901 56.68 55.00 2017 69.41 69.602010 56.72 56.75 2018 65 339,266 18,849,950 55.56
(note -$14.04 decrease this year)(For this Unit Cost Study, there were 148 projects in 65 cities)
Price Used in Needs
Needs Year
Number of Cities
Quantity (Ton)
Total Cost
Yearly Contract Price of $55.56 is a -20.2% decrease from "Price used in Needs" last year ($69.60) (Previous year saw an increase of 4.2%)
SUBCOMMITTEE'S RECOMMENDED PRICE FOR THE 2018 NEEDS STUDY IS $60.00 PER TON
Yearly Average Contract
Price
Engineering News Record Construction
Cost Index
Price Used in Needs
Engineering News Record Construction
Cost Index
ALL BITUMINOUS BASE & SURFACE
Needs Year
Number of Cities
Quantity (Ton)
Total Cost
Yearly Average Contract
Price
$20.00
$30.00
$40.00
$50.00
$60.00
$70.00
$80.00
2003 2004 2005 2006 2007 2008 2009 2010 2011 2012 2013 2014 2015 2016 2017 2018
UN
IT P
RIC
E P
ER
TO
N
YEARLY CONTRACT AVERAGE ENR CCI NEEDS PRICE
39

CITY No. Of TOTAL TOTAL AVERAGENAME Projects QTY. COST UNIT PRICE
Duluth 2 9,555 66,198 $6.93Hermantown 2 19,023 73,698 $3.87
District 1 Total 4 28,578 $139,896 $4.90
Bemidji 1 12,445 $47,284 $3.80Crookston 3 26,126 116,261 4.45
District 2 Total 4 38,571 $163,545 $4.24
Brainerd 3 15,640 $85,150 $5.44St. Cloud 4 32,847 342,074 10.41Sauk Rapids 2 17,654 77,079 4.37Elk River 4 8,750 58,926 6.73Sartell 1 176 1,584 9.00St. Michael 2 10,510 68,315 6.50Isanti 1 10,875 43,500 4.00Zimmerman 2 11,120 48,372 4.35
District 3 Total 19 107,572 $725,000 $6.74
Alexandria 1 8,554 $36,711 $4.29Fergus Falls 1 2,694 20,212 7.50
District 4 Total 2 11,248 $56,923 $5.06
Albert Lea 2 17,826 $87,681 $4.92Austin 2 10,160 78,339 7.71Winona 1 11,362 55,403 4.88
District 6 Total 5 39,348 $221,424 $5.63
Fairmont 1 1,927 $26,593 $13.80Mankato 1 19,669 105,315 5.35St. Peter 1 10,263 38,486 3.75Worthington 4 31,984 189,224 5.92
District 7 Total 7 63,843 $359,617 $5.63
Hutchinson 2 1,692 $17,410 $10.29Montevideo 1 3,832 21,675 5.66Willmar 2 4,823 44,250 9.17Redwood Falls 1 9,188 50,534 5.50
District 8 Total 6 19,535 $133,868 $6.85
District 6
District 3
District 4
District 7
District 8
MSAS UNIT PRICE STUDYSIDEWALK CONSTRUCTION - SQUARE FOOT
District 1
District 2
40

CITY No. Of TOTAL TOTAL AVERAGENAME Projects QTY. COST UNIT PRICE
MSAS UNIT PRICE STUDYSIDEWALK CONSTRUCTION - SQUARE FOOT
Hastings 2 1,094 $12,157 $11.12Mendota Heights 2 2,510 25,438 $10.13Roseville 6 2,378 19,623 $8.25St. Paul 3 42,305 260,495 $6.16West St. Paul 1 4,608 22,742 $4.94Burnsville 2 910 6,035 $6.63Oakdale 2 730 5,376 $7.36Lakeville 1 843 9,821 $11.65Eagan 1 1,148 13,317 $11.60Forest Lake 2 4,835 31,476 $6.51Wyoming 1 2,300 26,500 $11.52Chisago City 2 285 10,038 $35.22
Metro East Total 25 63,946 $443,017 $6.93
Blaine 1 49,680 $205,336 $4.13Bloomington 6 23,293 141,300 6.07Brooklyn Park 3 29,702 201,421 6.78Coon Rapids 3 15,690 70,863 4.52Edina 1 5,754 25,803 4.48Fridley 1 27 177 6.54Golden Valley 2 4,851 24,990 5.15Minneapolis 1 21,865 156,049 7.14Robbinsdale 1 16,026 62,009 3.87St. Louis Park 1 34,020 164,877 4.85Chanhassen 1 5,000 33,750 6.75Ham Lake 1 71 568 8.00Andover 1 90 803 8.92Savage 3 26,695 152,899 5.73Minnetrista 1 2,710 18,157 6.70
Metro West Total 27 235,474 $1,259,003 $5.35
District 1 Total 4 28,578 $139,896 $4.90District 2 Total 4 38,571 163,545 4.24District 3 Total 19 107,572 725,000 6.74District 4 Total 2 11,248 56,923 5.06District 6 Total 5 39,348 221,424 5.63District 7 Total 7 63,843 359,617 5.63District 8 Total 6 19,535 133,868 6.85Metro East Total 25 63,946 443,017 6.93Metro West Total 27 235,474 1,259,003 5.35
STATE TOTAL 99 608,114 $3,502,293 $5.76N:\MSAS\UNIT COST STUDY\2018\UNIT PRICE BREAK OUT 2018.xls Sidewalk
District Totals
Metro East
Metro West
41
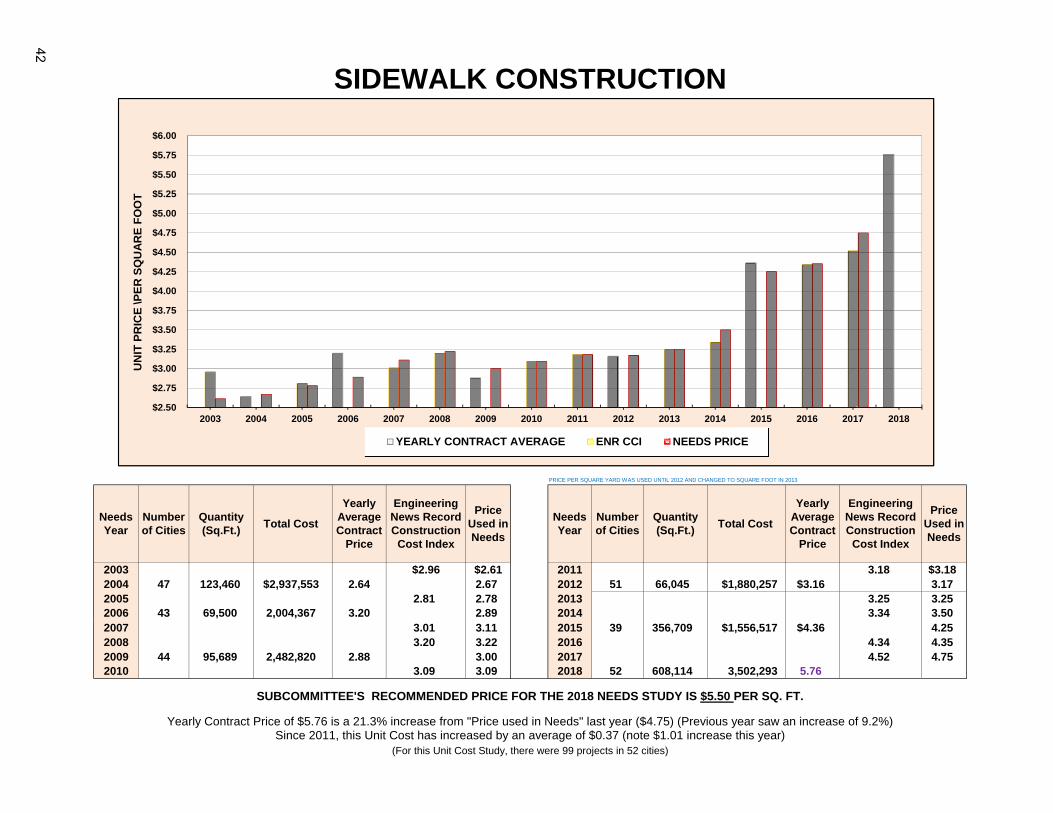
PRICE PER SQUARE YARD WAS USED UNTIL 2012 AND CHANGED TO SQUARE FOOT IN 2013
2003 $2.96 $2.61 2011 3.18 $3.182004 47 123,460 $2,937,553 2.64 2.67 2012 51 66,045 $1,880,257 $3.16 3.172005 2.81 2.78 2013 3.25 3.252006 43 69,500 2,004,367 3.20 2.89 2014 3.34 3.502007 3.01 3.11 2015 39 356,709 $1,556,517 $4.36 4.252008 3.20 3.22 2016 4.34 4.352009 44 95,689 2,482,820 2.88 3.00 2017 4.52 4.752010 3.09 3.09 2018 52 608,114 3,502,293 5.76
Needs Year
Number of Cities
Quantity (Sq.Ft.)
Total Cost
Yearly Average Contract
Price
Total Cost
SIDEWALK CONSTRUCTION
Engineering News Record Construction
Cost Index
Price Used in Needs
Needs Year
Number of Cities
Quantity (Sq.Ft.)
Yearly Average Contract
Price
Engineering News Record Construction
Cost Index
Price Used in Needs
SUBCOMMITTEE'S RECOMMENDED PRICE FOR THE 2018 NEEDS STUDY IS $5.50 PER SQ. FT.
Yearly Contract Price of $5.76 is a 21.3% increase from "Price used in Needs" last year ($4.75) (Previous year saw an increase of 9.2%)Since 2011, this Unit Cost has increased by an average of $0.37 (note $1.01 increase this year)
(For this Unit Cost Study, there were 99 projects in 52 cities)
$2.50
$2.75
$3.00
$3.25
$3.50
$3.75
$4.00
$4.25
$4.50
$4.75
$5.00
$5.25
$5.50
$5.75
$6.00
2003 2004 2005 2006 2007 2008 2009 2010 2011 2012 2013 2014 2015 2016 2017 2018
UN
IT P
RIC
E \P
ER
SQ
UA
RE
FO
OT
YEARLY CONTRACT AVERAGE ENR CCI NEEDS PRICE
42

CITY No. Of TOTAL TOTAL AVERAGE
NAME Projects QTY. COST UNIT PRICE
Chisholm 1 760 $15,200 $20.00Duluth 2 1,806 56,465 31.27International Falls 1 1,856 38,976 21.00Hermantown 2 5,333 78,410 14.70
District 1 Total 6 9,755 $189,051 $19.38
Bemidji 1 5,817 $66,933 $11.51Crookston 3 2,673 78,854 29.50
District 2 Total 4 8,490 $145,786 $17.17
Brainerd 3 4,407 $99,158 $22.50St. Cloud 4 2,478 59,591 24.05Sauk Rapids 2 3,127 37,524 12.00Elk River 5 19,106 240,609 12.59Sartell 1 7,760 97,000 12.50St. Michael 3 3,215 51,880 16.14Isanti 1 2,350 41,445 17.64Zimmerman 2 3,330 39,960 12.00
District 3 Total 21 45,773 $667,167 $14.58
Alexandria 1 3,113 $35,544 $11.42Fergus Falls 1 407 17,094 42.00
District 4 Total 2 3,520 $52,638 $14.95
Albert Lea 2 4,244 $78,396 $18.47Austin 2 467 16,239 34.77Winona 1 3,032 44,722 14.75
District 6 Total 5 7,743 $139,357 $18.00
Fairmont 1 7,761 $103,609 $13.35Mankato 1 3,376 54,323 16.09St. Peter 1 2,102 31,110 14.80Worthington 3 3,399 77,890 22.92
District 7 Total 6 16,638 $266,932 $16.04
Hutchinson 2 7,292 $85,316 $11.70Litchfield 3 400 13,200 33.00Marshall 1 4,400 49,060 11.15Montevideo 1 2,016 32,256 16.00Willmar 2 3,609 73,771 20.44Redwood Falls 1 4,143 60,488 14.60
District 8 Total 10 21,860 $314,092 $14.37
District 7
District 8
MSAS UNIT PRICE STUDYCURB AND GUTTER CONSTRUCTION - LIN. FT.
District 1
District 6
District 2
District 3
District 4
43

CITY No. Of TOTAL TOTAL AVERAGE
NAME Projects QTY. COST UNIT PRICE
MSAS UNIT PRICE STUDYCURB AND GUTTER CONSTRUCTION - LIN. FT.
Hastings 2 400 $8,672 $21.68Mendota Heights 2 8,270 164,739 19.92Roseville 8 1,077 23,686 21.99St. Paul 3 9,796 183,698 18.75South St. Paul 2 320 6,656 20.80West St. Paul 1 5,781 68,505 11.85Burnsville 2 610 15,494 25.40Oakdale 2 520 11,336 21.80Lakeville 1 66 2,063 31.25Eagan 1 605 15,518 25.65Forest Lake 2 14,590 205,960 14.12Wyoming 2 550 11,083 20.15Chisago City 1 72 5,705 79.24
Metro East Total 29 42,657 $723,114 $16.95
Blaine 1 22,750 $286,887 $12.61Bloomington 6 6,319 122,922 19.45Brooklyn Park 3 10,660 203,337 19.07Coon Rapids 4 10,220 161,868 15.84Edina 1 5,104 82,976 16.26Fridley 4 448 9,520 21.25Golden Valley 2 1,308 42,995 32.87Minneapolis 1 6,928 155,332 22.42Robbinsdale 1 5,271 61,144 11.60St. Louis Park 1 5,530 133,628 24.16Chanhassen 1 1,825 36,956 20.25Ham Lake 1 2,619 27,211 10.39Andover 1 10,500 117,285 11.17East Bethel 1 10,374 121,261 11.69Savage 3 6,383 121,673 19.06Waconia 1 1,956 23,879 12.21Rogers 1 976 17,500 17.93Minnetrista 1 1,930 33,941 17.59Medina 1 296 4,631 15.64
Metro West Total 35 111,397 $1,764,946 $15.84
District 1 Total 6 9,755 $189,051 $19.38District 2 Total 4 8,490 145,786 17.17District 3 Total 21 45,773 667,167 14.58District 4 Total 2 3,520 52,638 14.95District 6 Total 5 7743 139,357 18.00District 7 Total 6 16,638 266,932 16.04District 8 Total 10 21,860 314,092 14.37Metro East Total 29 42,657 723,114 16.95Metro West Total 35 111,397 1,764,946 15.84STATE TOTAL 118 267,833 $4,263,081 $15.92
N:\MSAS\UNIT COST STUDY\2018\UNIT PRICE BREAK OUT 2018.xls C&G
District Totals
Metro East
Metro West
44

2003 $7.91 $8.00 2011 11.29 $11.302004 59 469,131 $4,110,211 8.76 8.25 2012 63 281,751 3,130,181 $11.11 11.152005 9.31 8.75 2013 11.44 11.452006 52 327,171 3,195,201 9.77 9.75 2014 11.76 11.752007 10.17 10.15 2015 44 168,891 $2,344,989 $13.88 13.752008 10.45 10.45 2016 14.03 14.002009 43 262,251 2,812,246 10.72 10.70 2017 14.55 14.552010 11.03 11.00 2018 61 267,833 4,263,081 15.92
SUBCOMMITTEE'S RECOMMENDED PRICE FOR THE 2018 NEEDS STUDY IS $15.90 PER LIN. FT.
Yearly Contract Price of $15.92 is a 9.4% increase from "Price used in Needs" last year ($14.55) (Previous year saw an increase of 3.9%)Since 2011, this Unit Cost has increased by an average of $0.66 (note $1.37 increase this year)
(For this Unit Cost Study, there were 118 projects in 61 cities)
Yearly Average Contract
Price
Engineering News Record Construction
Cost Index
Price Used in Needs
CURB AND GUTTER CONSTRUCTION
Engineering News Record Construction
Cost Index
Price Used in Needs
Needs Year
Number of Cities
Quantity (Ln. Ft.)
Needs Year
Number of Cities
Quantity (Ln. Ft.)
Total Cost
Yearly Average Contract
Price
Total Cost
$7.00
$8.00
$9.00
$10.00
$11.00
$12.00
$13.00
$14.00
$15.00
$16.00
$17.00
2003 2004 2005 2006 2007 2008 2009 2010 2011 2012 2013 2014 2015 2016 2017 2018
UN
IT P
RIC
E P
ER
LIN
EA
L F
OO
T
YEARLY CONTRACT AVERAGE ENR CCI NEEDS PRICE
45

Dist. Dist. Dist. Dist. Dist. Dist. Dist. Metro Metro State1 2 3 4 6 7 8 East West Average
Excavation $12.48 $11.57 $8.98 $9.42 $9.17 $9.20 $11.21 $9.86 $8.02 $9.12Aggregate Base $14.72 $15.26 $13.21 $13.23 $14.64 $14.77 $14.76 $13.40 $13.43 $13.78Bituminous- All $47.34 $59.09 $50.83 $53.03 $70.18 $69.40 $68.65 $52.58 $56.95 $55.56Sidewalk Construction $4.90 $4.24 $6.74 $5.06 $5.63 $5.63 $6.85 $6.93 $5.35 $5.76C & G Construction $19.38 $17.17 $14.58 $14.95 $18.00 $16.04 $14.37 $16.95 $15.84 $15.92
N:\MSAS\UNIT COST STUDY/UNIT PRICE BREAKOUT 2018
UNIT PRICES BY DISTRICT2017 prices, for the 2018 Unit Price Study
$12.48 $11.57
$8.98 $9.42 $9.17 $9.20
$11.21
$9.86
$8.02
$6.00
$9.00
$12.00
$15.00
Dist. 1 Dist. 2 Dist. 3 Dist. 4 Dist. 6 Dist. 7 Dist. 8 MetroE
MetroW
State Average = $9.12
EXCAVATION
EXCAVATION STATE AVERAGE
$14.72 $15.26
$13.21 $13.23 $14.64 $14.77
$14.76
$13.40 $13.43
$10
$13
$16
$19
Dist. 1 Dist. 2 Dist. 3 Dist. 4 Dist. 6 Dist. 7 Dist. 8 MetroE
MetroW
State Average = $13.78
AGGREGATE BASE
AGGREGATE BASE STATE AVERAGE
$47.34
$59.09
$50.83 $53.03
$70.18 $69.40 $68.65
$52.58
$56.95
$45
$50
$55
$60
$65
$70
$75
$80
Dist. 1 Dist. 2 Dist. 3 Dist. 4 Dist. 6 Dist. 7 Dist. 8 MetroE
MetroW
State Average = $55.56
BITUMINOUS
BIT. SURFACE STATE AVERAGE
$19.38
$17.17
$14.58 $14.95
$18.00
$16.04
$14.37
$16.95
$15.84
$10
$12
$14
$16
$18
$20
$22
$24
Dist. 1 Dist. 2 Dist. 3 Dist. 4 Dist. 6 Dist. 7 Dist. 8 MetroE
MetroW
State Average = $15.92
CURB AND GUTTER CONSTRUCTION
Curb & Gutter Construction STATE AVERAGE
$4.90
$4.24
$6.74
$5.06
$5.63 $5.63
$6.85 $6.93
$5.35
$3
$4
$5
$6
$7
$8
$9
Dist. 1 Dist. 2 Dist. 3 Dist. 4 Dist. 6 Dist. 7 Dist. 8 MetroE
MetroW
State Average = $5.76
SIDEWALK CONSTRUCTION
SIDEWALK CONSTRUCTION STATE AVERAGE
46

Storm Sewer
Lighting
Signals
47

48

1998 $76,000 $245,000 $20,000 $24,990-$99,9901999 79,000 246,000 35,000 24,990-99,9902000 80,200 248,500 50,000 24,990-99,9902001 80,400 248,000 78,000 30,000-120,0002002 81,600 254,200 78,000 30,000-120,0002003 82,700 257,375 80,000 31,000-124,0002004 83,775 262,780 80,000 31,000-124,0002005 85,100 265,780 82,500 32,500-130,0002006 86,100 268,035 100,000 32,500-130,0002007 88,100 271,000 100,000 32,500-130,0002008 89,700 278,200 100,000 32,500-130,0002009 92,800 289,300 100,000 32,500-130,0002010 94,200 295,400 100,000 34,000-136,0002011 95,600 301,300 100,000 34,000-136,0002012 97,000 307,300 100,000 34,000-136,000
2013 100,000 $225,000/signal2014 100,000 205,000/signal2015 100,000 185,000/signal2016 100,000 188,700/signal2017 100,000 195,000/signal2018 100,000 201,850/signal
** Signals and Storm Sewer were 'per mile' in old Needs method
Storm Sewer (high section) $226,100
Lighting / Mile $100,000
Traffic Signals (per Signal) $201,850
n:/msas/books/2018 NSS Book\SS, Lighting, Signal History.xls
New Needs Method
148,100 to 210,000 $145,260 to $205,954
150,900 to 214,000
NEEDS STUDY SUBCOMMITTEE'S RECOMMENDED PRICES FOR 2018:
153,600 to 217,800156,500 to 221,900159,500 to 226,100
SIGNALS**
HISTORY: STORM SEWER, LIGHTING AND SIGNAL NEEDS COSTS
NEEDS YEAR
STORM SEWER ADJUSTMENT
STORM SEWER** CONSTRUCTION LIGHTING
49

50

Municipal Screening Board Resolutions state:
Complete Storm Sewer Cost from Hydraulics Specialist $346,066
Partial Storm Sewer Cost from Hydraulics Specialist $106,075
$226,071
NSS Recommended Unit Cost $226,100MSB Approved Unit Cost for 2018 $xxx,xxx
Needs Width of MSAS
Urban ADT Groups for
Needs Purposes
Existing ADT per Traffic
Group
Cost difference from 70' section
MSB approved percent cost
difference from 70' section
Cost based on % of Cost of highest Typical Section
260 ADT & Non
Existing ($66,600) -29.5% $159,500
28 1-499 ($63,600) -28.1% $162,500
34 500-1,999 ($54,500) -24.1% $171,600
40 2,000-4,999 ($45,400) -20.1% $180,700
48 5,000-8,999 ($33,300) -14.7% $192,800
54 9,000-13,999 ($24,200) -10.7% $201,900
62 14,000-24,999 ($12,100) -5.4% $214,000
70 25,000 and over $0 0.0% $226,100
from last year's SS letter
Complete: $339,280
Partial: $104,507
AVG: $221,894
Needs Width of MSAS Urban ADT Groups
Existing ADT per Traffic Group
Cost difference from 70' section
MSB approved percent cost
difference from 70' section
Cost based on % of Cost of highest Typical
Section
260 ADT & Non
Existing ($65,400) -29.5% $156,500
28 1-499 ($62,400) -28.1% $159,500
34 500-1,999 ($53,500) -24.1% $168,400
40 2,000-4,999 ($44,600) -20.1% $177,300
48 5,000-8,999 ($32,700) -14.7% $189,200
54 9,000-13,999 ($23,800) -10.7% $198,100
62 14,000-24,999 ($11,900) -5.4% $210,000
70 25,000 and over $0 0.0% $221,900
2017-2018 Percentage Change for highest section = 1.9% (same as 2017)
N:MSAS\Books\2018 June Book\Storm Sewer Recommendations.xlsx
NSS recommended Storm Sewer Costs for 2018
STORM SEWER COST RECOMMENDATIONS
Average SS Cost = ($346,066 + $106,075) / 2 =
The Unit Cost per mile of Storm Sewer for the highest MSAS Urban ADT Group for Needs Purposes will be based on the average costs of all Storm Sewer Construction on the MSAS system in the previous year. To determine the Unit Cost for the highest ADT Group, average costs for Complete Storm Sewer projects and Partial Storm Sewer projects will be provided to State Aid by the MnDOT Hydraulics Office and then added together and divided by two to calculate a statewide average Unit Cost for all Storm Sewer Construction.
The Unit Cost per mile for Storm Sewer Construction will be calculated for the highest MSAS Urban ADT Group and be prorated downward for the other ADT Groups. This proration has been determined based upon an engineering study requested by the Municipal Screening Board in 2011 and will be the basis for the Needs calculations.
based on 2017 costs - for the 2018 Needs Study
MSB approved Storm Sewer Costs for 2017 (last year)based on 2016 costs - for the 2017 Needs Study
51

SIGNALS
CURRENT SCREENING BOARD RESOLUTION ON TRAFFIC SIGNALS
The Unit Cost for Traffic Signals will be determined by the recommendation by the SALT Program Support Engineer and approved by the MSB. The Unit Cost for traffic signals will be based on a cost per signal leg, and for Needs purposes a signal leg will be defined as ¼ of the signal cost. Only signal legs on designated MSAS routes will be included in the Needs study. Stand-alone pedestrian crossing signals will not be included in the Needs study.
TRAFFIC SIGNALS AND THE UNIT COST STUDY
Traffic Signals are part of the Unit Cost Study. Signal Studies are conducted by The SALT Program Support Engineer once every 3 years. In ‘off years’ an inflation factor is applied. Here is the summary of this year’s study:
NSS RECOMMENDATION
Last year’s unit cost for signals was $195,000.
SUBCOMMITTEE’S RECOMMENDED SIGNAL PRICE FOR THE 2018 NEEDS IS $201,850.
52

Summary Signal ONLY Needs
Intersection Configuration
Cost Construct
Cost Remove Exiting
Grand Total Signal ONLY
Contract Total Contract Holder Location Year Built
Smaller 4 Legged $150,471 Incidental $157,159 $14,320,706 MnDOT Detroit Lakes 2016Smaller 4 Legged $190,000 $3,400 $193,400 $2,037,500 MnDOT Morris 2015Larger 4 Legged $241,000 $8,500 $261,030 $1,197,442 MnDOT Baxter 2016
Greater MN
MetroIntersection Configuration
Cost Construct
Cost Remove Exiting
Grand Total Signal ONLY
Contract Total Contract Holder Location Year Built
Larger 4 Legged $204,510 Incidental $214,200 $962,925 Hennepin County Richfield 2015
Smaller 4 Legged $175,000 $2,710 $183,460 $15,574,002 Hennepin County Minnetonka 2015
NOTES: These estimates do NOT account for temporary signal systems, curb and gutter, pavement, pavement marking, traffic signing, truncated domes or pedestrian ramps, interconnection, etc.These estimates account for signal mast arms, signal heads, handholes, loops, EVP, push buttons, etc.
By: GF and MEVOn: 041118
Average Cost
Greater MN $203,863
Metro $198,830
Statewide $201,850
48
53

LIGHTING
The unit cost for Street lighting has been $100,000 / per mile since 2007.
During the 2014 NSS meeting, the committee approved a motion that lighting costs should be studied as part of the 2015 Full Unit Cost Study. The highlights from that study are below:
For details of the 2015 Street Light Study, find the 2015 Spring Report at following website:
http://www.dot.state.mn.us/stateaid/msas-springbooks.html
CURRENT SCREENING BOARD RESOLUTION ON STREET LIGHTING
(revised May, 2015)
The Unit Cost for Street Lighting will be determined by multiplying the Unit Price per mile by the segment length. This Unit Cost will remain at $100,000 per mile. The Municipal Screening Board may request a study on this item on any year if it is deemed necessary
SUBCOMMITTEE’S RECOMMENDED PRICE FOR 2018 NEEDS IS $100,000 PER MILE
54

MnDOT State Aid Bridge Office2017 Calendar Year - - Bridge Cost Report
General Notes
The CY 2017 Bridge Cost Report reflects the unit cost ($ per square foot of bridge area) of all of thebridges let in CY 2017.
Pre-cast concrete box culverts have not been included in this report as they do not generally getreviewed (or approved) by the State Aid Bridge Office. We have produced a separate report for pre-cast concrete box culvert cost information.
The bridge unit costs are derived from the pay items on the 1st sheet of each bridge plan andtherefore may include Traffic Control, Guardrail, etc.
We exclude one bridge pay item when calculating the cost of each bridge. That pay item is RemoveExisting Bridge and it occurs prior to bridge construction and is not eligible for state or federalfunding.
If a bridge has expensive aesthetic features, it may result in a higher unit cost for the bridge. Bridgeswith an unusually high (or low) unit cost will be omitted to ensure we are reporting “average” bridgeunit costs.
Please note that the purpose of this report is to provide the approximate costs of building the varioustypes of bridges and to track those cost trends over time.
Please report any missing bridges to the State Aid Bridge Office as soon as possible so we can revisethe report. Once the report gets loaded to our website it’s considered to be final.
As always we appreciate your comments and feel free to call us if you have any questions orcomments.
Dave ConkelMnDOT State Aid Bridge EngineerPhone: 651-366-4493E-Mail: [email protected]
55
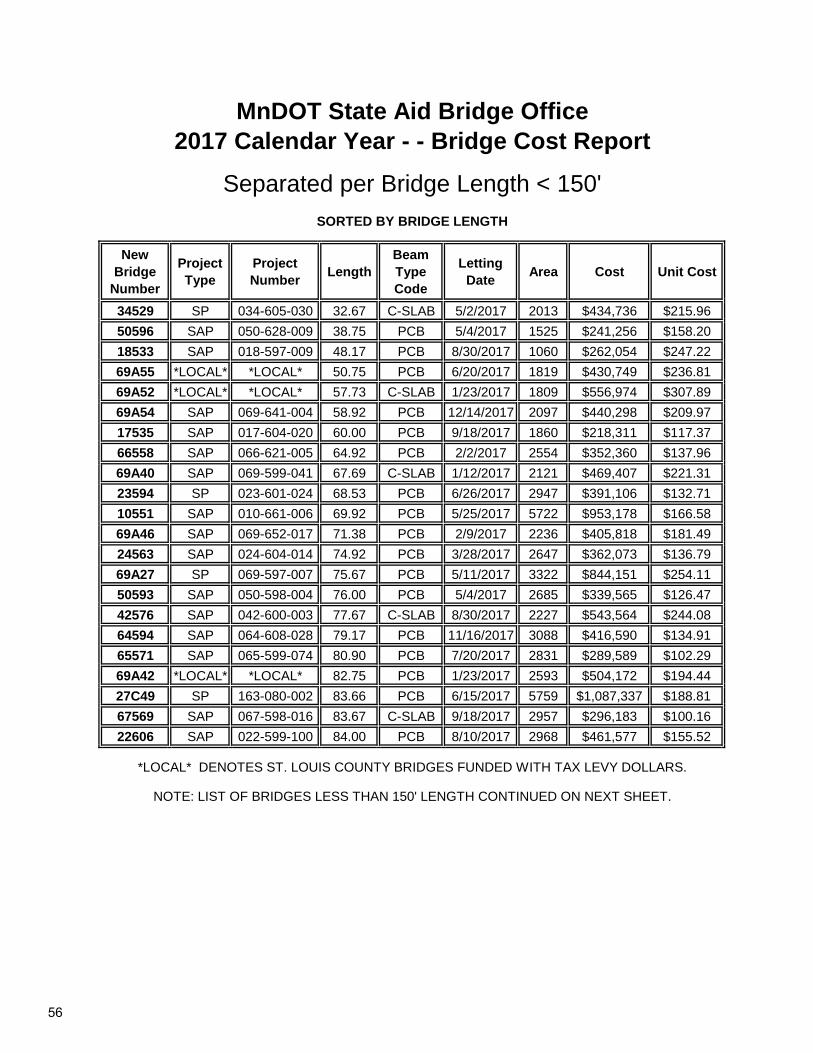
New Bridge
Number
Project Type
Project Number
LengthBeam Type Code
Letting Date
Area Cost Unit Cost
34529 SP 034-605-030 32.67 C-SLAB 5/2/2017 2013 $434,736 $215.96
50596 SAP 050-628-009 38.75 PCB 5/4/2017 1525 $241,256 $158.20
18533 SAP 018-597-009 48.17 PCB 8/30/2017 1060 $262,054 $247.22
69A55 *LOCAL* *LOCAL* 50.75 PCB 6/20/2017 1819 $430,749 $236.81
69A52 *LOCAL* *LOCAL* 57.73 C-SLAB 1/23/2017 1809 $556,974 $307.89
69A54 SAP 069-641-004 58.92 PCB 12/14/2017 2097 $440,298 $209.97
17535 SAP 017-604-020 60.00 PCB 9/18/2017 1860 $218,311 $117.37
66558 SAP 066-621-005 64.92 PCB 2/2/2017 2554 $352,360 $137.96
69A40 SAP 069-599-041 67.69 C-SLAB 1/12/2017 2121 $469,407 $221.31
23594 SP 023-601-024 68.53 PCB 6/26/2017 2947 $391,106 $132.71
10551 SAP 010-661-006 69.92 PCB 5/25/2017 5722 $953,178 $166.58
69A46 SAP 069-652-017 71.38 PCB 2/9/2017 2236 $405,818 $181.49
24563 SAP 024-604-014 74.92 PCB 3/28/2017 2647 $362,073 $136.79
69A27 SP 069-597-007 75.67 PCB 5/11/2017 3322 $844,151 $254.11
50593 SAP 050-598-004 76.00 PCB 5/4/2017 2685 $339,565 $126.47
42576 SAP 042-600-003 77.67 C-SLAB 8/30/2017 2227 $543,564 $244.08
64594 SAP 064-608-028 79.17 PCB 11/16/2017 3088 $416,590 $134.91
65571 SAP 065-599-074 80.90 PCB 7/20/2017 2831 $289,589 $102.29
69A42 *LOCAL* *LOCAL* 82.75 PCB 1/23/2017 2593 $504,172 $194.44
27C49 SP 163-080-002 83.66 PCB 6/15/2017 5759 $1,087,337 $188.81
67569 SAP 067-598-016 83.67 C-SLAB 9/18/2017 2957 $296,183 $100.16
22606 SAP 022-599-100 84.00 PCB 8/10/2017 2968 $461,577 $155.52
MnDOT State Aid Bridge Office2017 Calendar Year - - Bridge Cost Report
Separated per Bridge Length < 150'
SORTED BY BRIDGE LENGTH
*LOCAL* DENOTES ST. LOUIS COUNTY BRIDGES FUNDED WITH TAX LEVY DOLLARS.
NOTE: LIST OF BRIDGES LESS THAN 150' LENGTH CONTINUED ON NEXT SHEET.
56

New Bridge
Number
Project Type
Project Number
LengthBeam Type Code
Letting Date
Area Cost Unit Cost
28557 SAP 028-619-001 87.34 PCB 7/17/2017 3200 $392,774 $122.74
42578 SAP 042-600-003 89.67 C-SLAB 8/30/2017 2571 $580,922 $225.95
31575 SAP 031-598-024 90.17 PCB 5/2/2017 3186 $408,346 $128.17
37555 SAP 037-599-107 97.00 C-SLAB 3/20/2017 3427 $386,747 $112.85
42577 SAP 042-600-003 99.67 C-SLAB 8/30/2017 2858 $640,719 $224.18
69A50 SAP 069-597-008 100.21 PCB 11/9/2017 3724 $864,629 $232.18
74560 SAP 074-599-031 104.00 PCB 5/4/2017 3675 $374,987 $102.04
77536 SAP 077-601-021 104.17 PCB 7/11/2017 3889 $463,371 $119.15
14557 SAP 014-598-068 104.67 C-SLAB 9/5/2017 3280 $396,884 $121.00
25619 SAP 025-599-116 111.92 PCB 1/14/2017 3283 $346,477 $105.54
14558 SAP 014-599-102 118.73 C-SLAB 2/21/2017 3721 $409,957 $110.17
32576 SP 032-624-035 123.00 PCB 3/24/2017 4838 $521,501 $107.79
67570 SAP 067-617-011 128.67 C-SLAB 3/31/2017 4547 $541,874 $119.17
43539 SAP 133-109-008 147.73 C-SLAB 12/21/2017 6328 $846,426 $133.76
Total Deck Area 111,367Average Cost per Sq Ft $156.93Total No. of Bridges < 150' 36
MnDOT State Aid Bridge Office2017 Calendar Year - - Bridge Cost Report
Separated per Bridge Length < 150' (Cont'd)SORTED BY BRIDGE LENGTH
*LOCAL* DENOTES ST. LOUIS COUNTY BRIDGES FUNDED WITH TAX LEVY DOLLARS.
Total Cost $17,476,662
57

New Bridge
Number
Project Type
Project Number
LengthBeam Type Code
Letting Date
Area Cost Unit Cost
43561 SAP 043-599-043 160.38 PCB 3/28/2017 5667 $867,902 $153.15
31574 SAP 031-598-025 175.17 PCB 5/2/2017 5489 $1,050,133 $191.32
03513 SAP 003-607-022 192.17 PCB 9/14/2017 9624 $2,038,065 $211.77
R0665 SP 073-090-010 200.00 TRUSS 7/21/2017 2867 $620,014 $216.26
87563 SP 087-598-025 252.42 PCB 8/3/2017 8919 $951,385 $106.67
13526 SAP 013-620-026 354.17 PCB 11/21/2017 15348 $1,782,433 $116.13
Average Cost per Sq Ft $155.62Total Number of Bridges 42
MnDOT State Aid Bridge Office2017 Calendar Year - - Bridge Cost Report
Totals for All Bridges Let in CY 2017
Total Cost for all Bridges $24,786,595Total Deck Area for all Bridges 159,281
Total Deck Area 47,914Average Cost per Sq Ft $152.56Total No. of Bridges > 150' 6
MnDOT State Aid Bridge Office2017 Calendar Year - - Bridge Cost Report
Separated per Bridge Length > 150'SORTED BY BRIDGE LENGTH
Total Cost $7,309,934
58

AVG COST PER SQ FT AVG COST PER SQ FT
YEARLY 5-YEAR YEARLY 5-YEAR
NUMBER AVERAGE PRICE AVERAGE NUMBER AVERAGE PRICE AVERAGE
NEEDS OF DECK TOTAL CONTRACT USED IN CONTRACT NEEDS OF DECK TOTAL CONTRACT USED IN CONTRACT
YEAR PROJECTS AREA COST PRICE NEEDS PRICE YEAR PROJECTS AREA COST PRICE NEEDS PRICE
2007 49 235,505 $26,798,183 $113.79 $105.00 $94.26 2013 73 505,031 $61,637,866 $122.05 $120.00 $117.80
2008 37 247,120 28,815,052 116.60 110.00 94.58 2014 91 379,364 54,646,656 144.05 72.00 120.85
2009 46 301,827 38,797,162 128.54 115.00 109.97 2015 49 196,550 37,973,287 193.20 96.50 130.48
2010 56 333,867 34,675,259 103.86 120.00 112.02 2016 41 178,429 42,852,558 240.17 120.08 150.68
2011 66 509,552 51,008,086 100.10 115.00 110.63 2017 47 184,138 31,962,025 173.58 90.00 158.69
2012 69 475,190 64,255,407 135.22 125.00 116.49 2018 42 159,281 24,786,595 155.62 87.55 175.10
ALL BRIDGES
SUBCOMMITTEES RECOMMENDED STRUCTURE PRICE FOR THE 2018 NEEDS STUDY IS $87.55 PER SQ. FT.MSB RESOLUTIONS STATE THAT 1\2 OF THE STATEWIDE AVERAGE BRIDGE COST BE USED AS THE STRUCTURE COST IN THE NEEDS
N/MSAS/2018 JUNE BOOK/ALL BRIDGES GRAPH 2018.XLSX
$50
$60
$70
$80
$90
$100
$110
$120
$130
$140
$150
$160
$170
$180
$190
$200
$210
$220
$230
$240
$250
2007 2008 2009 2010 2011 2012 2013 2014 2015 2016 2017 2018
UN
IT P
RIC
E P
ER
SQ
. FT.
`
Yearly Avg. Contract Price Price Used in Needs Five Year Average Contract Price
59

AVG COST PER SQ FT AVG COST PER SQ FT
YEARLY 5-YEAR YEARLY 5-YEAR
NUMBER AVERAGE PRICE AVERAGE NUMBER AVERAGE PRICE AVERAGE
NEEDS OF DECK TOTAL CONTRACT USED IN CONTRACT NEEDS OF DECK TOTAL CONTRACT USED IN CONTRACT
YEAR PROJECTS AREA COST PRICE NEEDS PRICE YEAR PROJECTS AREA COST PRICE NEEDS PRICE
2007 49 235,505 $26,798,183 $113.79 $105.00 $94.26 2013 73 505,031 $61,637,866 $122.05 $120.00 $117.80
2008 37 247,120 28,815,052 116.60 110.00 94.58 2014 91 379,364 54,646,656 144.05 60.43 120.85
2009 46 301,827 38,797,162 128.54 115.00 109.97 2015 49 196,550 37,973,287 193.20 65.24 130.48
2010 56 333,867 34,675,259 103.86 120.00 112.02 2016 41 178,429 42,852,558 240.17 75.34 150.68
2011 66 509,552 51,008,086 100.10 115.00 110.63 2017 47 184,138 31,962,025 173.58 79.35 158.69
2012 69 475,190 64,255,407 135.22 125.00 116.49 2018 42 159,281 24,786,595 155.62 87.55 175.10
N/MSAS/2018 JUNE BOOK/ALL BRIDGES GRAPH 2018.XLSX
ALL BRIDGES (Hypothetical)
GRAPH SHOWS WHAT NEEDS PRICES FOR STRUCTURES WOULD HAVE BEEN SINCE 2014,IF THE ANNUAL NSS RECOMMENDATION HAD BEEN BASED OFF ONE-HALF THE 5 YEAR CONTRACT AVERAGE
$0
$10
$20
$30
$40
$50
$60
$70
$80
$90
$100
$110
$120
$130
$140
$150
$160
$170
$180
$190
2014 2015 2016 2017 2018
UN
IT P
RIC
E P
ER
SQ
. FT.
`
Price Used in Needs Five Year Average Contract Price
60

April 16, 2018.
RECOMMENDATION ON STRUCTURE UNIT COST FOR THE NEEDS
The Needs Study Subcommittee reviewed the following motion, which was approved by the
Municipal Screening Board on May 24th 2017:
Motion: that the NSS meet to further study ways to reduce the large fluctuations in the
Structures Unit Prices from year to year.
The committee looked at the annual fluctuations in this cost, noting that some years have low
numbers of low priced projects, while in other years we might see more funding / bridge
bonding and therefore higher numbers of larger projects, bringing the overall cost up.
Using just one year of data for a given year – this unit cost will continue to fluctuate.
NSS RECOMMENDATION: the Unit Cost for Structures shall be based off a “5‐year average” of
bridge costs provided by the MnDOT State Aid Bridge Office. Keeping consistent with current
Screening Board Resolutions, one‐half of this 5‐year average will the basis of the
recommendation for the Unit Price for Structures.
The Needs Study Subcommittee has determined that this method increases the sample size of
projects being used in the average cost, thus reducing the annual fluctuation in the Structure
Cost used in the Needs.
For 2018 Needs Study, the Needs Study Subcommittee’s recommended structure price is $87.55
per SQ FT
Five Year Average
Data Year / Needs Year
Area Cost yearly contract price
one‐half
2013/2014 379,364 $54,646,656 $144.05 $72.02
2014/2015 196,550 $37,973,287 $193.20 $96.60
2015/2016 178,429 $42,852,558 $240.17 $120.08
2016/2017 184,138 $31,962,025 $173.58 $86.79
2017/2018 159,281 $24,786,595 $155.62 $77.81
5 year Ave 1,097,762 $192,221,121 $175.10 $87.55
Submitted,
Sean Christensen
NSS Secretary
61

62

63

REMINDER OF THE 2015 UCFS RECOMMENDATION ON SIGNALS
In August of 2015, the UCFS made a recommendation which provided clarity on how Unit Costs for Signals would be determined:
“Consistent with current MSB resolution which states, “The Unit Cost for Traffic Signals will be determined by the recommendation by the SALT Program Support Engineer and approved by the MSB”, the UCFS recommends that the screening board direct the NSS to utilize the average cost of a four leg signal as provided every three years by the SALT program engineer as the primary basis for their unit price study recommendation for signal needs. In ‘off years’, the unit price be set using the Engineering News Record construction cost index. For the 2015 needs Unit Price Study this average cost is $185,000.
The UCFS Meeting was adjourned by Chair Keely at 2:20 pm.
Respectfully Submitted,
Steven G. Bot, P.E.
Unencumbered Construction Funds Subcommittee Secretary
St. Michael City Engineer
64

REMINDER OF THE 2016 UCFS RECOMMENDATION ON ROUNDABOUTS
As formally requested by the MSA Screening Board at their 2015 fall meeting, the UCFS has reviewed the
possibility of including roundabouts as a Needs item. Per meeting discussions on January 27 and March
2, 2016, the UCFS believes that Needs Study Task Force’s (NSTF) approach to not include roundabouts as
a Needs item should remain as it currently exists. This decision was based on the following
considerations and points:
Respect of the NSTF’s determination not to include roundabouts in the new MSA Needs administration/calculation system.
MSA street segments are currently measured to the center of a roundabout intersection, therefore each leg receives Needs on an approximate relative share of the roundabout circumference.
Roundabout improvements primarily consist of roadway construction costs, where traffic signal improvements also have significant roadway construction costs along with the actual signal system equipment installations.
The major distinction between roundabout and signalized intersections appears to be the addition of the actual traffic signal equipment installation and associated maintenance costs.
Can’t simply apply traffic signal Needs amounts to roundabouts, due to this approach utilizing unit costs from one item to generate Needs for another when the costs involved in constructing, maintaining and potentially replacing the two are significantly different.
Cities are currently receiving after‐the‐fact adjustments of right‐of‐way acquisition costs (potentially a significant roundabout construction cost).
Cities often decide to construct a roundabout where traffic signal warrants aren’t satisfied.
Maintenance costs for traffic signals in comparison to roundabouts seem to be higher.
The UCFS has unanimously approved the position that roundabouts do not have the ongoing
maintenance and equipment replacement for which signals draw Needs. Therefore roundabouts should
draw Needs as a typical non‐signalized intersection.
Respectfully submitted,
Klayton Eckles
65

State Aid for Local Transportation
395 John Ireland Blvd., MS 500
St. Paul, MN 55155
Local Road Research Board
Program Overview Established in 1959 through state legislation, the Local Road Research Board has brought important developments to transportation engineers throughout Minnesota. Those developments range from new ways to determine pavement strength to innovative methods for engaging the public. Today, LRRB remains true to its mission of supporting and sharing the latest transportation research applications with the state’s city and county engineers. These engineers, who best understand the problems and challenges in providing safe and efficient roadways, are responsible for city streets and county highways. The LRRB makes it easy for them to participate in setting the research agenda. Transportation practitioners from across Minnesota submit research ideas to the LRRB through MnDOT Research Services. The LRRB Board then selects and approves research proposals. MnDOT Research Services provides administrative support and technical assistance. Researchers from MnDOT, universities, and consulting firms conduct the research and the LRRB monitors the progress.
Board Members The Board consists of 10 members, including:
Four County Engineers
Two City Engineers
Three MnDOT representatives o State Aid Engineer o A representative from a MnDOT specialty office o Director of Research Services
One University of Minnesota Center for Transportation Studies representative
Committees
Research Implementation Committee
The LRRB works through its Research Implementation Committee to make research information available and to transfer research results into practical applications. The RIC uses a variety of methods to reach engineers and others with new developments, including presentations, videos, written reports, pamphlets, seminars, workshops, field demonstrations, web-based technology, and on-site visits. RIC members include:
Four County Engineers
Two City Engineers
MnDOT Deputy State Aid Engineer
A MnDOT District State Aid Engineer
A representative from MnDOT’s Research Services
66

State Aid for Local Transportation
395 John Ireland Blvd., MS 500
St. Paul, MN 55155
A representative from a MnDOT’s specialty office
A representative from University of Minnesota, Center for Transportation Studies. MnDOT Research Services provides support services, and at least one voting RIC member serves on the LRRB to ensure a strong link between the RIC and the LRRB.
Outreach Subcommittee
The Outreach Subcommittee was established by the LRRB to increase the awareness of LRRB functions and products within the transportation community. It meets as needed to review current LRRB marketing practices and public relations strategies.
Funding LRRB is funded from the County State Aid Highway and the Municipal State Aid Street accounts. Each year, the County and City Screening Boards recommend to the Commissioner a sum of money to be set aside from the CSAH and the MSAS funds. The table below shows the amount of funds allocated to the LRRB and number of research projects funded over the past five years.
2013 2014 2015 2016 2017
Amount Allocated
$3.1 $3.2 M $3.3 M $3.5 M $2.5 M
Number of New Projects
24 25 25 17 19
Total Number of Active Projects
n/a n/a n/a 74 72
For More Information The LRRB publishes an annual LRRB At-a-Glance Report. This is a summary of completed reports and active projects and describes its goals and resources.
http://www.dot.state.mn.us/research/documents/LRRB_At-A-Glance_2016_WEB.pdf Website: www.lrrb.org LRRB Board Chair: Lyndon Robjent
[email protected] Carver County Engineer
(952) 466-5200 Linda Taylor: MnDOT Research Services and Library Director
[email protected] (651) 366-3765
Revised: 2/2018
67

January 3, 2003
COUNTY HIGHWAY TURNBACK POLICY
Definitions:
County Highway – Either a County State Aid Highway or a County Road
County Highway Turnback- A CSAH or a County Road which has been released by the county and designated as an MSAS roadway. A designation request must be approved and a Commissioner’s Order written. A County Highway Turnback may be either County Road (CR) Turnback or a County State Aid (CSAH) Turnback. (See Minnesota Statute 162.09 Subdivision 1). A County Highway Turnback designation has to stay with the County Highway turned back and is not transferable to any other roadways. Basic Mileage- Total improved mileage of local streets, county roads and county road turnbacks. Frontage roads which are not designated trunk highway, trunk highway turnback or on the County State Aid Highway System shall be considered in the computation of the basic street mileage. A city is allowed to designate 20% of this mileage as MSAS. (See Screening Board Resolutions in the back of the most current booklet).
MILEAGE CONSIDERATIONS
County State Aid Highway Turnbacks
A CSAH Turnback is not included in a city’s basic mileage, which means it is not included in the computation for a city’s 20% allowable mileage. However, a city may draw Construction Needs and generate allocation on 100% of the length of the CSAH Turnback
County Road Turnbacks A County Road Turnback is included in a city’s basic mileage, so it is included in the computation for a city’s 20% allowable mileage. A city may also draw Construction Needs and generate allocation on 100% of the length of the County Road Turnback.
Jurisdictional Exchanges County Road for MSAS Only the extra mileage a city receives in an exchange between a County Road and an MSAS route will be considered as a County Road Turnback. If the mileage of a jurisdictional exchange is even, the County Road will not be considered as a County Road Turnback. If a city receives less mileage in a jurisdictional exchange, the County Road will not be considered as a County Road Turnback.
68

CSAH for MSAS Only the extra mileage a city receives in an exchange between a CSAH and an MSAS route will be considered as a CSAH Turnback. If the mileage of a jurisdictional exchange is even, the CSAH will not be considered as a CSAH Turnback. If a city receives less mileage in a jurisdictional exchange, the CSAH will not be considered as a CSAH Turnback NOTE: When a city receives less mileage in a CSAH exchange it will have less mileage to designate within its 20% mileage limitation and may have to revoke mileage the following year when it computes its allowable mileage. Explanation: After this exchange is completed, a city will have more CSAH mileage and less MSAS mileage than before the exchange. The new CSAH mileage was included in the city’s basic mileage when it was MSAS (before the exchange) but is not included when it is CSAH (after the exchange). So, after the jurisdictional exchange the city will have less basic mileage and 20% of that mileage will be a smaller number. If a city has more mileage designated than the new, lower 20% allowable mileage, the city will be over designated and be required to revoke some mileage. If a revocation is necessary, it will not have to be done until the following year after a city computes its new allowable mileage. MSAS designation on a County Road County Roads can be designated as MSAS. If a County Road which is designated as MSAS is turned back to the city, it will not be considered as County Road Turnback.
MISCELLANEOUS A CSAH which was previously designated as Trunk Highway turnback on the CSAH system and is turned back to the city will lose all status as a TH turnback and only be considered as CSAH Turnback. A city that had previously been over 5,000 population, lost its eligibility for an MSAS system and regained it shall revoke all streets designated as CSAH at the time of eligibility loss and consider them for MSAS designation. These roads will not be eligible for consideration as CSAH turnback designation. In a city that becomes eligible for MSAS designation for the first time all CSAH routes which serve only a municipal function and have both termini within or at the municipal boundary, should be revoked as CSAH and considered for MSAS designation. These roads will not be eligible for consideration as CSAH turnbacks. For MSAS purposes, a County or CSAH that has been released to a city cannot be local road for more than two years and still be considered a turnback.
N:\MSAS\Books\2012 October book\COUNTY HIGHWAY TURNBACK POLICY.docx
69

8/28/2014 1
MUNICIPAL STATE AID CONSTUCTION ACCOUNT
ADVANCE GUIDELINES
ADVANCE STATUS IS CURRENTLY CODE GREEN
State Aid Advances
M.S. 162.14, Subd 6 provides for municipalities to make advances from future year’s allocations
for the purpose of expediting construction. This process not only helps reduce the construction
cash balance, but also allows municipalities to fund projects that may have been delayed due to
funding shortages.
The formula used to determine if advances will be available is based on the current construction
cash balance, expenditures trends, repayments and the $20,000,000 recommended threshold in
MSAS construction. The threshold can be administratively adjusted by the Chief Financial
Officer and reported to the Screening Board at the next Screening Board meeting.
The process used for advancing is dependent on the code levels which are listed below. Code
levels for the current year can be obtained from the SAF website -
http://www.dot.state.mn.us/safinance/advances.html.
State Aid Advance Code Levels
Guidelines for advances are determined by the following codes.
General Guidelines for State Aid & Federal Aid Advance Construction
If a City requests an advance on future allotments they need to submit an Advance Resolution
authorizing the advance by the board. This will “earmark” the funding for that City, but it will
Code RED - SEVERE – Construction cash balance too low. NO MORE
ADVANCES - NO EXCEPTIONS
Code YELLOW - GUARDED – Construction cash balance low; balances
reviewed monthly. Advancing money may not meet the anticipated needs.
Priority system will be used. Resolution required. Reserve option is
available only prior to bid advertisement.
SEVERE
LOW Code GREEN - LOW – Construction cash balance at acceptable level to
approve anticipated advances. Advances approved on first-come, first-
serve basis while funds are available. Resolution required. High priority
projects are reserved; others optional.
GUARDED
70

8/28/2014 2
NOT hold the funds. Advanced funds will be paid out on a first come first serve basis as the
construction accounts are spent down to zero. The correct resolution must be used for each
advance type and there is a sample resolution for each on the State Aid Finance webpage.
Requests are good only for the year requested (cannot be summited for multiple years) and
void at 12/31 of that year.
Advances are not limited to the projects listed on the resolution. Project payments are processed
in the order received by SAF until the maximum advance amount is reached. Advances are
repaid from next year’s allocation until fully repaid.
Advance funding is not guaranteed. If the City finds they need a guarantee that the funds will be
held specifically for them they can submit a “Request to Reserve Funds” to ensure funds will be
available for their project. Once approved, a signed copy will be returned to the County.
Requests are good only for the year requested (cannot be summited for multiple years) and
void at 12/31 of that year.
Sample Advance Resolutions and a - Request to Reserve Funds can be obtained from SAF
website - http://www.dot.state.mn.us/safinance/formsandresolutions.html.
E-mail completed forms to Sandra Martinez in State Aid Finance and your DSAE for review.
Priority System
A Priority System will be required if the construction cash balances drop below an acceptable
level which is Code Yellow. This process starts in early October proceeding the advance year.
Each city will be required to submit projects to their DSAE for prioritization within the district.
The DSAE will submit the prioritized list to SALT for final prioritization.
Requests should include a negative impact statement if project had to be delayed or advance
funding was not available. In addition, include the significance of the project.
Priority projects include, but are not limited to projects where agreements have mandated the
city's participation, or projects with advanced federal aid. Small over-runs and funding shortfalls
may be funded, but require State Aid approval.
Advance Limitations
Statutory - None
Ref. M.S.162.14, Subd 6.
State Aid Rules - None
Ref. State Aid Rules 8820.1500, Subp 10& 10b.
State Aid Guidelines
Advance is limited to five times the municipalities’ last construction allotment or $4,000,000,
whichever is less. Advance amount will be reduced by any similar outstanding obligations
and/or bond principle payments due. The limit can be administratively adjusted by the Chief
Financial Officer.
71

8/28/2014 3
Limitation may be exceeded due to federal aid advance construction projects programmed by the
ATP in the STIP where State Aid funds are used in lieu of federal funds. Repayment will be
made at the time federal funds are converted. Should federal funds fail to be programmed, or the
project (or a portion of the project) be declared federally ineligible, the local agency is required to
pay back the advance under a payment plan mutually agreed to between State Aid and the
Municipality.
72

CURRENT RESOLUTIONS OF THE
MUNICIPAL SCREENING BOARD
October 2017
Bolded wording (except headings) are revisions since the last publication of the Resolutions
BE IT RESOLVED: ADMINISTRATION
Appointments to Screening Board - Oct. 1961 (Revised June 1981, May 2011)
The Commissioner of Mn/DOT will annually be requested to appoint three (3) new members, upon recommendation of the City Engineers Association of Minnesota, to serve three (3) year terms as voting members of the Municipal Screening Board. These appointees are selected from the MnDOT State Aid Districts as they exist in 2010, together with one representative from each of the four (4) cities of the first class.
Screening Board Chair, Vice Chair and Secretary- June 1987 (Revised June, 2002)
The Chair Vice Chair, and Secretary, nominated annually at the annual meeting of the City Engineers Association of Minnesota and subsequently appointed by the Commissioner of the Minnesota Department of Transportation will not have a vote in matters before the Screening Board unless they are also the duly appointed Screening Board Representative of a construction District or of a City of the first class.
Appointment to the Needs Study Subcommittee - June 1987 (Revised June 1993)
The Screening Board Chair will annually appoint one city engineer, who has served on the Screening Board, to serve a three year term on the Needs Study Subcommittee. The appointment will be made at the annual winter meeting of the City's Engineers Association. The appointed subcommittee person will serve as chair of the subcommittee in the third year of the appointment. Appointment to Unencumbered Construction Funds Subcommittee – (Revised June 1979, May 2014) The Screening Board past Chair will be appointed to serve a minimum three-year term on the Unencumbered Construction Fund Subcommittee. This appointment will continue to maintain an experienced group to follow a program of accomplishments. The most senior member will serve as chair of the subcommittee.
73

Appearance Screening Board - Oct. 1962 (Revised Oct. 1982)
Any individual or delegation having items of concern regarding the study of State Aid Needs or State Aid Apportionment amounts, and wishing to have consideration given to these items, will send such request in writing to the State Aid Engineer. The State Aid Engineer with concurrence of the Chair of the Screening Board will determine which requests are to be referred to the Screening Board for their consideration. This resolution does not abrogate the right of the Screening Board to call any person or persons before the Board for discussion purposes. Screening Board Meeting Dates and Locations - June 1996 The Screening Board Chair, with the assistance of the State Aid Engineer, will determine the dates and locations for Screening Board meetings. Research Account - Oct. 1961 An annual resolution be considered for setting aside up to ½ of 1% of the previous years’ Apportionment fund for the Research Account to continue municipal street research activity. Population Apportionment - October 1994, 1996 Beginning with calendar year 1996, the MSAS population apportionment will be determined using the latest available federal census or population estimates of the State Demographer and/or the Metropolitan Council. However, no population will be decreased below that of the latest available federal census, and no city will be dropped from the MSAS eligible list based on population estimates. Improper Needs Report - Oct. 1961
The State Aid Engineer and the District State Aid Engineer (DSAE) are requested to recommend an adjustment of the Needs reporting whenever there is a reason to believe that said reports have deviated from accepted standards and to submit their recommendations to the Screening Board, with a copy to the municipality involved, or its engineer.
New Cities Needs - Oct. 1983 (Revised June 2005, May 2014) Any new city having determined its eligible mileage, but has not submitted its Needs to the DSAE by December 1, will have its Needs based upon zero ADT assigned to the eligible mileage until the DSAE approves the traffic counts. Certified Complete Cities – May 2014 (Revised October 2014) State Aid Operational Rule 8820.18 subp.2 allows cities to spend the population based portion of their Construction Allotment on non MSAS city streets if its MSAS system has been Certified Complete. At the city’s request, the District State Aid Engineer will review the MSAS system in that city and if the system has been completely built, may certify it complete for a period of two years. The same proportion of a city’s total allocation based on population will be used to compute the population portion of its Construction Allotment.
74

If a payment request for a project on the MSAS system is greater than the amount available in the Needs based account, the remainder will come from the population based account, thereby reducing the amount available for non MSAS city streets. A city may carry over any remaining amount in its population based account from year to year. However if a payment request for a project on a non MSAS city street is greater than the amount available in the population based account, the population based account will be reduced to zero and the city will be responsible for the remaining amount. Construction Needs Components – May 2014 For Construction Needs purposes, all roadways on the MSAS system will be considered as being built to Urban standards. All segments on the MSAS system will generate continuous Construction Needs on the following items: Excavation/Grading Gravel Base Bituminous Curb and Gutter Construction Sidewalk Construction Storm Sewer Construction Street Lighting Traffic Signals Engineering Structures Unit Price Study- Oct. 2006 (Revised May, 2014) The Needs Study Subcommittee will annually review the Unit Prices for the Needs components used in the Needs Study. The Subcommittee will make its recommendation to the Municipal Screening board at its annual spring meeting. The Unit Price Study go to a 3 year (or triennial) cycle with the Unit Prices for the two ‘off years’ to be set using the Engineering News Record construction cost index on all items where a Unit Price is not estimated and provided by other MnDOT offices. The Screening Board may request a Unit Price Study on individual items in the ‘off years’ if it is deemed necessary. Unit Costs – May 2014, (Revised January 2015, May 2015) The quantities which the Unit Costs for Excavation/Grading, Gravel Base, and Bituminous are based upon will be determined by using the roadway cross sections and structural sections in each of the ADT groups as determined by the Municipal Screening Board and shown in the following table ‘MSAS Urban ADT Groups for Needs Purposes’.
75

26 FOOT
ROADBED
WIDTH 2,917
2‐ 11' TRAFFIC LANES0 PARKING LANES
2‐ 2' CURB REACTION
28' FOOT
ROADBED
WIDTH 3,182
2‐ 12' TRAFFIC LANES0 PARKING LANES
2‐ 2' CURB REACTION
34 FOOT
ROADBED
WIDTH 3,978
2‐ 12' TRAFFIC LANES1‐ 8' PARKING LANE1‐ 2' CURB REACTION
40 FOOT
ROADBED
WIDTH 4,773
2‐12' TRAFFIC LANES2‐ 8' PARKING LANE
48 FOOT
ROADBED
WIDTH 5,834
4‐11' TRAFFIC LANES2‐ 2' CURB REACTION
54 FOOT
ROADBED
WIDTH 8,287
4‐11' TRAFFIC LANES1‐ 8' PARKING LANE1‐ 2' CURB REACTION
62 FOOT
ROADBED
WIDTH 11,535
4‐11' TRAFFIC LANES1‐ 14' CENTER TURN2‐ 2' CURB REACTION
70 FOOT
ROADBED
WIDTH 13,126
6‐11' TRAFFIC LANES0 PARKING LANES
2‐ 2' CURB REACTION
4,346
4 INCHES
CLASS 5
GRAVEL BASE
DEPTH (inches)
CLASS 5 GRAVEL
BASE QUANTITY
(Tons)
TOTAL
BITUMINOUS
QUANTITY (TONS)
GT 25,000
EXISTING ADT39 INCHES 53,172 21 INCHES 44,776
6 INCHES
5 INCHES
38 INCHES 45,838 20 INCHES 38,049
9000‐13,999
EXISTING ADT36 INCHES 37,918 19 INCHES
14,000‐24,999
EXISTING ADT
6 INCHES
4 INCHES
5000‐8999
EXISTING ADT35 INCHES 32,795 19 INCHES 27,907
4 INCHES
2000‐4999
EXISTING ADT32 INCHES 25,188 16 INCHES 19,628
31,460
500‐1999
EXISTING ADT26 INCHES 17,698 10 INCHES 10,176
4 INCHES
1‐499 EXISTING
ADT22 INCHES 12,496 6 INCHES 4,691
4 INCHES
MSAS URBAN ADT GROUPS FOR NEEDS PURPOSESQuantities Based on a One Mile Section
0 EXISTING ADT
& NON EXISTING22 INCHES 11,655 6 INCHES
EXISTING ADT NEEDS
WIDTH
NEEDS GENERATION
DATA
GRADING
DEPTH
(inches)
GRADING
QUANTITY
(cubic yards)
76

The quantity used for Curb and Gutter Construction will be determined by multiplying the segment length times two if it is an undivided roadway and by four if it is divided. This quantity will then be multiplied by the Municipal Screening Board approved Unit Price to determine the Curb and Gutter Construction Needs. The quantity used for Sidewalk Construction will be determined by multiplying the segment length times 26,400 (a five foot wide sidewalk on one side of a mile of roadway) in the lower two ADT groups (less than 500 ADT) and by 52,800 (two five foot wide sidewalks on a mile of roadway) in the upper ADT groups. This quantity will then be multiplied by the Municipal Screening Board approved Unit Price to determine the Sidewalk Construction Needs. The Unit Cost per mile of Storm Sewer for the highest MSAS Urban ADT Group for Needs Purposes will be based on the average costs of all Storm Sewer Construction on the MSAS system in the previous year. To determine the Unit Cost for the highest ADT Group, average costs for Complete Storm Sewer projects and Partial Storm Sewer projects will be provided to State Aid by the MnDOT Hydraulics Office and then added together and divided by two to calculate a statewide average Unit Cost for all Storm Sewer Construction. The Unit Cost per mile for Storm Sewer Construction will be calculated for the highest MSAS Urban ADT Group and be prorated downward for the other ADT Groups. This proration has been determined based upon an engineering study requested by the Municipal Screening Board in 2011 and will be the basis for the Needs calculations. The Unit Cost for Street Lighting will be determined by multiplying the Unit Price per mile by the segment length. This Unit Cost will remain at $100,000 per mile. The Municipal Screening Board may request a study on this item on any year if it is deemed necessary. The Unit Cost for Traffic Signals will be determined by the recommendation by the SALT Program Support Engineer and approved by the MSB. The Unit Cost for traffic signals will be based on a cost per signal leg, and for Needs purposes a signal leg will be defined as ¼ of the signal cost. Only signal legs on designated MSAS routes will be included in the Needs study. Stand-alone pedestrian crossing signals will not be included in the Needs study. The area in square feet used for Structure Needs (Bridges and Box Culverts) will be determined by multiplying the centerline length of the bridge, or the culvert width of the box culvert, times the Needs Width from the appropriate MSAS Urban ADT Group. This quantity will then be multiplied by the Municipal Screening Board Unit Price to determine the Structure Needs. The Unit Price for Structures will be determined by using one-half of the approved unit cost provided by the MnDOT State Aid Bridge Office. The Unit Cost for Engineering will be determined by adding together all other Unit Costs and multiplying them by the MSB approved percentage. The result is added to the other Unit Costs.
77

Mileage - Feb. 1959 (Revised Oct. 1994. 1998)
The maximum mileage for Municipal State Aid Street designation will be 20 percent of the municipality's basic mileage - which is comprised of the total improved mileage of local streets, county roads and county road turnbacks.
Nov. 1965 – (Revised 1969, October 1993, October 1994, June 1996, October 1998, May 2014)
Needs ItemGrading (Excavation) Cu. Yd. $7.65 $7.95 $7.95Aggregate Base Ton 14.30 14.90 14.90All Bituminous Ton 66.80 69.60 69.60
Sidewalk Construction Sq. Ft. 4.35 4.75 4.75Curb and Gutter Construction Lin.Ft. 14.00 14.55 14.55
Traffic Signals Per Sig 188,700 195,000 195,000Street Lighting Mile 100,000 100,000 100,000Engineering Percent 22 22 22
All Structures (includes both bridges and box culverts)Sq. Ft. 120.00 90.00 90.00
Storm Sewer (based on ADT) Per Mile 0 ADT & Non Existing 153,600 156,500 156,500 1-499 156,500 159,500 159,500 500-1,999 165,300 168,400 168,400 2,000-4,999 174,000 177,300 177,300 5,000-8,999 185,700 189,200 189,200 9,000-13,999 194,500 198,100 198,100 14,000-24,999 206,100 210,000 210,000 25,000 and over 217,800 221,900 221,900
Municipal Screening Board Approved Prices
for the 2017 Distribution
2017 UNIT PRICE RECOMMENDATIONSfor the January 2018 distribution
Needs Study Subcommittee Recommended Prices for 2018
Distribution
Municipal Screening Board Approved Prices
for the 2018 Distribution
78

That the maximum mileage for State Aid designation may be exceeded to designate trunk highway turnbacks released to the Municipality after July 1, 1965. The maximum mileage for State Aid designation may also be exceeded to designate both County Road and County State Aid Highways released to the Municipality after May 11th, 1994. Nov. 1965 (Revised 1972, Oct. 1993, 1995, 1998) The maximum mileage for Municipal State Aid Street designation will be based on the Annual Certification of Mileage current as of December 31st of the preceding year. Submittal of a supplementary certification during the year will not be permitted. Frontage roads not designated Trunk Highway, Trunk Highway Turnback or County State Aid Highways will be considered in the computation of the basic street mileage. The total mileage of local streets, county roads and county road turnbacks on corporate limits will be included in the municipality's basic street mileage. Any State Aid Street that is on the boundary of two adjoining urban municipalities will be considered as one-half mileage for each municipality. All mileage on the MSAS system will accrue Needs in accordance with current rules and resolutions. Oct. 1961 (Revised May 1980, Oct. 1982, Oct. 1983, June 1993, June 2003) All requests for revisions to the Municipal State Aid System must be received by the District State Aid Engineer by March first to be included in that years Needs Study. If a system revision has been requested, a City Council resolution approving the system revisions and the Needs Study reporting data must be received by May first, to be included in the current year's Needs Study. If no system revisions are requested, the District State Aid Engineer must receive the Normal Needs Updates by March 31st to be included in that years’ Needs Study. One Way Street Mileage - June 1983 (Revised Oct. 1984, Oct. 1993, June 1994, Oct. 1997) Any one-way streets added to the Municipal State Aid Street system must be reviewed by the Needs Study Sub-Committee, and approved by the Screening Board before any one-way street can be treated as one-half mileage in the Needs Study. All Municipal Screening Board approved one-way streets be treated as one-half of the mileage and allow one-half complete Needs. When Trunk Highway or County Highway Turnback is used as part of a one-way pair, mileage for certification shall only be included as Trunk Highway or County Turnback mileage and not as approved one-way mileage. Needs Adjustments Phase In (Restriction) May 2014 The method of computing Needs is to be phased in over a period of seven years. This seven year period will begin with the January 2015 allocation and go through the January 2021 allocation. The phase in will be reviewed annually by the Municipal Screening Board to determine if the Phase In period should be revised. During the seven year period the phase in is being applied, a city’s Restricted Needs will be computed using the following steps:
79

1) Compare the current years Unadjusted Needs to the previous years Restricted Needs. In the first year of the phase in, the current years Unadjusted Needs will be compared to the previous years Unadjusted Needs.
2) Compute the Statewide Average Percent of Change between the two totals. 3) Determine each individual city’s Percent of Change between last years Restricted Needs 4) and this years Unadjusted Needs. 5) If an individual city’s Percent of Change is greater than 5 Percentage Points less than the
Statewide Average Percent of Change, increase this year’s Unadjusted Needs to 5 Percentage Points less than the Statewide Average Percent of Change.
6) If an individual city’s Percent of Change is greater than 10 Percentage Points more than the Statewide Average Percent of Change, decrease this year’s Unadjusted Needs to 10 Percentage Points more than the Statewide Average Percent of Change.
7) If an individual city’s Percent of Change is between 5 Percentage Points less and 10 Percentage Points more than the Statewide Average Percent of Change, no restriction is made and the current year’s Unadjusted Needs will be used as its Restricted Needs.
All Needs adjustments will be applied to the city’s Restricted Needs. In the event that an MSAS route earning “After the Fact” Needs is removed from the MSAS system, the “After the Fact” Needs will then be removed from the Needs Study, except if transferred to another state system. No adjustment will be required on Needs earned prior to the revocation. Excess Unencumbered Construction Fund Balance Adjustment – Oct. 2002, (Revised Jan. 2010, May 2014) State Aid Payment Requests received before December 1st by the District State Aid Engineer for payment will be considered as being encumbered and the construction balances will be so adjusted. The December 31 construction fund balance will be compared to the annual construction allotment from January of the same year. If the December 31 construction fund balance exceeds 3 times the January construction allotment and $1,500,000, the negative adjustment to the Needs will be 1 times the December 31 construction fund balance. In each consecutive year the December 31 construction fund balance exceeds 3 times the January construction allotment and $1,500,000, the negative adjustment to the Needs will be increased to 2, 3, 4, etc. times the December 31 construction fund balance until such time the Construction Needs are adjusted to zero. If the December 31 construction fund balance drops below 3 times the January construction allotment and subsequently increases to over 3 times, the multipliers will start over with one. Low Balance Incentive – Oct. 2003 (Revised May, 2014) The amount of the Excess Unencumbered Construction Fund Balance Adjustment will be redistributed as a positive adjustment to the Construction Needs of all municipalities whose December 31st construction fund balance is less than 1 times their January construction allotment of the same year. This redistribution will be based on a city’s prorated share of its Unadjusted Construction Needs to the total Unadjusted Construction Needs of all participating
80

cities times the total Excess Balance Adjustment. After the Fact Right of Way Adjustment - Oct. 1965 (Revised June 1986, 2000, May 2014) Right of Way Needs will not be included in the Needs calculations until the right of way is acquired and the actual cost established. At that time a Construction Needs adjustment will be made by annually adding the local cost (which is the total cost less county or trunk highway participation) for a 15-year period. Only right of way acquisition costs that are eligible for State-Aid funding will be included in the right-of-way Construction Needs adjustment. This Directive is to exclude all Federal or State grants. When "After the Fact" Needs are requested for right-of-way projects that have been funded with local funds, but qualify for State Aid reimbursement, documentation (copies of warrants and description of acquisition) must be submitted to the District State Aid Engineer. The City Engineer will input the data into the Needs Update program and the data will be approved by the DSAE.
After the Fact Railroad Bridge over MSAS Route Adjustment – May 2014
RR Bridge over MSAS Route Rehabilitation Any structure that has been rehabilitated (Minnesota Administrative Rules, CHAPTER 8820, 8820.0200 DEFINITIONS, Subp. 8. Bridge rehabilitation) will not be included in the Needs calculations until the rehabilitation project has been completed and the actual cost established. At that time a Construction Needs adjustment will be made by annually adding the local cost (which is the total cost less county or trunk highway participation) for a 15-year period. Only State Aid eligible items are allowed to be included in this adjustment and all structure rehabilitation Needs adjustments must be input by the city and approved by the DSAE. RR Bridge over MSAS Route Construction/Reconstruction Any structure that has been constructed/reconstructed (Minnesota Administrative Rules, CHAPTER 8820, 8820.0200 DEFINITIONS, Subp. 31. Reconstruction) will not be included in the Needs calculations until the project has been completed and the actual cost established. At that time a Construction Needs adjustment will be made by annually adding the local cost (which is the total cost less county or trunk highway participation) for a 35-year period. Only State Aid eligible items are allowed to be included in this adjustment and all structure construction/reconstruction Needs adjustments must be input by the city and approved by the District State Aid Engineer.
After the Fact Railroad Crossing Adjustment
Any Railroad Crossing improvements will not be included in the Needs Calculations until the project has been completed and the actual cost established. At that time a Construction Needs adjustment will be made by annually adding the local cost (which is the total cost less county or trunk highway participation) to the annual Construction Needs for a 15 year period. Only State Aid eligible items are allowed to be included in this adjustment, and all Railroad Crossing Needs adjustments must be input by the city and approved by the District State Aid Engineer.
81

Excess Maintenance Account – June 2006 Any city which requests an annual Maintenance Allocation of more than 35% of their Total Allocation, is granted a variance by the Variance Committee, and subsequently receives the increased Maintenance Allocation will receive a negative Needs adjustment equal to the amount of money over and above the 35% amount transferred from the city’s Construction Account to its Maintenance Account. The Needs adjustment will be calculated for an accumulative period of twenty years, and applied as a single one-year (one time) deduction each year the city receives the maintenance allocation. After the Fact Retaining Wall Adjustment Oct. 2006 (Revised May 2014) Retaining wall Needs will not be included in the Needs study until such time that the retaining wall has been constructed and the actual cost established. At that time a Needs adjustment will be made by annually adding the local cost (which is the total cost less county or trunk highway participation) for a 15 year period. Documentation of the construction of the retaining wall, including eligible costs, must be submitted to your District State Aid Engineer by July 1 to be included in that years Needs study. After the Fact needs on retaining walls will begin effective for all projects awarded after January 1, 2006. All Retaining Wall adjustments must be input by the city and approved by the District State Aid Engineer. Trunk Highway Turnback - Oct. 1967 (Revised June 1989, May 2014) Any trunk highway turnback which reverts directly to the municipality and becomes part of the Municipal State Aid Street system will not have its Construction Needs considered in the Construction Needs apportionment determination as long as the former trunk highway is fully eligible for 100 percent construction payment from the Municipal Turnback Account. During this time of eligibility, financial aid for the additional maintenance obligation, to the municipality imposed by the turnback will be computed on the basis of the current year's apportionment data and will be accomplished in the following manner. The initial turnback maintenance adjustment when for less than 12 full months will provide partial maintenance cost reimbursement by adding said initial adjustment to the Construction Needs which will produce approximately 1/12 of $7,200 per mile in apportionment funds for each month or part of a month that the municipality had maintenance responsibility during the initial year. To provide an advance payment for the coming year's additional maintenance obligation, a Needs adjustment per mile will be added to the annual Construction Needs. This Needs adjustment per mile will produce sufficient apportionment funds so that at least $7,200 in apportionment will be earned for each mile of trunk highway turnback on Municipal State Aid Street System. Trunk Highway Turnback adjustments will terminate at the end of the calendar year during which a construction contract has been awarded that fulfills the Municipal Turnback Account Payment provisions.
82

TRAFFIC - June 1971 (Revised May 2014) Beginning in 1965 and for all future Municipal State Aid Street Needs Studies, the Needs Study procedure will utilize traffic data developed according the Traffic Forecasting and Analysis web site at http://www.dot.state.mn.us/traffic/data/coll-methods.html#TCS Traffic Counting - Sept. 1973 (Revised June 1987, 1997, 1999, Oct. 2014) Traffic data for State Aid Needs Studies will be developed as follows:
1) The municipalities in the metropolitan area cooperate with the State by agreeing to participate in counting traffic every two or four years at the discretion of the city.
2) The cities in the outstate area may have their traffic counted and maps prepared by State forces every four years, or may elect to continue the present procedure of taking their own counts and have state forces prepare the maps.
3) Any city may count traffic with their own forces every two years at their discretion and expense, unless the municipality has made arrangements with the Mn/DOT district to do the count.
4) On new MSAS routes, the ADT will be determined by the City with the concurrence of the District State Aid Engineer until such time the roadway is counted in the standard MnDOT count rotation.
83