2017 shareholders report nws louisville - weather.gov credits slide or mention slidescarnival and...
TRANSCRIPT

SHAREHOLDERS REPORT
National Weather Service, Louisville
Photo by Janet McLanahan in Scott County, Kentucky
2017

CONTENTS
THIS IS YOUR CONTENTS TITLE
Welcome 2
Kentucky Emergency
Management Boot Camp
3
Decision Support Services
4
Silver Anchor Award
5
New Airport Forecast Point
6
Weather Simulator 7-8
Weather Ready Nation
9
New Satellite 10-11
Retirements 12
Historic Tornadoes 13-14
Flash Flood Emergency
15
2017 Climate 16

INSTRUCTIONS FOR USE
EDIT IN GOOGLE SLIDES
Click on the button under the presentation preview that says "Use as Google Slides Theme".
You will get a copy of this document on your Google Drive and will be able to edit, add or delete slides.
You have to be signed in to your Google account.
EDIT IN POWERPOINT®
Click on the button under the presentation preview that says "Download as PowerPoint template". You will get a .pptx file that you can edit in PowerPoint.
Remember to download and install the fonts used in this presentation (you’ll find the links to the font files needed in the Presentation design slide)
More info on how to use this template at www.slidescarnival.com/help-use-presentation-template
This template is free to use under Creative Commons Attribution license. You can keep the Credits slide or mention SlidesCarnival and other resources used in a slide footer.
From the Meteorologist-in-Charge
WELCOME Welcome to the 13th edition of National Weather Service (NWS) Louisville’s Shareholders Report. As I say every year, you are a shareholder in the NWS! This report details our activities and events in this office’s 59 county warning area of responsibility across southern Indiana and central Kentucky during 2017. From our perspective, 2017 will be remembered for a very warm winter, providing more decision support to our partners (page 3), media training on our weather simulator (page 8), and a large number of staff retirements (page 12) . Early in 2017 we were fortunate to hire forecasters Evan Webb, raised in Hodgenville, KY, and Dan McKemy, who came to us from NWS Rapid City. Evan is taking over much of the GIS mapping that Hydrologist Mike Callahan led, and Dan is leading our efforts to improve our weather simulator both here and across the NWS.
Top Priorities for 2018
• Hiring three new meteorologists • Increasing Impact-Based Decision Support Services • Improving all facets of Tornado Warnings • Comprehensive flooding analysis • Recruit engineers for storm damage surveys
I hope you find that our activities demonstrate the sort of stewardship you expect from your public servants. The NWS was appropriated about $1 billion for Fiscal Year 2017, which was an investment of only $3.46 per American. As the leader of NWS Louisville, I feel it is my duty to report to you how your holdings have fared. I am grateful to Lead Forecaster and Shareholders Report Editor Tom Reaugh for assembling another excellent report, and Science and Operations Officer Ted Funk for his thorough review of the document. I welcome your suggestions on how the NWS can be an even better investment for you.
John Gordon, Meteorologist-in-Charge
2

HELLO!
I am Jayden Smith
I am here because I love to give presentations. You can find me at @username
As part of the NWS’s Impact-Based Decision Support Services (IDSS) and Weather-Ready Nation initiatives, NWS Louisville conducted an IDSS “Boot Camp” exercise at the Kentucky Emergency Operations Center (EOC) in Frankfort on August 8 and 10. Meteorologists responsible for forecasting Kentucky’s weather from NWS offices in Louisville, Jackson, Wilmington, OH, and Charleston, WV participated. Facilitators, instructors, and evaluators included several Kentucky emergency managers in addition to personnel from NWS Louisville, our regional headquarters, NWS Training Center in Kansas City, and Kentucky State EOC.
KY Emergency Management
BOOT CAMP
On each of the two days, 16 participants, separated into two-person teams, were involved in a full day of instruction that included orientation, event simulation exercises, and evaluator feedback. Highlights of the simulation included two stand-up briefings delivered by the teams to emergency management, impromptu on-the-spot interviews with actors portraying politicians and the media, and various surprises such as a hazardous materials train derailment during a severe weather outbreak.
Participant feedback revealed that valuable experience was gained, and that this realistic exercise will definitely help in future IDSS situations for our partners and the public.
3 Toby TenHarmsel, Information Technology Officer
NWS employees and emergency services personnel gathered in Frankfort to practice severe weather scenarios.

Place your screenshot here
ANDROID PROJECT
Show and explain your web, app or software projects using these gadget templates.
DSS NWS Louisville provided partners remote and on-site support for public safety at major events. Forecasters were embedded in Emergency Operation Centers for Thunder Over Louisville and the Kentucky Oaks and Derby. Off-site support was provided for other events including the Battle of Perryville Commemoration in October.
For Thunder Over Louisville a dreary start to the day limited spectator numbers. However, NWS forecasts and on-site briefings allowed the air show boss to adjust the schedule so that most of the crews could perform their routines later in the day when conditions would improve.
On Derby Day forecasters provided roughly an hour advance notice of when showers with the potential for lightning and gusty winds would affect Churchill Downs. Showers skirted the area before intensifying just beyond the track, and fortunately no evacuations were needed.
Decision Support Services
During the Battle of Perryville, reenactment phone briefings were provided to Boyle County Emergency Management concerning a chance for thunderstorms on the final day of the event.
Lead Forecaster Andrea Schoettmer briefing Mayor Greg Fischer on when showers would exit the area before Thunder Over Louisville. Photo courtesy Office of the Mayor of Louisville
4
Decision Support Services
Ron Steve, Lead Forecaster

“ “(NWS Louisville is) recognized for outstanding commitment to the safety of patrons at Waterfront Park events. Over the years, the NWS team in Louisville has gone above and beyond to support the Waterfront Development Corporation…with advice and insight which has ensured the safety of hundreds of thousands of patrons. NWS has guided WDC through dozens of serious situations over the years. NWS support has helped WDC staff to evacuate when necessary (and with great precision), and has provided confidence to proceed with events whenever possible.” --- Waterfront Development Corporation
AWARD Silver Anchor
NWS Louisville was presented with a 2017 Silver Anchor Award by Louisville’s Friends of the Waterfront during a September 14 reception. Warning Coordination Meteorologist Joe Sullivan and Forecaster Erin Rau (pictured right) represented the staff at the ceremony held on the Belle of Louisville.
Ashley Smith of the Waterfront Development Corporation (WDC) presented the award and recalled numerous times NWS Louisville provided critical assistance regarding timing and intensity of thunderstorms affecting the downtown waterfront. In particular, she noted the partnership during the free summer concerts that drew tens of thousands of patrons to the riverfront parks. NWS Louisville’s on-site support of Thunder Over Louisville was also greatly appreciated. The annual air show and fireworks display drew over 600,000 people to kick off the Kentucky Derby Festival in April.
5 Erin Rau, Forecaster
THIS IS A SLIDE TITLE
▸ Here you have a list of items ▸ And some text ▸ But remember not to overload
your slides with content
Your audience will listen to you or read the content, but won’t do both.
AVIATION FORECAST Huntingburg Regional Airport
Airports have a large economic impact on a city, region, and state. Whether it’s the increased efficiency of hauling cargo, the transport of important business personnel, or the promotion of local tourism, an airport makes a significant contribution. Since the protection and growth of commerce is part of the NWS core mission, aviation forecasting is a big part of what we do.
The Huntingburg, IN airport is one of the most economically impactful airports in the state. With plans for future runway expansion, this airport’s impact will very likely continue to grow.
On August 31, NWS Louisville issued its first Terminal Aerodrome Forecast (TAF) for Huntingburg Regional Airport (HNB). It joined Louisville International, Lexington’s Blue Grass, and Bowling Green-Warren County Regional as a fourth aviation forecast point in the area. Huntingburg’s airport will now receive four routine forecasts every day, along with amendments when the weather is rapidly changing. Forecasts of sky cover, cloud height, winds, visibility, and precipitation will improve aviation safety and flight efficiency.
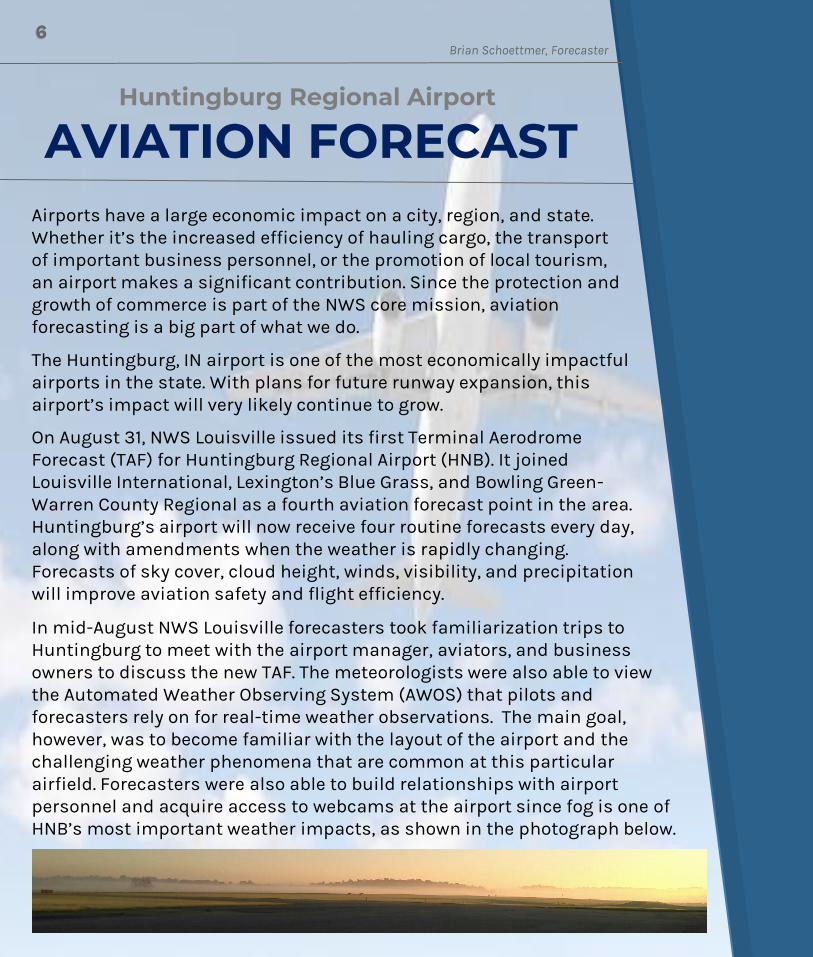
In mid-August NWS Louisville forecasters took familiarization trips to Huntingburg to meet with the airport manager, aviators, and business owners to discuss the new TAF. The meteorologists were also able to view the Automated Weather Observing System (AWOS) that pilots and forecasters rely on for real-time weather observations. The main goal, however, was to become familiar with the layout of the airport and the challenging weather phenomena that are common at this particular airfield. Forecasters were also able to build relationships with airport personnel and acquire access to webcams at the airport since fog is one of HNB’s most important weather impacts, as shown in the photograph below.
6 Brian Schoettmer, Forecaster
White
Is the color of milk and fresh snow, the color produced by the combination of all the colors of the visible spectrum.
YOU CAN ALSO SPLIT YOUR CONTENT
Black
Is the color of coal, ebony, and of outer space. It is the darkest color, the result of the absence of or complete absorption of light.
WES Weather Event Simulator
Simulators are very useful to mimic scenarios that might occur in real-time.
For example, pilots use them periodically to simulate various emergency
situations so they will be more proficient if an actual issue happens while
on a flight. At NWS Louisville we do likewise by using our Weather Event
Simulator (WES) to assess and learn from past significant severe and winter
weather events. The WES is a tremendous post-storm data assessment and
training tool, helping to keep meteorologists sharp in their interpretation
and warning skills. Training can be conducted in a group session or one-on-
one between a training facilitator and trainee.
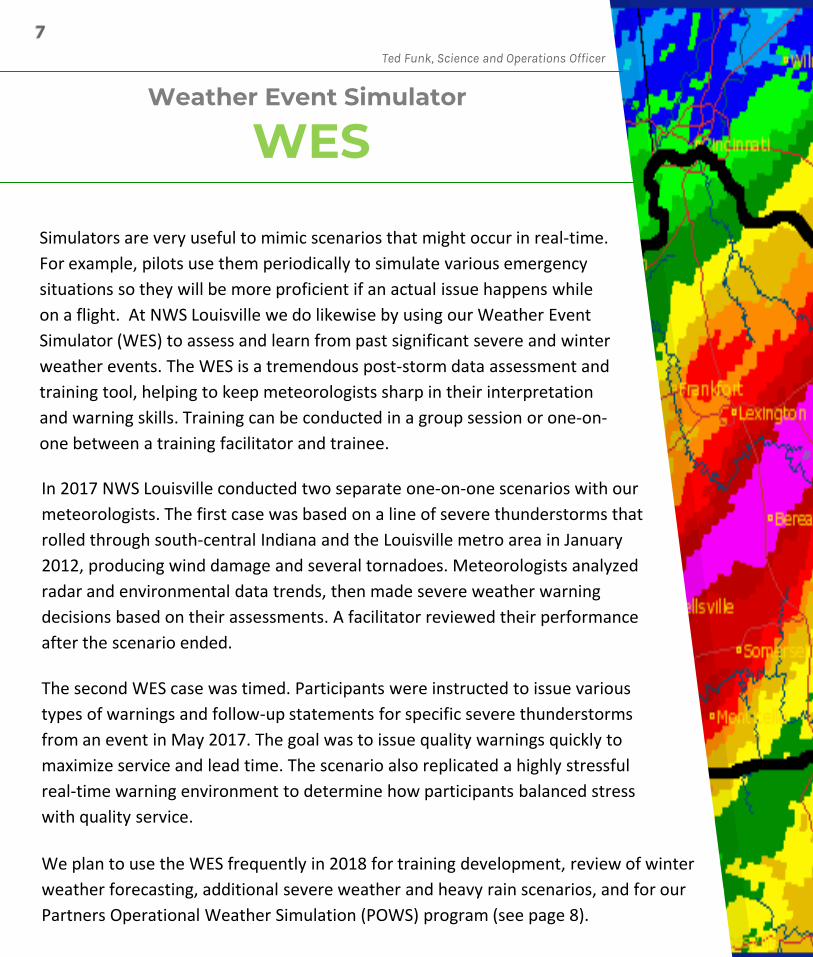
In 2017 NWS Louisville conducted two separate one-on-one scenarios with our
meteorologists. The first case was based on a line of severe thunderstorms that
rolled through south-central Indiana and the Louisville metro area in January
2012, producing wind damage and several tornadoes. Meteorologists analyzed
radar and environmental data trends, then made severe weather warning
decisions based on their assessments. A facilitator reviewed their performance
after the scenario ended.
The second WES case was timed. Participants were instructed to issue various
types of warnings and follow-up statements for specific severe thunderstorms
from an event in May 2017. The goal was to issue quality warnings quickly to
maximize service and lead time. The scenario also replicated a highly stressful
real-time warning environment to determine how participants balanced stress
with quality service.
We plan to use the WES frequently in 2018 for training development, review of winter
weather forecasting, additional severe weather and heavy rain scenarios, and for our
Partners Operational Weather Simulation (POWS) program (see page 8).
7 Ted Funk, Science and Operations Officer
BIG CONCEPT
Bring the attention of your audience over a key concept using icons or illustrations
POWS Partners Operational Weather Simulation
NWS Louisville’s Partners Operational Weather Simulation (POWS) program is a collaborative effort through which NWS partners participate in severe thunderstorm analysis using our Weather Event Simulator (WES). The program initially targeted broadcast TV meteorologists in and close to our forecast area, and so far 13 have participated. Future participants may include private meteorologists, university faculty, personnel from the U.S. Army Corps of Engineers, and emergency managers.
The program provides training on severe storm structure and evolution, showcases the complexity of the NWS warning decision thought process, and allows partners to experience firsthand the strategies employed by radar analysts. However, perhaps most importantly, POWS enhances professional relationships and teamwork via one-to-one interaction which facilitates a consistent message of awareness, safety, and response for the public.
Participants assess NWS Doppler radar trends, environmental weather data, and damage reports, then use the WES to issue Severe Thunderstorm Warnings and Tornado Warnings as needed in displaced real-time. An NWS trainer discusses their actions and verification at the end of the simulation.
I already had a lot of respect for what you guys do, but this gives me a greater sense of appreciation. Other TV meteorologists need to do this.
T. G. Shuck, WHAS
8
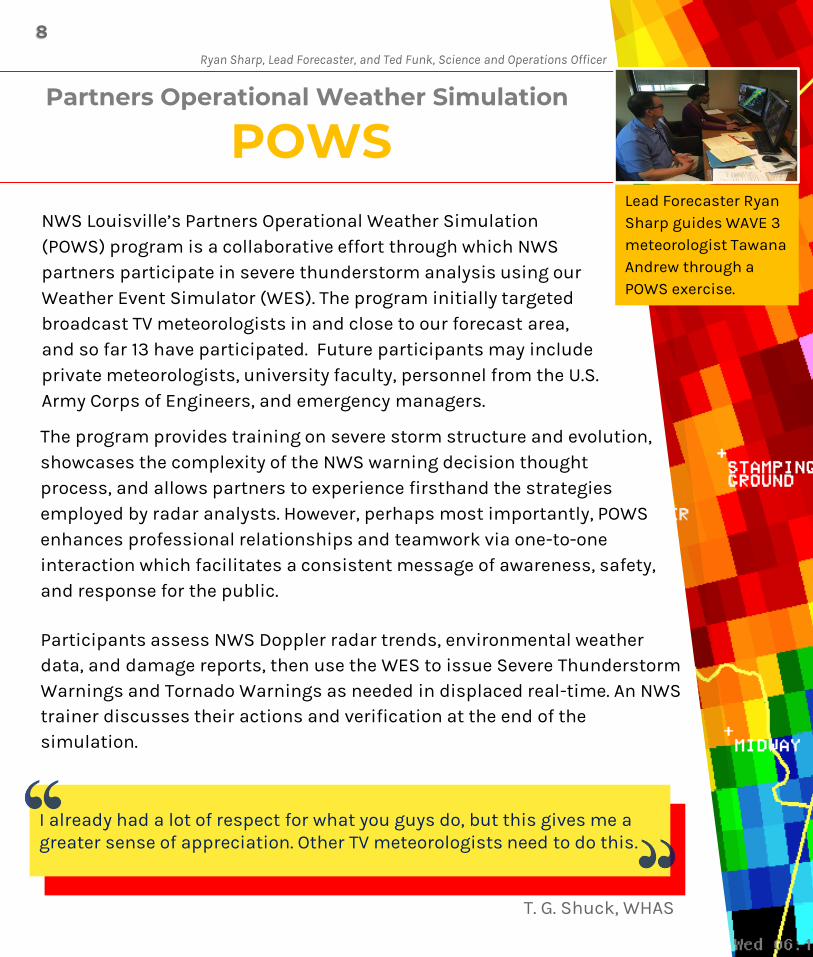
Lead Forecaster Ryan Sharp guides WAVE 3 meteorologist Tawana Andrew through a POWS exercise.
Ryan Sharp, Lead Forecaster, and Ted Funk, Science and Operations Officer
IN TWO OR THREE COLUMNS
Yellow
Is the color of gold, butter and ripe lemons. In the spectrum of visible light, yellow is found between green and orange.
Blue
Is the colour of the clear sky and the deep sea. It is located between violet and green on the optical spectrum.
Red
Is the color of blood, and because of this it has historically been associated with sacrifice, danger and courage.
AMBASSADORS Weather-Ready Nation
One accepted definition of the word ambassador is “an authorized messenger or representative.” In recent efforts to promote a more Weather-Ready Nation (WRN), the NWS has recognized and recruited many ambassadors who help us promote weather preparedness and safety on a regular basis. We are looking for organizations and businesses to carry our messages to a broader audience. Trust between our partners and ourselves has been built over many years of closely working together based on mutual interest in weather, preparedness, and safety. Emergency management, first responders, the media, and school systems are some of the many types of ambassadors we are looking for.
Since 2014 NWS Louisville has recruited 107 Weather-Ready Nation Ambassadors. Once approved, they enjoy specialized tours of our office, webinars on a wide range of topics, detailed briefings during impactful weather, and other perks. We led four specialized tours in 2017. We’ve learned that very productive conversations result from bringing folks with multiple backgrounds together in the same room.
Ambassadors are encouraged to spread weather-related messages, tweets, and graphics to their families, friends, associates, and customers to broaden the reach of important information. Future plans to keep our partners active include an Ambassador Appreciation Day, Ambassador of the Year, promotion of success stories, and a regional Ambassador Conference.
Contact NWS Louisville at [email protected] if you would like to become a Weather-Ready Nation Ambassador.
9 Brian Schoettmer, Forecaster

89,526,124
Whoa! That’s a big number, aren’t you proud?
Amazing New
WEATHER SATELLITE The new Geostationary Operational Environmental Satellite (GOES), called GOES-East, has become operational. Satellite imagery comes in much faster now, within a minute of the image being taken, compared to a 15-45 minute lag time with previous satellites. We can now see the billowing tops of severe thunderstorms on a similar time scale as our radar imagery. The improved resolution and timeliness will lead to better understanding of atmospheric processes and quicker, more accurate warnings and forecasts.
Blue colors show river valley fog. Check out the break in the fog over urban Louisville!
On a clear, cool night the warmer cities and lakes (orange shading) are easy to see!
Right: An analysis of the moisture content in the atmosphere. Yellows, greens, and
blues indicate drier air while reds and purples are wet. Black areas are clouds.
Forecasters use these data to determine where storms have a better chance to form.
10 Ryan Sharp, Lead Forecaster
Louisville

89,526,124
Whoa! That’s a big number, aren’t you proud?
We can now better monitor the development of individual cumulus clouds popping up between cooler wooded areas and warmer agricultural lands.
cool
woods
warmer open
land
This new color composite image combines multiple views from 3 separate GOES channels. On a cold morning, as shown above, the orange colors show low clouds and yellow colors slightly higher clouds. Several of the yellow-banded features are streaming downwind from power plants along the Ohio River.
A comparison of the new satellite (top) and its predecessor (bottom). The better resolution helps us to see features more clearly. In this image, the rivers and lakes across the region are easy to detect with the new satellite.
cumulus clouds
11
145 YEARS
A B C
Yellow 10 20 7
Blue 30 15 10
Orange 5 24 16
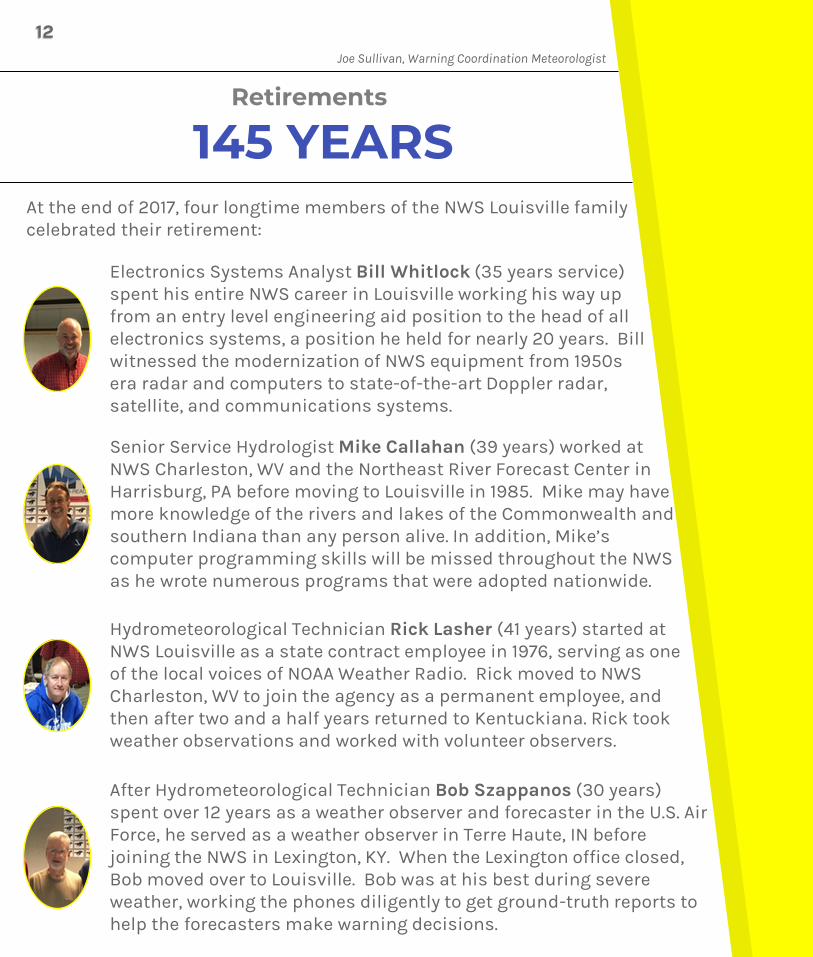
After Hydrometeorological Technician Bob Szappanos (30 years) spent over 12 years as a weather observer and forecaster in the U.S. Air Force, he served as a weather observer in Terre Haute, IN before joining the NWS in Lexington, KY. When the Lexington office closed, Bob moved over to Louisville. Bob was at his best during severe weather, working the phones diligently to get ground-truth reports to help the forecasters make warning decisions.
At the end of 2017, four longtime members of the NWS Louisville family celebrated their retirement:
Electronics Systems Analyst Bill Whitlock (35 years service) spent his entire NWS career in Louisville working his way up from an entry level engineering aid position to the head of all electronics systems, a position he held for nearly 20 years. Bill witnessed the modernization of NWS equipment from 1950s era radar and computers to state-of-the-art Doppler radar, satellite, and communications systems.
Senior Service Hydrologist Mike Callahan (39 years) worked at NWS Charleston, WV and the Northeast River Forecast Center in Harrisburg, PA before moving to Louisville in 1985. Mike may have more knowledge of the rivers and lakes of the Commonwealth and southern Indiana than any person alive. In addition, Mike’s computer programming skills will be missed throughout the NWS as he wrote numerous programs that were adopted nationwide.
Hydrometeorological Technician Rick Lasher (41 years) started at NWS Louisville as a state contract employee in 1976, serving as one of the local voices of NOAA Weather Radio. Rick moved to NWS Charleston, WV to join the agency as a permanent employee, and then after two and a half years returned to Kentuckiana. Rick took weather observations and worked with volunteer observers.
12 Joe Sullivan, Warning Coordination Meteorologist
Retirements

1. TRANSITION HEADLINE
Let’s start with the first set of slides
A 1 year scientific investigation concluded from questions at a Nicholasville rotary talk in 2016. A comprehensive webpage was created on this event: http://www.weather.gov/lmk/may18_1995_tornadoes
During the morning hours of May 18, 1995, a line of severe thunderstorms pushed through Kentucky producing millions of dollars in damage and causing dozens of injuries.
FORENSICS Meteorological
In Nicholasville, storms moved through around 7:30 AM as students were arriving at Jessamine County High School. Large sections of the school’s roof were torn off and bleachers were picked up and thrown across the football field. Over 30 students were injured. The storm also produced considerable structural damage to the Wal-Mart and numerous businesses and homes in town. The storms barreled east all the way to West Virginia.
Storm surveys from 1995 listed the damage as having been caused by straight-line winds. However, inspired by questions received during a Rotary talk in 2016 at which audience members insisted the 1995 storm was actually a tornado, an investigation was launched. NWS Louisville examined radar data, videos, photos, and newspaper articles. Environmental weather analysis was performed and eyewitnesses were consulted. NWS Louisville concluded that an F2 tornado with 145 mph winds ripped through Nicholasville that morning along a 24 mile path. Appropriate corrections will be made to the historical tornado database.
13 John Gordon, Meteorologist-in-Charge
The high school’s bleachers twisted and thrown into a heap. Photo courtesy Jessamine County EMA

New Albany’s Dark Day
100 YEARS AGO
On March 23, 1917, a powerful tornado, possibly F-4 strength, touched down near Corydon and headed east through the southern Indiana river communities across from Louisville. In New Albany, 500 homes and many businesses were demolished. There were at least 46 fatalities, including several children in schools. Five deaths occurred in a single home. This terrible but important event was commemorated on its 100th anniversary this year. University of Louisville student Cody Moore, volunteering with NWS Louisville, organized the centennial commemoration. Ceremonies were held outside the Floyd County/New Albany City-County Building and included several speakers as well as a hardy audience braving the morning chill.
Left: Cody Moore addresses the audience.
Right: Warning Coordination Meteorologist Joe Sullivan speaks to the media.
14 Tom Reaugh, Lead Forecaster
Background: DePauw Mansion on Charleston Road.

FLASH FLOOD
A PICTURE IS WORTH A THOUSAND WORDS
A complex idea can be conveyed with just a single still image, namely making it possible to absorb large amounts of data quickly.
EMERGENCY On May 19 severe storms developed over southern Indiana and north- central Kentucky. After several reports of large hail and strong winds, and even a small tornado in Crawford County, attention turned to the torrential rains falling from the strongest cells. In particular, 4 to 6 inches of rain fell on Salem, IN in a few hours. Extreme flooding resulted, prompting NWS Louisville to issue a rare Flash Flood Emergency. The west fork of the Blue River soared 3 feet above the old record stage at Salem.
Above: Partially submerged trucks in Salem. Photo courtesy Rosy Callahan
Right: Red and pink colors on this rainfall map show how localized the storm was, right over Salem.
15 Tom Reaugh, Lead Forecaster
Salem
INSTRUCTIONS FOR USE
EDIT IN GOOGLE SLIDES
Click on the button under the presentation preview that says "Use as Google Slides Theme".
You will get a copy of this document on your Google Drive and will be able to edit, add or delete slides.
You have to be signed in to your Google account.
EDIT IN POWERPOINT®
Click on the button under the presentation preview that says "Download as PowerPoint template". You will get a .pptx file that you can edit in PowerPoint.
Remember to download and install the fonts used in this presentation (you’ll find the links to the font files needed in the Presentation design slide)
More info on how to use this template at www.slidescarnival.com/help-use-presentation-template
This template is free to use under Creative Commons Attribution license. You can keep the Credits slide or mention SlidesCarnival and other resources used in a slide footer.
2017
CLIMATE
16
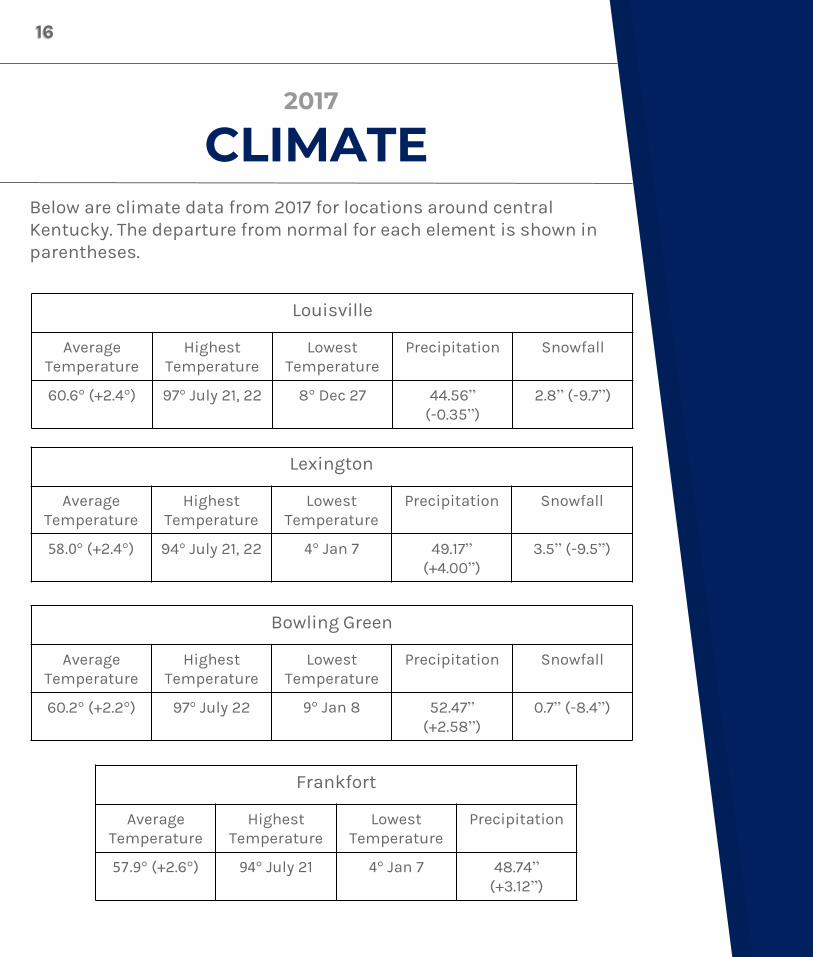
Louisville
Average Temperature
Highest Temperature
Lowest Temperature
Precipitation Snowfall
60.6° (+2.4°) 97° July 21, 22 8° Dec 27 44.56” (-0.35”)
2.8” (-9.7”)
Below are climate data from 2017 for locations around central Kentucky. The departure from normal for each element is shown in parentheses.
Lexington
Average Temperature
Highest Temperature
Lowest Temperature
Precipitation Snowfall
58.0° (+2.4°) 94° July 21, 22 4° Jan 7 49.17” (+4.00”)
3.5” (-9.5”)
Bowling Green
Average Temperature
Highest Temperature
Lowest Temperature
Precipitation Snowfall
60.2° (+2.2°) 97° July 22 9° Jan 8 52.47” (+2.58”)
0.7” (-8.4”)
Frankfort
Average Temperature
Highest Temperature
Lowest Temperature
Precipitation
57.9° (+2.6°) 94° July 21 4° Jan 7 48.74” (+3.12”)

Phone 502.969.8842 Fax 502.968.5663
Email [email protected] Twitter: @NWSLouisville
Facebook: NWSLouisville YouTube: NWSLouisville
National Weather Service 6201 Theiler Lane
Louisville, Kentucky 40229
Photo by Ryan Massey in La Grange