colorado lightning climatology - weather.gov
TRANSCRIPT

Hodanish, S. J., B. J. Vogt, and P. Wolyn, 2019: Colorado lightning climatology. J. Operational Meteor., 7 (4), 45-60, doi: https://doi.org/10.15191/nwajom.2019.0704
Corresponding author address: Stephen Hodanish, 3 Eaton Way, Pueblo CO 81001E-mail: [email protected]
45
Colorado Lightning ClimatologySTEPHEN J. HODANISH
National Weather Service, Pueblo, Colorado
BRANDON J. VOGTUniversity of Colorado Colorado Springs, Colorado
PAUL WOLYNNational Weather Service, Pueblo, Colorado
Average cloud-to-ground (CG) lightning flash density values for Colorado are analyzed for the 21-yrperiod1996–2016.Anannualmeanmapandmonthlymeanmapsofflashdensityprovide insight into thethunderstorm/lightningclimatologyoverthecomplexphysicallandscapesofColorado.Findingsincludethat1)theDenverconvergence/vorticityzoneregionalcirculationinfluencestheCGlightningdistributionacrossthenortheasternColorado region;2)moistureassociatedwith theNorthAmericanmonsoon increasesCGlightningovertheentirestate,focusingalongthesouthernexposuresoftheSanJuanMountains;and3)thehighestconcentrationsofCGlightningoccurwheremoisture,lift,andinstabilityaremaximized.
ABSTRACT
(Manuscript received 5 September 2018; review completed 4 April 2019)
1. Introduction
A goal of this climatological study is to articulate to operational meteorologists the relationship among thunderstorm activity, terrain-driven flow, and the complex landscape of Colorado. Although the specificity of atmospheric processes operating in Colorado cannot be denied, understanding the thunderstorm regimes outlined in this paper can potentially benefit forecasters in adjacent states or in regions isolated from Colorado altogether. For Colorado-based forecasters, we outline detailed explanations of both apparent and unapparent atmosphere/landscape interactions. The unapparent explanations build Colorado-based forecasters’ local knowledge and link the influence of topographic features that bridge different National Weather Service (NWS) forecast office (WFO) county warning areas. This spillover of local/regional knowledge carries opportunities for improving forecasts and for connecting more seamlessly with adjacent WFOs. This work provides context to upstream and downstream WFOs in adjacent states whose weather has a Colorado origin or otherwise shares a teleconnection to the influence
of the central and southern Rockies. Transposing the intricacies of thunderstorm behavior from Colorado to other complex landscape regions with little to no teleconnection to Colorado may direct forecasters to more critically consider topography-related force regimes that may be partially responsible for patterns of thunderstorm activity. This paper builds primarily upon two papers that analyzed lightning stroke data over Colorado—Vogt and Hodanish (2014, 2016). The 2014 paper analyzed 10 yr of lightning data over Colorado. The authors stratified lightning stroke data in 152-m (500-ft) vertical bins for the state. Stroke density increases significantly with elevation, especially in the high-terrain regions above 3048 m (10 000 ft). Vogt and Hodanish (2014) documented lightning maximum and minimum areas over parts of Colorado but did not elaborate on the atmospheric regimes that create these patterns in lightning activity. Additionally, through a high-resolution map of lightning stroke density, Vogt and Hodanish (2014) elucidated lightning minimums across fluvially and glacially incised mountainous regions (Fig. 1). This visualization underscores the

ISSN 2325-6184, Vol. 7, No. 4 46
Hodanish et al. NWA Journal of Operational Meteorology 12 June 2019
influence of fine spatial-scale topographical features on lightning activity. Significant findings of Vogt and Hodanish (2016) indicate that higher terrain serves to initiate thunderstorms over Colorado, but a continuous source of low-level moisture is needed to sustain storms. Also, local circulation patterns enhance the moisture source on the plains, which leads to significant enhancement of lightning activity over parts of the mountains/plains interface. One of these circulation patterns—the Denver convergence/vorticity zone (DCVZ)—is a stationary, terrain-induced mesoscale cyclonic gyre that is often observed over the plains between the Cheyenne Ridge and the Palmer Divide when the surface (~850 hPa) geostrophic wind is southerly (Szoke et al. 1984). This 850-hPa geostrophic flow typically occurs approximately 24 h after a Canadian frontal passage, as an area of high pressure settles over the north-central plains of the United States. First documented in 1981, the DCVZ wind gyre has a typical diameter of 50–100 km and has been observed as a nearly stationary feature for periods of about 10 h (Wilczak and Glendening 1988). The DCVZ circulation is a relatively common feature over northeastern Colorado. Szoke et al. (1984, 2006) and Szoke and Augustine (1990) found that this gyre occurs more than one out of three days (35%) from May through August. Severe weather activity associated with post-frontal flow over the High Plains is well documented (e.g., Doswell 1980; Maddox et al. 1981). The DCVZ itself has been studied extensively owing to its preponderance
for nonsupercell tornado activity that occurs along the convergence zone (Szoke et al. 1984, 2006; Brady and Szoke 1989; Wakimoto and Wilson 1989; Szoke and Augustine 1990). In this study, we hypothesize that the wind flow pattern associated with the DCVZ affects the lightning distributions over the greater northeastern Colorado region—enhancing the activity over the southern Front Range Mountains/Pikes Peak/Palmer Divide region, while decreasing lightning activity over the northern Front Range Mountains/Cheyenne Ridge region and over the area of the plains just east of the Front Range Mountains, generally north of Denver. Through the support of time-series animations, Vogt and Hodanish (2016) showed hour-by-hour and day-to-day warm-season lightning activity composites. The hour-by-hour animation depicted storms over the mountains/plains interface developing in the late morning/early afternoon and moving east onto the plains, while storms that initiated over the southern San Juan mountains propagated to the south as the day progressed. The day-by-day animation indicated that most of the springtime activity occurred along the mountains/plains interface and moved east onto the plains, whereas later in the season lightning activity increased over the entire state as North American monsoon (NAM) moisture moved in from the southwest. The NAM is a seasonal shift in the subtropical ridge. From a sensible weather perspective, the NAM is a pronounced increase in precipitation between the months of June and July across parts of the southwestern United States and northwestern Mexico—with the increased precipitation continuing through August and lasting into September over parts of the region. Over 50% of the annual precipitation that occurs over small sections of Arizona, New Mexico, and a large area of northwestern Mexico, falls during the months of July, August, and September (Hales 1974; Douglas et al. 1993; Adams and Comrie 1997; Holle and Murphy 2015). Finally, Vogt and Hodanish (2016) outlined that not all high mountains show significant lightning activity. Areas where moisture is limited reveal significantly less lightning activity. However, lightning still occurs on a near daily basis in the warm season in these high-elevation moisture-limited regions. Vogt and Hodanish (2014, 2016) provided a foundation for the next step toward understanding lightning activity across Colorado: to examine the meteorological and topographical forcing that causes the lightning distributions. In section 2, an overview
Figure1. Topography of CO. County outlines are shown along with place names mentioned in this document. Pitkin County is highlighted in cyan. Click image for an external version; this applies to all figures hereafter.

ISSN 2325-6184, Vol. 7, No. 4 47
Hodanish et al. NWA Journal of Operational Meteorology 12 June 2019
of the dataset is provided. In section 3, we examine an annual flash density map and discuss the general areas of maximum and minimum flash values over Colorado. We then examine monthly flash density maps along with a statewide flash rate plot that shows day-by-day lightning activity and examine how the flash values change through the seasons. In section 4, we partition Colorado into six regions and discuss the lightning characteristics within each. In section 5, we summarize our work, and in section 6, provide concluding remarks.
2. Dataandmethods
Twenty-one years (1996–2016) of National Lightning Detection Network (NLDN) cloud-to-ground (CG) lightning flash data serve as the dataset for this study. These data were provided by Vaisala in a text file format that included for each flash record date and time (UTC), latitude and longitude (decimal degrees), polarity, peak current (kA), and multiplicity (the number of detected strokes per flash). A flash represents 1–20 individual CG return strokes (Valine and Krider 2002; Rakov and Huffines 2003; also see ghrc.nsstc.nasa.gov/opendap/doc/vaistroke/vaistroke_dataset.html). Flash data are analyzed exclusively in this work because, unlike stroke data that are better suited for lightning process studies, flash data show geographic trends in a more general sense (Orville 1991; Orville et al. 2011). Both positive and negative flashes are incorporated in this study, and no polarity distinction is made. Two upgrades to the NLDN occurred during the years of this study; the first upgrade was in 2002–2003 and the second was in 2013–2014. CG detection efficiency (DE) prior to the first upgrade was 80–90%; between the first and second upgrade DE was 90–95%; and after the second upgrade DE improved to >95%. The location accuracy (LA) prior to the first upgrade was 500 m; between the first and second upgrade LA was 300 m; and after the second upgrade LA was 200 m (Mach et al. 1986; Cummins et al. 1998; Orville 2008; Cummins and Murphy 2009; Buck et al. 2014). Rudlosky and Fuelberg (2010) found that the 2002–2003 upgrade increased the overall flash density counts over parts of Colorado, especially over the far northeastern plains [see Fig. 2e from Rudlosky and Fuelberg (2010)]. To prepare the data for analysis (using a Microsoft Access database), positive flashes <15 kA were removed (Cummins and Murphy 2009; Rudlosky and Fuelberg 2010) and dates and times were adjusted to Mountain Daylight Time (MDT) from Greenwich
Mean Time. The data were imported into ESRI ArcMap 10.5 geographic information system (GIS) software for clipping, mapping, spatial analysis, and temporal analysis. The GIS project was mapped to the robust, meter-based, commonly used North American Datum 1983 coordinate system. The raw flash data were delivered by Vaisala in a geographic area bound by 36.80 to 41.15ºN latitude and –109.24 to –101.80ºW longitude. This area covers Colorado with some overlap into adjacent states. As such, the data were clipped to precisely match the boundary of Colorado. The resulting clipped extent (Fig. 2) is bound by 36.99 to 41.00ºN latitude and –109.05 to 102.05ºW longitude. The United States Geological Survey base map used for clipping the flash data accounts for the surveying deviations that form Colorado’s imperfect rectangle. The remaining dataset consists of 10 682 345 CG lightning flash coordinate pairs (points). This spatial database maintains the association between coordinate pairs and all attributes, including time. To prepare the millions of points for fine-scale flash density mapping, a 1 km × 1 km fishnet (grid) was generated and added to the GIS project. Each of the 283 125 1 km × 1 km grid cells in the fishnet serve as clipping features from which temporal statistics were generated and mapped. For this study, map layers were created from the 21-yr dataset and show average annual (Fig. 2) and monthly (Fig. 3) flash densities. Daily average flash densities were extracted through 24 h, and MDT attribute queries from the GIS project are shown in histogram form in Fig. 4.
Figure2. Cloud-to-ground (CG) flash density map for CO for the years 1996 through 2016. County outlines are shown. Lightning data from Vaisala.

ISSN 2325-6184, Vol. 7, No. 4 48
Hodanish et al. NWA Journal of Operational Meteorology 12 June 2019
North American Regional Reanalysis (NARR) data (Mesinger et al. 2006) were used to obtain monthly averages of convective available potential energy (CAPE) and dewpoint for Colorado. The data are available at 3-h increments on a grid with a spacing of approximately 0.3 degrees (32 km). The monthly average for each year at the specified hour (2100 UTC or 3 pm local time) was calculated. These monthly averages were then combined to compute the average value for each month and hour for the 21-yr period,
1996 to 2016. CAPE data are shown for each month, while dewpoint data for the months of June and July are shown. Thirty years (1981–2010) of Parameter-elevation Regressions on Independent Slopes Model (PRISM) precipitation data (prism.oregonstate.edu) are used to show warm-season (June–August) precipitation over the state.
Figure3. Monthly average CG flash density maps for CO from 1996 through 2016 for the months of (a) November, (b) December, (c) January, (d) February, (e) March, (f) April, (g) May, (h) June, (i) July, (j) August, (k) September, and (l) October. The months of November through March make up the winter season; April through June make up the spring season; July and August make up the North American monsoon (NAM) season; and September and October make up the autumn season. Lightning data were provided by Vaisala.
ISSN 2325-6184, Vol. 7, No. 4 49
Hodanish et al. NWA Journal of Operational Meteorology 12 June 2019
3. Statewidelightningdistributions
a. Annual CG flash density map
In this section, we discuss where flash maxima and minima exist over Colorado and give a brief overview of why these maxima and minima exist. In section 4, we hypothesize reasons for the geographic coverage of these maxima and minima. A diverse range of CG flash density values define lightning activity in Colorado. Annual CG flash density values range from >6.5 fl km–2 over the east-central portion of Colorado to <0.5 fl km–2 over the south-central portion of Colorado (Fig. 2). Four areas of enhanced lightning activity occur over Colorado. The first two areas are located where the higher terrain of the plains intersects the Rocky Mountains (mountains/plains interface), the third covers the southern slopes of the San Juan Mountains, while the fourth area blankets the far northeastern Colorado plains. The first of the two enhanced areas along the mountains/plains interface is located where the Palmer Divide intersects Pikes Peak, while the second is located where the Raton Mesa intersects the southern Sangre de Cristo (SDC) Mountains. Flash maxima in these two areas are due to (1) a juxtaposition of topographical forcing associated with daytime, thermally driven upslope flow and (2) the availability of low-level moisture that initiates and, more importantly, sustains convection as it moves off the mountain slopes and higher terrain out onto the plains. The flash maximum surrounding the southern slopes of the San Juan Mountains is due to a juxtaposition of favorable topographical forcing and mid-to-late summer NAM moisture. The enhanced area over far northeastern Colorado is caused by thunderstorms over this region congealing into mesoscale convective systems (MCSs)
as they move east-northeast over far northeastern Colorado. Most of the minima in lightning activity are in mountain valleys, with the least amount covering the San Luis Valley (SLV) in south-central Colorado. Another minimum is located over the vast plateau region of northwestern Colorado. In this area, the flash minima are primarily attributed to limited low-level moisture, primarily by blocking from surrounding higher terrain. The minimum located over the plains, east of the Colorado Front Range and north of the Denver metropolitan area, is likely the result of a predominantly divergent lower-level wind flow regime that develops relatively frequently over this region. Areas of flash density maxima do not necessarily occur in the tallest mountain ranges. As an example, the Sawatch Range, a north–south oriented mountain range in the central part of the state, is one of the tallest mountain ranges in Colorado, yet experiences very little lightning. The reason for the low flash densities over this high terrain region is related to the lack of CAPE from the blocking of moisture by the Front Range Mountains to the east and the San Juan Mountains to the south.
b. Monthly CG flash density maps
Monthly flash density maps and daily flash counts characterize the spatiotemporal character of lightning distributions across the state. Figure 3 shows plots of lightning flash density for each month and Fig. 4 is a histogram of the daily CG distribution. Additionally, to demonstrate how much buoyancy is occurring over the state during maximum heating, NARR-based plots (Mesinger et al. 2006) show CAPE averaged for each month (Fig. 5). Values of CAPE at 2100 UTC (1500 local time) are shown. In this manuscript, we define November through March as the winter season, April through June as the spring season, July and August as the NAM season, and September and October as the autumn season. The winter season captures the period when CG activity is at a minimum. The spring season shows lightning increasing over the state, especially over the plains and the eastern slopes of the mountains adjacent to the plains. During the NAM season, lightning is at a maximum statewide owing to the increase of monsoon moisture. The autumnal season is a transitional time as instability decreases. During the winter season (Fig. 3a–e), very few CG
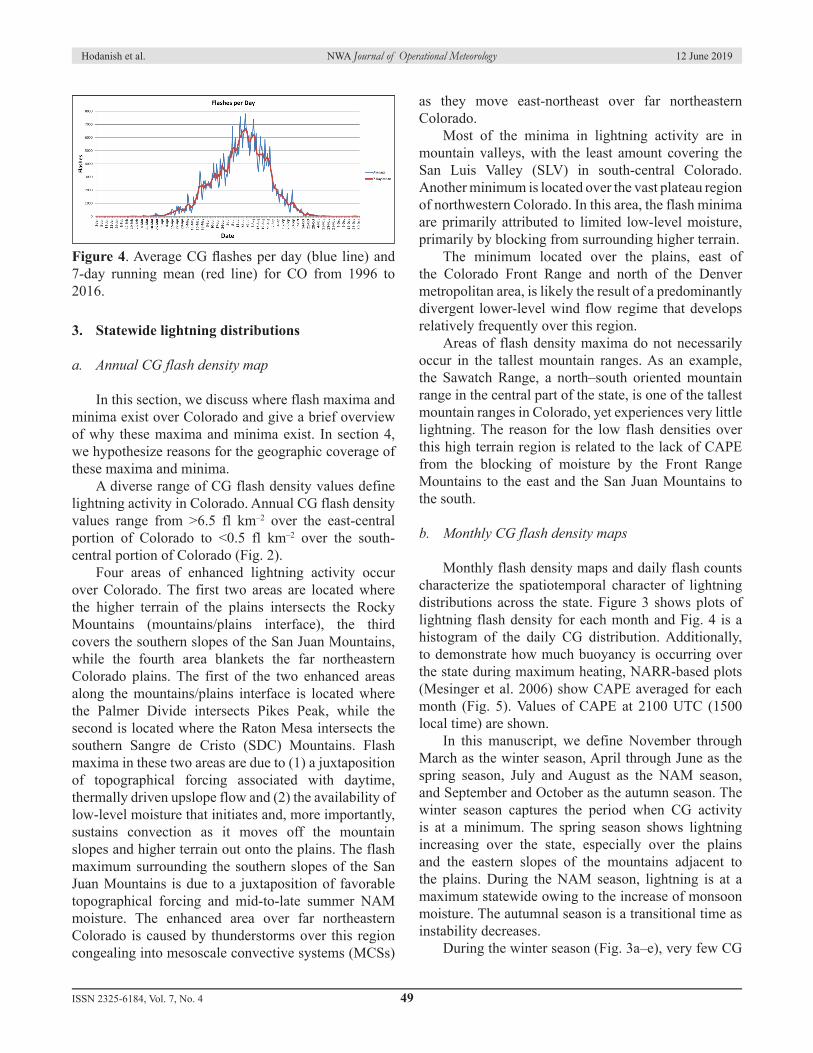
Figure4. Average CG flashes per day (blue line) and 7-day running mean (red line) for CO from 1996 to 2016.

ISSN 2325-6184, Vol. 7, No. 4 50
Hodanish et al. NWA Journal of Operational Meteorology 12 June 2019
lightning flashes occur (0.4% of the yearly total). The lack of lightning activity is due to limited instability as monthly averaged CAPE plots show CAPE values <20 J kg–1 over the entire state for months of November through February, with slightly higher values (<40 J kg–1) in March (Fig. 5a–e). Some lightning does occur during the winter season, primarily during the months of November and March. The November activity is focused over the western and far southeastern part of the state (Fig. 3a), whereas the activity in March is more evenly distributed statewide (Fig. 3e), driven by the increasing insolation [and gradually increasing CAPE values (Fig. 5e)] along with transient late winter/early spring synoptic cyclones. The few CG flashes that do occur during December through February are mostly concentrated over the plains where the activity occurs in streaks (Fig. 3b–d). This pattern is likely the result of individual convective cells producing an occasional CG flash as weak convective activity moves across the plains (see Fig. 4 from Vogt and Hodanish 2016). Most of these streaks are oriented south-southwest–north-northeast, which implies the likelihood of a high amplitude (and likely slow-moving) trough located to the west of the state. A slow-moving long-wave trough in this orientation is most likely capable of bringing moisture, albeit limited, from the Gulf of Mexico over the High Plains of eastern Colorado. During the spring season, the combination of increasing insolation and increasing CAPE (Fig. 5f–h), coupled with transient cyclones and diurnal upslope flow, support an increase in lightning (Fig. 3f–h) statewide. Average flash values in the lower 10s of flashes day–1 (fl dy–1) in early April increase to ~500 fl dy–1 by the beginning of May, to 2400 fl dy–1 by the beginning of June, and to 4500 fl dy–1 by the end of June (Fig. 4). However, the amount of lightning activity over the state is not uniform during the spring season. Most lightning activity in the spring season occurs from the mountains/plains interface eastward onto the plains (Fig. 3f–h). Higher amounts of CG activity over this region are due to the larger CAPE values over the plains compared to the interior mountains and valleys. CAPE values of 50–100 J kg–1 over the plains during April increase to 400–800 J kg–1 by June, while over the interior mountains and valleys, CAPE values are 20–40 J kg–1 in April and increase to 100–300 J kg–1 by June (Fig. 5f–h). There is more CG activity across the plains than across the interior mountains/valleys because low-level moisture is blocked from advancing west by the Colorado Front Range, Pike Peak, and the
SDC Mountains. The NAM season brings a significant increase in lightning activity statewide (Fig. 3i,j), with the greatest change in activity over the mountains. Daily statewide flash values of 5500 to 6500 fl dy–1 are common in July, with the activity rapidly dropping off in late August (Fig. 4). Moisture that was previously blocked from reaching the interior mountains is now abundant as the NAM advects midlevel moisture over the entire state from the southwest (Hales 1974; Douglas et al. 1993; Adams and Comrie 1997; Holle and Murphy 2015). This moisture increase is evident by comparing NARR dewpoint plots for June (Fig. 6a) and July (Fig 6b). During June, dewpoints of 4.4–10.0°C (40–50°F) are observed on the plains while values of 1.1–4.4°C (34–40°F) are observed over the interior mountains/valleys. During July, dewpoints increase to 7.2–12.8°C (45–55°F) on the plains and to 3.3–7.2°C (38–45°F) over the mountains/interior valleys. CAPE values during the NAM season are still maximized over the plains, with values of 400–800 J kg–1; however, CAPE values of 300–500 J kg–1 are observed over the interior mountains and valleys, especially during July (Fig. 5i). Over the plains, this increasing midlevel monsoon moisture combines with the favorable diurnal upslope flow to amplify the lightning activity there. The greatest amount of CG activity is observed over the Palmer Divide and Pikes Peak regions (Fig. 3i,j). Lightning activity decreases during the autumn season. Flash values decrease abruptly from about 4500 fl dy–1 during the last week of August to about 2000 fl dy–1 by the first week of September (Fig. 4). Flash values continue to decrease during the 2nd and 3rd week of September, but at a slower rate. A slight uptick in activity is noted at the end of September (about 1000 fl dy–1), but then decrease to the lower 10s of fl dy–1 by the latter part of October. The decrease in lightning activity during the autumn season is due to more stable air being advected into the plains region as Canadian air masses begin to impinge on the High Plains. This decrease in CG activity is clearly indicated by comparing Fig. 3j to Fig. 3k. In addition, August CAPE values (Fig. 5j) that were in the 400–800 J kg–1 range over the plains and 100–300 J kg–1 range over the mountains/interior valleys drop to <50 J kg–1 statewide by October (Fig. 5l).
4. Regionallightningdistributions
In this section, we divide the state into six regions

ISSN 2325-6184, Vol. 7, No. 4 51
Hodanish et al. NWA Journal of Operational Meteorology 12 June 2019
(Fig. 7) and explain the geographic distribution of CG lightning in each region. Three of the regions—the greater northeastern Colorado region, the far northeastern Colorado region, and the greater southeastern Colorado region—form the part of Colorado from the mountains/plains interface eastward to the Colorado/Kansas border. The remaining three regions include the SLV, the San Juan Mountains, and northwestern and west-central Colorado. These regions capture the interior mountains and valleys of Colorado.
a. Mountains/plains interface extending eastward to the Colorado/Kansas border
Low-level moisture arrives over the eastern plains of Colorado either directly or indirectly from the Gulf of Mexico. Moisture can be transported northward from the Gulf of Mexico via the low-level jet (Bonner
1968), then drawn directly westward by weak synoptic mechanisms; or moisture can be transported westward by the diurnal upslope circulation (Toth and Johnson 1985; Abbs and Pielke 1986). Moisture also may be transferred onto the state through indirect methods. For example, Gulf of Mexico moisture can be precipitated onto the plains of Kansas and Nebraska, and then evapotranspiration and northeasterly flow behind a stationary front complete the transport of moisture into Colorado. Furthermore, midlevel moisture can advect over the entire state during the mid-to-late summer. This process is associated with the NAM flow (Hales 1974; Adams and Comrie 1997). Three east–west ridges—the Cheyenne Ridge, the Palmer Divide, and the Raton Mesa—extend eastward onto the plains from the Rocky Mountains of Colorado (Fig. 1). Low-level moisture advecting upslope across the plains interacts with each of these ridges. However,
Figure5. Monthly averaged CAPE plots for CO for (a) November, (b) December, (c) January, (d) February, (e) March, (f) April, (g) May, (h) June, (i) July, (j) August, (k) September, and (l) October. Season definitions are as in Fig. 3. NARR data were provided by the Earth System Research Laboratory [www.esrl.noaa.gov/psd/; also see Mesinger (2006)].

ISSN 2325-6184, Vol. 7, No. 4 52
Hodanish et al. NWA Journal of Operational Meteorology 12 June 2019
despite the ridges’ general east–west alignment, the lightning flash distributions across these three ridges vary. The most significant lightning activity occurs across the Palmer Divide region. Here, yearly average lightning flash values across a large part of this region are in excess of 4.0 fl km–2, with several areas in excess of 6.5 fl km–2 (Fig. 7). The Raton Mesa region to the south along the Colorado/New Mexico border displays less activity than the Palmer Divide region, but far more than the Cheyenne Ridge region to the north. The Raton
Mesa region experiences flash density values ranging between 4.0 to 5.0 fl km–2, while the Cheyenne Ridge, which is located along the Colorado/Wyoming border, does not show a maximum in lightning activity. Flash distributions across the Cheyenne Ridge are rather uniform, with values in the 2.0 to 3.0 fl km–2 range. Areas on the plains between the three ridges [generally areas below 1.5 km (5 kft) in elevation], and areas along most of the Colorado/Kansas border, show rather uniform flash values, ranging between 1.0 to 3.0 fl km–2. Exceptions to these uniform flash rates include an area of anomalously low flash values located just east of the Colorado Front Range in north-central Colorado, bounded roughly between the cities of Denver to Greeley to Fort Collins and back to Denver (cf. Figs. 1 and 2). Here, flash rates range between 0.5 to 1.5 fl km–2. An area of higher activity covers extreme northeastern Colorado where values range between 3.0 to 4.0 fl km–2.
1) GREATER NORTHEASTERN COLORADO REGION
The north slope of the Palmer Divide, the south slope of the Cheyenne Ridge, the east slopes of the Colorado Front Range/Pikes Peak, and the northeastern plains form the northeastern Colorado region (Figs. 1 and 7). Flash distributions in this region are driven by the warm-season low-level wind flow regime. During the 1980s, the Prototype Regional Observing and Forecasting Service (PROFS, Beran and Little 1979; Reynolds 1983) operated a mesonetwork
Figure 6. Monthly averaged dewpoint plots for CO for (a) June and (b) July. Dewpoint temperatures given in °F. NARR data were provided by the Earth System Research Laboratory [www.esrl.noaa.gov/psd/; also see Mesinger (2006)].
Figure7. Same as Fig. 2, except with outlines for the place names of the six regions discussed in the text.

ISSN 2325-6184, Vol. 7, No. 4 53
Hodanish et al. NWA Journal of Operational Meteorology 12 June 2019
of weather stations across the northeastern Colorado region. Toth and Johnson (1985) analyzed 3 yr (1981–1983) of warm-season surface wind data collected from the PROFS mesonetwork, along with surface wind data from NWS stations, to investigate the diurnal wind flow pattern over the northeastern Colorado region.1 They found that the confluence of the surface wind field over the Palmer Divide is much more pronounced than that of the Cheyenne Ridge, and observed that this area of confluence over the Palmer Divide exists for 5–6 h per day. They also found that an area of persistent diffluence in the surface wind field is observed over the lower elevations of the northeastern plains, bounded roughly by Denver–Greeley–Fort Collins–Denver. This area of diffluence persists for 4–5 h each day. The averaged wind patterns described in Toth and Johnson (1985) likely were influenced by the DCVZ circulation, as described in section 1. Figure 8 shows a typical surface wind regime associated with the DCVZ (Szoke et al. 2006). During a DCVZ event, a surface trough develops and extends from areas south of the Denver metropolitan region north-northeastward to near Greeley (blue dashed line in Fig. 8). To the south and east of the trough axis, south-southeasterly winds dominate across the plains of Colorado. To the west of the trough axis, the wind flow shows a more divergent pattern; southeasterly wind flow in the Fort Collins area generally backs as one travels south and becomes northerly across the Boulder/Denver area. An area of well-defined convergence is observed along the trough axis, especially east and south of the immediate Denver area. The DCVZ circulation likely affects the lightning distributions across the northeastern Colorado region. Figure 9 shows the DCVZ flow regime overlaid on the annual flash density map. A minimum in flash density values is seen over the northern Front Range Mountains [generally north of Ward (wrd), the southern sections of the Cheyenne Ridge, and that area of the plains bounded roughly from Denver (DEN) to Fort Collins (for) to Greeley (gly) and then back to Denver]. This minimum occurs where the DCVZ circulation is generally diffluent. Additionally, a maximum in flash density values is found across the southern sections of the Front Range Mountains, the Pikes Peak area, and the Palmer Divide. In these areas, strong convergence
is associated with the DCVZ trough axis. A study by Fuchs et al. (2016) found a similar flash density pattern as shown in Fig. 9. In the Fuchs et al. study, two years of Colorado Lightning Mapping Array (COLMA) data were analyzed. The COLMA is a total lightning [in-cloud (IC) + CG] detection system where lightning flashes are constructed from lightning point source data using an open source flash clustering algorithm. Similar to the present study, Fuchs et al. identified a flash density maximum extending from just east of the Denver region extending northeastward to the Fort Morgan region (see Fig. 8b from Fuchs et al. 2016), with a relative minimum in flash density north of the Denver area. However, Fuchs et al. observed a
Figure8. Schematic of the DCVZ (red arrows) overlaid on a topographic map (m, hatched for elevations >3000 m). PROFS mesonet stations are marked with open circles; NWS stations are shown as darkened circles; red arrows show the general surface flow; and the blue dashed lines indicate the surface trough axis. The following towns/cities are referenced in the text: “for” is Fort Collins; “gly” is Greeley; DEN is Denver; and “wrd” is Ward. Figure taken from Szoke et al. (2006).
1 Only results for July 1981 were presented by Toth and Johnston (1985); data for the other two years were quite similar to the July 1981 results.

ISSN 2325-6184, Vol. 7, No. 4 54
Hodanish et al. NWA Journal of Operational Meteorology 12 June 2019
relative maximum in total lightning flash density over the Cheyenne Ridge whereas this study identifies a minimum in CG flash density over the Cheyenne Ridge. The flash density calculated from the COLMA was more than an order of magnitude greater than the NLDN flash density found in this study. The COLMA flash density values are in the 60s to lower 70s fl km–2, whereas this study estimates flash density values of 2 to 6 fl km–2. This would imply an IC:CG ratio (Z ratio) of >10:1 over the northeastern Colorado region. Boccippio et al. (2000) calculated a Z ratio using four years of Optical Transient Detector lightning data and NLDN data; they found a Z ratio of 8–10 across the far northeastern Colorado region, with values rapidly decreasing to one to two over the Colorado Front Range. In addition to the favorable low-level DCVZ wind flow pattern that enhances CG lightning activity over the southern Front Range Mountains/Pikes Peak area and the Palmer Divide, the topography and physical setting of this region is more conducive for initiating and, more importantly, sustaining, thunderstorm activity. First, Pikes Peak, which abuts the Palmer Divide, is a high [4.3 km MSL (14.1 kft)] isolated mountain massif. In addition to being one of the 54 tallest mountains in Colorado, Pikes Peak juts eastward farther than any Front Range mountain. Pikes Peak’s south, east, and to a certain extent, northern flanks are immediately adjacent to the moisture-rich plains. Second, the slope of Pikes Peak adjacent to the plains is quite steep. The horizontal distance between the summit of Pikes Peak and the Colorado Springs metropolitan area [elevation ~1.8 km MSL (6.0 kft)] is 19.3 km. This configuration creates a slope angle of 13%. In a study of convective initiation using satellite imagery, Klitch et al. (1985) noted that initiation occurred “along the rugged slopes of the Rockies,” implying slope angle is important in initiating convection in the mountains of Colorado. The minimum in CG lightning activity over the Cheyenne Ridge is primarily due to less confluence when compared to the Palmer Divide (Fig. 9). Less confluence manifests as less deep convection. In addition, a study by Klitch et al. (1985) analyzed visible satellite imagery over Colorado for July and August of 1982. Though the study was limited in duration, the authors contended that deep, moist convection over the Cheyenne Ridge region occurs less frequently than over the Palmer Divide region. A 30-yr (1980–2010) average of summer precipitation (June–August) over Colorado is shown in Fig. 10. Like the lightning distribution over the three
ridges, the Cheyenne Ridge shows the least amount of summer precipitation compared to the Palmer Divide and Raton Mesa. The topography of the Cheyenne Ridge also may play a role in the minimum in CG activity over this ridge. Although the Cheyenne Ridge is similar in form to the other two ridges (e.g., all are areas of higher terrain extending west to east from the Rocky Mountains), the Cheyenne Ridge is not as high as the Raton Mesa or the Palmer Divide (Fig. 1). As such, the slope of the terrain from the river basins to the top of the ridge is less. Also, the north–south mountain ranges [Laramie Range in southern Wyoming (not shown) and the northern section of the Colorado Front Range] are not as tall as the mountains that abut the Palmer Divide and Raton Mesa.2) FAR NORTHEASTERN COLORADO
Numerous studies have shown that MCSs originate over the greater northeastern Colorado region (Wetzel et al. 1983; Nachamkin et al. 2000; Coniglio et al. 2007). The flash density maximum over far northeastern Colorado (Fig. 7) is related to the initial development of these convective systems. Maps of yearly continental United States CG flash density activity (e.g., Rudlosky and Fuelberg 2010; Orville et al. 2011) show flash rates increasing across southern Nebraska and into northwestern Kansas. The flash density maximum
Figure 9. Same as Fig. 8, except with annual 1996–2016 CG lightning flash density data embedded.

ISSN 2325-6184, Vol. 7, No. 4 55
Hodanish et al. NWA Journal of Operational Meteorology 12 June 2019
over far northeastern Colorado is best seen during the months of June and July (Fig. 3h–i).
3) GREATER SOUTHEASTERN COLORADO REGION
The southeastern Colorado region (Fig. 7) is defined from the south slopes of the Palmer Divide to the New Mexico border, and from the SDC Mountains eastward to the Kansas state line (Fig. 1). Within this region is another maximum in lightning activity, located adjacent to the east-facing slopes of the southern SDC Mountains and extending eastward across the Raton Mesa. The SDC Mountains are oriented roughly north–south over southern Colorado. The range separates the SLV to the west from the plains to the east. Many of the peaks along this range are in excess of 3.7 km (12.0 kft) elevation. Because of its length, the SDC Mountains can be divided geographically into the northern SDC Mountains, which extend from just south of Salida, Colorado, south to La Veta Pass, and the southern SDC Mountains, which extend from La Veta Pass southward into New Mexico. A less extensive mountain range, the Wet Mountains, parallels the northern SDC Mountains along their eastern flank. A small mountain spur, the Spanish Peaks, extends northeastward from the southern SDC Mountains near Cuchara, Colorado. A majority of the lightning activity over the SDC Mountain region occurs primarily over the southern SDC Mountain range. Specifically, this maximum occurs over the east- and southeast-facing slopes of the southern SDC Mountains from the Spanish Peaks south to the Colorado/New Mexico border. This maximum extends eastward to the Raton Mesa. There is relatively little lightning over and near the east-facing slopes of the SDC Mountains north of the Spanish Peaks compared to areas south of the Spanish Peaks. This variation is likely due to a lack of low-level moisture to sustain convection. Although many mountain tops in the SDC Mountain range are favorable for initiating convection (Klitch et al. 1985; Banta and Schaaf 1987; Schaaf et al. 1988; Vogt and Hodanish 2014), the lack of low-level moisture to the immediate east of the SDC Mountain Range north of the Spanish Peaks limits the amount of convection and, hence, lightning activity. Figure 6 also shows less moisture (lower dewpoints) to the immediate east of the SDC Mountain Range north of the Spanish Peaks. Flash densities to the immediate east of the northern SDC Mountains are low, ranging between 2.0 and 3.0 fl km–2.
This lack of moisture is primarily due to the blocking by the Wet Mountains, which show higher flash rates with values ranging between 3.0 and 4.0 fl km–2. Unlike the SDC Mountains north of the Spanish Peaks, which are blocked by the Wet Mountain range to the east, the SDC Mountains south of the Spanish Peaks are in a much more favorable area to initiate and sustain convection. First, there is no blocking terrain east of the southern SDC Mountains. Second, an area of higher terrain over the plains, the Raton Mesa, extends immediately east of the southern SDC Mountains. Diurnal heating across the Raton Mesa allows low-level flow to travel up the mesa, converging at the center along the Colorado/New Mexico border. Convection that initiates over the southern SDC Mountains then travels to the east in the prevailing westerly flow into this favorable (unstable) low-level environment, sustaining the convection. The combination of these factors supports flash rates that range from 3.0 to 5.0 fl km–2. Unfortunately, a mesonetwork similar to PROFS has never existed over the southeastern Colorado region, and thus a high-resolution observational analysis of the wind flow regime is not possible.
b. Interior mountains and high valleys
1) THE SAN LUIS VALLEY
The SLV (Fig. 7), located over south-central Colorado and extending into northern New Mexico, is a vast flat-floored valley covering >21 000 km-2. The valley is high with an average elevation of 2.3 km (7.5 kft, see Fig. 1). The SLV is surrounded to the west, north, and east by mountains with elevations in excess of 3 km (9.8 kft). With respect to the SLV, the San Juan Mountain Range lie from the southwest through northwest, and the SDC Mountains lie from the northeast through southeast. The high terrain that surrounds the SLV blocks low-level moisture from entering the valley. Adequate low-level moisture, located over the eastern plains of Colorado, is blocked by the SDC Mountains to the east. The extensive San Juan Mountains block most low-level moisture arriving from the west and southwest. The SLV is one of the driest (Fig. 10) and sunniest locations (www.nrel.gov/gis/maps.html) in Colorado and displays the least amount of lightning in the state. Not surprisingly, annual flash rates (Fig. 2) in nearly all the SLV are ≤1.0 fl km–2. The sheer size of the SLV valley floor may

Hodanish et al. NWA Journal of Operational Meteorology 12 June 2019
ISSN 2325-6184, Vol. 7, No. 4 56
contribute to the low flash densities. As a vast and high valley, the SLV experiences heating on a typical summer day, allowing for upslope winds to develop along the mountains. As air rises along the mountain slopes, compensating downward vertical motion occurs over the valley floor. Continued heating of the valley floor gradually erodes any low-level inversion, and the convective boundary layer mixes out. Once mixing is complete, surface winds across the valley will blow from the direction of the ridgetop level winds (Banta 1984). In the case of the SLV during the warm season, a southwesterly wind will prevail by afternoon across the surface of the valley as shown by monthly wind roses for the SLV airport (Peroutka et al. 2004). Given the lack of low-level moisture over the SLV, and the overall downward vertical motion that occurs over the valley floor, any thunderstorms that move off the higher terrain of the San Juan Mountains and into the valley move into an unfavorable environment and weaken. The lightning activity that does occur over the SLV likely is due to either stronger dynamic systems that occasionally move across the area during the warmer months or when there is sufficient low-level moisture in the valley (mainly during the NAM season; see Fig. 3i,j) and the flow in the lower atmosphere is light. Regarding the latter scenario, storms forming over the mountains will develop cool pools that propagate over the valley floor. If sufficient instability exists, these cool pools will initiate new convection.
2) THE SAN JUAN MOUNTAIN REGION
The San Juan Mountain region (Fig. 7) consists of two mountain groups: the La Garita Mountains to the north, and the San Juan Mountains to the south through southeast (Fig. 1). These two mountain groups are bisected by the Rio Grande River drainage. The annual lightning distribution (Fig. 2) across the entire San Juan Mountain region reveals that most activity occurs across the southern slopes of the San Juan Mountains where values range between 3.0 and 4.0 fl km–2, with localized areas at 5.0 fl km–2. Lesser amounts, ranging between 1.5 and 2.5 fl km–2, occur across the La Garita Mountains and the Upper Rio Grande River Valley. Much of the lightning activity over the San Juan Mountain region occurs during the NAM season (July and August) as CG flash density values are between 0.5 and 1.2 fl km–2 (Fig. 3i,j). During the same two months CAPE values are at a maximum, peaking between 250 to 400 J kg–1 (Fig 5i,j). Both the highest CG values and CAPE values are located on the southern slopes of the San Juan Mountains. The month prior to the NAM season, lightning activity is significantly less as the June flash density map (Fig. 3h) shows flash density values <0.3 fl km–2. CAPE values during June (Fig. 5h) also are noticeably less, with values of 50–150 J kg–1. The same is true for the month after the NAM season, as the September flash density map (Fig. 3k) shows flash density values <0.4 fl km–2. CAPE values during September (Fig. 5k) range from 50 to 150 J kg–1. Though the San Juan Mountain region receives most precipitation during the winter months (wrcc.dri.edu/summary/Climsmco.html), there is a marked increase in precipitation in June and July. An examination of precipitation data for 23 weather stations across the San Juan Mountain region during a 30-yr period (1971–2000) indicates that precipitation nearly doubles between the two months. The average precipitation for all stations in June is 3.3 cm (1.3 in), increasing to 6.1 cm (2.4 in) in July—an increase of 185% (w2.weather.gov/climate/xmacis.php?wfo=pub; www.co.nrcs.usda.gov/). All 23 stations showed a positive increase in precipitation between these two months. As moisture from the NAM moves up from Arizona and New Mexico, across the higher terrain of southwestern Colorado, thunderstorms develop over the higher elevations of the southern flanks of the San Juan Mountains. When the initial storms mature, cool downdrafts develop and move down the southern flanks of the mountains. These cool pools in turn initiate new
Figure 10. Thirty-year (1981–2010) average precipitation data for the months of June, July, and August over CO. Data from prism.oregonstate.edu/.

Hodanish et al. NWA Journal of Operational Meteorology 12 June 2019
ISSN 2325-6184, Vol. 7, No. 4 57
convection, which then produces additional downdrafts, and the process repeats itself as the convection propagates southward and down-valley. This motion of the lightning activity over the southwestern Colorado region can be seen in Vogt and Hodanish (2016, their Fig. 4). 3) WEST-CENTRAL AND NORTHWESTERN COLORADO
West-central and northwestern Colorado (Fig. 7) is defined as that part of Colorado bounded by the San Juan Mountains to the south and the Pikes Peak region/Front Range Mountains to the east. The west-central region consists of some of the higher mountain peaks in Colorado, especially those peaks along the Sawatch Mountain range (Fig. 1). Along this one range, 14 mountains exceed 4.3 km (14.0 kft). In contrast, the northwestern Colorado region is predominantly mesas and valleys, with the mesas typically reaching 3.0 km (10 kft). Annual CG lightning values across the lower elevations [<2.3 km (7.5 kft)] of the west-central and northwestern Colorado region are typically <1.5 fl km–2 (Fig. 2), while higher elevations experience flash rates in the 1.5–2.5 fl km–2 range. The overall low flash amounts across west-central and northwestern Colorado are likely due to the blocking of adequate moisture by the San Juan Mountains to the south and the Front Range mountains/Pikes Peak region to the east. Low-level moisture on the eastern plains is blocked by the Front Range Mountains along the mountains/plains interface, while the San Juan Mountains block most of the NAM moisture advecting up from the south. Some midlevel moisture does advect into this region during the monsoon season, increasing the CAPE over west-central and northwestern Colorado (Fig. 5i,j); lightning amounts are highest during the months of July and August (Fig. 3i,j). The Sawatch Mountain Range, with its string of the tallest peaks in Colorado, experiences minimal lightning activity (Fig. 2). Examination of the monthly CAPE plots during the spring and NAM seasons (Fig. 5g–k) shows a minimum in CAPE in and around this mountain range. This characteristic reinforces the notion that lightning activity is not always denser in the highest peaks. If instability is not present, lightning activity will be minimal, even if favorable lift is available. Earth’s surface topographic features are distinguishable from CG lightning data alone.
Documenting fine-scale linkages between lightning and Earth’s topographic features can help the forecasters in mountainous regions predict relative concentrations of CG lightning activity—valley floor (concave in cross section, typically populated) versus adjacent valley wall (convex in cross section, generally less populated). In Colorado, Pitkin County (Fig. 2) clearly illustrates these ties between lightning and landscape; numerous low CG flash density river valleys run from southeast to northwest and eventually merge with the Colorado River.
5. Summary
Twenty-one years of CG lightning flash data were analyzed over Colorado. Lightning over the state is primarily a warm-season phenomenon with 99.6% of the CG flashes occurring from 1 April through 31 October. Most of the activity from April through June occurs along the mountains/plains interface extending eastward onto the plains. As the NAM becomes active starting in early July, CG activity increases statewide, with the overall lightning activity peaking late July through early August. By mid-August, lightning activity starts to decrease across the state, with a sharp drop in late August. By early October, the statewide lightning activity becomes negligible. A major finding in this study is how the DCVZ plays a significant role in the lightning distributions over the greater northeastern Colorado region. The role of the DCVZ in severe weather activity is well documented (e.g., Szoke et al. 1984, 2006; Brady and Szoke 1989; Wakimoto and Wilson 1989; Szoke and Augustine 1990); however, the role of this circulation in lightning distributions is not. Locations where DCVZ wind flow is divergent show a noticeable decrease in lightning activity whereas areas where the flow is convergent show a noticeable increase in flash rates. The DCVZ’s influence on flash rates extends across the northeastern plains, the east–west ridges (Cheyenne Ridge and Palmer Divide), and the east-facing slopes of the Front Range Mountains. The NAM affects the lightning distributions across the state in July and August. The midlevel moisture and instability associated with the monsoon circulation begins to move into the state from the southwest by early July and lasts into mid-August. Prior to the NAM affecting the region (e.g., June flash density map, Fig. 3h), lightning activity over the interior mountains and valleys is generally between 0.1 and 0.5 fl km–2, while

from the mountains/plains interface eastward across the plains the lightning activity ranges from 0.5 to 1.0 fl km–2. The lack of lightning over the interior mountains and valleys prior to the onset of the NAM is due to the low-level moisture (and associated instability) being blocked from reaching the interior mountains and valleys. As the midlevel moisture associated with the NAM moves into the state in July and August (Fig. 3i,j), lightning activity over the mountains and interior valleys ranges between 0.5 and 1.0 fl km–2 (with locally higher amounts over the southern San Juan Mountains), while over the mountains/plains interface eastward onto the plains the lightning activity ranges between 0.8 and 2.0 fl km–2 (with locally higher amounts in the Pikes Peak region and Palmer Divide). With the waning NAM flow in September, lightning activity decreases to 0.1–0.7 fl km–2 statewide. Regions of Colorado blocked by higher terrain show overall minima in lightning activity. The SLV shows the most noticeable minimum in CG activity, as this high valley is nearly surrounded by >3.7 km (>12.0 kft) mountains. Similarly, the Sawatch Range shows a noticeable minimum in lightning activity despite its 14 mountains that are >4.3 km (>14.0 kft) in elevation. The Sawatch Range is blocked by other surrounding mountain ranges, including the San Juan, Sangre de Cristo, and Front Range. While in-depth analyses of flow patterns conducive to convective development have been performed for the greater northeastern Colorado region, almost no attention has been devoted to other regions. Though there is a higher population in the greater northeastern Colorado region, the potential for lightning to cause wildfires or threaten human health and safety in the other regions should serve as strong justification of similar in-depth analyses elsewhere within the state.
6. Conclusion
The complex warm-season atmospheric CG lightning dynamics operating across Colorado are indeed directly tied to the state’s unique topographic configuration. The interior continental setting, mountain ranges and ridges and their alignments, gently sloping piedmont surfaces, moisture sources, meso- to micro-scale circulations, and a host of multiscale mountain meteorology-driven conditions create a specific CG lightning climatology for the region. However, the various physiographic configurations discussed region-by-region in this paper are not unique. As examples,
topographic ridges separated by hundreds of meters of relief are found in the Black Hills of South Dakota, the Edwards Plateau region of Texas, the Ozark Plateau region of Arkansas and Missouri, and dozens of locales in the intermountain west. North–south aligned mountain ranges, in some cases separated by vast basins, are found in Utah, Nevada, California, and Oregon. Outside of the United States, mountainous landscapes, such as the Himalayan–Tibetan region and parts of Europe and China, like Colorado, exhibit mountains/plains interfaces, interior mountains, and high valleys. The transposition of lightning climatology information from Colorado to faraway places can lead forecasters to consider thunderstorm geographies more critically. Some forecasters can apply this knowledge to think more broadly about how adjacent physiographic regions might influence one other. Others can apply this knowledge to attune their understanding of local, nuanced orographic processes at the individual valley or mountaintop scale. Furthermore, a better understanding of lightning climatologies brings a robust context to studies related to wildland fire initiation zones (Read et al. 2018), wildland fire firefighting resource placement (Arienti et al. 2006), outdoor recreation risk management (Cooper and Holle 2019), site selection for wind turbines (Smorgonskiy et al. 2017) and solar arrays (Christodoulou et al. 2016), the calibration of the GOES-16 Geostationary Lightning Mapper (GLM, Rudlosky et al. 2017), and understanding vertical atmospheric mountain system connections with troposphere and mesosphere wave patterns (Portele et al. 2018). In sum, an awareness of the complexities of lightning activity in topographically diverse places enables forecasters to connect higher and lower levels of thunderstorm activity to local and regional terrain features. This heightened awareness supports making precise thunderstorm forecasts and incorporates new ways of understanding and explaining thunderstorm geography. Last, the awareness that terrain generally dominates lightning patterns across a landscape underscores the value of a forecaster’s familiarity with the physical geography of WFO areas of responsibility.
Acknowledgments: The authors thank Vaisala for providing the CG flash data and the PRISM Group for providing precipitation data. We thank Jennifer Stark (Meteorologist-in-Charge, NWS Pueblo) and NWS Central Region Headquarters for their support, with a special thanks to Ron Holle for many years of valuable input. We also thank the three anonymous reviewers for
Hodanish et al. NWA Journal of Operational Meteorology 12 June 2019
ISSN 2325-6184, Vol. 7, No. 4 58

their helpful comments and suggestions.
_____________________
REFERENCES
Abbs, D. J., and R. A. Pielke, 1986: Thermally forced surface flow and convergence patterns over northeast Colorado. Mon. Wea. Rev., 114, 2281–2296, Crossref.Adams, D. K., and A. C. Comrie, 1997: The North American monsoon. Bull. Amer. Meteor. Soc., 10, 2197–2213, Crossref.Arienti, M. C., S. G. Cumming, and S. Boutin, 2006: Empirical models of forest fire initial attack success probabilities: The effects of fuels, anthropogenic linear features, fire weather, and management. Can. J. For. Res., 36, 3155– 3166, Crossref.Banta, R. M., 1984: Daytime boundary-layer evolution over mountainous terrain. Part 1: Observations of the dry circulations. Mon. Wea. Rev., 112, 340–356, Crossref.____, and C. B. Schaaf, 1987: Thunderstorm genesis zones in the Colorado Rocky Mountains as determined by traceback of geosynchronous satellite images. Mon. Wea. Rev., 115, 463–476, Crossref.Beran, D. W., and C. G. Little, 1979: PROFS: Prototype Regional Observing and Forecasting Service: From concept to implementation. Natl. Wea Dig., 4 (3) 2–5. [Available online at nwafiles.nwas.org/digest/ papers/1979/Vol04No3/1979v004no03-Beran-Little. pdf.]Boccippio, D. J., K. L. Cummins, H. J. Christian, and S. J. Goodman, 2000: Combined satellite- and surface-based estimation of the intracloud–cloud-to-ground lightning ratio over the continental United States. Mon. Wea. Rev., 129, 108–122, Crossref.Bonner, W. D., 1968: Climatology of the low level Jet. Mon. Wea. Rev., 96, 833–850, Crossref.Brady, R. H., and E. J. Szoke, 1989: A case study of nonmesocyclone tornado development in northeast Colorado: Similarities to waterspout formation. Mon. Wea. Rev., 117, 843–856, Crossref.Buck, T. L., A. Nag, M. J. Murphy, 2014: Improved cloud-to- ground and intracloud lightning detection with the LS7002 Advanced Total Lightning sensor. TECO-2014– WMO Tech. Conf. on Meteorological and Environmental Instruments and Methods of Observation, St. Petersburg, Russia, World Meteorological Organization, 8 pp. [Available online at www.wmo.int/pages/ prog/www/IMOP/publications/IOM-116_TECO-2014/ Session%201/P1_9_Buck_TotalLightningSensor.pdf.]Christodoulou, C. A., L. Ekonomou, I. F. Gonos, and N. P. Papanikolaou, 2016: Lightning protection of PV systems. Energy Syst., 7, 469–482, Crossref.
Coniglio, M. C., H. E. Brooks, S. J. Weiss, and S. F. Corfidi, 2007: Forecasting the maintenance of quasi-linear mesoscale convective systems. Wea. Forecasting, 22, 556–570, Crossref.Cooper, M. A., and R. L. Holle, 2019: Reducing Lightning Injuries Worldwide. Springer Natural Hazards, 233 pp, Crossref.Cummins, K. L., and M. J. Murphy, 2009: An overview of lightning locating systems: History, techniques, and data uses, with an in-depth look at the U.S. NLDN. IEEE Trans. Electromagn. Compat., 51, 499–518, Crossref.____, ____, E. A. Bardo, W. L. Hiscox, R. B. Pyle, and A. E. Pifer, 1998: A combined TOA/MDF technology upgrade of the U.S. National Lightning Detection Network. J. Geophys. Res., 103, 9035–9044, Crossref.Doswell, C. A., 1980: Synoptic-scale environments associated with High Plains severe thunderstorms. Bull. Amer. Meteor. Soc., 61, 1388–1400, Crossref.Douglas, M. W., R. A. Maddox, K. Howard, and S. Reyes, 1993: The Mexican monsoon. J. Climate, 6, 1665–1677, Crossref.Fuchs, B. R., E. C. Bruning, S. A. Rutledge, L. D. Carey, P. R. Krehbiel, and W. Rison, 2016: Climatological analyses of LMA data with an open-source lightning flash-clustering algorithm. J. Geophys. Res. Atmos., 121, 8625–8648, Crossref.Hales, J. E., Jr., 1974: Southwestern United States summer monsoon source—Gulf of Mexico or Pacific Ocean? J. Appl. Meteor., 13, 331–342, Crossref.Holle, R. L., and M. J. Murphy, 2015: Lightning in the North American monsoon: An exploratory climatology. Mon. Wea. Rev., 143, 1970–1977, Crossref.Klitch, M. A., J. F. Weaver, F. P. Kelley, and T. H. Vonder Haar, 1985: Convective cloud climatologies constructed from satellite imagery. Mon. Wea. Rev., 113, 326–337, Crossref.Maddox, R. A., D. M. Rodgers, W. Deitrich, and D. L. Bartels, 1981: Meteorological settings associated with significant convective storms in Colorado. NOAA Tech. Memo., ERL OWRM-4, U.S. Dept. of Commerce, Washington, DC, 75 pp.Mach, D. M., D. R. MacGorman, W. D. Rust, and R. T. Arnold, 1986: Site errors and detection efficiency in a magnetic direction-finder network for locating lightning strikes to ground. J. Atmos. Oceanic Technol., 3, 67–74, Crossref.Mesinger, F., and Coauthors, 2006: North American Regional Reanalysis. Bull. Amer. Meteor. Soc., 87, 343–360, Crossref.Nachamkin, J. E., R. L. McAnelly, and W. R. Cotton, 2000: Interactions between a developing mesoscale convective system and its environment. Part 1: Observational analysis. Mon. Wea. Rev., 128, 1205–1224, Crossref.
Hodanish et al. NWA Journal of Operational Meteorology 12 June 2019
ISSN 2325-6184, Vol. 7, No. 4 59

Orville, R. E., 1991: Lightning ground flash density in the contiguous United States—1989. Mon. Wea. Rev., 119, 573–577, Crossref.____, 2008, Development of the National Lightning Detection Network. Bull. Amer. Meteor. Soc., 89, 180–190, Crossref.____, G. R. Huffines, W. R. Burrows, and K. L. Cummins, 2011: The North American Lightning Detection Network (NALDN)—Analysis of flash data: 2001–09 Mon. Wea. Rev., 139, 1305–1322, Crossref.Peroutka, M. R., M. Graf, M. G. Oberfield, G. Trojan, and B. Li, 2004: The Aviation Forecast Preparation System of the National Weather Service. Preprints, 11th Conf. on Aviation, Range, and Aerospace Meteorology, Hyannis, MA, Amer. Meteor. Soc., P3.2. [Available online at ams. c o n f e x . c o m / a m s / 11 a r a m 2 2 s l s / w e b p r o g r a m / Paper81312.html.]Portele, T. C., A. Dörnbrack, J. S. Wagner, S. Gisinger, B. Ehard, P.-D. Pautet, and M. Rapp, 2018: Mountain- wave propagation under transient tropospheric forcing: A DEEPWAVE case study. Mon. Wea. Rev., 146, 1861– 1888, Crossref.Rakov, V. A., and G. R. Huffines, 2003: Return-stroke multiplicity of negative cloud-to-ground lightning flashes. J. Appl. Meteor., 42, 1455–1462, Crossref.Read, N., T. J. Duff, and P. G. Taylor, 2018: A lightning- caused wildfire ignition forecasting model for operational use. Agric. For. Meteor., 253–254, 233–246, Crossref.Reynolds, D. W., 1983: Prototype workstation for mesoscale forecasting. Bull. Amer. Meteor. Soc., 64, 264–273, Crossref.Rudlosky, S. D., and H. E. Fuelberg, 2010: Pre- and postupgrade distributions of NLDN reported cloud-to- ground lightning characteristics in the contiguous United States. Mon. Wea. Rev., 138, 3623–3633, Crossref. ____, S. J. Goodman, W. J. Koshak, R. J. Blakeslee, D. E. Buechler, D. M. Mach, and M. Bateman, 2017: Characterizing the GOES-R (GOES-16) Geostationary Lightning Mapper (GLM) on-orbit performance. In Geoscience and Remote Sensing Symposium (IGARSS), 2017 IEEE International (pp. 279–282). [Available online at ieeexplore.ieee.org/document/8126949.]Schaaf, C. B., J. Wurman, and R. M. Banta, 1988: Thunderstorm-producing terrain features. Bull Amer. Meteor. Soc., 69, 272–277, Crossref.Smorgonskiy, A., M. Rubinstein, F. Rachidi, and G. Diendorfer, 2017: Prediction of lightning incidence to tall structures before construction. Preprints, Fourth Int. Symp. on Winter Lightning (ISWL2017), Joetsu, Japan.Szoke, E. J., and J. A. Augustine, 1990: A decade of tornado occurrences associated with a surface mesoscale flow feature—The Denver Cyclone. Preprints, 16th Conf. on Severe Local Storms, Kananaskis Park, Alberta, Canada, Amer. Meteor. Soc., 554–559.
____, M. L. Weisman, J. M. Brown, F. Caracena, and T. W. Schlatter, 1984: A subsynoptic analysis of the Denver tornadoes of 3 June 1981. Mon. Wea. Rev., 112, 790– 808, Crossref.____, J., D. Barjenbruch, R. Glancy, and R. Kleyla, 2006: The Denver Cyclone and tornadoes 25 years later: The continued challenge of predicting nonsupercell tornadoes. Preprints, 23rd Conf. on Severe Local Storms., St Louis, MO. Amer. Meteor. Soc., P8.7. [Available online at ams.confex.com/ams/pdfpapers/115160.pdf.]Toth, J. J., and R. H. Johnson, 1985: Summer surface flow characteristics over northeast Colorado. Mon. Wea. Rev. 113, 1458–1469, Crossref.Valine, W. C., and E. P. Krider, 2002. Statistics and characteristics of cloud-to-ground lightning with multiple ground contacts. J. Geophys. Res., 107, NO. D20, 4441, Crossref.Vogt, B. J., and S. J. Hodanish, 2014: A high-resolution lightning map of the state of Colorado. Mon. Wea. Rev., 142, 2353–2360, Crossref.____, and ____, 2016: A geographical analysis of warm season lightning/landscape interactions across Colorado, USA. Appl. Geogr., 75, 93–103, Crossref.Wakimoto, R. M., and J. W. Wilson, 1989: Non-supercell tornadoes. Mon. Wea. Rev., 117, 1113–1140, Crossref.Wetzel, P. J., W. R. Cotton, and R. L. McAnelly, 1983: A long-lived mesoscale convective complex. Part II: Evolution and structure of the mature complex. Mon. Wea. Rev., 111, 1919–1937, Crossref.Wilczak, J. M., and J. W. Glendening, 1988: Observations and mixed-layer modeling of a terrain-induced mesoscale gyre: The Denver Cyclone. Mon. Wea. Rev., 116, 2688– 2711, Crossref.
Hodanish et al. NWA Journal of Operational Meteorology 12 June 2019
ISSN 2325-6184, Vol. 7, No. 4 60