2017 back-to-school survey - deloitte us · 2017 back-to-school survey 23 about the survey this...
TRANSCRIPT

2017 back-to-school surveyTesting a new curriculum

2017 back-to-school surveyCopyright © 2017 Deloitte LLP. All rights reserved. 2
Back-to-school (B2S) shopping season accounts for about 50% of annual school-related spend and touches about one-quarter ofU.S. households
Source: U.S. Current Population Survey (CPS) 2016, Deloitte surveyNote: Sample size (N) = 1,200
B2S is the second biggest shopping season and involves…
53 Million children $27 Billion
50% of school related spend29 Million households
2017 back-to-school surveyCopyright © 2017 Deloitte LLP. All rights reserved. 3
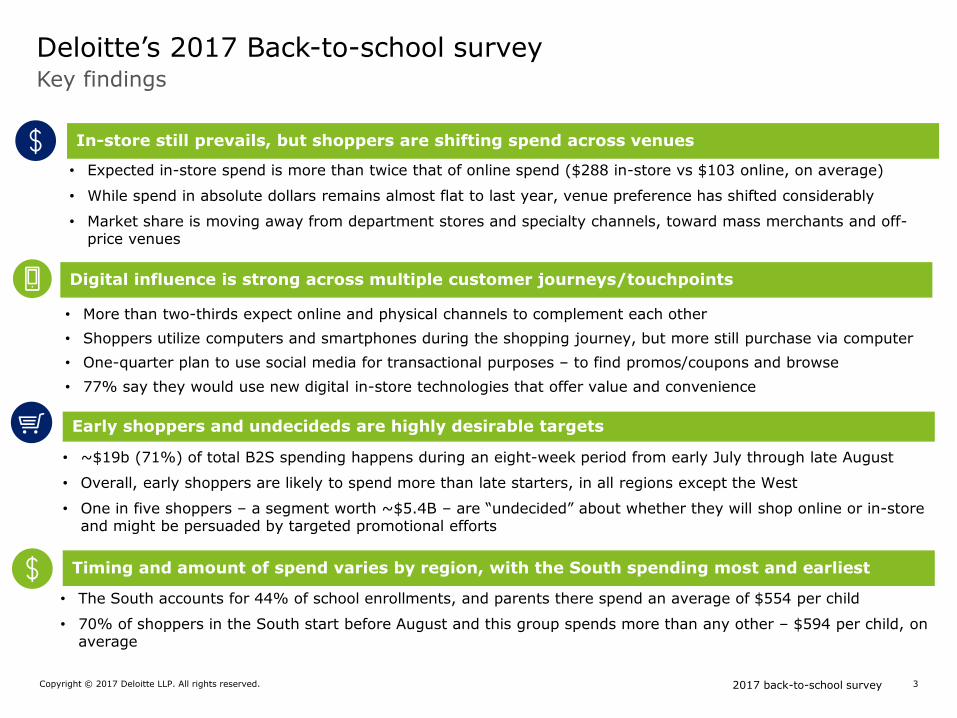
Key findings
Deloitte’s 2017 Back-to-school survey
In-store still prevails, but shoppers are shifting spend across venues
Digital influence is strong across multiple customer journeys/touchpoints
Early shoppers and undecideds are highly desirable targets
• Expected in-store spend is more than twice that of online spend ($288 in-store vs $103 online, on average)
• While spend in absolute dollars remains almost flat to last year, venue preference has shifted considerably
• Market share is moving away from department stores and specialty channels, toward mass merchants and off-price venues
• More than two-thirds expect online and physical channels to complement each other
• Shoppers utilize computers and smartphones during the shopping journey, but more still purchase via computer
• One-quarter plan to use social media for transactional purposes – to find promos/coupons and browse
• 77% say they would use new digital in-store technologies that offer value and convenience
• ~$19b (71%) of total B2S spending happens during an eight-week period from early July through late August
• Overall, early shoppers are likely to spend more than late starters, in all regions except the West
• One in five shoppers – a segment worth ~$5.4B – are “undecided” about whether they will shop online or in-store and might be persuaded by targeted promotional efforts
Timing and amount of spend varies by region, with the South spending most and earliest
• The South accounts for 44% of school enrollments, and parents there spend an average of $554 per child
• 70% of shoppers in the South start before August and this group spends more than any other – $594 per child, on average

2017 back-to-school surveyCopyright © 2017 Deloitte LLP. All rights reserved. 4
Average B2S spend remains flat at $501 in 2017 compared to $488 in 2016
National Avg. B2S spend:
$501 Northeast
West
South
Midwest
18% $455
% of total B2S spend Avg. spend
20% $443
44% $554
18% $513
South region drives B2S season with the highest average spend
Source: Deloitte surveyNote: Average spend based on shoppers from each region – South (n = 474), Northeast (n = 206), Midwest (n = 275), and West (n = 245).

2017 back-to-school surveyCopyright © 2017 Deloitte LLP. All rights reserved. 5
Although, B2S spend is expected to remain flat, allocations among categories will shift
Source: Deloitte surveyNote: Sample size (includes only respondents who will purchase the above mentioned category or item) * Spending share of ‘other’ category not shown.
% - Share of total spend
Clothing & accessories
School supplies
14%
9%
55%
20%
2016
18%
11%
45%
24%
$488 $501
Sp
en
din
g s
hare
by c
ate
go
ry*
Average spend
Electronic gadgets
Computers & hardware
10%
4%
4%
2%
Average spend
by category
2017
$284
$104
$307
$254
2016
Average spend
by category
$239
$122
$456
$286

2017 back-to-school surveyCopyright © 2017 Deloitte LLP. All rights reserved. 6
Mass merchants and off-price are the big winners while traditional department stores, specialty and office supply stores plummet
“Which type of retailer(s) do you plan to visit for your B2S shopping?”
Source: Deloitte surveyNote: Sample size (N) = 1,200; multi-select question+percent represents increase of respondents preferences change from 2016/2017
3%
5%
5%
8%
10%
12%
13%
17%
17%
18%
24%
24%
28%
28%
33%
36%
40%
81%
Bookstores (On-campus)
Catalogs
Retailer’s mobile apps
Specialty clothing stores
Bookstores
Home electronics stores
Supermarkets
Consignment shops/thrift stores
Retailer’s websites
Drug stores
Fast fashion apparel retailers
Warehouse membership clubs
Traditional department stores
Off-price stores
Office supply/technology stores
Online only retailers
Dollar stores
Mass merchants +24%
-9%
-26%
-17%
+18%
-8%

2017 back-to-school surveyCopyright © 2017 Deloitte LLP. All rights reserved. 7
While clothing and school supplies dominate B2S lists, computers & hardware will garner the highest average spend
Category spend planned for 2017 B2S season
Source: Deloitte surveyNote: Sample size (N) = 1,200; Spending on ‘voice and mobile data plans’, ‘digital subscription’, and ‘other’ are excluded; average spend includes only respondents who will purchase the above mentioned category or item
Categories
97% plan to buy
Clothing & accessories
Average spend $284
98% plan to buy
School supplies
Average spend $104*
23% plan to buy
Computers & hardware
Average spend $307
18% plan to buy
Electronic gadgets
Average spend $254
*30% plan to purchase pre-configured school supply kits

2017 back-to-school surveyCopyright © 2017 Deloitte LLP. All rights reserved. 8
$680 $695
$574 $504
$628
$493
$369
$486 $421 $448
South West Northeast Midwest Overall
Shoppers who plan to buy 'pre-configured' kits Shoppers who DO NOT plan to buy 'pre-configured' kits
On an average, they will spend 40% more than other shoppers ($628)
Shoppers who buy “pre-configured” kits likely to outspend others
Average B2S shopping spend by region
Source: Deloitte surveyNote: Sample size (N) = 1,200; Sample size for each region – South (n = 474), Northeast (n = 206), Midwest (n = 275), and West (n = 245).
2017 back-to-school surveyCopyright © 2017 Deloitte LLP. All rights reserved. 9
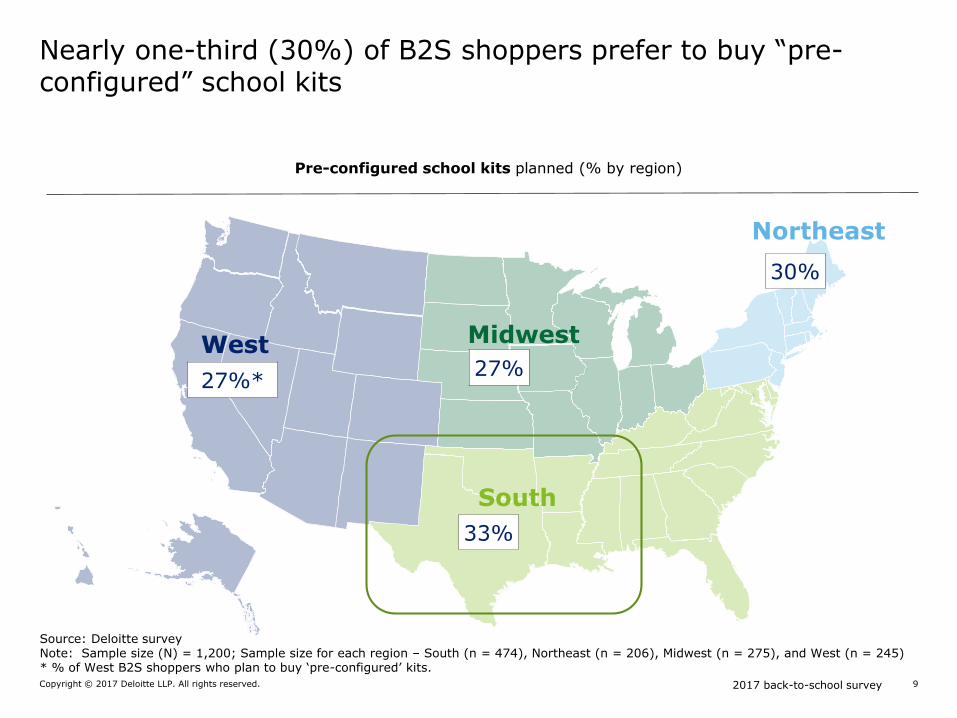
Nearly one-third (30%) of B2S shoppers prefer to buy “pre-configured” school kits
Northeast
West
South
Midwest
27%*27%
33%
30%
Source: Deloitte surveyNote: Sample size (N) = 1,200; Sample size for each region – South (n = 474), Northeast (n = 206), Midwest (n = 275), and West (n = 245)* % of West B2S shoppers who plan to buy ‘pre-configured’ kits.
Pre-configured school kits planned (% by region)

2017 back-to-school surveyCopyright © 2017 Deloitte LLP. All rights reserved. 10
Spending breakdown by category
Average spend (by category buyer) planned for 2017 B2S season
Source: Deloitte surveyNote: Sample size (includes only respondents who will purchase the above mentioned category or item)
Categories Items
$47
$68
$150
$174
$222
$64
$85
$147
$197
$100
$149
$428
Backpack/book bag/lunch box
accessories
School supplies
Wearable technology
Tablet, e-reader
Cell phone/smart phone
Jewelry/handbag/accessories
Gym clothes and shoes
School uniform and shoes
Clothes/shoes - casual wear
Computer software/small accessories
Printer or other computer hardware
Computer
$104
School supplies
Clothing & accessories
$284
Electronic gadgets
$254
Computers & hardware
$307

2017 back-to-school surveyCopyright © 2017 Deloitte LLP. All rights reserved. 11
Online most often the channel of choice for electronics and computers
In-store dominates B2S shopping channel, but undecideds present a huge opportunity
Source: Deloitte surveyNote: Sample size (N) = 1,200
63%17%
20%
Clothing & accessoriesSchool supplies
Computers & hardwareElectronic gadgets
40%
31%
29% 38%
33%
30%
66%
14%
20%
$284
$254 $307
$104
Average consumer spend and channel split within each category
In-store Online Undecided (In-store/Online)
n = 211 n = 270
n = 1,162n = 1,178
*Undecided (In-store/Online)
Avg. B2S spending by channel
$111 (22%)
Undecided*
?
$103 (21%)
Online
$288 (57%)
In-store
2017 back-to-school surveyCopyright © 2017 Deloitte LLP. All rights reserved. 12
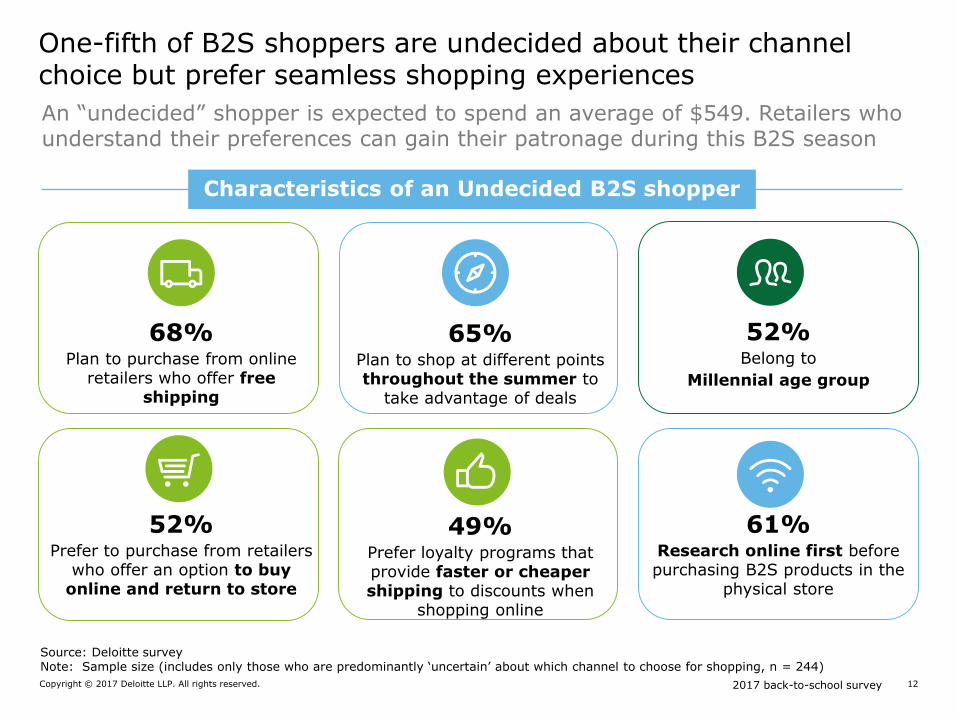
One-fifth of B2S shoppers are undecided about their channel choice but prefer seamless shopping experiences
An “undecided” shopper is expected to spend an average of $549. Retailers who understand their preferences can gain their patronage during this B2S season
68% Plan to purchase from online
retailers who offer free shipping
65% Plan to shop at different points throughout the summer to
take advantage of deals
52%Belong to
Millennial age group
52% Prefer to purchase from retailers
who offer an option to buy online and return to store
49% Prefer loyalty programs that provide faster or cheaper shipping to discounts when
shopping online
61% Research online first before purchasing B2S products in the
physical store
Source: Deloitte surveyNote: Sample size (includes only those who are predominantly ‘uncertain’ about which channel to choose for shopping, n = 244)
Characteristics of an Undecided B2S shopper

2017 back-to-school surveyCopyright © 2017 Deloitte LLP. All rights reserved. 13
Early shoppers are expected to spend more than those who wait
Source: Deloitte surveyNote: Sample size (N) = 1,200; “When are you likely to begin your B2S shopping?”
B2S shoppers by starting period (%)
July SeptemberAugustEarlier than July
11%
Earl
y in J
uly
19%
Late
r in
July
30%
Earl
y in A
ugust
32%
Late
r in
August
8%
1%
60% will begin shopping before August
(Average spend = $532)
$670 $571 $458 $483 $367 $417Average
Spend
Shoppers who start before August are likely to spend 16% more than late starters
40% will begin shopping after July
(Average spend = $458)

2017 back-to-school surveyCopyright © 2017 Deloitte LLP. All rights reserved. 14
61%
40%
70%
53%
60
%
39% 6
0%
30% 47%
40
%
Midwest Northeast South West Overall US
% shoppers starting earlier than August % shoppers starting in August or later
Shoppers who start early are likely to spend more with the exception of those in the West
Early shoppers are expected to spend more than those who wait
B2S shopper by regional start
$469
$403
$458
$536
$596
$445
$467
$497
$458
$532
---- Avg. spend of shoppers starting before August ---- Avg. spend of shoppers starting in August or later

2017 back-to-school surveyCopyright © 2017 Deloitte LLP. All rights reserved. 15
$0.4 $0.7 $0.6
$1.6
$0.5 $0.03
$0.9 $2.0 $1.6 $1.0$0.2
$1.6 $4.3 $1.0
$0.2 $0.2
$3.3 $4.1
$0.7$0.1
$1.0
$0.5$0.1
~$19b (71%) of expected B2S spend happens during an eight-week shopping window between early July and late August
Earl
ier
than J
ul
Early
Ju
ly
Late
Ju
l
Early
A
ug
Late
Aug
Sept
Source: Deloitte surveyNote: Sample size (N) = 1,200 Share of total spend ($ Bn) Early – First 2 weeks Late – Last 2 weeks
Earlier than Jul
Early Jul Late Jul Early Aug Late Aug Sept Oct
Finishing Period
Sta
rtin
g P
eriod
Spending spread ($ Bn): B2S shopping starting and finishing period

2017 back-to-school surveyCopyright © 2017 Deloitte LLP. All rights reserved. 16
Device % of total shoppers
Usage
B2S shoppers are more likely to make online purchases via desktop/laptopBut mobile is not far behind
Source: Deloitte surveyNote: Sample size for devices (includes only respondents who selected each of the devices); multi select question
43%
44%
45%
63%
64%
Make a purchase
Get product information
Compare products to similar products
Get price information
Access a retailer's website
48%
53%
60%
64%
76%
Compare similar products online
Collect discounts, coupons, sale…
Make a purchase
Get price information
Access a retailer's website
44%
45%
58%
61%
61%
Access a mobile shopping app
Make a purchase
Access a retailer's website
Get price information
Collect discounts, coupons, sale…
22%
49%
Mo
bil
eTab
let
Deskto
p/
lap
top
57%
n = 683
n = 590
n = 269

2017 back-to-school surveyCopyright © 2017 Deloitte LLP. All rights reserved. 17
Customers expect online and physical shopping experiences to be complementary
63%
56%
49%
44%
38%
31%
Purchase from online retailers who offer free shipping
Research online before purchasing products in thephysical store
Prefer to purchase from retailers offering buy online andreturn in-store option
When shopping online, I prefer loyalty programs thatprovide faster or cheaper shipping than product
discounts
Prefer to purchase from retailers offering buy online andpick-up in-store option
I will shop in stores less this season because buy onlineand pick-up in-store option is more convenient
“Please indicate your level of agreement with the following statements (% who agree or somewhat agree)”
Source: Deloitte surveyNote: Sample size (N) = 1,200

2017 back-to-school surveyCopyright © 2017 Deloitte LLP. All rights reserved. 18
A majority of shoppers will increase their B2S spending across channels if offered a sales tax reduction/holiday
Impact of sales tax reduction/holiday on spending
If sales tax reduction/holiday is not automatically included
I would NOT complete my shopping and check out*
44%
Source: Deloitte survey* “If an online purchase did NOT automatically include the sales tax reduction/holiday, I would NOT complete shopping cart checkout” ** “If an in-store purchase did NOT automatically include the sales tax reduction/holiday, I would demand to speak to a supervisor/manager”
% who agree or somewhat agree
Shoppers will also take affirmative actions to avail sales tax reductions
I would increase my online spending due to a sales tax
reduction/holiday
44%
40%
I would demand to speak to a supervisor**
I would increase my in-store spending due to a sales tax
reduction/holiday
53%
% who agree or somewhat agree
2017 back-to-school surveyCopyright © 2017 Deloitte LLP. All rights reserved. 19
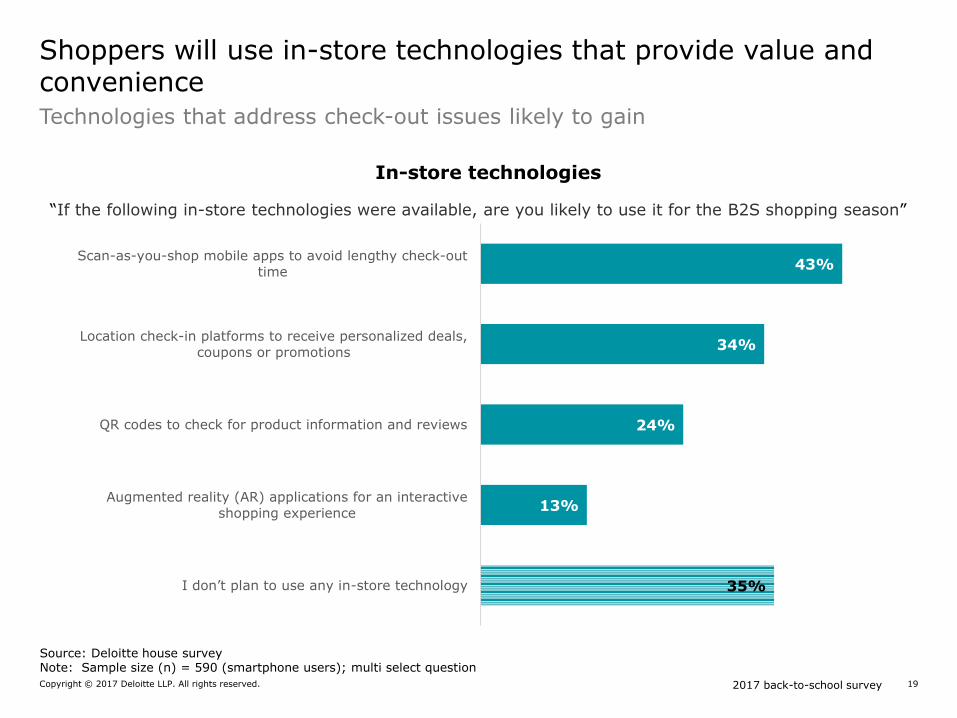
Shoppers will use in-store technologies that provide value and convenience
43%
34%
24%
13%
35%
Scan-as-you-shop mobile apps to avoid lengthy check-out
time
Location check-in platforms to receive personalized deals,
coupons or promotions
QR codes to check for product information and reviews
Augmented reality (AR) applications for an interactive
shopping experience
I don’t plan to use any in-store technology
“If the following in-store technologies were available, are you likely to use it for the B2S shopping season”
Source: Deloitte house surveyNote: Sample size (n) = 590 (smartphone users); multi select question
In-store technologies
Technologies that address check-out issues likely to gain

2017 back-to-school surveyCopyright © 2017 Deloitte LLP. All rights reserved. 20
One fourth of B2S shoppers cite usage of social media for transactional purposes
“Do you plan to use social media sites to assist in your
B2S shopping?*”
11%
13%
14%
27%
40%
43%
64%
75%
To post to or view virtual imageboards
To post comments, reviews orfeedback
To watch a retail/product video
To visit retailers' pages on socialnetworking sites
To read reviews/recommendations
To browse products
To receive a coupon
To view promotions/ads
“With regard to your B2S shopping, how do you plan to use social media sites? #”
Source: Deloitte survey Notes: *Sample size (shoppers who use at least one digital device, n = 978 #Multi-select question (n = 260)
Most will use social to find promotions, receive coupons, and browse products
27%

2017 back-to-school surveyCopyright © 2017 Deloitte LLP. All rights reserved. 21
Shopping habits vary by spender type
1% 3%
20%
2% 3%
12%
62%67%
49%
35%26%
16%
0% 1% 3%
Low-spender
(<=$250)
Medium-spender
($250 to $475)
High-spender
(>$475)Computer & hardware Electronic gadgets Clothes and accessories School supplies Others
Budget allocation by Category (%)
12% 16%24%
68%63%
54%
20% 21% 23%
Low-spender
(<=$250)
Medium-spender
($250 to $475)
High-spender
(> $475)
Online Instore Uncertain
Budget allocation by Shopping channel (%)
High-spenders are more likely to shop for computers and gadgets and opt for online channels compared to other spenders
Source: Deloitte survey

2017 back-to-school surveyCopyright © 2017 Deloitte LLP. All rights reserved. 22
Payment type varies by household income
57%
48%
42%
4%
3%
Debit Card
Credit Card
Cash/Check
Gift Card
Digital
payment
“Which of the following payment methods will you likely use for your B2S purchases?”
Source: Deloitte in-house surveyNote: Sample size (N) = 1,200; Multi-select question
46
% 53
% 63
%
57
%
53
%
42
%
36
%
32
%
49
%
4%
5%
3%
1%
2% 4%
Baby Boomers GenXers Millennials
66
%
66
%
68
%
53
%
37
%
21
% 35
% 48
% 57
%
74
%
61
%
52
%
44
%
31
%
22
%
5%
5%
3% 6%
3%
3%
2%
3%
3%
3%
<$25,000 $25,000 - $49,999 $50,000 - $74,999 $75,000 – 99,999 $100,000+
Debit card Credit card Cash/check Gift card Digital payment
Overall Generation
Household income
Digital payment penetration remains low

2017 back-to-school surveyCopyright © 2017 Deloitte LLP. All rights reserved. 23
About the survey
This annual Deloitte survey was conducted online using an independent research panel between May 31 and June 6, 2017. The survey polled a sample of 1,200 parents of school-aged children and has a margin of error for the entire sample of plus or minus three percentage points.
All respondents had at least one child attending school in grades K – 12 this fall.
This publication contains general information only and Deloitte is not, by means of this publication, rendering accounting, business, financial, investment, legal, tax, or other professional advice or services. This publication is not a substitute for such professional advice or services, nor should it be used as a basis for any decision or action that may affect your business. Before making any decision or taking any action that may affect your business, you should consult a qualified professional advisor. Deloitte shall not be responsible for any loss sustained by any person who relies on this publication.
About Deloitte
Deloitte refers to one or more of Deloitte Touche Tohmatsu Limited, a UK private company limited by guarantee (“DTTL”), its network of member firms, and their related entities. DTTL and each of its member firms are legally separate and independent entities. DTTL (also referred to as “Deloitte Global”) does not provide services to clients. In the United States, Deloitte refers to one or more of the US member firms of DTTL, their related entities that operate using the “Deloitte” name in the United States and their respective affiliates. Certain services may not be available to attest clients under the rules and regulations of public accounting. Please see www.deloitte.com/about to learn more about our global network of member firms.
Deloitte Center for Industry Insights
The Deloitte Center for Industry Insights is the research division of Deloitte LLP’s Consumer and Industrial Products practices. The center’s goal is to inform stakeholders of critical business issues, including emerging trends, challenges and opportunities. Using primary research and rigorous analysis, the center provides unique perspectives and seeks to be a trusted source for relevant, timely and reliable insights.