2016 social media impact report: b2c industry...
TRANSCRIPT

2016 Social Media Impact Report: B2C Industry Edition
1

EXECUTIVE SUMMARY
• Apparel
• Automakers
• Consumer Products
• Entertainment
• Food & Beverage
• Hospitality
• Insurance
• Restaurants
• Retailers
• Telco & Cable
For this report, we used the TrackMaven software
platform to analyze 10 months of content from 213
leading B2C brands on 5 key social networks to
understand the impact of social media for
B2C marketers.
The findings presented in this report show how industry-
disruptive brands find audiences on saturated social
networks, and how innovative social strategies keep
long-established brands on top. We also compare the
impact of different B2C industries on social media,
including detailed industry breakdowns with best
practices and recommendations. Learn which social networks drive the greatest impact for
your peers, and see how your brand measures up against
industry-specific benchmarks.
THE B2C INDUSTRIES ANALYZED IN THIS
REPORT INCLUDE:
We all learn from the best. So what could you learn from the best brands in your industry?
2

10
8
6
4
2
11
12
13
14
15
16
17
18
19
20
21
I. Executive Summary
II The B2C Social Media Landscape: How Do B2C Industries Stack Up On Social Media?
How Do B2C Industries Stack Up By Audience Size?
Where Do B2C Industries See Engagement?
III. Industry Case Studies
Apparel
Automakers
Consumer Products
Entertainment
Food & Beverage
Hospitality
Insurance
Retailers
Restaurants
Telco & Cable
IV. About the Data
3

THE B2C SOCIAL MEDIA LANDSCAPE:
HOW DO B2C INDUSTRIES STACK UP ON
SOCIAL MEDIA?
Which industries drive the greatest ROI from social
media? The graph to the right provides a high-level
answer for B2C marketers.
This graph plots the average follower growth and content
engagement — measured across Facebook, Twitter,
LinkedIn, Instagram, and Pinterest — by industry.
Industries with the greatest average follower growth per
brand score highest along the Y-axis. Industries with the
greatest engagement ratio — measured as the average
number of interactions per post per 1,000 followers —
score highest along the X-axis.
The size of the bubble reflects the median total audience
size for a brand in each industry on Facebook, Twitter,
LinkedIn, Instagram, and Pinterest combined.
Analysis based on social media accounts from
213 B2C brands across Facebook, Twitter,
Instagram, Pinterest, and LinkedIn from January
2015-October 2015.
0.5 1.0 1.5 2.0 2.5 3.0 3.5 4.0 4.5 5.0 5.50
5
10
15
20
25
30
35
40
45
50
Apparel
Automakers
Consumer Products
Food Beverage
Hospitality
Insurance
Restaurants
Retailers
Telco & Cable
Entertainment
FOLLOWER GROWTH VS. ENGAGEMENT RATIO FOR B2C INDUSTRIES:
JANUARY - OCTOBER 2015
ENGAGEMENT RATIO
(Average Interactions Per Post Per 1000 Followers)
% F
OL
LO
WE
R G
RO
WT
H
SOCIAL MEDIA AUDIENCE SIZE
4

B2C Social Media Landscape: Key Takeaways
APPAREL, INSURANCE, AND ENTERTAINMENT BRANDS ARE IN THE SOCIAL MEDIA SWEET SPOT. Brands in these industries have both
substantial audience growth and content
engagement on social media, indicating
highly impactful social content.
The Apparel industry’s 18.62% average
follower growth per brand is especially
impressive given the large overall
social following.
WHEN IT COMES TO SOCIAL ENGAGEMENT, AUTOMAKER BRANDS RULE THE ROAD. Across the B2C landscape, automakers
have the most engaged social media
audiences with an average engagement
ratio of 5.62. Insurance brands are a
distant second (2.43).
HOSPITALITY BRANDS ARE ADEPT AT GROWING THEIR AUDIENCES. Across the B2C landscape, brands in the
hospitality sector see the highest social
media audience growth, with 53.34%
follower growth on average, despite the
fact that their engagement level is just
middle-of-the-pack compared to the rest
of the B2C industries.
FOOD & BEVERAGE AUDIENCES ARE SHRINKING. Food & Beverage is the only industry with
negative follower growth across the period
of study (-0.06%). Across the industry,
large beverage brands — including Coca-
Cola and Dr. Pepper — experienced a
decline in Facebook followers across 2015.
This could be due to Facebook’s cleanup
of inactive accounts, as well as due to the
brewing backlash against big soda.
5

How Do B2C Industries Stack Up By Audience Size?The graph below displays the median social media audience size for B2C brands by
industry across Facebook, Twitter, LinkedIn, Pinterest, and Instagram.
Analysis based on social media accounts from 213 B2C brands across Facebook, Twitter, Instagram, Pinterest, and LinkedIn from January 2015-October 2015.
B2C SOCIAL MEDIA AUDIENCE SIZE BY INDUSTRY
MEDIAN AUDIENCE SIZE BY CHANNELBy millions of followers
0.0 0.5 1.0 1.5 2.0 2.5 3.0 3.5 4.0
Insurance
Entertainment
Hospitality
Retail
Food & Beverage
Telco & Cable
Consumer Products
Restaurants
Automakers
Apparel
6

Audience Size: Key Takeaways
FACEBOOK IS A FOLLOWER
FEEDING GROUND.
Across industries, B2C brands have
the largest median audience sizes on
Facebook. Among B2C industries,
restaurant brands have the largest
median Facebook audience (2.8 Million
Page Likes).
APPAREL BRANDS ARE SOCIAL
MEDIA BEHEMOTHS.
On Instagram, Twitter, and Pinterest,
Apparel brands sport the largest median
audience sizes (952K, 545K, and 18K,
respectively). Apparel brands also
sport the 3rd largest median Facebook
audience (2.3 million Fans).
APPAREL & AUTOMAKER BRANDS
CULTIVATE CHANNEL VARIETY.
While Facebook dominates the overall
social audience for the majority of B2C
industries, Apparel and Automaker brands
have significant audiences on a diverse
mix of channels.
CONSUMER PRODUCT AND BRANDS
CONNECT ON LINKEDIN.
At 748K, the median LinkedIn audience
for Consumer Products brands is 5X
greater than that of brands in all other B2C
industries.
7

Where Do B2C Industries See Engagement?
B2C SOCIAL MEDIA ENGAGEMENT RATIO BY INDUSTRYThe graph below displays the engagement ratio — measured as the average number of interactions per post per 1,000 followers — on Facebook, Twitter, Instagram, Pinterest, and LinkedIn. In other words, the bigger the bubble, the more engagement a brand in the industry gets on that social network.
Entertainment Food & Beverage
Apparel
0.2 0.4 0.7 0.6 0.30.6 0.4 1.0 0.2 0.2
0.4 1.2 2.1 1.2 0.91.0 2.6 1.9 0.8 0.4
0.4 2.6
28.3
3.5
13.6
3.8
20.2 9.3
0.2
75.5
1.1 1.1 0.3 1.8 1.00.8 0.6 1.4 0.5 0.5
13.7 40.6 15.2 14.9 34.7 20.8 48.6 15.0 17.9 9.0
Automakers Consumer Products
Hospitality Insurance Restaurants Retail Telco & Cable
8

B2C BRANDS FAIL TO ENGAGE ON TWITTER.
Industry-wide, B2C brands see minimal engagement
ratios on Twitter. Restaurant brands perform best on
Twitter, but still sport a measly engagement ratio of 1
interaction per post per 1,000 followers on average.
DESPITE MYRIAD FANS, FACEBOOK FLOUNDERS.
B2C brands have plentiful Facebook fans, but their
Facebook audiences engage minimally, likely due to
overall decreases in organic reach on the network. B2C
brands see a higher ratio of interactions on Instagram and
Pinterest.
INSTAGRAM IS THE B2C ENGAGEMENT WINNER.
With the exception of the Consumer Products and
Telcommunication & Cable industries, B2C brands see
the highest engagement ratios on Instagram.
TELCO & CABLE AND CONSUMER PRODUCTS
BRANDS SOAR ON PINTEREST.
Believe it or not, these two industries are Pining their way
to greater brand engagement. We’ll explore this finding
further in the industry breakdown sections of this report
(pages 20 and 13, respectively).
Engagement Ratio: Key Takeaways
9

Industry Case Studies

Apparel
KEY TAKEAWAYS
• Facebook is where Apparel brands see the largest audiences (2.3
million Page Likes). Compared to other B2C industries, however,
Apparel brands are also well-represented with sizable audiences on
Instagram and Twitter.
• Instagram is the most effective channel for Apparel brands, with
an average engagement ratio of 13.71. LinkedIn is the second most
effective channel (1.12 engagement ratio).
• Outerwear brands are top performers on Instagram (24.9
engagement ratio), 2X the engagement ratio of Casual Clothing
(13.8), Footwear (12.9), and High Fashion (11.8) brands on average.
Analysis based on the top 27 apparel brands in the Global 500 and leading apparel brands on social media as identified by the TrackMaven platform.
MEDIAN SOCIAL MEDIA AUDIENCE SIZE IN THOUSANDS
ENGAGEMENT RATIO (AVERAGE INTERACTIONS PER POST PER 1,000 FOLLOWERS)
TOP CHANNEL: INSTAGRAM
FOOTWEAR
CASUAL CLOTHINGOUTERWEAR
HIGH FASHION
12.9
13.824.9
11.8
INSTAGRAM SUBSECTOR ENGAGEMENT RATIO
2,282
952
91
18
545
0.17
0.43
0.49
1.12
13.71
11

Automakers
KEY TAKEAWAYS
• Facebook is where Automaker brands have the largest median
audience size on Facebook (2.6 million Page Likes).
• Instagram is the most effective channel for Automakers, with an
average engagement ratio of 40.68. Pinterest is the second most
effective channel (2.69 engagement ratio).
• Luxury car brands out-engage Standard brands on Instagram, with
an engagement ratio of 37.6 versus 22.4.
Analysis based on the top 25 automaker brands in the Global 500 and leading automaker brands on social media as identified by the TrackMaven platform.
ENGAGEMENT RATIO (AVERAGE INTERACTIONS PER POST PER 1,000 FOLLOWERS)
MEDIAN SOCIAL MEDIA AUDIENCE SIZE IN THOUSANDS
STANDARD
37.6 22.4LUXURY
TOP CHANNEL: INSTAGRAM
INSTAGRAM SUBSECTOR ENGAGEMENT RATIO
2585
289
25
4
459
2.6
1.2
1.1
0.4
40.6
12
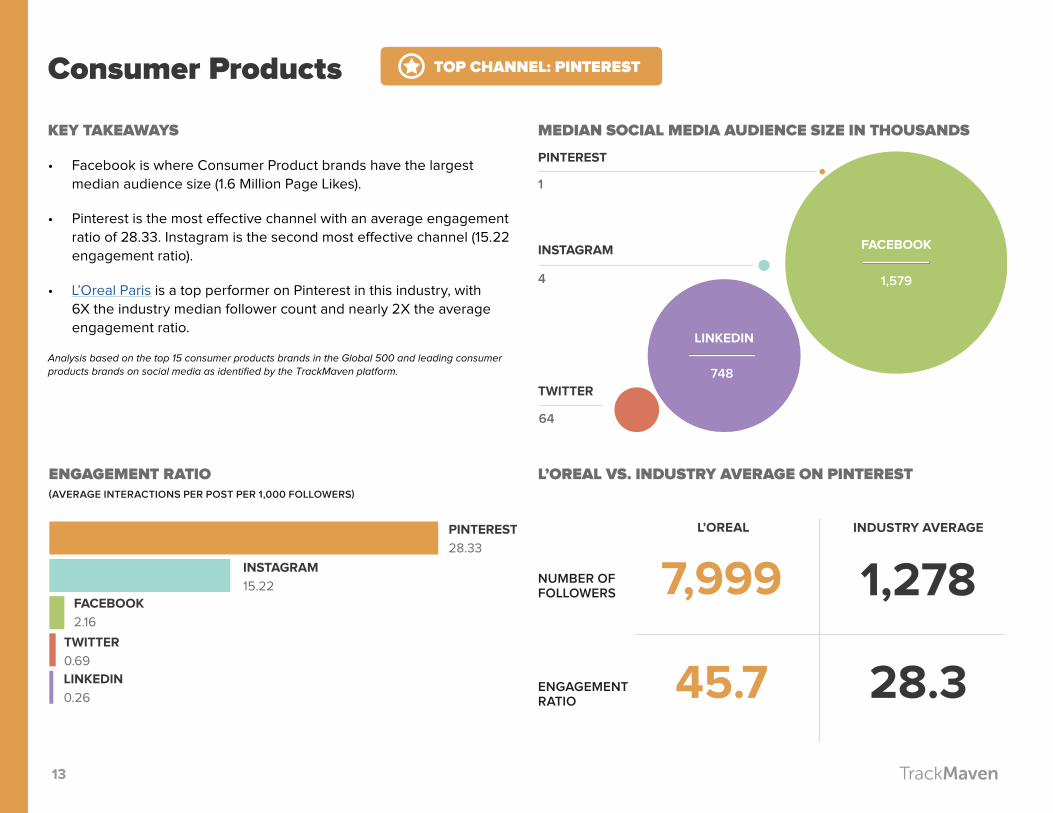
Consumer Products
KEY TAKEAWAYS
• Facebook is where Consumer Product brands have the largest
median audience size (1.6 Million Page Likes).
• Pinterest is the most effective channel with an average engagement
ratio of 28.33. Instagram is the second most effective channel (15.22
engagement ratio).
• L’Oreal Paris is a top performer on Pinterest in this industry, with
6X the industry median follower count and nearly 2X the average
engagement ratio.
Analysis based on the top 15 consumer products brands in the Global 500 and leading consumer products brands on social media as identified by the TrackMaven platform.
ENGAGEMENT RATIO (AVERAGE INTERACTIONS PER POST PER 1,000 FOLLOWERS)
L’OREAL VS. INDUSTRY AVERAGE ON PINTEREST
MEDIAN SOCIAL MEDIA AUDIENCE SIZE IN THOUSANDS
TOP CHANNEL: PINTEREST
1,5794
748
1
64
FACEBOOKINSTAGRAM
0.69
28.33
0.26
15.22
2.16
NUMBER OF FOLLOWERS
ENGAGEMENT RATIO
INDUSTRY AVERAGE
7,999
45.7 28.3
1,278
L’OREAL
13

Entertainment
KEY TAKEAWAYS
• Facebook is where brands entertainment industry have the largest
median audience (210K Page Likes).
• Entertainment brands have the highest engagement ratio on
Instagram (14.96). Pinterest is the second most effective channel
(3.54 engagement ratio).
• On Instagram, Event Management brands out-engage Casino brands
(16.7 versus 13.7 engagement ratios).
Analysis based on the top 11 entertainment brands in the Global 500 and leading entertainment brands on social media as identified by the TrackMaven platform.
ENGAGEMENT RATIO (AVERAGE INTERACTIONS PER POST PER 1,000 FOLLOWERS)
MEDIAN SOCIAL MEDIA AUDIENCE SIZE IN THOUSANDS
TOP CHANNEL: INSTAGRAM
CASINOS
16.7 13.7EVENT MANAGEMENT
INSTAGRAM SUBSECTOR ENGAGEMENT RATIO
210
19
9
0.8
181
TWITTER0.59
FACEBOOK1.27
LINKEDIN1.78
PINTEREST3.54
INSTAGRAM14.96
14

Food & Beverage
KEY TAKEAWAYS
• Facebook is where Food & Beverage brands have the largest median
audience size (1.8 Million Page Likes).
• Instagram is the most effective channel, with an engagement ratio
of 34.71. Pinterest is the second most effective channel (13.69
engagement ratio).
• On Instagram, beer brands (26.2 engagement ratio) out-engage soda
brands (23.3), energy drink brands (18.9), and food manufacturers
(13.3).
Analysis based on the top 38 food & beverage brands in the Global 500 and leading food & beverage brands on social media as identified by the TrackMaven platform.
ENGAGEMENT RATIO (AVERAGE INTERACTIONS PER POST PER 1,000 FOLLOWERS)
MEDIAN SOCIAL MEDIA AUDIENCE SIZE IN THOUSANDS
TOP CHANNEL: INSTAGRAM
ENERGY DRINK
MANUFACTURERS
SODA MANUFACTURERSBEER MANUFACTURERS
FOOD MANUFACTURERS
18.9
23.326.2
13.3
INSTAGRAM SUBSECTOR ENGAGEMENT RATIO
1845
36
69
2
74
TWITTER0.59
FACEBOOK1.27
LINKEDIN1.78
PINTEREST3.54
INSTAGRAM14.96
15

Hospitality
ENGAGEMENT RATIO (AVERAGE INTERACTIONS PER POST PER 1,000 FOLLOWERS)
MEDIAN SOCIAL MEDIA AUDIENCE SIZE IN THOUSANDS
AUTOSERVICES
24.5 18.1
• Hospitality brands have the largest median audience size on
Facebook (350K Page Likes).
• Instagram is the social network with the highest engagement ratio
for hospitality brands (20.82).
• On Instagram, Autoservices brands out-engage Lodging brands on
average (24.5 versus 18.1 engagement ratio).
Analysis based on the top 15 hospitality brands in the Global 500 and leading hospitality brands on social media as identified by the TrackMaven platform.
TOP CHANNEL: INSTAGRAM
KEY TAKEAWAYS
LODGING
INSTAGRAM SUBSECTOR ENGAGEMENT RATIO
350
21
1
48
160
TWITTER0.25
FACEBOOK0.94
LINKEDIN1.04
PINTEREST3.83
INSTAGRAM20.82
Pinterest28.33
16

Insurance
KEY TAKEAWAYS
• Insurance brands have the largest median audience size on
Facebook (123K Page Likes), as well as a sizeable LinkedIn audience
(81K followers).
• Instagram is the social network with the highest engagement ratio
for Insurance brands (48.6). Pinterest is the second most effective
channel (20.29).
• On Instagram , Property & Casualty Insurance brands out-engage
Life Insurance brands on average (48.8 versus 28.7 engagement
ratios).
Analysis based on the top 18 insurance brands in the Global 500 and leading insurance brands on social media as identified by the TrackMaven platform.
MEDIAN SOCIAL MEDIA AUDIENCE SIZE IN THOUSANDS
TOP CHANNEL: INSTAGRAM
ENGAGEMENT RATIO (AVERAGE INTERACTIONS PER POST PER 1000 FOLLOWERS)
PROPERTY & CASUALTY INSURANCE
LIFE INSURANCE
43.8 28.7
INSTAGRAM SUBSECTOR ENGAGEMENT RATIO
123
2
81
0.3
16
0.36
0.65
2.67
20.29
40.60
17

Restaurants
KEY TAKEAWAYS
• For Restaurant brands, Facebook is King (median 2.8 Million Page
Likes). Restaurants have yet to find substantial audiences on other
social channels.
• Instagram is the social network with the highest engagement ratio
for restaurant brands (15.08). Pinterest is the second most effective
channel, with an engagement ratio of 9.32.
• On Instagram, Fast Food brands out-engage Full-Service brands
(21.4 versus 18.4 engagement ratios).
Analysis based on the top 15 restaurant brands in the Global 500 and leading restaurant brands on social media as identified by the TrackMaven platform.
ENGAGEMENT RATIO (AVERAGE INTERACTIONS PER POST PER 1,000 FOLLOWERS)
MEDIAN SOCIAL MEDIA AUDIENCE SIZE IN THOUSANDS
TOP CHANNEL: INSTAGRAM
FAST FOOD FULL SERVICE
21.4 18.4
INSTAGRAM SUBSECTOR ENGAGEMENT RATIO
1.01
1.42
1.92
9.32
15.08
2,781
24
21
71
2
18

Retail
KEY TAKEAWAYS
• Retailers have the largest median audience size on Facebook (1.8
Million Page Likes).
• Instagram is the social network with the highest engagement ratio
for Retailers by far (17.99). Facebook is a distant second for retailers,
with an engagement ratio of 0.80.
• On Instagram, Mass Merchant brands perform especially well (21.7
engagement ratio), beating out Department Store (14.6) and Grocers
(16.2) brands on average.
Analysis based on the top 34 retail brands in the Global 500 and leading retail brands on social media as identified by the TrackMaven platform.
ENGAGEMENT RATIO (AVERAGE INTERACTIONS PER POST PER 1,000 FOLLOWERS)
MEDIAN SOCIAL MEDIA AUDIENCE SIZE IN THOUSANDS
TOP CHANNEL: INSTAGRAM
MASS MERCHANT DEPARTMENT STORE
GROCERS
21.7 14.6
16.2
INSTAGRAM SUBSECTOR ENGAGEMENT RATIO
350
21
1
48
160
0.22
0.24
0.54
0.80
17.99
19

Telco & Cable
ENGAGEMENT RATIO (AVERAGE INTERACTIONS PER POST PER 1,000 FOLLOWERS)
MEDIAN SOCIAL MEDIA AUDIENCE SIZE IN THOUSANDS
TELCO CARRIERS CABLE & SATELLITE
88.2 0.83
PINTEREST SUBSECTOR ENGAGEMENT RATIO
TOP CHANNEL: PINTEREST
KEY TAKEAWAYS
• Telco & Cable brands have the largest median audience size on
Facebook (2.1 Million Page Likes).
• Pinterest is the social network with the highest engagement ratio for
Telco & Cable brands (75.58), significantly greater than other B2C
industries. Instagram is a distant second with an engagement ratio of
9.00.
• On Pinterest, Telco Carriers drastically out-engage Cable & Satellite
brands. Look at Verizon and AT&T’s Pinterest boards, for example,
which are top-performers in the industry.
Analysis based on the top 15 Telcommunications & cable brands in the Global 500 and leading Telcommunications & cable brands on social media as identified by the TrackMaven platform.
0.17
0.39
0.51
9.0
75.58
2,095
32
84
2
80
20
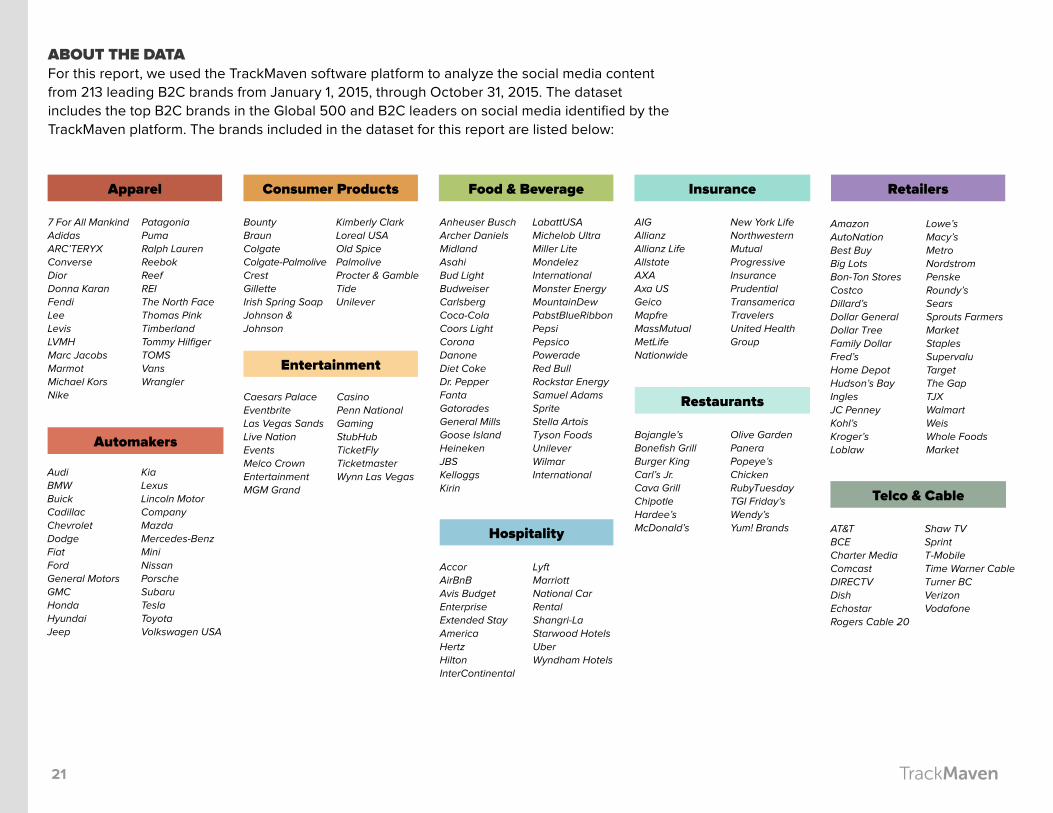
ABOUT THE DATAFor this report, we used the TrackMaven software platform to analyze the social media content
from 213 leading B2C brands from January 1, 2015, through October 31, 2015. The dataset
includes the top B2C brands in the Global 500 and B2C leaders on social media identified by the
TrackMaven platform. The brands included in the dataset for this report are listed below:
Apparel
Automakers
Consumer Products
Entertainment
Food & Beverage
Hospitality
Insurance
Restaurants
Retailers
Telco & Cable
7 For All MankindAdidasARC’TERYXConverseDiorDonna KaranFendiLeeLevisLVMHMarc JacobsMarmotMichael KorsNike
PatagoniaPumaRalph LaurenReebokReefREIThe North FaceThomas PinkTimberlandTommy HilfigerTOMSVansWrangler
Caesars PalaceEventbriteLas Vegas SandsLive Nation EventsMelco Crown EntertainmentMGM Grand
CasinoPenn National GamingStubHubTicketFlyTicketmasterWynn Las Vegas
AIGAllianzAllianz LifeAllstateAXAAxa USGeicoMapfreMassMutualMetLifeNationwide
New York LifeNorthwestern MutualProgressive InsurancePrudentialTransamericaTravelersUnited Health Group
Bojangle’sBonefish GrillBurger KingCarl’s Jr.Cava GrillChipotleHardee’sMcDonald’s
Olive GardenPaneraPopeye’s ChickenRubyTuesdayTGI Friday’sWendy’sYum! Brands
Anheuser BuschArcher Daniels MidlandAsahiBud LightBudweiserCarlsbergCoca-ColaCoors LightCoronaDanoneDiet CokeDr. PepperFantaGatoradesGeneral MillsGoose IslandHeinekenJBSKelloggsKirin
LabattUSAMichelob UltraMiller LiteMondelez InternationalMonster EnergyMountainDewPabstBlueRibbonPepsiPepsicoPoweradeRed BullRockstar EnergySamuel AdamsSpriteStella ArtoisTyson FoodsUnileverWilmar International
AccorAirBnBAvis BudgetEnterpriseExtended Stay AmericaHertzHiltonInterContinental
LyftMarriottNational Car RentalShangri-LaStarwood HotelsUberWyndham Hotels
AmazonAutoNationBest BuyBig LotsBon-Ton StoresCostcoDillard’sDollar GeneralDollar TreeFamily DollarFred’sHome DepotHudson’s BayInglesJC PenneyKohl’sKroger’sLoblaw
Lowe’sMacy’sMetroNordstromPenskeRoundy’sSearsSprouts Farmers MarketStaplesSupervaluTargetThe GapTJXWalmartWeisWhole Foods Market
AT&TBCECharter MediaComcastDIRECTVDishEchostarRogers Cable 20
Shaw TVSprintT-MobileTime Warner CableTurner BCVerizonVodafone
BountyBraunColgateColgate-PalmoliveCrestGilletteIrish Spring SoapJohnson & Johnson
Kimberly ClarkLoreal USAOld SpicePalmoliveProcter & GambleTideUnilever
AudiBMWBuickCadillacChevroletDodgeFiatFordGeneral MotorsGMCHondaHyundaiJeep
KiaLexusLincoln Motor CompanyMazdaMercedes-BenzMiniNissanPorscheSubaruTeslaToyotaVolkswagen USA
21

Find out where you rank in your industry!
Want to see how your content marketing
stacks up against other companies in your
industry?
Go to trackmaven.com/b2c to get a custom
benchmark of your content. You’ll learn
exactly which channels and topics are
working for you and what you can do to
leapfrog your competitors.
22