2016 analyst day - files.shareholder.comfiles.shareholder.com/downloads/qcom/6362260405x0x... · in...
TRANSCRIPT

1
2016 Analyst Day
February 11, 2016
2
In addition to the historical information contained herein, this presentation and the conference call that accompanies it contain forward-looking statements that are inherently subject to risks and uncertainties, including but not limited to statements regarding our business and financial strategies, priorities, plans, drivers, opportunities, outlook, estimates and expectations; our business and growth opportunities and initiatives, including licensing, core and adjacent opportunities and initiatives, and our positioning to take advantage thereof; our technology, products, product roadmap, innovation and investments; industry trends; 5G and LTE; operational performance; mergers, acquisitions and joint ventures; our strategic realignment plan, including cost reduction initiatives, and our progress vs. that plan; our capital return commitments; our regulatory and compliance challenges, including compliance and reporting challenges in China and our progress, expectations and intentions with respect to resolving those challenges, and the timing thereof, as well as the impact on our business and financial results; and estimates including 3G/4G device shipments and sales, global cellular connections, handset replacement rates, non-handset device shipments and ASPs. Forward-looking statements are generally identified by words such as “estimates,” “guidance,” “expects,” “anticipates,” “intends,” “plans,” “believes,” “seeks” and similar expressions. Actual results may differ materially from those referred to in the forward-looking statements due to a number of important factors, including but not limited to risks associated with commercial network deployments, expansions and upgrades of CDMA, OFDMA and other communications technologies, our customers’ and licensees’ sales of products and services based on these technologies and our ability to drive our customers’ demand for our products and services; competition in an environment of rapid technological change; our dependence on a small number of customers and licensees; attacks on our licensing business model, including current and future legal proceedings or actions of governmental or quasi-governmental bodies or standards or industry organizations; the enforcement and protection of our intellectual property rights; the continued and future success of our licensing programs; government regulations and policies, or adverse rulings in enforcement or other proceedings; the commercial success of our new technologies, products and services; our dependence on a limited number of third-party suppliers; claims by third parties that we infringe their intellectual property; acquisitions, strategic transactions and investments; the execution of our strategic realignment plan; our stock price and earnings volatility; our indebtedness; our ability to attract and retain qualified employees; foreign currency fluctuations; global economic conditions that impact the mobile communications industry and failures in our products or services or in the products or services of our customers or licensees, including those resulting from security vulnerabilities, defects or errors. These and other risks are set forth in our most recent Quarterly Report on Form 10-Q filed with the SEC. Our reports filed with the SEC are available on our website at www.qualcomm.com. We undertake no obligation to update, or continue to provide information with respect to, any forward-looking statement or risk factor, whether as a result of new information, future events or otherwise.
This presentation includes “non-GAAP financial measures” as that term is defined in Regulation G. The most directly comparable GAAP financial measures and information reconciling these non-GAAP financial measures to our financial results prepared in accordance with GAAP are included at the end of this presentation.
We refer to “Qualcomm” for ease of reference. However, in connection with our fiscal 2013 reorganization, Qualcomm Incorporated continues to operate QTL and own the vast majority of our patent portfolio, while Qualcomm Technologies, Inc., its wholly-owned subsidiary, now operates, along with its subsidiaries, substantially all of our products and services businesses, including QCT, and substantially all of our research and development functions.
Safe Harbor

3
Steve Mollenkopf10:00am
10:40am Matt Grob
11:00am Derek Aberle
11:45am Lunch Break
12:30pm Cristiano Amon
1:15pm George Davis
1:45pm Q&A
Agenda
Steve Mollenkopf
CEO, Qualcomm Incorporated
5
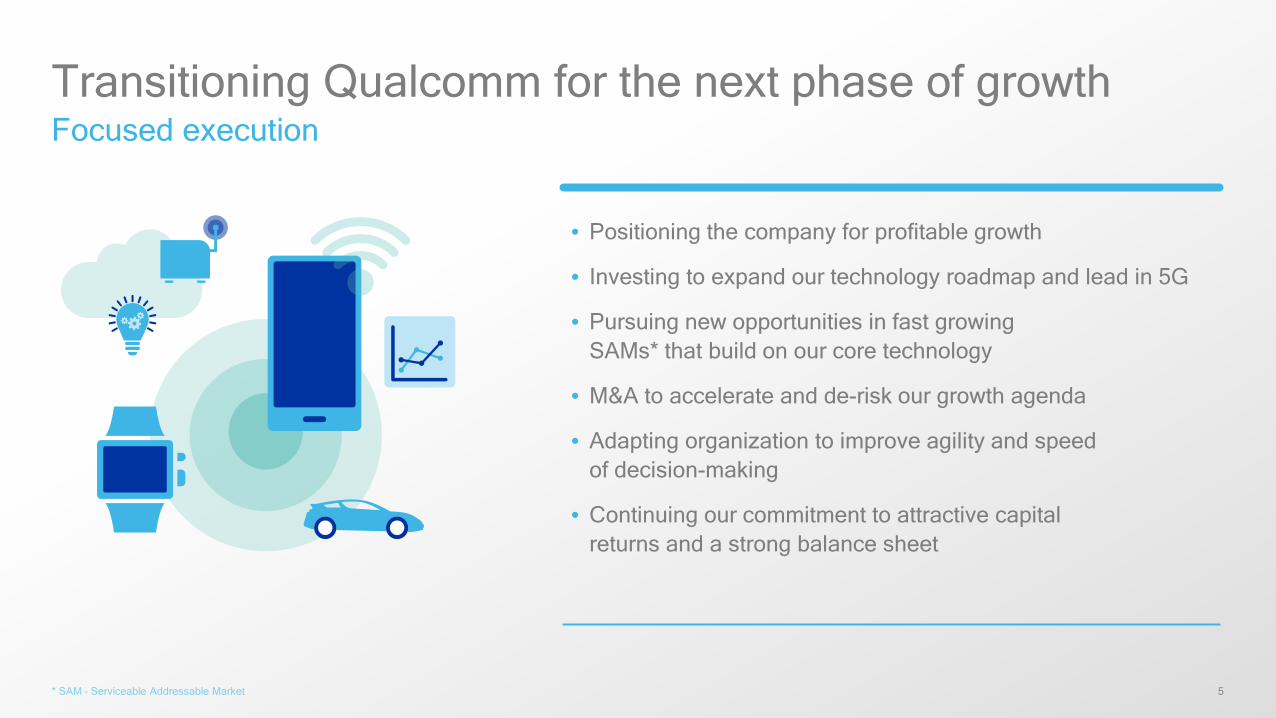
• Positioning the company for profitable growth
• Investing to expand our technology roadmap and lead in 5G
• Pursuing new opportunities in fast growing SAMs* that build on our core technology
• M&A to accelerate and de-risk our growth agenda
• Adapting organization to improve agility and speed of decision-making
• Continuing our commitment to attractive capital returns and a strong balance sheet
Focused execution
* SAM – Serviceable Addressable Market
Transitioning Qualcomm for the next phase of growth
6
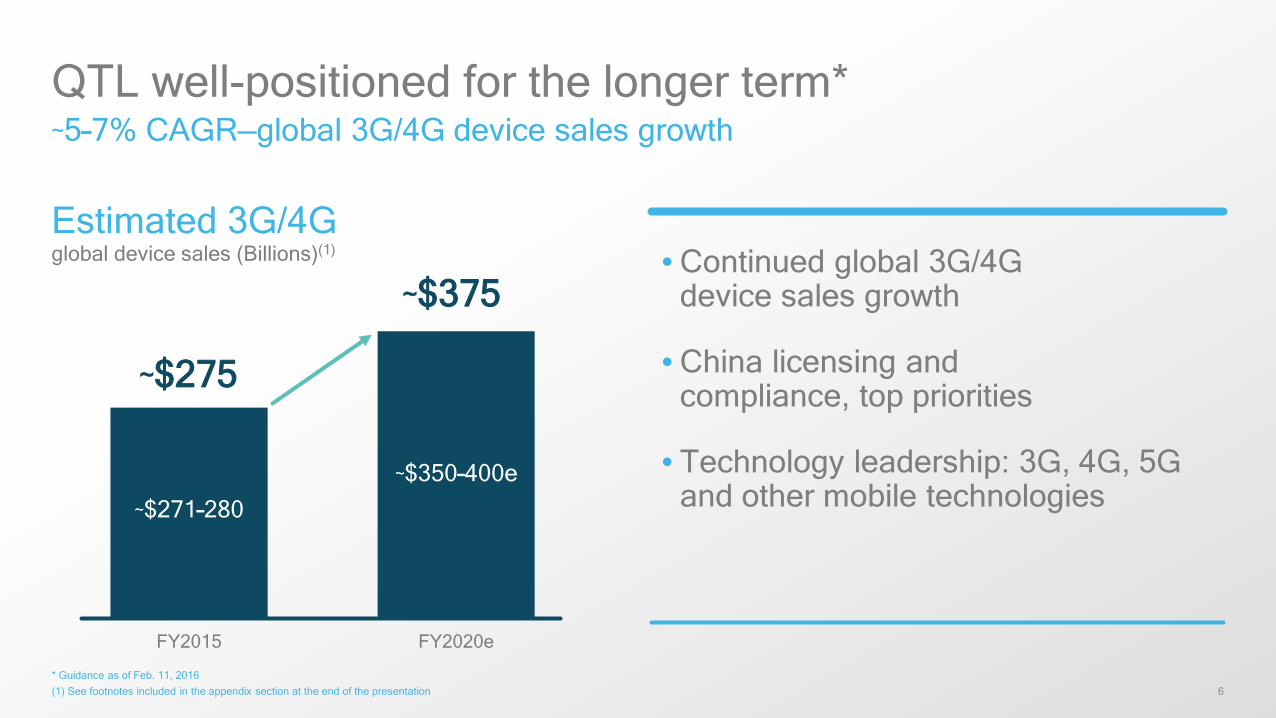
• Continued global 3G/4G device sales growth
• China licensing and compliance, top priorities
• Technology leadership: 3G, 4G, 5G and other mobile technologies
~5–7% CAGR—global 3G/4G device sales growth
* Guidance as of Feb. 11, 2016(1) See footnotes included in the appendix section at the end of the presentation
QTL well-positioned for the longer term*
FY2015 FY2020e
~$271–280~$350–400e
~$275
~$375
Estimated 3G/4G global device sales (Billions)(1)
7
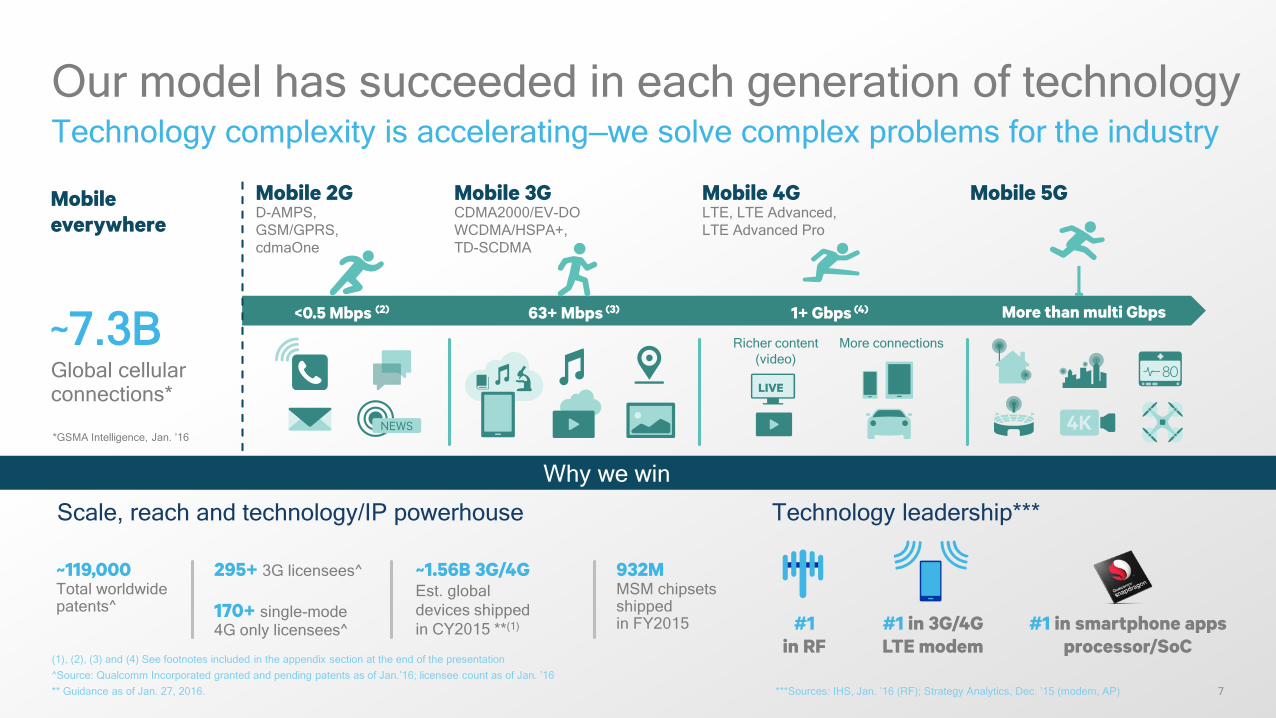
Our model has succeeded in each generation of technologyTechnology complexity is accelerating—we solve complex problems for the industry
(1), (2), (3) and (4) See footnotes included in the appendix section at the end of the presentation^Source: Qualcomm Incorporated granted and pending patents as of Jan.’16; licensee count as of Jan. ’16** Guidance as of Jan. 27, 2016. ***Sources: IHS, Jan. ’16 (RF); Strategy Analytics, Dec. ’15 (modem, AP)
932MMSM chipsets shipped in FY2015
170+ single-mode 4G only licensees^
295+ 3G licensees^ ~1.56B 3G/4GEst. global devices shipped in CY2015 **(1)
~119,000Total worldwide patents^
#1 in 3G/4G LTE modem
Scale, reach and technology/IP powerhouse
#1 in RF
Technology leadership***
Why we win
#1 in smartphone apps processor/SoC
Mobile everywhere
~7.3B
*GSMA Intelligence, Jan. ’16
Global cellular connections*
Richer content(video)
More connections
LIVE
Mobile 2G Mobile 3G Mobile 4G Mobile 5GD-AMPS, GSM/GPRS,cdmaOne
CDMA2000/EV-DOWCDMA/HSPA+, TD-SCDMA
LTE, LTE Advanced,LTE Advanced Pro
<0.5 Mbps (2) 63+ Mbps (3) More than multi Gbps1+ Gbps (4)
8
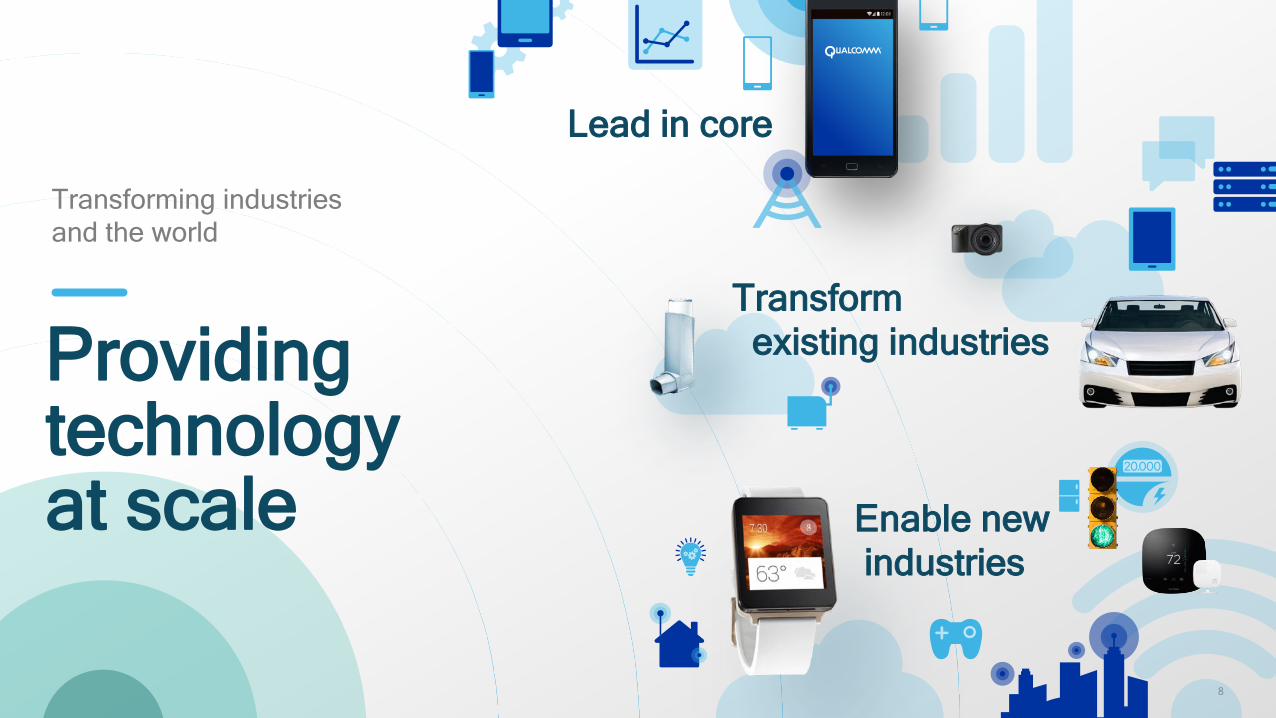
Providing technology at scale
Transforming industries and the world
Transformexisting industries
Enable new industries
Lead in core
9
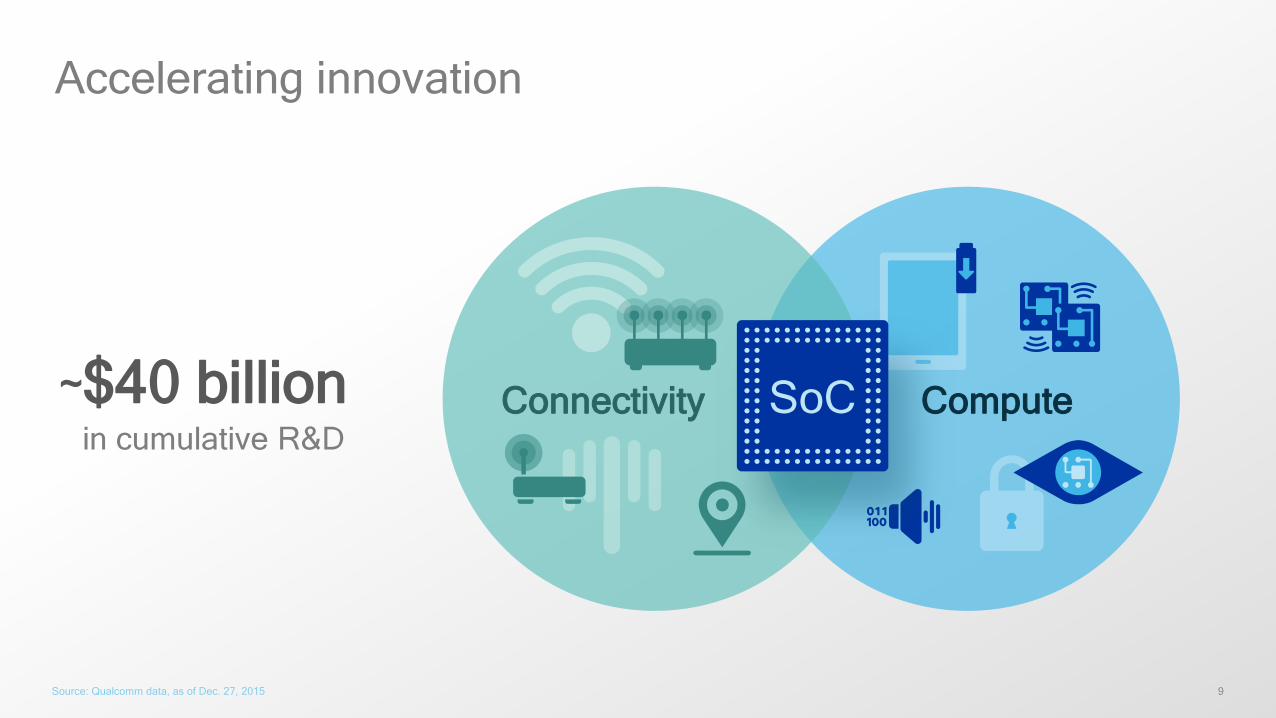
Accelerating innovation
Source: Qualcomm data, as of Dec. 27, 2015
~$40 billionin cumulative R&D
Connectivity ComputeSoC
10
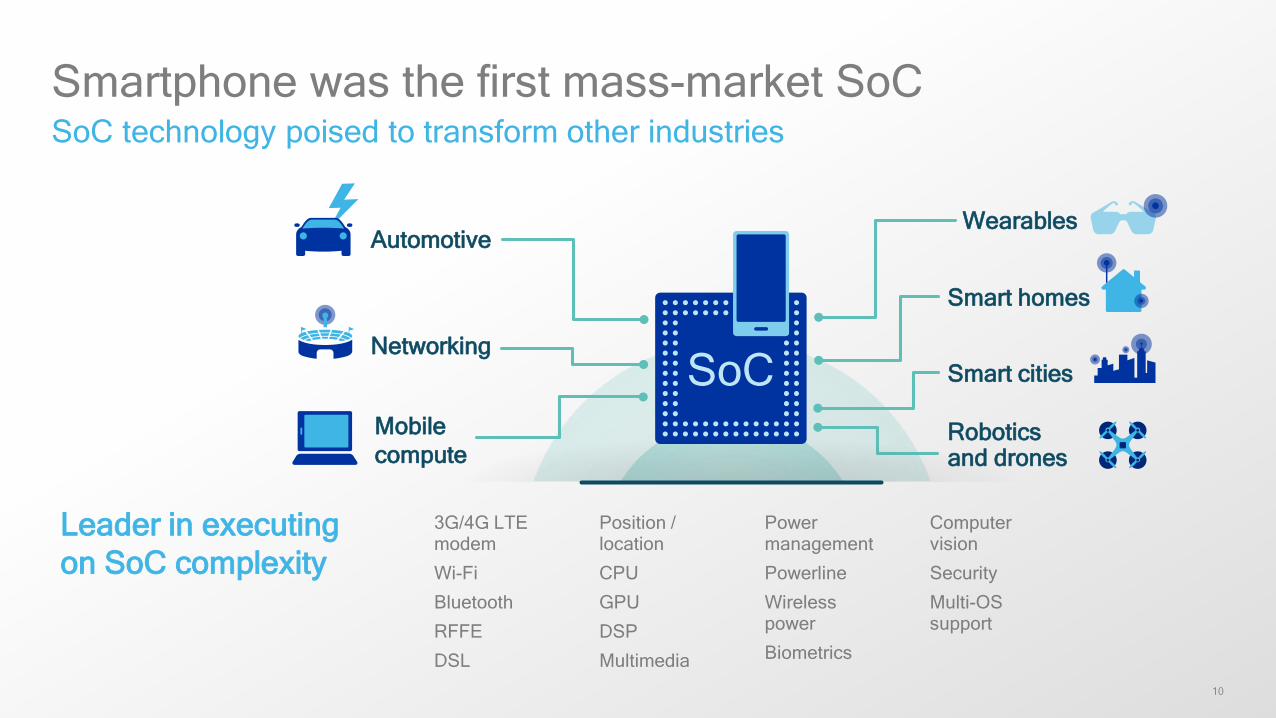
SoC
Smartphone was the first mass-market SoCSoC technology poised to transform other industries
3G/4G LTE modem
Wi-Fi
Bluetooth
RFFE
DSL
Position / location
CPU
GPU
DSP
Multimedia
Power management
Powerline
Wireless power
Biometrics
Computer vision
Security
Multi-OS support
Leader in executing on SoC complexity
WearablesAutomotive
NetworkingSmart cities
Robotics and drones
Smart homes
Mobile compute
11
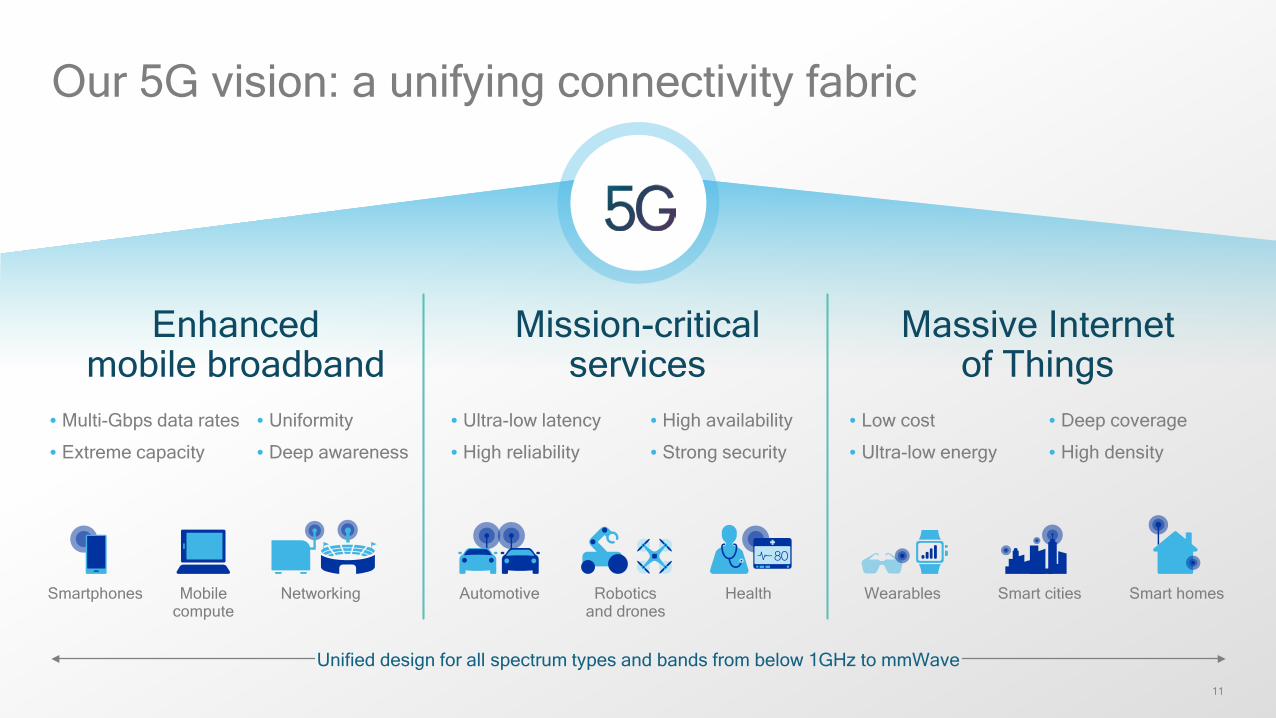
Our 5G vision: a unifying connectivity fabric
Mission-criticalservices
Enhancedmobile broadband
Massive Internetof Things
NetworkingSmartphones Robotics and drones
Automotive Health Smart cities Smart homesWearables
Unified design for all spectrum types and bands from below 1GHz to mmWave
• Ultra-low latency
• High reliability
• High availability
• Strong security
• Multi-Gbps data rates
• Extreme capacity
• Uniformity
• Deep awareness
• Low cost
• Ultra-low energy
• Deep coverage
• High density
Mobilecompute
12
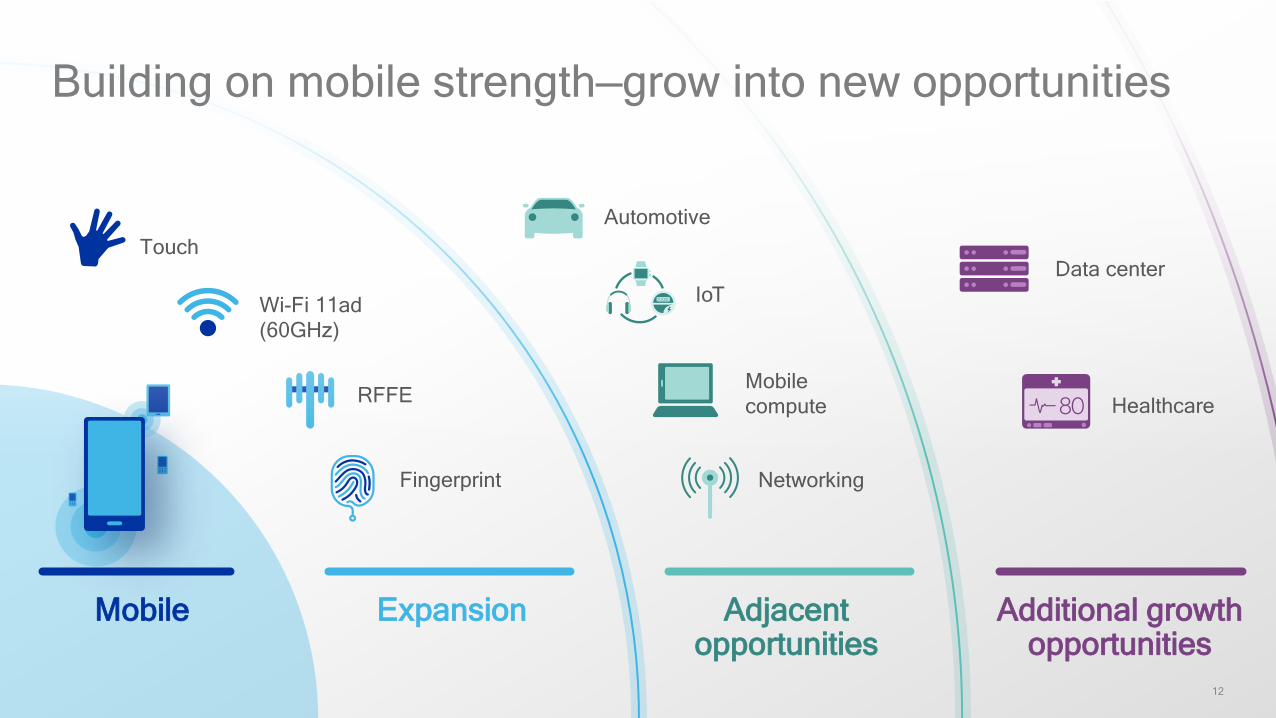
Expansion Adjacentopportunities
Additional growth opportunities
Building on mobile strength—grow into new opportunities
RFFE
Fingerprint
Automotive
Networking
Healthcare
Data center
Wi-Fi 11ad (60GHz)
Touch
IoT
Mobile
Mobile compute
13
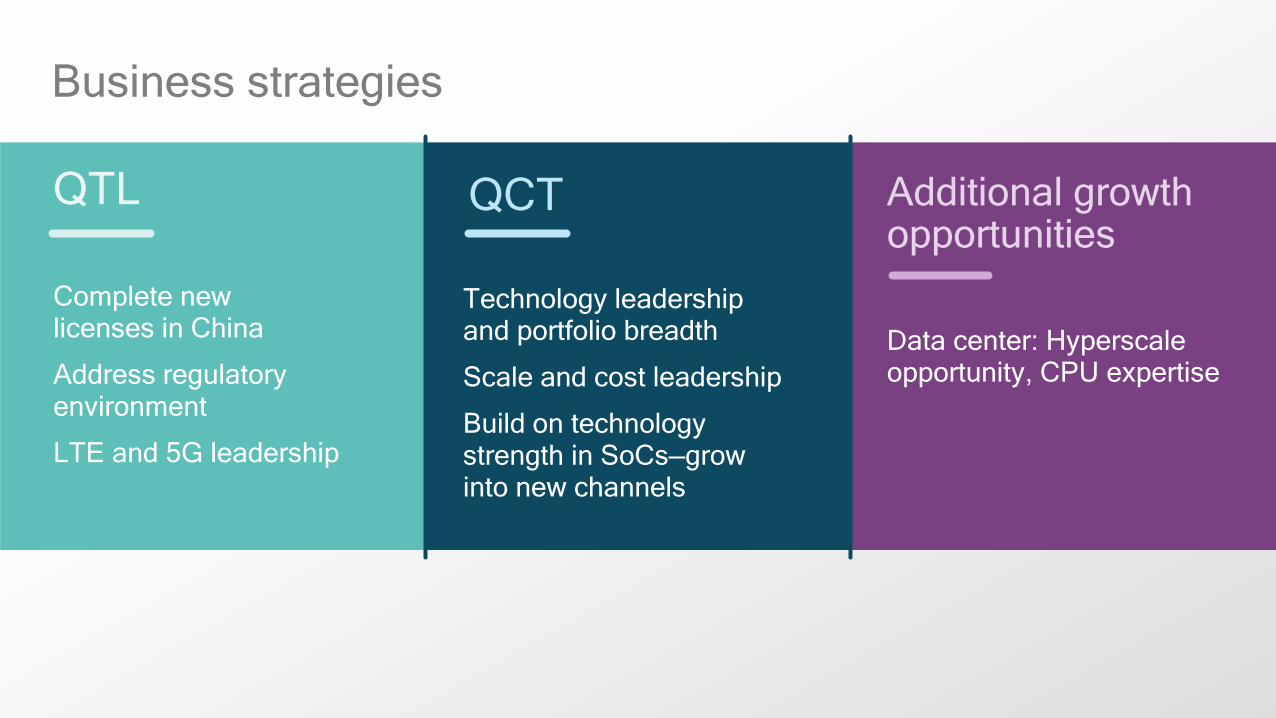
QTL Additional growth opportunities
Complete new licenses in China
Address regulatory environment
LTE and 5G leadership
Data center: Hyperscaleopportunity, CPU expertise
QCT
Technology leadership and portfolio breadth
Scale and cost leadership
Build on technology strength in SoCs—grow into new channels
Business strategies
14
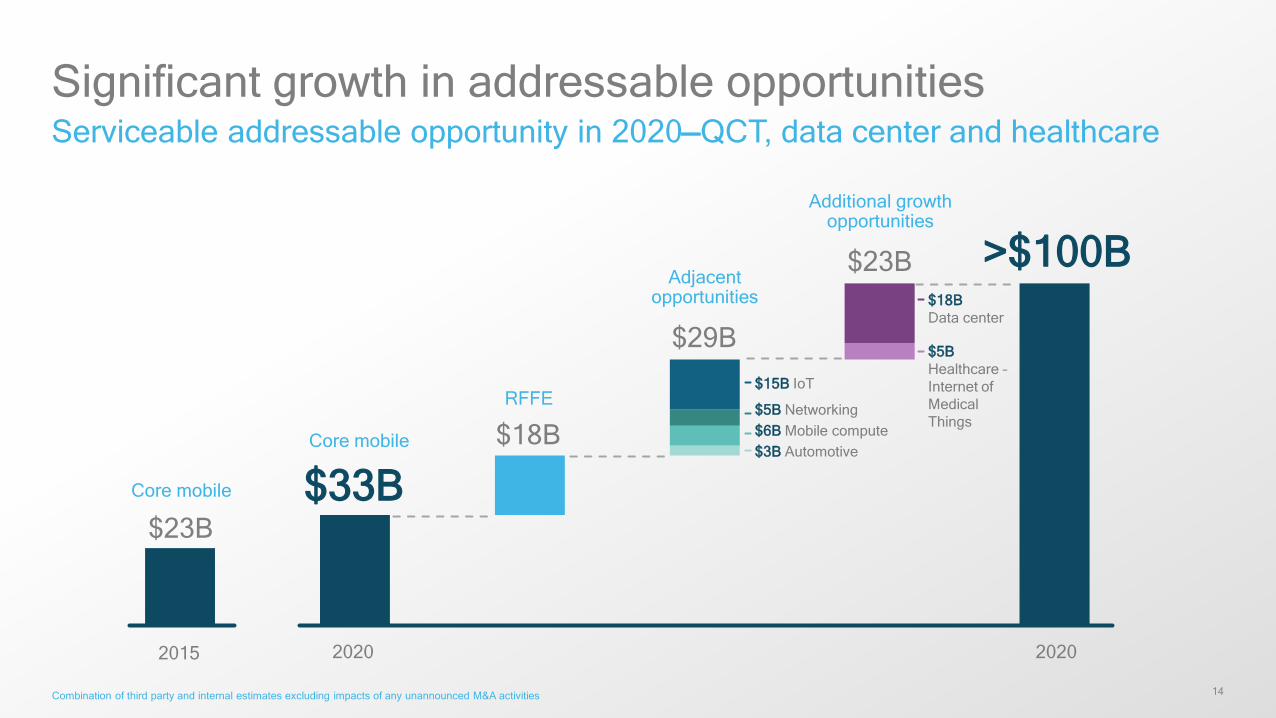
Significant growth in addressable opportunitiesServiceable addressable opportunity in 2020—QCT, data center and healthcare
Combination of third party and internal estimates excluding impacts of any unannounced M&A activities
Core mobile
RFFE
Adjacentopportunities
$15B IoT
$5B Networking
$3B Automotive
Additional growth opportunities
$18B Data center
$5B Healthcare –Internet of Medical Things
$33B
>$100B
$6B Mobile compute
2015 2020
$18B
$29B
$23B
$23B
Core mobile
2020
15
M&A approach
• Strong alignment with core competency
• Tuck-in acquisitions to support platforms
• Differentiated intellectual property
• Industry consolidation will continue and create opportunities
• Inorganic overall likely to increase
• Balance sheet strength critical to retaining optionality given industry scale

Mobile
17
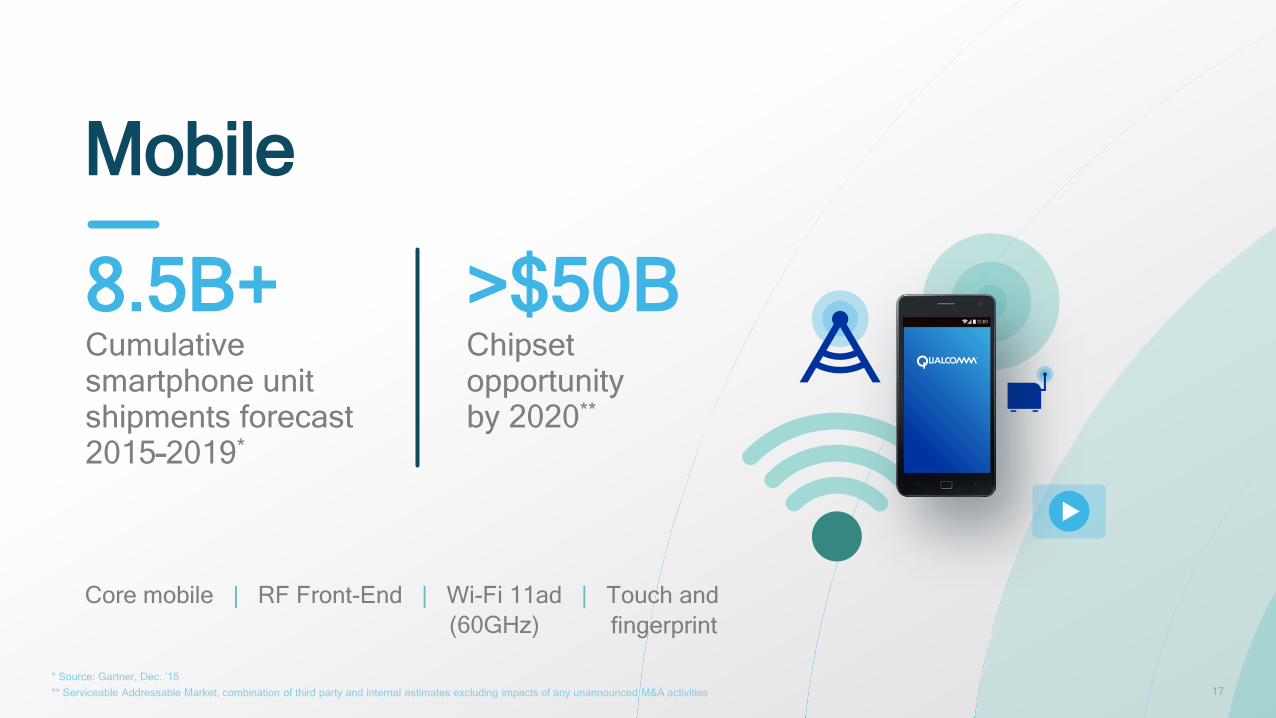
Mobile
8.5B+Cumulative smartphone unit shipments forecast 2015–2019*
>$50BChipset opportunity by 2020**
* Source: Gartner, Dec. ’15 ** Serviceable Addressable Market, combination of third party and internal estimates excluding impacts of any unannounced M&A activities
Core mobile | RF Front-End | Wi-Fi 11ad | Touch and (60GHz) fingerprint
18
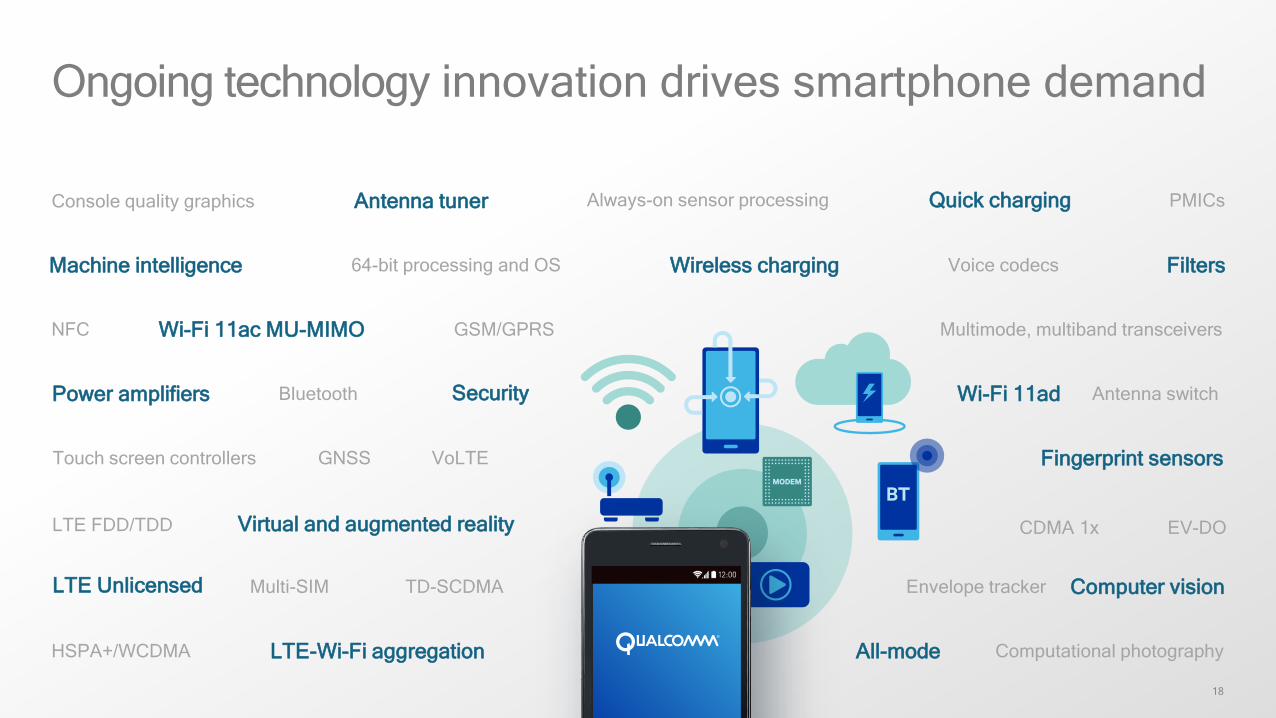
Ongoing technology innovation drives smartphone demand
LTE Unlicensed
CDMA 1x EV-DO
GSM/GPRSNFC Wi-Fi 11ac MU-MIMO Multimode, multiband transceivers
Bluetooth Wi-Fi 11adSecurity Antenna switchPower amplifiers
Machine intelligence 64-bit processing and OS Wireless charging Voice codecs Filters
Quick charging PMICsAntenna tunerConsole quality graphics Always-on sensor processing
VoLTEGNSS Fingerprint sensorsTouch screen controllers
LTE FDD/TDD
Multi-SIM TD-SCDMA Envelope tracker Computer vision
LTE-Wi-Fi aggregationHSPA+/WCDMA Computational photographyAll-mode
Virtual and augmented reality
19
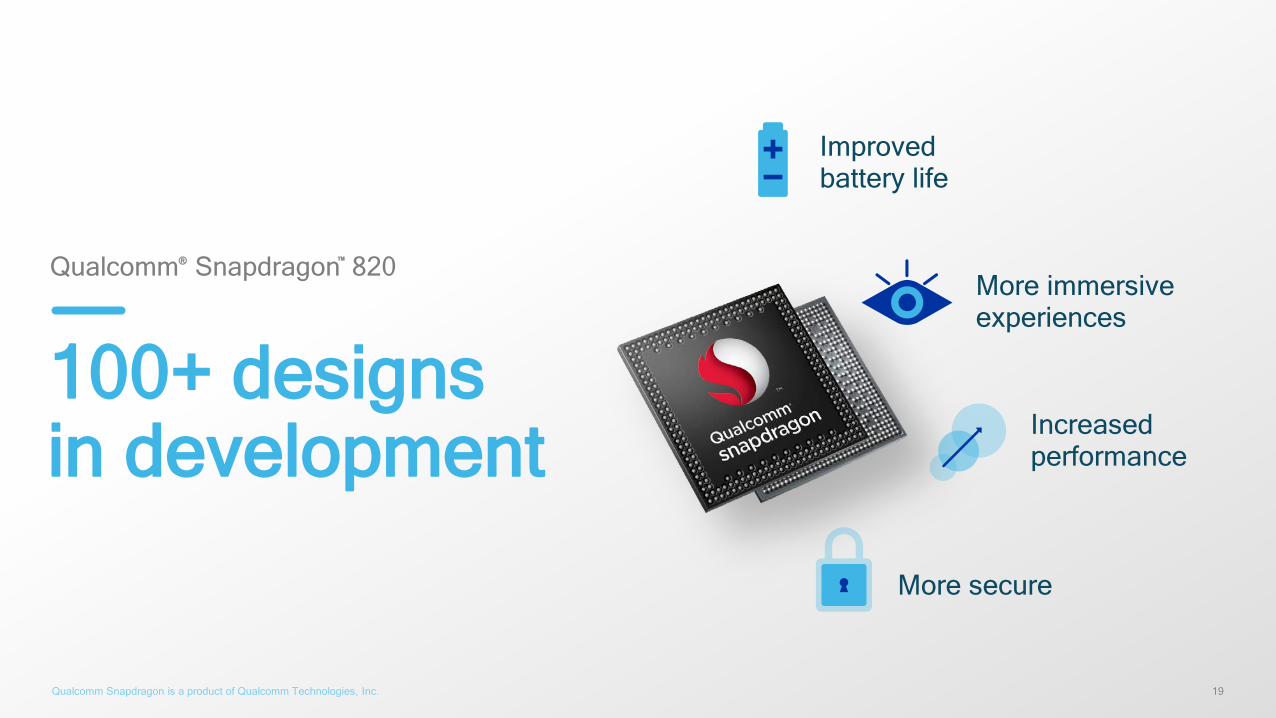
Qualcomm® Snapdragon™ 820
100+ designsin development Increased
performance
More immersive experiences
More secure
Improved battery life
Qualcomm Snapdragon is a product of Qualcomm Technologies, Inc.
20
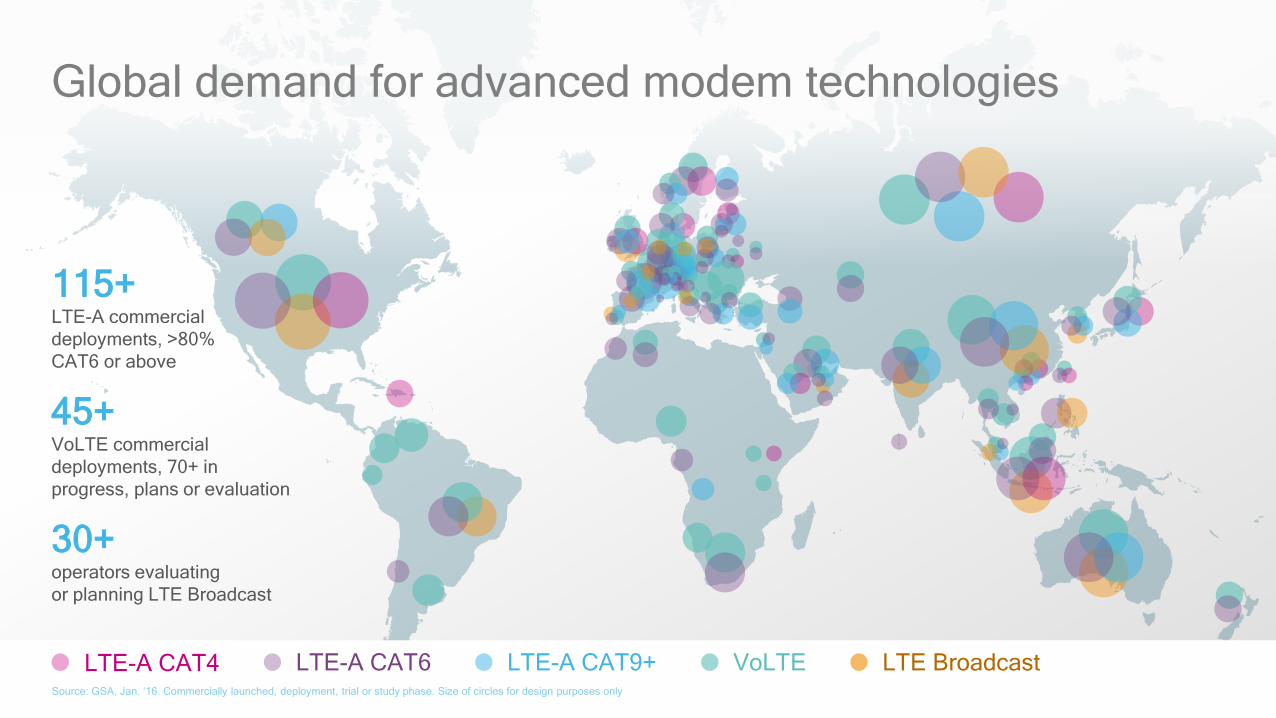
Global demand for advanced modem technologies
115+ LTE-A commercial deployments, >80% CAT6 or above
45+ VoLTE commercial deployments, 70+ in progress, plans or evaluation
30+ operators evaluating or planning LTE Broadcast
LTE-A CAT4 LTE-A CAT6 LTE-A CAT9+ VoLTE LTE BroadcastSource: GSA, Jan. ‘16. Commercially launched, deployment, trial or study phase. Size of circles for design purposes only
21
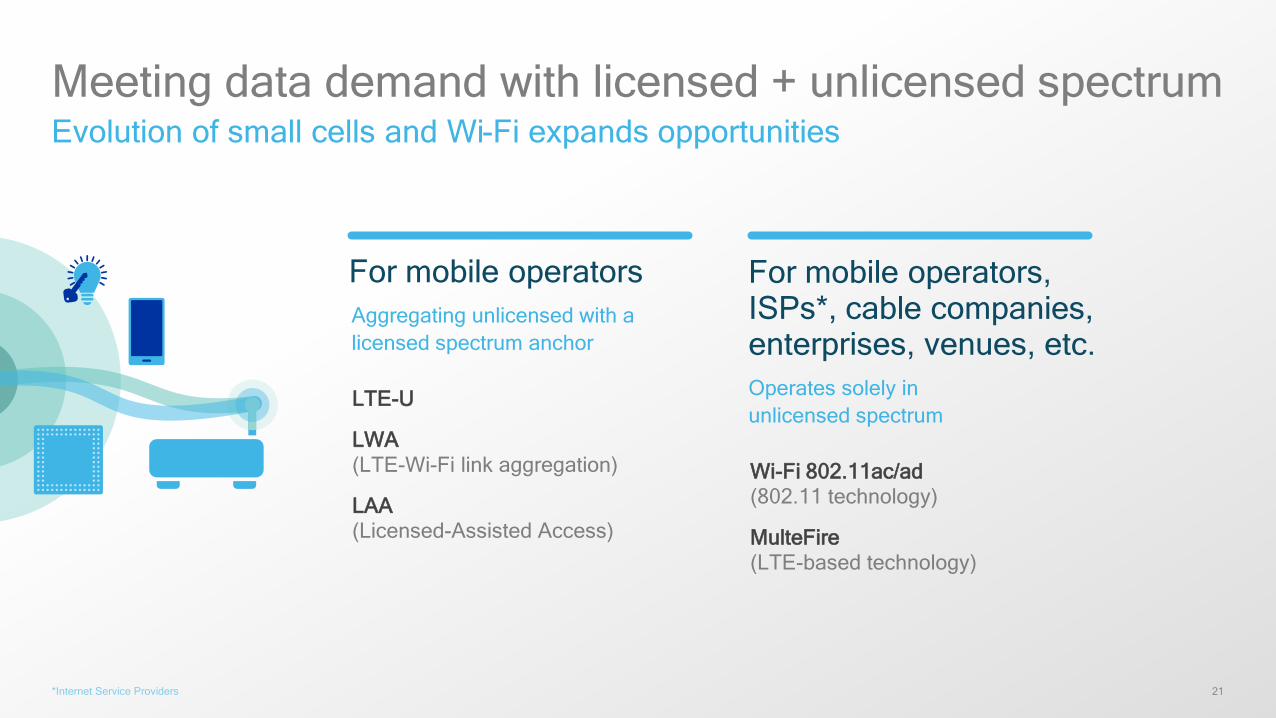
Meeting data demand with licensed + unlicensed spectrumEvolution of small cells and Wi-Fi expands opportunities
Aggregating unlicensed with a licensed spectrum anchor
Operates solely in unlicensed spectrum
LTE-U
LWA(LTE-Wi-Fi link aggregation)
LAA(Licensed-Assisted Access)
For mobile operators, ISPs*, cable companies, enterprises, venues, etc.
For mobile operators
Wi-Fi 802.11ac/ad(802.11 technology)
MulteFire(LTE-based technology)
*Internet Service Providers
22
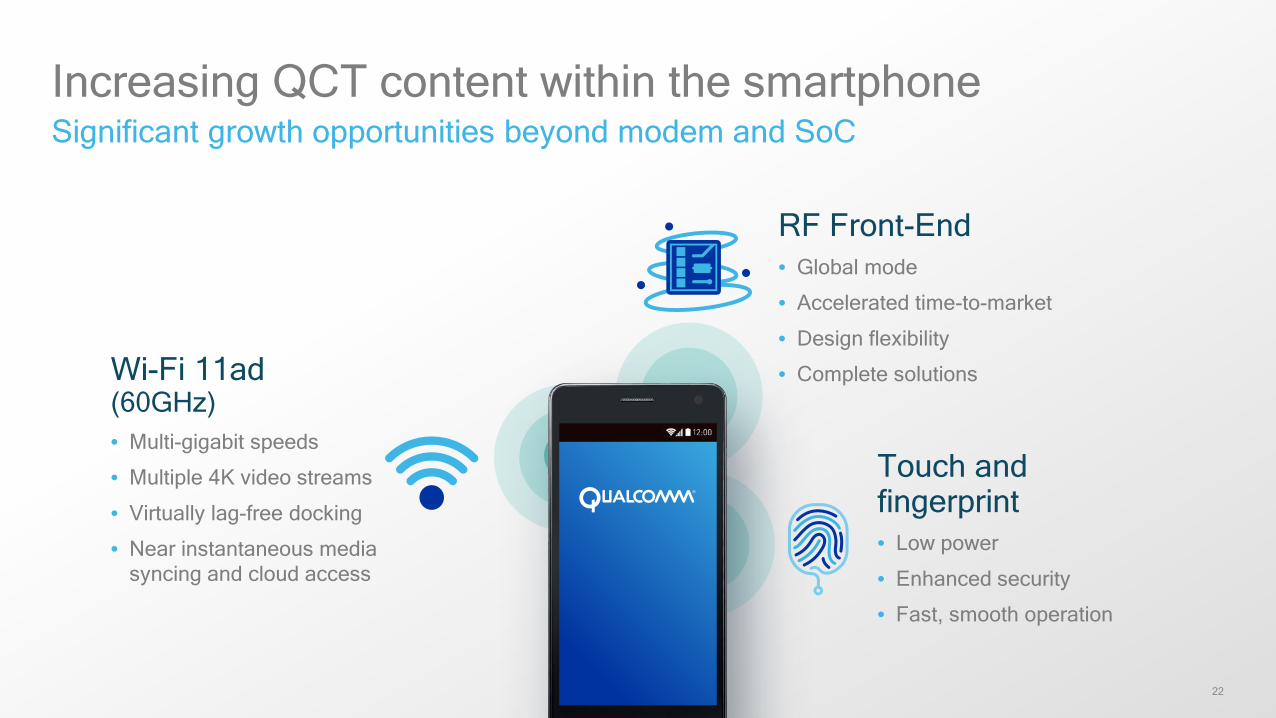
Increasing QCT content within the smartphoneSignificant growth opportunities beyond modem and SoC
RF Front-End• Global mode
• Accelerated time-to-market
• Design flexibility
• Complete solutionsWi-Fi 11ad (60GHz)• Multi-gigabit speeds
• Multiple 4K video streams
• Virtually lag-free docking
• Near instantaneous media syncing and cloud access
Touch and fingerprint• Low power
• Enhanced security
• Fast, smooth operation
23
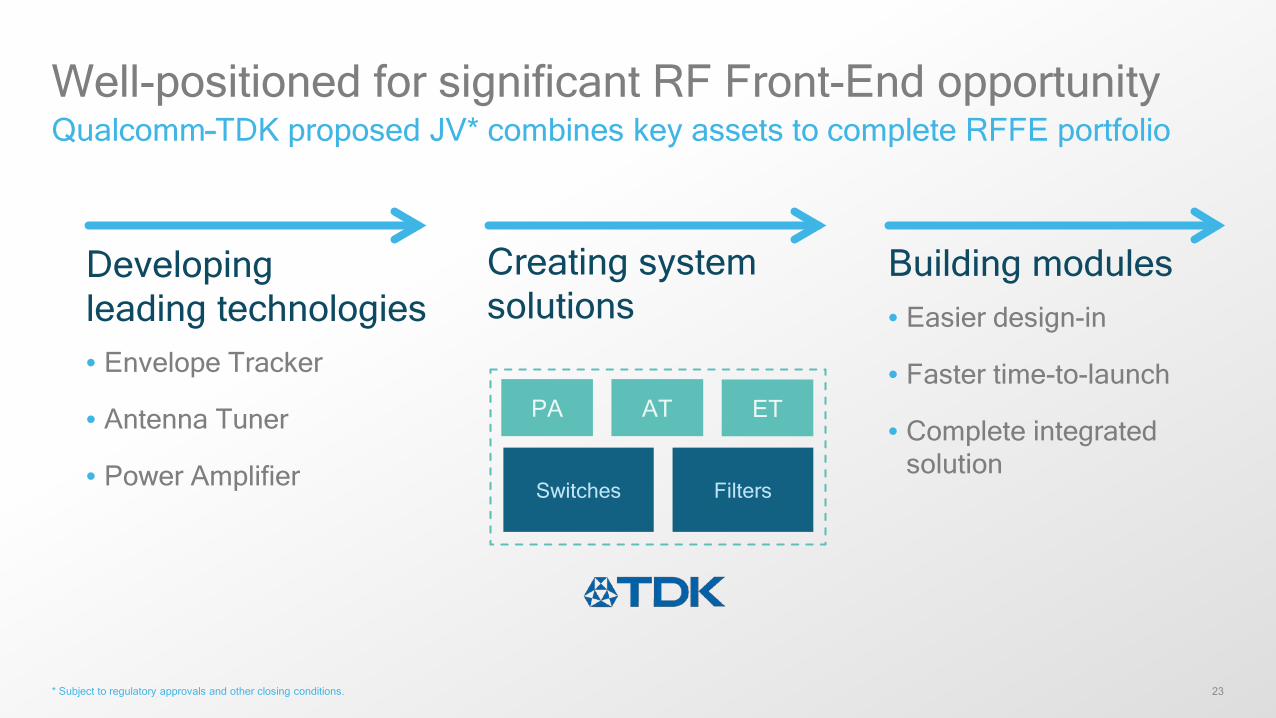
Developing leading technologies• Envelope Tracker
• Antenna Tuner
• Power Amplifier
Qualcomm–TDK proposed JV* combines key assets to complete RFFE portfolio
* Subject to regulatory approvals and other closing conditions.
Well-positioned for significant RF Front-End opportunity
Creating system solutions
Building modules• Easier design-in
• Faster time-to-launch
• Complete integrated solution
PA AT ET
Switches Filters
Adjacent QCT opportunities
25
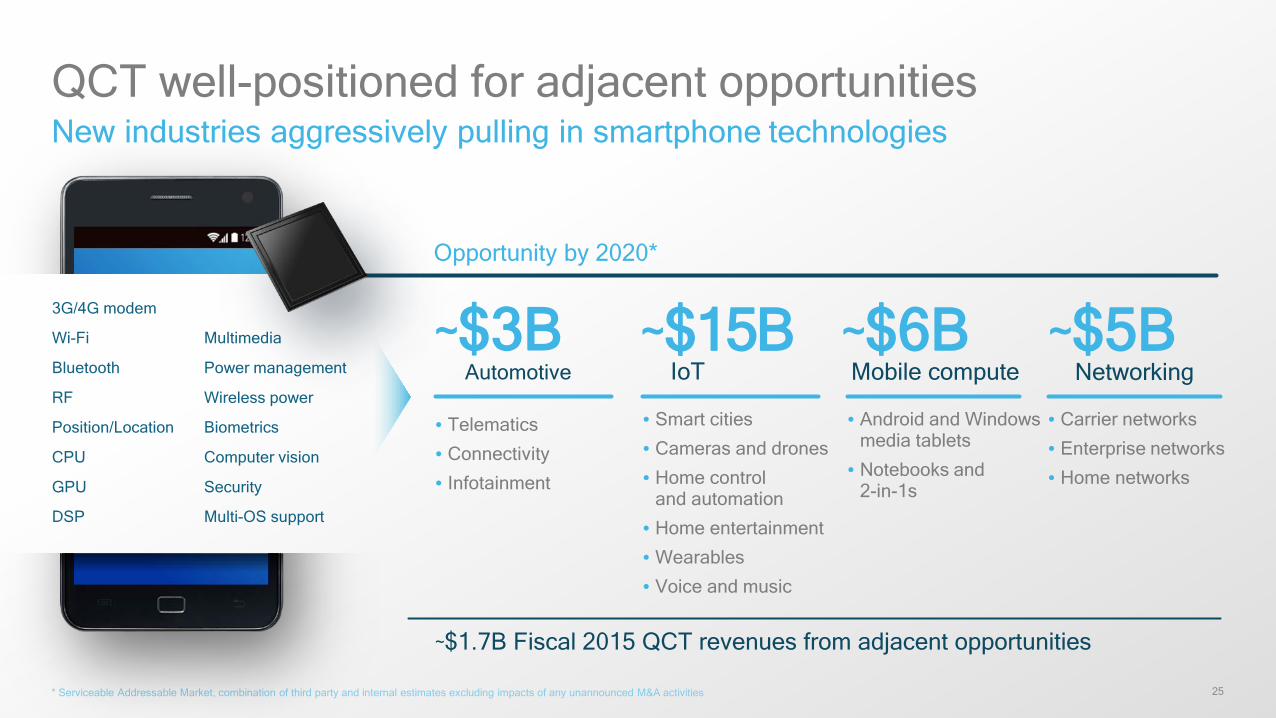
Opportunity by 2020*
3G/4G modem
Wi-Fi
Bluetooth
RF
Position/Location
CPU
GPU
DSP
Multimedia
Power management
Wireless power
Biometrics
Computer vision
Security
Multi-OS support
QCT well-positioned for adjacent opportunitiesNew industries aggressively pulling in smartphone technologies
~$1.7B Fiscal 2015 QCT revenues from adjacent opportunities
* Serviceable Addressable Market, combination of third party and internal estimates excluding impacts of any unannounced M&A activities
~$3BAutomotive
• Telematics
• Connectivity
• Infotainment
~$5B• Carrier networks
• Enterprise networks
• Home networks
~$15B• Smart cities
• Cameras and drones
• Home control and automation
• Home entertainment
• Wearables
• Voice and music
• Android and Windows media tablets
• Notebooks and 2-in-1s
~$6BIoT Mobile compute Networking
26
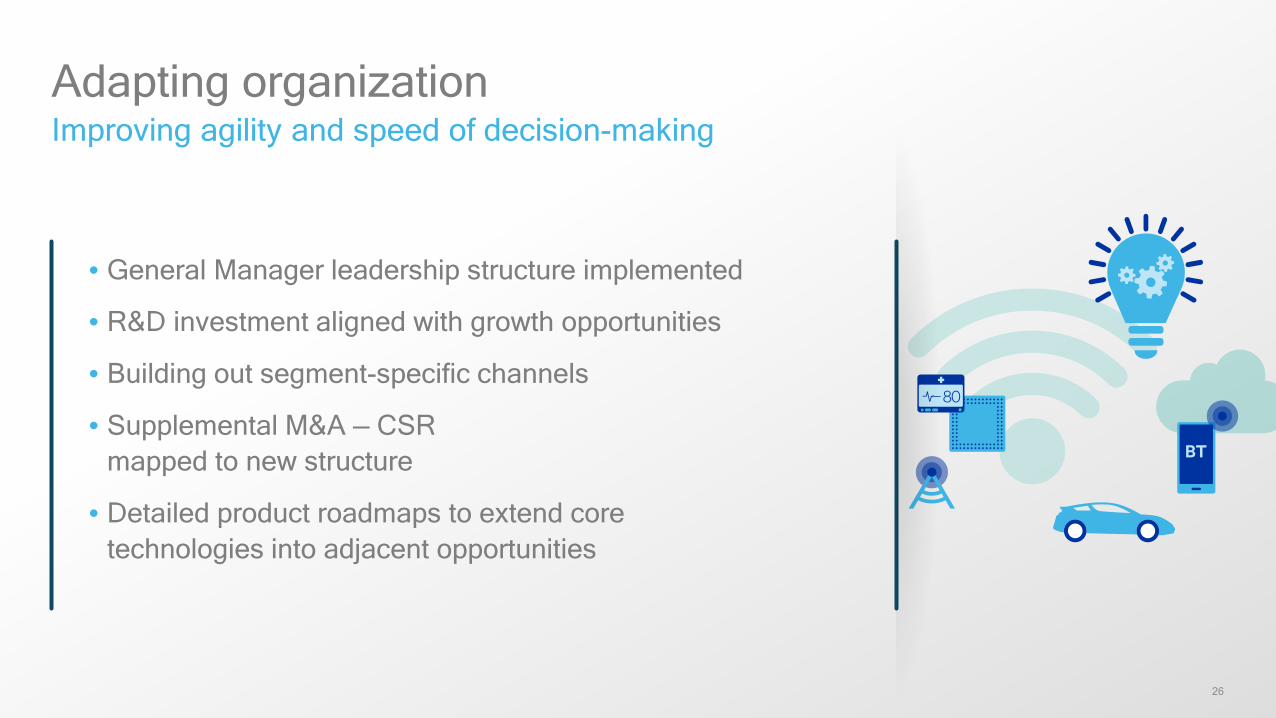
• General Manager leadership structure implemented
• R&D investment aligned with growth opportunities
• Building out segment-specific channels
• Supplemental M&A — CSR mapped to new structure
• Detailed product roadmaps to extend core technologies into adjacent opportunities
Improving agility and speed of decision-makingAdapting organization

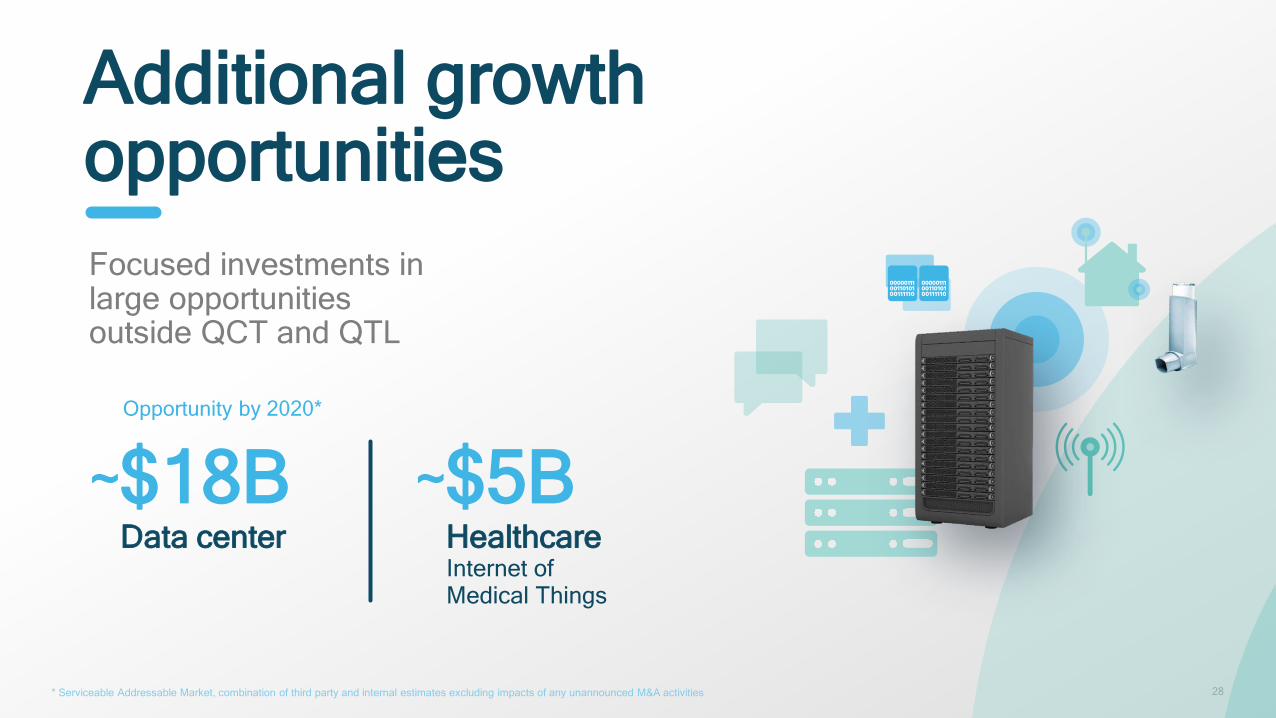
Additional growth opportunities
28
Extension opportunities
Opportunity by 2020*
Additional growth opportunities
~$18BData center
~$5BHealthcareInternet of Medical Things
Focused investments in large opportunities outside QCT and QTL
* Serviceable Addressable Market, combination of third party and internal estimates excluding impacts of any unannounced M&A activities

Strategic focus
30
• Positioning the company for profitable growth
• Investing to expand our technology roadmap and lead in 5G
• Pursuing new opportunities in fast growing SAMs* that build on our core technology
• M&A to accelerate and de-risk our growth agenda
• Adapting organization to improve agility and speed of decision-making
• Continuing our commitment to attractive capital returns and a strong balance sheet
Focused execution
* SAM – Serviceable Addressable Market
Key takeaways—2016 analyst meeting
Matt Grob
Executive Vice President, Qualcomm Technologies, Inc. and Chief Technology Officer
32
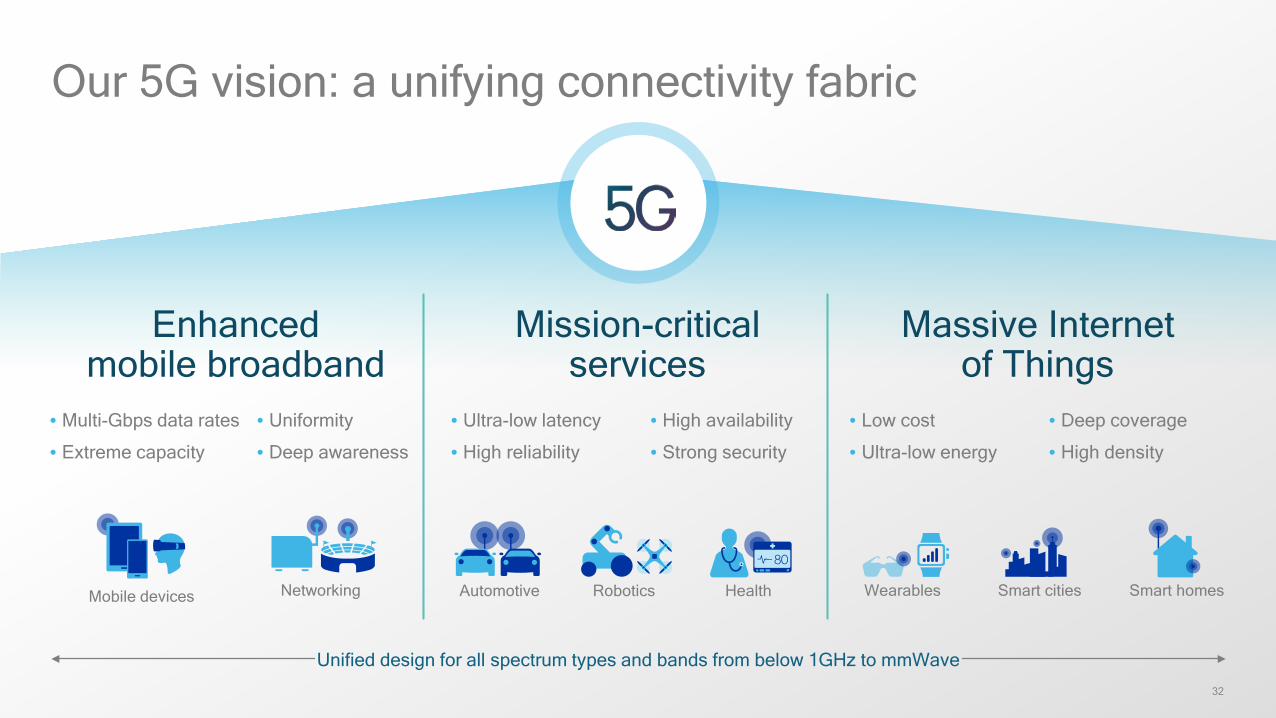
Our 5G vision: a unifying connectivity fabric
Mission-criticalservices
Enhancedmobile broadband
Massive Internetof Things
NetworkingMobile devices RoboticsAutomotive Health Smart cities Smart homesWearables
Unified design for all spectrum types and bands from below 1GHz to mmWave
• Ultra-low latency
• High reliability
• High availability
• Strong security
• Multi-Gbps data rates
• Extreme capacity
• Uniformity
• Deep awareness
• Low cost
• Ultra-low energy
• Deep coverage
• High density
33
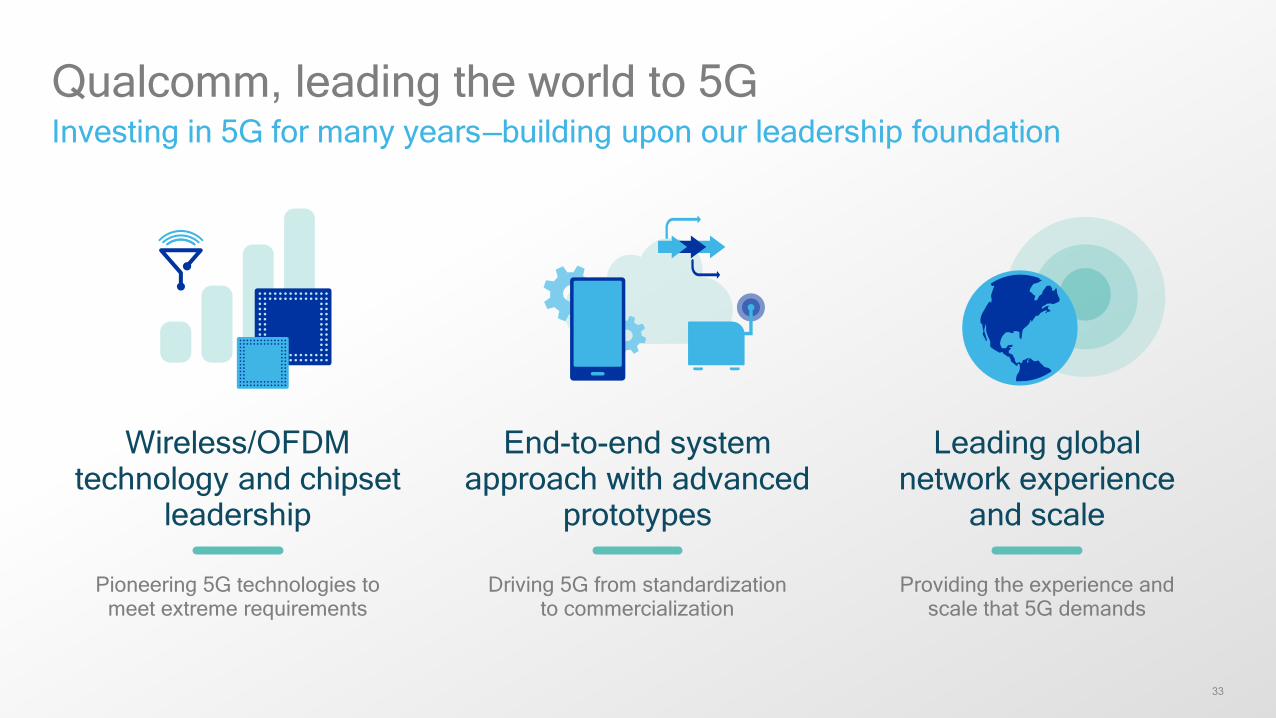
Wireless/OFDM technology and chipset
leadership
Pioneering 5G technologies tomeet extreme requirements
End-to-end systemapproach with advanced
prototypes
Driving 5G from standardizationto commercialization
Leading globalnetwork experience
and scale
Providing the experience andscale that 5G demands
Qualcomm, leading the world to 5GInvesting in 5G for many years—building upon our leadership foundation
34
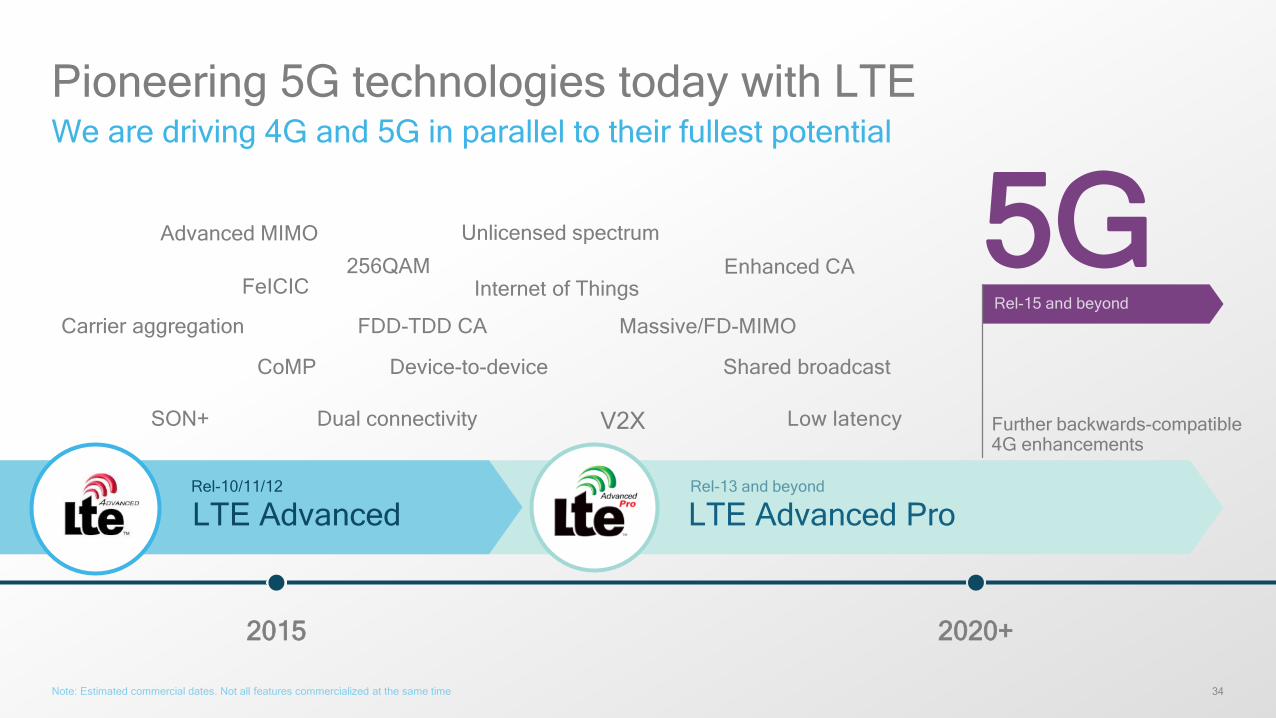
Pioneering 5G technologies today with LTEWe are driving 4G and 5G in parallel to their fullest potential
Note: Estimated commercial dates. Not all features commercialized at the same time
Further backwards-compatible 4G enhancements
5GCarrier aggregation
Dual connectivitySON+
Massive/FD-MIMO
CoMP Device-to-device
Unlicensed spectrum
Enhanced CA
Shared broadcast
Internet of Things256QAM
V2X
FeICIC
Advanced MIMO
FDD-TDD CA
Low latency
LTE Advanced ProLTE AdvancedRel-10/11/12
2015 2020+
35
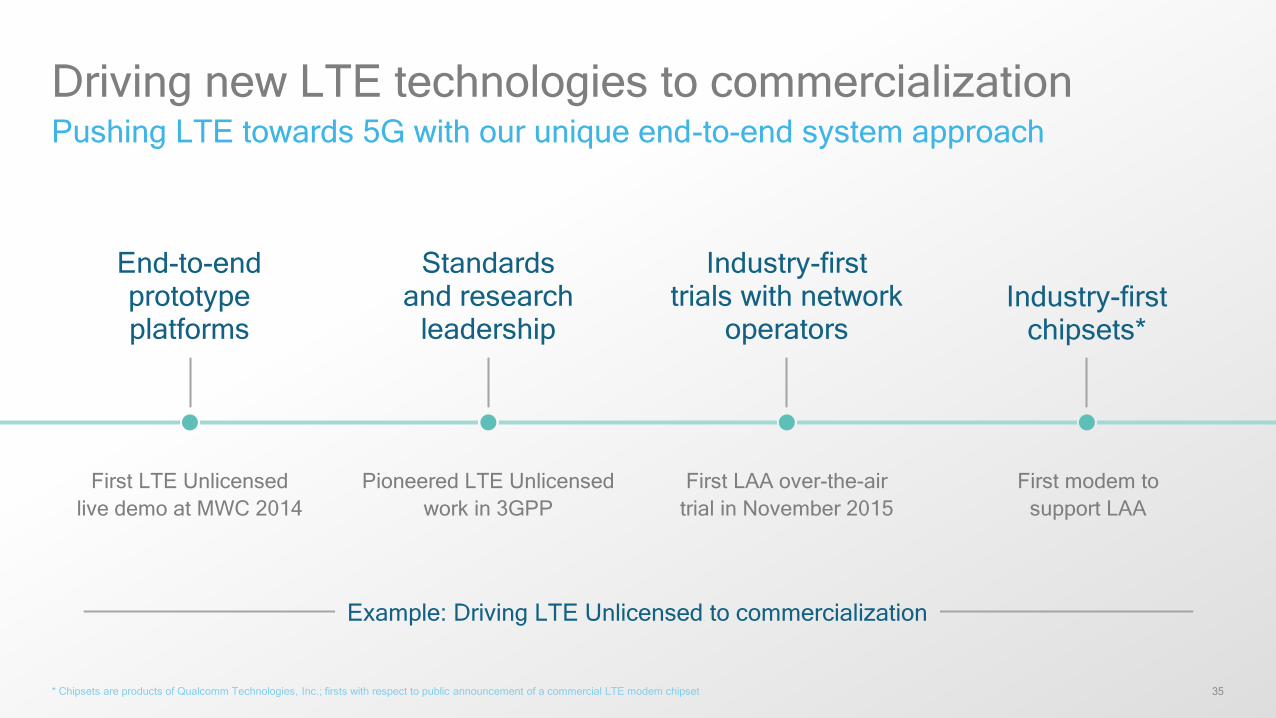
Driving new LTE technologies to commercializationPushing LTE towards 5G with our unique end-to-end system approach
* Chipsets are products of Qualcomm Technologies, Inc.; firsts with respect to public announcement of a commercial LTE modem chipset
Pioneered LTE Unlicensedwork in 3GPP
First modem to support LAA
First LTE Unlicensedlive demo at MWC 2014
First LAA over-the-airtrial in November 2015
End-to-end prototype platforms
Standards and research
leadership
Industry-first trials with network
operatorsIndustry-first
chipsets*
Example: Driving LTE Unlicensed to commercialization
36
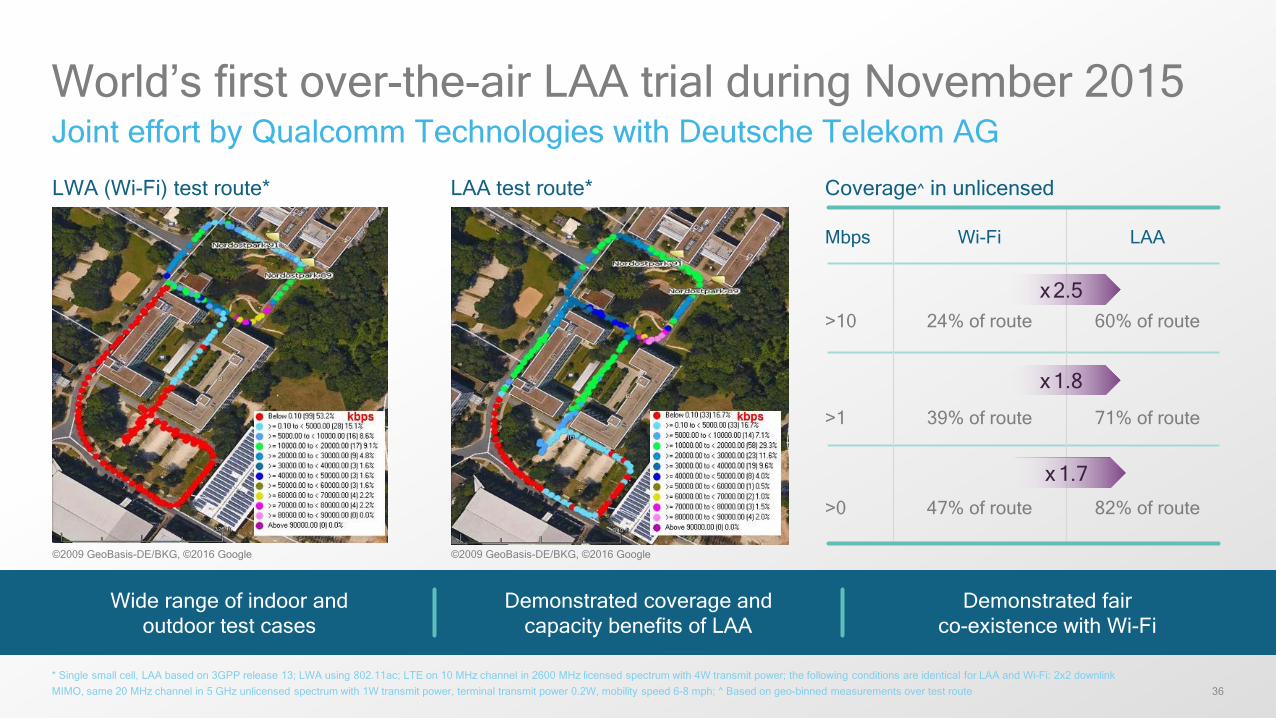
World’s first over-the-air LAA trial during November 2015Joint effort by Qualcomm Technologies with Deutsche Telekom AG
* Single small cell, LAA based on 3GPP release 13; LWA using 802.11ac; LTE on 10 MHz channel in 2600 MHz licensed spectrum with 4W transmit power; the following conditions are identical for LAA and Wi-Fi: 2x2 downlink MIMO, same 20 MHz channel in 5 GHz unlicensed spectrum with 1W transmit power, terminal transmit power 0.2W, mobility speed 6-8 mph; ^ Based on geo-binned measurements over test route
LAA test route* Coverage^ in unlicensed
Mbps Wi-Fi LAA
>10 24% of route 60% of route
>1 39% of route 71% of route
>0 47% of route 82% of route
x2.5
x1.8
x1.7
LWA (Wi-Fi) test route*
©2009 GeoBasis-DE/BKG, ©2016 Google©2009 GeoBasis-DE/BKG, ©2016 Google
Demonstrated coverage and capacity benefits of LAA
Wide range of indoor and outdoor test cases
Demonstrated fair co-existence with Wi-Fi
37
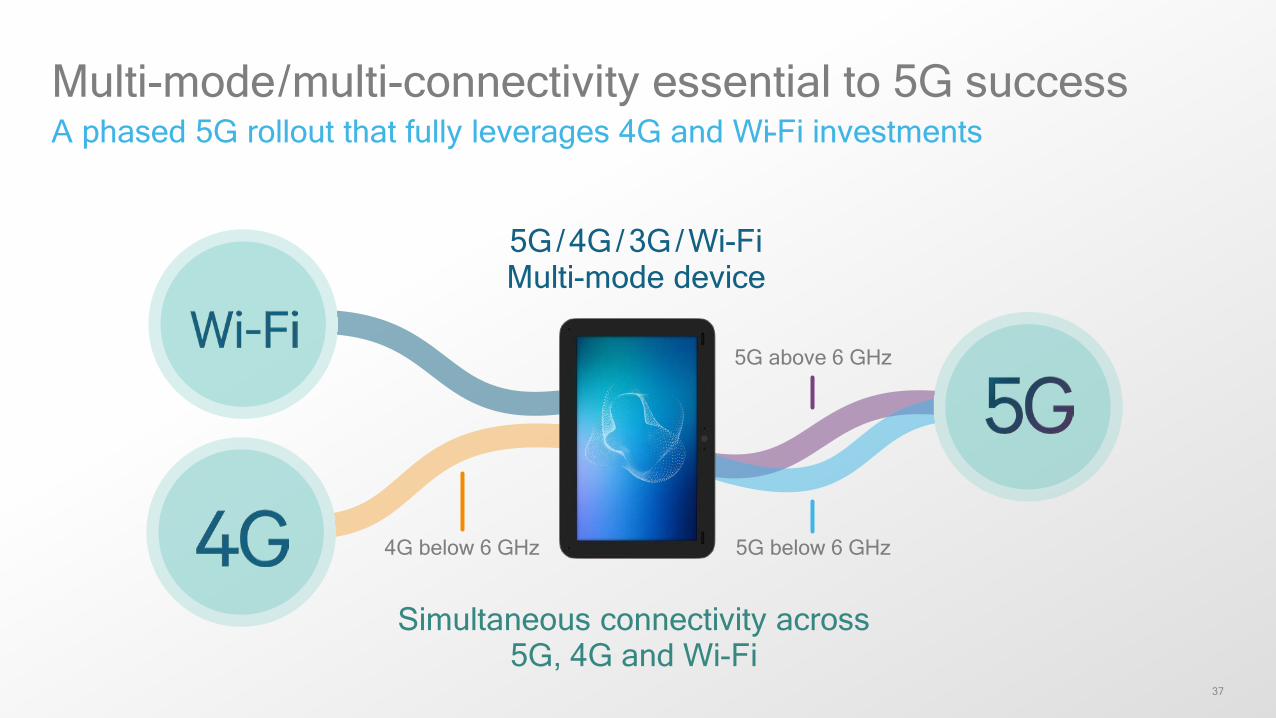
Multi-mode/multi-connectivity essential to 5G successA phased 5G rollout that fully leverages 4G and Wi-Fi investments
4G below 6 GHz
5G above 6 GHz
5G below 6 GHz
5G/4G/3G/Wi-FiMulti-mode device
Simultaneous connectivity across 5G, 4G and Wi-Fi
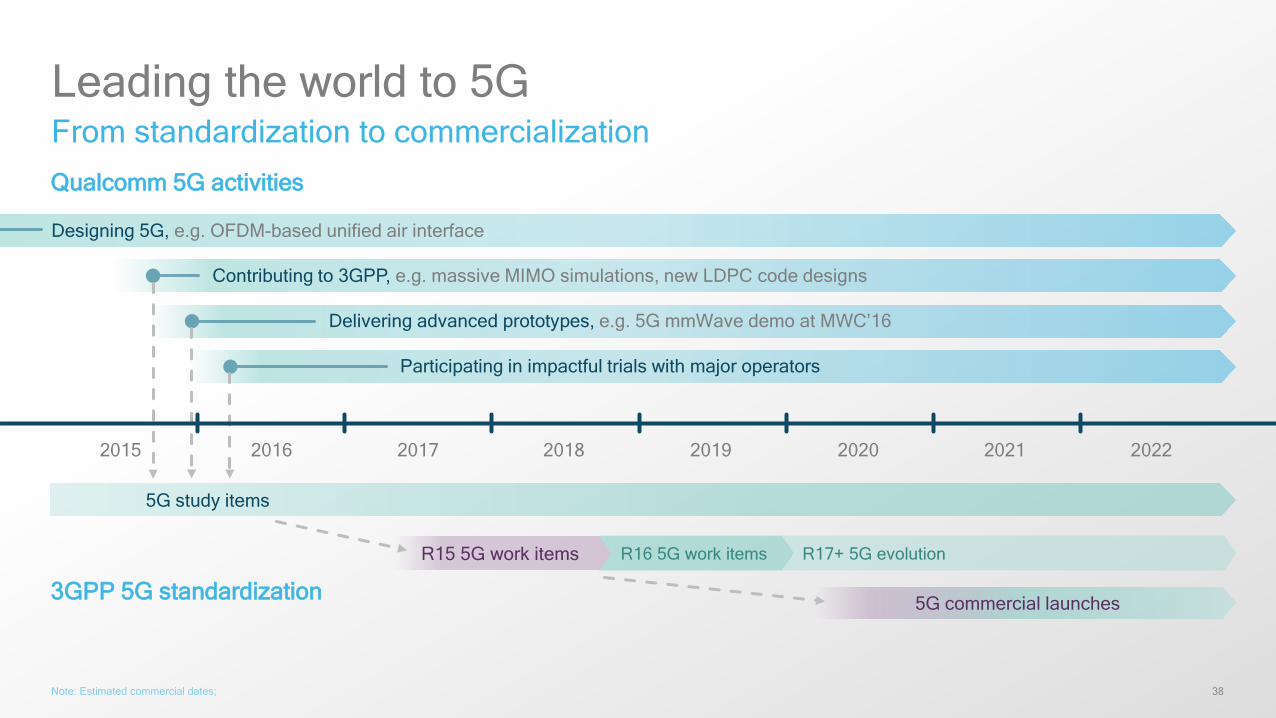
38
Delivering advanced prototypes, e.g. 5G mmWave demo at MWC’16
R17+ 5G evolution
Leading the world to 5G
Note: Estimated commercial dates;
R16 5G work items
5G commercial launches
R15 5G work items
5G study items
3GPP 5G standardization
Qualcomm 5G activities
Designing 5G, e.g. OFDM-based unified air interface
Participating in impactful trials with major operators
Contributing to 3GPP, e.g. massive MIMO simulations, new LDPC code designs
2016 20212017 2019 2020 20222015 2018
From standardization to commercialization
39
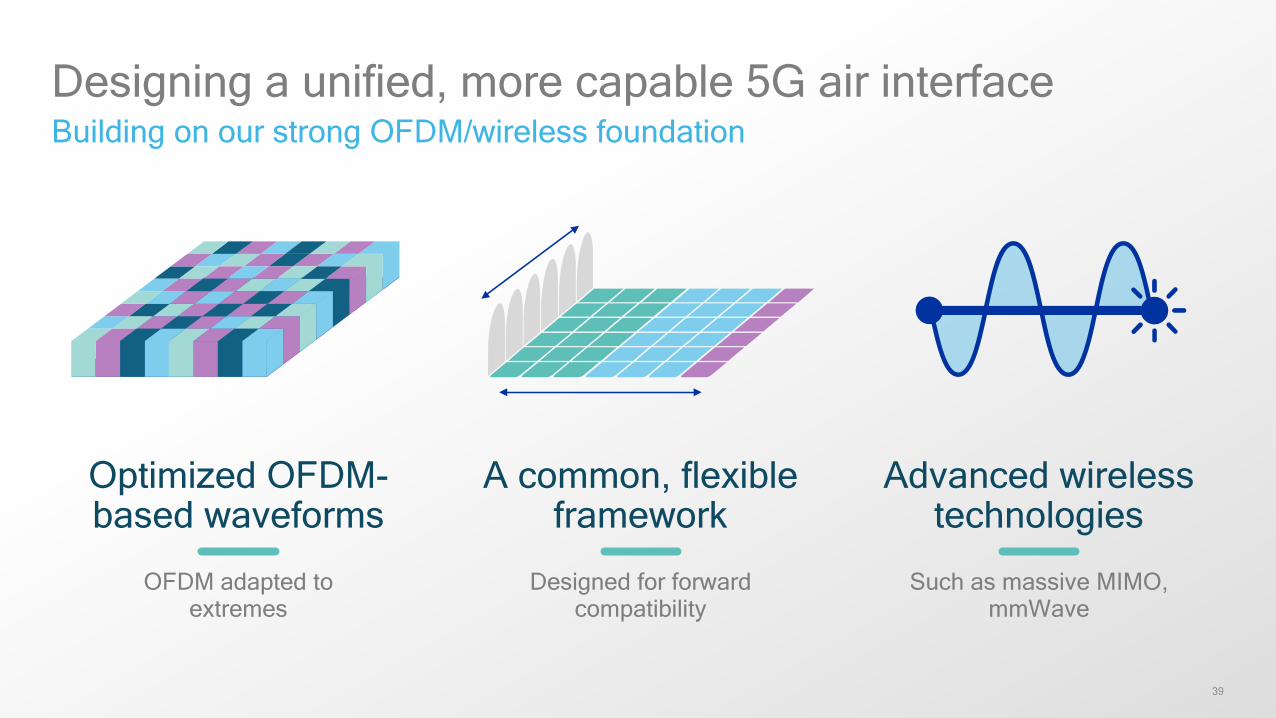
Designing a unified, more capable 5G air interfaceBuilding on our strong OFDM/wireless foundation
Optimized OFDM-based waveforms
A common, flexibleframework
Advanced wireless technologies
OFDM adapted to extremes
Such as massive MIMO, mmWave
Designed for forward compatibility
40
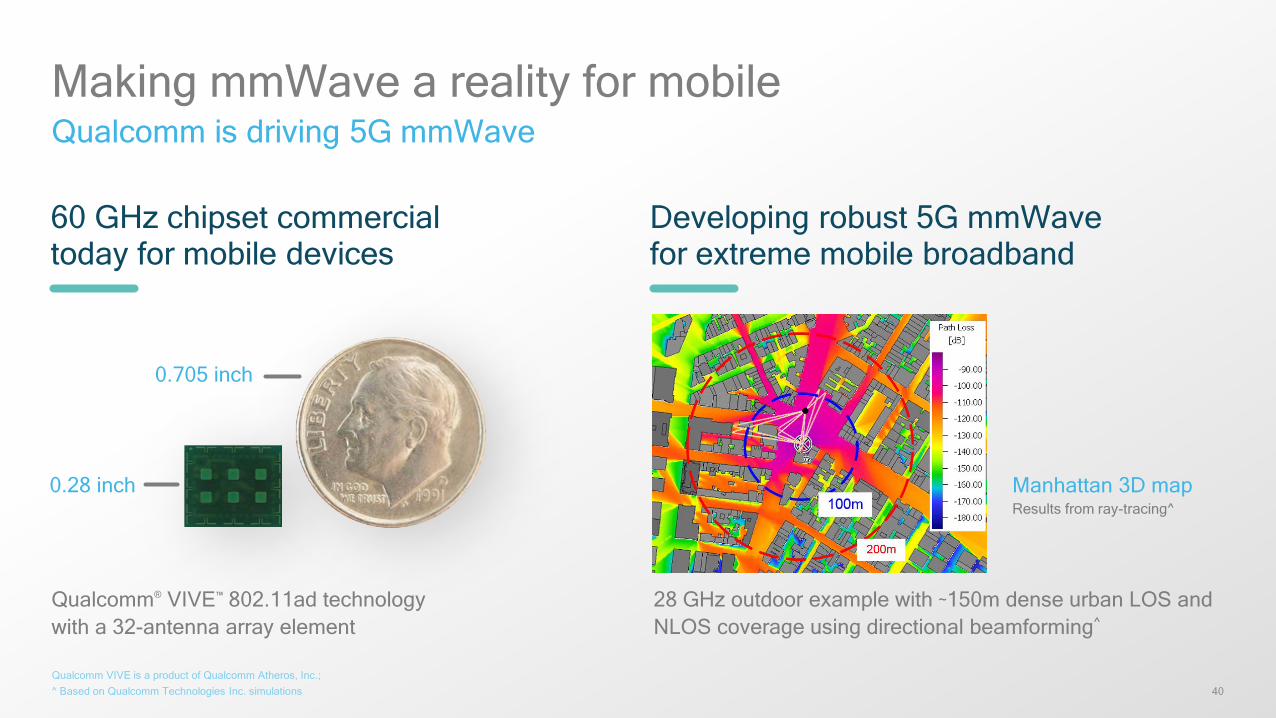
Making mmWave a reality for mobileQualcomm is driving 5G mmWave
Qualcomm VIVE is a product of Qualcomm Atheros, Inc.;^ Based on Qualcomm Technologies Inc. simulations
Qualcomm® VIVE™ 802.11ad technology with a 32-antenna array element
60 GHz chipset commercial today for mobile devices
Developing robust 5G mmWavefor extreme mobile broadband
0.705 inch
0.28 inch
28 GHz outdoor example with ~150m dense urban LOS and NLOS coverage using directional beamforming^
Manhattan 3D mapResults from ray-tracing^
41
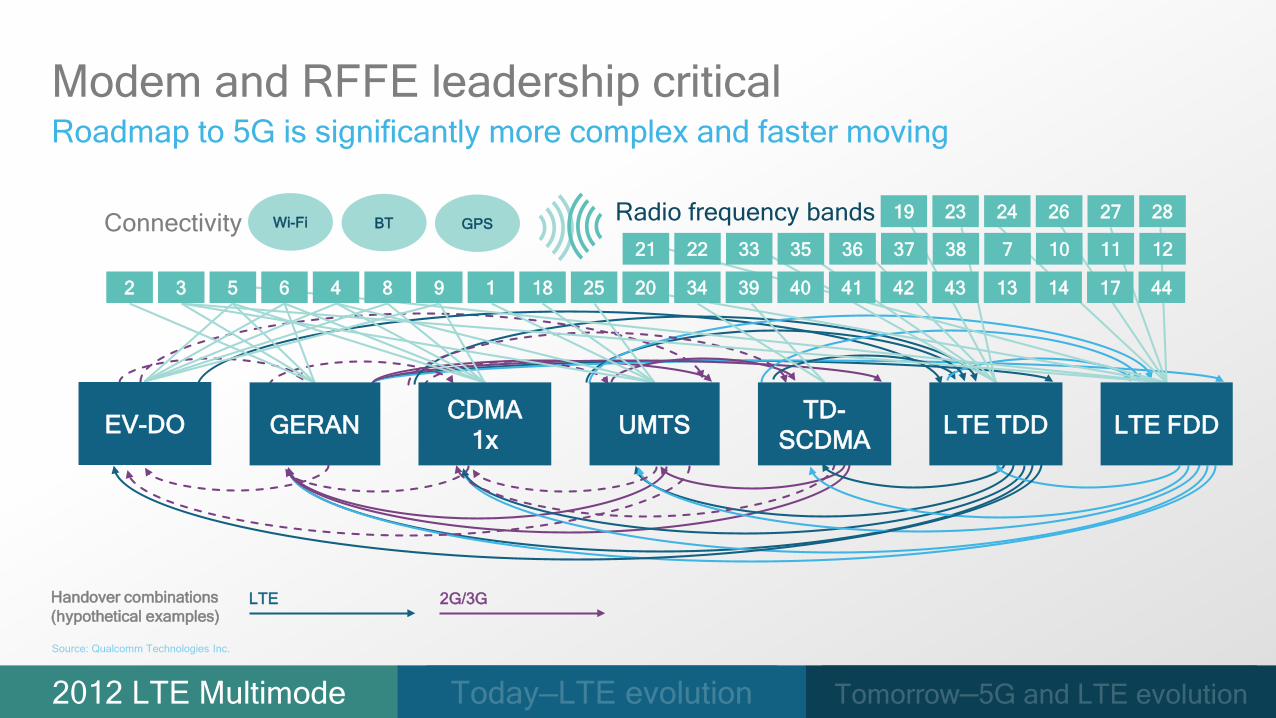
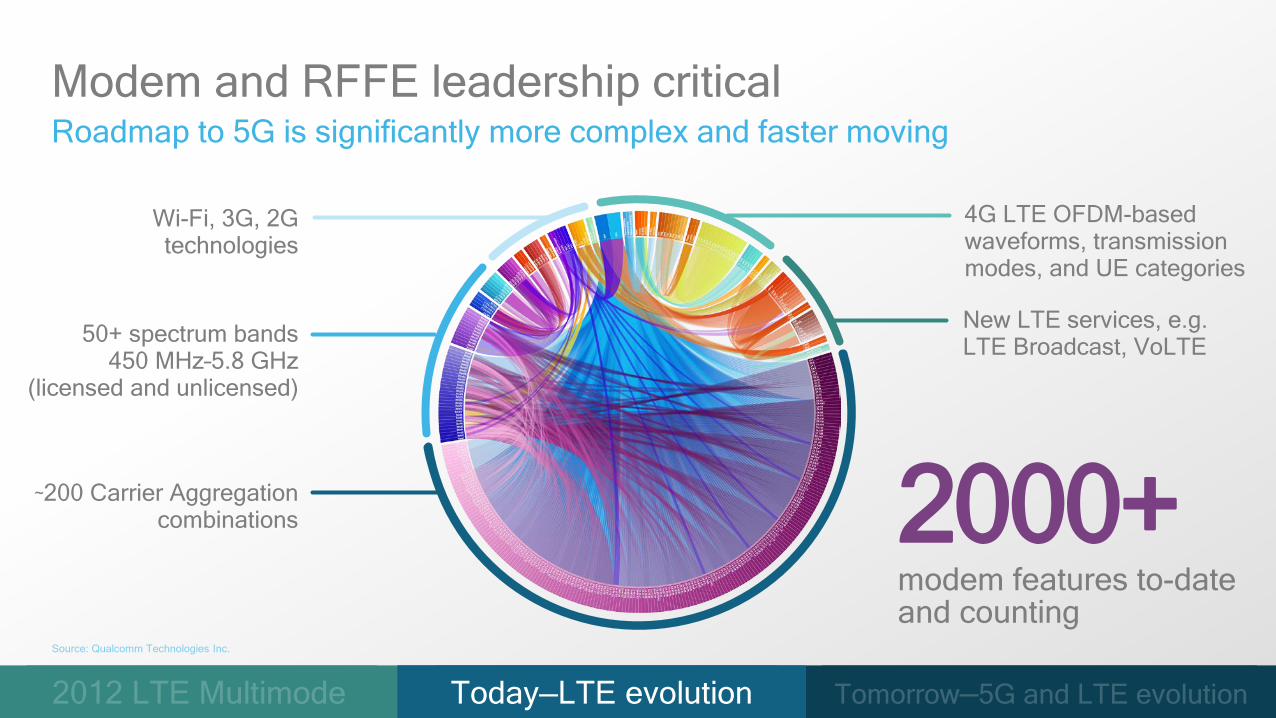
Modem and RFFE leadership critical Roadmap to 5G is significantly more complex and faster moving
Source: Qualcomm Technologies Inc.
2012 LTE Multimode Today—LTE evolution Tomorrow—5G and LTE evolution
LTE 2G/3GHandover combinations (hypothetical examples)
GERAN CDMA 1x UMTS TD-
SCDMA LTE TDD LTE FDDEV-DO
Connectivity Wi-Fi BT GPS
22 33
27
35 36 37 38
39 40 41 42 4312 83 45 6 9
28
34
7 10 11 12
13 14 17 4418
19
20
21
23 24
25
26Radio frequency bands
42
GERAN CDMA 1x UMTS TD-
SCDMA LTE TDD LTE FDDEV-DO
Connectivity Wi-Fi BT GPS
22 33
27
35 36 37 38
39 40 41 42 4312 83 45 6 9
28
34
7 10 11 12
13 14 17 4418
19
20
21
23 24
25
26Radio frequency bands
Modem and RFFE leadership critical Roadmap to 5G is significantly more complex and faster moving
Source: Qualcomm Technologies Inc.,
2000+modem features to-date and counting
50+ spectrum bands450 MHz–5.8 GHz
(licensed and unlicensed)
~200 Carrier Aggregationcombinations
New LTE services, e.g. LTE Broadcast, VoLTE
Wi-Fi, 3G, 2G technologies
4G LTE OFDM-based waveforms, transmission modes, and UE categories
2012 LTE Multimode Tomorrow—5G and LTE evolution
Source: Qualcomm Technologies Inc.
Today—LTE evolutionToday—LTE evolution
43
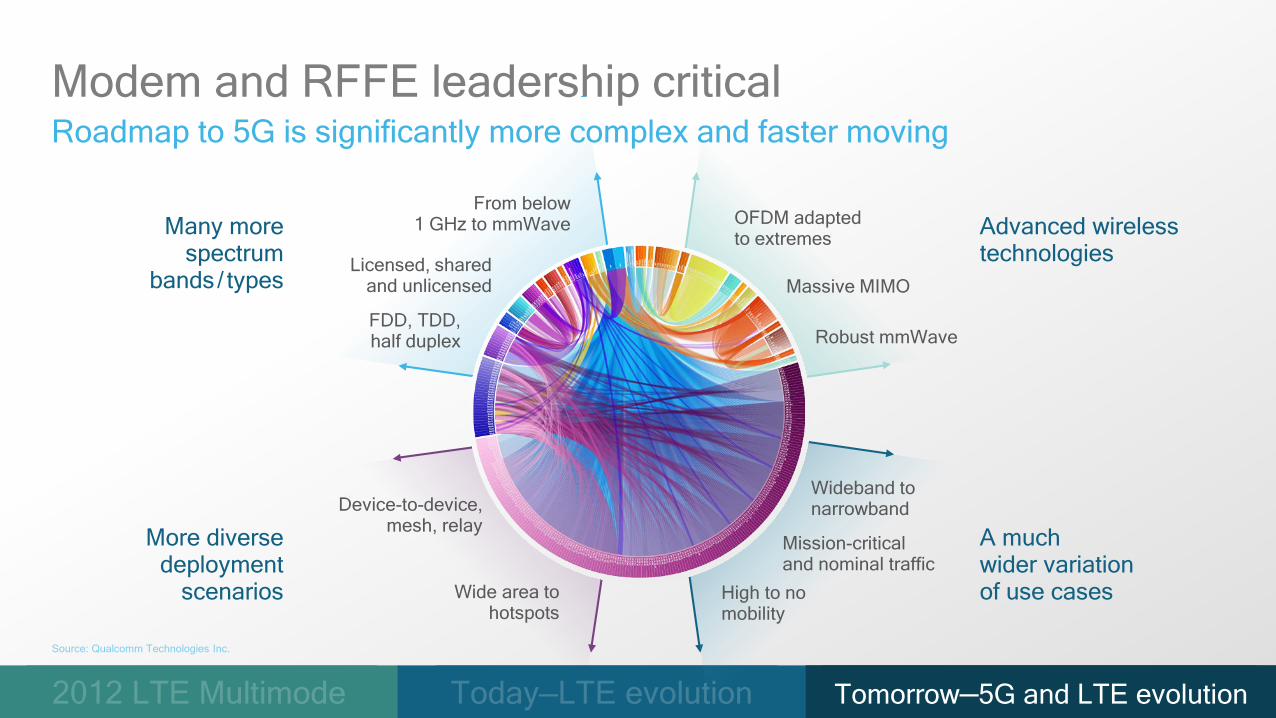
Modem and RFFE leadership critical Roadmap to 5G is significantly more complex and faster moving
Source: Qualcomm Technologies Inc., 2012 LTE Multimode Tomorrow – 5G and LTE evolutionToday—LTE evolution Tomorrow—5G and LTE evolution
More diverse deployment
scenarios
Many more spectrum
bands/ types
A much wider variation of use cases
Advanced wireless technologies
FDD, TDD, half duplex
Licensed, shared and unlicensed
From below 1 GHz to mmWave OFDM adapted
to extremes
Massive MIMO
Robust mmWave
Mission-critical and nominal traffic
High to no mobility
Device-to-device, mesh, relay
Wide area to hotspots
Wideband to narrowband
Source: Qualcomm Technologies Inc.
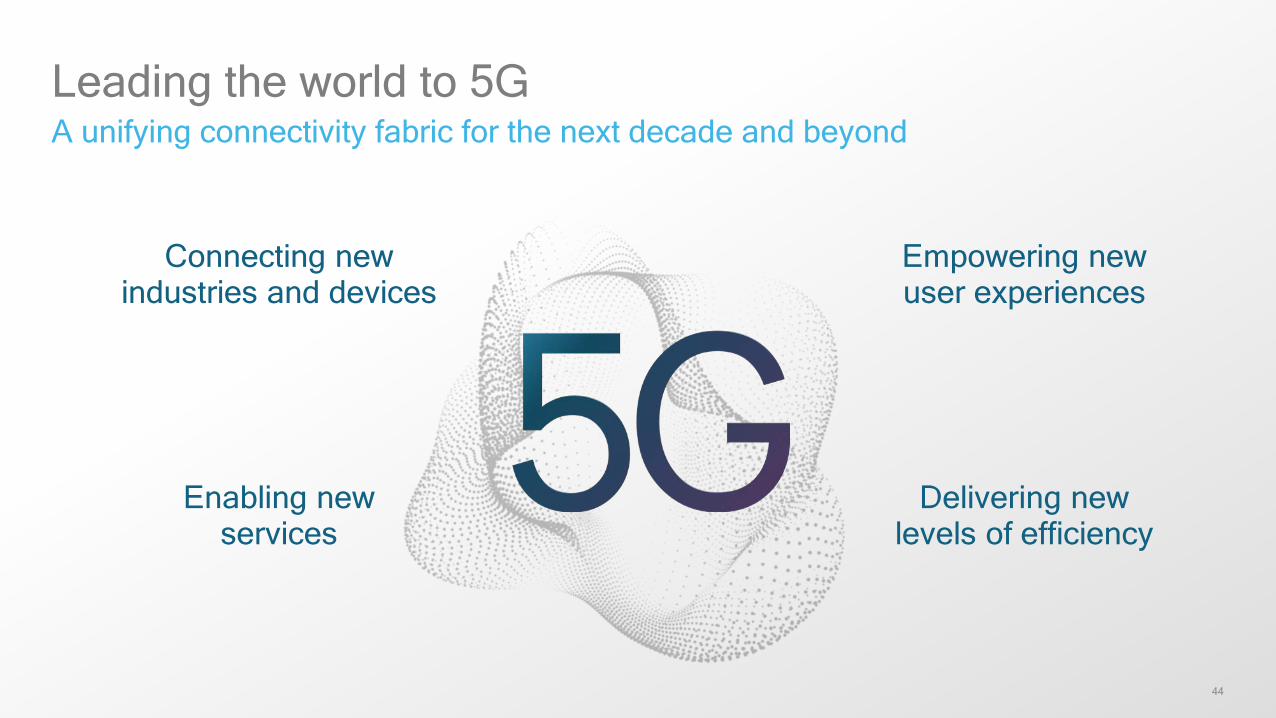
44
Empowering new user experiences
Connecting new industries and devices
Enabling new services
Delivering new levels of efficiency
Leading the world to 5GA unifying connectivity fabric for the next decade and beyond
Derek Aberle
President, Qualcomm Incorporated
46
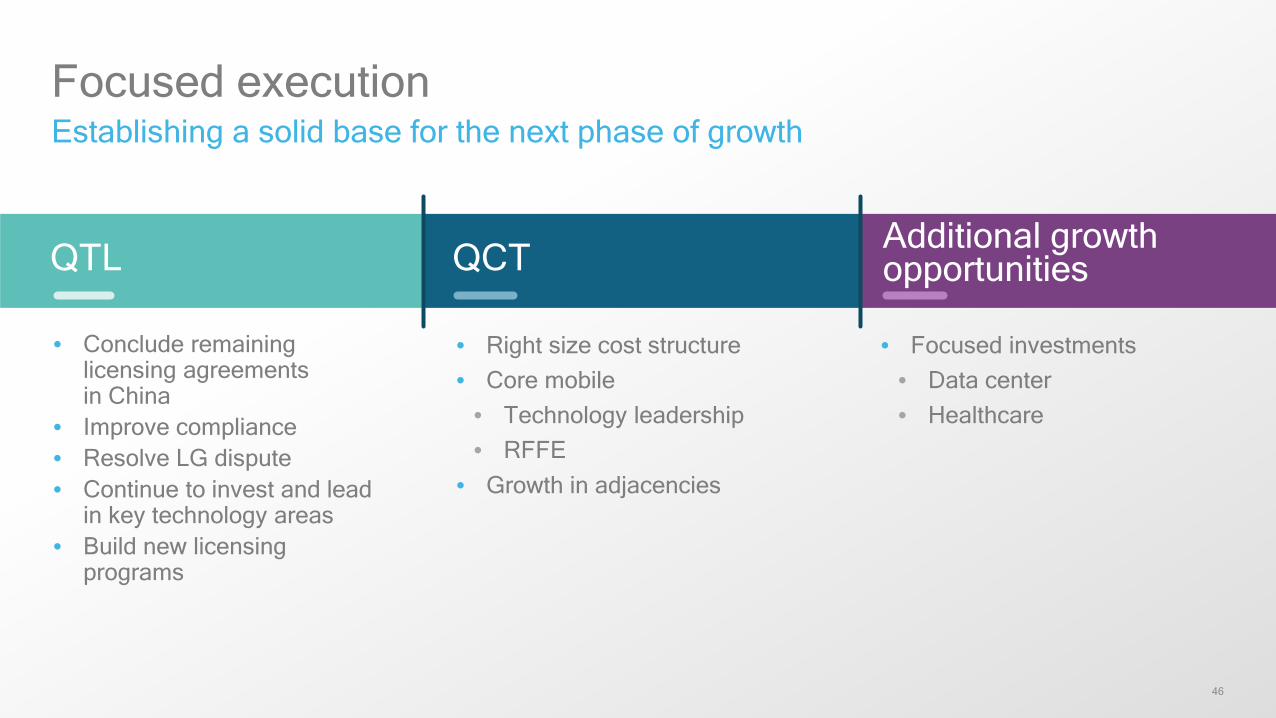
Focused executionEstablishing a solid base for the next phase of growth
QTL Additional growth opportunities
• Right size cost structure• Core mobile
• Technology leadership• RFFE
• Growth in adjacencies
• Conclude remaining licensing agreements in China
• Improve compliance• Resolve LG dispute• Continue to invest and lead
in key technology areas• Build new licensing
programs
• Focused investments• Data center• Healthcare
QCT
QTL: China update
48
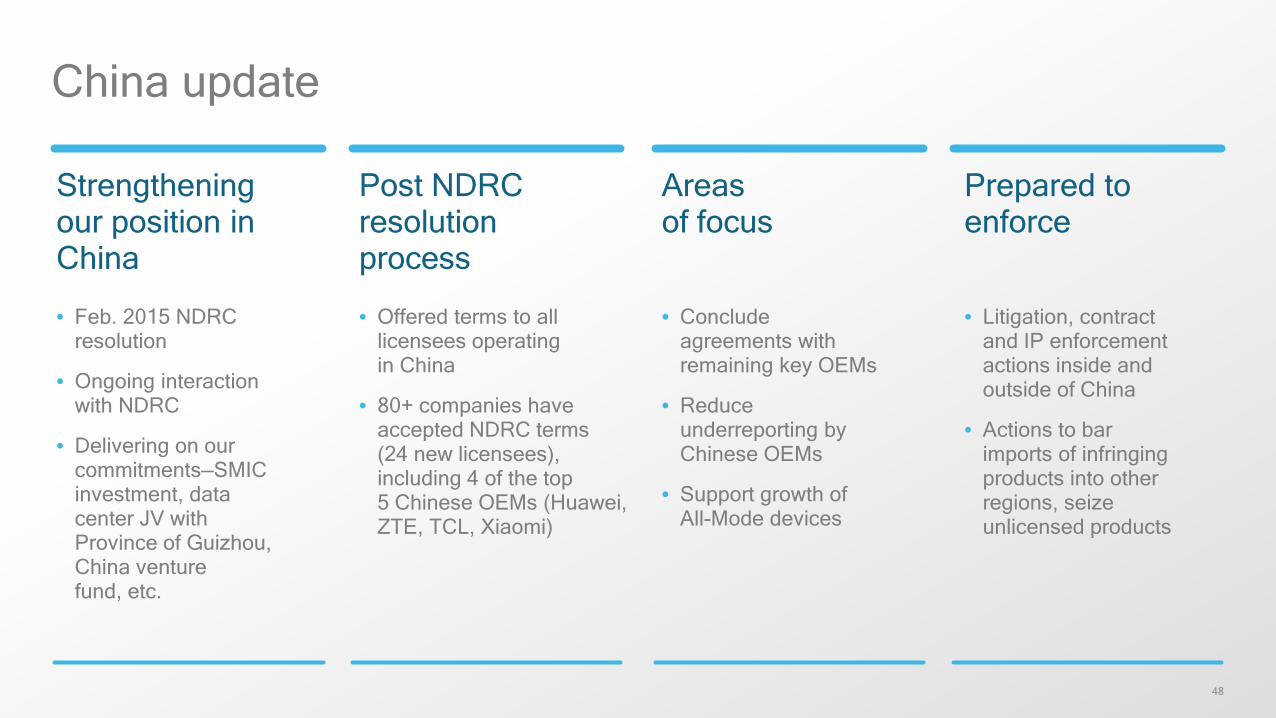
China update
Strengthening our position in China
• Feb. 2015 NDRC resolution
• Ongoing interaction with NDRC
• Delivering on our commitments—SMIC investment, data center JV with Province of Guizhou, China venture fund, etc.
Post NDRC resolution process
• Offered terms to all licensees operating in China
• 80+ companies have accepted NDRC terms (24 new licensees), including 4 of the top 5 Chinese OEMs (Huawei, ZTE, TCL, Xiaomi)
Areas of focus
Prepared to enforce
• Litigation, contract and IP enforcement actions inside and outside of China
• Actions to bar imports of infringing products into other regions, seize unlicensed products
• Conclude agreements with remaining key OEMs
• Reduce underreporting by Chinese OEMs
• Support growth of All-Mode devices
49
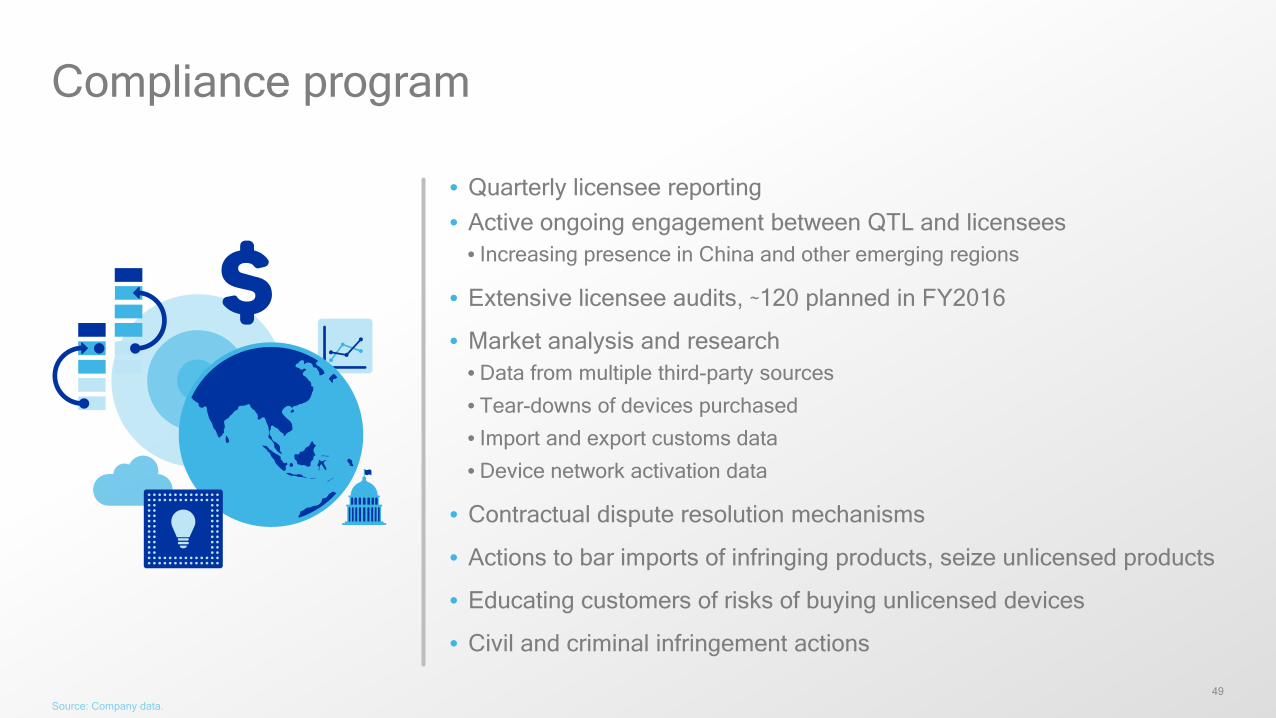
Compliance program
• Quarterly licensee reporting• Active ongoing engagement between QTL and licensees
• Increasing presence in China and other emerging regions
• Extensive licensee audits, ~120 planned in FY2016
• Market analysis and research• Data from multiple third-party sources
• Tear-downs of devices purchased
• Import and export customs data
• Device network activation data
• Contractual dispute resolution mechanisms
• Actions to bar imports of infringing products, seize unlicensed products
• Educating customers of risks of buying unlicensed devices
• Civil and criminal infringement actions
Source: Company data.
50
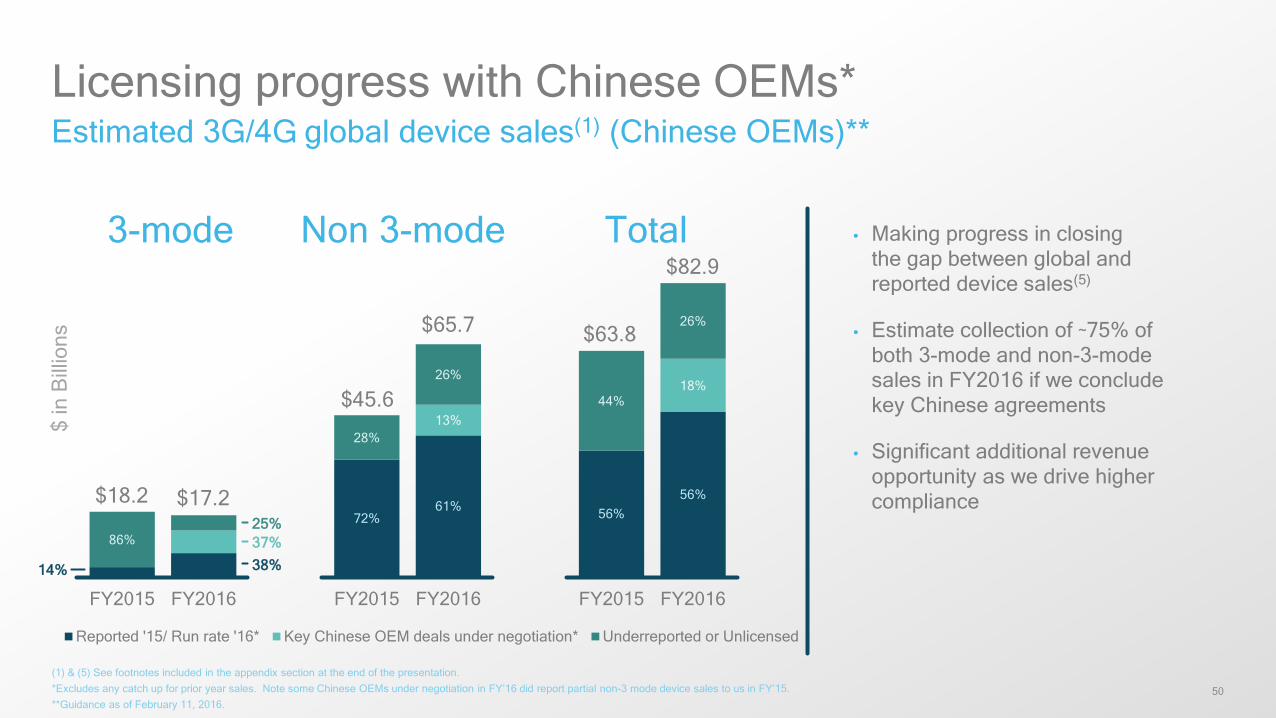
Licensing progress with Chinese OEMs*Estimated 3G/4G global device sales(1) (Chinese OEMs)**
(1) & (5) See footnotes included in the appendix section at the end of the presentation. *Excludes any catch up for prior year sales. Note some Chinese OEMs under negotiation in FY’16 did report partial non-3 mode device sales to us in FY’15. **Guidance as of February 11, 2016.
72%61% 56%
56%
13%
18%
86%
28%
26%
44%
26%
FY2015 FY2016 FY2015 FY2016 FY2015 FY2016
Reported '15/ Run rate '16* Key Chinese OEM deals under negotiation* Underreported or Unlicensed
$ in
Bill
ions
$17.2$18.2
$82.9
$63.8$65.7
$45.6
3-mode Non 3-mode Total • Making progress in closing the gap between global and reported device sales(5)
• Estimate collection of ~75% of both 3-mode and non-3-mode sales in FY2016 if we conclude key Chinese agreements
• Significant additional revenue opportunity as we drive higher compliance
25%37%
14% 38%
3G/4G deviceopportunity
3G 4G
52
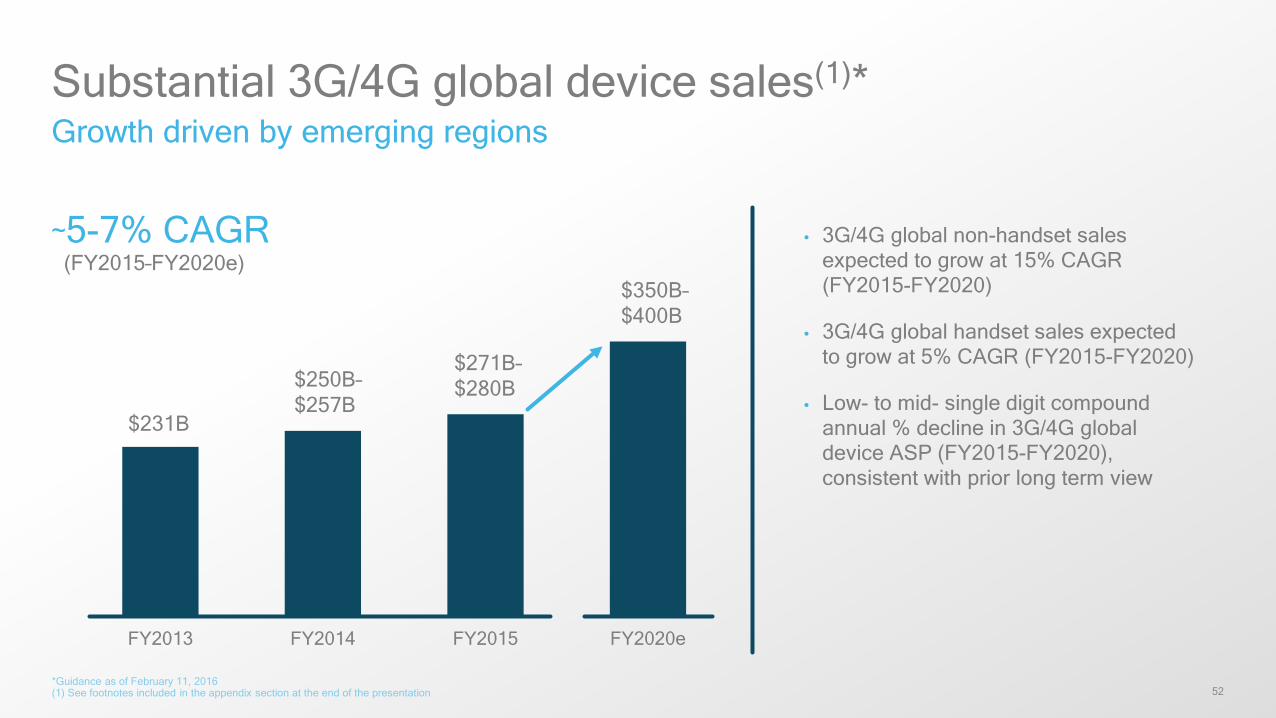
FY2013 FY2014 FY2015 FY2020e
Substantial 3G/4G global device sales(1)*Growth driven by emerging regions
• 3G/4G global non-handset sales expected to grow at 15% CAGR (FY2015-FY2020)
• 3G/4G global handset sales expected to grow at 5% CAGR (FY2015-FY2020)
• Low- to mid- single digit compound annual % decline in 3G/4G global device ASP (FY2015-FY2020), consistent with prior long term view
$231B
$250B–$257B
$271B–$280B
$350B–$400B
~5-7% CAGR(FY2015–FY2020e)
*Guidance as of February 11, 2016(1) See footnotes included in the appendix section at the end of the presentation
53
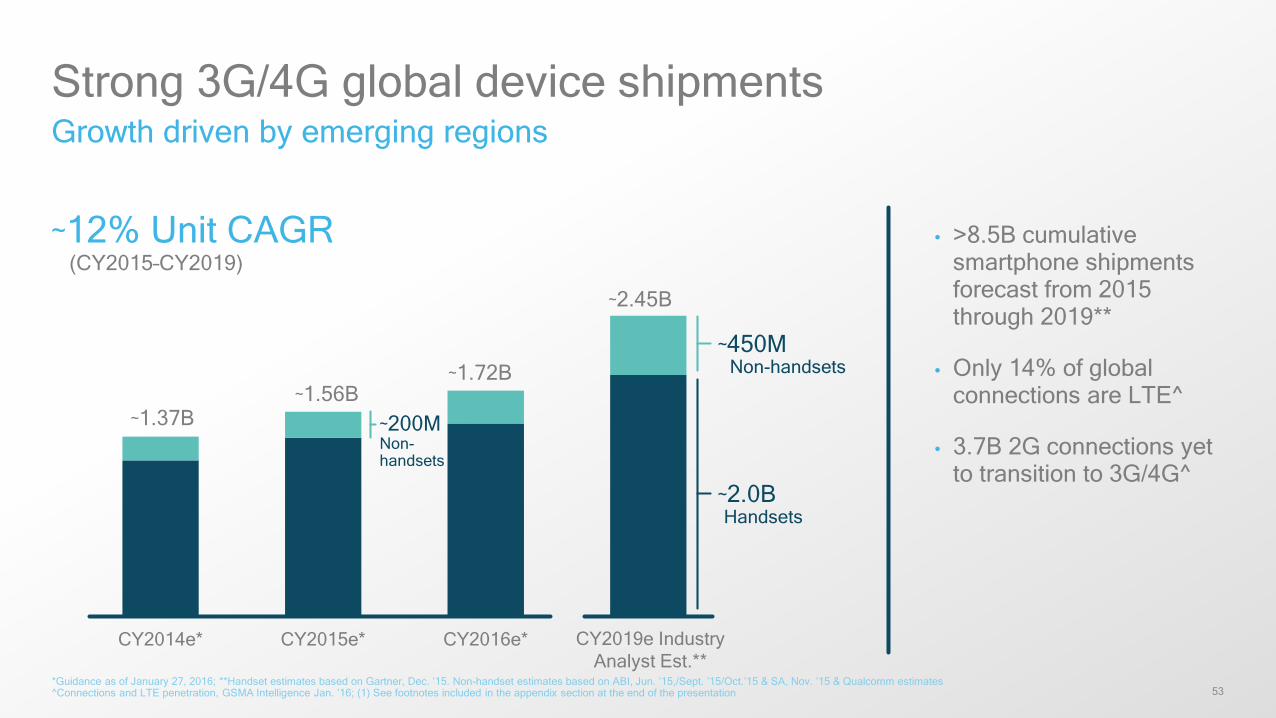
CY2014e* CY2015e* CY2016e* CY2019e **
Strong 3G/4G global device shipmentsGrowth driven by emerging regions
• >8.5B cumulative smartphone shipments forecast from 2015 through 2019**
• Only 14% of global connections are LTE^
• 3.7B 2G connections yet to transition to 3G/4G^
*Guidance as of January 27, 2016; **Handset estimates based on Gartner, Dec. ’15. Non-handset estimates based on ABI, Jun. ’15,/Sept. ’15/Oct.’15 & SA, Nov. ’15 & Qualcomm estimates^Connections and LTE penetration, GSMA Intelligence Jan. ’16; (1) See footnotes included in the appendix section at the end of the presentation
CY2019e Industry Analyst Est.**
~200MNon-handsets
~450M Non-handsets
~1.37B~1.56B
~1.72B
~2.45B
~12% Unit CAGR(CY2015–CY2019)
~2.0B Handsets
Smartphones
55
51%
35%
14%
Q4 2015
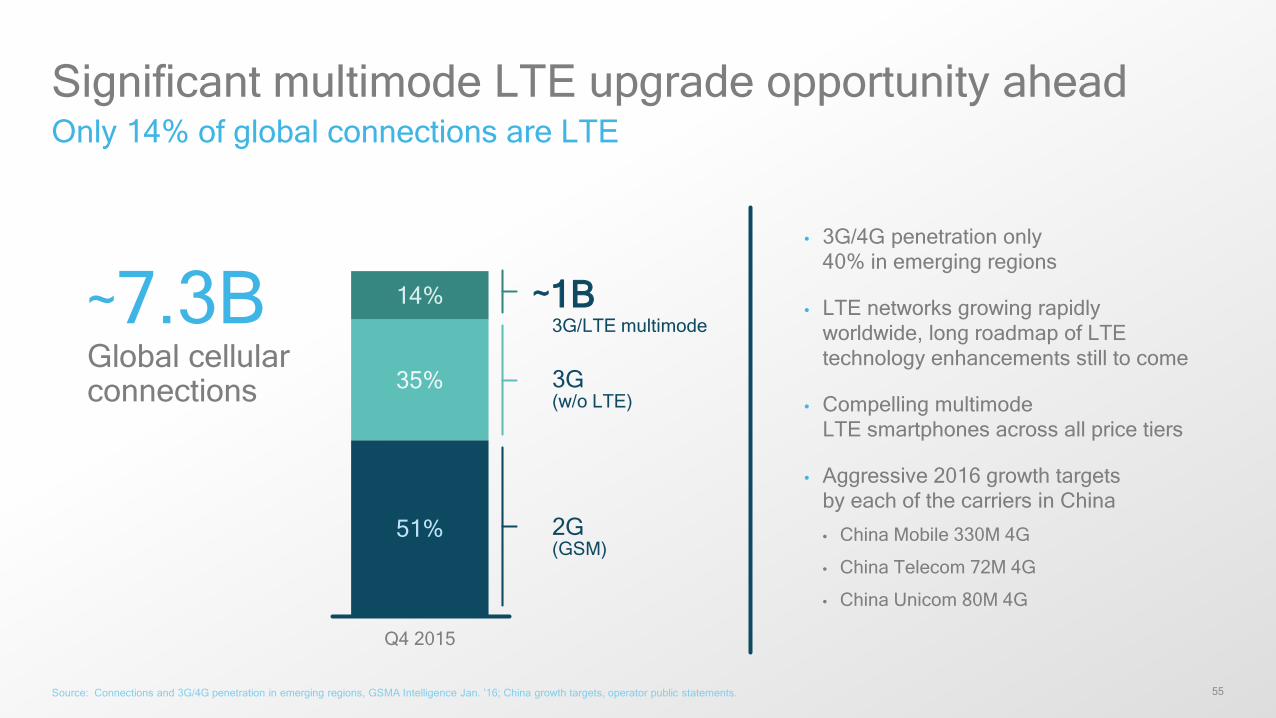
Significant multimode LTE upgrade opportunity aheadOnly 14% of global connections are LTE
~7.3BGlobal cellular connections
~1B3G/LTE multimode
3G (w/o LTE)
2G(GSM)
• 3G/4G penetration only 40% in emerging regions
• LTE networks growing rapidly worldwide, long roadmap of LTE technology enhancements still to come
• Compelling multimode LTE smartphones across all price tiers
• Aggressive 2016 growth targets by each of the carriers in China
• China Mobile 330M 4G
• China Telecom 72M 4G
• China Unicom 80M 4G
Source: Connections and 3G/4G penetration in emerging regions, GSMA Intelligence Jan. ’16; China growth targets, operator public statements.
56
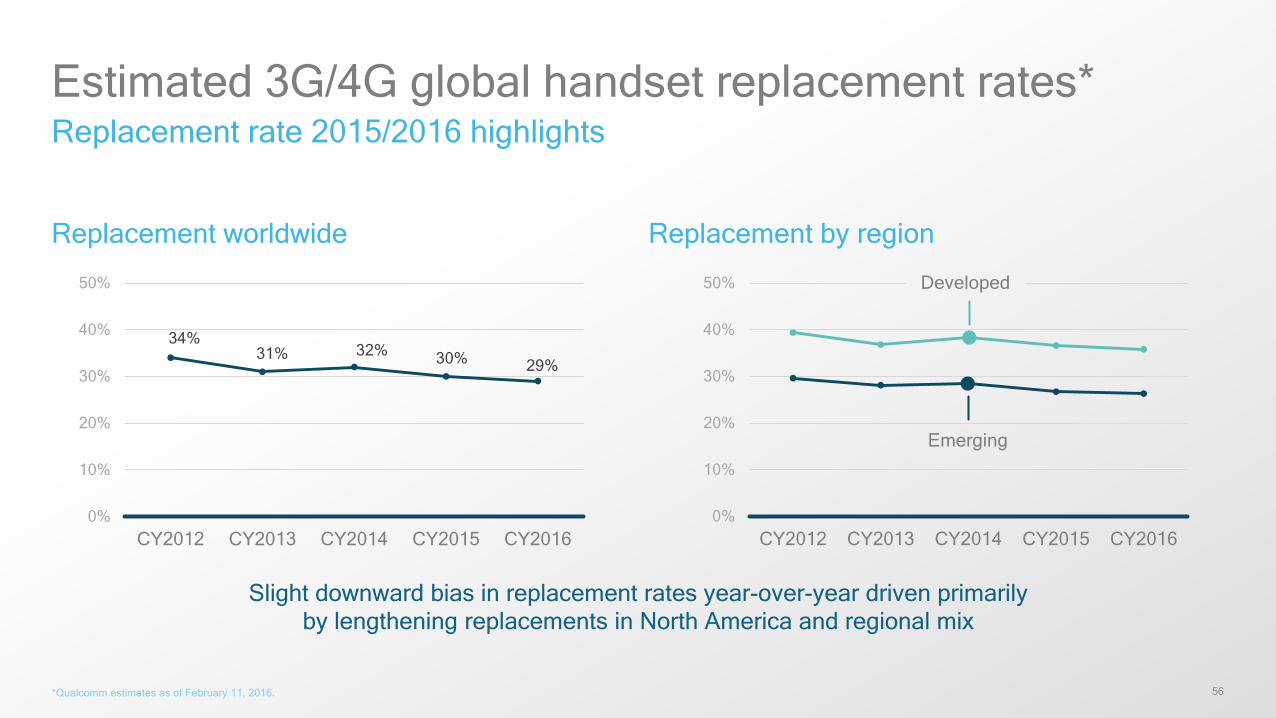
Estimated 3G/4G global handset replacement rates*Replacement rate 2015/2016 highlights
Replacement worldwide
Slight downward bias in replacement rates year-over-year driven primarily by lengthening replacements in North America and regional mix
34%31% 32% 30% 29%
0%
10%
20%
30%
40%
50%
CY2012 CY2013 CY2014 CY2015 CY20160%
10%
20%
30%
40%
50%
CY2012 CY2013 CY2014 CY2015 CY2016
Developed
Emerging
Replacement by region
*Qualcomm estimates as of February 11, 2016.
57
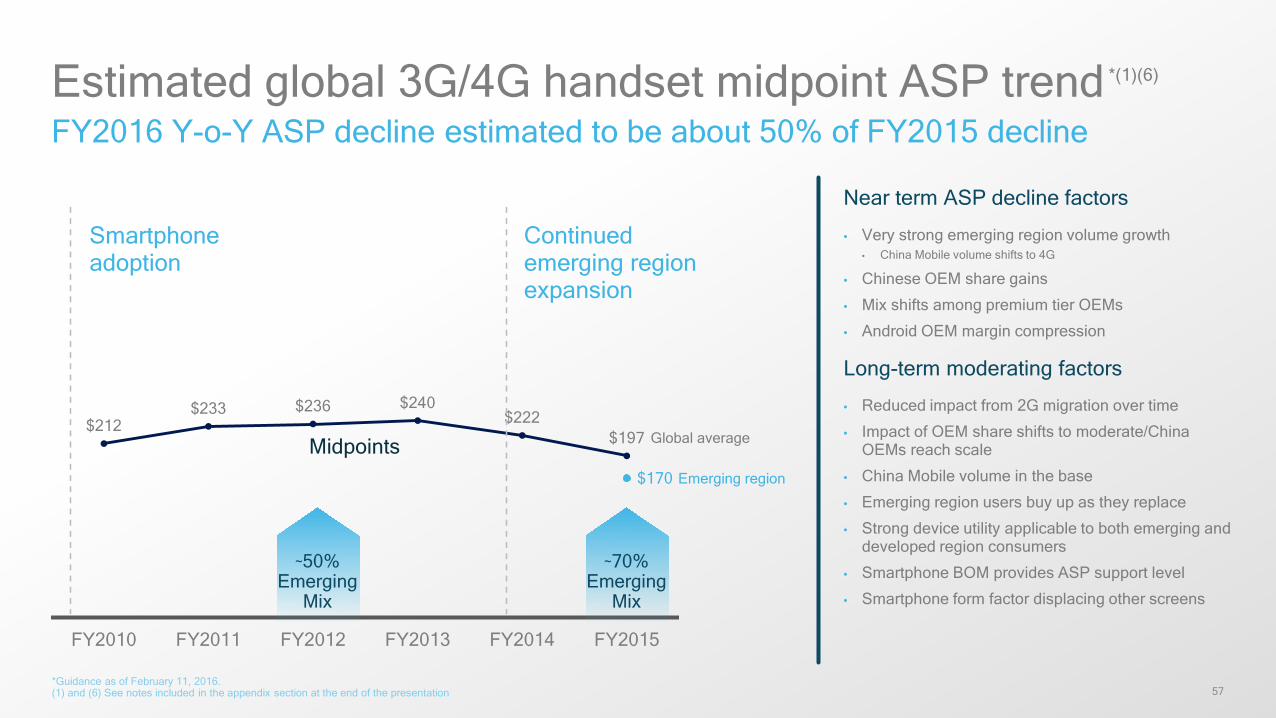
$212$233 $236 $240
$222$197
FY2010 FY2011 FY2012 FY2013 FY2014 FY2015
Estimated global 3G/4G handset midpoint ASP trend *(1)(6)
Smartphone adoption
Midpoints
Continued emerging region expansion
Near term ASP decline factors
• Very strong emerging region volume growth• China Mobile volume shifts to 4G
• Chinese OEM share gains
• Mix shifts among premium tier OEMs
• Android OEM margin compression
Long-term moderating factors
• Reduced impact from 2G migration over time
• Impact of OEM share shifts to moderate/China OEMs reach scale
• China Mobile volume in the base
• Emerging region users buy up as they replace
• Strong device utility applicable to both emerging and developed region consumers
• Smartphone BOM provides ASP support level
• Smartphone form factor displacing other screens
*Guidance as of February 11, 2016. (1) and (6) See notes included in the appendix section at the end of the presentation
FY2016 Y-o-Y ASP decline estimated to be about 50% of FY2015 decline
~70% Emerging
Mix
$170
Global average
Emerging region
~50% Emerging
Mix
Non-handsets
59
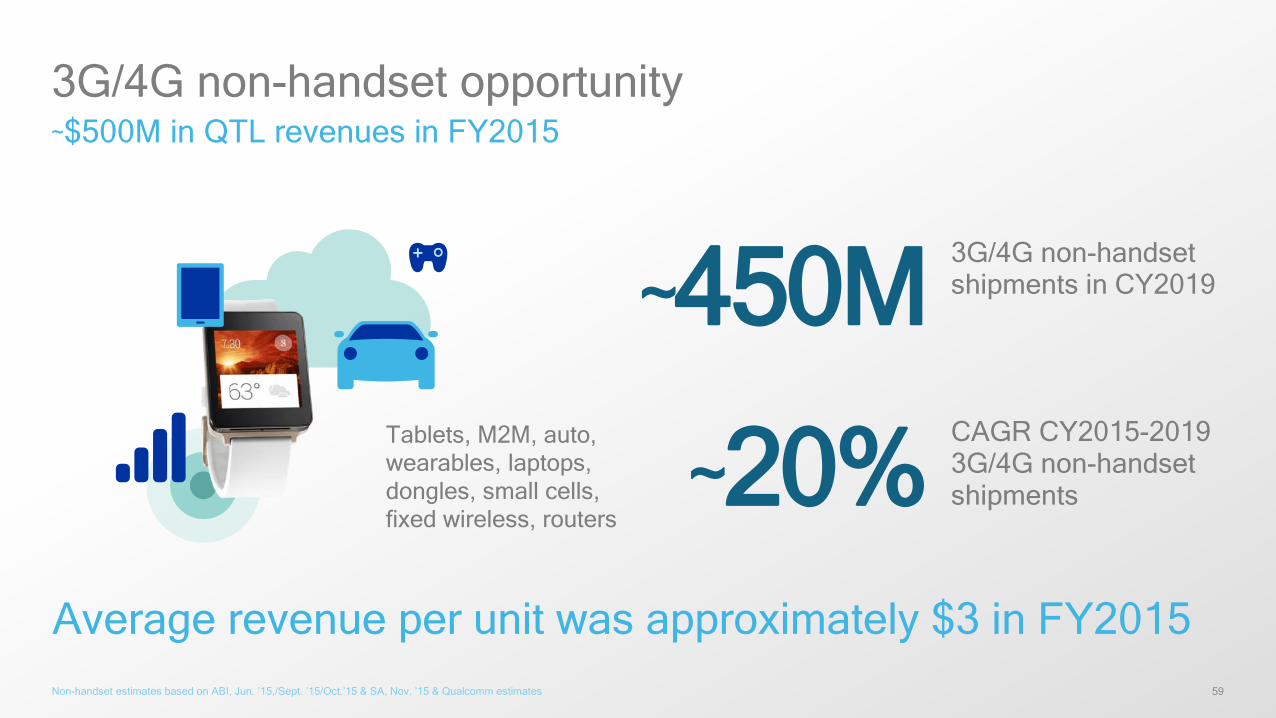
3G/4G non-handset opportunity~$500M in QTL revenues in FY2015
Non-handset estimates based on ABI, Jun. ’15,/Sept. ’15/Oct.’15 & SA, Nov. ’15 & Qualcomm estimates
~20% CAGR CY2015-20193G/4G non-handset shipments
Tablets, M2M, auto, wearables, laptops, dongles, small cells, fixed wireless, routers
~450M 3G/4G non-handset shipments in CY2019
Average revenue per unit was approximately $3 in FY2015
60
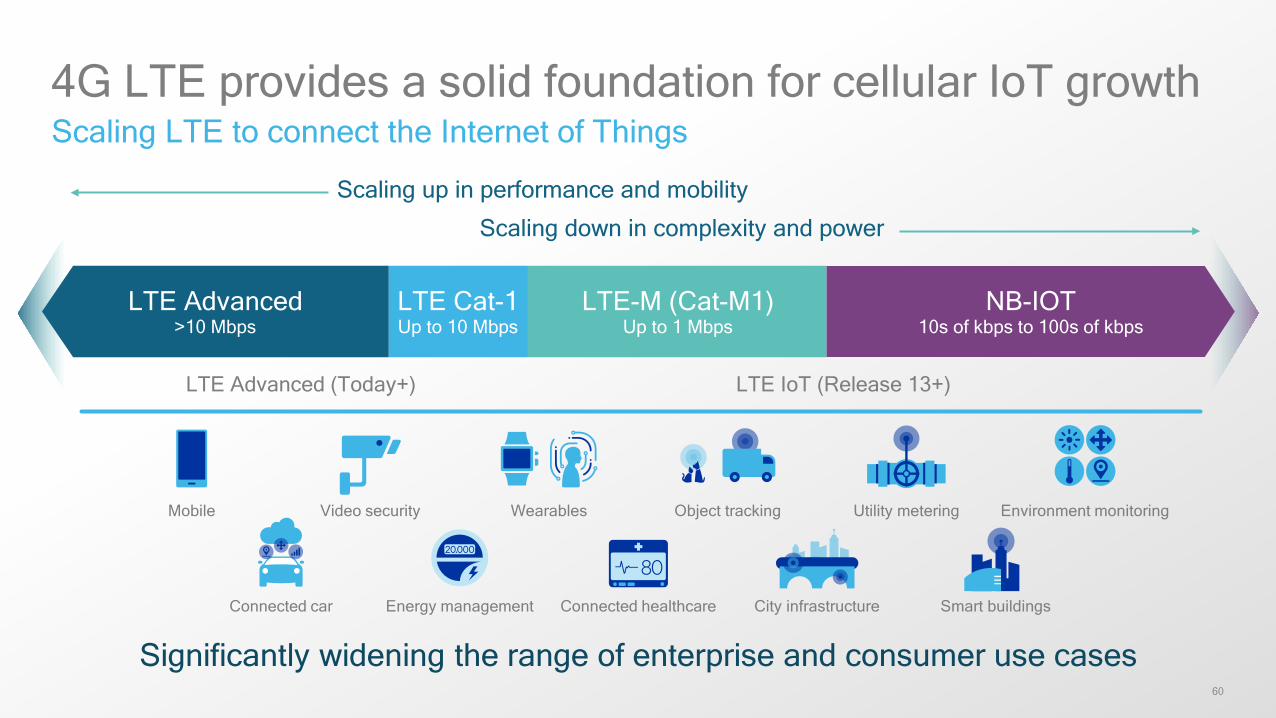
4G LTE provides a solid foundation for cellular IoT growthScaling LTE to connect the Internet of Things
Significantly widening the range of enterprise and consumer use cases
Scaling up in performance and mobility
Scaling down in complexity and power
LTE Advanced (Today+) LTE IoT (Release 13+)
LTE Advanced>10 Mbps
LTE Cat-1Up to 10 Mbps
LTE-M (Cat-M1)Up to 1 Mbps
NB-IOT10s of kbps to 100s of kbps
Object trackingMobile
Connected car Energy management
Video security Utility meteringWearables
Connected healthcare
Environment monitoring
Smart buildingsCity infrastructure
Implied royalty rate
3G
4G
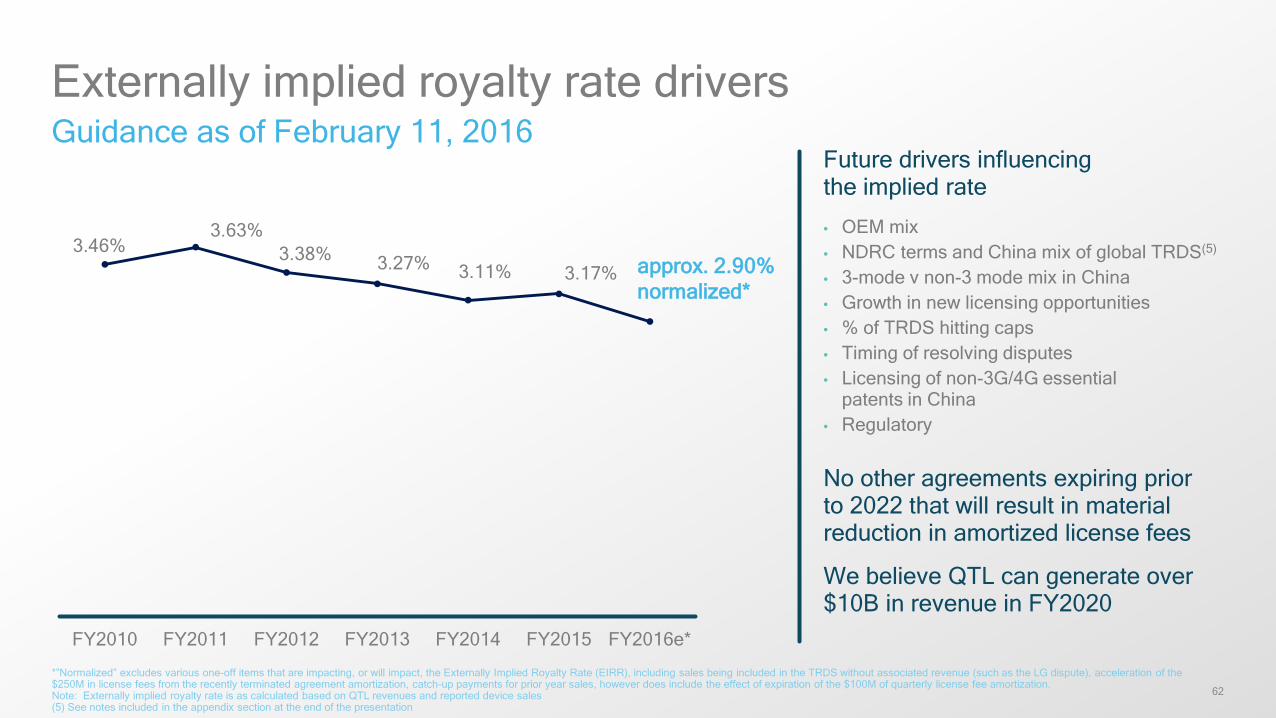
62
3.46%3.63%
3.38% 3.27% 3.11% 3.17%
FY2010 FY2011 FY2012 FY2013 FY2014 FY2015 FY2016e*
Externally implied royalty rate drivers Guidance as of February 11, 2016
Future drivers influencing the implied rate
• OEM mix• NDRC terms and China mix of global TRDS(5)
• 3-mode v non-3 mode mix in China• Growth in new licensing opportunities• % of TRDS hitting caps • Timing of resolving disputes• Licensing of non-3G/4G essential
patents in China• Regulatory
No other agreements expiring prior to 2022 that will result in material reduction in amortized license fees
We believe QTL can generate over $10B in revenue in FY2020
*”Normalized” excludes various one-off items that are impacting, or will impact, the Externally Implied Royalty Rate (EIRR), including sales being included in the TRDS without associated revenue (such as the LG dispute), acceleration of the $250M in license fees from the recently terminated agreement amortization, catch-up payments for prior year sales, however does include the effect of expiration of the $100M of quarterly license fee amortization. Note: Externally implied royalty rate is as calculated based on QTL revenues and reported device sales(5) See notes included in the appendix section at the end of the presentation
approx. 2.90% normalized*
Licensing model
64
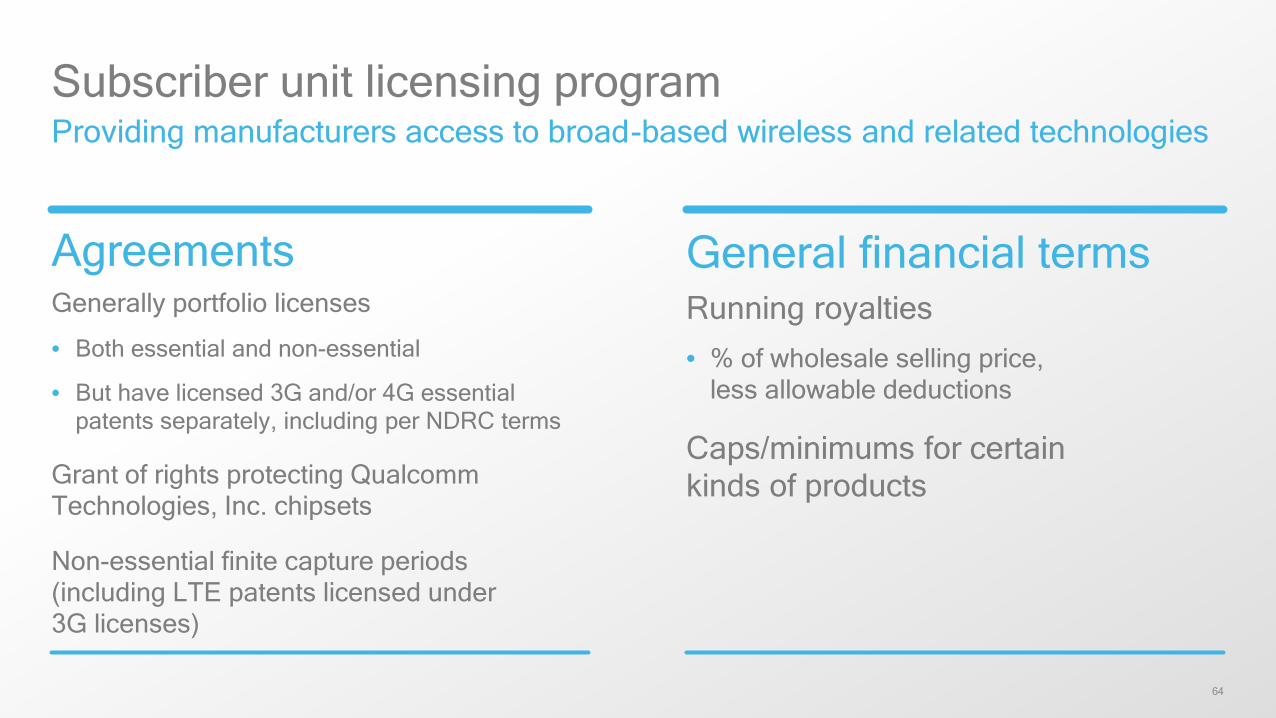
Subscriber unit licensing programProviding manufacturers access to broad-based wireless and related technologies
General financial termsRunning royalties• % of wholesale selling price,
less allowable deductions
Caps/minimums for certain kinds of products
AgreementsGenerally portfolio licenses
• Both essential and non-essential
• But have licensed 3G and/or 4G essential patents separately, including per NDRC terms
Grant of rights protecting Qualcomm Technologies, Inc. chipsets
Non-essential finite capture periods (including LTE patents licensed under 3G licenses)
65
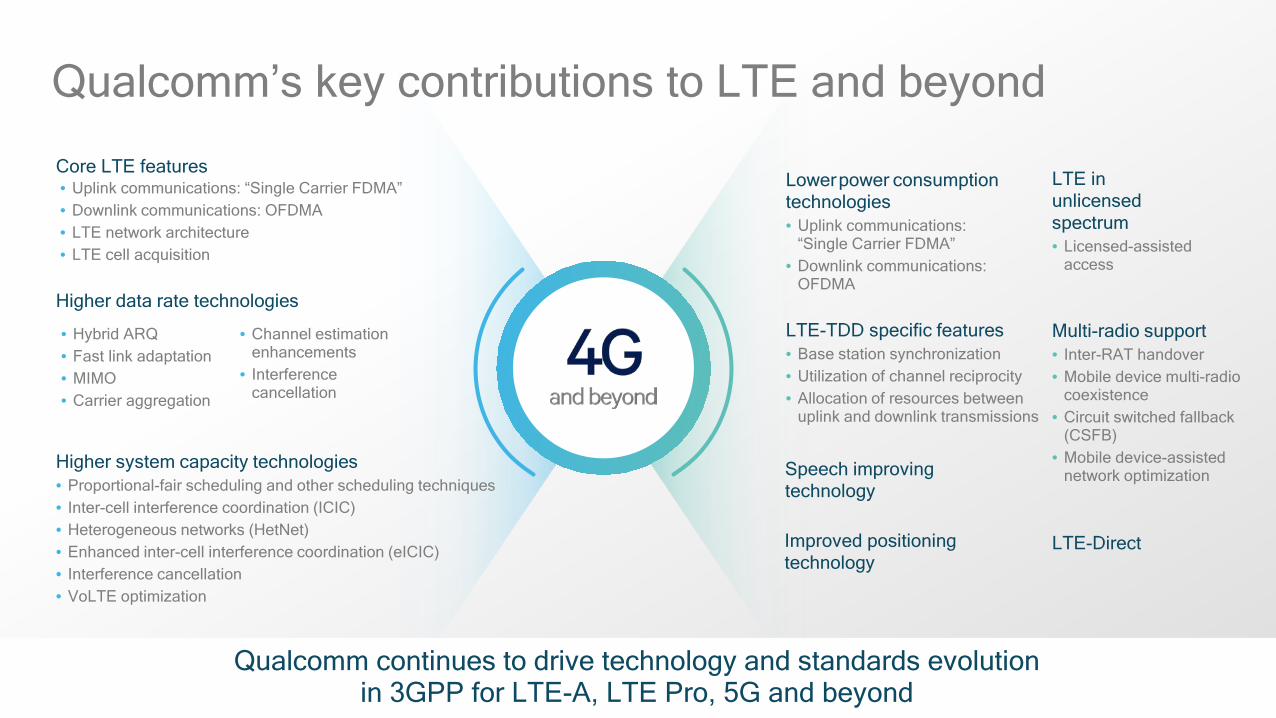
Qualcomm’s key contributions to LTE and beyond
Multi-radio support• Inter-RAT handover • Mobile device multi-radio
coexistence • Circuit switched fallback
(CSFB) • Mobile device-assisted
network optimization
Lower power consumptiontechnologies• Uplink communications:
“Single Carrier FDMA” • Downlink communications:
OFDMA
LTE-TDD specific features• Base station synchronization • Utilization of channel reciprocity • Allocation of resources between
uplink and downlink transmissions
Improved positioning technology
Speech improving technology
Qualcomm continues to drive technology and standards evolution in 3GPP for LTE-A, LTE Pro, 5G and beyond
Higher data rate technologies
Core LTE features
Higher system capacity technologies• Proportional-fair scheduling and other scheduling techniques • Inter-cell interference coordination (ICIC) • Heterogeneous networks (HetNet) • Enhanced inter-cell interference coordination (eICIC) • Interference cancellation • VoLTE optimization
LTE-Direct
LTE in unlicensed spectrum• Licensed-assisted
access
• Uplink communications: “Single Carrier FDMA” • Downlink communications: OFDMA• LTE network architecture • LTE cell acquisition
• Hybrid ARQ • Fast link adaptation • MIMO • Carrier aggregation
• Channel estimation enhancements
• Interferencecancellation
66
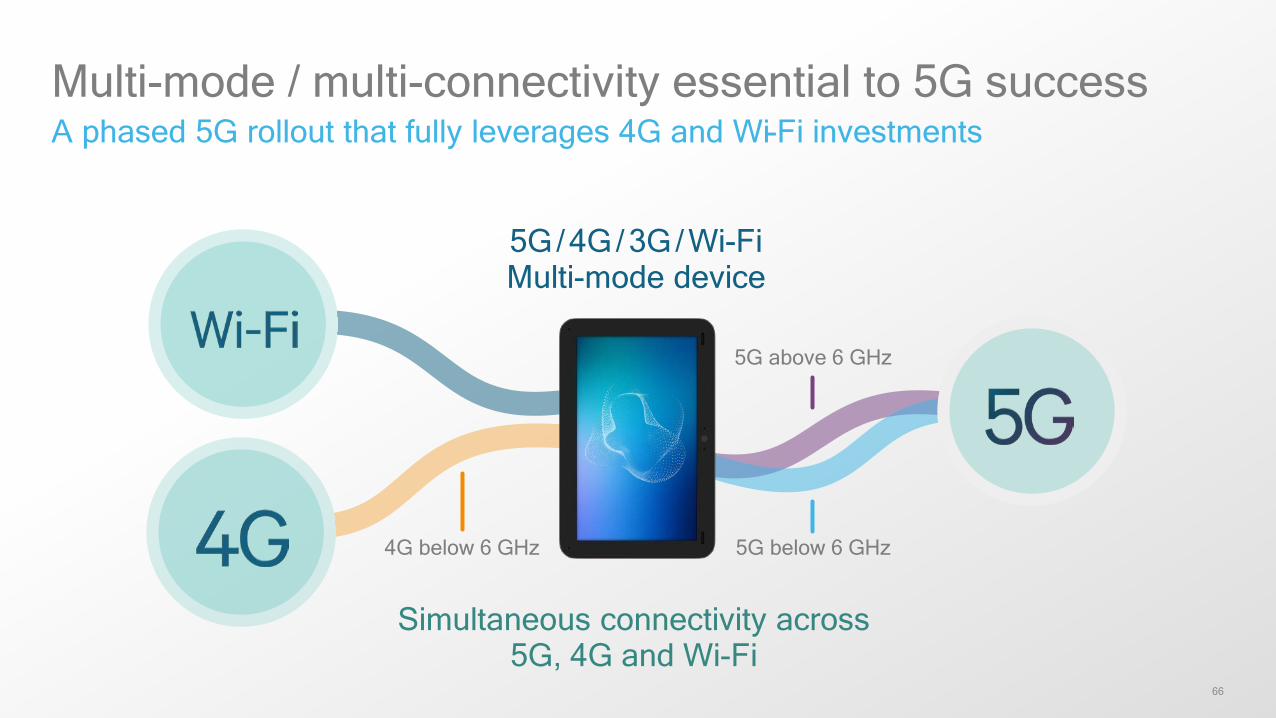
Multi-mode / multi-connectivity essential to 5G successA phased 5G rollout that fully leverages 4G and Wi-Fi investments
4G below 6 GHz
5G above 6 GHz
5G below 6 GHz
5G/4G/3G/Wi-FiMulti-mode device
Simultaneous connectivity across 5G, 4G and Wi-Fi
67
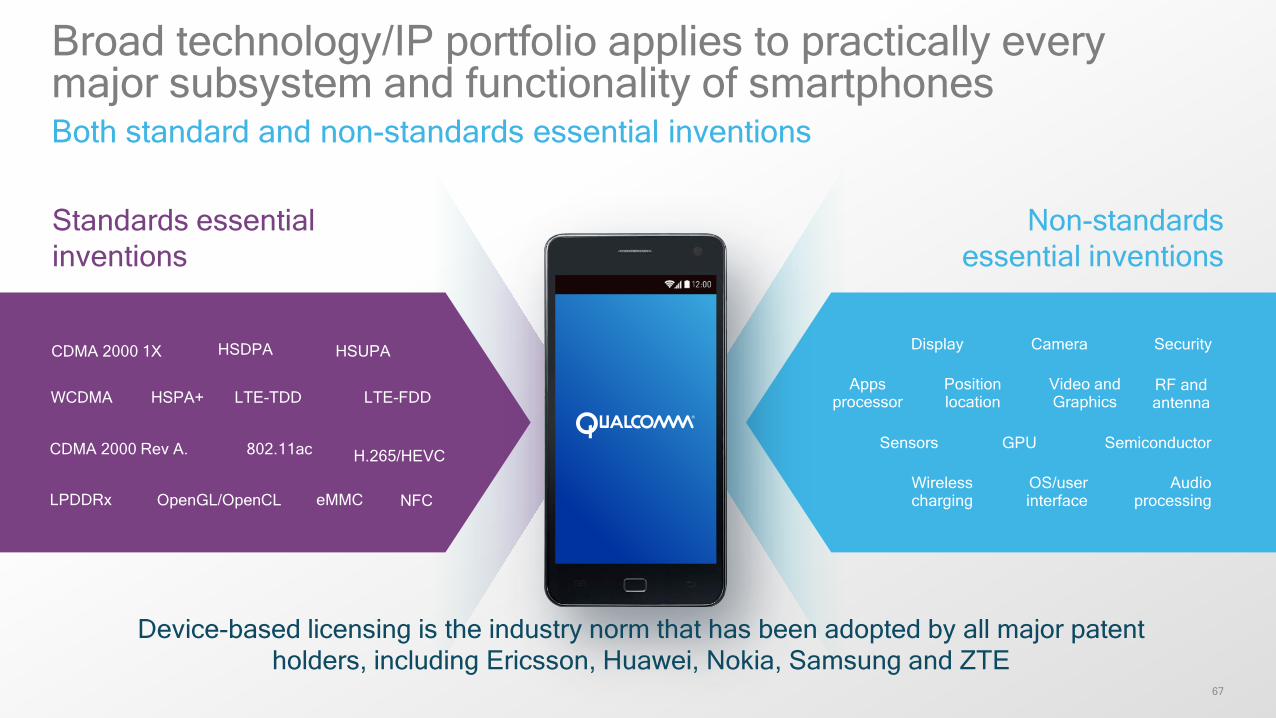
Broad technology/IP portfolio applies to practically every major subsystem and functionality of smartphones Both standard and non-standards essential inventions
Standards essential inventions
Non-standardsessential inventions
GPUSensors Semiconductor
Appsprocessor
Position location
Video and Graphics
RF andantenna
Camera SecurityDisplay
OS/user interface
Wireless charging
Audio processing
WCDMA HSPA+ LTE-TDD LTE-FDD
CDMA 2000 1X HSDPA HSUPA
CDMA 2000 Rev A. 802.11ac H.265/HEVC
LPDDRx OpenGL/OpenCL eMMC NFC
Device-based licensing is the industry norm that has been adopted by all major patent holders, including Ericsson, Huawei, Nokia, Samsung and ZTE
68
Additional licensing opportunities
• Mobile technologies being adopted across many new industries/segments (e.g., multimedia/video compression)
• Remaining unlicensed patents in China
• Qualcomm Halo™ technology
69
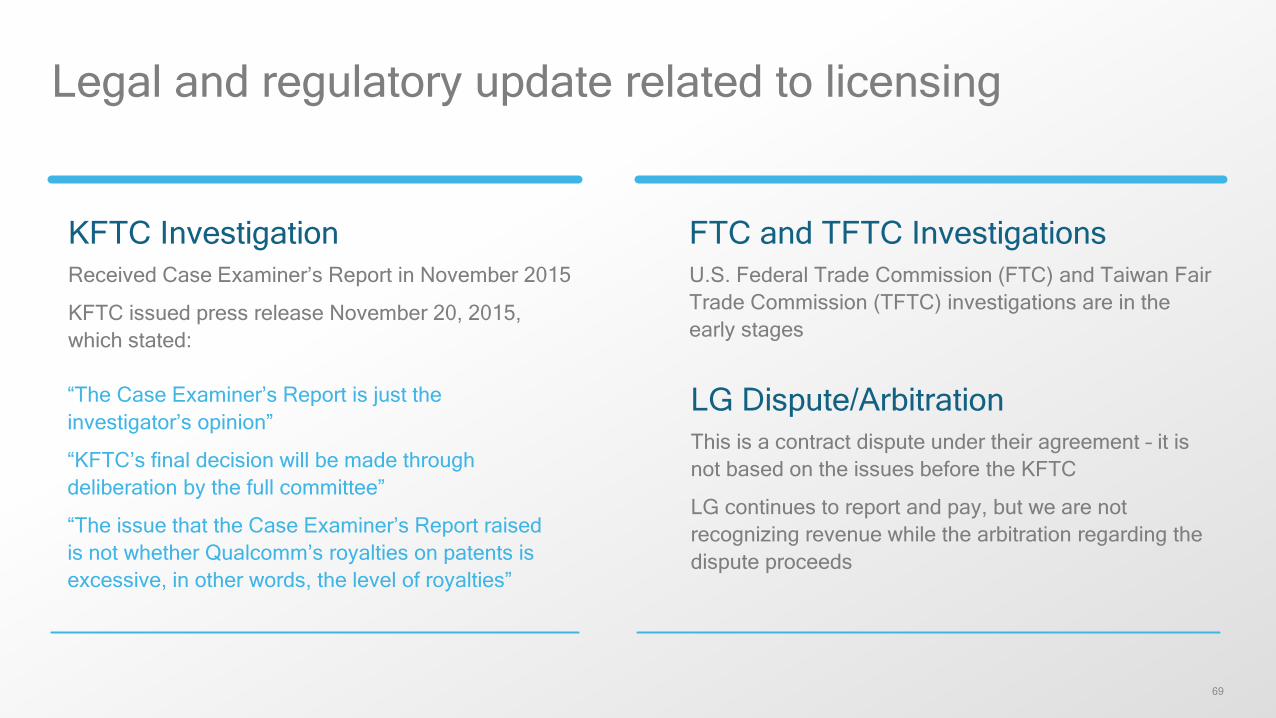
Legal and regulatory update related to licensing
KFTC InvestigationReceived Case Examiner’s Report in November 2015
KFTC issued press release November 20, 2015, which stated:
FTC and TFTC InvestigationsU.S. Federal Trade Commission (FTC) and Taiwan Fair Trade Commission (TFTC) investigations are in the early stages
LG Dispute/ArbitrationThis is a contract dispute under their agreement – it is not based on the issues before the KFTC
LG continues to report and pay, but we are not recognizing revenue while the arbitration regarding the dispute proceeds
“The Case Examiner’s Report is just the investigator’s opinion”
“KFTC’s final decision will be made through deliberation by the full committee”
“The issue that the Case Examiner’s Report raised is not whether Qualcomm’s royalties on patents is excessive, in other words, the level of royalties”
Additional growth opportunities
71
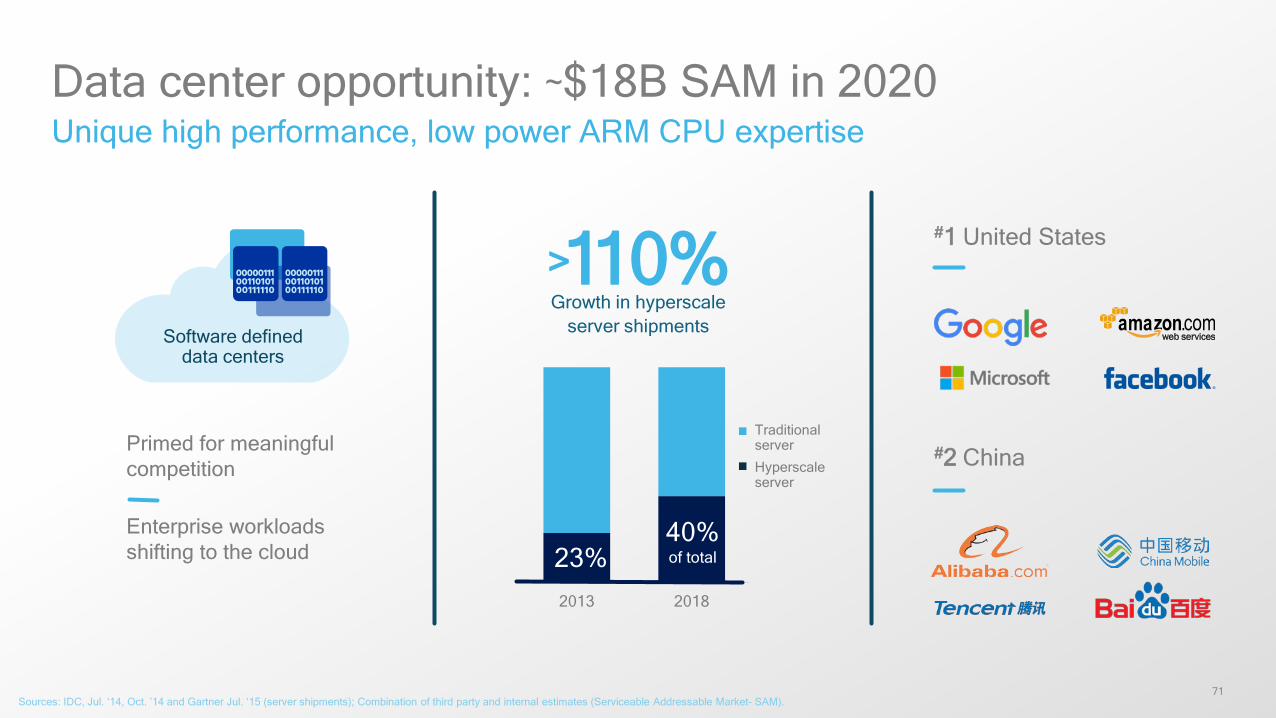
2013 2018
Data center opportunity: ~$18B SAM in 2020Unique high performance, low power ARM CPU expertise
Sources: IDC, Jul. ‘14, Oct. ’14 and Gartner Jul. ‘15 (server shipments); Combination of third party and internal estimates (Serviceable Addressable Market- SAM).
>110%Growth in hyperscale
server shipments
23%40%of total
#2 ChinaHyperscaleserver
Traditionalserver
#1 United States
Software defined data centers
Primed for meaningful competition
Enterprise workloads shifting to the cloud
72
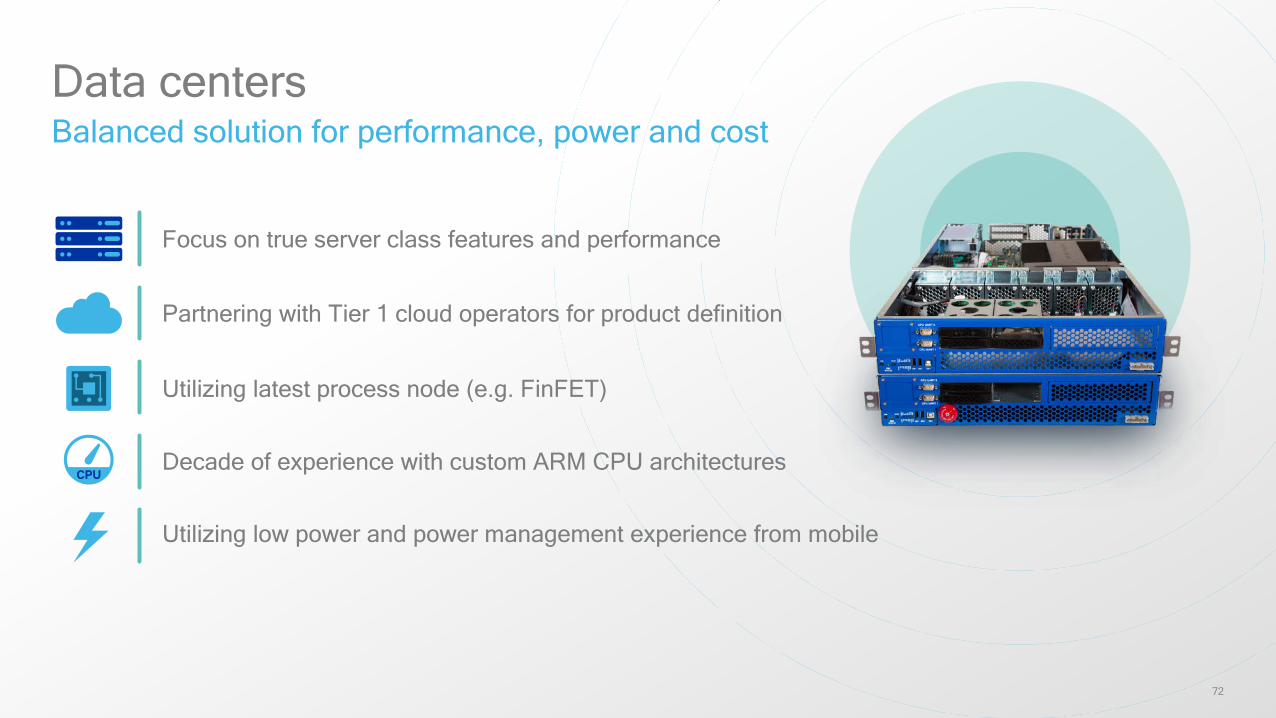
Data centersBalanced solution for performance, power and cost
Focus on true server class features and performance
Partnering with Tier 1 cloud operators for product definition
Utilizing latest process node (e.g. FinFET)
Decade of experience with custom ARM CPU architectures
Utilizing low power and power management experience from mobile
73
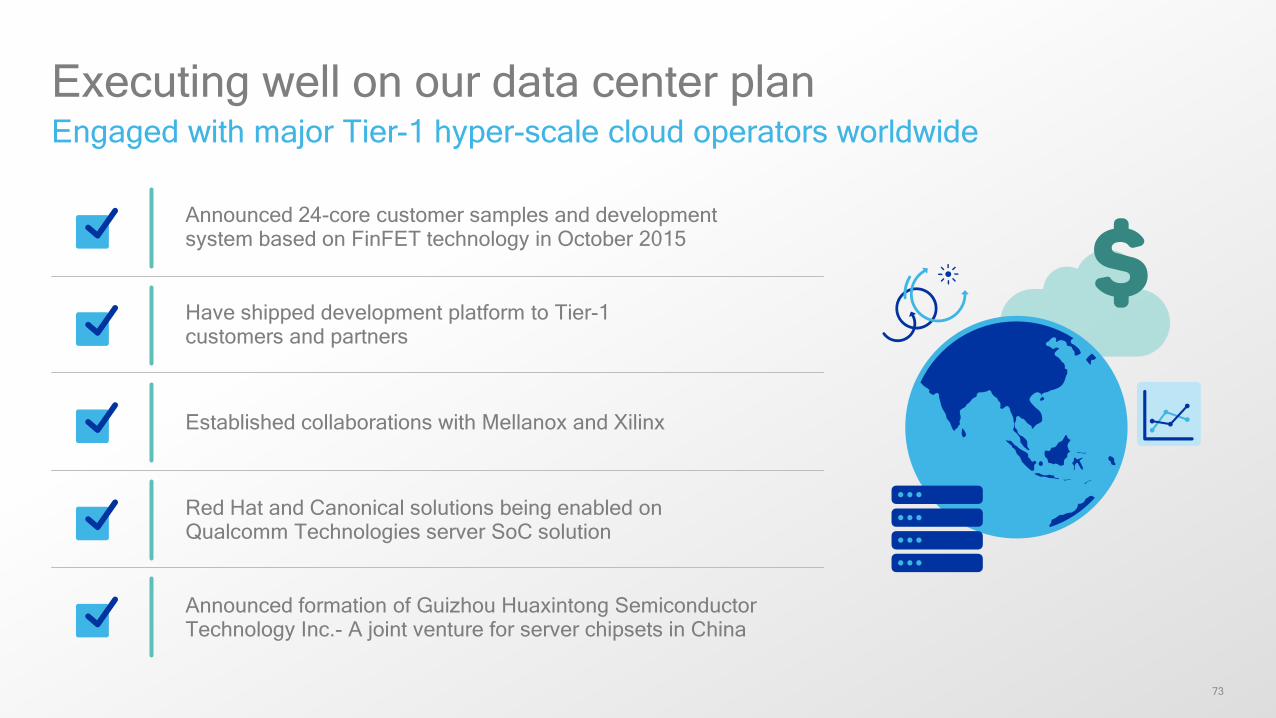
Executing well on our data center planEngaged with major Tier-1 hyper-scale cloud operators worldwide
Announced 24-core customer samples and developmentsystem based on FinFET technology in October 2015
Have shipped development platform to Tier-1 customers and partners
Established collaborations with Mellanox and Xilinx
Red Hat and Canonical solutions being enabled on Qualcomm Technologies server SoC solution
Announced formation of Guizhou Huaxintong Semiconductor Technology Inc.- A joint venture for server chipsets in China
74
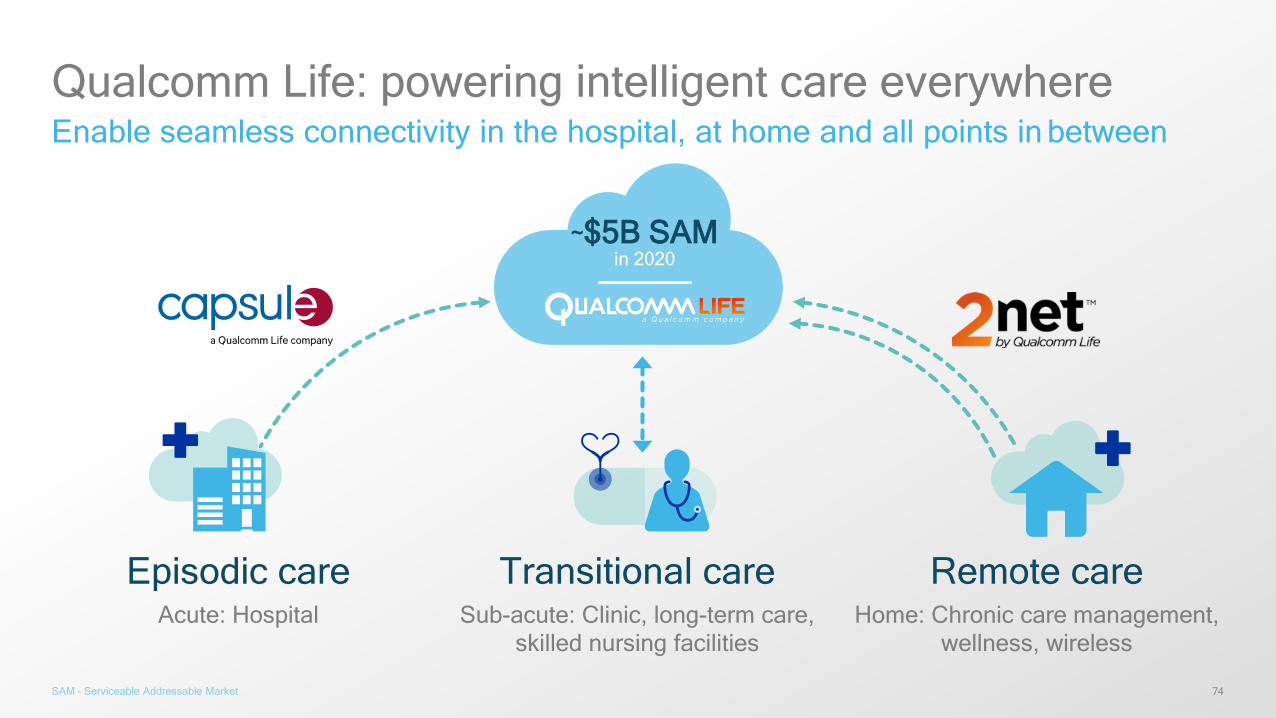
Qualcomm Life: powering intelligent care everywhereEnable seamless connectivity in the hospital, at home and all points in between
Transitional careSub-acute: Clinic, long-term care,
skilled nursing facilities
Episodic careAcute: Hospital
Remote careHome: Chronic care management,
wellness, wireless
~$5B SAM in 2020
SAM - Serviceable Addressable Market
75
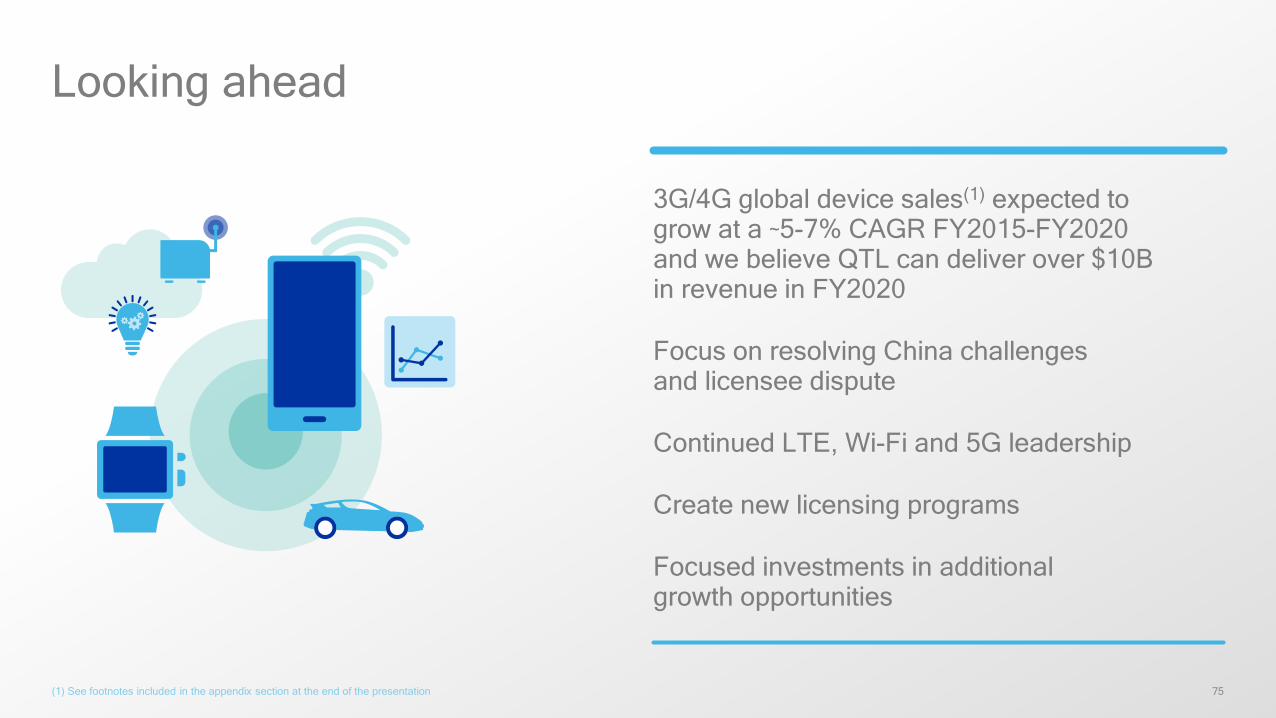
3G/4G global device sales(1) expected to grow at a ~5-7% CAGR FY2015-FY2020 and we believe QTL can deliver over $10B in revenue in FY2020
Focus on resolving China challenges and licensee dispute
Continued LTE, Wi-Fi and 5G leadership
Create new licensing programs
Focused investments in additional growth opportunities
Looking ahead
(1) See footnotes included in the appendix section at the end of the presentation
Cristiano Amon
EVP, Qualcomm Technologies, Inc. and President, QCT
77
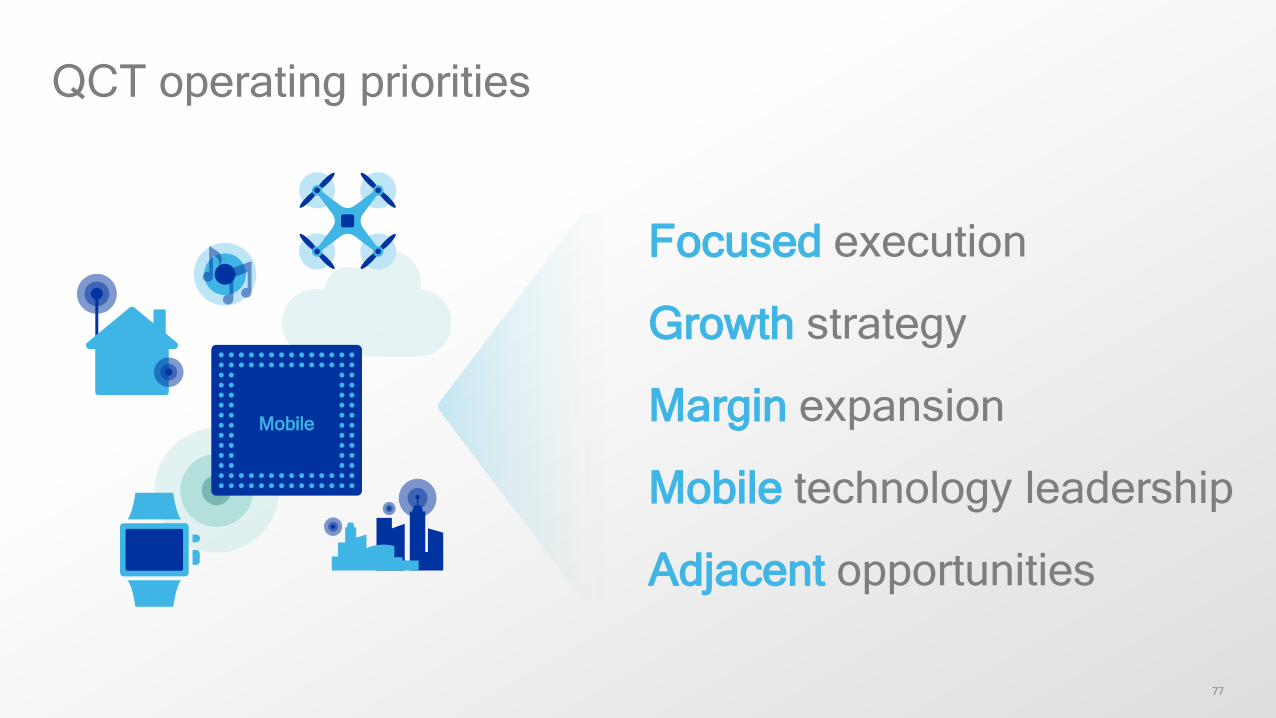
QCT operating priorities
Focused execution
Growth strategy
Margin expansion
Mobile technology leadership
Adjacent opportunities
Mobile
78
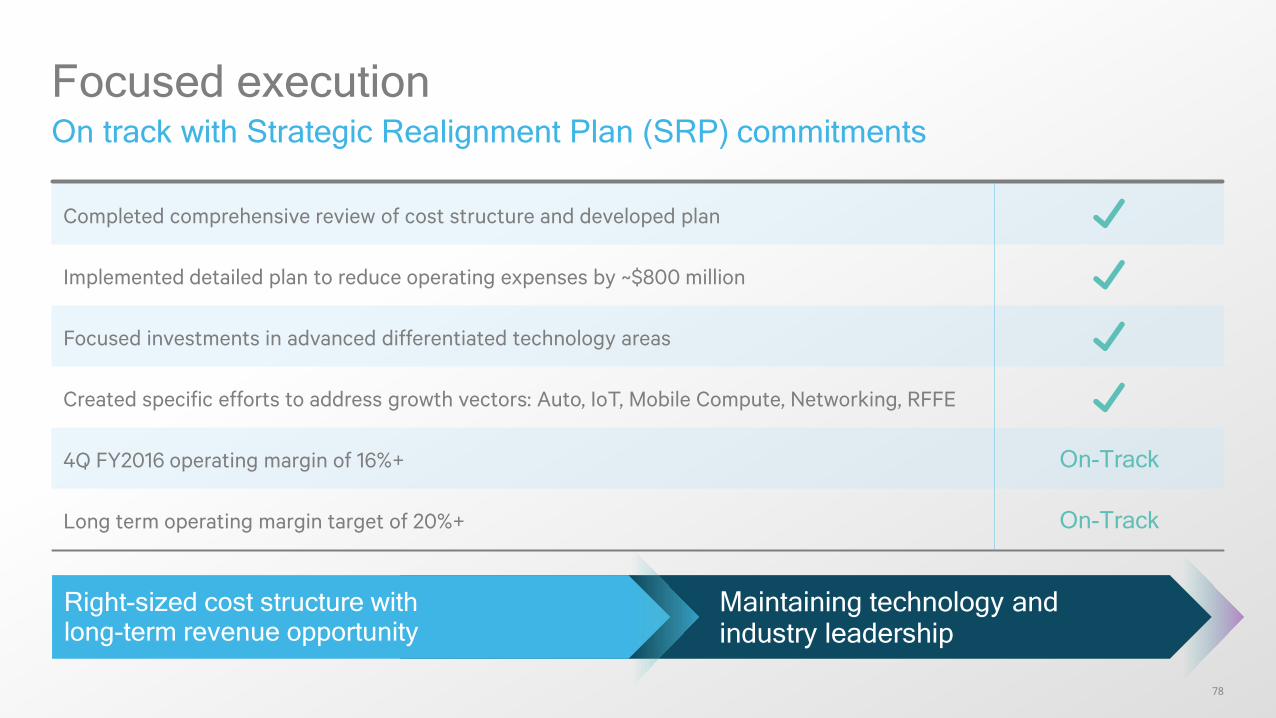
Focused executionOn track with Strategic Realignment Plan (SRP) commitments
Right-sized cost structure withlong-term revenue opportunity
Maintaining technology andindustry leadership
Completed comprehensive review of cost structure and developed plan
Implemented detailed plan to reduce operating expenses by ~$800 million
Focused investments in advanced differentiated technology areas
Created specific efforts to address growth vectors: Auto, IoT, Mobile Compute, Networking, RFFE
4Q FY2016 operating margin of 16%+ On-Track
Long term operating margin target of 20%+ On-Track
79
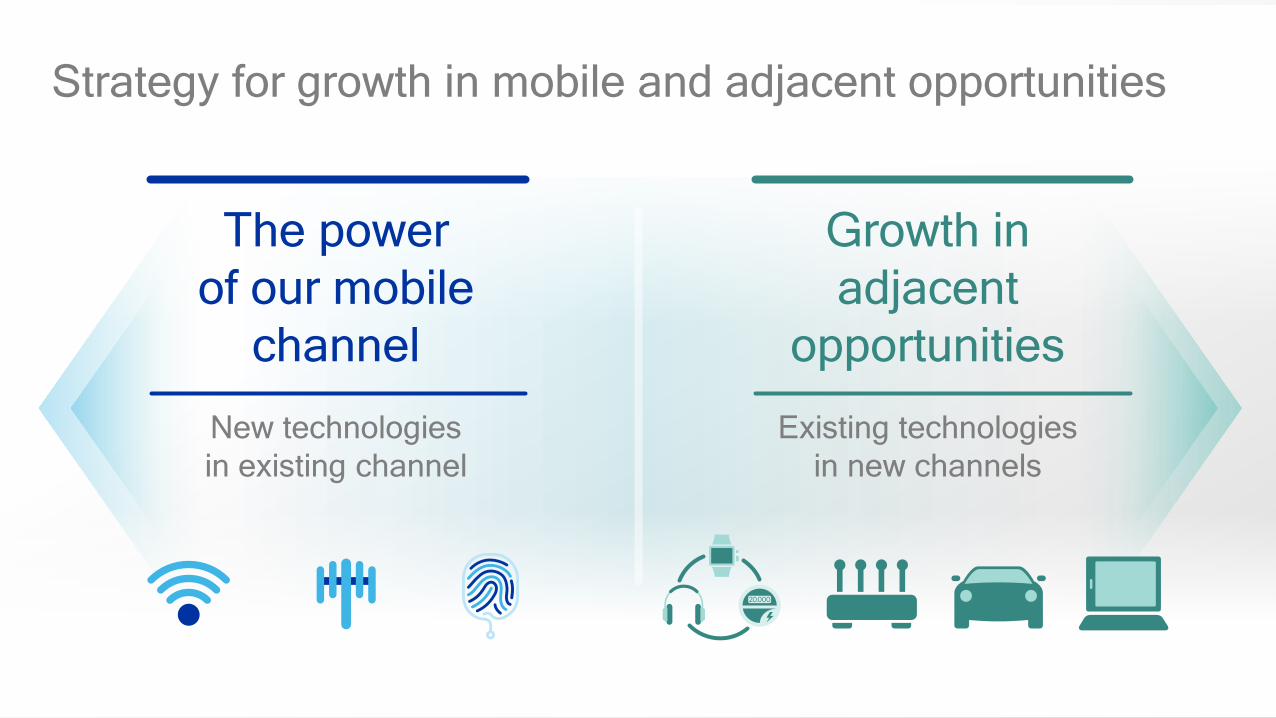
Strategy for growth in mobile and adjacent opportunities
The powerof our mobile
channel
New technologiesin existing channel
Growth in adjacent
opportunities
Existing technologiesin new channels
80
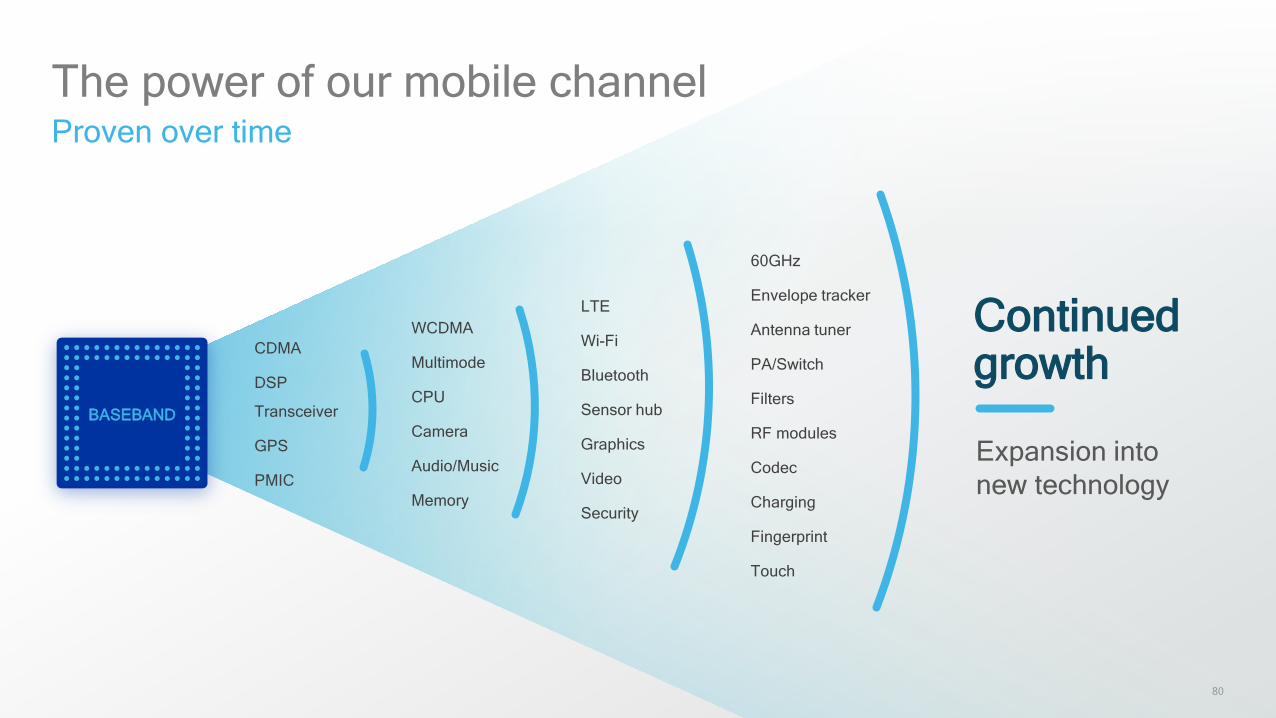
The power of our mobile channelProven over time
Continued growth
Expansion intonew technology
LTE
Wi-Fi
Bluetooth
Sensor hub
Graphics
Video
Security
CDMA
DSP
Transceiver
GPS
PMIC
WCDMA
Multimode
CPU
Camera
Audio/Music
Memory
60GHz
Envelope tracker
Antenna tuner
PA/Switch
Filters
RF modules
Codec
Charging
Fingerprint
Touch
BASEBAND
81
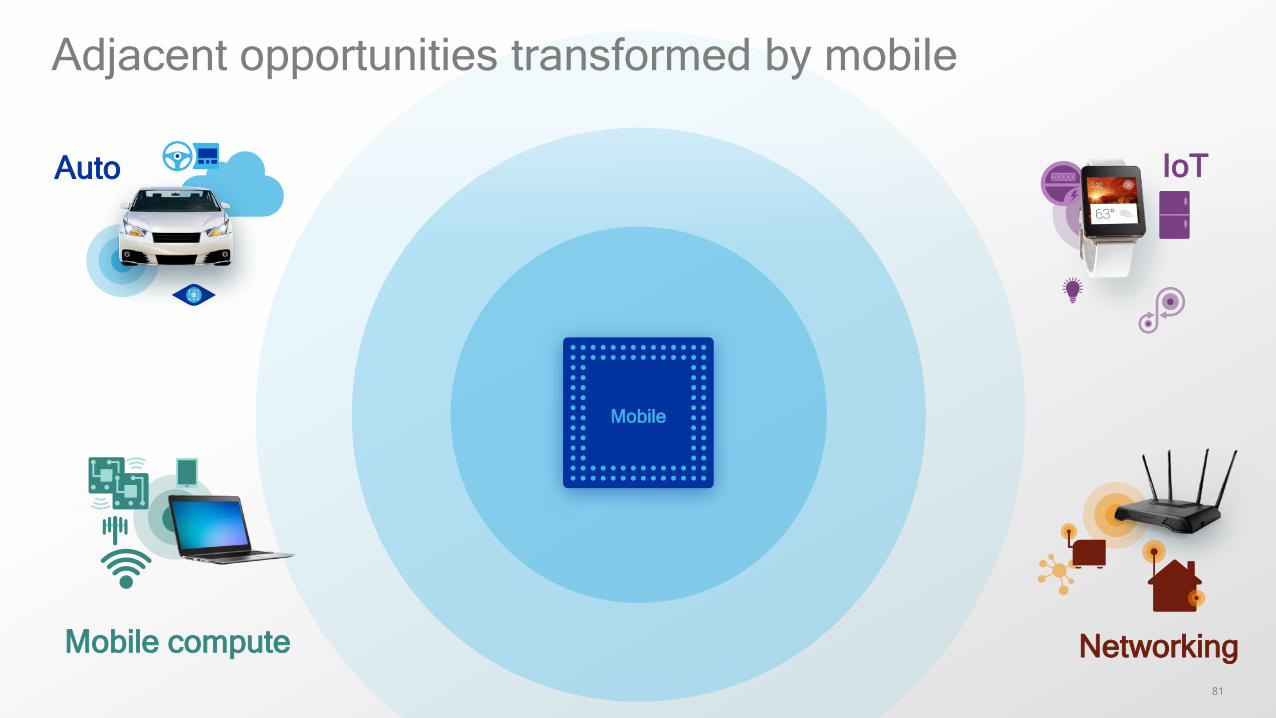
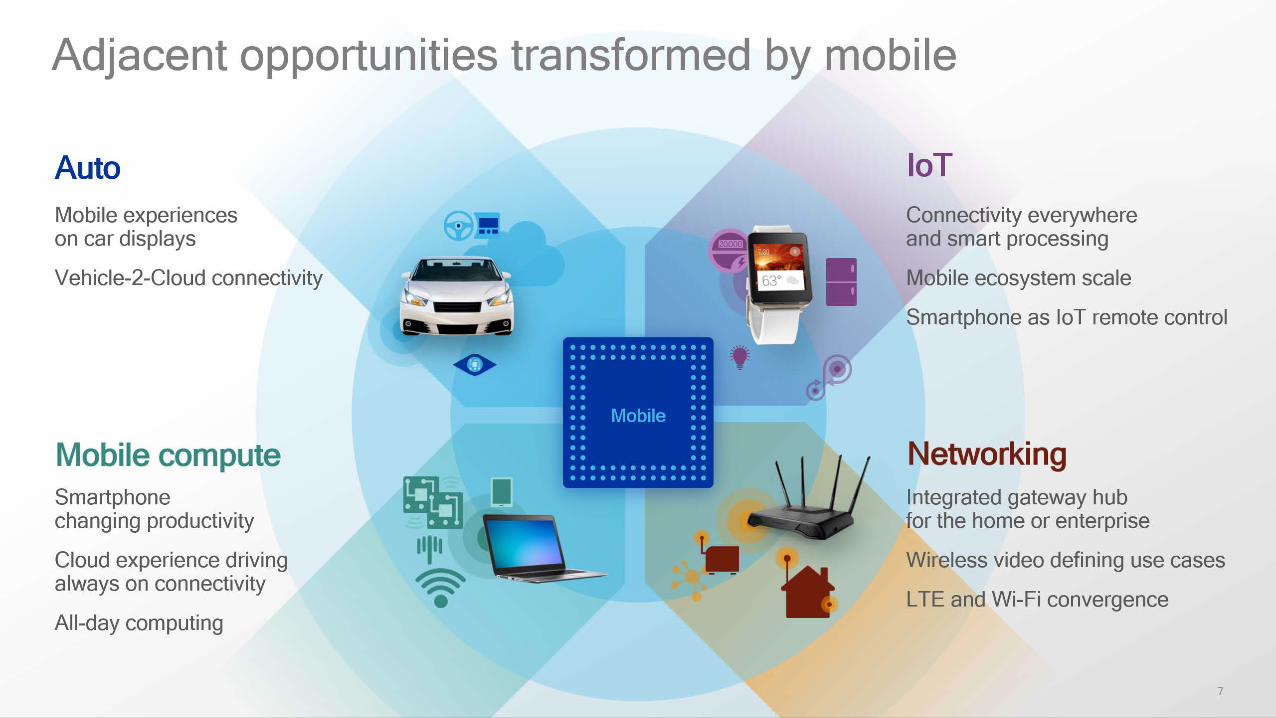
Adjacent opportunities transformed by mobile
Mobile
Networking
Auto IoT
Mobile compute
82
Adjacent opportunities transformed by mobile
Mobile
Networking
Auto IoT
Mobile compute
Mobile experiences on car displays
Vehicle-2-Cloud connectivity
Connectivity everywhere and smart processing
Mobile ecosystem scale
Smartphone as IoT remote control
Integrated gateway hub for the home or enterprise
Wireless video defining use cases
LTE and Wi-Fi convergence
Smartphone changing productivity
Cloud experience driving always on connectivity
All-day computing
83
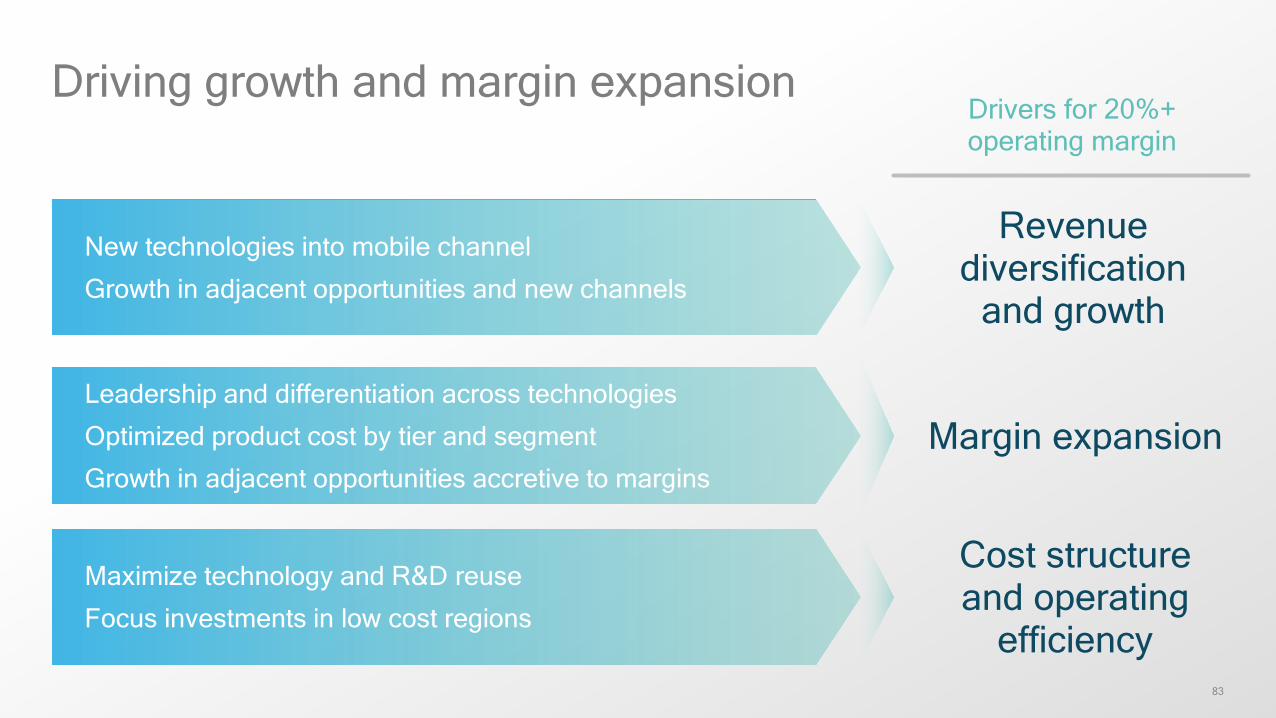
New technologies into mobile channel
Growth in adjacent opportunities and new channels
Leadership and differentiation across technologies
Optimized product cost by tier and segment
Growth in adjacent opportunities accretive to margins
Maximize technology and R&D reuse
Focus investments in low cost regions
Driving growth and margin expansion
Revenue diversification
and growth
Margin expansion
Cost structure and operating
efficiency
Drivers for 20%+operating margin
84
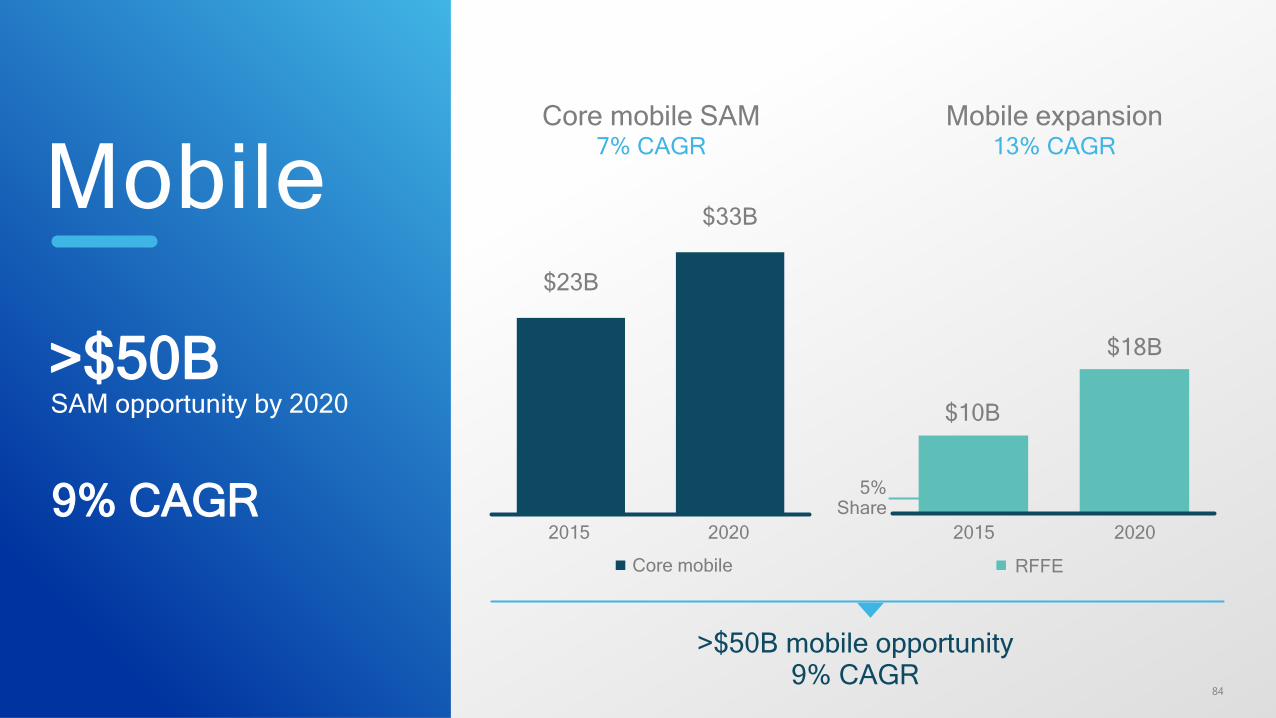
Mobile
2020
$33B
2015
$23B
Core mobile SAM7% CAGR
Mobile expansion13% CAGR
2020
$18B
2015
$10B
5% Share
Core mobile
>$50B mobile opportunity9% CAGR
RFFE
>$50BSAM opportunity by 2020
9% CAGR
85
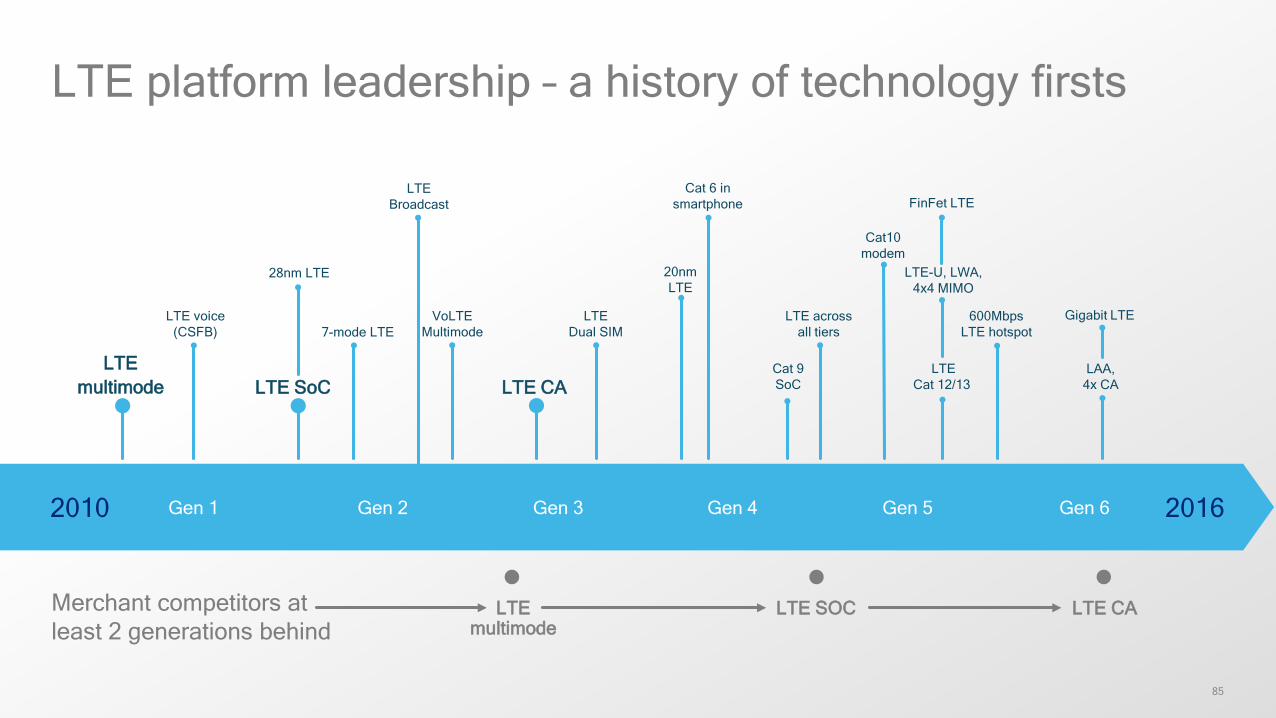
LTE platform leadership – a history of technology firsts
2010 2016
LTE multimode
LTE voice(CSFB)
LTE SoC
28nm LTE
LTE CA
7-mode LTE
LTEBroadcast
LTEDual SIM
VoLTEMultimode
20nmLTE
Cat10modem
LTE acrossall tiers
Gigabit LTE
LTE-U, LWA,4x4 MIMO
LTECat 12/13
FinFet LTE
LAA, 4x CA
LTE SOC LTE CALTE multimode
Merchant competitors atleast 2 generations behind
Gen 1 Gen 2 Gen 3 Gen 4 Gen 5 Gen 6
600Mbps LTE hotspot
Cat 6 in smartphone
Cat 9SoC
86
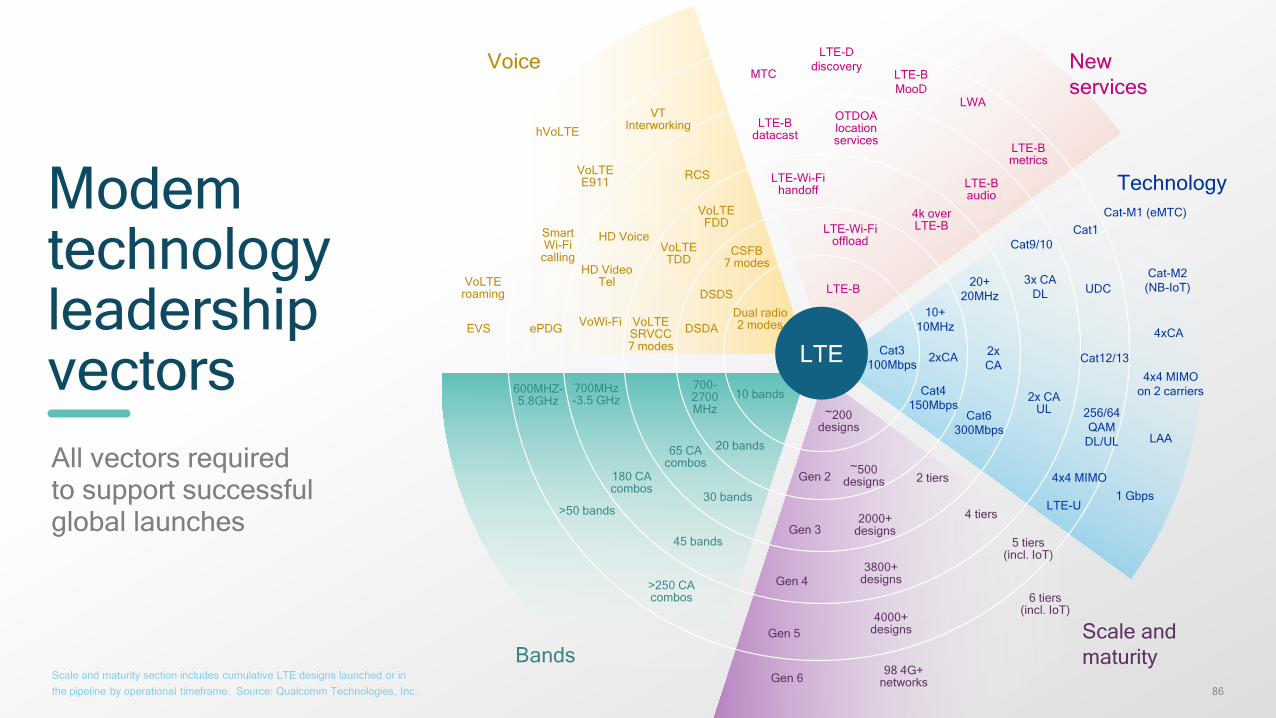
Modem technologyleadershipvectorsAll vectors requiredto support successful global launches
LTE
Bands
10 bands
20 bands
30 bands
65 CAcombos
700-2700MHz
45 bands
700MHz-3.5 GHz
180 CAcombos
>50 bands
>250 CAcombos
600MHZ-5.8GHz
LTE-B
LTE-Wi-Fioffload
4k over LTE-B
LTE-Wi-Fihandoff
LTE-B datacast
LTE-Baudio
OTDOAlocationservices
LWA
LTE-B MooD
LTE-Ddiscovery
MTC
LTE-B metrics
Newservices
Technology
Cat4150Mbps
2xCA
10+10MHz
Cat3100Mbps
Cat6300Mbps
2xCA
20+20MHz
Cat9/10
LTE-U
2x CAUL
Cat1
4x4 MIMO
256/64QAM
DL/UL
3x CADL UDC
Cat12/13
Scale andmaturity
~500designsGen 2
~200 designs
2 tiers
2000+designsGen 3
4 tiers
Gen 43800+
designs
98 4G+networks
6 tiers(incl. IoT)
5 tiers(incl. IoT)
Gen 54000+
designs
Gen 6
CSFB 7 modes
DSDS
DSDADual radio 2 modes
VoLTEFDD
VoLTESRVCC7 modes
HD Voice
RCS
VoWi-Fi
VT Interworking
ePDG
VoLTEE911
EVS
hVoLTE
Voice
SmartWi-Fi
calling
VoLTEroaming
Cat-M1 (eMTC)
Cat-M2(NB-IoT)
4xCA
4x4 MIMOon 2 carriers
LAA
1 Gbps
VoLTETDD
HD Video Tel
Scale and maturity section includes cumulative LTE designs launched or inthe pipeline by operational timeframe. Source: Qualcomm Technologies, Inc.
87
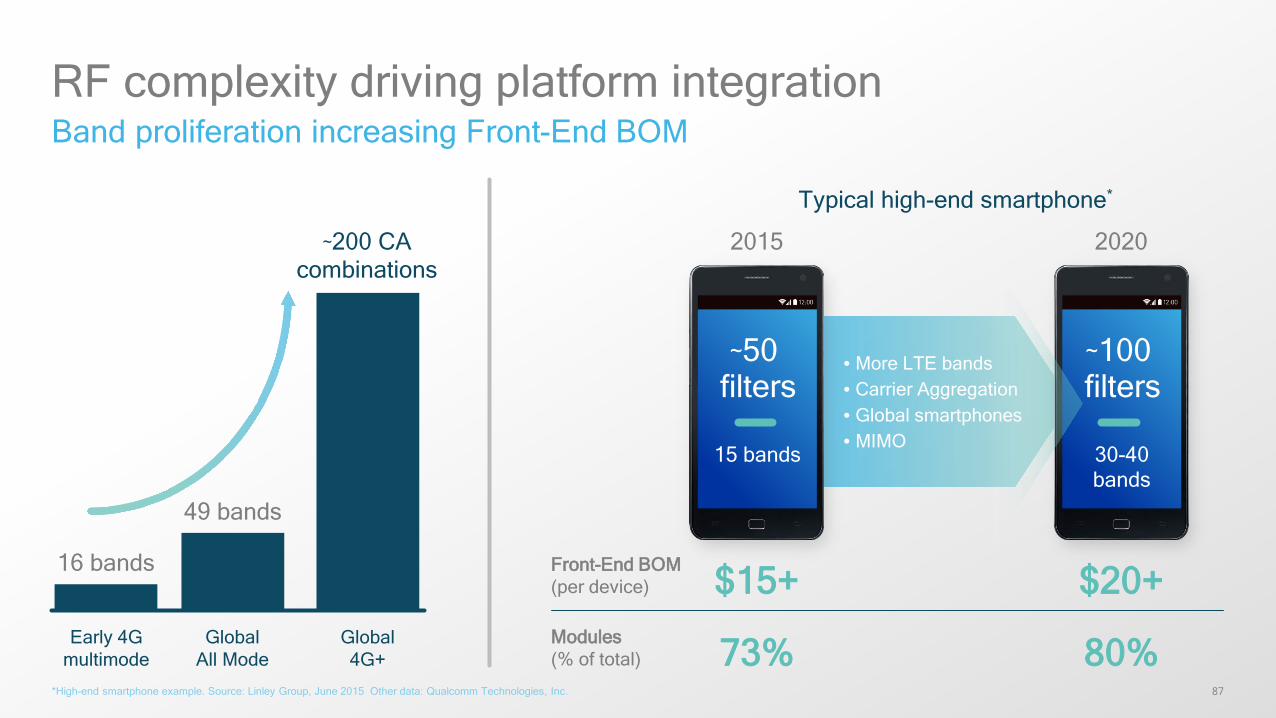
RF complexity driving platform integrationBand proliferation increasing Front-End BOM
*High-end smartphone example. Source: Linley Group, June 2015 Other data: Qualcomm Technologies, Inc.
Global 4G+
GlobalAll Mode
49 bands
Early 4G multimode
16 bands
~200 CA combinations
• More LTE bands• Carrier Aggregation• Global smartphones• MIMO
2015 2020
~100 filters
30-40 bands
~50 filters
15 bands
Typical high-end smartphone*
Modules (% of total) 73% 80%
Front-End BOM(per device) $15+ $20+
88
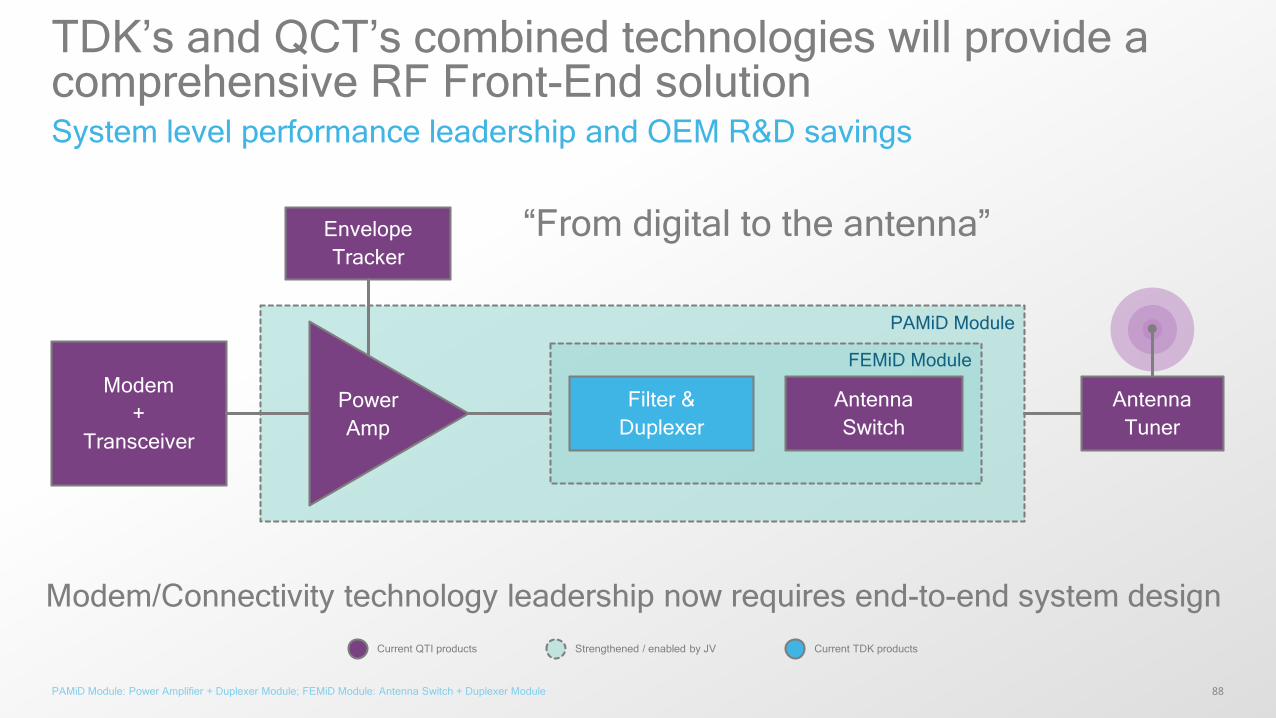
TDK’s and QCT’s combined technologies will provide a comprehensive RF Front-End solutionSystem level performance leadership and OEM R&D savings
PAMiD Module: Power Amplifier + Duplexer Module; FEMiD Module: Antenna Switch + Duplexer Module
“From digital to the antenna”
Modem/Connectivity technology leadership now requires end-to-end system designStrengthened / enabled by JV Current TDK productsCurrent QTI products
Modem+
Transceiver
AntennaSwitch
Filter &Duplexer
EnvelopeTracker
PAMiD Module
AntennaTuner
PowerAmp
FEMiD Module
89
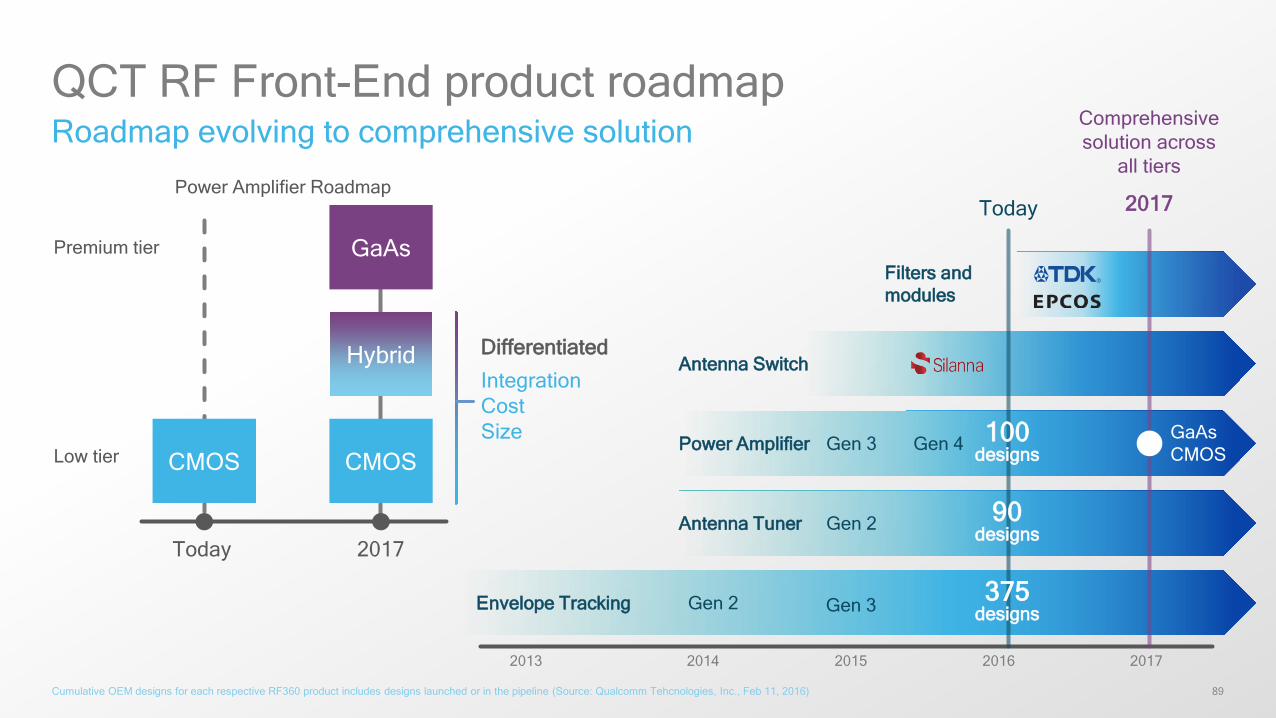
QCT RF Front-End product roadmapRoadmap evolving to comprehensive solution
Cumulative OEM designs for each respective RF360 product includes designs launched or in the pipeline (Source: Qualcomm Tehcnologies, Inc., Feb 11, 2016)
Comprehensivesolution across
all tiers
2017
2013 2014 2015 2016 2017
Today
Filters and modules
Antenna Switch
Power Amplifier Gen 3 Gen 4GaAsCMOS
Antenna Tuner Gen 2
Envelope Tracking Gen 2
100designs
90designs
375designs
Today 2017
CMOS CMOS
Hybrid
GaAsPremium tier
Low tier
Differentiated
IntegrationCostSize
Power Amplifier Roadmap
Gen 3
90
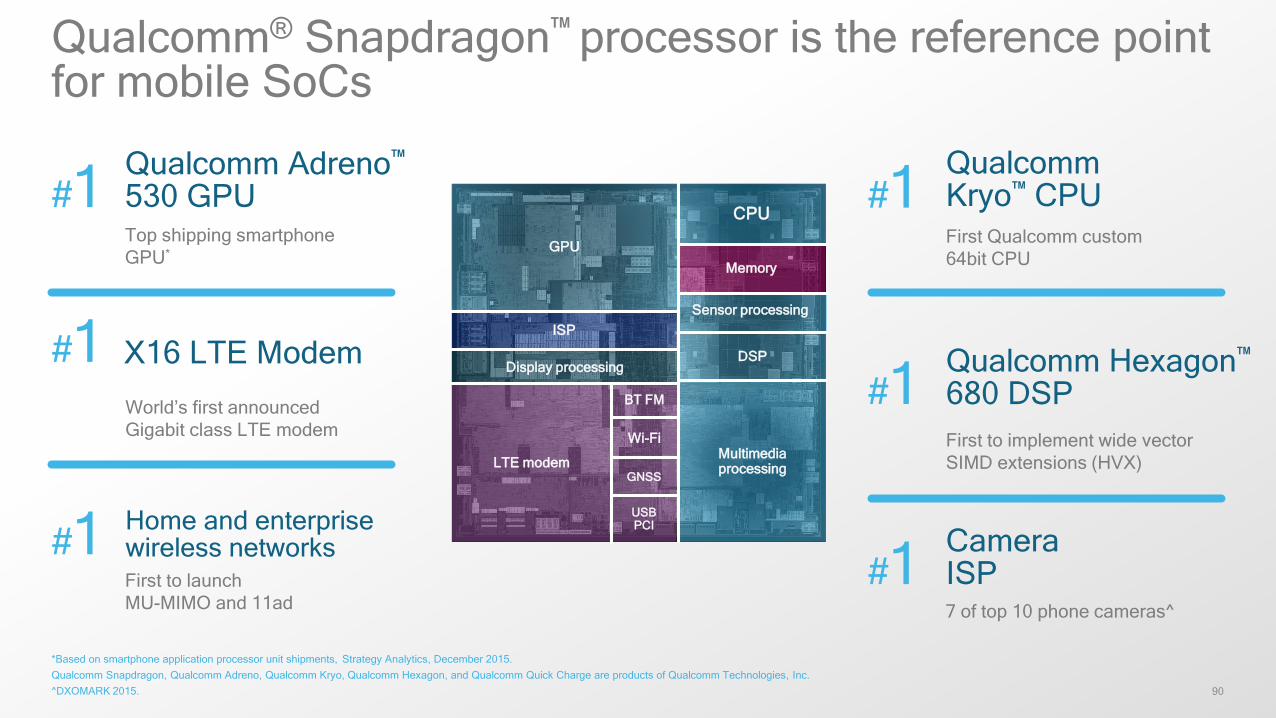
Qualcomm® Snapdragon™ processor is the reference point for mobile SoCs
Qualcomm Adreno™
530 GPU
X16 LTE Modem
Top shipping smartphone GPU*
World’s first announcedGigabit class LTE modem
Home and enterprise wireless networks First to launchMU-MIMO and 11ad
*Based on smartphone application processor unit shipments, Strategy Analytics, December 2015. Qualcomm Snapdragon, Qualcomm Adreno, Qualcomm Kryo, Qualcomm Hexagon, and Qualcomm Quick Charge are products of Qualcomm Technologies, Inc.^DXOMARK 2015.
#1
#1
#1
QualcommKryo™ CPU
Qualcomm Hexagon™
680 DSP
First Qualcomm custom 64bit CPU
First to implement wide vector SIMD extensions (HVX)
CameraISP7 of top 10 phone cameras^
#1
#1
#1
Display processing
Memory
Multimedia processing
Wi-Fi
LTE modem
CPU
DSP
GPU
GNSS
BT FM
ISP
USBPCI
Sensor processing
91
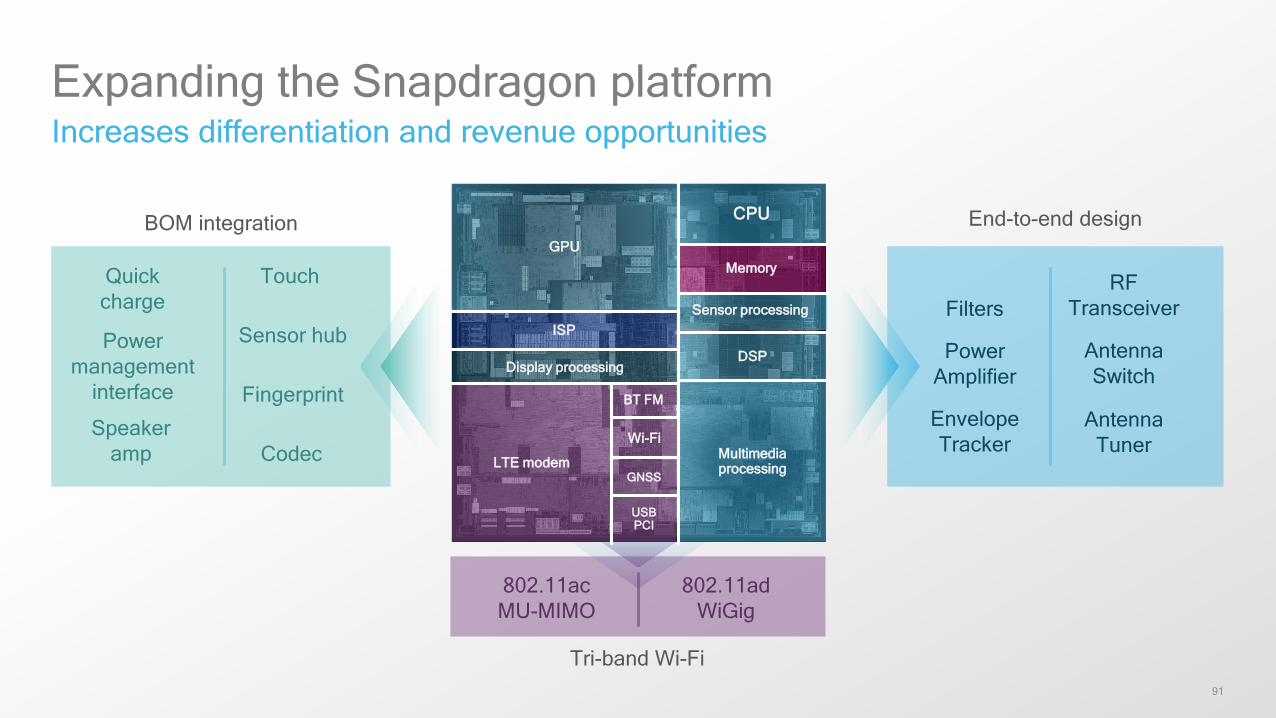
Envelope Tracker
PowerAmplifier
Antenna Tuner
Antenna Switch
RF TransceiverFilters
Speakeramp
Quick charge
Codec
802.11acMU-MIMO
802.11adWiGig
Power management
interface
Touch
Fingerprint
End-to-end design
Tri-band Wi-Fi
BOM integration
Expanding the Snapdragon platformIncreases differentiation and revenue opportunities
Display processing
Memory
Multimedia processing
Wi-Fi
LTE modem
CPU
DSP
GPU
GNSS
BT FM
ISP
USBPCI
Sensor processing
Sensor hub
92
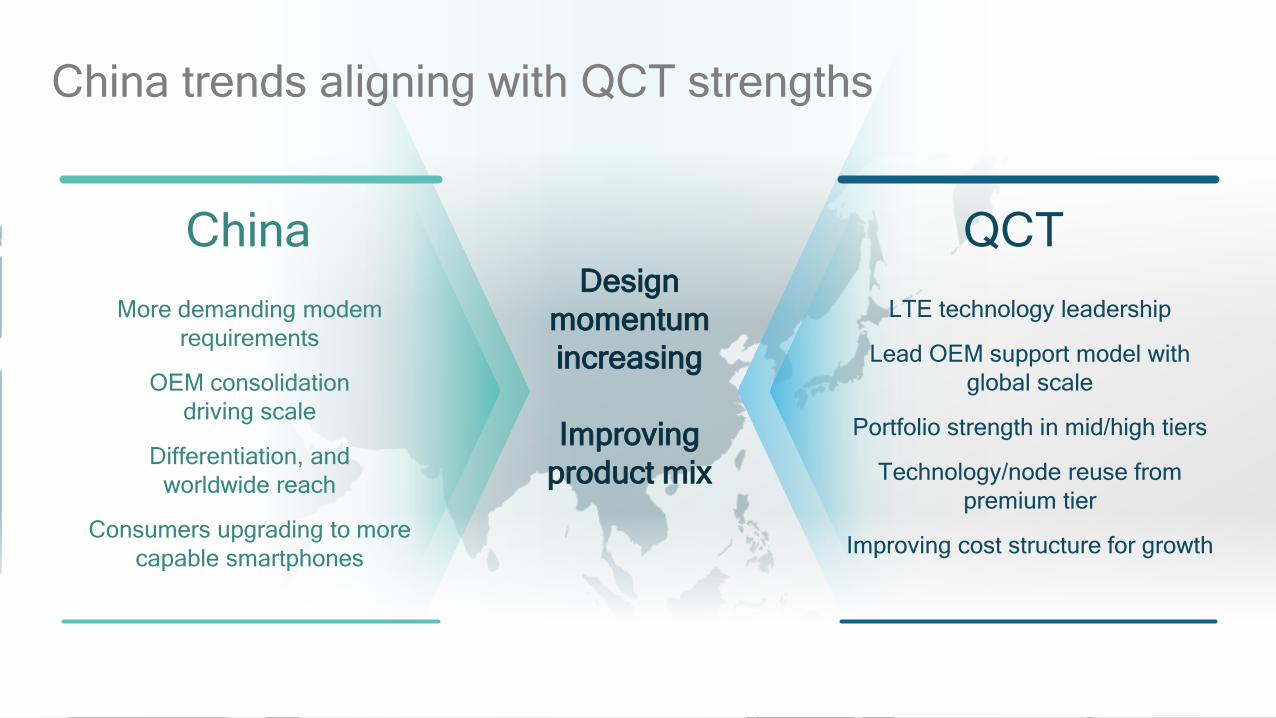
China trends aligning with QCT strengths
China QCTMore demanding modem
requirements
OEM consolidationdriving scale
Differentiation, andworldwide reach
Consumers upgrading to more capable smartphones
LTE technology leadership
Lead OEM support model with global scale
Portfolio strength in mid/high tiers
Technology/node reuse from premium tier
Improving cost structure for growth
Design momentumincreasing
Improvingproduct mix
93
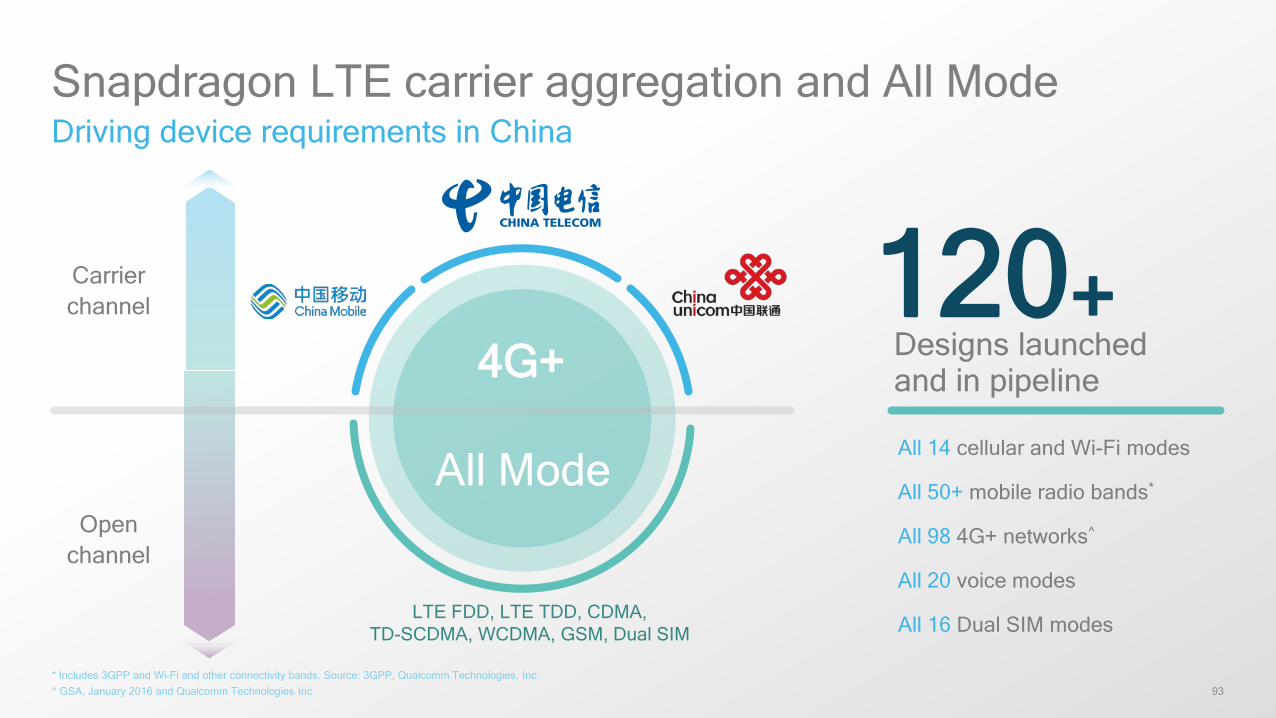
Snapdragon LTE carrier aggregation and All ModeDriving device requirements in China
4G+
All Mode
Carrier channel
Open channel
All 14 cellular and Wi-Fi modes
All 50+ mobile radio bands*
All 98 4G+ networks^
All 20 voice modes
All 16 Dual SIM modes
120+Designs launchedand in pipeline
LTE FDD, LTE TDD, CDMA,TD-SCDMA, WCDMA, GSM, Dual SIM
* Includes 3GPP and Wi-Fi and other connectivity bands. Source: 3GPP, Qualcomm Technologies, Inc.^ GSA, January 2016 and Qualcomm Technologies Inc.
94
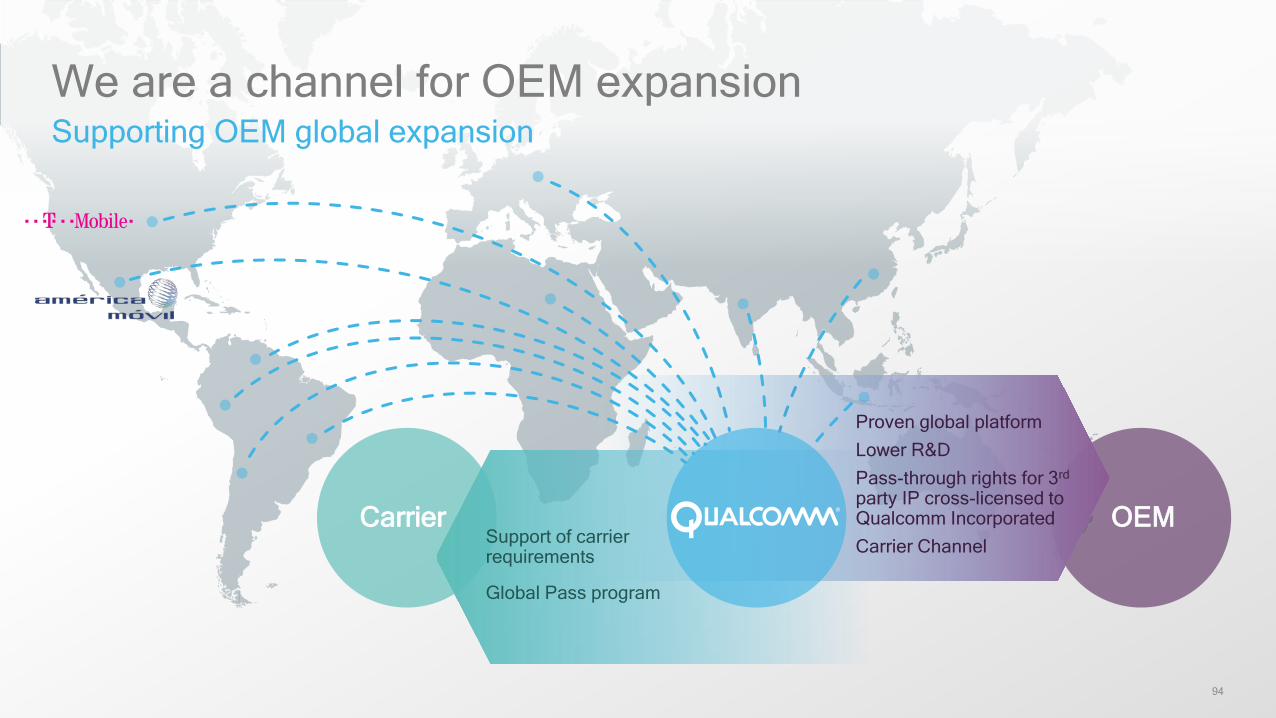
We are a channel for OEM expansionSupporting OEM global expansion
OEMSupport of carrierrequirements
Global Pass program
Proven global platformLower R&DPass-through rights for 3rd
party IP cross-licensed toQualcomm IncorporatedCarrier Channel
Carrier
95
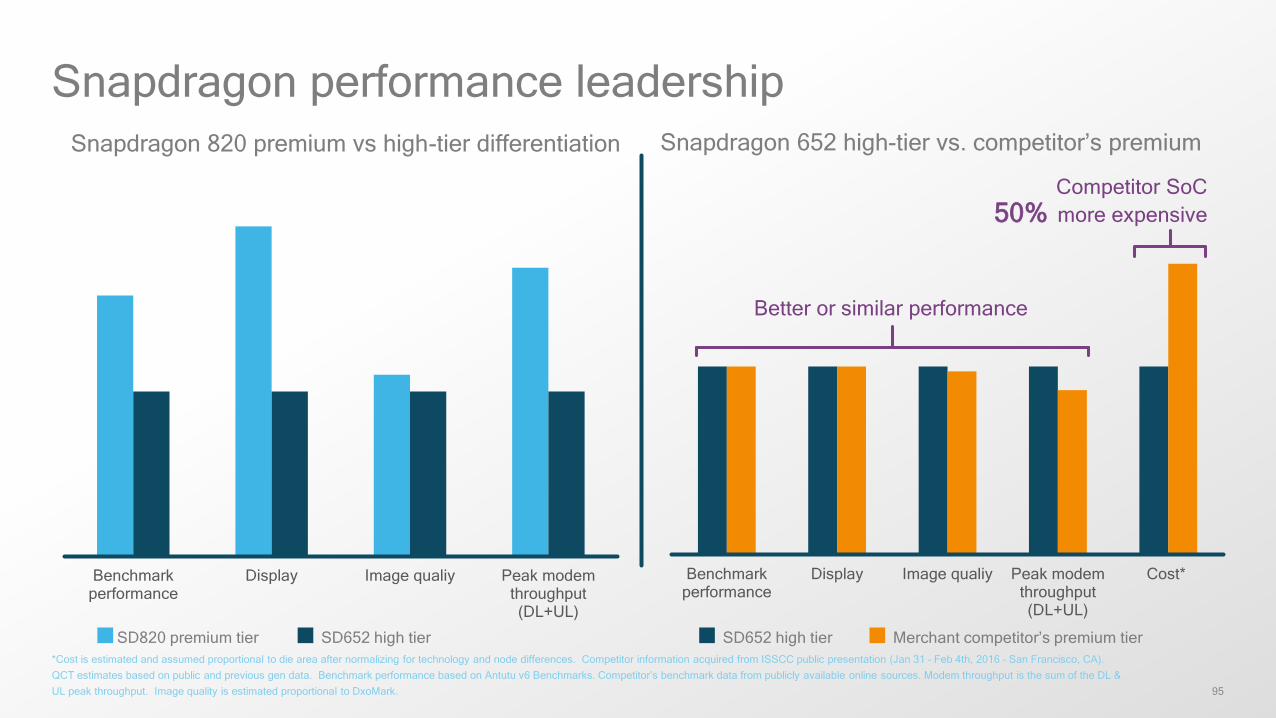
Benchmarkperformance
Display Image qualiy Peak modemthroughput(DL+UL)
Benchmarkperformance
Display Image qualiy Peak modemthroughput(DL+UL)
Cost*
Snapdragon 652 high-tier vs. competitor’s premium
Better or similar performance
Competitor SoC50% more expensive
Snapdragon 820 premium vs high-tier differentiation
Snapdragon performance leadership
*Cost is estimated and assumed proportional to die area after normalizing for technology and node differences. Competitor information acquired from ISSCC public presentation (Jan 31 – Feb 4th, 2016 – San Francisco, CA). QCT estimates based on public and previous gen data. Benchmark performance based on Antutu v6 Benchmarks. Competitor’s benchmark data from publicly available online sources. Modem throughput is the sum of the DL & UL peak throughput. Image quality is estimated proportional to DxoMark.
SD820 premium tier SD652 high tier SD652 high tier Merchant competitor’s premium tier
96
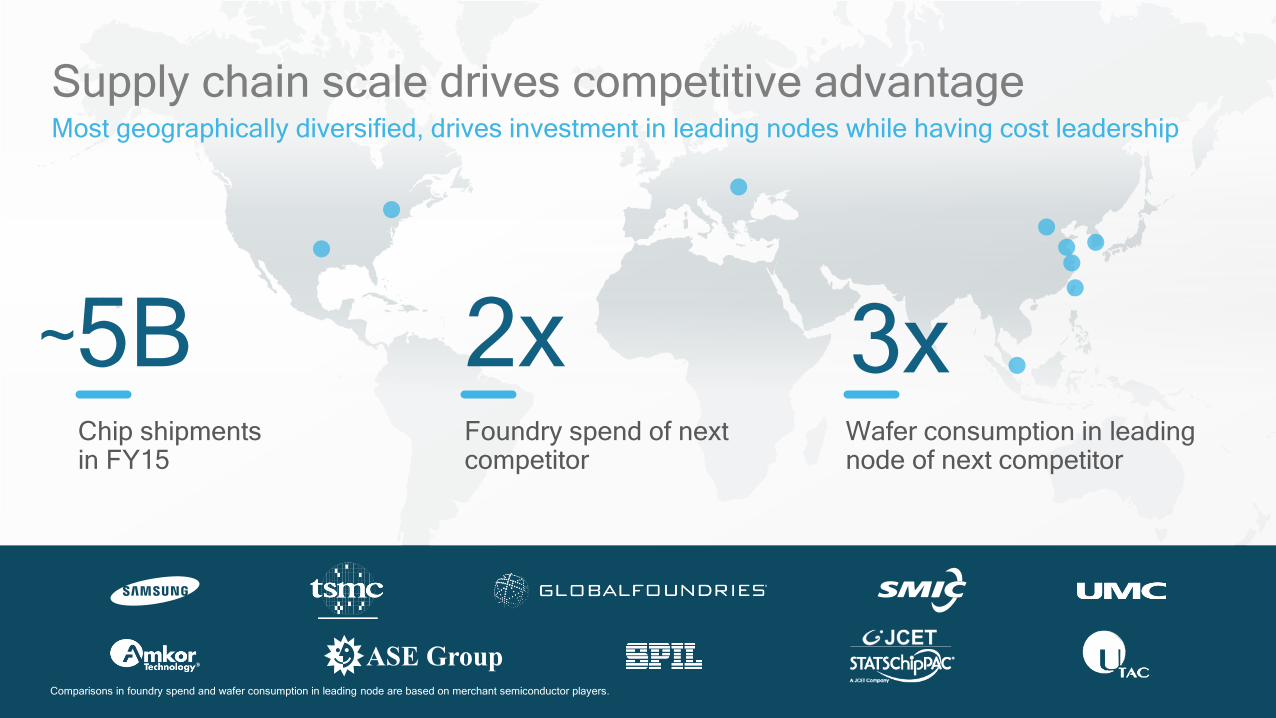
Supply chain scale drives competitive advantageMost geographically diversified, drives investment in leading nodes while having cost leadership
~5BChip shipments in FY15
2xFoundry spend of next competitor
3xWafer consumption in leading node of next competitor
Comparisons in foundry spend and wafer consumption in leading node are based on merchant semiconductor players.
97
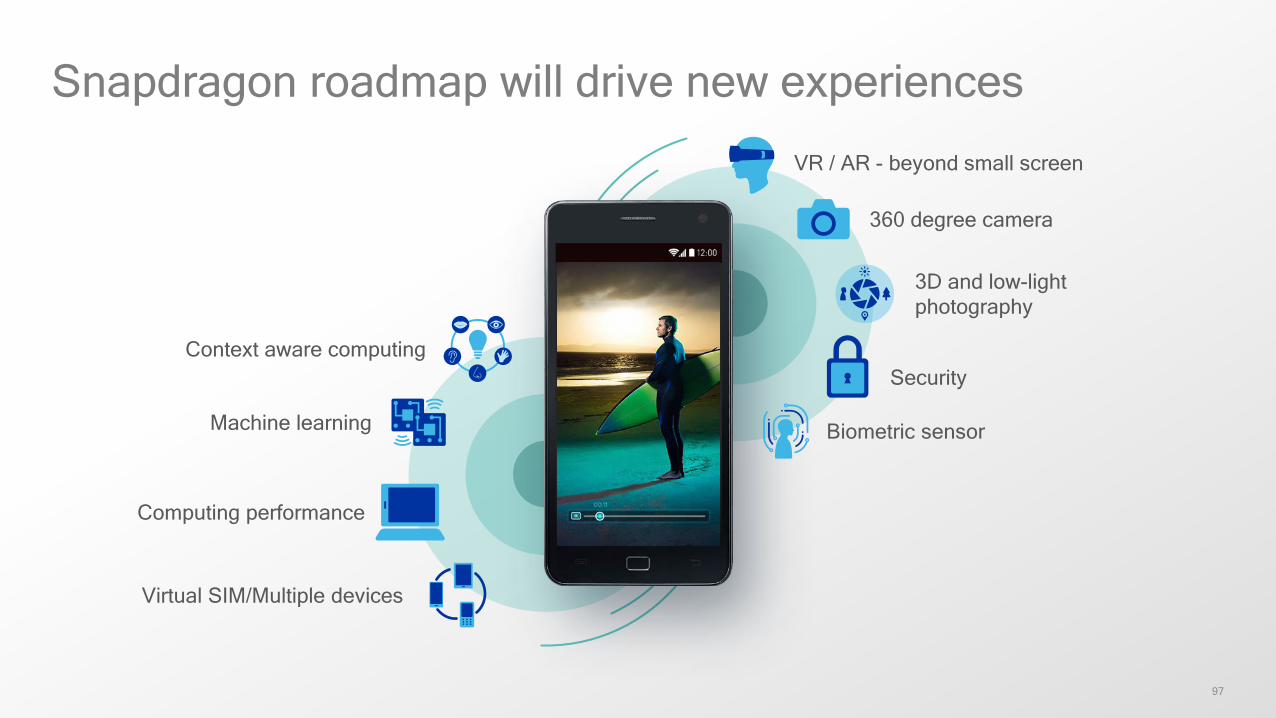
Snapdragon roadmap will drive new experiences
Context aware computing
Machine learning
Computing performance
VR / AR - beyond small screen
360 degree camera
3D and low-light photography
Security
Biometric sensor
Virtual SIM/Multiple devices
98
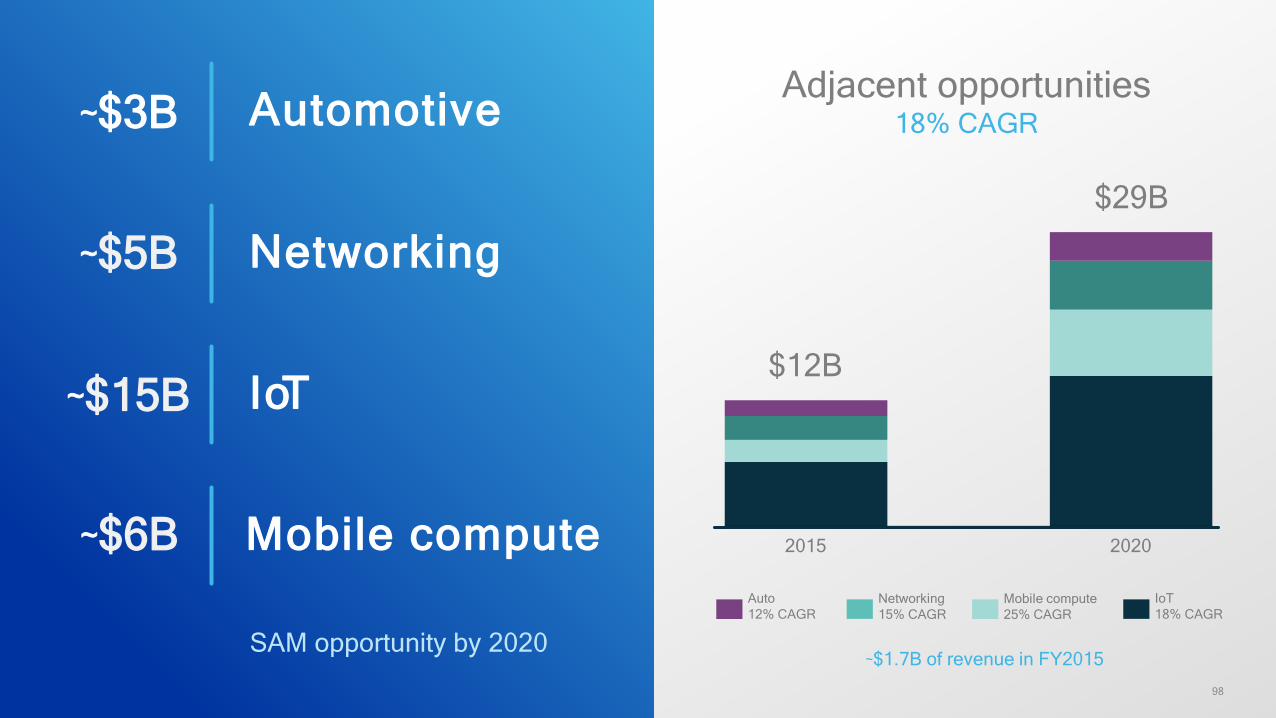
Adjacent opportunities18% CAGR
2020
$29B
2015
$12B
Mobile compute25% CAGR
Networking15% CAGR
Auto12% CAGR
IoT18% CAGR
~$1.7B of revenue in FY2015SAM opportunity by 2020
Automotive~$3B
Networking~$5B
IoT~$15B
Mobile compute~$6B
99
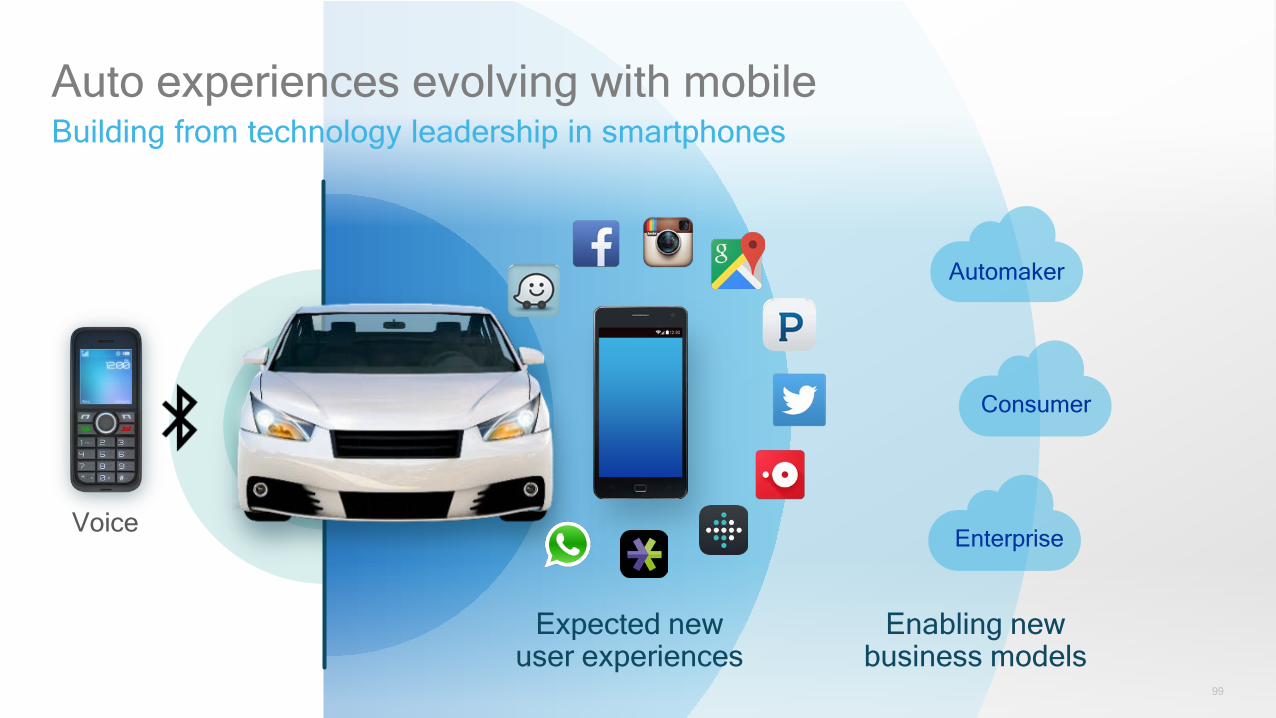
Auto experiences evolving with mobileBuilding from technology leadership in smartphones
Voice
Automaker
Consumer
Enterprise
Expected newuser experiences
Enabling new business models
100
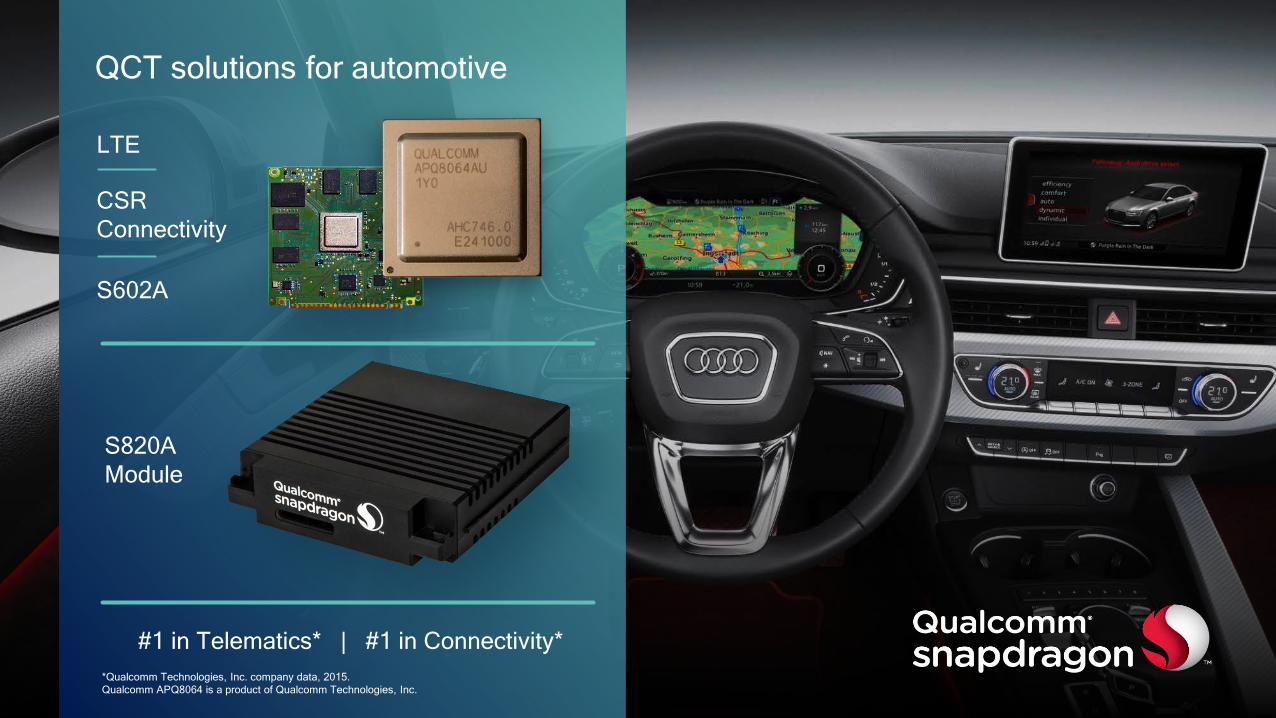
QCT solutions for automotive
S602A
S820AModule
CSR Connectivity
#1 in Telematics* | #1 in Connectivity**Qualcomm Technologies, Inc. company data, 2015. Qualcomm APQ8064 is a product of Qualcomm Technologies, Inc.
LTE
101
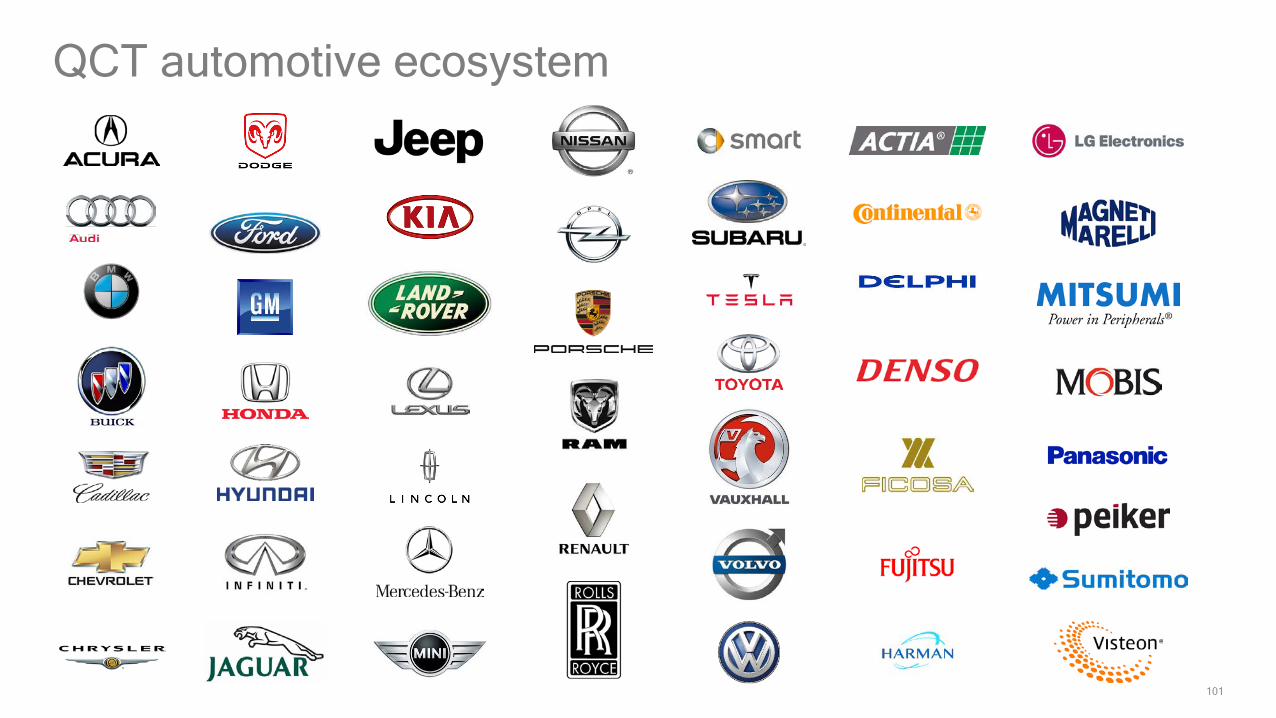
QCT automotive ecosystem
102
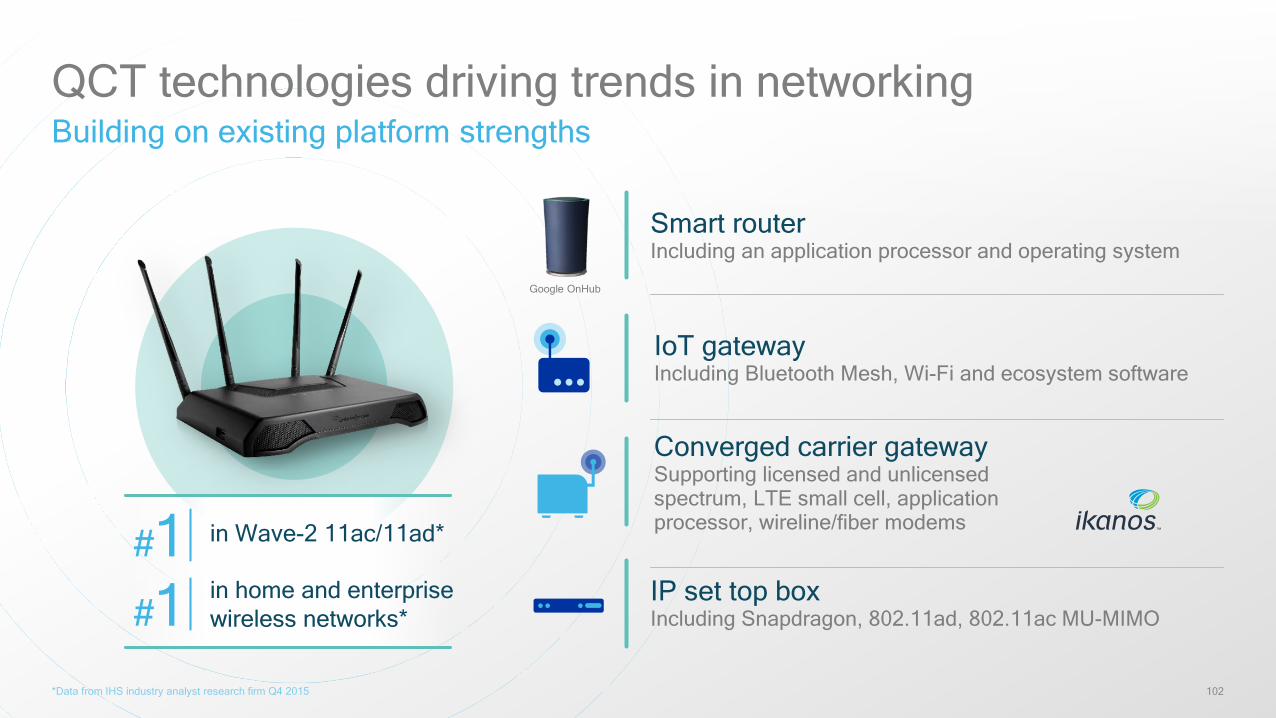
QCT technologies driving trends in networkingBuilding on existing platform strengths
IP set top boxIncluding Snapdragon, 802.11ad, 802.11ac MU-MIMO
Google OnHub
Smart routerIncluding an application processor and operating system
IoT gatewayIncluding Bluetooth Mesh, Wi-Fi and ecosystem software
Converged carrier gatewaySupporting licensed and unlicensed spectrum, LTE small cell, application processor, wireline/fiber modems
#1#1 in Wave-2 11ac/11ad*
in home and enterprise wireless networks*
*Data from IHS industry analyst research firm Q4 2015
103
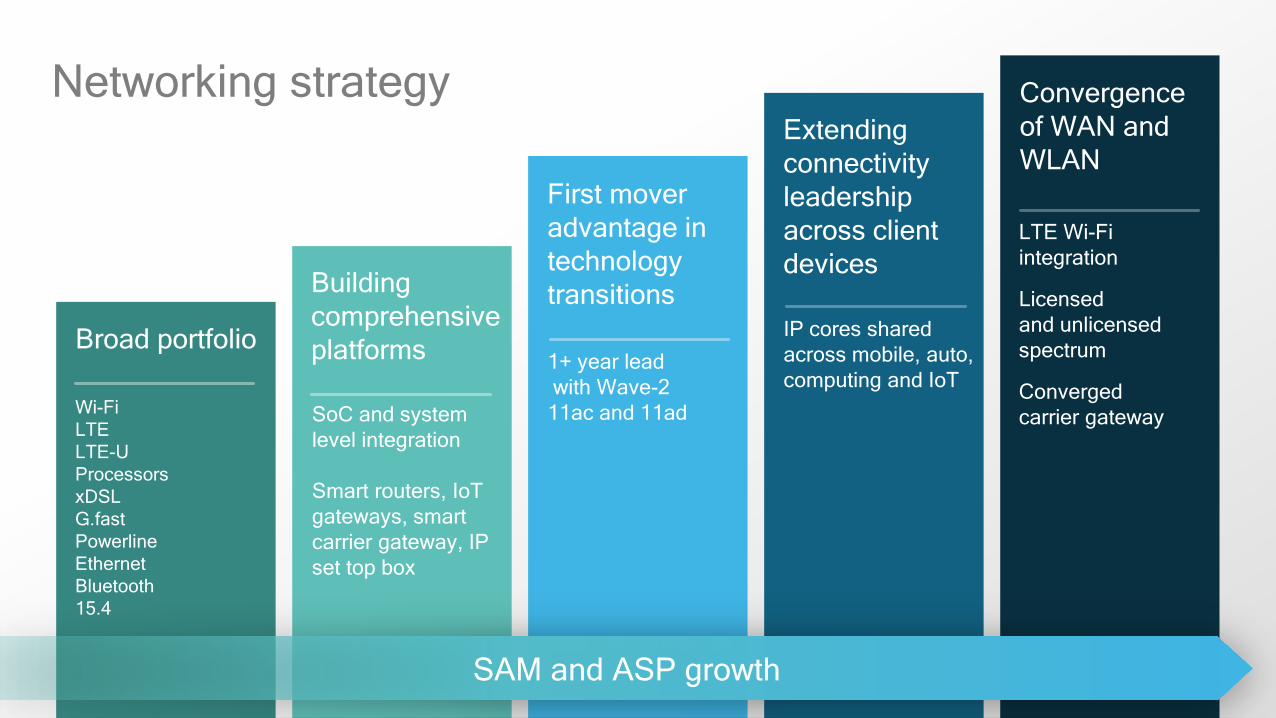
Building comprehensive platforms
SoC and system level integration
Smart routers, IoTgateways, smart carrier gateway, IP set top box
First mover advantage in technology transitions
1+ year leadwith Wave-2 11ac and 11ad
IP cores shared across mobile, auto, computing and IoT
Extending connectivity leadership across client devices
LTE Wi-Fi integration
Licensedand unlicensed spectrum
Converged carrier gateway
Convergenceof WAN and WLAN
Broad portfolio
Wi-FiLTELTE-UProcessorsxDSLG.fastPowerlineEthernetBluetooth15.4
Networking strategy
SAM and ASP growth
104
QCT networking ecosystem
105
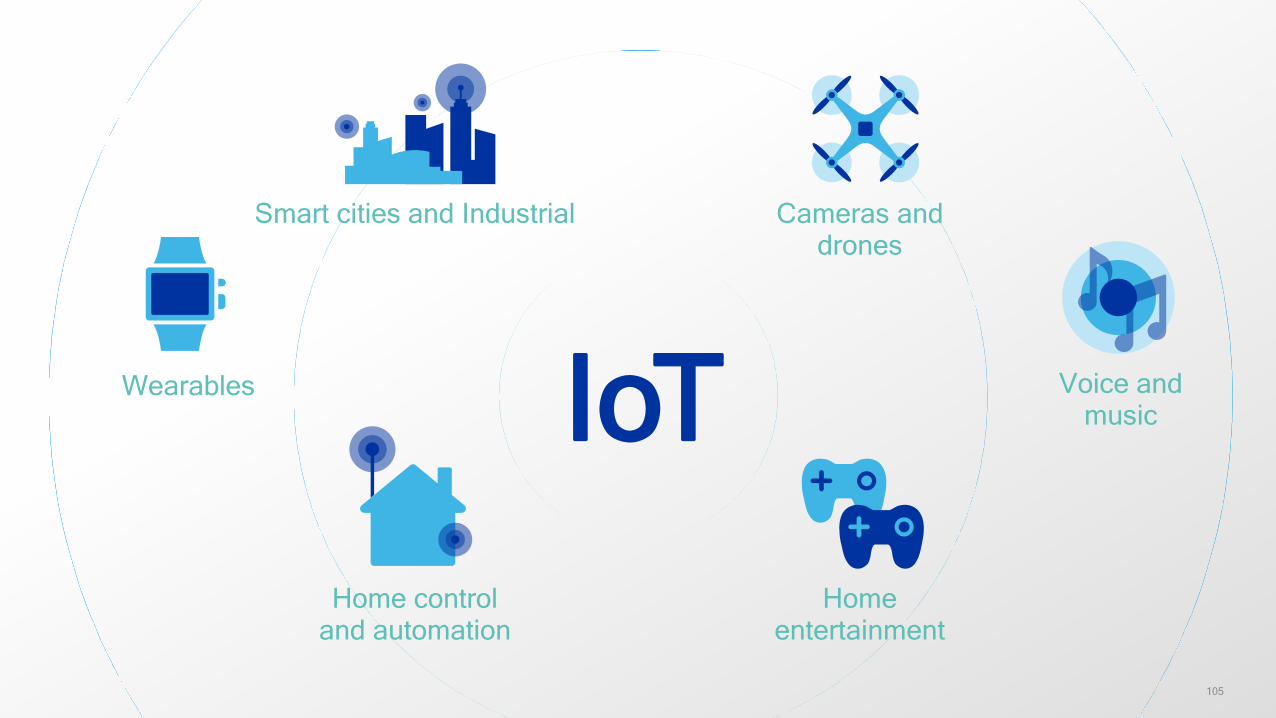
IoTHome control
and automationHome
entertainment
Voice and music
Wearables
Cameras and drones
Smart cities and Industrial
106
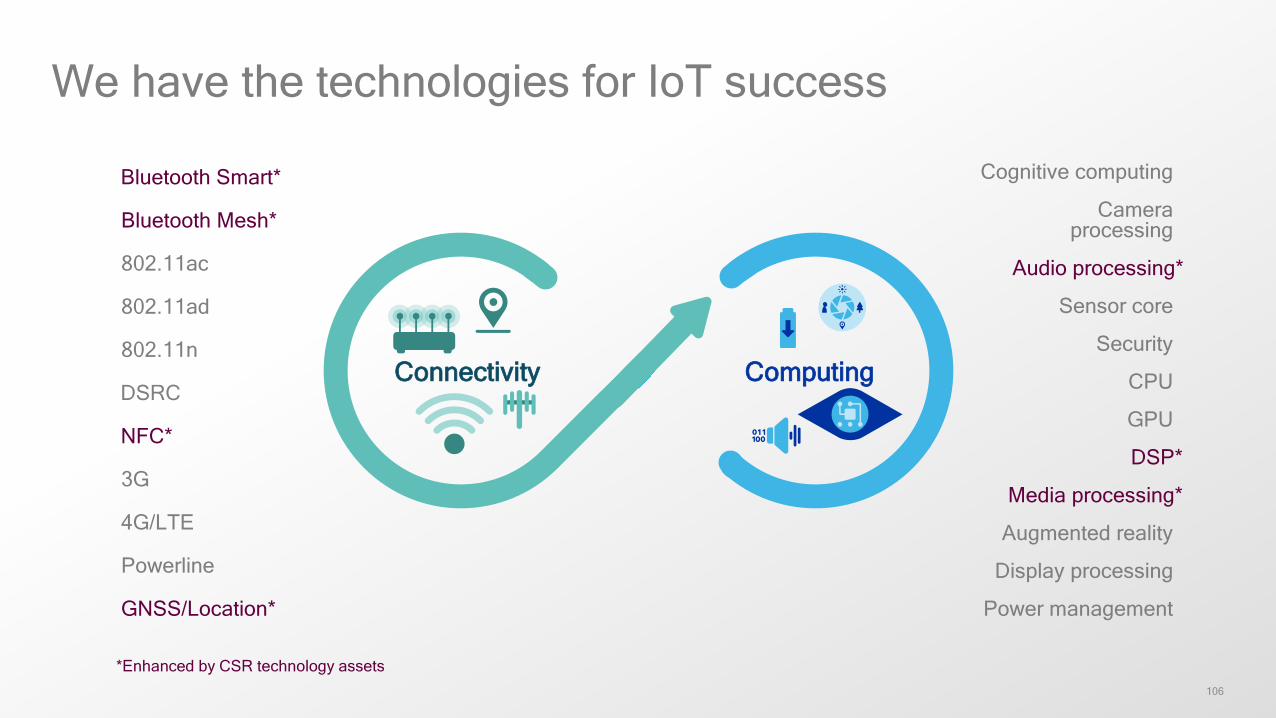
Connectivity Computing
We have the technologies for IoT success
802.11ad
Bluetooth Smart*
802.11ac
3G
4G/LTE
802.11n
Powerline
DSRC
NFC*
Sensor core
Display processing
Media processing*
CPU
Augmented reality
GNSS/Location*
GPU
Camera processing
DSP*
Security
Power management
Cognitive computing
Bluetooth Mesh*
Audio processing*
*Enhanced by CSR technology assets
107
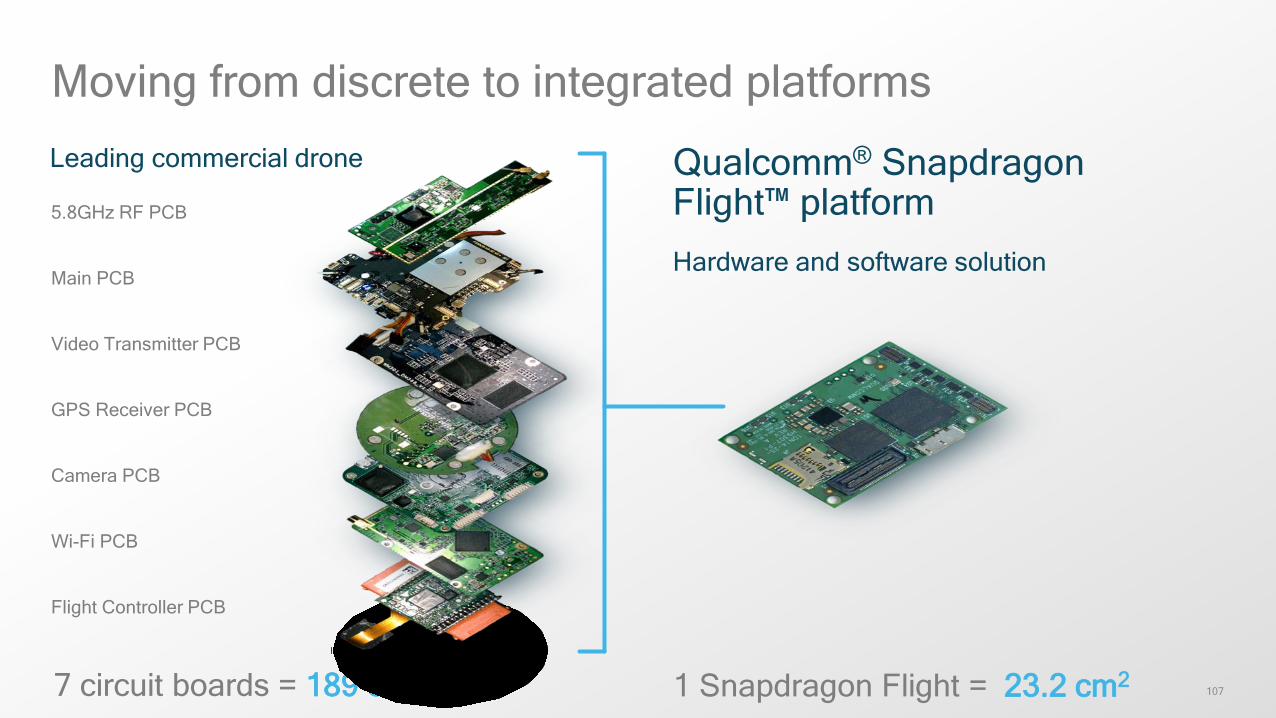
Moving from discrete to integrated platforms
Qualcomm® Snapdragon Flight™ platform Hardware and software solution
1 Snapdragon Flight = 23.2 cm2
Main PCB
Flight Controller PCB
Wi-Fi PCB
Video Transmitter PCB
5.8GHz RF PCB
GPS Receiver PCB
Camera PCB
7 circuit boards = 189 cm2
Leading commercial drone
108
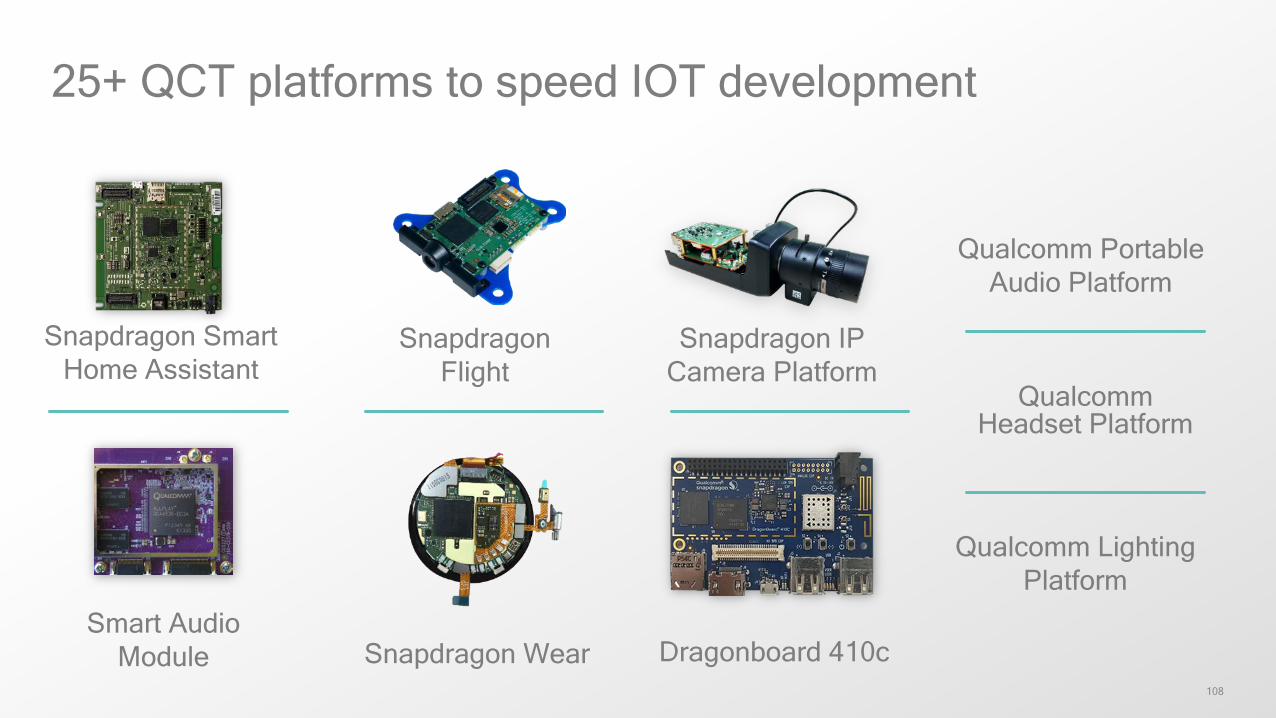
25+ QCT platforms to speed IOT development
Smart AudioModule
Snapdragon SmartHome Assistant
Qualcomm LightingPlatform
Qualcomm PortableAudio Platform
QualcommHeadset Platform
Snapdragon IPCamera Platform
SnapdragonFlight
Dragonboard 410cSnapdragon Wear
109
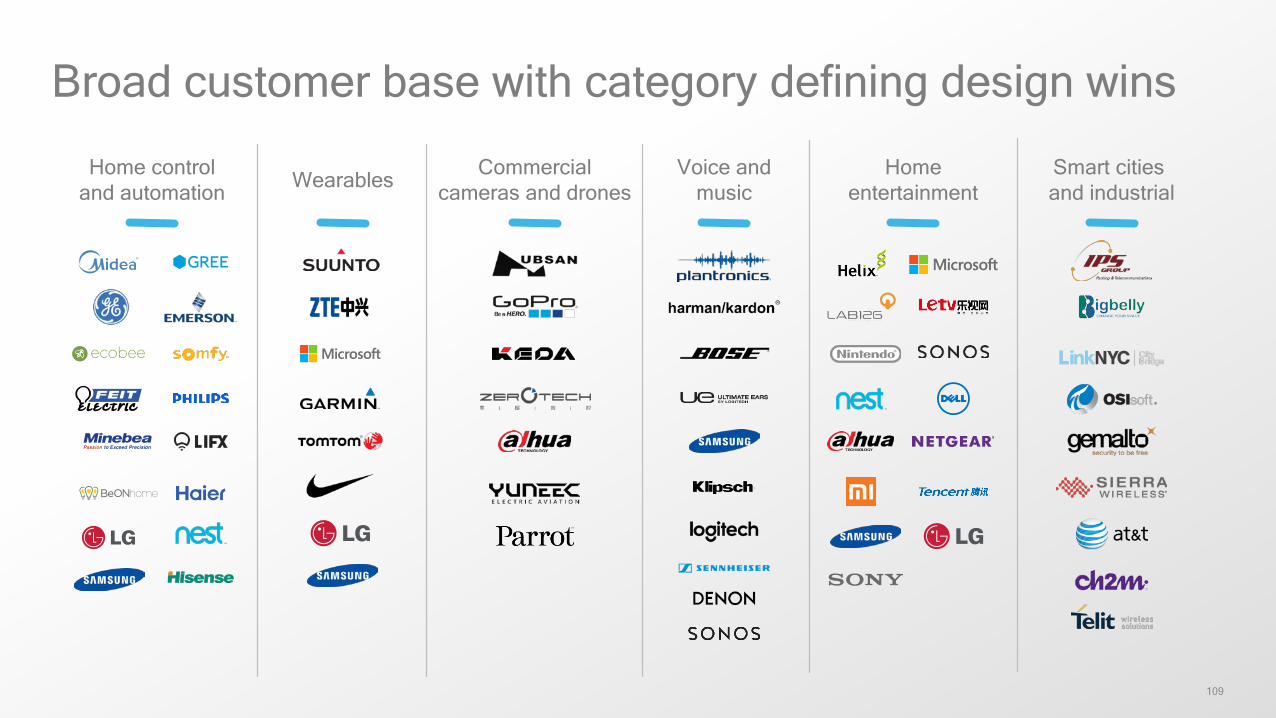
Broad customer base with category defining design wins
Home controland automation Wearables Commercial
cameras and dronesVoice and
musicHome
entertainmentSmart cities and industrial
Product announcements
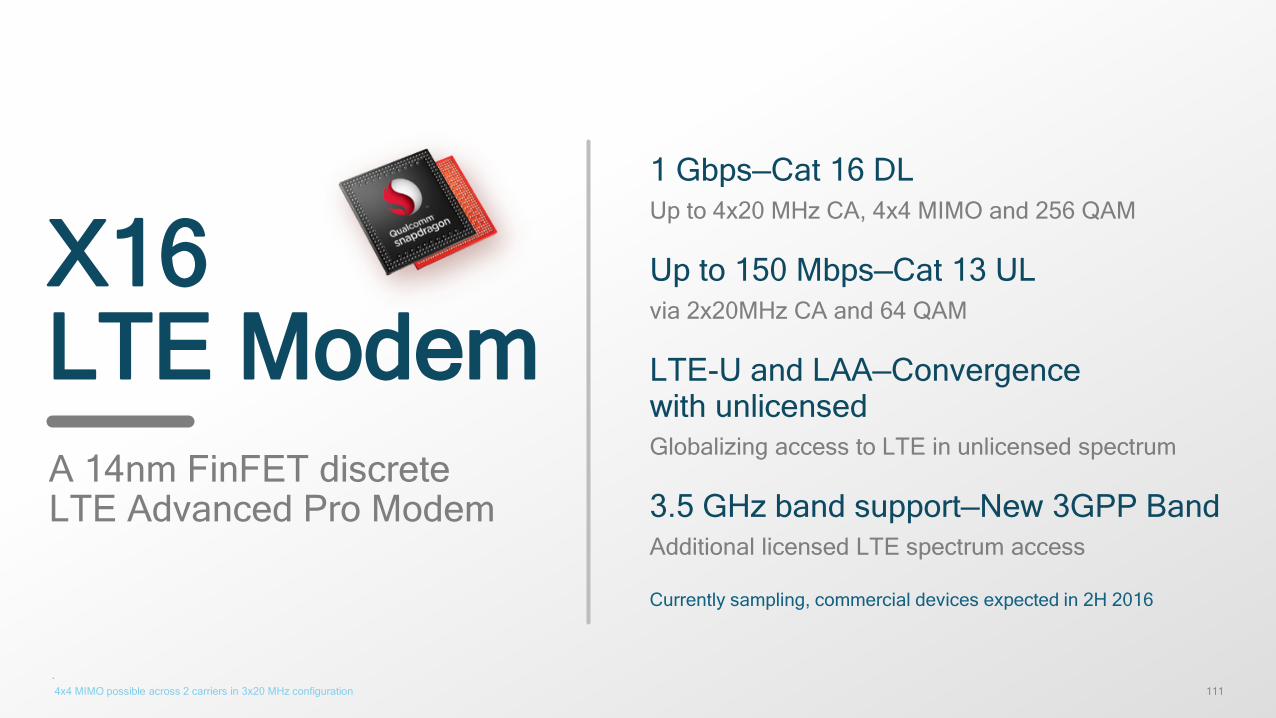
111.4x4 MIMO possible across 2 carriers in 3x20 MHz configuration
X16LTE ModemA 14nm FinFET discreteLTE Advanced Pro Modem
1 Gbps—Cat 16 DLUp to 4x20 MHz CA, 4x4 MIMO and 256 QAM
Up to 150 Mbps—Cat 13 ULvia 2x20MHz CA and 64 QAM
LTE-U and LAA—Convergence with unlicensedGlobalizing access to LTE in unlicensed spectrum
3.5 GHz band support—New 3GPP BandAdditional licensed LTE spectrum access
Currently sampling, commercial devices expected in 2H 2016
112* Performance against previous generation. ^ Strategy analytics, global smartphone reviews, ASPs and price tier forecasts: 2003-2020, July 2015. Growth rates for Asia Pacific [$100-$299 price band, 2015-2016]
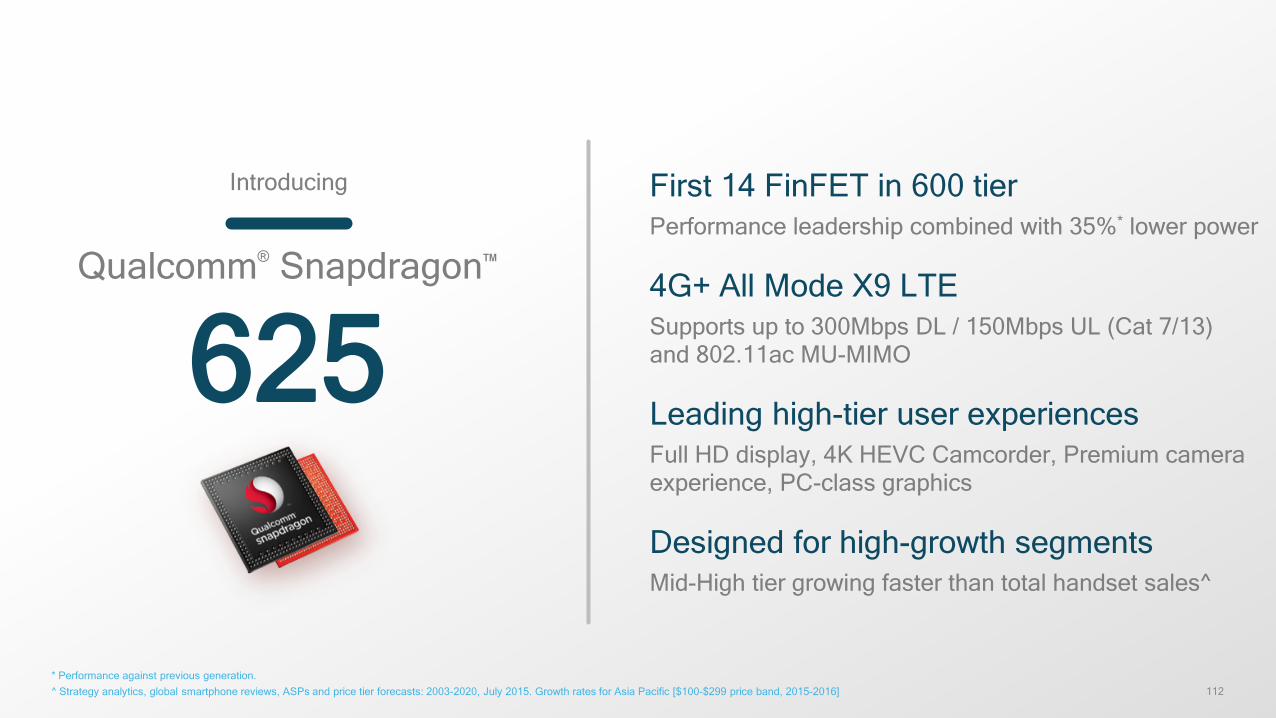
Introducing
Qualcomm® Snapdragon™
First 14 FinFET in 600 tier Performance leadership combined with 35%* lower power
4G+ All Mode X9 LTESupports up to 300Mbps DL / 150Mbps UL (Cat 7/13)and 802.11ac MU-MIMO
Leading high-tier user experiencesFull HD display, 4K HEVC Camcorder, Premium camera experience, PC-class graphics
Designed for high-growth segmentsMid-High tier growing faster than total handset sales^
625
113
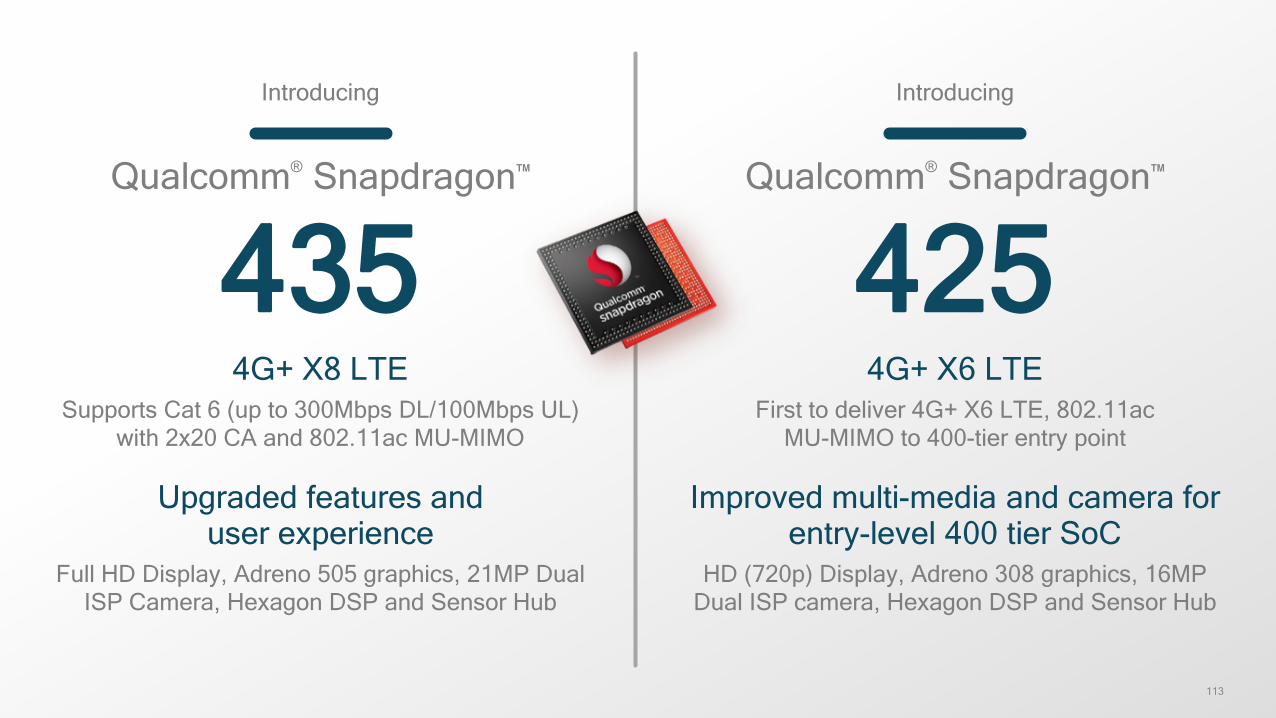
4G+ X8 LTESupports Cat 6 (up to 300Mbps DL/100Mbps UL)
with 2x20 CA and 802.11ac MU-MIMO
Upgraded features anduser experience
Full HD Display, Adreno 505 graphics, 21MP Dual ISP Camera, Hexagon DSP and Sensor Hub
4G+ X6 LTEFirst to deliver 4G+ X6 LTE, 802.11ac
MU-MIMO to 400-tier entry point
Improved multi-media and camera for entry-level 400 tier SoC
HD (720p) Display, Adreno 308 graphics, 16MP Dual ISP camera, Hexagon DSP and Sensor Hub
Introducing
Qualcomm® Snapdragon™
435
Introducing
Qualcomm® Snapdragon™
425
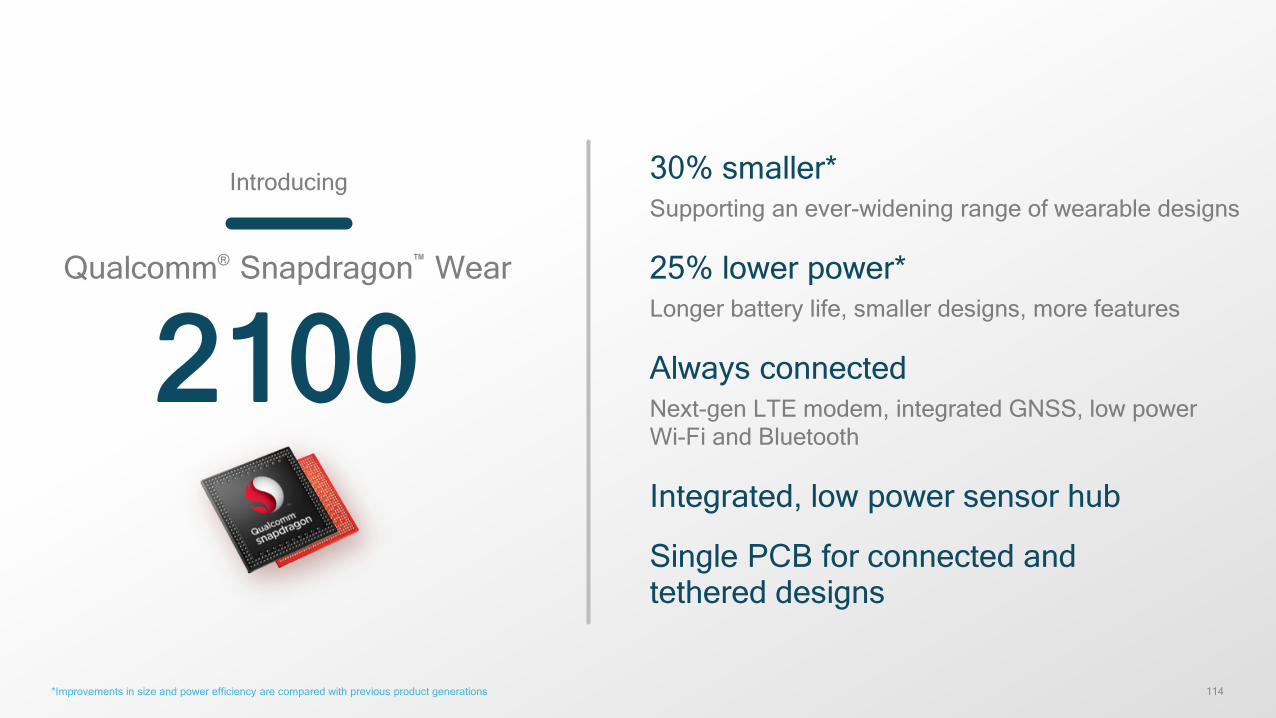
114*Improvements in size and power efficiency are compared with previous product generations
Introducing
Qualcomm® Snapdragon™ Wear
30% smaller*Supporting an ever-widening range of wearable designs
25% lower power*Longer battery life, smaller designs, more features
Always connectedNext-gen LTE modem, integrated GNSS, low powerWi-Fi and Bluetooth
Integrated, low power sensor hub
Single PCB for connected andtethered designs
2100
115
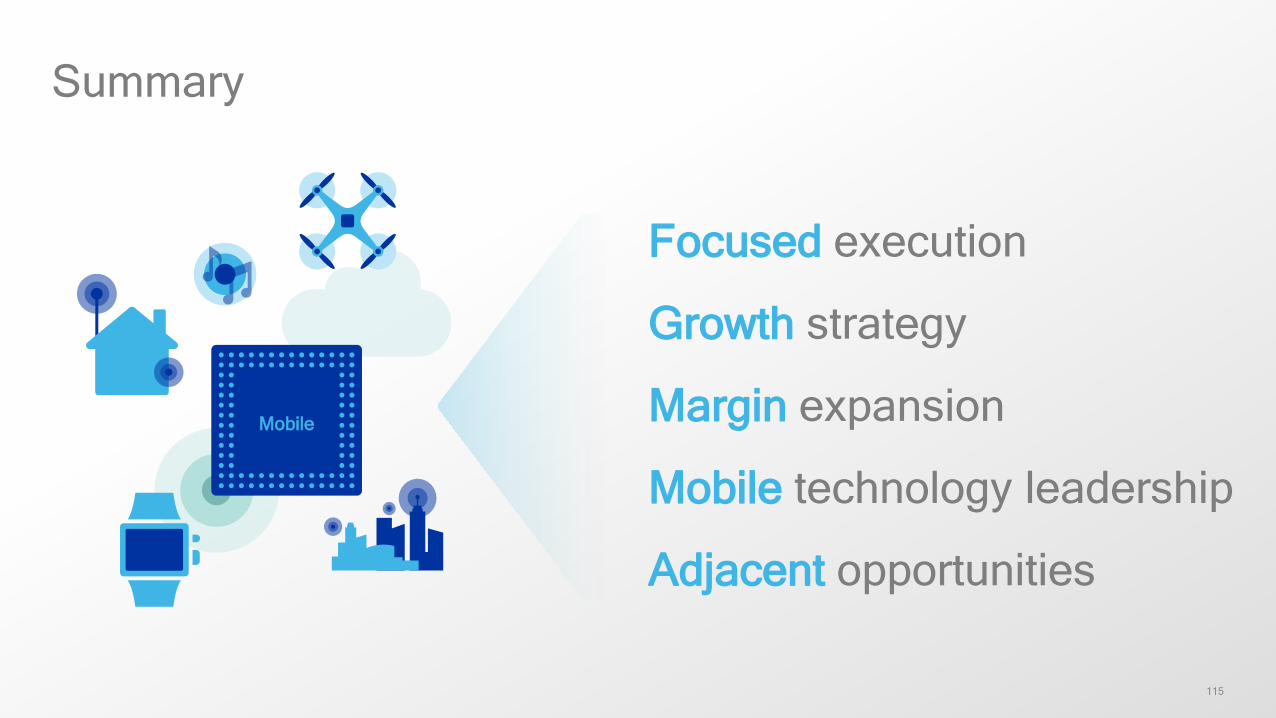
Summary
Focused execution
Growth strategy
Margin expansion
Mobile technology leadership
Adjacent opportunities
Mobile
George Davis
EVP and Chief Financial Officer,Qualcomm Incorporated
117
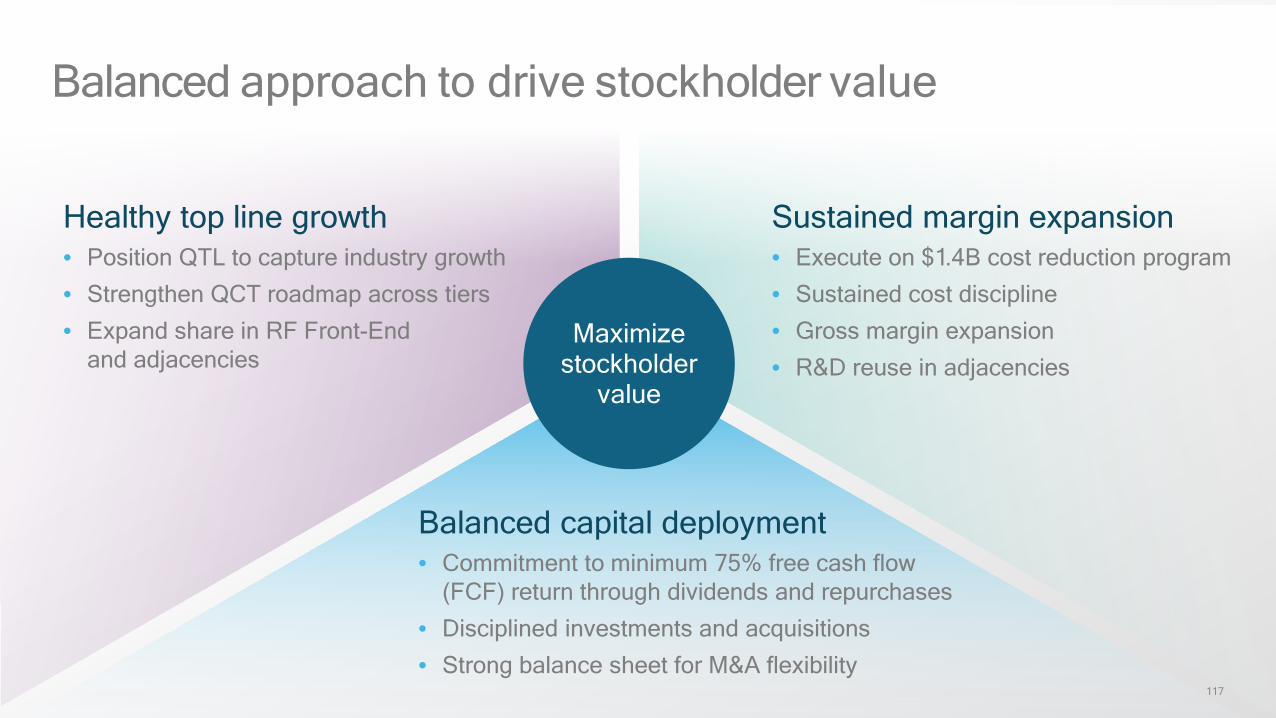
Balanced approach to drive stockholder value
Maximizestockholder
value
Healthy top line growth• Position QTL to capture industry growth
• Strengthen QCT roadmap across tiers
• Expand share in RF Front-Endand adjacencies
Sustained margin expansion • Execute on $1.4B cost reduction program
• Sustained cost discipline
• Gross margin expansion
• R&D reuse in adjacencies
Balanced capital deployment• Commitment to minimum 75% free cash flow
(FCF) return through dividends and repurchases
• Disciplined investments and acquisitions
• Strong balance sheet for M&A flexibility

Top-line growth
119
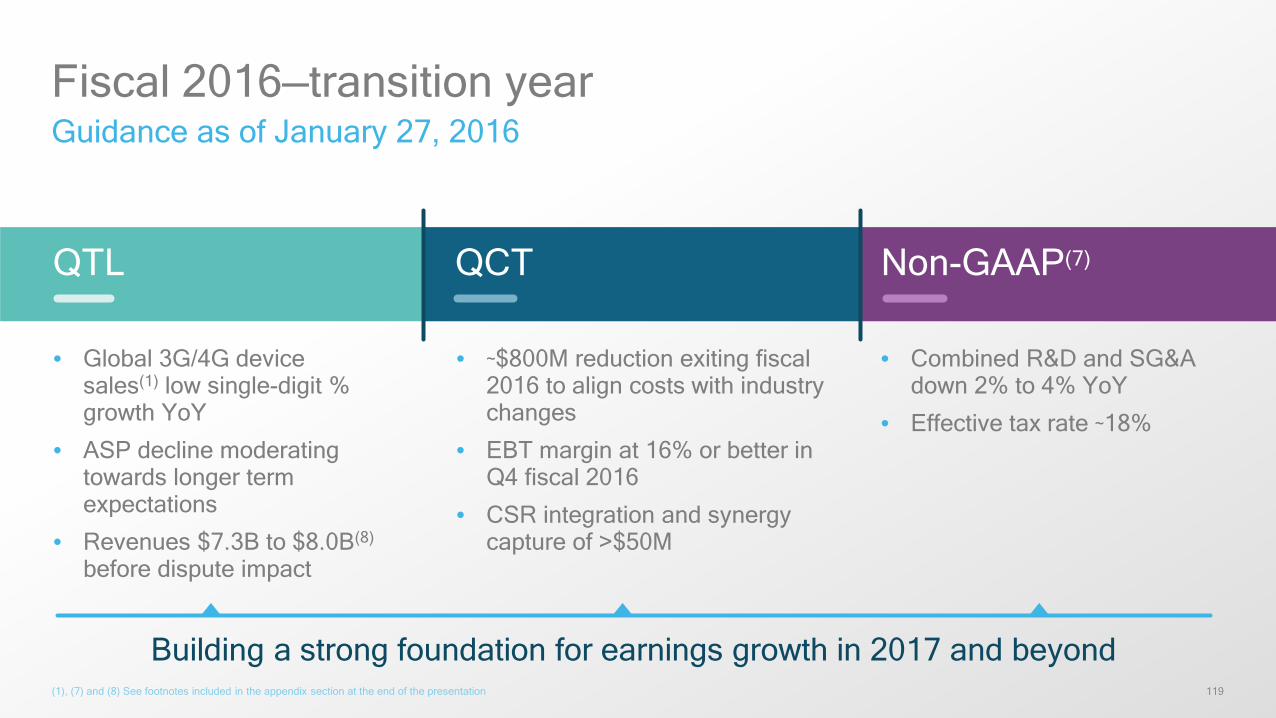
Fiscal 2016—transition yearGuidance as of January 27, 2016
(1), (7) and (8) See footnotes included in the appendix section at the end of the presentation
QTL Non-GAAP(7)
• ~$800M reduction exiting fiscal 2016 to align costs with industry changes
• EBT margin at 16% or better in Q4 fiscal 2016
• CSR integration and synergy capture of >$50M
• Global 3G/4G device sales(1) low single-digit % growth YoY
• ASP decline moderating towards longer term expectations
• Revenues $7.3B to $8.0B(8)
before dispute impact
• Combined R&D and SG&A down 2% to 4% YoY
• Effective tax rate ~18%
Building a strong foundation for earnings growth in 2017 and beyond
QCT
120
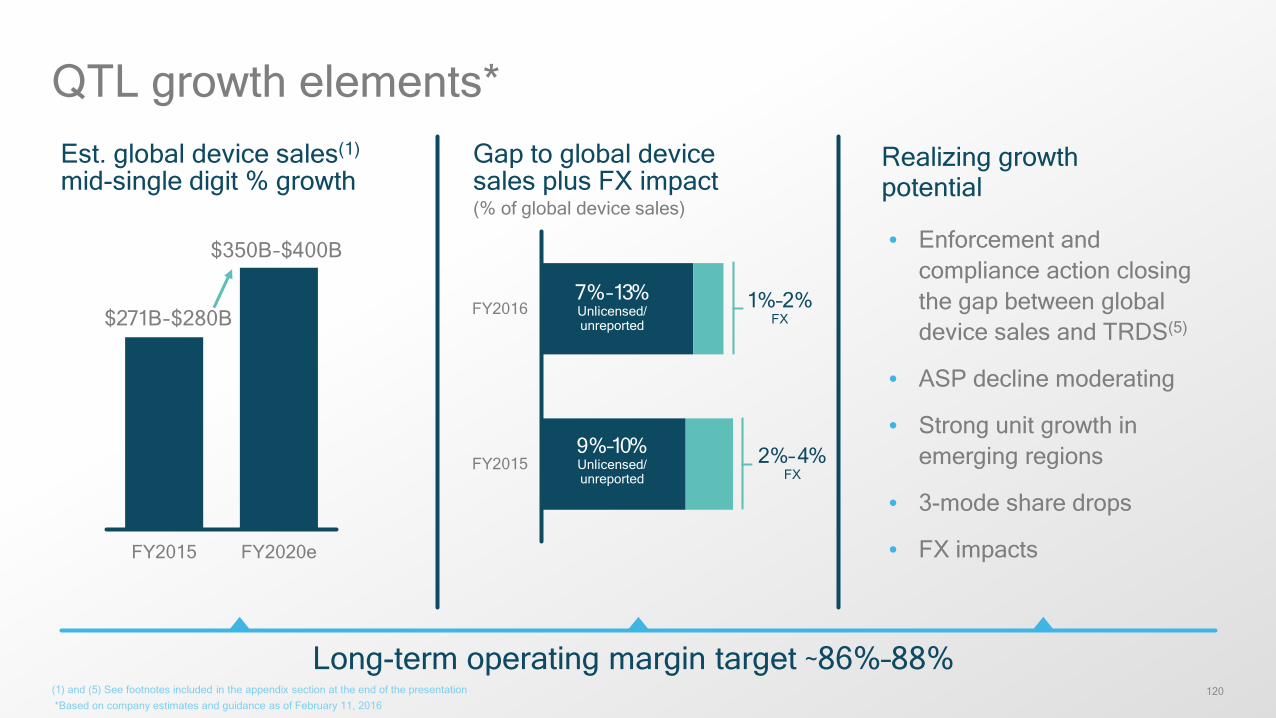
FY2015 FY2020e
QTL growth elements*
(1) and (5) See footnotes included in the appendix section at the end of the presentation*Based on company estimates and guidance as of February 11, 2016
FY2015
FY2016
$350B–$400B
$271B–$280B
Est. global device sales(1)
mid-single digit % growthGap to global device sales plus FX impact(% of global device sales)
2%–4%FX
• Enforcement and compliance action closing the gap between global device sales and TRDS(5)
• ASP decline moderating
• Strong unit growth in emerging regions
• 3-mode share drops
• FX impacts
Realizing growthpotential
1%–2%FX
7%–13%Unlicensed/unreported
9%–10%Unlicensed/unreported
Long-term operating margin target ~86%–88%
121
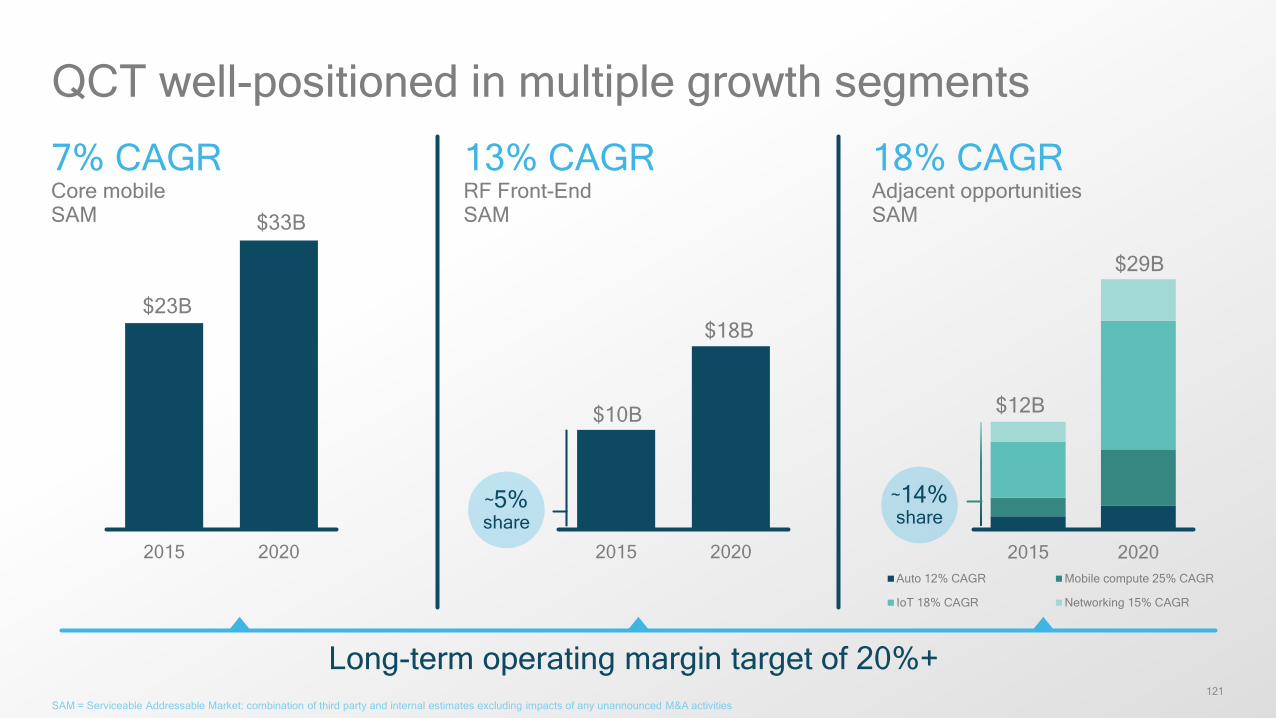
2015 2020Auto 12% CAGR Mobile compute 25% CAGR
IoT 18% CAGR Networking 15% CAGR
2015 20202015 2020
QCT well-positioned in multiple growth segments
SAM = Serviceable Addressable Market: combination of third party and internal estimates excluding impacts of any unannounced M&A activities
$23B
$33B
$12B
$29B
Long-term operating margin target of 20%+
~14%share
~5%share
$18B
$10B
7% CAGRCore mobile SAM
13% CAGRRF Front-EndSAM
18% CAGRAdjacent opportunities SAM
122
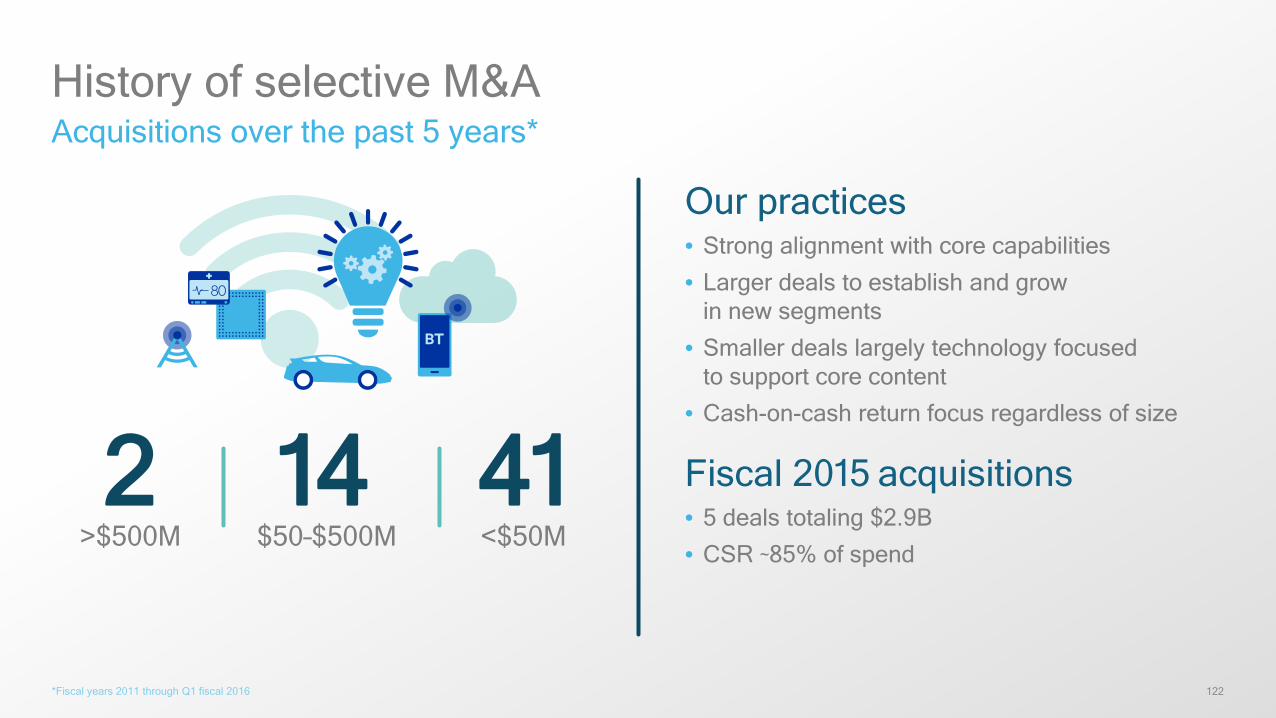
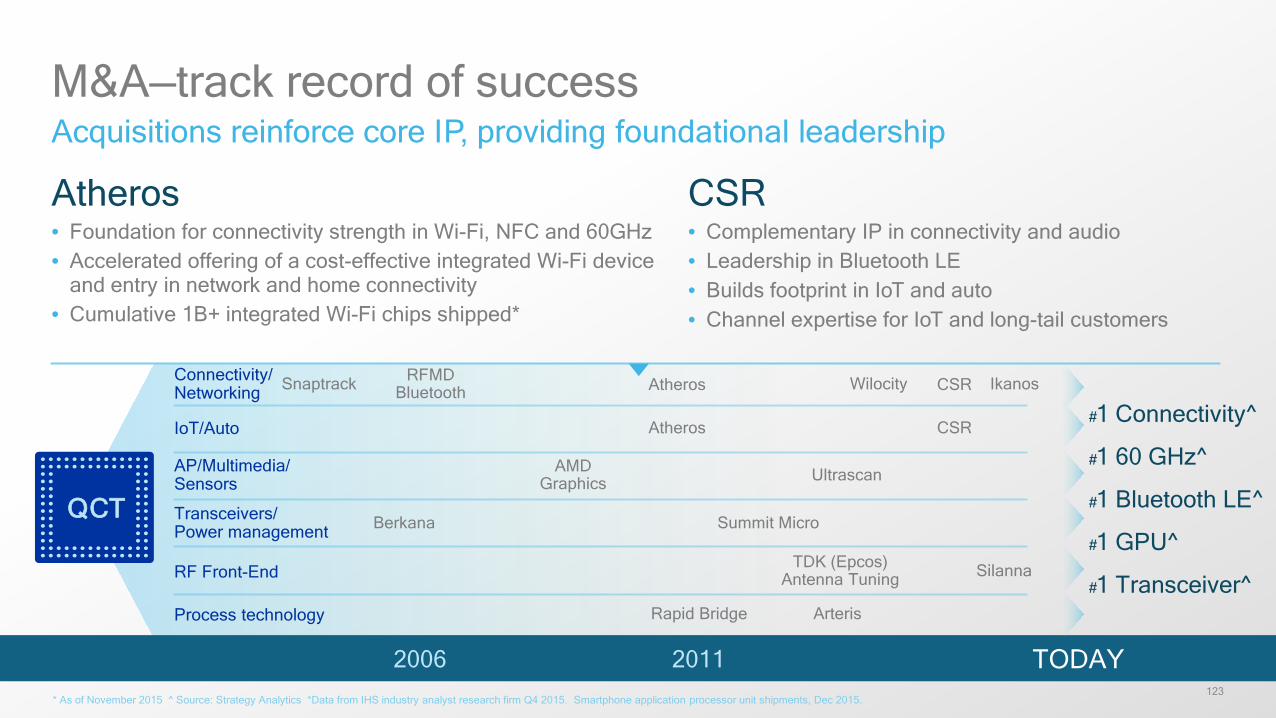
History of selective M&AAcquisitions over the past 5 years*
*Fiscal years 2011 through Q1 fiscal 2016
Our practices• Strong alignment with core capabilities
• Larger deals to establish and grow in new segments
• Smaller deals largely technology focused to support core content
• Cash-on-cash return focus regardless of size
Fiscal 2015 acquisitions• 5 deals totaling $2.9B
• CSR ~85% of spend>$500M2
$50–$500M14
<$50M41
123
CSR• Complementary IP in connectivity and audio• Leadership in Bluetooth LE• Builds footprint in IoT and auto• Channel expertise for IoT and long-tail customers
M&A—track record of successAcquisitions reinforce core IP, providing foundational leadership
* As of November 2015 ^ Source: Strategy Analytics *Data from IHS industry analyst research firm Q4 2015. Smartphone application processor unit shipments, Dec 2015.
2006 2011 TODAY
Atheros• Foundation for connectivity strength in Wi-Fi, NFC and 60GHz• Accelerated offering of a cost-effective integrated Wi-Fi device
and entry in network and home connectivity• Cumulative 1B+ integrated Wi-Fi chips shipped*
#1 Connectivity^
#1 60 GHz^
#1 Bluetooth LE^
#1 GPU^
#1 Transceiver^
Berkana
Arteris
TDK (Epcos)Antenna Tuning
AMDGraphics
Wilocity
Summit Micro
RF Front-End
Connectivity/Networking
AP/Multimedia/ Sensors
Transceivers/ Power management
RFMDBluetooth
IoT/Auto
Ikanos
Ultrascan
Process technology Rapid Bridge
Snaptrack
Silanna
QCT
Atheros CSR
Atheros CSR
124
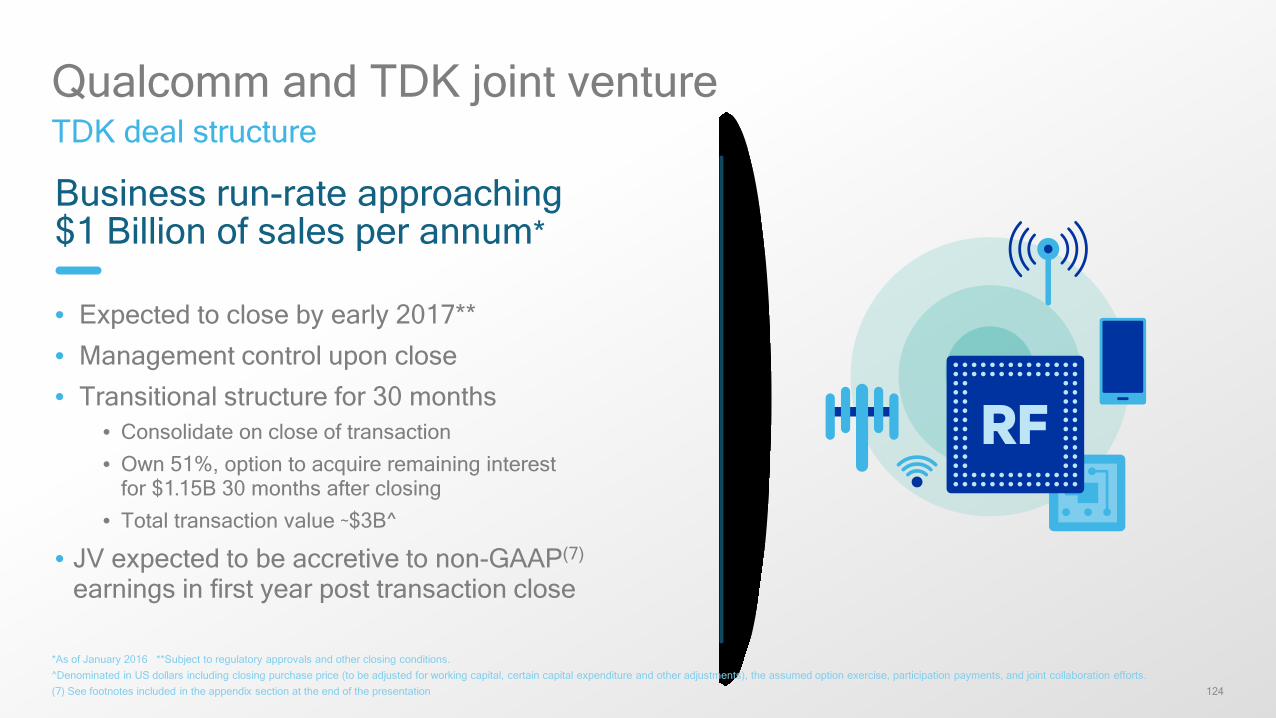
Qualcomm and TDK joint ventureTDK deal structure
*As of January 2016 **Subject to regulatory approvals and other closing conditions. ^Denominated in US dollars including closing purchase price (to be adjusted for working capital, certain capital expenditure and other adjustments), the assumed option exercise, participation payments, and joint collaboration efforts.(7) See footnotes included in the appendix section at the end of the presentation
Business run-rate approaching$1 Billion of sales per annum*
• Expected to close by early 2017**
• Management control upon close
• Transitional structure for 30 months• Consolidate on close of transaction • Own 51%, option to acquire remaining interest
for $1.15B 30 months after closing• Total transaction value ~$3B^
• JV expected to be accretive to non-GAAP(7)
earnings in first year post transaction close
Focus on margin expansion
126
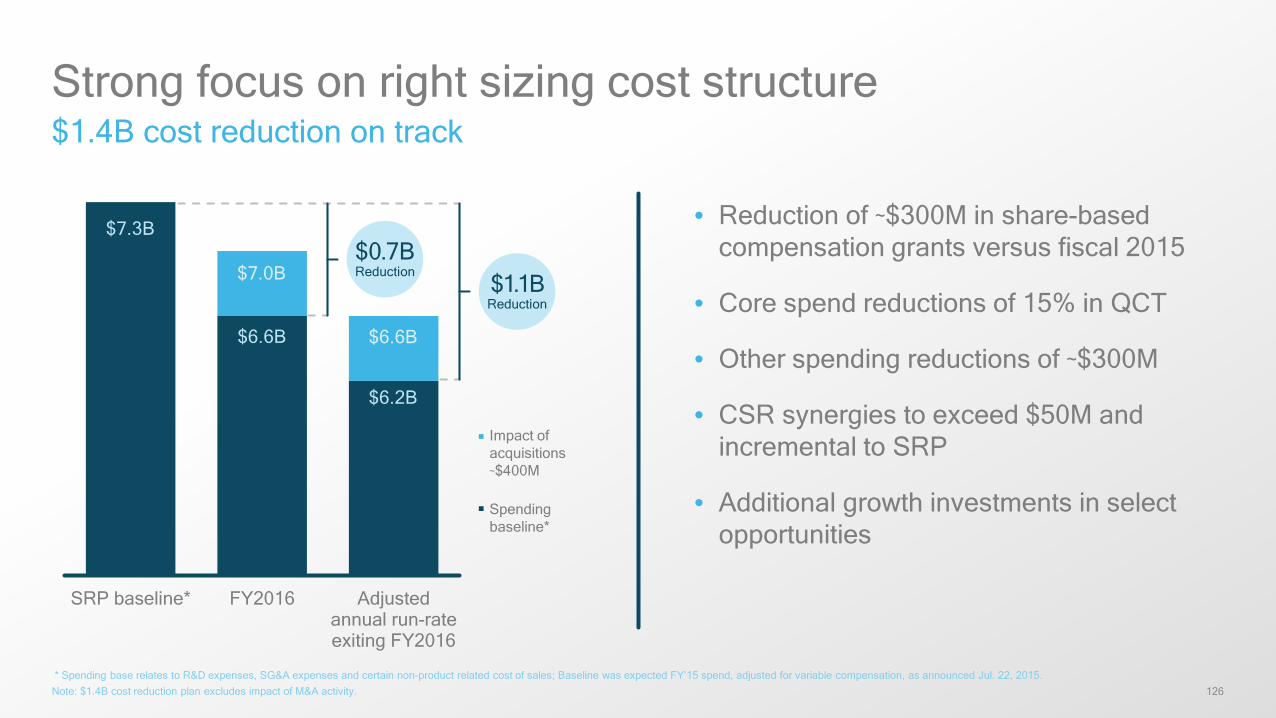
SRP baseline* FY2016 Adjustedannual run-rateexiting FY2016
$6.2B
$7.3B
$6.6B
$7.0B
$6.6B
Strong focus on right sizing cost structure$1.4B cost reduction on track
* Spending base relates to R&D expenses, SG&A expenses and certain non-product related cost of sales; Baseline was expected FY’15 spend, adjusted for variable compensation, as announced Jul. 22, 2015.Note: $1.4B cost reduction plan excludes impact of M&A activity.
• Reduction of ~$300M in share-based compensation grants versus fiscal 2015
• Core spend reductions of 15% in QCT
• Other spending reductions of ~$300M
• CSR synergies to exceed $50M and incremental to SRP
• Additional growth investments in select opportunities
$1.1BReduction
$0.7BReduction
Impact of acquisitions ~$400M
Spending baseline*
127
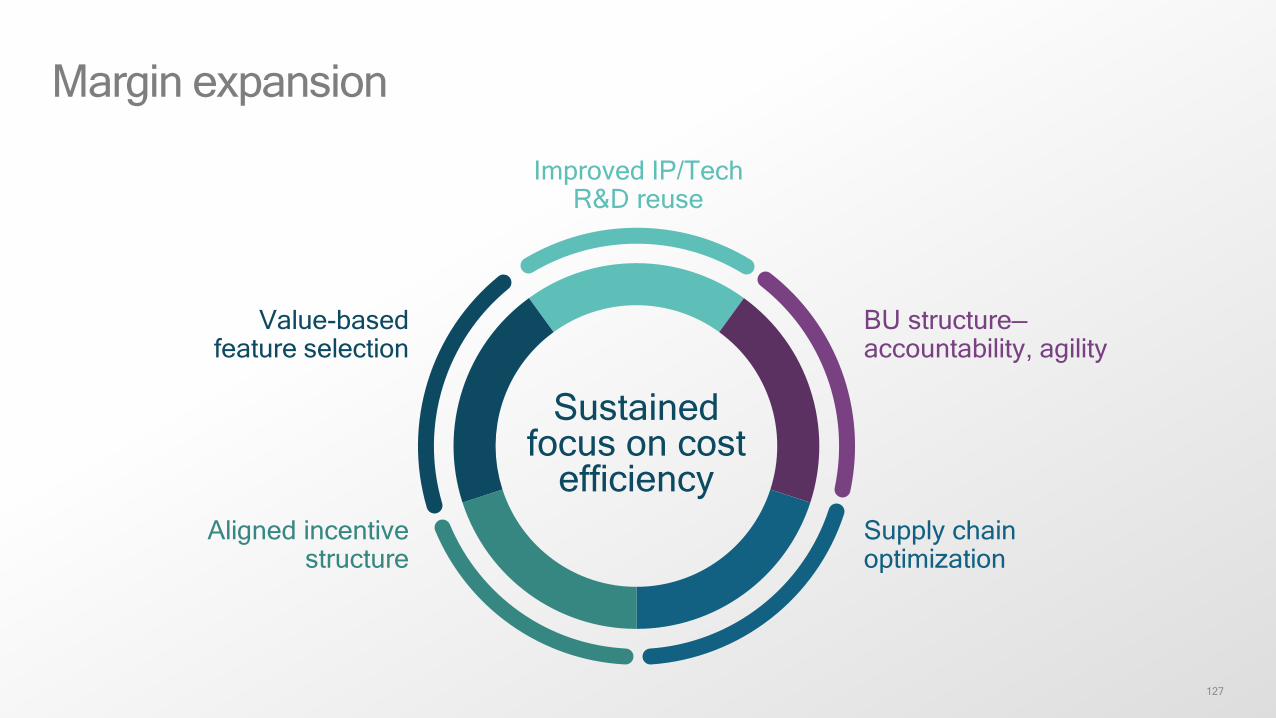
Margin expansion
Improved IP/Tech R&D reuse
Supply chain optimization
Aligned incentive structure
BU structure—accountability, agility
Value-based feature selection
Sustained focus on cost
efficiency
128
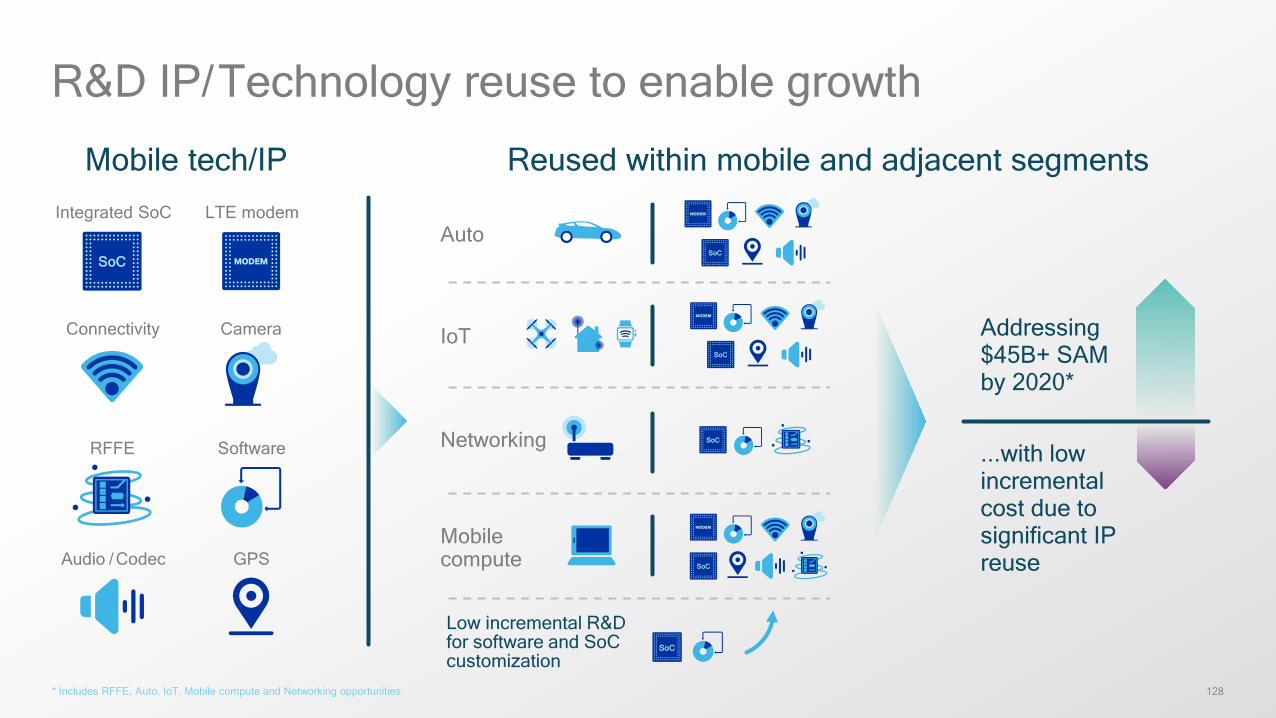
R&D IP/ Technology reuse to enable growth
* Includes RFFE, Auto, IoT, Mobile compute and Networking opportunities
Mobile tech/IP Reused within mobile and adjacent segments
Addressing $45B+ SAM by 2020*
...with low incremental cost due to significant IP reuse
Integrated SoC
Camera
LTE modem
Connectivity
RFFE Software
Audio / Codec GPS
SoC
Auto
IoT
Networking
Low incremental R&D for software and SoCcustomization
SoC
SoC
SoC
SoC
Mobilecompute SoC
Balanced capital deployment
130
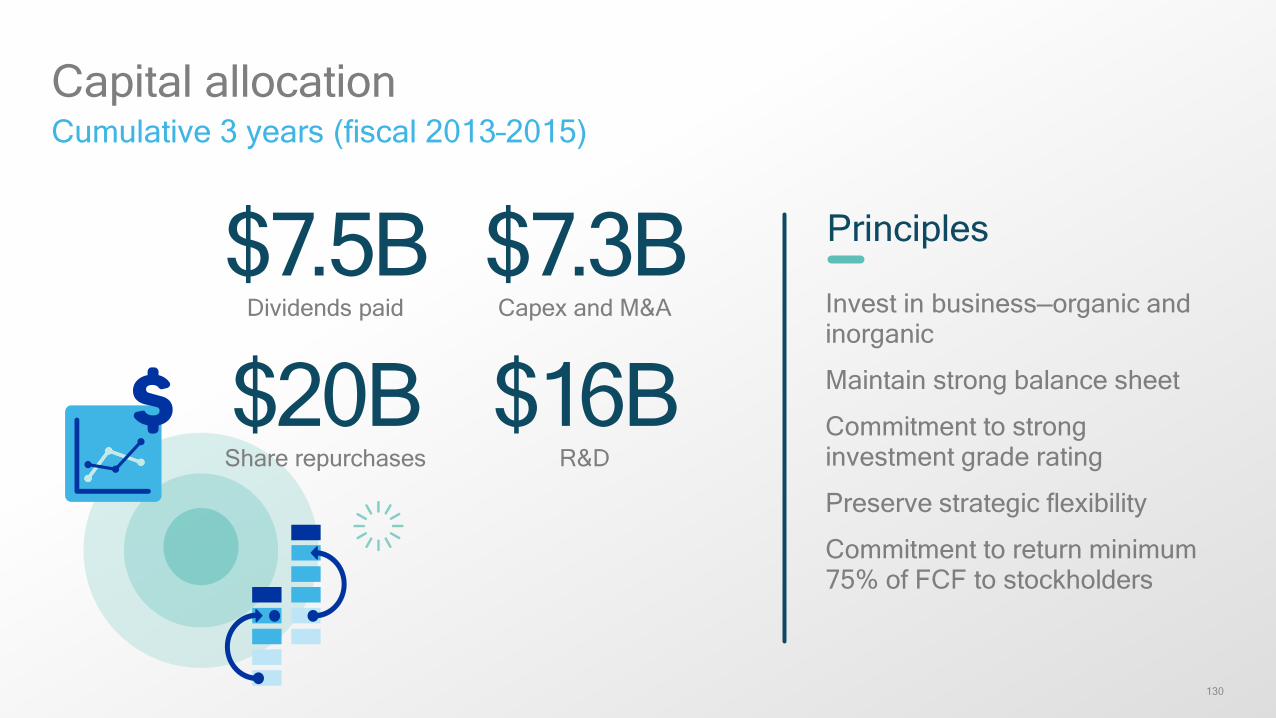
Capital allocationCumulative 3 years (fiscal 2013–2015)
Principles
Invest in business—organic and inorganic
Maintain strong balance sheet
Commitment to strong investment grade rating
Preserve strategic flexibility
Commitment to return minimum 75% of FCF to stockholders
$7.5BDividends paid
$7.3BCapex and M&A
$20BShare repurchases
$16BR&D
131
Focused executionKey takeaways—2016 analyst meeting
• Positioning the company for profitable growth
• Investing to expand our technology roadmap and lead in 5G
• Pursuing new opportunities in fast growing SAMs that build on our core technology
• M&A to accelerate and de-risk our growth agenda
• Adapting organization to improve agility and speed of decision-making
• Continuing our commitment to attractive capital returns and a strong balance sheet
Nothing in these materials is an offer to sell any of the components or devices referenced herein.
©2016 Qualcomm Incorporated and/or its subsidiaries. All Rights Reserved.
Qualcomm, Snapdragon, Adreno, Hexagon, and Qualcomm RF360 are trademarks of Qualcomm Incorporated, registered in the United States and other countries. Kryo, Qualcomm Spectra, Qualcomm Halo, Quick Charge and Snapdragon Flight are trademarks of Qualcomm Incorporated. Qualcomm VIVE is a product of Qualcomm Atheros, Inc. 2net is a product of Qualcomm Life, Inc. Other products and brand names may be trademarks or registered trademarks of their respective owners.
References in this presentation to “Qualcomm” may mean Qualcomm Incorporated, Qualcomm Technologies, Inc., and/or other subsidiaries or business units within the Qualcomm corporate structure, as applicable.
Qualcomm Incorporated includes Qualcomm’s licensing business, QTL, and the vast majority of its patent portfolio. Qualcomm Technologies, Inc., a wholly-owned subsidiary of Qualcomm Incorporated, operates, along with its subsidiaries, substantially all of Qualcomm’s engineering, research and development functions, and substantially all of its product and services businesses, including its semiconductor business, QCT.
Thank you
Follow us on:For more information, visit us at: www.qualcomm.com & www.qualcomm.com/blog

Appendix
134
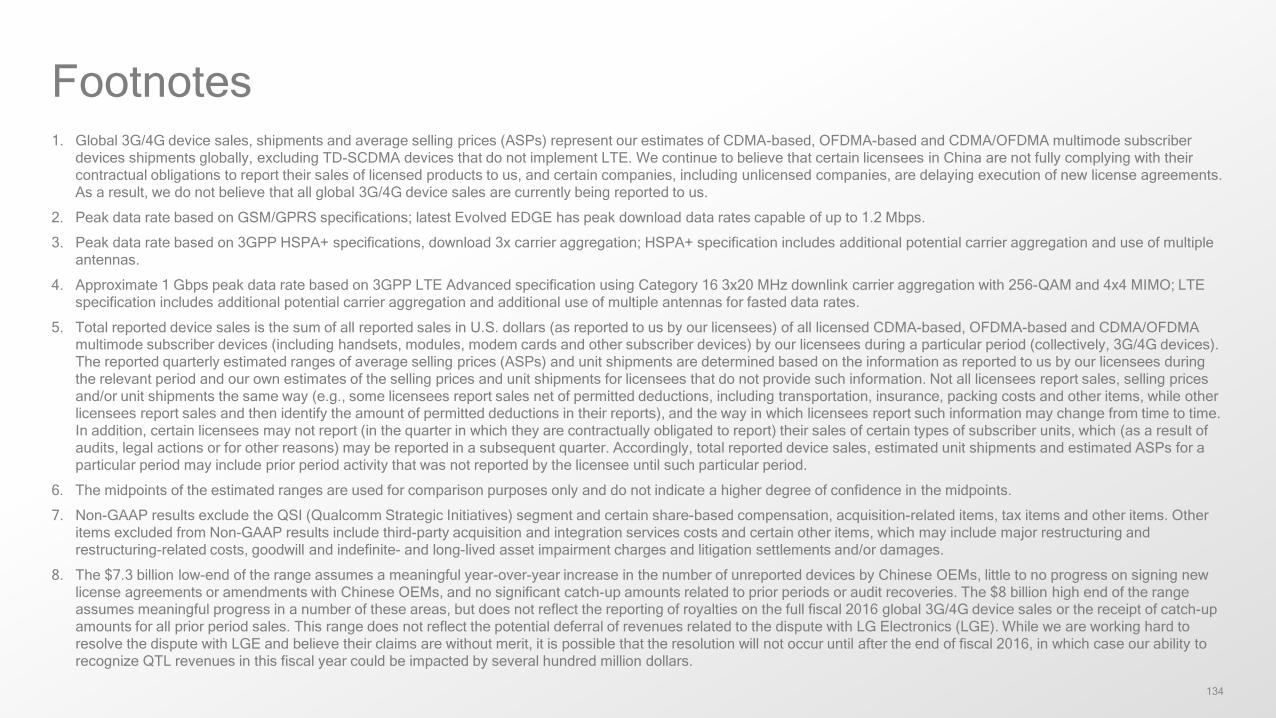
1. Global 3G/4G device sales, shipments and average selling prices (ASPs) represent our estimates of CDMA-based, OFDMA-based and CDMA/OFDMA multimode subscriber devices shipments globally, excluding TD-SCDMA devices that do not implement LTE. We continue to believe that certain licensees in China are not fully complying with their contractual obligations to report their sales of licensed products to us, and certain companies, including unlicensed companies, are delaying execution of new license agreements. As a result, we do not believe that all global 3G/4G device sales are currently being reported to us.
2. Peak data rate based on GSM/GPRS specifications; latest Evolved EDGE has peak download data rates capable of up to 1.2 Mbps.
3. Peak data rate based on 3GPP HSPA+ specifications, download 3x carrier aggregation; HSPA+ specification includes additional potential carrier aggregation and use of multiple antennas.
4. Approximate 1 Gbps peak data rate based on 3GPP LTE Advanced specification using Category 16 3x20 MHz downlink carrier aggregation with 256-QAM and 4x4 MIMO; LTE specification includes additional potential carrier aggregation and additional use of multiple antennas for fasted data rates.
5. Total reported device sales is the sum of all reported sales in U.S. dollars (as reported to us by our licensees) of all licensed CDMA-based, OFDMA-based and CDMA/OFDMA multimode subscriber devices (including handsets, modules, modem cards and other subscriber devices) by our licensees during a particular period (collectively, 3G/4G devices). The reported quarterly estimated ranges of average selling prices (ASPs) and unit shipments are determined based on the information as reported to us by our licensees during the relevant period and our own estimates of the selling prices and unit shipments for licensees that do not provide such information. Not all licensees report sales, selling prices and/or unit shipments the same way (e.g., some licensees report sales net of permitted deductions, including transportation, insurance, packing costs and other items, while other licensees report sales and then identify the amount of permitted deductions in their reports), and the way in which licensees report such information may change from time to time. In addition, certain licensees may not report (in the quarter in which they are contractually obligated to report) their sales of certain types of subscriber units, which (as a result of audits, legal actions or for other reasons) may be reported in a subsequent quarter. Accordingly, total reported device sales, estimated unit shipments and estimated ASPs for a particular period may include prior period activity that was not reported by the licensee until such particular period.
6. The midpoints of the estimated ranges are used for comparison purposes only and do not indicate a higher degree of confidence in the midpoints.
7. Non-GAAP results exclude the QSI (Qualcomm Strategic Initiatives) segment and certain share-based compensation, acquisition-related items, tax items and other items. Other items excluded from Non-GAAP results include third-party acquisition and integration services costs and certain other items, which may include major restructuring and restructuring-related costs, goodwill and indefinite- and long-lived asset impairment charges and litigation settlements and/or damages.
8. The $7.3 billion low-end of the range assumes a meaningful year-over-year increase in the number of unreported devices by Chinese OEMs, little to no progress on signing new license agreements or amendments with Chinese OEMs, and no significant catch-up amounts related to prior periods or audit recoveries. The $8 billion high end of the range assumes meaningful progress in a number of these areas, but does not reflect the reporting of royalties on the full fiscal 2016 global 3G/4G device sales or the receipt of catch-up amounts for all prior period sales. This range does not reflect the potential deferral of revenues related to the dispute with LG Electronics (LGE). While we are working hard to resolve the dispute with LGE and believe their claims are without merit, it is possible that the resolution will not occur until after the end of fiscal 2016, in which case our ability to recognize QTL revenues in this fiscal year could be impacted by several hundred million dollars.
Footnotes

Reconciliations
136
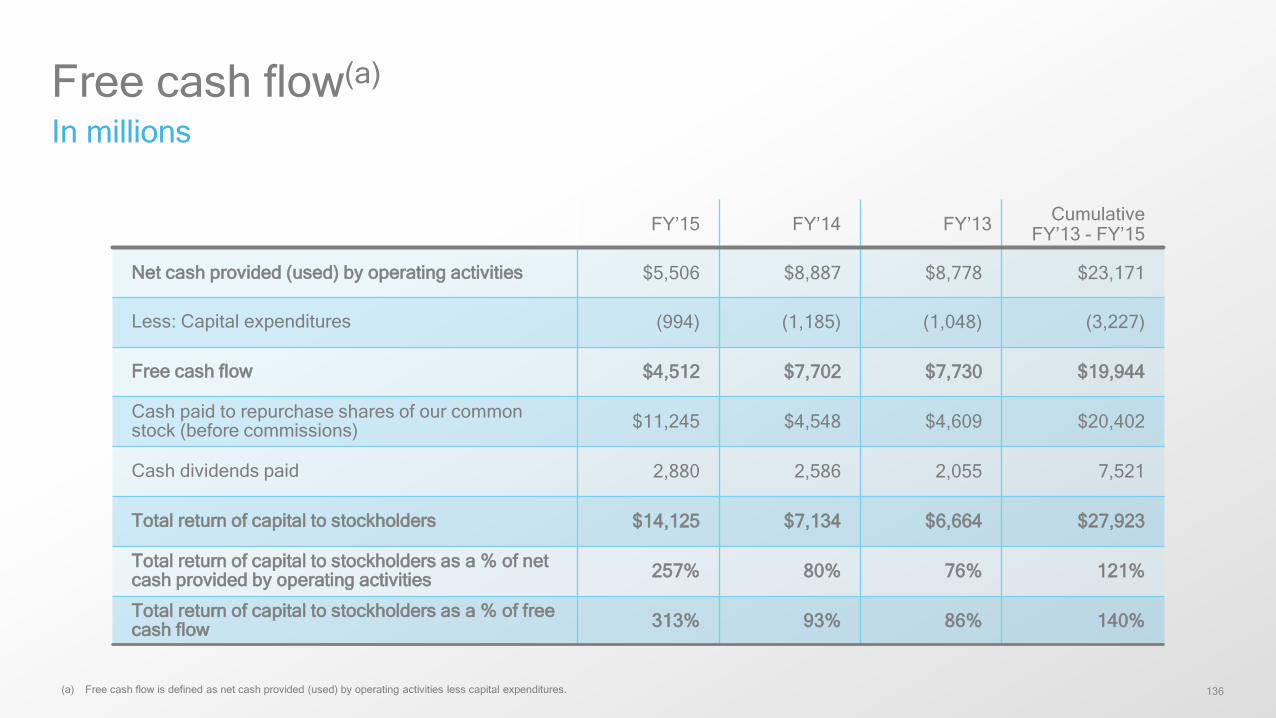
FY’15 FY’14 FY’13 Cumulative FY’13 - FY’15
Net cash provided (used) by operating activities $5,506 $8,887 $8,778 $23,171
Less: Capital expenditures (994) (1,185) (1,048) (3,227)
Free cash flow $4,512 $7,702 $7,730 $19,944
Cash paid to repurchase shares of our commonstock (before commissions) $11,245 $4,548 $4,609 $20,402
Cash dividends paid 2,880 2,586 2,055 7,521
Total return of capital to stockholders $14,125 $7,134 $6,664 $27,923
Total return of capital to stockholders as a % of net cash provided by operating activities 257% 80% 76% 121%
Total return of capital to stockholders as a % of free cash flow 313% 93% 86% 140%
Free cash flow(a)
In millions
(a) Free cash flow is defined as net cash provided (used) by operating activities less capital expenditures.
137
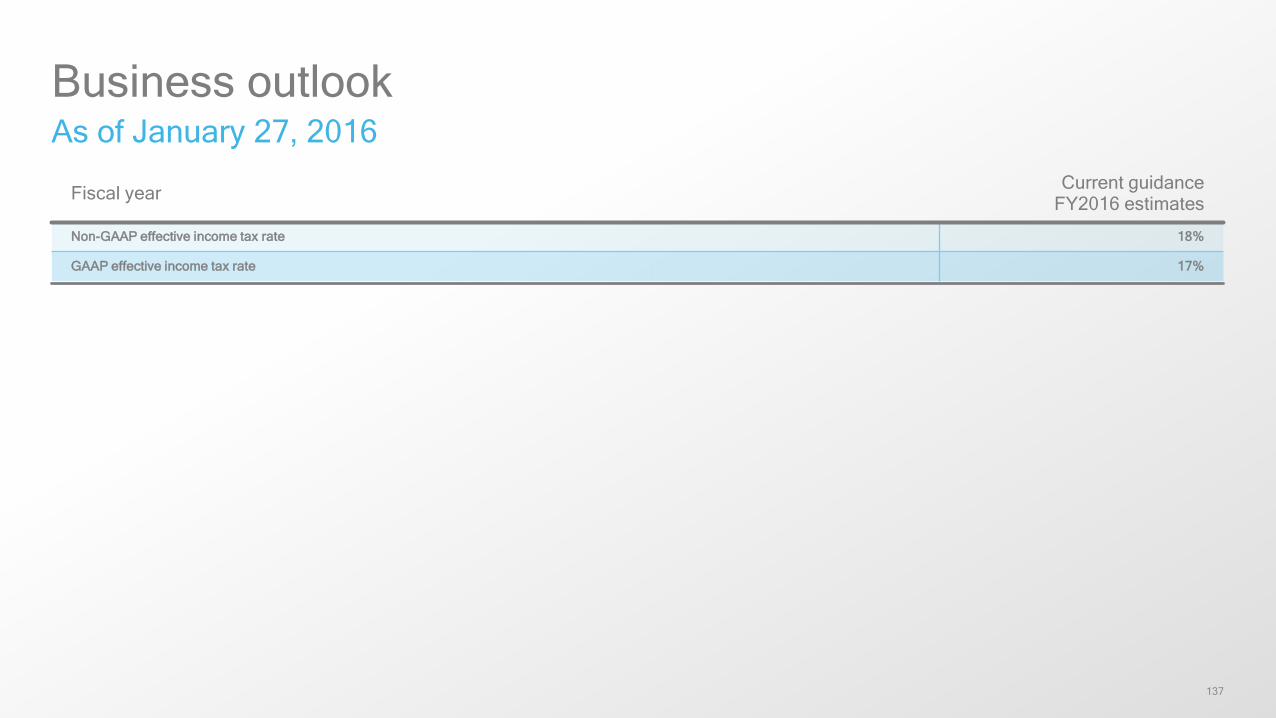
Business outlookAs of January 27, 2016
Fiscal year Current guidance FY2016 estimates
Non-GAAP effective income tax rate 18%
GAAP effective income tax rate 17%
138
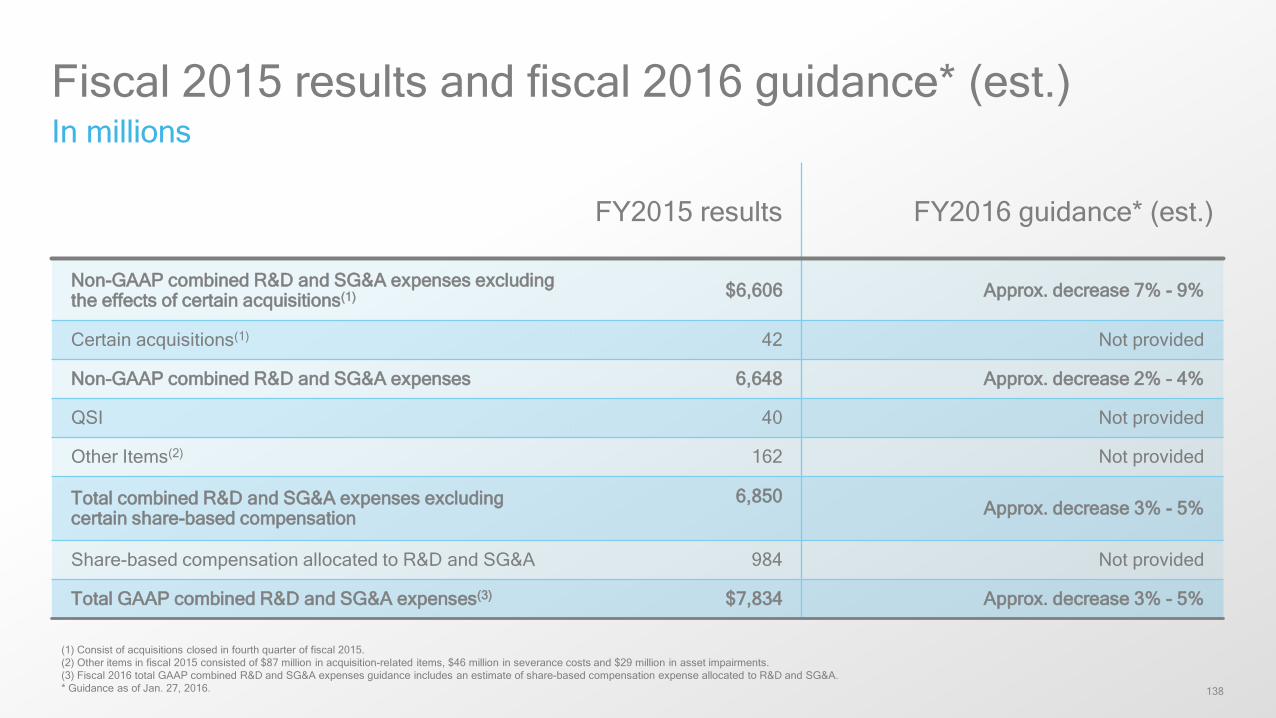
Fiscal 2015 results and fiscal 2016 guidance* (est.)In millions
(1) Consist of acquisitions closed in fourth quarter of fiscal 2015.(2) Other items in fiscal 2015 consisted of $87 million in acquisition-related items, $46 million in severance costs and $29 million in asset impairments.(3) Fiscal 2016 total GAAP combined R&D and SG&A expenses guidance includes an estimate of share-based compensation expense allocated to R&D and SG&A.* Guidance as of Jan. 27, 2016.
FY2015 results FY2016 guidance* (est.)
Non-GAAP combined R&D and SG&A expenses excluding the effects of certain acquisitions(1) $6,606 Approx. decrease 7% - 9%
Certain acquisitions(1) 42 Not provided
Non-GAAP combined R&D and SG&A expenses 6,648 Approx. decrease 2% - 4%
QSI 40 Not provided
Other Items(2) 162 Not provided
Total combined R&D and SG&A expenses excluding certain share-based compensation
6,850Approx. decrease 3% - 5%
Share-based compensation allocated to R&D and SG&A 984 Not provided
Total GAAP combined R&D and SG&A expenses(3) $7,834 Approx. decrease 3% - 5%