trimble navigation ltd /ca/ -...
TRANSCRIPT

TRIMBLE NAVIGATION LTD /CA/
FORM 10-Q(Quarterly Report)
Filed 05/02/13 for the Period Ending 03/29/13
Address 935 STEWART DRIVE
SUNNYVALE, CA 94085Telephone 4084818000
CIK 0000864749Symbol TRMB
SIC Code 3829 - Measuring and Controlling Devices, Not Elsewhere ClassifiedIndustry Communications Equipment
Sector TechnologyFiscal Year 12/27
http://www.edgar-online.com© Copyright 2013, EDGAR Online, Inc. All Rights Reserved.
Distribution and use of this document restricted under EDGAR Online, Inc. Terms of Use.

Table of Contents
UNITED STATES SECURITIES AND EXCHANGE COMMISSION
Washington, D.C. 20549 ___________________________________
FORM 10-Q ___________________________________
(Mark One)
OR
Commission file number: 001-14845
___________________________________
TRIMBLE NAVIGATION LIMITED (Exact name of registrant as specified in its charter)
___________________________________
935 Stewart Drive, Sunnyvale, CA 94085 (Address of principal executive offices) (Zip Code)
Telephone Number (408) 481-8000 (Registrant’s telephone number, including area code)
___________________________________
Indicate by check mark whether the registrant (1) has filed all reports required to be filed by Section 13 or 15(d) of the Securities Exchange Act of 1934 during the preceding 12 months (or for such shorter period that the registrant was required to file such reports), and (2) has been subject to such filing requirements for the past 90 days. Yes � No �
Indicate by check mark whether the registrant has submitted electronically and posted on its corporate Web site, if any, every Interactive Data File required to be submitted and posted pursuant to Rule 405 of Regulation S-T (§232.405 of this chapter) during the preceding 12 months (or for such shorter period that the registrant was required to submit and post such files). Yes � No �
Indicate by check mark whether the registrant is a large accelerated filer, an accelerated filer, a non-accelerated filer, or a smaller reporting company. See definition of “large accelerated filer”, “accelerated filer” and “smaller reporting company” in Rule 12b-2 of the Exchange Act. (Check one):
Indicate by check mark whether the registrant is a shell company (as defined in Rule 12b-2 of the Exchange Act). Yes � No �
As of April 29, 2013, there were 255,797,838 shares of Common Stock (no par value) outstanding.
� QUARTERLY REPORT PURSUANT TO SECTION 13 OR 15(D) OF THE SECURITIES EXCHANGE ACT OF 1934 FOR THE QUARTERLY PERIOD ENDED March 29, 2013
� TRANSITION REPORT PURSUANT TO SECTION 13 OR 15(D) OF THE SECURITIES EXCHANGE ACT OF 1934 FOR THE TRANSITION PERIOD FROM TO
California 94-2802192 (State or other jurisdiction of (I.R.S. Employer Identification Number)
incorporation or organization)
Large Accelerated Filer � Accelerated Filer �
Non-accelerated Filer � (Do not check if a smaller reporting company) Smaller Reporting Company �

Table of Contents
TRIMBLE NAVIGATION LIMITED FORM 10-Q for the Quarter Ended March 29, 2013
TABLE OF CONTENTS
2
PART I. Financial Information Page
ITEM 1. Financial Statements (Unaudited):
Condensed Consolidated Balance Sheets 3
Condensed Consolidated Statements of Income 4
Condensed Consolidated Statements of Comprehensive Income 5
Condensed Consolidated Statements of Cash Flows 6
Notes to Condensed Consolidated Financial Statements 7
ITEM 2. Management’s Discussion and Analysis of Financial Condition and Results of Operations 17
ITEM 3. Quantitative and Qualitative Disclosures about Market Risk 33
ITEM 4. Controls and Procedures 34
PART II. Other Information
ITEM 1. Legal Proceedings 34
ITEM 1A. Risk Factors 34
ITEM 6. Exhibits 34
SIGNATURES 35

Table of Contents PART I – FINANCIAL INFORMATION ITEM 1. CONDENSED CONSOLIDATED FINANCIAL STATEMENTS
TRIMBLE NAVIGATION LIMITED CONDENSED CONSOLIDATED BALANCE SHEETS
(UNAUDITED)
See accompanying Notes to the Condensed Consolidated Financial Statements.
First Quarter of Fiscal Year End
As of 2013 2012
(In thousands) ASSETS
Current assets :
Cash and cash equivalents $ 143,552 $ 157,771 Accounts receivable, net 388,850 323,477 Other receivables 14,168 17,327 Inventories, net 260,596 240,529 Deferred income taxes 43,198 43,473 Other current assets 39,586 33,396
Total current assets 889,950 815,973 Property and equipment, net 105,603 96,890 Goodwill 1,837,937 1,815,699 Other purchased intangible assets, net 636,696 644,419 Other non-current assets 95,535 96,123
Total assets $ 3,565,721 $ 3,469,104 LIABILITIES
Current liabilities:
Current portion of long-term debt $ 91,117 $ 38,092 Accounts payable 120,838 124,532 Accrued compensation and benefits 75,621 86,064 Deferred revenue 187,551 138,920 Accrued warranty expense 17,476 17,066 Other current liabilities 63,851 63,996
Total current liabilities 556,454 468,670 Non-current portion of long-term debt 829,322 873,066 Non-current deferred revenue 10,927 7,262 Deferred income taxes 136,308 148,260 Other non-current liabilities 66,842 58,322
Total liabilities 1,599,853 1,555,580 Commitments and contingencies
EQUITY
Shareholders’ equity:
Preferred stock, no par value; 3,000 shares authorized; none outstanding — — Common stock, no par value; 360,000 shares authorized; 255,758 and 254,486 shares issued and outstanding as of the first quarter of fiscal 2013 and fiscal year end 2012, respectively 1,036,779 1,006,818 Retained earnings 916,158 868,026 Accumulated other comprehensive income (loss) (3,144 ) 22,611
Total Trimble Navigation Ltd. shareholders’ equity 1,949,793 1,897,455 Noncontrolling interests 16,075 16,069
Total equity 1,965,868 1,913,524 Total liabilities and equity $ 3,565,721 $ 3,469,104

3

Table of Contents
TRIMBLE NAVIGATION LIMITED CONDENSED CONSOLIDATED STATEMENTS OF INCOME
(UNAUDITED)
See accompanying Notes to the Condensed Consolidated Financial Statements.
4
First Quarter of
(In thousands, except per share data) 2013 2012
Revenue:
Product $ 412,787 $ 398,538 Service 81,596 57,430 Subscription 61,728 46,299
Total revenue 556,111 502,267 Cost of sales:
Product 198,701 193,044 Service 30,843 22,521 Subscription 19,972 14,431 Amortization of purchased intangible assets 19,681 13,121
Total cost of sales 269,197 243,117 Gross margin 286,914 259,150 Operating expense
Research and development 73,608 60,235 Sales and marketing 83,623 76,024 General and administrative 51,970 46,886 Restructuring charges 1,605 481 Amortization of purchased intangible assets 19,651 15,676
Total operating expense 230,457 199,302 Operating income 56,457 59,848 Non-operating income (expense), net
Interest expense, net (5,071 ) (3,863 )
Foreign currency transaction loss (1,569 ) (2,213 )
Income from equity method investments, net 4,257 6,192 Other income, net 295 363
Total non-operating income (expense), net (2,088 ) 479 Income before taxes 54,369 60,327 Income tax provision 5,437 10,255 Net income 48,932 50,072
Less: Net loss attributable to noncontrolling interests (876 ) (746 )
Net income attributable to Trimble Navigation Ltd. $ 49,808 $ 50,818 Basic earnings per share $ 0.20 $ 0.20 Shares used in calculating basic earnings per share 255,181 248,740 Diluted earnings per share $ 0.19 $ 0.20 Shares used in calculating diluted earnings per share 260,299 255,520

Table of Contents
TRIMBLE NAVIGATION LIMITED CONDENSED CONSOLIDATED STATEMENTS OF COMPREHENSIVE INCOME
(UNAUDITED)
See accompanying Notes to the Condensed Consolidated Financial Statements.
5
First Quarter of
2013 2012
(Dollars in thousands) Net income $ 48,932 $ 50,072
Foreign currency translation adjustments (25,683 ) 23,720 Net unrealized actuarial loss (71 ) (38 )
Comprehensive income 23,178 73,754 Less: Comprehensive loss attributable to the noncontrolling interests (876 ) (746 )
Comprehensive income attributable to Trimble Navigation Ltd. $ 24,054 $ 74,500

Table of Contents
TRIMBLE NAVIGATION LIMITED CONDENSED CONSOLIDATED STATEMENTS OF CASH FLOWS
(UNAUDITED)
See accompanying Notes to the Condensed Consolidated Financial Statements.
6
First Quarter of
(Dollars in thousands) 2013 2012
Cash flow from operating activities:
Net income $ 48,932 $ 50,072 Adjustments to reconcile net income to net cash provided by operating activities:
Depreciation expense 6,193 5,562 Amortization expense 39,332 28,797 Provision for doubtful accounts 65 587 Deferred income taxes (11,809 ) 146 Stock-based compensation 8,818 7,789 Income from equity method investments, net (4,257 ) (6,192 )
Excess tax benefit for stock-based compensation (4,784 ) (7,580 )
Provision for excess and obsolete inventories 584 3,111 Other non-cash items 104 (977 )
Add decrease (increase) in assets:
Accounts receivable (61,956 ) (46,425 )
Other receivables 5,027 2,211 Inventories (20,218 ) 5,928 Other current and non-current assets (10,867 ) (7,972 )
Add increase (decrease) in liabilities:
Accounts payable (6,081 ) 4,205 Accrued compensation and benefits (12,037 ) (1,895 )
Deferred revenue 51,964 29,569 Accrued warranty expense 439 (728 )
Other current and non-current liabilities 7,939 1,450 Net cash provided by operating activities 37,388 67,658 Cash flow from investing activities:
Acquisitions of businesses, net of cash acquired (65,192 ) (101,392 )
Acquisitions of property and equipment (14,927 ) (7,644 )
Acquisitions of intangible assets — (755 )
Sale of equity method investments 2,430 — Dividends received 1,284 181 Other — 70
Net cash used in investing activities (76,405 ) (109,540 )
Cash flow from financing activities:
Issuances of common stock, net 14,437 26,682 Excess tax benefit for stock-based compensation 4,784 7,580 Proceeds from long-term debt and revolving credit lines 113,000 181,500 Payments on short-term and long-term debt (103,981 ) (122,850 )
Net cash provided by financing activities 28,240 92,912 Effect of exchange rate changes on cash and cash equivalents (3,442 ) 3,495 Net increase (decrease) in cash and cash equivalents (14,219 ) 54,525 Cash and cash equivalents, beginning of period 157,771 154,621 Cash and cash equivalents, end of period $ 143,552 $ 209,146

Table of Contents NOTES TO CONDENSED CONSOLIDATED FINANCIAL STATEMENTS – UNAUDITED
NOTE 1. OVERVIEW AND BASIS OF PRESENTATION
Trimble Navigation Limited (the "Company"), incorporated in California in 1981, provides positioning solutions to commercial and government users in a large number of markets. These markets include surveying, agriculture, construction, asset management, mapping and mobile resource management.
The Company has a 52-53 week fiscal year, ending on the Friday nearest to December 31, which for fiscal 2012 was December 28, 2012 . The first quarter of fiscal 2013 and 2012 ended on March 29, 2013 and March 30, 2012 , respectively. Fiscal 2013 is a 53-week year and 2012 is a 52-week year. Unless otherwise stated, all dates refer to the Company’s fiscal year and fiscal periods.
The Condensed Consolidated Financial Statements include the results of the Company and its consolidated subsidiaries. Inter-company accounts and transactions have been eliminated. Noncontrolling interests represent the noncontrolling shareholders’ proportionate share of the net assets and results of operations of the Company’s consolidated subsidiaries.
The accompanying financial data as of the first quarter of fiscal 2013 and for the first quarter of fiscal 2013 and 2012 has been prepared by the Company, without audit, pursuant to the rules and regulations of the Securities and Exchange Commission (“SEC”). Certain information and footnote disclosures normally included in financial statements, prepared in accordance with U.S. generally accepted accounting principles, have been condensed or omitted pursuant to such rules and regulations. The Condensed Consolidated Balance Sheet as of fiscal year end 2012 is derived from the audited Consolidated Financial Statements included in the Annual Report on Form 10-K of Trimble Navigation Limited for fiscal year 2012 . The following discussion should be read in conjunction with the Company’s 2012 Annual Report on Form 10-K.
The preparation of financial statements in accordance with U.S. generally accepted accounting principles requires management to make estimates and assumptions that affect the amounts reported in its Condensed Consolidated Financial Statements and accompanying notes. Management bases its estimates on historical experience and various other assumptions believed to be reasonable. Although these estimates are based on management’s best knowledge of current events and actions that may impact the company in the future, actual results may be different from the estimates.
In the opinion of management, all adjustments necessary have been made to present a fair statement of results for the interim periods presented. The results of operations for the first quarter of fiscal 2013 are not necessarily indicative of the operating results for the full fiscal year or any future periods. Individual segment revenue may be affected by seasonal buying patterns and general economic conditions.
The Company has evaluated all subsequent events through the date that these financial statements have been filed with the Securities and Exchange Commission.
The Company has presented revenue and cost of sales separately for products, service and subscriptions. Product revenue includes primarily hardware, software licenses, parts and accessories; service revenue includes primarily hardware and software maintenance and support, training and professional services; subscription revenue includes software as a service (SaaS).
On February 11, 2013, Trimble's Board of Directors approved a 2 -for-1 split of all outstanding shares of the Company's Common Stock, payable March 20, 2013 to shareholders of record on March 6, 2013. All shares and per share information presented has been adjusted to reflect the stock split on a retroactive basis for all periods presented.
NOTE 2. UPDATES TO SIGNIFICANT ACCOUNTING POLICIES
There have been no material changes to the Company’s significant accounting polices during the first quarter of fiscal 2013 from those disclosed in the Company’s 2012 Form 10-K.
NOTE 3. SHAREHOLDERS’ EQUITY
Stock Repurchase Activities
In October 2011, the Company’s Board of Directors approved a stock repurchase program (“2011 Stock Repurchase Program”), authorizing the Company to repurchase up to $100.0 million of Trimble’s common stock. No shares of common stock were repurchased during the first quarter of fiscal 2013 or 2012 . The timing and actual number of future shares repurchased will depend on a variety of factors including price, regulatory requirements, capital availability and other market conditions. The program does not require the purchase of any minimum number of shares and may be suspended or discontinued at any time without public notice .
Stock-Based Compensation Expense
7
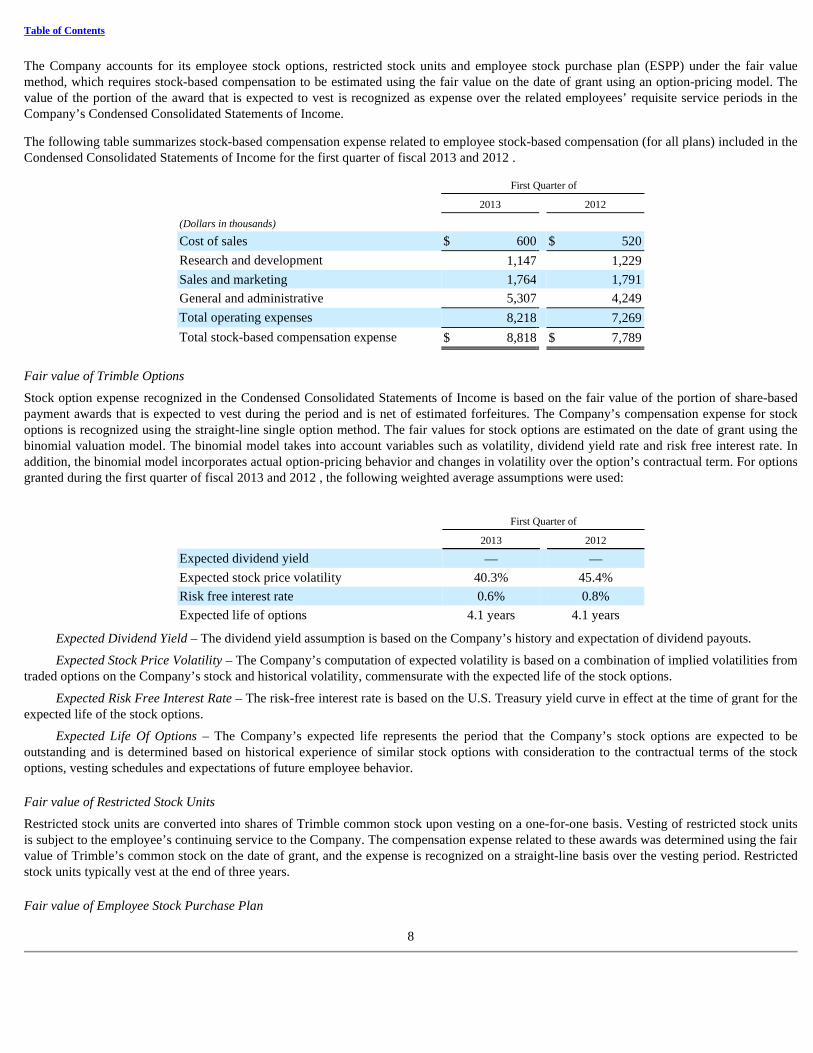
Table of Contents
The Company accounts for its employee stock options, restricted stock units and employee stock purchase plan (ESPP) under the fair value method, which requires stock-based compensation to be estimated using the fair value on the date of grant using an option-pricing model. The value of the portion of the award that is expected to vest is recognized as expense over the related employees’ requisite service periods in the Company’s Condensed Consolidated Statements of Income.
The following table summarizes stock-based compensation expense related to employee stock-based compensation (for all plans) included in the Condensed Consolidated Statements of Income for the first quarter of fiscal 2013 and 2012 .
Fair value of Trimble Options
Stock option expense recognized in the Condensed Consolidated Statements of Income is based on the fair value of the portion of share-based payment awards that is expected to vest during the period and is net of estimated forfeitures. The Company’s compensation expense for stock options is recognized using the straight-line single option method. The fair values for stock options are estimated on the date of grant using the binomial valuation model. The binomial model takes into account variables such as volatility, dividend yield rate and risk free interest rate. In addition, the binomial model incorporates actual option-pricing behavior and changes in volatility over the option’s contractual term. For options granted during the first quarter of fiscal 2013 and 2012 , the following weighted average assumptions were used:
Expected Dividend Yield – The dividend yield assumption is based on the Company’s history and expectation of dividend payouts.
Expected Stock Price Volatility – The Company’s computation of expected volatility is based on a combination of implied volatilities from traded options on the Company’s stock and historical volatility, commensurate with the expected life of the stock options.
Expected Risk Free Interest Rate – The risk-free interest rate is based on the U.S. Treasury yield curve in effect at the time of grant for the expected life of the stock options.
Expected Life Of Options – The Company’s expected life represents the period that the Company’s stock options are expected to be outstanding and is determined based on historical experience of similar stock options with consideration to the contractual terms of the stock options, vesting schedules and expectations of future employee behavior.
Fair value of Restricted Stock Units
Restricted stock units are converted into shares of Trimble common stock upon vesting on a one-for-one basis. Vesting of restricted stock units is subject to the employee’s continuing service to the Company. The compensation expense related to these awards was determined using the fair value of Trimble’s common stock on the date of grant, and the expense is recognized on a straight-line basis over the vesting period. Restricted stock units typically vest at the end of three years.
Fair value of Employee Stock Purchase Plan
8
First Quarter of
2013 2012
(Dollars in thousands) Cost of sales $ 600 $ 520 Research and development 1,147 1,229 Sales and marketing 1,764 1,791 General and administrative 5,307 4,249 Total operating expenses 8,218 7,269 Total stock-based compensation expense $ 8,818 $ 7,789
First Quarter of
2013 2012
Expected dividend yield — —
Expected stock price volatility 40.3% 45.4%
Risk free interest rate 0.6% 0.8%
Expected life of options 4.1 years 4.1 years

Table of Contents
Under the Employee Stock Purchase Plan, rights to purchase shares are generally granted during the second and fourth quarter of each year. The fair value of rights granted under the Employee Stock Purchase Plan was estimated at the date of grant using the Black-Scholes option-pricing model.
NOTE 4. GOODWILL AND INTANGIBLE ASSETS
Intangible Assets
Intangible Assets consisted of the following:
The estimated future amortization expense of purchased intangible assets as of the first quarter of fiscal 2013 was as follows:
Goodwill
The changes in the carrying amount of goodwill by operating segment for the first quarter of fiscal 2013 were as follows:
The Company determined the total consideration paid for each of its acquisitions as well as the fair value of the assets acquired and liabilities assumed as of the date of acquisition. For certain acquisitions completed in fiscal 2012 and the first quarter of fiscal 2013 , the fair value of the assets acquired and liabilities assumed are preliminary and may be adjusted as the Company obtains additional information, primarily related to adjustments for the true up of acquired net working capital in accordance with certain purchase agreements, and estimated values of certain net tangible assets and liabilities including tax balances, pending the completion of final studies and analyses. If there are adjustments made for these items, the fair value of intangible asset and goodwill could be impacted. Thus the provisional measurements of fair value are subject to change. Such changes could be significant. The Company expects to finalize the valuation of the net tangible and intangible assets as soon as practicable, but not later than one-year from the acquisition date.
9
First Quarter of 2013 Fiscal Year End 2012
Gross Gross
As of Carrying Accumulated Net Carrying Carrying Accumulated Net Carrying
(Dollars in thousands) Amount Amortization Amount Amount Amortization Amount
Developed product technology $ 631,917 $ (289,608 ) $ 342,309 $ 610,643 $ (267,952 ) $ 342,691 Trade names and trademarks 43,428 (24,459 ) 18,969 42,512 (23,241 ) 19,271 Customer relationships 389,862 (147,171 ) 242,691 385,269 (135,571 ) 249,698 Distribution rights and other intellectual properties 74,691 (41,964 ) 32,727 72,510 (39,751 ) 32,759
$ 1,139,898 $ (503,202 ) $ 636,696 $ 1,110,934 $ (466,515 ) $ 644,419
(Dollars in thousands)
2013 (Remaining) $ 115,939 2014 130,962 2015 118,851 2016 101,305 2017 82,283 Thereafter 87,356 Total $ 636,696
Engineering and
Construction Field
Solutions Mobile
Solutions Advanced Devices Total
(Dollars in thousands) Balance as of fiscal year end 2012 $ 958,103 $ 68,684 $ 763,386 $ 25,526 $ 1,815,699 Additions due to acquisitions 1,790 — 32,770 — 34,560 Purchase price adjustments 79 — 329 35 443 Foreign currency translation adjustments (10,085 ) (915 ) (1,380 ) (385 ) (12,765 )
Balance as of the first quarter of 2013 $ 949,887 $ 67,769 $ 795,105 $ 25,176 $ 1,837,937

Table of Contents
NOTE 5. INVENTORIES
Inventories, net, consisted of the following:
Deferred costs of sales for the short-term deferral of hardware and related products are included within finished goods and were $16.4 million as of the first quarter of fiscal 2013 and $16.2 million as of fiscal year end 2012 .
NOTE 6 . SEGMENT INFORMATION
The Company is a designer and distributor of positioning solutions enabled by GPS, optical, laser and wireless communications technology. The Company provides products for diverse applications in its targeted markets.
To achieve distribution, marketing, production and technology advantages, the Company manages its operations in the following four segments:
The Company evaluates each of its segment’s performance and allocates resources based on segment operating income before income taxes and some corporate allocations. The Company and each of its segments employ consistent accounting policies.
The following table presents revenue, operating income and identifiable assets for the four segments. Operating income is revenue less cost of sales and operating expense, excluding general corporate expense, amortization of purchased intangible assets, amortization of acquisition-related inventory step-up, acquisition costs and restructuring costs. The identifiable assets that the Company’s Chief Operating Decision Maker, its Chief Executive Officer, views by segment are accounts receivable, inventories and goodwill.
10
First Quarter of Fiscal Year End
As of 2013 2012
(Dollars in thousands) Raw materials $ 98,001 $ 89,016 Work-in-process 6,117 6,658 Finished goods 156,478 144,855 Total inventories, net $ 260,596 $ 240,529
• Engineering and Construction — Consists of hardware and software solutions for a variety of applications including: survey; heavy civil and building construction; infrastructure; geospatial; railway; mining and utilities.
• Field Solutions — Consists of hardware and software solutions for applications including agriculture, mapping and geographic information systems (GIS), utilities, and energy distribution.
• Mobile Solutions — Consists of hardware and software solutions that enable end-users to monitor and manage their mobile work, mobile workers and mobile assets.
• Advanced Devices — The various operations that comprise this segment are aggregated on the basis that no single operation accounts for more than 10% of the Company’s total revenue, operating income and assets. This segment is comprised of the Component Technologies, Military and Advanced Systems, Applanix, Trimble Outdoors, and ThingMagic businesses.

Table of Contents
A reconciliation of the Company’s consolidated segment operating income to consolidated income before income taxes is as follows:
Unallocated corporate expense includes general corporate expense, amortization of acquisition-related inventory step-up and restructuring costs.
NOTE 7. DEBT, COMMITMENTS AND CONTINGENCIES
Debt consisted of the following:
11
Reporting Segments
Engineering and
Construction Field
Solutions Mobile
Solutions Advanced Devices Total
(Dollars in thousands) First Quarter of Fiscal 2013
Segment revenue $ 266,871 $ 147,481 $ 110,164 $ 31,595 $ 556,111 Operating income 42,973 59,526 11,573 6,485 120,557
First Quarter of Fiscal 2012
Segment revenue $ 248,885 $ 147,499 $ 78,383 $ 27,500 $ 502,267 Operating income 40,077 62,361 7,358 3,339 113,135
As of the First Quarter of Fiscal 2013
Accounts receivable $ 186,909 $ 112,239 $ 67,224 $ 22,478 $ 388,850 Inventories 167,070 45,458 30,328 17,740 260,596 Goodwill 949,887 67,769 795,105 25,176 1,837,937
As of Fiscal Year End 2012
Accounts receivable $ 171,580 $ 71,465 $ 59,720 $ 20,712 $ 323,477 Inventories 148,241 44,738 30,598 16,952 240,529 Goodwill 958,103 68,684 763,386 25,526 1,815,699
First Quarter of
2013 2012
(Dollars in thousands) Consolidated segment operating income $ 120,557 $ 113,135 Unallocated corporate expense (21,350 ) (19,724 )
Amortization of purchased intangible assets (39,332 ) (28,797 )
Acquisition costs (3,418 ) (4,766 )
Consolidated operating income 56,457 59,848 Non-operating income (expense), net (2,088 ) 479 Consolidated income before taxes $ 54,369 $ 60,327
First Quarter of Fiscal Year End
As of 2013 2012
(Dollars in thousands) Credit Facilities:
Term loan $ 691,250 $ 700,000 Revolving credit facility 226,000 208,000
Promissory notes and other debt 3,189 3,158 Total debt 920,439 911,158
Less current portion of long-term debt 91,117 38,092 Non-current portion $ 829,322 $ 873,066

Table of Contents
Credit Facilities
On November 21, 2012 , the Company entered into an amended and restated credit agreement with a group of lenders (the “2012 Credit Facility”). This credit facility provides for unsecured credit facilities in the aggregate principal amount of $1.4 billion , comprised of a five -year revolving loan facility of $700.0 million and a five -year $700.0 million term loan facility. Subject to the terms of the 2012 Credit Facility, the revolving loan facility and the term loan facility may be increased by $300.0 million in the aggregate. Additionally, we have a $75 million uncommitted revolving loan facility (the “2011 Uncommitted Facility”), which is callable by the bank at any time and has no covenants. The interest rate on the 2011 Uncommitted Facility is 1.00% plus either LIBOR or the bank’s cost of funds or as otherwise agreed upon by the bank and the Company.
As of the first quarter of fiscal 2013 , total debt was comprised primarily of a term loan of $691.3 million and a revolving credit line of $173.0 million under the 2012 Credit Facility and a revolving credit line of $53.0 million under the 2011 Uncommitted Facility. Of the total outstanding balance, $656.0 million of the term loan and the $173.0 million revolving credit line are classified as long-term in the Condensed Consolidated Balance Sheet.
The funds available under the 2012 Credit Facility may be used for general corporate purposes, the financing of certain acquisitions and the payment of transaction fees and expenses related to such acquisitions. Under the 2012 Credit Facility, the Company may borrow, repay and reborrow funds under the revolving loan facility until its maturity on November 21, 2017 , at which time the revolving facility will terminate, and all outstanding loans, together with all accrued and unpaid interest, must be repaid. Amounts not borrowed under the revolving facility will be subject to a commitment fee, to be paid in arrears on the last day of each fiscal quarter, ranging from 0.15% to 0.35% per annum depending on the Company's leverage ratio as of the most recently ended fiscal quarter. The term loan will be repaid in quarterly installments, with the last quarterly payment to be made at September 29, 2017, with the remaining outstanding balance being due and payable on November 21, 2017. On an annualized basis, the amortization of the term loan is as follows: 5% , 5% , 10% , 10% and 70% for years one through five respectively. The term loan may be prepaid in whole or in part, subject to certain minimum thresholds, without penalty or premium. Amounts repaid or prepaid with respect to the term loan facility may not be reborrowed.
The Company may borrow funds under the 2012 Credit Facility in U.S. Dollars, Euros or in certain other agreed currencies, and borrowings will bear interest, at the Company’s option, at either: (i) a floating per annum base rate based on the administrative agent’s prime rate or other agreed-upon rate, depending on the currency borrowed, plus a margin of between 0.00% and 1.00% , depending on the Company's leverage ratio as of the most recently ended fiscal quarter, or (ii) a reserve-adjusted fixed per annum rate based on LIBOR, EURIBOR, or other agreed-upon rate, depending on the currency borrowed, plus a margin of between 1.00% and 2.00% , depending on the Company's leverage ratio as of the most recently ended fiscal quarter. Interest will be paid on the last day of each fiscal quarter with respect to borrowings bearing interest based on a floating rate, or on the last day of an interest period, but at least every three months, with respect to borrowings bearing interest at a fixed rate. The Company's obligations under the 2012 Credit Facility are guaranteed by several of the Company's domestic subsidiaries.
The 2012 Credit Facility contains various customary representations and warranties by the Company, which include customary use of materiality, material adverse effect and knowledge qualifiers. The 2012 Credit Facility also contains customary affirmative and negative covenants including, among other requirements, negative covenants that restrict the Company's ability to dispose of assets, create liens, incur indebtedness, repurchase stock, pay dividends, make acquisitions and make investments. Further, the 2012 Credit Facility contains financial covenants that require the maintenance of minimum interest coverage and maximum leverage ratios. Specifically, the Company must maintain as of the end of each fiscal quarter a ratio of (a) EBITDA (as defined in the 2012 Credit Facility) to (b) interest expenses for the most recently ended period of four fiscal quarters of not less than 3.5 to 1. The Company must also maintain, at the end of each fiscal quarter, a ratio of (x) total indebtedness to (y) EBITDA (as defined in the 2012 Credit Facility) for the most recently ended period of four fiscal quarters of not greater than the applicable ratio set forth in the table below; provided, that on the completion of a material acquisition, the Company may increase the applicable ratio in the table below by 0.25 for the fiscal quarter during which such acquisition occurred and each of the three subsequent fiscal quarters.
The Company was in compliance with these restrictive covenants as of the first quarter of fiscal 2013 .
The 2012 Credit Facility contains events of default that include, among others, non-payment of principal, interest or fees, breach of covenants, inaccuracy of representations and warranties, cross defaults to certain other indebtedness, bankruptcy and insolvency events, material judgments and events constituting a change of control. Upon the occurrence and during the continuance of an
12
Fiscal Quarter Ending Maximum Leverage Ratio
Prior to June 28, 2013 3.50 to 1
On and after June 28, 2013 and prior to September 27, 2013 3.25 to 1
On and after September 27, 2013 3 to 1

Table of Contents
event of default, interest on the obligations will accrue at an increased rate and the lenders may accelerate the Company's obligations under the 2012 Credit Facility, however that acceleration will be automatic in the case of bankruptcy and insolvency events of default.
The weighted average interest rate on the current portion of the long-term debt outstanding under the 2012 Credit Facility and 2011 Uncommitted Facility was 1.66% and 1.96% at the end of the first quarter of fiscal 2013 and fiscal year end 2012 , respectively. The interest rate on the non-current debt outstanding under the 2012 Credit Facility was 1.89% and 1.96% at the end of the first quarter of fiscal 2013 and fiscal year end 2012 , respectively.
Promissory Notes and Other Debt
As of the first quarter of fiscal 2013 and fiscal year end 2012 , the Company had promissory notes and other debt totaling approximately $3.2 million for both periods, of which $0.1 million for both periods was classified as long-term in the Condensed Consolidated Balance Sheet.
Leases and Other Commitments
The estimated future minimum operating lease commitments as of the first quarter of fiscal 2013 are as follows (dollars in thousands):
As of the first quarter of fiscal 2013 , the Company had unconditional purchase obligations of approximately $103.8 million . These unconditional purchase obligations primarily represent open non-cancelable purchase orders for material purchases with the Company’s vendors. Purchase obligations exclude agreements that are cancelable without penalty.
NOTE 8. FAIR VALUE MEASUREMENTS
The Company determines fair value based on the exchange price that would be received for an asset or paid to transfer a liability (an exit price) in the principal or most advantageous market for the asset or liability in an orderly transaction between market participants. Where available, fair value is based on observable market prices or parameters . Where observable prices or inputs are not available, valuation models are applied. Hierarchical levels, defined by the guidance on fair value measurements are directly related to the amount of subjectivity associated with the inputs to fair valuation of these assets and liabilities, and are as follows:
Level I – Observable inputs such as unadjusted, quoted prices in active markets for identical assets or liabilities.
Level II – Inputs (other than quoted prices included in Level I) are either directly or indirectly observable for the asset or liability. These include quoted prices for similar assets or liabilities in active markets and quoted prices for identical or similar assets or liabilities in markets that are not active.
Level III – Unobservable inputs that reflect management’s best estimate of what market participants would use in pricing the asset or liability at the measurement date. Consideration is given to the risk inherent in the valuation technique and the risk inherent in the inputs to the model.
Fair Value on a Recurring Basis
Assets and liabilities measured at fair value on a recurring basis are categorized in the tables below based upon the lowest level of significant input to the valuations.
13
2013 (Remaining) $ 20,083 2014 19,235 2015 16,513 2016 10,723 2017 8,175 Thereafter 3,238 Total $ 77,967

Table of Contents
Additional Fair Value Information
The following table provides additional fair value information relating to the Company’s financial instruments outstanding:
The fair value of the bank borrowings and promissory notes has been calculated using an estimate of the interest rate the Company would have had to pay on the issuance of notes with a similar maturity and discounting the cash flows at that rate. The fair values do not give an indication of the amount that the Company would currently have to pay to extinguish any of this debt.
NOTE 9. PRODUCT WARRANTIES
14
Fair Values as of the First Quarter of 2013 Fair Values as of Fiscal Year End 2012
(Dollars in thousands) Level I Level II Level III Total Level I Level II Level III Total
Assets
Money market funds(1) $ 2 $ — $ — $ 2 $ 2 $ — $ — $ 2 Deferred compensation plan assets (2) 14,683 — — 14,683 12,875 — — 12,875 Derivative assets (3) — 547 — 547 — 343 — 343 Total $ 14,685 $ 547 $ — $ 15,232 $ 12,877 $ 343 $ — $ 13,220 Liabilities
Deferred compensation plan liabilities (2) $ 14,683 $ — $ — $ 14,683 $ 12,875 $ — $ — $ 12,875 Derivative liabilities (3) — 852 — 852 — 420 — 420 Contingent consideration liabilities (4) — — 2,174 2,174 — — 2,235 2,235 Total $ 14,683 $ 852 $ 2,174 $ 17,709 $ 12,875 $ 420 $ 2,235 $ 15,530
(1) The money market funds are highly liquid investments. The fair values are determined using observable quoted prices in active markets. Money market funds are included in Cash and cash equivalents on the Company’s Condensed Consolidated Balance Sheets.
(2) The Company maintains a self-directed, non-qualified deferred compensation plan for certain executives and other highly compensated employees. The plan assets and liabilities are invested in actively traded mutual funds and individual stocks valued using observable quoted prices in active markets. Deferred compensation plan assets and liabilities are included in Other non-current assets and Other non-current liabilities on the Company's Condensed Consolidated Balance Sheets.
(3) Derivative assets and liabilities primarily represent forward currency exchange contracts. The Company typically enters into these contracts to minimize the short-term impact of foreign currency exchange rates on certain trade and inter-company receivables and payables. Derivative assets and liabilities are included in Other current assets and Other current liabilities on the Company's Condensed Consolidated Balance Sheets.
(4) Contingent consideration liabilities represents arrangements to pay the former owners of certain companies the Company acquired. The undiscounted maximum payment under the arrangements is $6.3 million at the end of first quarter of fiscal 2013 , based on future revenues or gross margins. Contingent consideration liabilities are included in Other current liabilities and Other non-current liabilities on the Company's Condensed Consolidated Balance Sheets.
Carrying Amount
Fair Value
Carrying Amount
Fair Value
As of First Quarter of Fiscal 2013 Fiscal Year End 2012
(Dollars in thousands) Assets:
Cash and cash equivalents $ 143,552 $ 143,552 $ 157,771 $ 157,771 Forward foreign currency exchange contracts 547 547 343 343
Liabilities:
Credit facility $ 917,250 $ 917,250 $ 908,000 $ 908,000 Forward foreign currency exchange contracts 852 852 420 420 Promissory note and other 3,189 3,189 3,158 3,158

Table of Contents
The Company accrues for warranty costs as part of its cost of sales based on associated material product costs, technical support labor costs and costs incurred by third parties performing work on the Company’s behalf. The Company’s expected future costs are primarily estimated based upon historical trends in the volume of product returns within the warranty period and the costs to repair or replace the equipment. The products sold are generally covered by a warranty for periods ranging from 90 days to 5.5 years.
While the Company engages in extensive product quality programs and processes, including actively monitoring and evaluating the quality of component suppliers, its warranty obligation is affected by product failure rates, material usage and service delivery costs incurred in correcting a product failure. Should actual product failure rates, material usage, or service delivery costs differ from the estimates, revisions to the estimated warranty accrual and related costs may be required.
Changes in the Company’s product warranty liability during the first quarter of fiscal 2013 are as follows:
NOTE 10. EARNINGS PER SHARE
The following data was used in computing earnings per share and the effect on the weighted-average number of shares of potentially dilutive common stock.
For the first quarter of fiscal 2013 and 2012 , the Company excluded 2.5 million and 3.8 million shares of outstanding stock options, respectively, from the calculation of diluted earnings per share. These shares were excluded because the exercise prices of these stock options were greater than or equal to the average market value of the common shares during the respective periods. Inclusion of these shares would be antidilutive. These options could be included in the calculation in the future if the average market value of the common shares increases and is greater than the exercise price of these options.
NOTE 11. INCOME TAXES
In the first quarter of fiscal 2013 , the Company’s effective income tax rate was 10% as compared to 17% in the corresponding period in 2012 , primarily due to difference in geographic mix of pretax income and the favorable impact of the retroactive research and development tax credit for the fiscal year 2012. The enactment of the American Taxpayer Relief Act in January 2013 resulted in the Company recording a net discrete tax benefit of $3.6 million in the first quarter of 2013. The Company's effective tax rates for the first quarters of fiscal years 2013 and 2012 are lower than the U.S. federal statutory rate of 35% due to discrete benefit
15
(Dollars in thousands)
Balance as of fiscal year end 2012 $ 17,066 Acquired warranties 25 Accruals for warranties issued 5,155 Changes in estimates (112 )
Warranty settlements (in cash or in kind) (4,658 )
Balance as of the first quarter of fiscal 2013 $ 17,476
First Quarter of
2013 2012
(Dollars in thousands, except per share amounts) Numerator:
Net income attributable to Trimble Navigation Ltd. $ 49,808 $ 50,818 Denominator:
Weighted average number of common shares used in basic earnings per share 255,181 248,740 Effect of dilutive securities (using treasury stock method):
Common stock options and restricted stock units 5,118 6,780 Weighted average number of common shares and dilutive potential common shares used in diluted earnings per share 260,299 255,520 Basic earnings per share $ 0.20 $ 0.20 Diluted earnings per share $ 0.19 $ 0.20

Table of Contents
from the reinstatement of the 2012 R&D tax in 2013 and favorable tax rates associated with certain earnings from operations in lower-tax jurisdictions. The Company has not provided U.S. taxes for all of such earnings due to the indefinite reinvestment of some of those earnings outside the U.S.
The Company and its subsidiaries are subject to U.S. federal and state, and foreign income tax. The Company is currently in various stages of multiple year examinations by federal, state and foreign taxing authorities. Although timing of the resolution of audits is highly uncertain, the Company does not believe it is reasonably possible that the unrecognized tax benefits as of March 29, 2013 will materially change in the next twelve months.
The unrecognized tax benefits of $42.4 million and $35.2 million as of the first quarter of fiscal 2013 and fiscal year end 2012 , respectively, if recognized, would favorably affect the effective income tax rate in future periods. Unrecognized tax benefits are recorded in Other non-current liabilities and in the deferred tax accounts in the accompanying Condensed Consolidated Balance Sheets.
The Company's practice is to recognize interest and/or penalties related to income tax matters in income tax expense. The Company's unrecognized tax benefit liabilities include interest and penalties as of the first quarter of fiscal 2013 and fiscal year end 2012 , of $3.4 million and $2.9 million , respectively, which were recorded in Other non-current liabilities in the accompanying Condensed Consolidated Balance Sheets.
16

Table of Contents
This Quarterly Report on Form 10-Q contains forward-looking statements within the meaning of Section 27A of the Securities Act of 1933, as amended, and Section 21E of the Securities Exchange Act of 1934, as amended, which are subject to the “safe harbor” created by those sections. Actual results could differ materially from those indicated in the forward-looking statements due to a number of factors including, but not limited to, the risk factors discussed in “Risk Factors” below and elsewhere in this report as well as in the Company’s Annual Report on Form 10-K for fiscal year 2012 and other reports and documents that the Company files from time to time with the Securities and Exchange Commission. The Company has attempted to identify forward-looking statements in this report by placing an asterisk (*) before paragraphs. Discussions containing such forward-looking statements may be found in “Management’s Discussion and Analysis of Financial Condition and Results of Operations” below. In some cases, forward-looking statements can be identified by terminology such as “may,” “will,” “should,”“could,” “predicts,” “potential,” “continue,” “expe cts,” “anticipates,” “future,” “intends,” “plans,” “believes,” “estimates,” and similar expressions. These forward-looking statements are made as of the date of this Quarterly Report on Form 10-Q, and the Company disclaims any obligation to update these statements or to explain the reasons why actual results may differ.
ITEM 2. MANAGEMENT’S DISCUSSION AND ANALYSIS OF FIN ANCIAL CONDITION AND RESULTS OF OPERATIONS
The discussion and analysis of our financial condition and results of operations are based upon our condensed consolidated financial statements, which have been prepared in accordance with accounting principles generally accepted in the U. S. The preparation of these financial statements requires us to make estimates and judgments that affect the reported amounts of assets, liabilities, revenue and expense, and related disclosure of contingent assets and liabilities. On an on-going basis, we evaluate our estimates, including those related to product returns, doubtful accounts, inventories, investments, intangible assets, stock-based compensation, income taxes, warranty obligations, restructuring costs, contingencies and litigation. We base our estimates on historical experience and on various other assumptions that are believed to be reasonable under the circumstances, the results of which form the basis for making judgments about the amount and timing of revenue and expense and the carrying values of assets and liabilities that are not readily apparent from other sources. Actual results may differ from these estimates under different assumptions or conditions.
CRITICAL ACCOUNTING POLICIES AND ESTIMATES
There have been no material changes to the Company’s significant accounting polices during the first quarter of fiscal 2013 from those disclosed in the Company’s 2012 Form 10-K.
EXECUTIVE LEVEL OVERVIEW
Trimble's focus is on integrating its broad technological and application capabilities to create system-level solutions that transform how work is done within the industries we serve, enhancing productivity, accuracy, safety and regulatory compliance for our customers. The majority of our markets are end-user markets, including engineering and construction firms, surveyors, farmers, governmental organizations, energy and utility companies and organizations who must manage fleets of mobile workers and assets. We also provide components to original equipment manufacturers to incorporate into their products. In the end user markets, we provide stand-alone systems which may consist of software, hardware or some combination of the two, as well as integrated enterprise or workflow solutions which address the entire work process. Some examples of our solutions include products that automate and simplify the process of surveying land, products that automate the control, management and utilization of equipment such as tractors and bulldozers, products for engineering or building design, construction and operations management, products that enable a company to manage its mobile workforce and assets, and products that allow municipalities or utilities to manage their fixed assets and operations. To achieve distribution, marketing, production, and technology advantages in our targeted markets, we manage our operations in the following four segments: Engineering and Construction, Field Solutions, Mobile Solutions, and Advanced Devices.
Solutions targeted at the end-user make up a significant majority of our revenue. To create compelling products, we must attain an understanding of the end-users' needs and work flow, and of how our broad based technological capabilities can be deployed and integrated to enable that end-user to work faster, more efficiently, more accurately and more safely. We use this knowledge to create highly innovative solutions that change the way work is done by the end-user. With the exception of our Mobile Solutions and Advanced Devices segments, our products are primarily sold through a dealer channel, and it is crucial that we maintain a proficient, global, third-party distribution channel.
We continue to execute our strategy with a series of actions across new and existing markets:
Reinforcing our position in new and existing markets
17

Table of Contents Within our Engineering and Construction segment, the Trimble Buildings portfolio of solutions for project optimization across the entire design-build-operate lifecycle was further developed during the first quarter with the release of Plancal Version 9 and Proliance 5.6; Plancal Version 9 includes support for Trimble SketchUp models and integration with Trimble Field Link, among other new features all designed to further optimize the building information modeling workflow for the mechanical, electrical & plumbing market. The Proliance 5.6 product, used for capital planning, building and renovation processes across large infrastructure programs includes support for PCs and Apple iPad products to enable access to critical financial and project data. We also launched the Trimble Slate Controller, an ergonomic smartphone product incorporating voice, cellular data and an 8-megapixel camera into a device specifically designed for field use, with rugged environmental standards and a touch screen optimized for outdoor, daylight readability. This solution enables surveyors to operate the Trimble Access field software on a smartphone device with superior resistance to shock, drop and moisture than is provided by most consumer smartphone devices. The Trimble Connected Site® solution was further extended with the announcement of Trimble Remote Assistant, providing real-time technical support to field crew personnel or earthworks machine operators, without the time and cost of waiting for a technician to drive to the construction site. In our Field Solutions segment, we launched multiple new products and services designed to further improve productivity and real-time decision making capabilities within farming operations. The addition of remote diagnostics capabilities to the Trimble Connected Farm™ enables Trimble or authorized reseller support technicians to remotely access Trimble automated steering, application control, yield monitoring and other precision agriculture systems in order to diagnose, support and troubleshoot problems in the field. The launch of our xFill Technology for agriculture and our RangePoint™ RTX™ correction service enhance the range of agricultural applications of our satellite-delivered data services.. A further addition to the Connected Farm portfolio during the first quarter was the launch of the Connected Farm App, an application for Apple and Android smartphones that enables farmers to record crop readings and determine application rates using a smartphone or tablet in conjunction with the Green Seeker® handheld crop sensor, a handheld measurement device designed to assess the health of a crop. The solution enables farmers to more efficiently use fertilizers and other inputs through automated application rate calculations and location tracking data, logging data in real-time to a remote server via a wireless internet connection. Within our Mobile Solutions segment, we announced the acquisition of ALK Technologies, a provider of routing, mapping, mileage and navigation technologies for transportation, logistics and mobile workforce applications. The combination of ALK's routing, mapping, mileage and navigation capabilities with our enterprise transportation management software and the mobile communications solutions within the our transportation and logistics suite of products further enhances our comprehensive and industry-focused technology approach. We further strengthened our portfolio of products for the environmental industry with the launch of the WaterWell Monitor, a solution for digitally recording and monitoring water wells at landfills and remediation sites. We also announced an agreement with Plexus Controls Corporation of Ottawa, Canada to collaborate on the development of solutions that leverage positioning technology, wireless supervisory control and data acquisition, which we call (SCADA) solutions and mobile field management tools to enhance productivity for consultants and professionals in the environmental industry. Under the agreement, Trimble will have worldwide rights to use Plexus Control's wireless SCADA and mobile monitoring technologies to provide products for the industry.
Also within our Mobile Solutions segment, the Trimble Construction Logistics solution for fleet owners and operators in the construction materials and supply industry was further enhanced during the first quarter with the addition of the TrimFleet™ Communicator product. This integrates critical real-time push-to-talk communications between dispatchers, drivers and mechanics into the solution, making use of existing cellular telephone infrastructure and offering an alternative to legacy, proprietary two way radios or carrier push-to-talk systems. The TrimFleet Communicator product can also be integrated with the Trimble Paving Solution to offer a complete Trimble end-to-end workflow solution from order fulfillment at the concrete batch plant, through delivery, to final placement of the concrete on site by the paving machine. Additionally, we enhanced this integrated paving solution during the first quarter with the launch of the new PCS900 Paving Control System, a 3D control system consisting of on-machine sensors and office software designed to minimize material waste while enabling fast, accurate and automated paving operations without the need for manually placed stringlines.
Bringing existing technology to new markets We continue to reinforce our position in existing markets and position ourselves in newer markets that will serve as important sources of future growth. Our continued execution of our global SITECH distribution strategy resulted in the establishment of new SITECH Technology Dealers in Vietnam, the Kingdom of Saudi Arabia, the Republic of South Africa, and Louisiana, U.S.A. during the first quarter.
18

Table of Contents We also continue to focus on expansion initiatives in Africa, China, India, The Middle-East, Russia, South America, and South East Asia. Our acquisition of Penmap.com of the UK extended our suite of software offerings for the cadastral and land administration markets, further enhancing our ability to provide localized and customized solutions to customers engaged in surveying for land title, cadastral and land management activities.
RECENT BUSINESS DEVELOPMENTS
The following companies or business assets were acquired during the twelve months ended March 29, 2013 and are combined in our results of operations since the date of acquisition:
Penmap Software
On January 11, 2013, we acquired a suite of software solutions from Penmap.com Ltd. of Bradford, United Kingdom. Penmap Software’s performance is reported under our Engineering and Construction business segment.
ALK Technologies
On December 31, 2012, we acquired privately-held ALK Technologies Inc. of of Princeton, NJ, a provider in routing, mapping, mileage and navigation technologies. ALK’s performance is reported under our Mobile Solutions business segment.
Vico Software, Inc.
On October 31, 2012, we acquired the assets of privately-held Vico Software, Inc. (Vico) of Boulder, Colorado, a provider of 5D virtual construction software and consulting services. The Vico business performance is reported under our Engineering and Construction business segment.
Refraction Technology, Inc.
On October 4, 2012, we acquired the assets of privately-held Refraction Technology, Inc. (REF TEK) of Plano, Texas, a leading provider of seismic sensors and high-frequency data logging systems. The REF TEK business performance is reported under our Engineering and Construction business segment.
TMW Systems, Inc.
On October 2, 2012, we acquired privately-held TMW Systems Holding LLC, including its operating subsidiary, TMW Systems, Inc. (TMW) of Beachwood, Ohio, a provider of enterprise software to transportation and logistics companies. TMW’s performance is reported under our Mobile Solutions business segment.
Logicway
On September 6, 2012, we acquired privately-held Logicway of Oldenzaal, Netherlands, a provider of software for automating payroll and expenses with a specific focus on the transportation and logistics industry. Logicway’s performance is reported under our Mobile Solutions business segment.
WinEstimator
On August 6, 2012, we acquired privately-held WinEstimator, Inc., a provider of construction cost estimating and cost-modeling software. WinEstimator’s performance is reported under our Engineering and Construction business segment.
GEOTrac Systems Inc.
On June 8, 2012, we acquired privately-held GEOTrac Systems Inc. of Calgary, Canada, a leading provider of wireless fleet management and worker safety solutions for the oil and gas industry. GEOTrac Systems Inc.’s performance is reported under our Mobile Solutions business segment.
SketchUp
On June 1, 2012, we acquired SketchUp ® , a popular 3D modeling platform, and related assets from Google Inc. SketchUp’s performance is reported under our Engineering and Construction business segment.
Gatewing
19

Table of Contents
On April 5, 2012, we acquired privately-held Gatewing of Gent, Belgium, a provider of lightweight unmanned aerial vehicles for photogrammetry and rapid terrain mapping applications. Gatewing’s performance is reported under our Engineering and Construction business segment.
Seasonality of Business
* Our individual segment revenue may be affected by seasonal buying patterns. Historically, the second fiscal quarter has been the strongest quarter for the Company driven by the construction buying season. However, as a result of recent acquisitions, we may experience less seasonality in the future.
RESULTS OF OPERATIONS
Overview
The following table is a summary of revenue, gross margin and operating income for the periods indicated and should be read in conjunction with the narrative descriptions below.
Revenue
In the first quarter of fiscal 2013 , total revenue increased by $53.8 million or 11% , as compared to the first quarter of fiscal 2012 . Of this increase, product revenue increased $14.2 million, or 4% , service revenue increased $24.2 million, or 42% , and subscription revenue increased $15.4 million, or 33% . The product, service, and subscription revenue increase during the first quarter of fiscal 2013 , as compared to the first quarter of fiscal 2012 , was driven primarily by growth across Engineering and Construction and Mobile Solutions, which included organic growth as well as the impact of the TMW acquisition which was not applicable in the prior period. We consider organic growth to include all revenue except for revenue associated with acquisitions made within the last four quarters.
On a segment basis, Engineering and Construction revenue for the first quarter of fiscal 2013 increased $18.0 million, or 7% , Mobile Solutions increased $31.8 million or 41% , Advanced Devices increased $4.1 million or 15% , and Field Solutions was flat as compared to the first quarter of fiscal 2012 . Revenue growth within Engineering and Construction was driven by organic growth due to global sales of building construction products, and heavy highway products in the U.S., partially offset by softness in Australia and Europe. Field Solutions revenue was flat primarily due to moderate growth in the agriculture market, partially offset by a decline in GIS markets. Mobile Solutions revenue increased due to strong organic growth in the transportation and logistics market as well as the acquisition of TMW which was not applicable in the prior period. Advanced Devices revenue increased primarily due to stronger sales of embedded and timing devices.
Gross Margin
Gross margin varies due to a number of factors including product mix, pricing, distribution channel, production volumes and foreign currency translations.
Gross margin increased by $27.8 million for the first quarter of fiscal 2013 , as compared to the first quarter of fiscal 2012 . The increase was primarily due to increased sales in Engineering and Construction and Mobile Solutions. Gross margin as a percentage of total revenue for the first quarter of fiscal 2013 and fiscal 2012 were both 51.6% . The flat percentage was primarily due to
20
First Quarter of
2013 2012
(Dollars in thousands) Revenue:
Product $ 412,787 $ 398,538 Service 81,596 57,430 Subscription 61,728 46,299
Total revenue 556,111 502,267 Gross margin $ 286,914 $ 259,150 Gross margin % 51.6 % 51.6 %
Operating income $ 56,457 $ 59,848 Operating income % 10.2 % 11.9 %

Table of Contents
product mix, with an increase in higher margin software and subscription sales, which was largely offset by higher amortization of purchased intangible assets.
Operating Income
Operating income decreased by $3.4 million for the first quarter of fiscal 2013 , as compared to the first quarter of fiscal 2012 . Operating income as a percentage of total revenue was 10.2% for the first quarter of fiscal 2013 , as compared to 11.9% for the first quarter of fiscal 2012 . The decrease in operating income and operating income percentage was primarily driven by higher amortization of purchased intangibles due to acquisitions, largely offset by higher revenue and associated gross margin.
Results by Segment
To achieve distribution, marketing, production and technology advantages in our targeted markets, we manage our operations in the following four segments: Engineering and Construction, Field Solutions, Mobile Solutions and Advanced Devices. Operating income equals net revenue less cost of sales and operating expense, excluding general corporate expense, amortization of purchased intangible assets, amortization of inventory step-up charges, acquisition costs and restructuring costs. Operating leverage is defined as an increase in operating income as a percentage of the increase in revenue.
The following table is a summary of revenue and operating income by segment:
A reconciliation of our consolidated segment operating income to consolidated income before taxes follows:
21
First Quarter of
2013 2012
(Dollars in thousands)
Engineering and Construction
Revenue $ 266,871 $ 248,885 Segment revenue as a percent of total revenue 48 % 50 %
Operating income $ 42,973 $ 40,077 Operating income as a percent of segment revenue 16 % 16 %
Field Solutions
Revenue $ 147,481 $ 147,499 Segment revenue as a percent of total revenue 27 % 29 %
Operating income $ 59,526 $ 62,361 Operating income as a percent of segment revenue 40 % 42 %
Mobile Solutions
Revenue $ 110,164 $ 78,383 Segment revenue as a percent of total revenue 20 % 16 %
Operating income $ 11,573 7,358 Operating income as a percent of segment revenue 11 % 9 %
Advanced Devices
Revenue $ 31,595 $ 27,500 Segment revenue as a percent of total revenue 5 % 5 %
Operating income $ 6,485 $ 3,339 Operating income as a percent of segment revenue 21 % 12 %

Table of Contents
Unallocated corporate expense includes general corporate expense, amortization of inventory step-up charges and restructuring costs.
Engineering and Construction
Engineering and Construction revenue increased by $18.0 million or 7% for the first quarter of fiscal 2013 , as compared to the first quarter of fiscal 2012 . Segment operating income increased $2.9 million or 7% for the first quarter of fiscal 2013 , as compared to the first quarter of fiscal 2012 .
The revenue increase for the first quarter was primarily driven by organic growth due to increased global sales of building construction as the residential and commercial markets revive. Heavy highway sales were up year over year, with growth in North America somewhat limited by weather conditions which delayed purchases. The growth was offset partially by poor market conditions in Europe and Australia. Survey sales were down year over year. Europe and Australia sales were down and North America survey sales, although up, were limited by government spending and weather conditions. Segment operating income increased primarily due to higher revenue.
Field Solutions
Field Solutions revenue was flat for the first quarter of fiscal 2013 , as compared to the first quarter of fiscal 2012 . Segment operating income decreased by $2.8 million or 5% for the first quarter of fiscal 2013 , as compared to the first quarter of fiscal 2012 .
Field Solution revenue was flat for the first quarter of fiscal 2013 primarily due to moderate growth in the agriculture market, partially offset by a decline in GIS markets. There was sales growth for agricultural products in Europe and South American markets. The U.S. was down as a result of a shorter planting window due to weather conditions which delayed purchases. GIS was down due to the impact of U.S. government spending. Segment operating income decreased due to reduced operating leverage in GIS.
Mobile Solutions
Mobile Solutions revenue increased by $31.8 million or 41% for the first quarter of fiscal 2013 , as compared to the first quarter of fiscal 2012 . Segment operating income increased by $4.2 million or 57% for the first quarter of fiscal 2013 , as compared to the first quarter of fiscal 2012 .
The revenue increase for the first quarter of fiscal 2013 was primarily due to continued organic growth in the transportation and logistics market as well as the acquisition of TMW which was not applicable in the prior period. Operating income increased due to increased revenue and product mix, including higher subscription revenue.
Advanced Devices
Advanced Devices revenue increased by $4.1 million or 15% for the first quarter of fiscal 2013 , as compared to the first quarter of fiscal 2012 . Segment operating income increased by $3.1 million or 94% for the first quarter of fiscal 2013 , as compared to the first quarter of fiscal 2012 .
The increase in revenue and operating income for the first quarter of fiscal 2013 was due to increased sales of high margin timing devices and good operating leverage.
Research and Development, Sales and Marketing and General and Administrative Expense
22
First Quarter of
2013 2012
(Dollars in thousands) Consolidated segment operating income $ 120,557 $ 113,135 Unallocated corporate expense (21,350 ) (19,724 )
Amortization of purchased intangible assets (39,332 ) (28,797 )
Acquisition costs (3,418 ) (4,766 )
Consolidated operating income 56,457 59,848 Non-operating income (expense), net (2,088 ) 479 Consolidated income before taxes $ 54,369 $ 60,327

Table of Contents
Research and development (R&D), sales and marketing (S&M) and general and administrative (G&A) expense are summarized in the following table:
Overall, R&D, S&M and G&A expense increased by approximately $26.1 million for the first quarter of fiscal 2013 , as compared to the first quarter of fiscal 2012 .
Research and development expense increased by $13.4 million for the first quarter of fiscal 2013 , as compared to the first quarter of fiscal 2012 . The cost of software developed for external sale subsequent to reaching technical feasibility was not considered material and was expensed as incurred. Research and development spending overall was at approximately 13% of revenue in the first quarter of fiscal 2013 , as compared to 12% of revenue in the first quarter of fiscal 2012 .
The increase in R&D expense in the first quarter of fiscal 2013 , as compared to the first quarter of fiscal 2012 was primarily due to the inclusion of expense of $10.6 million from acquisitions not applicable in the first quarter of fiscal 2012 and a $2.5 million increase in compensation related expense due to headcount increases.
* We believe that the development and introduction of new products are critical to our future success and we expect to continue active development of new products.
Sales and marketing expense increased by $7.6 million for the first quarter of fiscal 2013 , as compared to the first quarter of fiscal 2012 . Sales and marketing spending overall was at approximately 15% of revenue in both the first quarter of fiscal 2013 and 2012 .
The increase in S&M expense in the first quarter of fiscal 2013 , as compared to the first quarter of fiscal 2012 was primarily due to the inclusion of expense of $7.6 million from acquisitions not applicable in the first quarter of fiscal 2012 .
* Our future growth will depend in part on the timely development and continued viability of the markets in which we currently compete, as well as our ability to continue to identify and develop new markets for our products.
General and administrative expense increased by $5.1 million for the first quarter of fiscal 2013 , as compared to the first quarter of fiscal 2012 . General and administrative spending overall was at approximately 10% of revenue in the first quarter of fiscal 2013 , as compared to 9% of revenue in the first quarter of fiscal 2012 .
The increase in G&A expenses in the first quarter of fiscal 2013 , as compared to the first quarter of fiscal 2012 was primarily due to the inclusion of expense of $7.0 million from acquisitions not applicable in the first quarter of fiscal 2012 , offset by a decrease of $1.3 million in merger and acquisition costs, and a $0.6 million decrease in bad debt expense.
Amortization of Purchased Intangible Assets
Amortization of purchased intangible assets was $39.3 million in the first quarter of fiscal 2013 , as compared to $28.8 million in the first quarter of fiscal 2012 . Of the total $39.3 million in the first quarter of fiscal 2013 , $19.6 million is presented as a separate line within Operating expense and $19.7 million is presented as a separate line within Cost of sales on our Condensed Consolidated Statements of Income. The increase was due to acquisitions not included in the first quarter of fiscal 2012 . As of the first quarter of fiscal 2013 , future amortization of intangible assets is expected to be $115.9 million during the remaining three quarters of fiscal 2013 , $131.0 million during 2014 , $118.9 million during 2015 , $101.3 million during 2016 , $82.3 million during 2017 and $87.4 million thereafter.
Non-operating Income (Expense), Net
The components of non-operating income (expense), net, were as follows:
23
First Quarter of
2013 2012
(Dollars in thousands) Research and development 73,608 60,235 Percentage of revenue 13 % 12 %
Sales and marketing 83,623 76,024 Percentage of revenue 15 % 15 %
General and administrative 51,970 46,886 Percentage of revenue 10 % 9 %
Total 209,201 183,145 Percentage of revenue 38 % 36 %

Table of Contents
Non-operating income (expense), net decrease d $2.6 million for the first quarter , as compared to the first quarter of fiscal 2012 . The decrease in the first quarter of fiscal 2013 was primarily due to an increase in interest expense due to an increase in debt associated with acquisitions and lower profitability from joint ventures.
Income Tax Provision
Our effective income tax rate for the first quarter of fiscal 2013 was 10% , as compared to 17% for the first quarter of fiscal 2012 , primarily due to difference in geographic mix of pretax income and the favorable impact of the retroactive research and development tax credit for the fiscal year 2012. The enactment of the American Taxpayer Relief Act in January 2013 resulted in the recording of a net discrete tax benefit of $3.6 million in the first quarter of 2013. Our effective tax rates for the first quarters of fiscal years 2013 and 2012 are lower than the U.S. federal statutory rate of 35% due to discrete benefit from the reinstatement of the 2012 R&D tax in 2013 and favorable tax rates associated with certain earnings from operations in lower-tax jurisdictions. We have not provided U.S. taxes for all of such earnings due to the indefinite reinvestment of some of those earnings outside the U.S.
OFF-BALANCE SHEET FINANCINGS AND LIABILITIES
Other than lease commitments incurred in the normal course of business, we do not have any off-balance sheet financing arrangements or liabilities, guarantee contracts, retained or contingent interests in transferred assets, or any obligation arising out of a material variable interest in an unconsolidated entity. We do not have any majority-owned subsidiaries that are not included in the Condensed Consolidated Financial Statements. Additionally, we do not have any interest in, or relationship with, any special purpose entities.
In the normal course of business to facilitate sales of our products, we indemnify other parties, including customers, lessors and parties to other transactions with us, with respect to certain matters. We have agreed to hold the other party harmless against losses arising from a breach of representations or covenants, or out of intellectual property infringement or other claims made against certain parties. These agreements may limit the time within which an indemnification claim can be made and the amount of the claim. In addition, we have entered into indemnification agreements with our officers and directors, and our bylaws contain similar indemnification obligations to our agents.
It is not possible to determine the maximum potential amount under these indemnification agreements due to the limited history of prior indemnification claims and the unique facts and circumstances involved in each particular agreement. Historically, payments made by us under these agreements were not material and no liabilities have been recorded for these obligations on the Condensed Consolidated Balance Sheets as of the first quarter of fiscal 2013 and fiscal year end 2012 .
LIQUIDITY AND CAPITAL RESOURCES
24
First Quarter of
2013 2012
(Dollars in thousands) Interest expense, net (5,071 ) (3,863 )
Foreign currency transaction loss (1,569 ) (2,213 )
Income from equity method investments, net 4,257 6,192 Other income, net 295 363
Total non-operating income (expense), net $ (2,088 ) $ 479
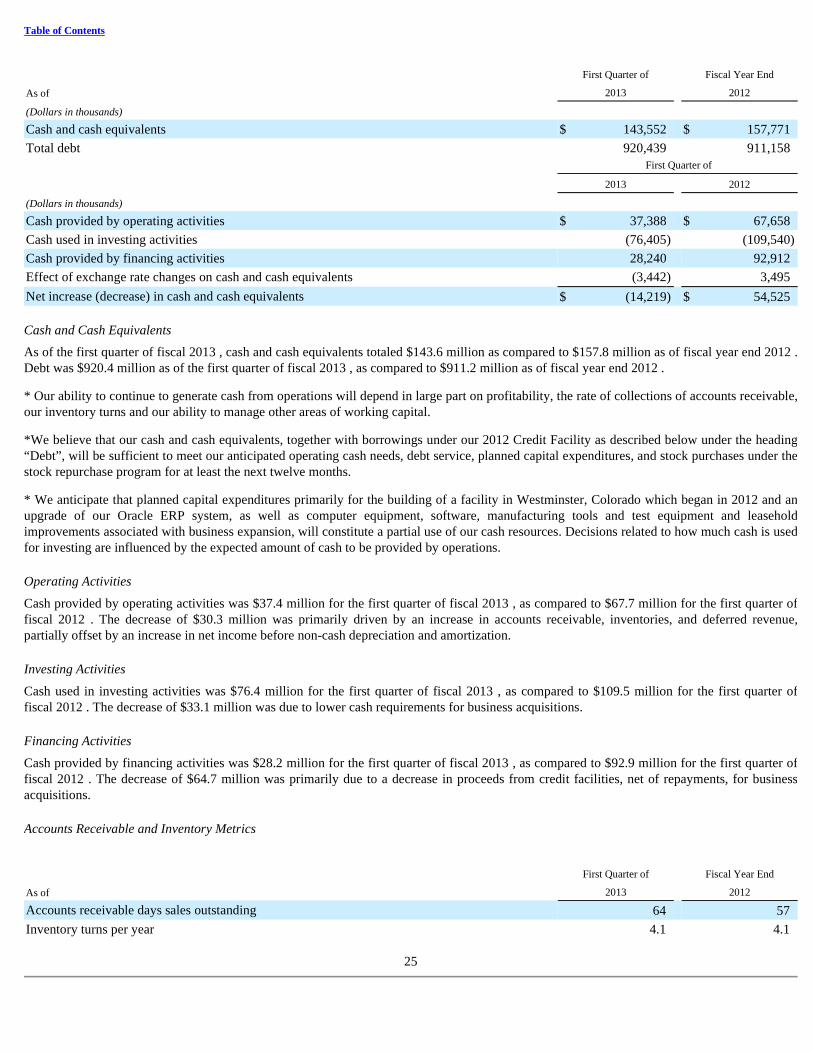
Table of Contents
Cash and Cash Equivalents
As of the first quarter of fiscal 2013 , cash and cash equivalents totaled $143.6 million as compared to $157.8 million as of fiscal year end 2012 . Debt was $920.4 million as of the first quarter of fiscal 2013 , as compared to $911.2 million as of fiscal year end 2012 .
* Our ability to continue to generate cash from operations will depend in large part on profitability, the rate of collections of accounts receivable, our inventory turns and our ability to manage other areas of working capital.
*We believe that our cash and cash equivalents, together with borrowings under our 2012 Credit Facility as described below under the heading “Debt”, will be sufficient to meet our anticipated operating cash needs, debt service, planned capital expenditures, and stock purchases under the stock repurchase program for at least the next twelve months.
* We anticipate that planned capital expenditures primarily for the building of a facility in Westminster, Colorado which began in 2012 and an upgrade of our Oracle ERP system, as well as computer equipment, software, manufacturing tools and test equipment and leasehold improvements associated with business expansion, will constitute a partial use of our cash resources. Decisions related to how much cash is used for investing are influenced by the expected amount of cash to be provided by operations.
Operating Activities
Cash provided by operating activities was $37.4 million for the first quarter of fiscal 2013 , as compared to $67.7 million for the first quarter of fiscal 2012 . The decrease of $30.3 million was primarily driven by an increase in accounts receivable, inventories, and deferred revenue, partially offset by an increase in net income before non-cash depreciation and amortization.
Investing Activities
Cash used in investing activities was $76.4 million for the first quarter of fiscal 2013 , as compared to $109.5 million for the first quarter of fiscal 2012 . The decrease of $33.1 million was due to lower cash requirements for business acquisitions.
Financing Activities
Cash provided by financing activities was $28.2 million for the first quarter of fiscal 2013 , as compared to $92.9 million for the first quarter of fiscal 2012 . The decrease of $64.7 million was primarily due to a decrease in proceeds from credit facilities, net of repayments, for business acquisitions.
Accounts Receivable and Inventory Metrics
25
First Quarter of Fiscal Year End
As of 2013 2012
(Dollars in thousands) Cash and cash equivalents $ 143,552 $ 157,771 Total debt 920,439 911,158 First Quarter of
2013 2012
(Dollars in thousands) Cash provided by operating activities $ 37,388 $ 67,658 Cash used in investing activities (76,405 ) (109,540 )
Cash provided by financing activities 28,240 92,912 Effect of exchange rate changes on cash and cash equivalents (3,442 ) 3,495 Net increase (decrease) in cash and cash equivalents $ (14,219 ) $ 54,525
First Quarter of Fiscal Year End
As of 2013 2012
Accounts receivable days sales outstanding 64 57 Inventory turns per year 4.1 4.1

Table of Contents
Accounts receivable days sales outstanding were 64 days as of the end of the first quarter of fiscal 2013 , as compared to 57 days as of the end of fiscal 2012 . The increase in DSO was primarily due to non-linearity of sales within the quarter, which is typical for the first quarter, and to a lesser extent, the timing of product maintenance and support billings, of which a significant portion will be recognized as revenue over future quarters. Accounts receivable days sales outstanding are calculated based on ending accounts receivable, net, divided by revenue for the corresponding fiscal quarter, times a quarterly average of 91 days. Our inventory turns were both 4.1 as of the end of the first quarter of fiscal 2013 and the end of fiscal 2012 . Our inventory turnover is calculated based on total cost of sales for the most recent twelve months divided by average ending inventory, net, for this same twelve month period.
Repatriation of Foreign Earnings and Income Taxes
A significant portion of our foreign earnings continue to be permanently reinvested in our foreign subsidiaries, and it is anticipated this reinvestment will not impede cash needs at the parent company level. In our determination of which foreign earnings are permanently reinvested, we consider numerous factors, including the financial requirements of the U.S. parent company, the financial requirements of the foreign subsidiaries, and the tax consequences of remitting the foreign earnings back to the U.S. There are no other material impediments to our ability to access sources of liquidity and our resulting ability to meet short and long-term liquidity needs, other than in the event we are not in compliance with the covenants under our 2012 Credit Facility or the tax costs of remitting foreign earnings back to the U.S.
Credit Facilities
On November 21, 2012, we entered into an amended and restated credit agreement with a group of lenders (the “2012 Credit Facility”). This credit facility provides for unsecured credit facilities in the aggregate principal amount of $1.4 billion, comprised of a five-year revolving loan facility of $700.0 million and a five-year $700.0 million term loan facility. Subject to the terms of the 2012 Credit Facility, the revolving loan facility and the term loan facility may be increased by $300.0 million in the aggregate. Additionally, the Company has a $75 million uncommitted revolving loan facility (the "2011 Uncommitted Facility"), which is callable by the bank at any time and has no covenants. The interest rate on the 2011 Uncommitted Facility is 1.00% plus either LIBOR or the bank's cost of funds or as otherwise agreed upon by the bank and us.
As of the first quarter of 2013 , our total debt was comprised primarily of a term loan of $691.3 million and a revolving credit line of $173.0 million under the 2012 Credit Facility and a revolving credit line of $53.0 million under the 2011 Uncommitted Facility. Of the total outstanding balance, $656.0 million of the term loan and $173.0 million of the revolving credit line are classified as long-term in the Condensed Consolidated Balance Sheet.
The funds available under the 2012 Credit Facility may be used for general corporate purposes, the financing of certain acquisitions and the payment of transaction fees and expenses related to such acquisitions. Under the 2012 Credit Facility, we may borrow, repay and reborrow funds under the revolving loan facility until its maturity on November 21, 2017, at which time the revolving facility will terminate, and all outstanding loans, together with all accrued and unpaid interest, must be repaid. Amounts not borrowed under the revolving facility will be subject to a commitment fee, to be paid in arrears on the last day of each fiscal quarter, ranging from 0.15% to 0.35% per annum depending on our leverage ratio as of the most recently ended fiscal quarter. The term loan will be repaid in quarterly installments, with the last quarterly payment to be made at September 29, 2017, with the remaining outstanding balance being due and payable on November 21, 2017. On an annualized basis, the amortization of the term loan is as follows: 5%, 5%, 10%, 10%, and 70% for years one through five respectively. The term loan may be prepaid in whole or in part, subject to certain minimum thresholds, without penalty or premium. Amounts repaid or prepaid with respect to the term loan facility may not be reborrowed.
We may borrow funds under the 2012 Credit Facility in U.S. Dollars, Euros or in certain other agreed currencies, and borrowings will bear interest, at our option, at either: (i) a floating per annum base rate based on the administrative agent's prime rate or other agreed-upon rate, depending on the currency borrowed, plus a margin of between 0.00% and 1.00%, depending on our leverage ratio as of the most recently ended fiscal quarter, or (ii) a reserve-adjusted fixed per annum rate based on LIBOR, EURIBOR, or other agreed-upon rate, depending on the currency borrowed, plus a margin of between 1.00% and 2.00%, depending on our leverage ratio as of the most recently ended fiscal quarter. Interest will be paid on the last day of each fiscal quarter with respect to borrowings bearing interest based on a floating rate, or on the last day of an interest period, but at least every three months, with respect to borrowings bearing interest at a fixed rate. Our obligations under the 2012 Credit Facility are guaranteed by several of our domestic subsidiaries.
The 2012 Credit Facility contains various customary representations and warranties by us, which include customary use of materiality, material adverse effect and knowledge qualifiers. The 2012 Credit Facility also contains customary affirmative and negative covenants including, among other requirements, negative covenants that restrict our ability to dispose of assets, create liens, incur indebtedness, repurchase stock, pay dividends, make acquisitions and make investments. Further, the 2012 Credit Facility contains financial covenants that require the maintenance of minimum interest coverage and maximum leverage ratios.
26

Table of Contents
Specifically, we must maintain as of the end of each fiscal quarter a ratio of (a) EBITDA (as defined in the 2012 Credit Facility) to (b) interest expenses for the most recently ended period of four fiscal quarters of not less than 3.5 to 1. We must also maintain, at the end of each fiscal quarter, a ratio of (x) total indebtedness to (y) EBITDA (as defined in the 2012 Credit Facility) for the most recently ended period of four fiscal quarters of not greater than the applicable ratio set forth in the table below; provided, that on the completion of a material acquisition, we may increase the applicable ratio in the table below by 0.25 for the fiscal quarter during which such acquisition occurred and each of the three subsequent fiscal quarters.
We were in compliance with these restrictive covenants as of the first quarter of fiscal 2013 .
The 2012 Credit Facility contains events of default that include, among others, non-payment of principal, interest or fees, breach of covenants, inaccuracy of representations and warranties, cross defaults to certain other indebtedness, bankruptcy and insolvency events, material judgments and events constituting a change of control. Upon the occurrence and during the continuance of an event of default, interest on the obligations will accrue at an increased rate and the lenders may accelerate our obligations under the 2012 Credit Facility, however that acceleration will be automatic in the case of bankruptcy and insolvency events of default.
The weighted average interest rate on the current portion of our our long-term debt outstanding under the 2012 Credit Facility and 2011 Uncommitted Facility was 1.66% and 1.96% at the end of the first quarter of fiscal 2013 and fiscal year end 2012 , respectively. The interest rate on our non-current debt outstanding under the 2012 Credit Facility was 1.89% and 1.96% at the end of the first quarter of fiscal 2013 and fiscal year end 2012 , respectively.
RECONCILIATION OF GAAP TO NON-GAAP FINANCIAL MEASUR ES
Our non-GAAP measures are not meant to be considered in isolation or as a substitute for comparable GAAP measures. The non-GAAP financial measures included in the tables below as well as detailed explanations to the adjustments to comparable GAAP measures, are set forth below: Non-GAAP gross margin
We believe our investors benefit by understanding our non-GAAP gross margin as a way of understanding how product mix, pricing decisions and manufacturing costs influence our business. Non-GAAP gross margin excludes restructuring costs, amortization of purchased intangible assets, stock-based compensation and amortization of acquisition-related inventory step-up from GAAP gross margin. We believe that these exclusions offer investors additional information that may be useful to view trends in our gross margin performance.
Non-GAAP operating expenses
We believe this measure is important to investors evaluating our non-GAAP spending in relation to revenue. Non-GAAP operating expenses exclude restructuring costs, amortization of purchased intangible assets, stock-based compensation and acquisition costs associated with external and incremental costs resulting directly from merger and acquisition activities such as legal, due diligence, and integration costs from GAAP operating expenses. We believe that these exclusions offer investors supplemental information to facilitate comparison of our operating expenses to our prior results.
Non-GAAP operating income
We believe our investors benefit by understanding our non-GAAP operating income trends which are driven by revenue, gross margin, and spending. Non-GAAP operating income excludes restructuring costs, amortization of purchased intangible assets, stock-based compensation, amortization of acquisition-related inventory step-up and acquisition costs associated with external and incremental costs resulting directly from merger and acquisition activities such as legal, due diligence, and integration costs. We believe that these exclusions offer an alternative means for our investors to evaluate current operating performance compared to results of other periods.
Non-GAAP non-operating income (expense), net
We believe this measure helps investors evaluate our non-operating income trends. Non-GAAP non-operating income (expense), net excludes acquisition and divestiture gains associated with unusual acquisition related items such as adjustments to the fair
27
Fiscal Quarter Ending Maximum Leverage Ratio
Prior to June 28, 2013 3.50 to 1
On and after June 28, 2013 and prior to September 27, 2013 3.25 to 1
On and after September 27, 2013 3 to 1

Table of Contents
value of earn-out liabilities and gains or losses related to the acquisition or sale of certain businesses and investments. These gains and losses are specific to particular acquisitions and divestitures and vary significantly in amount and timing. Non-GAAP non-operating income (expense), net also excludes foreign exchange losses specifically associated with a hedge for one of our acquisitions. We believe that these exclusions provide investors with a supplemental view of our ongoing financial results.
Non-GAAP income tax provision
Non-GAAP items tax effected adjusts the provision for income taxes to reflect the effect of certain non-GAAP items on non-GAAP net income. We believe this information is useful to investors because it provides for consistent treatment of the excluded items in our non-GAAP presentation.
Non-GAAP net income
This measure provides a supplemental view of net income trends which are driven by non-GAAP income before taxes and our non-GAAP tax rate. Non-GAAP net income excludes restructuring costs, amortization of purchased intangible assets, stock-based compensation, amortization of acquisition-related inventory step-up, acquisition and divestiture costs, a foreign exchange loss from a hedge associated with one of our acquisitions, and non-GAAP tax adjustments from GAAP net income. We believe our investors benefit from understanding these exclusions and from an alternative view of our net income performance as compared to our past net income performance.
Non-GAAP diluted net income per share
We believe our investors benefit by understanding our non-GAAP operating performance as reflected in a per share calculation as a way of measuring non-GAAP operating performance by ownership in the company. Non-GAAP diluted net income per share excludes restructuring costs, amortization of purchased intangible assets, stock-based compensation, amortization of acquisition-related inventory step-up, acquisition and divestiture costs, a foreign exchange loss from a hedge associated with one of our acquisitions, and non-GAAP tax adjustments from GAAP diluted net income per share. We believe that these exclusions offer investors a useful view of our diluted net income per share as compared to our past diluted net income per share.
Non-GAAP operating leverage
We believe this information is beneficial to investors as a measure of how much incremental revenue is contributed to our operating income. Non-GAAP operating leverage is the increase in non-GAAP operating income as a percentage of the increase in revenue. We believe that this information offers investors supplemental information to evaluate our current performance and to compare to our past non-GAAP operating leverage.
Non-GAAP segment operating income
Non-GAAP segment operating income excludes stock-based compensation from GAAP segment operating income. We believe this information is useful to investors because some may exclude stock-based compensation as an alternative view when assessing trends in the operating income of our segments.
These non-GAAP measures can be used to evaluate our historical and prospective financial performance, as well as our performance relative to competitors. We believe some of our investors track our "core operating performance" as a means of evaluating our performance in the ordinary, ongoing, and customary course of our operations. Core operating performance excludes items that are non-cash, not expected to recur or not reflective of ongoing financial results. Management also believes that looking at our core operating performance provides a supplemental way to provide consistency in period to period comparisons. Accordingly, management excludes from non-GAAP those items relating to restructuring, amortization of purchased intangible assets, stock based compensation, amortization of acquisition-related inventory step-up, acquisition and divestiture costs, a foreign exchange loss from a hedge associated with one of our acquisitions, and non-GAAP tax adjustments. For detailed explanations of the adjustments made to comparable GAAP measures, see items (A) - ( I ) following the tables below.
28
(Dollars in thousands, except per share data) First Quarter of
2013 2012
Dollar % of Dollar % of
Amount Revenue Amount Revenue
GROSS MARGIN:
GAAP gross margin: $ 286,914 51.6 % $ 259,150 51.6 %
Restructuring ( A ) 55 — % 45 — %

Table of Contents
29
Amortization of purchased intangible assets ( B ) 19,681 3.6 % 13,121 2.6 %
Stock-based compensation ( C ) 600 0.1 % 520 0.1 %
Amortization of acquisition-related inventory step-up ( D ) 603 0.1 % 8 — %
Non-GAAP gross margin: $ 307,853 55.4 % $ 272,844 54.3 %
OPERATING EXPENSES:
GAAP operating expenses: $ 230,457 41.4 % $ 199,302 39.7 %
Restructuring ( A ) (1,605 ) (0.3 )% (481 ) (0.1 )%
Amortization of purchased intangible assets ( B ) (19,651 ) (3.5 )% (15,676 ) (3.2 )%
Stock-based compensation ( C ) (8,218 ) (1.5 )% (7,269 ) (1.4 )%
Acquisition costs ( E ) (3,418 ) (0.6 )% (4,766 ) (0.9 )%
Non-GAAP operating expenses: $ 197,565 35.5 % $ 171,110 34.1 %
OPERATING INCOME:
GAAP operating income: $ 56,457 10.2 % $ 59,848 11.9 %
Restructuring ( A ) 1,660 0.3 % 526 0.1 %
Amortization of purchased intangible assets ( B ) 39,332 7.0 % 28,797 5.7 %
Stock-based compensation ( C ) 8,818 1.6 % 7,789 1.6 %
Amortization of acquisition-related inventory step-up ( D ) 603 0.1 % 8 — %
Acquisition costs ( E ) 3,418 0.6 % 4,766 1.0 %
Non-GAAP operating income: $ 110,288 19.8 % $ 101,734 20.3 %
NON-OPERATING INCOME (LOSS), NET:
GAAP non-operating income (loss), net: $ (2,088 ) $ 479
Acquisition (gain) loss ( E ) (401 ) 444
Foreign exchange loss associated with acquisitions ( F ) — 1,578
Non-GAAP non-operating income (loss), net: $ (2,489 ) $ 2,501
GAAP and Non-
GAAP Tax Rate %
( I )
GAAP and Non-
GAAP Tax Rate %
( I ) INCOME TAX PROVISION:
GAAP income tax provision: $ 5,437 10 % $ 10,255 17 %
Non-GAAP items tax effected: ( G ) 5,343 7,464
Non-GAAP income tax provision: $ 10,780 10 % $ 17,719 17 %
NET INCOME:
GAAP net income attributable to Trimble Navigation Ltd. $ 49,808 $ 50,818
Restructuring ( A ) 1,660 526
Amortization of purchased intangible assets ( B ) 39,332 28,797
Stock-based compensation ( C ) 8,818 7,789

Table of Contents
30
Amortization of acquisition-related inventory step-up ( D ) 603 8
Acquisition costs, net ( E ) 3,017 5,210
Foreign exchange loss associated with acquisitions ( F ) — 1,578
Non-GAAP tax adjustments ( G ) (5,343 ) (7,464 )
Non-GAAP net income attributable to Trimble Navigation Ltd. $ 97,895 $ 87,262
DILUTED NET INCOME PER SHARE:
GAAP diluted net income per share attributable to Trimble Navigation Ltd. 0.19 0.20
Restructuring ( A ) 0.01 —
Amortization of purchased intangible assets ( B ) 0.15 0.11
Stock-based compensation ( C ) 0.04 0.03
Amortization of acquisition-related inventory step-up ( D ) — —
Acquisition costs, net ( E ) 0.01 0.02
Foreign exchange loss associated with acquisitions ( F ) — 0.01
Non-GAAP tax adjustments ( G ) (0.02 ) (0.03 )
Non-GAAP diluted net income per share attributable to Trimble Navigation Ltd. 0.38 0.34
OPERATING LEVERAGE:
Increase in non-GAAP operating income $ 8,554 $ 31,632
Increase in revenue $ 53,844 $ 117,974
Operating leverage (increase in non-GAAP operating income as a % of increase in revenue) 15.9 % 26.8 %

Table of Contents
31
First Quarter of
2013 2012
(Dollars in thousands, except per share data)
% of Segment Revenue
% of Segment Revenue
SEGMENT OPERATING INCOME:
Engineering and Construction
GAAP operating income before corporate allocations: $ 42,973 16.1 % $ 40,077 16.1 %
Stock-based compensation ( I ) 2,862 1.1 % 2,756 1.1 %
Non-GAAP operating income before corporate allocations: $ 45,835 17.2 % $ 42,833 17.2 %
Field Solutions
GAAP operating income before corporate allocations: $ 59,526 40.4 % $ 62,361 42.3 %
Stock-based compensation ( I ) 717 0.4 % 643 0.4 %
Non-GAAP operating income before corporate allocations: $ 60,243 40.8 % $ 63,004 42.7 %
Mobile Solutions
GAAP operating income (loss) before corporate allocations: $ 11,573 10.5 % $ 7,358 9.4 %
Stock-based compensation ( I ) 912 0.8 % 793 1.0 %
Non-GAAP operating income before corporate allocations: $ 12,485 11.3 % $ 8,151 10.4 %
Advanced Devices
GAAP operating income before corporate allocations: $ 6,485 20.5 % $ 3,339 12.1 %
Stock-based compensation ( I ) 849 2.7 % 632 2.3 %
Non-GAAP operating income before corporate allocations: $ 7,334 23.2 % $ 3,971 14.4 %
A.
Restructuring costs. Included in our GAAP presentation of cost of sales and operating expenses, restructuring costs recorded are primarily for employee compensation resulting from reductions in employee headcount in connection with our company restructurings. We exclude restructuring costs from our non-GAAP measures because we believe they do not reflect expected future operating expenses, they are not indicative of our core operating performance, and they are not meaningful in comparisons to our past operating performance. We have incurred restructuring expense in each of the last three years however the amount incurred can vary significantly based on whether a restructuring has occurred in the period and the timing of headcount reductions.

Table of Contents
32
B.
Amortization of purchased intangible assets. Included in our GAAP presentation of gross margin and operating expenses is amortization of purchased intangible assets. US GAAP accounting requires that intangible assets are recorded at fair value and amortized over their useful lives. Consequently, the timing and size of our acquisitions will cause our operating results to vary from period to period, making a comparison to past performance difficult for investors. This accounting treatment may cause differences when comparing our results to companies that grow internally because the fair value assigned to the intangible assets acquired through acquisition may significantly exceed the equivalent expenses that a company may incur for similar efforts when performed internally. Furthermore, the useful life that we expense our intangible assets over may be substantially different from the time period that an internal growth company incurs and recognizes such expenses. We believe that by excluding the amortization of purchased intangible assets, which primarily represents technology and/or customer relationships already developed, it provides an alternative way for investors to compare our operations pre-acquisition to those post-acquisitions and to those of our competitors that have pursued internal growth strategies. However, we note that companies that grow internally will incur costs to develop intangible assets that will be expensed in the period incurred which may make a direct comparison more difficult.
C.
Stock-based compensation. Included in our GAAP presentation of cost of sales and operating expenses, stock-based compensation consists of expenses for employee stock options and awards and purchase rights under our employee stock purchase plan. We exclude stock-based compensation expense from our non-GAAP measures because some investors may view it as not reflective of our core operating performance as it is a non-cash expense. For the first quarter of fiscal 2013 and 2012, stock-based compensation was allocated as follows:
First Quarter of
(Dollars in thousands) 2013 2012
Cost of sales $ 600 $ 520 Research and development 1,147 1,229 Sales and Marketing 1,764 1,791 General and administrative 5,307 4,249
$ 8,818 $ 7,789
D.
Amortization of acquisition-related inventory step-up . The purchase accounting entries associated with our business acquisitions require us to record inventory at its fair value, which is sometimes greater than the previous book value of the inventory. Included in our GAAP presentation of cost of sales, the increase in inventory value is amortized to cost of sales over the period that the related product is sold. We exclude inventory step-up amortization from our non-GAAP measures because it is a non-cash expense that we do not believe is indicative of our ongoing operating results. We further believe that excluding this item from our non-GAAP results is useful to investors in that it allows for period-over-period comparability.
E.
Acquisition items. Included in our GAAP presentation of operating expenses, acquisition costs consist of external and incremental costs resulting directly from merger and acquisition activities such as legal, due diligence and integration costs. Included in our GAAP presentation of non-operating income (expense), net, acquisition/divestiture (gain) loss includes unusual acquisition or divestiture related items such as adjustments to the fair value of earn-out liabilities and gains on divestitures of certain businesses and investments. Although we do numerous acquisitions, the costs that have been excluded from the non-GAAP measures are costs specific to particular acquisitions. These are one-time costs that vary significantly in amount and timing and are not indicative of our core operating performance.
F. Foreign exchange loss associated with acquisitions. This amount represents a loss on a foreign exchange hedge associated with one of our acquisitions. We excluded the foreign exchange loss from our non-GAAP measures because we believe that the exclusion of this item provides investors an enhanced view of the cost structure of our operations and facilitates comparisons with the results of other periods.
G. Non-GAAP items tax effected. This amount adjusts the provision for income taxes to reflect the effect of the non-GAAP items ( A ) - ( F ) on non-GAAP net income. We believe this information is useful to investors because it provides for consistent treatment of the excluded items in this non-GAAP presentation.
H. GAAP and non-GAAP tax rate %. These percentages are defined as GAAP income tax provision as a percentage of GAAP income before taxes and non-GAAP income tax provision as a percentage of non-GAAP income before taxes. We believe that investors benefit from a presentation of non-GAAP tax rate percentage as a way of facilitating a comparison to non-GAAP tax rates in prior periods.

Table of Contents
Non-GAAP Operating Income
Non-GAAP operating income increased by $8.6 million for the first quarter of fiscal 2013 , as compared to the corresponding period in the prior year. Non-GAAP operating income as a percentage of total revenue was 19.8% for the first quarter of fiscal 2013 , as compared to 20.3% for the corresponding period in the prior year. The increase in operating income for the first quarter was primarily driven by higher revenue in Engineering and Construction and Mobile Solutions and gross margin expansion due to higher margin software and subscription revenue. Operating income percentage remained consistent. Gross margin expansion was offset by higher operating expenses associated with acquisitions.
ITEM 3. QUANTITATIVE AND QUALITATIVE DISCLOSURE ABO UT MARKET RISK
We are exposed to market risk related to changes in interest rates and foreign currency exchange rates. We use certain derivative financial instruments to manage these risks. We do not use derivative financial instruments for speculative purposes. All financial instruments are used in accordance with policies approved by our Board of Directors.
Market Interest Rate Risk
There have been no significant changes to our market interest rate risk assessment. Refer to our 2012 Annual Report on Form 10-K on page 50.
Foreign Currency Exchange Rate Risk
We operate in international markets, which expose us to market risk associated with foreign currency exchange rate fluctuations between the U.S. Dollar and various foreign currencies, the most significant of which is the Euro.
Historically, the majority of our revenue contracts are denominated in U.S. Dollars, with the most significant exception being Europe, where we invoice primarily in Euros. Additionally, a portion of our operating expenses, primarily the cost to manufacture, cost of personnel to deliver technical support on our products and professional services, sales and sales support and research and development, are denominated in foreign currencies, primarily the Euro, Swedish Krona, New Zealand Dollar and Canadian Dollar. Revenue resulting from selling in local currencies and costs incurred in local currencies are exposed to foreign currency exchange rate fluctuations which can affect our operating income. As exchange rates vary, operating income may differ from expectations. In the first quarter of fiscal 2013 , revenue was positively impacted by foreign currency exchange rates by $1.1 million. The impact to operating income was immaterial.
We enter into foreign currency forw ard contracts to minimize the short-term impact of foreign currency exchange rate fluctuations on cash and certain trade and inter-company receivables and payables, primarily denominated in Australian, Canadian, Singapore and New Zealand Dollars, Japanese Yen, Indian Rupee, South African Rand, Swedish Krona, Swiss Franc, Euro and British pound. These contracts reduce the exposure to fluctuations in foreign currency exchange rate movements as the gains and losses associated with foreign currency balances are generally offset with the gains and losses on the forward contracts. These instruments are marked to market through earnings every period and generally range from one to three months in original maturity. We do not enter into foreign currency forward contracts for trading purposes. We occasionally enter into foreign currency forward contracts to hedge the purchase price of some of our larger business acquisitions.
Foreign currency forward contracts outstanding as of the first quarter of fiscal 2013 and fiscal year end 2012 are summarized as follows (in thousands):
33
I.
Stock-based compensation. The amounts consists of expenses for employee stock options and awards and purchase rights under our employee stock purchase plan. As referred to above we exclude stock-based compensation here because investors may view it as not reflective of our core operating performance as it is a non-cash expense. However, management does include stock-based compensation for budgeting and incentive plans as well as for reviewing internal financial reporting. We discuss our operating results by segment with and without stock-based compensation expense, as we believe it is useful to investors. Stock-based compensation not allocated to the reportable segments was approximately $3.5 million and $3.0 million for the first quarter of fiscal 2013 and 2012, respectively.
First Quarter of Fiscal 2013 Fiscal Year End 2012
Nominal Amount Fair Value Nominal Amount Fair Value
Forward contracts:
Purchased $ (39,310 ) $ (226 ) $ (44,089 ) $ 135 Sold $ 54,347 $ (112 ) $ 58,628 $ (212 )

Table of Contents
* We do not anticipate any material adverse effect on our consolidated financial position utilizing our current hedging strategy.
ITEM 4. CONTROLS AND PROCEDURES
(a) Disclosure Controls and Procedures.
The management, with the participation of our Chief Executive Officer and Chief Financial Officer, has evaluated the effectiveness of our disclosure controls and procedures (as such term is defined in Rules 13a-15(e) and 15d-15(e) under the Securities Exchange Act of 1934, as amended (the “Exchange Act”)) as of the end of the period covered by this report. Based on such evaluation, our Chief Executive Officer and Chief Financial Officer have concluded that, as of the end of such period, our disclosure controls and procedures are effective.
(b) Internal Control Over Financial Reporting.
There have not been any changes in our internal control over financial reporting (as such term is defined in Rules 13a-15(f) and 15d-15(f) under the Exchange Act) during the fiscal quarter to which this report relates that have materially affected, or are reasonably likely to materially affect, our internal control over financial reporting.
PART II. OTHER INFORMATION
ITEM 1. LEGAL PROCEEDINGS
From time to time, we are involved in litigation arising out of the ordinary course of our business. There are no material legal proceedings, other than ordinary routine litigation incidental to the business, to which we or any of our subsidiaries is a party or of which any of our or their property is subject.
ITEM 1A. RISK FACTORS
A description of factors that could materially affect our business, financial condition, or operating results is included under “Risk and Uncertainties” in Item 1A of Part I of our 2012 Annual Report on Form 10-K and is incorporated herein by reference. There have been no material changes to the risk factor disclosure since our 2012 Annual Report on Form 10-K. The risk factors described in our Form 10-K are not the only risks facing our Company. Additional risks and uncertainties not currently known to us or that we currently deem to be immaterial also may materially adversely affect our business, financial conditions and/or operating results.
ITEM 6. EXHIBITS
34
3.1 Restated Articles of Incorporation of the Company filed June 25, 1986. (2)
3.2 Certificate of Amendment of Articles of Incorporation of the Company filed October 6, 1988. (2)
3.3 Certificate of Amendment of Articles of Incorporation of the Company filed July 18, 1990. (2)
3.4 Certificate of Amendment of Articles of Incorporation of the Company filed May 29, 2003. (3)

Table of Contents
SIGNATURES
Pursuant to the requirements of the Securities Exchange Act of 1934, the registrant has duly caused this report to be signed on its behalf by the undersigned, thereunto duly authorized.
35
3.5 Certificate of Amendment of Articles of Incorporation of the Company filed March 4, 2004. (4)
3.6 Certificate of Amendment of Articles of Incorporation of the Company filed February 21, 2007. (6)
3.7 Certificate of Amendment of Articles of Incorporation of the Company filed March 20, 2013. (7)
3.8 Bylaws of the Company, amended and restated through May 7, 2013. (5)
4.1 Specimen copy of certificate for shares of Common Stock of the Company. (1)
31.1 Certification of Chief Executive Officer pursuant to Section 302 of the Sarbanes-Oxley Act of 2002 dated May 2, 2013. (8)
31.2 Certification of Chief Financial Officer pursuant to Section 302 of the Sarbanes-Oxley Act of 2002 dated May 2, 2013. (8)
32.1 Certification of Chief Executive Officer pursuant to 18 U.S.C. Section 1350, as adopted pursuant to Section 906 of the Sarbanes-Oxley Act of 2002 dated May 2, 2013. (8)
32.2 Certification of Chief Financial Officer pursuant to 18 U.S.C. Section 1350, as adopted pursuant to Section 906 of the Sarbanes-Oxley Act of 2002 dated May 2, 2013. (8)
101.INS XBRL Instance Document.
101.SCH XBRL Taxonomy Extension Schema Document.
101.CAL XBRL Taxonomy Extension Calculation Linkbase Document.
101.DEF XBRL Taxonomy Extension Definition Document.
101.LAB XBRL Taxonomy Extension Label Linkbase Document.
101.PRE XBRL Taxonomy Extension Presentation Linkbase Document.
(1) Incorporated by reference to exhibit number 4.1 to the registrant’s Registration Statement on Form S-1, as amended (File No. 33-35333), which became effective July 19, 1990.
(2) Incorporated by reference to identically numbered exhibits to the registrant’s Annual Report on Form 10-K for the fiscal year ended January 1, 1999.
(3) Incorporated by reference to exhibit number 3.5 to the registrant’s Quarterly Report on Form 10-Q for the quarter ended July 4, 2003. (4) Incorporated by reference to exhibit number 3.6 to the registrant’s Quarterly Report on Form 10-Q for the quarter ended April 2, 2004. (5) Incorporated by reference to exhibit number 3.2 to the Company’s Current Report on Form 8-K, filed March 20, 2013. (6) Incorporated by reference to exhibit number 3.7 to the Company’s Quarterly Report on Form 10-Q for the quarter ended March 30, 2007. (7) Incorporated by reference to exhibit number 3.1 to the Company’s Current Report on Form 8-K, filed March 20, 2013. (8) Filed herewith.

Table of Contents
DATE: May 2, 2013
36
TRIMBLE NAVIGATION LIMITED
(Registrant)
By: /s/ Rajat Bahri
Rajat Bahri
Chief Financial Officer
(Authorized Officer and Principal
Financial Officer)

Table of Contents
EXHIBIT INDEX .
3.1 Restated Articles of Incorporation of the Company filed June 25, 1986. (2)
3.2 Certificate of Amendment of Articles of Incorporation of the Company filed October 6, 1988. (2)
3.3 Certificate of Amendment of Articles of Incorporation of the Company filed July 18, 1990. (2)
3.4 Certificate of Amendment of Articles of Incorporation of the Company filed May 29, 2003. (3)
3.5 Certificate of Amendment of Articles of Incorporation of the Company filed March 4, 2004. (4)
3.6 Certificate of Amendment of Articles of Incorporation of the Company filed February 21, 2007. (6)
3.7 Certificate of Amendment of Articles of Incorporation of the Company filed March 20, 2013. (7)
3.8 Bylaws of the Company, amended and restated through May 7, 2013. (5)
4.1 Specimen copy of certificate for shares of Common Stock of the Company. (1)
31.1 Certification of Chief Executive Officer pursuant to Section 302 of the Sarbanes-Oxley Act of 2002 dated May 2, 2013. (8)
31.2 Certification of Chief Financial Officer pursuant to Section 302 of the Sarbanes-Oxley Act of 2002 dated May 2, 2013. (8)
32.1 Certification of Chief Executive Officer pursuant to 18 U.S.C. Section 1350, as adopted pursuant to Section 906 of the Sarbanes-Oxley Act of 2002 dated May 2, 2013. (8)
32.2 Certification of Chief Financial Officer pursuant to 18 U.S.C. Section 1350, as adopted pursuant to Section 906 of the Sarbanes-Oxley Act of 2002 dated May 2, 2013. (8)
101.INS XBRL Instance Document.
101.SCH XBRL Taxonomy Extension Schema Document.
101.CAL XBRL Taxonomy Extension Calculation Linkbase Document.
101.DEF XBRL Taxonomy Extension Definition Document.
101.LAB XBRL Taxonomy Extension Label Linkbase Document.
101.PRE XBRL Taxonomy Extension Presentation Linkbase Document.
(1) Incorporated by reference to exhibit number 4.1 to the registrant’s Registration Statement on Form S-1, as amended (File No. 33-35333), which became effective July 19, 1990.
(2) Incorporated by reference to identically numbered exhibits to the registrant’s Annual Report on Form 10-K for the fiscal year ended January 1, 1999.
(3) Incorporated by reference to exhibit number 3.5 to the registrant’s Quarterly Report on Form 10-Q for the quarter ended July 4, 2003. (4) Incorporated by reference to exhibit number 3.6 to the registrant’s Quarterly Report on Form 10-Q for the quarter ended April 2, 2004. (5) Incorporated by reference to exhibit number 3.2 to the Company’s Current Report on Form 8-K, filed March 20, 2013. (6) Incorporated by reference to exhibit number 3.7 to the Company’s Quarterly Report on Form 10-Q for the quarter ended March 30, 2007. (7) Incorporated by reference to exhibit number 3.1 to the Company’s Current Report on Form 8-K, filed March 20, 2013. (8) Filed herewith.

37

Exhibit 31.1
CERTIFICATION OF CHIEF EXECUTIVE OFFICER PURSUANT T O SECTION 302 OF THE SARBANES-OXLEY ACT OF 2002
I, Steven W. Berglund, certify that:
1. I have reviewed this quarterly report on Form 10-Q of Trimble Navigation Limited;
2. Based on my knowledge, this report does not contain any untrue statement of a material fact or omit to state a material fact necessary to make the statements made, in light of the circumstances under which such statements were made, not misleading with respect to the period covered by this report;
3. Based on my knowledge, the financial statements, and other financial information included in this report, fairly present in all material respects the financial condition, results of operations and cash flows of the registrant as of, and for, the periods presented in this report;
4. The registrant’s other certifying officer(s) and I are responsible for establishing and maintaining disclosure controls and procedures (as defined in Exchange Act Rules 13a-15(e) and 15d-15(e)) and internal control over financial reporting (as defined in Exchange Act Rules 13a-15(f) and 15d-15(f)) for the registrant and have:
a) Designed such disclosure controls and procedures, or caused such disclosure controls and procedures to be designed under our supervision, to ensure that material information relating to the registrant, including its consolidated subsidiaries, is made known to us by others within those entities, particularly during the period in which this report is being prepared;
b) Designed such internal control over financial reporting, or caused such internal control over financial reporting to be designed under our supervision, to provide reasonable assurance regarding the reliability of financial reporting and the preparation of financial statements for external purposes in accordance with generally accepted accounting principles;
c) Evaluated the effectiveness of the registrant’s disclosure controls and procedures and presented in this report our conclusions about the effectiveness of the disclosure controls and procedures, as of the end of the period covered by this report based on such evaluation; and
d) Disclosed in this report any change in the registrant’s internal control over financial reporting that occurred during the registrant’s most recent fiscal quarter (the registrant’s fourth fiscal quarter in the case of an annual report) that has materially affected, or is reasonably likely to materially affect, the registrant’s internal control over financial reporting; and
5. The registrant’s other certifying officer(s) and I have disclosed, based on our most recent evaluation of internal control over financial reporting, to the registrant’s auditors and the audit committee of the registrant’s board of directors (or persons performing the equivalent functions):
a) All significant deficiencies and material weaknesses in the design or operation of internal control over financial reporting which are reasonably likely to adversely affect the registrant’s ability to record, process, summarize and report financial information; and
b) Any fraud, whether or not material, that involves management or other employees who have a significant role in the registrant’s internal control over financial reporting.
Date: May 2, 2013 /s/ Steven W. Berglund
Steven W. Berglund
Chief Executive Officer

Exhibit 31.2
CERTIFICATION OF CHIEF EXECUTIVE OFFICER PURSUANT T O SECTION 302 OF THE SARBANES-OXLEY ACT OF 2002
I, Rajat Bahri, certify that:
1. I have reviewed this quarterly report on Form 10-Q of Trimble Navigation Limited;
2. Based on my knowledge, this report does not contain any untrue statement of a material fact or omit to state a material fact necessary to make the statements made, in light of the circumstances under which such statements were made, not misleading with respect to the period covered by this report;
3. Based on my knowledge, the financial statements, and other financial information included in this report, fairly present in all material respects the financial condition, results of operations and cash flows of the registrant as of, and for, the periods presented in this report;
4. The registrant’s other certifying officer(s) and I are responsible for establishing and maintaining disclosure controls and procedures (as defined in Exchange Act Rules 13a-15(e) and 15d-15(e)) and internal control over financial reporting (as defined in Exchange Act Rules 13a-15(f) and 15d-15(f)) for the registrant and have:
a) Designed such disclosure controls and procedures, or caused such disclosure controls and procedures to be designed under our supervision, to ensure that material information relating to the registrant, including its consolidated subsidiaries, is made known to us by others within those entities, particularly during the period in which this report is being prepared;
b) Designed such internal control over financial reporting, or caused such internal control over financial reporting to be designed under our supervision, to provide reasonable assurance regarding the reliability of financial reporting and the preparation of financial statements for external purposes in accordance with generally accepted accounting principles;
c) Evaluated the effectiveness of the registrant’s disclosure controls and procedures and presented in this report our conclusions about the effectiveness of the disclosure controls and procedures, as of the end of the period covered by this report based on such evaluation; and
d) Disclosed in this report any change in the registrant’s internal control over financial reporting that occurred during the registrant’s most recent fiscal quarter (the registrant’s fourth fiscal quarter in the case of an annual report) that has materially affected, or is reasonably likely to materially affect, the registrant’s internal control over financial reporting; and
5. The registrant’s other certifying officer(s) and I have disclosed, based on our most recent evaluation of internal control over financial reporting, to the registrant’s auditors and the audit committee of the registrant’s board of directors (or persons performing the equivalent functions):
a) All significant deficiencies and material weaknesses in the design or operation of internal control over financial reporting which are reasonably likely to adversely affect the registrant’s ability to record, process, summarize and report financial information; and
b) Any fraud, whether or not material, that involves management or other employees who have a significant role in the registrant’s internal control over financial reporting.
Date: May 2, 2013 /s/ Rajat Bahri
Rajat Bahri
Chief Financial Officer

Exhibit 32.1
CERTIFICATION OF CEO PURSUANT TO 18 U.S.C. SECTION 1350, AS ADOPTED PURSUANT TO SECTION 906 OF THE SARBANES-OXLEY ACT OF 2002
In connection with the Quarterly Report on Form 10-Q of Trimble Navigation Limited (the “Company”) for the period ended March 29, 2013 as filed with the Securities and Exchange Commission on the date hereof (the “Report”), Steven W. Berglund, as Chief Executive Officer of the Company, hereby certifies, pursuant to 18 U.S.C. Section 1350, as adopted pursuant to Section 906 of the Sarbanes-Oxley Act of 2002, to the best of his knowledge, that:
May 2, 2013
(1) the Report fully complies with the requirements of Section 13(a) or 15(d) of the Securities Exchange Act of 1934, and
(2) the information contained in the Report fairly presents, in all material respects, the financial condition and results of operations of the Company.
/s/ Steven W. Berglund
Steven W. Berglund
Chief Executive Officer
Exhibit 32.2
CERTIFICATION OF CEO PURSUANT TO 18 U.S.C. SECTION 1350, AS ADOPTED PURSUANT TO SECTION 906 OF THE SARBANES-OXLEY ACT OF 2002
In connection with the Quarterly Report on Form 10-Q of Trimble Navigation Limited (the “Company”) for the period ended March 29, 2013 as filed with the Securities and Exchange Commission on the date hereof (the “Report”), Rajat Bahri, as Chief Financial Officer of the Company, hereby certifies, pursuant to 18 U.S.C. Section 1350, as adopted pursuant to Section 906 of the Sarbanes-Oxley Act of 2002, to the best of his knowledge, that:
May 2, 2013
(1) the Report fully complies with the requirements of Section 13(a) or 15(d) of the Securities Exchange Act of 1934, and
(2) the information contained in the Report fairly presents, in all material respects, the financial condition and results of operations of the Company.
/s/ Rajat Bahri
Rajat Bahri
Chief Financial Officer