casella waste systems, inc. -...
TRANSCRIPT

RESOURCE SOLUTIONSZERO-SORT® RECYCLING • COLLECTION • ORGANICS • ENERGY • LANDFILLS
RESOURCE SOLUTIONSCASELLA RESOURCE SOLUTIONS
2015ANNUAL REPORT
COMMUNITY ENGAGEMENTGREEN TEAMS
TECHNOLOGY
MASSACHUSETTS RM PROGRAMS
INTEGRATED SERVICES
MAINE
LEADERSHIP DEVELOPMENT
ENHANCED LANDFILL RETURNS
SAFETYENERGY
EXECUTION
RELIABLE
PROFITABILITY
IMPROVED COLLECTIONSUSTAINABILITY – ENVIRONMENTAL AND ECONOMIC
VERMONTNEW YORK
EXPERTISERENEWAL ECONOMY
FOCUS ON SAFETY
RESPONSIBILITY
CORE VALUES
RESIDUALS MANAGEMENT
MARKET DRIVEN STRATEGY
REDUCED RISKGREATER FREE CASH FLOW
DISCIPLINED CAPITAL STRATEGY COMPOSTING
HOLISTIC STRATEGY
PRICING DISCIPLINE
NEW HAMPSHIRESOIL
TEAM
WELL POSITIONED ASSETS
TEAMWORK
GROWSTRATEGY
PENNSYLVANIA
FLEET PLANRESOURCE RENEWAL GOALS
LOWER MAINTENANCE COSTSTRAINING
REDUCED COMMODITY RISK
GROWTH
ENERGY PRODUCTIONMARGIN IMPROVEMENT
VALUE
VOLUMESSTRATEGY
RETURNS
PA
ALIGNED INCENTIVES SERVICE
LANDFILLS
COMPANY CULTURELANDFILL VOLUMES COMPRESSED NATURAL GAS
SUSTAINING OUR PLANET
COMMODITY MARKETS
RECYCLINGEMPLOYEE
MARGIN GROWTH
DEVELOPING HIGH IMPACT LEADERSENHANCED MEASUREMENT AND MONITORING
SERVING COMMUNITIES
CUSTOMER CARE
FUEL EFFICIENCY
PAPER
MANAGERSUCCESS
PROFITABLE VOLUME RISK MANAGEMENT
UNIFIED
BALANCE
STAKEHOLDER
LEADERS
OUR PEOPLE
OUR RESPONSIBILITYFOCUS ON QUALITY
BALE
CARE
FOCUS
PLASTIC2018
CORE
MAEXCELPERFORMCELEBRATE
WELLNESS
AWARDSFACILITIES
DIGESTERCLIMATE
METAL
FLEET
WORK
STRATEGIES
COMMITMENT
PERFORMANCECOMMUNITIESTRUCK AUTOMATION
MANUFACTURING
OUR SOLUTIONS
CULTURE
REVENUE GROWTHCORE PERFORMANCE
LONG TERM VALUE CREATION PRICING
ZERO WASTESTRATEGIC SOURCINGSOLAR
CLOSED LOOP RECYCLING SYSTEMS
RESOURCE RECOVERY
CAPTURING VALUE FROM WASTE
ROBUST TRANSFER NETWORKENVIRONMENT SINGLE BIN
TECHNOLOGY
RENEWABLE ENERGY PARK
LAND APPLICATION
PASSIONATE PEOPLE
ELECTRICITY
INTERNALIZED MATERIALS
IMPROVED BALANCE SHEETLANDFILL SOLAR FARM
TRAINING
EVOLVE
GREENHOUSE GAS REDUCTION
LANDFILL GAS-TO-ENERGY

CASELLA WASTE SYSTEMS, INC.2015 ANNUAL REPORT

We just completed our 40th year of operations in early 2016, and I am happy to report that the execution of our business strategy is driving improved financial results and increased shareholder returns. It is truly an exciting time for Casella.
Just over three-and-a-half years ago, we laid out a comprehensive strategy and plan to improve our financial and operating performance. Pursuant to our plan, we have refocused the company while simplifying our business structure.
We have improved our financial and operating performance and reduced exposure to risk by divesting or closing operations that did not fit within our core strategy and by focusing management’s attention and Casella’s capital resources on core operations to drive continued growth. By focusing on our core operations, we have significantly improved our financial and operating performance, and we believe that our focused strategy provides a strong backbone for additional value creation.
We believe we have executed extremely well against our plan, as demonstrated in our improved financial performance.
1
NEXT STEPS: CONTINUE TO IMPROVE FREE CASH FLOW, FURTHER REDUCING LEVERAGE
Following the substantial completion of the priorities established in 2013, starting in August 2015 we focused our efforts on further improving Free Cash Flow and reducing debt leverage by targeting the following areas:
• Increasing landfill returns by maximizing annual capacity utilization in our Western Region and by driving pricing in excess of inflation in the disposal capacity constrained markets in our Eastern Region;
1 Please refer to pages 145-146 of this annual report for a reconciliation of Adjusted EBITDA to the most directly comparable GAAP measure, which is net loss. Net loss was ($54.5)mm for the fiscal year ended 4/30/13, ($27.4)mm for the fiscal year ended 4/30/14, ($29.1)mm for the unaudited calendar year ended 12/31/14, ($11.8)mm for the fiscal year ended 12/31/15, and ($7.2)mm for the 12 months ended 6/30/16.
TO OUR FELLOW SHAREHOLDERS:

• Driving additional profitability in our collection operations through profitable revenue growth, operating efficiencies and selling or swapping under-performing routes or operations;
• Creating incremental value through our resource solutions offerings in our recycling, organics, and customer solutions operations; and
• Improving our balance sheet and reducing risk through continued capital discipline and a focus on debt repayment with excess cash flows.
INCREASING LANDFILL RETURNS
As the Northeast disposal markets have continued to tighten due to the permanent closure of various competitor disposal sites, we further advanced our landfill strategy over the last year with higher pricing and increased volumes.
Since we launched our strategy in early 2013, we have increased annual landfill volumes by approximately 843,000 tons per year (or +23.7%) from the fiscal year ended April 30, 2013 to the 12 months ended June 30, 2016. We have driven this volume growth through our focused landfill sales strategy, building our special waste capabilities, as well as our landfill asset positioning in the marketplace. At the same time that we sourced additional volumes, we also increased average price per ton at our landfills by 3.4% as we advanced our focus on landfill pricing in select markets, and improved the mix of customers and materials at key sites.
We expect these positive trends to continue for us over the next several years as disposal capacity constraints become more acute across our footprint, and we remain focused on executing against our disposal strategy.
Further, we recently received three important landfill permits that will help us to drive additional value:
• In January 2016, we received a minor-modification at our Hyland landfill to expand the annual permit limit from 312,000 tons per year to 465,000 tons per year.
• In January 2016, the Ontario County landfill received the final permit for a +15.7 million cubic yard expansion, which provides for an additional estimated 13 years of potential airspace at the site.
• In June 2016, the Chemung County landfill received a permit for an +8.2 million cubic yard expansion, which provides for an additional estimated 14 years of potential airspace at the site. The permit also included an increase to the annual permit of 237,000 tons per year.
DRIVING ADDITIONAL PROFITABILITY IN COLLECTION OPERATIONS
We continued to make great progress on our second major objective of driving additional profitability in our collection operations. Our focus here is on core blocking-and-tackling; namely a focus on pricing, route optimization, fleet standardization, and maintenance.
The disposal capacity constraints in the Northeast markets are also providing a positive back-drop for us to advance pricing increases in the collection line-of-business.
Within the context of this rapidly improving market-place, we have continued to advance hauling price increases in the residential and commercial lines-of-business with only limited price roll-backs. In fiscal year 2015, combined residential and commercial collection pricing was up 4.5%,

and it was up 5.7% for the twelve months ended June 30, 2016, the strongest pricing execution that we have experienced in the last 10 years.
On the operating side, we continued to advance a number of key initiatives to further improve our operating costs in the collection line-of-business. We are in the second year of our five year comprehensive fleet plan, which is designed to simplify our fleet and target truck replacements to maximize returns, reduce our operating expenses through lower maintenance costs, and improve our service levels through decreased down time.
The combination of our robust pricing programs and these operating initiatives are driving improved results in our collection line-of-business, with our cost of operations as a percentage revenues down 540 basis points from our fiscal year 2014 to the twelve months ended June 30, 2016.
CREATING INCREMENTAL VALUE THROUGH RESOURCE SOLUTIONS
One of the key objectives of our strategy is to differentiate ourselves in the marketplace by offering value-added resource solutions to our customers. These solutions range from our Customer Solutions business, which provides professional services to large industrial customers, to our Organics business, which is the leader in organics processing and disposal in the Northeast, to our market leading recycling business.
Our Customer Solutions business continued to improve margins and returns over the last year, as we further transformed the business from the legacy brokerage model to a professional services organization focused on large industrial and institutional accounts.
Over the last year, our Organics business effectively capitalized on the rapidly changing disposal and regulatory environment for biosolids across the northeast by securing several new long-term contracts and advancing pricing.
Our Recycling business has faced significant headwinds over the last two years as the slowing global economy, lower oil prices, and the strong U.S. dollar have all weighed heavily on commodity pricing. As such, our average commodity revenue per ton has declined approximately 30% over the last two years.
However, we did not sit idly by and hope that the markets were going to recover; we took swift action to reshape our recycling model to earn an appropriate return on our infrastructure investments through all market cycles.
This effort included the implementation of higher tipping fees at our recycling facilities. Another critical step that we took was the implementation of our new Sustainability Recycling Adjustment Fee or “SRA Fee.” The SRA Fee is similar to a fuel surcharge where it floats inversely to changes in recycling commodity prices.
Our efforts have worked extremely well, and I am proud to say that we have improved operating income and returns in the recycling business over the last year despite the significant headwinds that we faced from a commodity price standpoint.
IMPROVING BALANCE SHEET AND REDUCING RISK
Over the last three-and-a-half years we have made great progress improving our asset mix, reducing risk and improving financial performance by divesting non-core operations, increasing

our capital hurdle rates, and refocusing capital investment into select core operations. Going forward, we continue to focus in these key areas to drive additional shareholder value and to further reduce risk.
We further reduced our balance sheet risk with the refinancing of our senior secured credit facility in March 2015, with a new ABL Revolver. This refinancing extended our debt maturity by 5 years, minimized cash interest costs, and increased our financial flexibility by enabling us to pay-down our highest cost junior debt as long as we maintain a minimum threshold availability.
Through our continued cash flow growth and debt repayment, we reduced our consolidated leverage ratio as defined by our ABL Revolver from 5.43x on March 31, 2015 to 4.43x on June 30, 2016; and we reduced our total debt by $29.6 million over the same period2. We have clearly demonstrated our commitment to reduce debt leverage through permanent debt repayment by utilizing our Free Cash Flow to repurchase and permanently retired our 7.75% senior subordinated notes.
While we still have work left to accomplish to further improve our operating performance and to drive higher cash flows, we are excited about our progress to date against our key strategies, and we believe that we are well positioned to further these efforts over the next several years.
Sincerely,
John W. Casella
Chairman and Chief Executive Officer September 29, 2016
2 “Consolidated Leverage Ratio” is defined in our Loan & Security Agreement dated as of February 27, 2015 (“ABL Revolver”) as the ratio of Consolidated Funded Debt to Consolidated EBITDA. Please refer to pages 145-146 of this annual report for a reconciliation of Consolidated EBITDA to the most directly comparable GAAP measure, which is net cash provided by operating activities.

UNITED STATES SECURITIES AND EXCHANGE COMMISSION
Washington, D.C. 20549
FORM 10-K (Mark One) ANNUAL REPORT PURSUANT TO SECTION 13 OR 15(d) OF THE SECURITIES EXCHANGE
ACT OF 1934 For the fiscal year ended December 31, 2015
Or TRANSITION REPORT PURSUANT TO SECTION 13 OR 15(d) OF THE SECURITIES
EXCHANGE ACT OF 1934 For the transition period from to
Commission file number 000-23211
CASELLA WASTE SYSTEMS, INC. (Exact name of registrant as specified in its charter)
Delaware 03-0338873(State or other jurisdiction of
incorporation or organization)(I.R.S. Employer
Identification No.)
25 Greens Hill Lane, Rutland, VT 05701(Address of principal executive offices) (Zip Code)
Registrant’s telephone number, including area code: (802) 775-0325 Securities registered pursuant to Section 12(b) of the Act:
Title of each class Name of each exchange on which registeredClass A common stock, $.01 per share par value The NASDAQ Stock Market LLC
(NASDAQ Global Select Market)Securities registered pursuant to Section 12(g) of the Act:
None.
Indicate by check mark if the registrant is a well-known seasoned issuer, as defined in Rule 405 of the Securities Act. Yes No
Indicate by check mark if the registrant is not required to file reports pursuant to Section 13 or Section 15(d) of the Act. Yes No
Indicate by checkmark whether the registrant (1) has filed all reports required to be filed by Section 13 or 15(d) of the Securities Exchange Act of 1934 during the preceding 12 months (or such shorter period that the registrant was required to file such reports), and (2) has been subject to such filing requirements for the past 90 days. Yes No
Indicate by check mark whether the registrant has submitted electronically and posted on its corporate Website, if any, every Interactive Data File required to be submitted and posted pursuant to Rule 405 of Regulation S-T (§232.405 of this chapter) during the preceding 12 months (or for such shorter period that the registrant was required to submit and post such files). Yes No
Indicate by check mark if disclosure of delinquent filers pursuant to Item 405 of Regulation S-K is not contained herein, and will not be contained, to the best of the registrant’s knowledge, in definitive proxy or information statements incorporated by reference in Part III of this Form 10-K or any amendment to this Form 10-K.
Indicate by check mark whether the registrant is a large accelerated filer, an accelerated filer, a non-accelerated filer, or a smaller reporting company. See the definitions of “large accelerated filer”, “accelerated filer” and “smaller reporting company” in Rule 12b-2 of the Exchange Act. (Check One):
Large accelerated filer Accelerated filer
Non-accelerated filer (Do not check if a smaller reporting company) Smaller reporting company
Indicate by check mark whether the registrant is a shell company (as defined in Rule 12b-2 of the Exchange Act). Yes No
The aggregate market value of the common equity held by non-affiliates of the registrant, based on the last reported sale price of the registrant’s Class A common stock on the NASDAQ Stock Market at the close of business on June 30, 2015 was approximately $213.1 million. The registrant does not have any non-voting common stock outstanding.
There were 40,064,411 shares of Class A common stock, $.01 par value per share, of the registrant outstanding at January 29, 2016. There were 988,200 shares of Class B common stock, $.01 par value per share, of the registrant outstanding at January 29, 2016.
Documents Incorporated by Reference
Part III of this Annual Report on Form 10-K incorporates by reference information from the definitive Proxy Statement for the registrant’s 2016 Annual Meeting of Stockholders or a Form10-K/A to be filed with the Securities and Exchange Commission not later than 120 days after the registrant’s fiscal year ended December 31, 2015.

PART I.
ITEM 1. BUSINESS 3
ITEM 1A. RISK FACTORS 19
ITEM 1B. UNRESOLVED STAFF COMMENTS 26
ITEM 2. PROPERTIES 26
ITEM 3. LEGAL PROCEEDINGS 26
ITEM 4. MINE SAFETY DISCLOSURES 28
PART II.
ITEM 5. MARKET FOR REGISTRANT’S COMMON EQUITY, RELATED STOCKHOLDER MATTERS AND ISSUER PURCHASES OF EQUITY SECURITIES 29
ITEM 6. SELECTED CONSOLIDATED FINANCIAL DATA 31
ITEM 7. MANAGEMENT’S DISCUSSION AND ANALYSIS OF FINANCIAL CONDITION AND RESULTS OF OPERATIONS 32
ITEM 7A. QUANTITATIVE AND QUALITATIVE DISCLOSURES ABOUT MARKET RISK 69
ITEM 8. FINANCIAL STATEMENTS AND SUPPLEMENTARY DATA 71
ITEM 9. CHANGES IN AND DISAGREEMENTS WITH ACCOUNTANTS ON ACCOUNTING AND FINANCIAL DISCLOSURE 134
ITEM 9A. CONTROLS AND PROCEDURES 134
PART III.
ITEM 10 DIRECTORS, EXECUTIVE OFFICERS AND CORPORATE GOVERNANCE 134
ITEM 11 EXECUTIVE COMPENSATION 134
ITEM 12 SECURITY OWNERSHIP OF CERTAIN BENEFICIAL OWNERS AND MANAGEMENT AND RELATED STOCKHOLDER MATTERS 135
ITEM 13 CERTAIN RELATIONSHIPS AND RELATED TRANSACTIONS, AND DIRECTOR INDEPENDENCE 135
ITEM 14 PRINCIPAL ACCOUNTANT FEES AND SERVICES 135
PART IV.
ITEM 15. EXHIBITS AND FINANCIAL STATEMENT SCHEDULE 136
SIGNATURES 137
SCHEDULE II – VALUATION AND QUALIFYING ACCOUNTS 138
EXHIBIT INDEX 139
CASELLA WASTE SYSTEMS, INC.
ANNUAL REPORT ON FORM 10-K
TABLE OF CONTENTS

3
3
PART I
Unless the context requires otherwise, all references in this Annual Report on Form 10-K to “Casella Waste Systems, Inc.,” “Casella,”the “Company,” “we,” “us,” and “our” refer to Casella Waste Systems, Inc. and its consolidated subsidiaries.
Forward-Looking Statements
This Annual Report on Form 10-K contains or incorporates a number of forward-looking statements within the meaning of Section 27A of the Securities Act of 1933, as amended, and Section 21E of the Securities Exchange Act of 1934, as amended, including statements regarding:
• expected liquidity and financing plans;
• expected future revenues, operations, expenditures and cash needs;
• fluctuations in the commodity pricing of our recyclables, increases in landfill tipping fees and fuel costs and general economic and weather conditions;
• projected future obligations related to final capping, closure and post-closure costs of our existing landfills and any disposal facilities which we may own or operate in the future;
• our ability to use our net operating losses and tax positions;
• our ability to service our debt obligations;
• the projected development of additional disposal capacity or expectations regarding permits for existing capacity;
• the recoverability or impairment of any of our assets or goodwill;
• estimates of the potential markets for our products and services, including the anticipated drivers for future growth;
• sales and marketing plans or price and volume assumptions;
• the outcome of any legal or regulatory matter;
• actions of activist investors and the cost and disruption of responding to those actions;
• potential business combinations or divestitures; and
• projected improvements to our infrastructure and impact of such improvements on our business and operations.
In addition, any statements contained in or incorporated by reference into this report that are not statements of historical fact should be considered forward-looking statements. You can identify these forward-looking statements by the use of the words “believes”, “expects”, “anticipates”, “plans”, “may”, “will”, “would”, “intends”, “estimates” and other similar expressions, whether in thenegative or affirmative. These forward-looking statements are based on current expectations, estimates, forecasts and projections about the industry and markets in which we operate, as well as management’s beliefs and assumptions, and should be read in conjunction with our consolidated financial statements and notes thereto. We cannot guarantee that we actually will achieve the plans, intentions or expectations disclosed in the forward-looking statements made. The occurrence of the events described and the achievement of the expected results depends on many events, some or all of which are not predictable or within our control. Actual results may differ materially from those set forth in the forward-looking statements.
There are a number of important risks and uncertainties that could cause our actual results to differ materially from those indicated by such forward-looking statements. These risks and uncertainties include, without limitation, those detailed in Item 1A, “Risk Factors”of this Annual Report on Form 10-K. We explicitly disclaim any obligation to update any forward-looking statements whether as aresult of new information, future events or otherwise, except as otherwise required by law.
ITEM 1. BUSINESS
Overview
Founded in 1975 with a single truck, Casella Waste Systems, Inc., a Delaware corporation, its wholly-owned subsidiaries and certain partially owned entities over which it has a controlling financial interest (collectively, “we”, “us” or “our”), is a regional, vertically-integrated solid waste services company. We provide resource management expertise and services to residential, commercial, municipal and industrial customers, primarily in the areas of solid waste collection and disposal, transfer, recycling and organics services. We provide integrated solid waste services in six states: Vermont, New Hampshire, New York, Massachusetts, Maine and Pennsylvania, with our headquarters located in Rutland, Vermont. We manage our solid waste operations on a geographic basis

4
4
through two regional operating segments, the Eastern and Western regions, each of which provides a full range of solid waste services, and our larger-scale recycling and commodity brokerage operations through our Recycling segment. Organics services, ancillary operations, industrial services, discontinued operations, and earnings from equity method investees, as applicable, are included in our Other segment.
As of January 29, 2016, we owned and/or operated 34 solid waste collection operations, 44 transfer stations, 18 recycling facilities,nine Subtitle D landfills, four landfill gas-to-energy facilities and one landfill permitted to accept construction and demolition (“C&D”) materials.
Change in Fiscal Year
In June 2014, we elected to change our fiscal year-end from April 30th to December 31st. This change in fiscal year became effective for our fiscal year beginning January 1, 2015 and ended December 31, 2015. As a result of this change, we filed a Transition Report on Form 10-KT for the eight-month transition period ended December 31, 2014. The references in this Annual Report on Form 10-K to the terms listed below reflect the respective period noted (all other reporting periods defined separately):
Term Financial Reporting Period
fiscal year 2015 January 1, 2015 through December 31, 2015 calendar year 2014 January 1, 2014 through December 31, 2014 (Unaudited) transition period 2014 May 1, 2014 through December 31, 2014 eight month period 2013 May 1, 2013 through December 31, 2013 (Unaudited) fiscal year 2014 May 1, 2013 through April 30, 2014 fiscal year 2013 May 1, 2012 through April 30, 2013
Strategy
Our goal is to build a sustainable and profitable company by providing exemplary service to our customers, while operating safe and environmentally sound facilities. Over the last several years, many of our customers have been seeking to reduce their environmental footprint by increasing their recycling rates, diverting organics materials out of the waste stream into beneficial use processes and exploring emerging methods to transform traditional waste streams into renewable resources. Since we first began operating in Vermont in 1975, our business strategy has been firmly tied to creating a sustainable resource management model and we continue to be rooted in these same tenets today. We strive to create long-term value for all of our stakeholders, including customers, employees,communities and shareholders.
Our primary objective is to maximize long-term shareholder value through a combination of financial performance and strategic assetpositioning. Annually, we complete a comprehensive strategic planning process to assess and refine our strategic objectives in the context of our asset mix and the current market environment. This process helps the management team allocate resources to a range of business opportunities in order to strive to maximize long-term financial returns and competitive positioning.
Over the last three years we have made significant progress in simplifying our business structure, improving cash flows and reducing risk exposure by divesting and closing underperforming operations that did not enhance or complement our core operations. Specifically, we have had success over the last three years improving our financial performance and driving positive cash flows by advancing efforts in four key areas: (1) increasing landfill returns; (2) driving additional profitability at collection operations; (3) creating incremental value through resource solutions; and (4) improving our balance sheet and reducing business risk. We plan to continue to focus our efforts in these areas in the fiscal year ending December 31, 2016. To support our efforts, we continue to invest in our employees through leadership development, technical training, and incentive compensation structures that seek to align our employees’ incentives with our long-term goal to improve returns on invested capital.
Increasing landfill returns
We launched a strategic initiative in fiscal year 2014 to source incremental waste volumes to our landfills to maximize annual capacity utilization and increase cash flows. Our goal was to increase waste volumes by 0.5 million tons annually to our landfills by the end of fiscal year 2015. As of December 31, 2015, we had exceeded this goal, with overall landfill volumes for fiscal year 2015 up by approximately 0.8 million tons per year compared to the twelve months ended December 31, 2012, excluding volumes from the Worcester landfill closure project in Massachusetts.
Landfill waste volume increases have been primarily driven by: (1) our success in acquiring new transfer station and hauling customers; (2) increasing waste volumes at our Southbridge landfill (“Southbridge”) in Southbridge, Massachusetts and our WasteUSA landfill (“Waste USA”) in Coventry, Vermont, in accordance with increased annual permit limits; (3) increasing C&D volumes

55
as the construction market began to slowly rebound across several of our market areas; (4) our focused landfill sales strategy, which included the revamping of our special waste team to focus on sourcing additional industrial and remediation waste volumes; and (5) our asset positioning in several key markets that have contracting permitted capacity.
Disposal market dynamics have quickly shifted across our footprint due to improving macroeconomic conditions and a challenging regulatory environment for new disposal capacity. In total, facilities that we estimate had approximately 1.7 million tons of annual disposal capacity have permanently closed in Massachusetts, Maine, New Hampshire, and Vermont over the last two years, and we expect that facilities with another 1.2 million tons of additional annual capacity will permanently close over the next several years. These closures and expected closures represent a reduction of over 20% of total market capacity across these states. Furthermore, we expect that waste flow shifts in New York State and additional facility closures in contiguous markets will keep more waste volumes in the market for ultimate disposal over the next 20 years, further tightening available market capacity.
Given this backdrop, we shifted our landfill strategy in transition period 2014 to balance sourcing additional volumes against improving pricing and returns at our landfills. While we believe it will take several years for the capacity constraints in our markets to become acute, we experienced tightening pricing elasticity in our markets over the last year, which has enabled us to begin increasing disposal prices in excess of the Consumer Price Index in several of our markets. In fiscal year 2015, our average price per ton at our landfills was up 3.7% over the prior period as we increased tipping fees and improved the mix of materials.
We continue to work on strategies to source additional waste volumes to our landfills by increasing our geographic reach through the use of rail transportation and accessing new end-markets.
Driving additional profitability at collection operations
Over the last three years we have developed and implemented a number of programs designed to improve profitability and returns in the collection line-of-business, including: pricing yield analytics; new sales force incentives; route profitability analytics; on-route sales and marketing initiatives; a comprehensive fleet strategy; and selling or swapping underperforming routes or operations.
Our local collection teams have moved pricing from an annual process to a core process that is continually reviewed and adjustedthroughout the year. Our division management and sales teams use our customer profitability analytics tool to calculate customer level profitability and increase pricing, where appropriate, to offset cost increases. We continue to yield success from our collection pricing programs, with commercial and residential collection price growth of 4.5% in fiscal year 2015.
We attempt to offset core inflationary pressures on an ongoing basis. In fiscal year 2015, we implemented the Sustainability RecyclingAdjustment fee (“SRA fee”) to dynamically adjust residential and commercial collection pricing for monthly changes in recyclingcommodity prices. The SRA fee has been well received by our customers and is helping to offset significant commodity price headwinds.
During fiscal year 2014, we adjusted our sales force incentive compensation program to better support our efforts to drive responsibility to the local operating level. We introduced a uniform commission structure tracking and payment system to help our local teams administer customized commission structures for each sales representative, while maintaining a consistent system to track performance.
Collection routes are the basic building blocks of our solid waste business and we believe that it is imperative that we seek to ensure that each route is profitable and covers the cost of truck and container capital. In order to achieve this goal we developed andimplemented a route profitability tool to help our operating teams analyze and improve their routing productivity and profitability.With the help of this tool, we increased the frequency of re-routing existing customers to improve efficiencies and take trucks off the road. In addition, we routinely evaluate on an account-by-account basis existing customer service levels, service types, equipmentselection and truck type selection to seek to ensure that we are maximizing profitability and asset utilization. To further improve route density, we focus our marketing and sales efforts on existing routes.
To augment our operating efforts, we implemented a comprehensive fleet plan during transition period 2014 to define our fleet standards and specifically target truck replacements to maximize returns. We believe that this plan will help us to reduce our operating costs and improve our capital efficiency by reducing downtime and maintenance costs and improving service levels.
Differentiating business with resource solutions
To complement our traditional solid waste offerings, we have developed a set of resource solutions and invested in select assets that are intended to enhance our ability to support emerging customer and market needs. Our resource solutions strategy seeks to leverage our core competencies across our operating segments in materials processing, industrial recycling, clean energy, and organics serviceofferings in order to generate additional value from the waste stream for our customers. In fiscal year 2015, 25.4% of our revenues were generated by our Recycling, Customer Solutions and Organics businesses in the aggregate.

6
6
For nearly 40 years, we have been a leader in providing recycling services to our customers. We currently own or operate six material recovery facilities (“MRFs”) that use our Zero-Sort Recycling process, which we own or operate under long-term operating agreements. With Zero-Sort Recycling, customers can commingle all of their recyclables (paper, cardboard, plastics, metals, andglass) into a single, right-sized residential or commercial container. By making it easier for a customer to recycle, we have increased recycling participation and yields, thereby increasing volumes through our MRFs and enhancing asset utilization.
The average mix of recycling commodities generated by residential and commercial customers has historically sold at an average price that covered the cost of processing the materials, including an adequate return on the processing equipment, facilities, and rolling stock necessary to process the recyclables. Since 2011, recycling commodity prices have declined by approximately 60% to historically low levels as global demand for fiber and metal materials has significantly dropped and plastics pricing has declined with lower crude oil pricing. Roughly half of this decline in recycling commodity pricing has occurred since the beginning of fiscal year 2015.
At current recycling commodity pricing levels, we are not generating adequate revenue from the sale of these commodities to coverthe cost of processing the materials or generating a positive return on our investment in recycling infrastructure. In order to continue to provide these necessary services to our residential, commercial, municipal, and industrial customers, we have readdressed our pricing model for these services by introducing the SRA fee in fiscal year 2015.
Our Customer Solutions business works with our industrial services, including multi-location customers, colleges and universities,municipalities, and industrial customers to develop customized comprehensive solid waste solutions. The focus of this group is to help these large scale organizations achieve waste reduction and diversion goals to meet their economic and environmental objectives. We believe that we differentiate our services from our competitors by providing a personalized set of resource solutions, which enables us to win new business, including traditional solid waste collection and disposal customers.
Our Organics business provides transportation, disposal and resource solutions to waste water treatment facilities across the northeast. In fiscal year 2015, our operations managed approximately 0.7 million tons of biosolids, with 0.2 million tons of this materialinternalized to our landfills and 0.4 million tons transformed into renewable products for fertilization and landscaping. In addition, our Organics group has been working to develop and/or partner with firms that have developed innovative approaches to deriving incremental value from source separated organics to comply with emerging waste regulations.
Improving our balance sheet and reducing business risk
We believe we are making excellent progress improving our balance sheet and reducing operational and financial risk. One of the key pillars of this initiative is our Enterprise Risk Management (“ERM”) program that helps us to more effectively identify and mitigaterisk throughout all aspects of our business. This program has helped us to prioritize and focus resources on mitigating key risk areas.
During fiscal year 2015, our financial strategy was focused on maximizing cash flows to permanently retire indebtedness and refinancing near term debt maturities to reduce financing risks. We made significant progress in each area during fiscal year 2015 as we completed the refinancing of our senior revolving credit and letter of credit facility that was due March 2016 (“Senior CreditFacility”) with our new senior secured asset-based revolving credit and letter of credit facility due February 2020 (“ABL Facility”) in February 2015 and paid down our long-term debt by $15.8 million, decreasing our consolidated leverage ratio under our ABL Facilityto 4.75 as of December 31, 2015 from 5.43 as of March 31, 2015. The ABL Facility allowed us to move out a key maturity date, whileincreasing our financial flexibility. We were able to take advantage of this additional flexibility during fiscal year 2015 by using excess cash flows to buy-back on the open market and permanently retire $14.7 million of our 7.75% senior subordinated notes dueFebruary 2019 (“2019 Notes”). The retirement of this portion of the 2019 Notes is expected to save us $1.1 million of annual cash interest expense.
Over the last three years we have made significant progress in simplifying our business structure, improving cash flows and reducing risk exposure by divesting and closing underperforming operations that did not enhance or complement our core operations. Theseactions included: (1) the divestiture of Maine Energy Recovery Company, LP (“Maine Energy”), a low margin, negative cash flow waste-to-energy operation, in fiscal year 2013; (2) the divestiture of KTI BioFuels, Inc. (“BioFuels”), a low margin, negative cash flow C&D processing facility, in fiscal year 2014; (3) the sale of our 50% equity interest in US GreenFiber LLC (“GreenFiber”), a negative cash flow cellulose insulation joint-venture, in fiscal year 2014; (4) the wind down of Casella-Altela Regional Environmental Services, LLC (“CARES”) through the disposal of the remaining assets of CARES in fiscal year 2015, in which we held a 51% membership interest; and (5) the sale of select low-margin collection routes in fiscal year 2015.
We believe that we are well-positioned for the future and remain strongly committed to a disciplined capital investment strategy, with excess cash flow expected to be primarily used to repay indebtedness. Further, we plan to continue our efforts to actively review our business portfolio for opportunities to improve financial performance by swapping or selling under-performing operations or making selective tuck-in acquisitions to improve route density or internalization.

77
Operational Overview
Our solid waste and recycling operations comprise a full range of non-hazardous solid waste, services, including collections, transfer stations, MRFs and disposal facilities.
Collections. A majority of our commercial and industrial collection services are performed under one-to-five year service agreements, with prices and fees determined by such factors as: collection frequency; type of equipment and containers furnished; type, volume and weight of solid waste collected; distance to the disposal or processing facility; and cost of disposal or processing. Our residential collection and disposal services are performed either on a subscription basis (with no underlying contract) with individuals, or through contracts with municipalities, homeowner associations, apartment building owners or mobile home park operators.
Transfer Stations. Our transfer stations receive, compact and transfer solid waste, collected primarily by our various residential and commercial collection operations, for transport to disposal facilities by larger vehicles. We believe that transfer stations benefit us by: (1) increasing the size of the wastesheds which have access to our landfills; (2) reducing costs by improving utilization of collection personnel and equipment; and (3) helping us build relationships with municipalities and other customers by providing a local physicalpresence and enhanced local service capabilities.
Material Recovery Facilities. Our MRFs receive, sort, bale and sell recyclable materials originating from the municipal solid waste stream, including newsprint, cardboard, office paper, glass, plastic, steel or aluminum containers and bottles. We operate eight MRFs within our Recycling region in geographic areas served by our collection divisions. Revenues are received from municipalities andcustomers in the form of processing fees, tipping fees and commodity sales. These MRFs, three of which are located in New York,two of which are located in Vermont, two of which are located in Massachusetts, and one of which is located in Maine, are large-scale, high-volume facilities that process over 0.5 million tons per year of recycled materials delivered to them by municipalities and commercial customers under long-term contracts. We also operate smaller MRFs, which generally process recyclables collected fromour various residential collection operations.
Landfills. We operate nine solid waste Subtitle D landfills and one landfill permitted to accept C&D materials. Revenues are received from municipalities and customers in the form of tipping fees. The estimated capacity at our landfills is subject to change based on engineering factors, requirements of regulatory authorities, our ability to continue to operate our landfills in compliance withapplicable regulations and our ability to successfully renew operating permits and obtain expansion permits at our sites. The following table (in thousands) reflects the aggregate landfill capacity and airspace changes, in tons, for landfills we operated during fiscal year 2015, transition period 2014 and fiscal year 2014:
Fiscal Year 2015 Transition Period 2014 Fiscal Year 2014EstimatedRemainingPermittedCapacity
(1)
EstimatedAdditionalPermittable
Capacity(1)(2)
EstimatedTotal
Capacity
EstimatedRemainingPermittedCapacity
(1)
EstimatedAdditionalPermittable
Capacity(1)(2)
EstimatedTotal
Capacity
EstimatedRemainingPermittedCapacity
(1)
EstimatedAdditionalPermittable
Capacity(1)(2)
EstimatedTotal
Capacity
Balance, beginning of year ...................... 26,456 76,547 103,003 29,164 80,525 109,689 34,780 75,936 110,716 New expansions
pursued (3) ....... — 1,366 1,366 — — — — 2,594 2,594 Permits
granted (4) ....... — — — 1,462 (1,462) — — — — Airspace
consumed ......... (3,793) — (3,793) (2,677) — (2,677) (3,465) — (3,465)Changes in
engineering estimates (5) ..... 545 (3,470) (2,925) (1,493) (2,516) (4,009) (2,151) 1,995 (156)
Balance, end of year ..... 23,208 74,443 97,651 26,456 76,547 103,003 29,164 80,525 109,689
(1) We convert estimated remaining permitted capacity and estimated additional permittable capacity from cubic yards to tons generally by assuming a compaction factor equal to the historic average compaction factor applicable to the respective landfillover the last three fiscal years. In addition to a total capacity limit, certain permits place a daily and/or annual limit on capacity.
(2) Represents capacity which we have determined to be “permittable” in accordance with the following criteria: (i) we control the land on which the expansion is sought; (ii) all technical siting criteria have been met or a variance has been obtained or is reasonably expected to be obtained; (iii) we have not identified any legal or political impediments which we believe will not be

8
8
resolved in our favor; (iv) we are actively working on obtaining any necessary permits and we expect that all required permits will be received; and (v) senior management has approved the project.
(3) The change in new expansions pursued airspace capacity in fiscal year 2015 and fiscal year 2014 relates to the determination of additional permittable airspace at our Southbridge and NCES landfills in the Eastern region and our Chemung landfill in the Western region.
(4) The increase in remaining permitted airspace capacity in transition period 2014 was the result of a permit received at our NCES landfill.
(5) The variation in changes in airspace capacity associated with engineering estimates in fiscal year 2015, transition period 2014 and fiscal year 2014 is primarily the result of changes in compaction at our landfills and estimated airspace changes associatedwith design changes at certain of our landfills.
Eastern Region
NCES. The North Country Environmental Services landfill (“NCES”) is a Subtitle D landfill located in Bethlehem, New Hampshire that we purchased in 1994. NCES currently consists of approximately 54 acres of landfill area, is permitted to accept municipal solid waste, C&D material and certain pre-approved special waste and has no annual tonnage limitations.
Juniper Ridge. The Juniper Ridge landfill (“Juniper Ridge”) is a Subtitle D landfill located in West Old Town, Maine. In 2004, we completed transactions with the State of Maine and Georgia-Pacific Corporation (“Georgia Pacific”), pursuant to which the State of Maine took ownership of Juniper Ridge, formerly owned by Georgia Pacific, and we became the operator under a 30-year operating and services agreement between us and the State of Maine. Juniper Ridge currently consists of approximately 179 acres of landfillarea, which is sufficient to permit the additional airspace required for the term of the 30-year operating and services agreement, and is permitted to accept the following waste originating from the State of Maine: 0.1 million tons of municipal solid waste per year through March 2018, C&D material, ash from municipal solid waste incinerators and fossil fuel boilers, front end processed residuals andbypass municipal solid waste from waste-to-energy facilities and certain pre-approved special waste. Outside of the limitations on municipal solid waste, there are no annual tonnage limitations at Juniper Ridge. In January 2015, we entered into an agreement with a third-party to develop and construct a 4.8 mW/hr landfill gas-to-energy plant that is expected to be completed during the fiscal year ending December 31, 2017, which will be owned and operated by this third-party.
Southbridge. Southbridge is a Subtitle D landfill located in Southbridge, Massachusetts. In 2003, we acquired Southbridge Recycling and Disposal Park, Inc., which owns a recycling facility and has a contract with the Town of Southbridge, Massachusetts to operate Southbridge. Southbridge currently consists of approximately 95 acres of landfill area, and is permitted to accept 0.4 million tons of municipal solid waste, processed C&D residual material and certain pre-approved special waste annually. The Southbridge site houses a landfill gas-to-energy plant, which is owned and operated by us, that has the capacity to generate 1.6 mW/hr of energy.
Closure Projects. In 2005, we started closure operations at the Worcester, Massachusetts landfill (“Worcester”). These closure operations were completed in April 2014 when Worcester accepted its final tons of waste. We began final capping and closing Worcester in May 2014 and expect to be completed final capping and closing in the fiscal year ending December 31, 2016. Worcesteris not included in the preceding table of landfill capacity.
Western Region
Waste USA. Waste USA, which is a Subtitle D landfill located in Coventry, Vermont that we purchased in 1995, is the only operating permitted Subtitle D landfill in the State of Vermont. Waste USA currently consists of approximately 148 acres of landfill area, and is permitted to accept 0.6 million tons of municipal solid waste, C&D material and certain pre-approved special waste annually. TheWaste USA site houses a landfill gas-to-energy plant, which is owned and operated by a third-party that has the capacity to generate 8.0 mW/hr of energy.
Clinton County. The Clinton County landfill (“Clinton”) is a Subtitle D landfill located in Schuyler Falls, New York. Clinton, which currently consists of approximately 170 acres of landfill area, is leased from Clinton County and is currently permitted to accept approximately 0.2 million tons of municipal solid waste, C&D material and certain pre-approved special waste annually. The Clinton site houses a landfill gas-to-energy facility, which is owned by us and operated by a third-party, that has the capacity to generate 6.4 mW/hr of energy.
Hyland. The Hyland landfill (“Hyland”) is a Subtitle D landfill located in Angelica, New York that we own, which began accepting waste in 1998. Hyland currently consists of approximately 121 acres of landfill area, and is permitted to accept 0.5 million tons of municipal solid waste, C&D material and certain pre-approved special waste annually. The Hyland site houses a landfill gas-to-energy facility, which is owned by us and operated by a third-party, that has the capacity to generate 4.8 mW/hr of energy. The Hylandlandfill has nearby access to a rail siding and has the potential to attract waste volumes shipped via rail.
99
Ontario. The Ontario landfill (“Ontario”) is a Subtitle D landfill located in Seneca, New York. In 2003, we entered into a 25-year operation, management and lease agreement for Ontario with the Ontario County Board of Supervisors. Ontario currently consists ofapproximately 170 acres of landfill area, and is permitted to accept 0.9 million tons of municipal solid waste, C&D material andcertain pre-approved special waste annually and is strategically situated to accept long haul volume from both the eastern and downstate New York markets. In January 2016, we received an expansion permit at Ontario for the acceptance of an estimated 13.6 million tons. The Ontario site houses a single stream MRF, which is operated by us, and a landfill gas-to-energy facility, which is owned and operated by a third-party, that has the capacity to generate 11.2 mW/hr of energy.
Hakes. The Hakes C&D landfill (“Hakes”) is a C&D landfill located in Campbell, New York that we purchased in 1998. Hakes currently consists of approximately 81 acres of landfill area, and is permitted to accept 0.5 million tons of C&D material annually.Hakes has nearby access to a rail siding and is being marketed to attract waste volumes shipped via rail.
Chemung. The Chemung landfill (“Chemung”) is a Subtitle D landfill located in Chemung, New York. In 2005, we entered into a 25-year operation, management and lease agreement for Chemung and certain other facilities with Chemung County. Chemung is strategically situated to accept long haul volume from both eastern and downstate New York markets. Chemung currently consists of approximately 126 acres of landfill area, which is sufficient to permit the additional airspace required for the term of the 25-yearoperation, management and lease agreement, and is permitted to accept 0.4 million tons of municipal solid waste and certain pre-approved special waste annually and eighty thousand tons of C&D material annually.
McKean. The McKean landfill (“McKean”) is a Subtitle D landfill located in Mount Jewett, Pennsylvania that we purchased in 2011 as part of a bankruptcy reorganization. McKean currently consists of approximately 256 acres of landfill area, and is permitted to accept one thousand tons of municipal solid waste, C&D material and certain pre-approved special waste daily. In March, 2014, the Commonwealth of Pennsylvania awarded a grant in the amount of $7.0 million to fund the construction of the rail siding at the landfill which if completed, would expand the market reach for the landfill to other rail capable transfer facilities. We have not yet committed to the construction of the rail siding pending a determination of the economic viability. We believe that the landfill is well situated to provide services to the oil and gas industry that explores natural gas in the Marcellus Shale of Pennsylvania in the form of disposalcapacity for residual materials.
Closed Landfills
We also own and/or manage five unlined landfills and three lined landfills that are not currently in operation. We have closed andcapped all of these landfills according to applicable environmental regulatory standards.
Operating Segments
We manage our solid waste operations, which include a full range of solid waste services, on a geographic basis through two regional operating segments, which we designate as the Eastern and Western regions. Our third operating segment is Recycling, which comprises our larger-scale recycling operations and our commodity brokerage operations. Organic services, ancillary operations,industrial services, discontinued operations and earnings from equity method investees, as applicable, are included in our “Other”segment. See Note 19, Segment Reporting to our consolidated financial statements included under Item 8 of this Annual Report on Form 10-K for a summary of revenues, certain expenses, profitability, capital expenditures, goodwill, and total assets of our operating segments.
Within each geographic region, we organize our solid waste services around smaller areas that we refer to as “wastesheds.” A wasteshed is an area that comprises the complete cycle of activities in the solid waste services process, from collection to transfer operations and recycling to disposal in landfills, some of which may be owned and or operated by third parties. We typically operateseveral divisions within each wasteshed, each of which provides a particular service, such as collection, recycling, disposal or transfer. Each division operates interdependently with the other divisions within the wasteshed. Each wasteshed generally operates autonomously from adjoining wastesheds.
Through the eight MRFs and one commodity brokerage operation comprising the Recycling segment, Recycling provides services to our six anchor contracts, which have original terms ranging from five to twenty years and expire at various times through calendar year end 2028. The terms of each contract vary, but all of the contracts provide that the municipality or a third-party delivers materials to our facility. These contracts may include a minimum volume guarantee by the municipality. We also have service agreements withindividual towns and cities and commercial customers, including small solid waste companies and major competitors that do not have processing capacity within a specific geographic region.
10
10
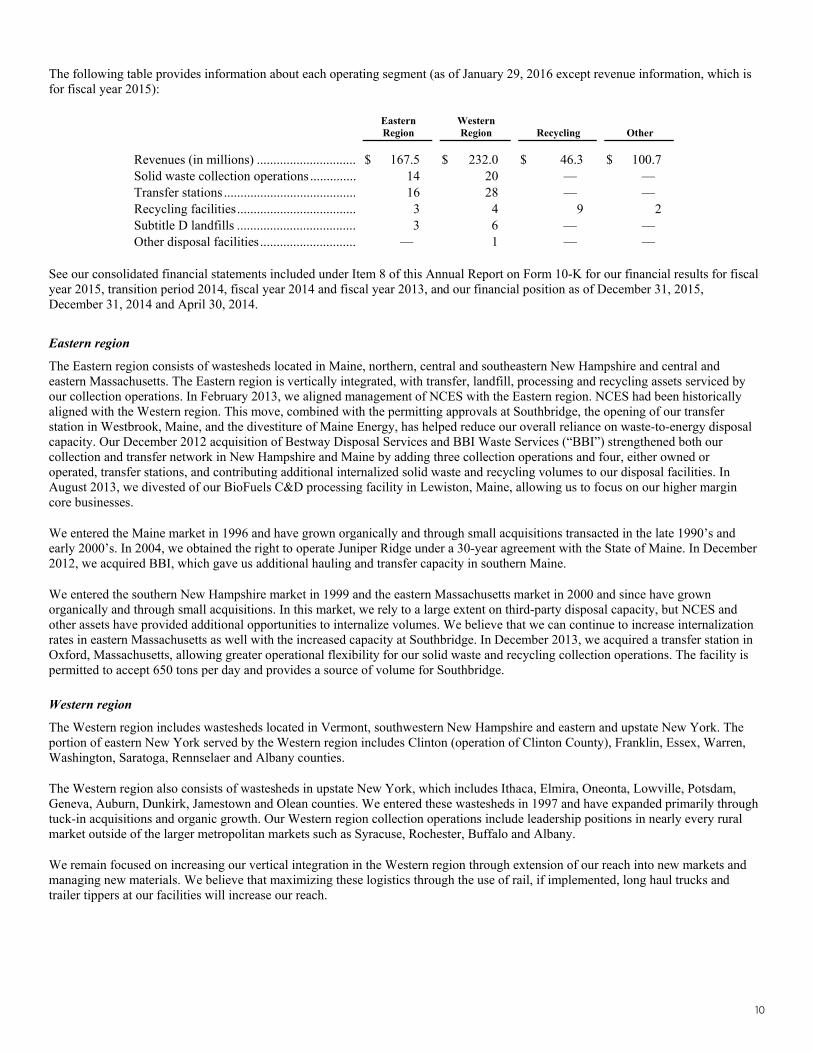
The following table provides information about each operating segment (as of January 29, 2016 except revenue information, which is for fiscal year 2015):
EasternRegion
Western Region Recycling Other
Revenues (in millions) .............................. $ 167.5 $ 232.0 $ 46.3 $ 100.7 Solid waste collection operations .............. 14 20 — — Transfer stations ........................................ 16 28 — — Recycling facilities .................................... 3 4 9 2 Subtitle D landfills .................................... 3 6 — — Other disposal facilities ............................. — 1 — —
See our consolidated financial statements included under Item 8 of this Annual Report on Form 10-K for our financial results for fiscal year 2015, transition period 2014, fiscal year 2014 and fiscal year 2013, and our financial position as of December 31, 2015, December 31, 2014 and April 30, 2014.
Eastern region
The Eastern region consists of wastesheds located in Maine, northern, central and southeastern New Hampshire and central and eastern Massachusetts. The Eastern region is vertically integrated, with transfer, landfill, processing and recycling assets serviced by our collection operations. In February 2013, we aligned management of NCES with the Eastern region. NCES had been historically aligned with the Western region. This move, combined with the permitting approvals at Southbridge, the opening of our transfer station in Westbrook, Maine, and the divestiture of Maine Energy, has helped reduce our overall reliance on waste-to-energy disposal capacity. Our December 2012 acquisition of Bestway Disposal Services and BBI Waste Services (“BBI”) strengthened both our collection and transfer network in New Hampshire and Maine by adding three collection operations and four, either owned or operated, transfer stations, and contributing additional internalized solid waste and recycling volumes to our disposal facilities. In August 2013, we divested of our BioFuels C&D processing facility in Lewiston, Maine, allowing us to focus on our higher margin core businesses.
We entered the Maine market in 1996 and have grown organically and through small acquisitions transacted in the late 1990’s andearly 2000’s. In 2004, we obtained the right to operate Juniper Ridge under a 30-year agreement with the State of Maine. In December 2012, we acquired BBI, which gave us additional hauling and transfer capacity in southern Maine.
We entered the southern New Hampshire market in 1999 and the eastern Massachusetts market in 2000 and since have grown organically and through small acquisitions. In this market, we rely to a large extent on third-party disposal capacity, but NCES and other assets have provided additional opportunities to internalize volumes. We believe that we can continue to increase internalization rates in eastern Massachusetts as well with the increased capacity at Southbridge. In December 2013, we acquired a transfer station in Oxford, Massachusetts, allowing greater operational flexibility for our solid waste and recycling collection operations. The facility is permitted to accept 650 tons per day and provides a source of volume for Southbridge.
Western region
The Western region includes wastesheds located in Vermont, southwestern New Hampshire and eastern and upstate New York. The portion of eastern New York served by the Western region includes Clinton (operation of Clinton County), Franklin, Essex, Warren, Washington, Saratoga, Rennselaer and Albany counties.
The Western region also consists of wastesheds in upstate New York, which includes Ithaca, Elmira, Oneonta, Lowville, Potsdam, Geneva, Auburn, Dunkirk, Jamestown and Olean counties. We entered these wastesheds in 1997 and have expanded primarily through tuck-in acquisitions and organic growth. Our Western region collection operations include leadership positions in nearly every rural market outside of the larger metropolitan markets such as Syracuse, Rochester, Buffalo and Albany.
We remain focused on increasing our vertical integration in the Western region through extension of our reach into new markets andmanaging new materials. We believe that maximizing these logistics through the use of rail, if implemented, long haul trucks andtrailer tippers at our facilities will increase our reach.

1111
Recycling
Our Recycling segment is one of the largest processors and marketers of recycled materials in the northeastern United States, comprised of eight MRFs that process and market recyclable materials that municipalities and commercial customers deliver underlong-term contracts. Two of the eight MRFs are leased, three are owned, and three are operated by us under contracts with third-parties. In fiscal year 2015, the Recycling segment processed and/or marketed over 0.5 million tons of recyclable materials including tons marketed through our commodity brokerage division and our baling facilities located throughout our footprint. Recycling’s facilities are located in Vermont, New York, Maine, and Massachusetts.
A significant portion of the material provided to Recycling is delivered pursuant to six anchor contracts. The anchor contracts have an original term of five to twenty years and expire at various times through 2028. The terms of the recycling contracts vary, but all of the contracts provide that the municipality or a third-party delivers the recycled materials to our facility. Under the recycling contracts, we charge the municipality a fee for each ton of material delivered to us. Some contracts contain revenue sharing arrangements under which the municipality receives a specified percentage of our revenues from the sale of the recovered materials.
Our Recycling segment derives a significant portion of its revenues from the sale of recyclable materials. Since purchase and saleprices of recyclable materials, particularly newspaper, corrugated containers, plastics, ferrous and aluminum, can fluctuate based upon market conditions, we use long-term supply contracts with customers to reduce commodity risk. Under such contracts, we obtain aguaranteed minimum price for the recyclable materials along with a commitment to receive higher prices if the current market pricerises. The contracts are generally with large domestic companies that use the recyclable materials in their manufacturing process, such as paper, packaging and consumer goods companies. In fiscal year 2015, 31.4% of the revenues from the sale of residential recyclable materials were derived from sales under long-term contracts which may include floor prices. At times, we also hedge against fluctuations in the commodity prices of recycled paper and corrugated containers in order to mitigate the variability in cash flows and earnings generated from the sales of recycled materials at floating prices. As of December 31, 2015, no such commodity hedges were in place.
Other
Our Other segment derives a significant portion of its revenues from our Customer Solutions and Organics businesses. Our resourcesolutions strategy seeks to leverage our core competencies in materials processing, industrial recycling, clean energy, and organicsservice offerings in order to generate additional value from the waste stream for our customers. Our Customer Solutions businessworks with industrial services (including multi-location customers, colleges and universities, municipalities, and industrial customers) to develop customized solid waste solutions. The focus of this business is to help these large scale organizations achieve wastereduction and diversion goals to meet their economic and environmental objectives. We differentiate our services from our competitors by providing a customized set of comprehensive resource solutions, which enables us to win new business, including traditional solid waste collection and disposal customers.
Our Organics business has been working to develop and/or partner with firms that have developed innovative approaches to deriving incremental value from the organic portion of the waste stream. Through our Earthlife® soils products, we offer a wide array of organic fertilizers, composts, and mulches that help our customers recycle organic waste streams. We also have an ownership interest in AGreen Energy, LLC (“AGreen”) and BGreen Energy, LLC (“BGreen”), which we account for as cost method investments, that partners with other capital investors to build farm-based anaerobic digesters in the Northeast to generate electricity from farm and food waste streams.
Casella-Altela Regional Environmental Services, LLC
CARES is a joint venture that owned and operated a water and leachate treatment facility for the natural gas drilling industry inPennsylvania. Our joint venture partner in CARES is Altela, Inc. (“Altela”). In fiscal year 2014, we determined that assets of the CARES water treatment facility were no longer operational or were not operating within product performance parameters. As a result, we initiated a plan to abandon and shut down the operations of CARES. It was determined that the carrying value of the assets ofCARES was no longer recoverable and, as a result, the carrying value of the asset group was assessed for impairment and impaired.As a result, we recorded an impairment charge of $7.5 million in fiscal year 2014 to the asset group of CARES in the Western region.
We executed a purchase and sale agreement in fiscal year 2015 pursuant to which we and Altela agreed to sell certain assets of the CARES water treatment facility to a third-party. We sold these assets of CARES for purchase consideration of $3.5 million, resulting in a gain of $2.9 million in fiscal year 2015, 49% of which was attributable to Altela, the noncontrolling interest holder. As of December 31, 2015, we continued to pursue the dissolution of CARES in accordance with the CARES agreement.

1212
In connection with this transaction, we also sold certain of our equipment and real estate to the same third-party for total consideration of $1.1 million, resulting in a gain of $0.9 million in fiscal year 2015. As of December 31, 2015, our ownership interest in CARES is 51%. In accordance with the Financial Accounting Standards Board (“FASB”) Accounting Standards Codification (“ASC”) 810-10-15, we consolidate the assets, liabilities, noncontrolling interest and results of operations of CARES into our consolidated financial statements due to our controlling financial interest in the joint venture.
Equity Method Investments
In the fiscal year 2014, we sold our 50% membership interest in GreenFiber and purchased the remaining 50% membership of Tompkins County Recycling LLC (“Tompkins”), both of which were previously accounted for using the equity method of accounting.
GreenFiber. In fiscal year 2014, we and Louisiana Pacific Corporation (“LP”) executed a purchase and sale agreement with a limited liability company formed by Tenex Capital Partners, L.P., pursuant to which we and LP agreed to sell our membership interests inGreenFiber for total cash consideration of $18.0 million plus an expected working capital true-up less any indebtedness and other unpaid transaction costs of GreenFiber as of the closing date. The transaction was completed for $19.2 million in gross cash proceeds,including a $1.2 million working capital adjustment. After netting indebtedness of GreenFiber and transaction costs, our 50% of the net cash proceeds amounted to $3.4 million. After considering the $0.6 million impact of our unrealized losses relating to derivative instruments in accumulated other comprehensive income on our investment in GreenFiber, we recorded a gain on sale of equity method investment of $0.6 million in fiscal year 2014.
Tompkins. Also in fiscal year 2014, we purchased the remaining 50% membership interest of Tompkins for total cash consideration of $0.4 million. The acquisition-date fair value of our investment in Tompkins, which was determined using the cost approach based on an assessment of the price to purchase the acquired assets of Tompkins prior to the acquisition date, was $0.3 million. We recognizeda gain of $0.1 million in fiscal year 2014 through loss from equity method investments due to the remeasurement. As a result of the purchase, we began including the accounts of Tompkins in our consolidated financial statements.
Competition
The solid waste services industry is highly competitive. We compete for collection and disposal volume primarily on the basis of the quality, breadth and price of our services. From time to time, competitors may reduce the price of their services in an effort to expand market share or to win a competitively bid municipal contract. These practices may also lead to reduced pricing for our services or the loss of business. In addition, competition exists within the industry for potential acquisition candidates.
The larger urban markets in which we compete are served by one or more of the large national solid waste companies, including Waste Management, Inc., Republic Services, Inc. and Waste Connections, Inc., that may be able to achieve greater economies of scalethan we can. We also compete with a number of regional and local companies that offer competitive prices and quality service. Inaddition, we compete with operators of alternative disposal facilities, including incinerators, and with certain municipalities, counties and districts that operate their own solid waste collection and disposal facilities. Public sector facilities may have certain advantages over us due to the availability of user fees, charges or tax revenues and tax-exempt financing.
Marketing and Sales
We have fully integrated sales and marketing strategies with a primary focus on acquiring and retaining commercial, industrial,municipal and residential customers. Our business strategy focuses on creating a highly differentiated sustainable resource management model that meets customers’ unique needs and provides value “beyond the curb”.
Maintenance of a local presence and identity is an important aspect of our sales and marketing strategy, and many of our divisional managers are involved in local governmental, civic and business organizations. Our name and logo, or, where appropriate, that of our divisional operations, are displayed on all of our containers and trucks. We attend and make presentations at municipal and statemeetings, and we advertise in a variety of media throughout our service footprint.
The Customer Solutions business serves customers with multiple locations and is also focused on growing our share of business with municipal, institutional and industrial customers. This group provides customers with a broader set of solutions to augment ourregional and divisional service capabilities.
Marketing activities are focused on attracting new commercial and residential customers directly on-route in order to enhance profitability. Marketing campaigns are integrated with divisional management, sales personnel and the centralized customer carecenter.

1313
Employees
As of January 29, 2016, we employed approximately 1,900 people, including approximately 400 professionals or managers, sales, clerical, information systems or other administrative employees and approximately 1,500 employees involved in collection, transfer, disposal, recycling or other operations. Approximately 80 of our employees are covered by collective bargaining agreements. We believe relations with our employees are good.
Risk Management, Insurance and Performance or Surety Bonds
We actively maintain environmental and other risk management programs that we believe are appropriate for our business. Our environmental risk management program includes evaluating existing facilities, as well as potential acquisitions, for compliance with environmental law requirements. We also maintain a worker safety program, which focuses on safe practices in the workplace. Operating practices at all of our operations are intended to reduce the possibility of environmental contamination, enforcement actions and litigation.
We carry a range of insurance intended to protect our assets and operations, including a commercial general liability policy and a property damage policy. A partially or completely uninsured claim against us (including liabilities associated with cleanup or remediation at our facilities), if successful and of sufficient magnitude, could have a material adverse effect on our business, financial condition and results of operations. Any future difficulty in obtaining insurance could also impair our ability to secure future contracts, which may be conditioned upon the availability of adequate insurance coverage.
We self-insure for automobile and workers’ compensation coverage with reinsurance coverage limiting our maximum exposure. Our maximum exposure in fiscal year 2015 under the workers’ compensation plan was $1.0 million per individual event. Our maximum exposure in fiscal year 2015 under the automobile plan was $1.2 million per individual event.
Municipal solid waste collection contracts and landfill closure and post-closure obligations may require performance or surety bonds, letters of credit or other means of financial assurance to secure contractual performance. While we have not experienced difficulty in obtaining these financial instruments, if we are unable to obtain these financial instruments in sufficient amounts or at acceptable rates we could be precluded from entering into additional municipal contracts or obtaining or retaining landfill operating permits.
We hold a 19.9% ownership interest in Evergreen National Indemnity Company (“Evergreen”), a surety company which provides surety bonds to secure our contractual obligations for certain municipal solid waste collection contracts and landfill closure and post-closure obligations. Our ownership interest in Evergreen is pledged to Evergreen as security for our obligations under the bonds they provide on our behalf.
Customers
We provide our collection services to commercial, institutional, industrial and residential customers. A majority of our commercialand industrial collection services are performed under one-to-five year service agreements, and fees are determined by such factors as: professional or management services required; collection frequency; type of equipment and containers furnished; the type, volume and weight of the solid waste collected; the distance to the disposal or processing facility; and the cost of disposal or processing. Our residential collection and disposal services are performed either on a subscription basis (with no underlying contract) with individuals, or through contracts with municipalities, homeowners associations, apartment owners or mobile home park operators.
Our Recycling segment provides recycling services to municipalities, commercial haulers and commercial waste generators within thegeographic proximity of the processing facilities.
Seasonality and Severe Weather
Our transfer and disposal revenues historically have been higher in the late spring, summer and early fall months. This seasonalityreflects lower volumes of waste in the late fall, winter and early spring months because:
• the volume of waste relating to C&D activities decreases substantially during the winter months in the northeastern United States; and
• decreased tourism in Vermont, New Hampshire, Maine and eastern New York during the winter months tends to lower the volume of waste generated by commercial and restaurant customers, which is partially offset by increased volume from the ski industry.
14
14
Because certain of our operating and fixed costs remain constant throughout the fiscal year, operating income is therefore impacted by a similar seasonality. Our operations can also be adversely affected by periods of inclement or severe weather, which could increaseour operating costs associated with the collection and disposal of waste, delay the collection and disposal of waste, reduce the volume of waste delivered to our disposal sites, increase the volume of waste collected under our existing contracts (without corresponding compensation), decrease the throughput and operating efficiency of our materials recycling facilities, or delay construction orexpansion of our landfill sites and other facilities. Our operations can also be favorably affected by severe weather, which could increase the volume of waste in situations where we are able to charge for our additional services provided.
Our Recycling segment experiences increased volumes of fiber in November and December due to increased newspaper advertising and retail activity during the holiday season.
Regulation
Introduction
We are subject to extensive and evolving federal, state and local environmental laws and regulations which have become increasingly stringent in recent years. The environmental regulations affecting us are administered by the United States Environmental Protection Agency (“EPA”) and other federal, state and local environmental, zoning, health and safety agencies. Failure to comply with suchrequirements could result in substantial costs, including civil and criminal fines and penalties. Except as described in this Annual Report on Form 10-K, we believe that we are currently in substantial compliance with applicable federal, state and local environmental laws, permits, orders and regulations. Other than as disclosed herein, we do not currently anticipate any material costs to bring our operations into environmental compliance, although there can be no assurance in this regard for the future. We expect that our operations in the solid waste services industry will be subject to continued and increased regulation, legislation and enforcement actions. We attempt to anticipate future legal and regulatory requirements and to keep our operations in compliance with those requirements.
In order to transport, process, or dispose of solid waste, it is necessary for us to possess and comply with one or more permits from federal, state and/or local agencies. We must renew these permits periodically, and the permits may be modified or revoked by theissuing agency.
The principal federal statutes and regulations applicable to our operations are as follows:
The Resource Conservation and Recovery Act of 1976, as amended (“RCRA”)
The RCRA regulates the generation, treatment, storage, handling, transportation and disposal of solid waste and requires states to develop programs to ensure the safe disposal of solid waste. The RCRA divides waste into two categories, hazardous and non-hazardous. Wastes are generally classified as hazardous if they either (a) are specifically included on a list of hazardous wastes, or (b) exhibit certain characteristics defined as hazardous and are not specifically designated as non-hazardous. Wastes classified as hazardous waste are subject to more extensive regulation than wastes classified as non-hazardous, and businesses that deal withhazardous waste are subject to regulatory obligations in addition to those imposed on businesses that deal with non-hazardous waste.
Among the wastes that are specifically designated as non-hazardous are household waste and “special” waste, including items such as petroleum contaminated soils, asbestos, foundry sand, shredder fluff and most non-hazardous industrial waste products.
The EPA regulations issued under Subtitle C of the RCRA impose a comprehensive “cradle to grave” system for tracking the generation, transportation, treatment, storage and disposal of hazardous wastes. Subtitle C regulations impose obligations on generators, transporters and disposers of hazardous wastes, and require permits that are costly to obtain and maintain for sites where those businesses treat, store or dispose of such material. Subtitle C requirements include detailed operating, inspection, training and emergency preparedness and response standards, as well as requirements for manifesting, record keeping and reporting, correctiveaction, facility closure, post-closure and financial responsibility. Most states have promulgated regulations modeled on some or all of the Subtitle C provisions issued by the EPA, and in many instances the EPA has delegated to those states the principal role in regulating businesses which are subject to those requirements. Some state regulations impose obligations different from and in addition to those the EPA imposes under Subtitle C.
Leachate generated at our landfills and transfer stations is tested on a regular basis, and generally is not regulated as a hazardous waste under federal law. However, there is no guarantee that leachate generated from our facilities in the future will not be classified as hazardous waste.

15
15
In October 1991, the EPA adopted the Subtitle D regulations under RCRA governing solid waste landfills. The Subtitle D regulations, which generally became effective in October 1993, include siting restrictions, facility design standards, operating criteria, closure and post-closure requirements, financial assurance requirements, groundwater monitoring requirements, groundwater remediation standards and corrective action requirements. In addition, the Subtitle D regulations require that new landfill sites meet more stringent liner design criteria (typically, composite soil and synthetic liners or two or more synthetic liners) intended to keep leachate out of groundwater and have extensive collection systems to carry away leachate for treatment prior to disposal. Regulations generallyrequire us to install groundwater monitoring wells at virtually all landfills we operate, to monitor groundwater quality and, indirectly, the effectiveness of the leachate collection systems. The Subtitle D regulations also require facility owners or operators to control emissions of landfill gas (including methane) generated at landfills exceeding certain regulatory thresholds. State landfill regulations must meet those requirements or the EPA will impose such requirements upon landfill owners and operators in that state.
The Federal Water Pollution Control Act of 1972, as amended (“Clean Water Act”)
The Clean Water Act regulates the discharge of pollutants into the “waters of the United States” from a variety of sources, including solid waste disposal sites and transfer stations, processing facilities and waste-to-energy facilities (collectively, “solid wastemanagement facilities”). If run-off, treated leachate from our solid waste management facilities is discharged into streams, rivers or other surface waters, the Clean Water Act would require us to apply for and obtain a discharge permit, conduct sampling and monitoring and, under certain circumstances, reduce the quantity of pollutants in such discharge. A permit also may be required if that run-off or leachate is discharged to a treatment facility that is owned by a local municipality. Almost all solid waste managementfacilities must comply with the EPA’s storm water regulations, which govern the discharge of regulated storm water to surface waters.
Under federal regulation, facilities that have above ground and/or below ground petroleum storage capacities over certain thresholds may be subject to regulations and/or permitting under the Clean Water Act. Many of our facilities have petroleum storage and arerequired to have a spill, prevention, control and countermeasures (“SPCC”) plan to prevent petroleum release to waters of the U.S. due to a spill rupture or leak.
Several states in which we operate have been delegated the authority to implement the Clean Water Act requirements and in some cases the regulations are more stringent than the federal regulations. We believe we are in compliance with the Clean Water Actregulations, however future changes to the law or regulations could have a material impact on our business.
The Comprehensive Environmental Response, Compensation, and Liability Act of 1980, as amended (“CERCLA”)
CERCLA established a regulatory and remedial program intended to provide for the investigation and remediation of facilities where, or from which, a release of any hazardous substance into the environment has occurred or is threatened. CERCLA has been interpretedto impose retroactive strict, and under certain circumstances, joint and severable, liability for the costs to investigate and clean up facilities on current owners and operators of the site, former owners and operators of the site at the time of the disposal of the hazardous substances, as well as the generators and certain transporters of the hazardous substances. In addition, CERCLA imposesliability for the costs of evaluating and addressing damage to natural resources. The costs of CERCLA investigation and cleanup can be substantial. Liability under CERCLA does not depend upon the existence or disposal of “hazardous waste” as defined by RCRA, but can be based on the presence of any of more than 700 “hazardous substances” listed by the EPA, many of which can be found inhousehold waste. In addition, the definition of “hazardous substances” in CERCLA incorporates substances designated as hazardousor toxic under the Federal Clean Water Act, Clean Air Act and Toxic Substances Control Act. If we were found to be a responsibleparty for a CERCLA cleanup, under certain circumstances, the enforcing agency could pursue us or any other responsible party, for all investigative and remedial costs, even if others also were liable. CERCLA also authorizes the EPA to impose a lien in favor of the United States upon all real property subject to, or affected by, a remedial action for all costs for which the property owner is liable. CERCLA provides a responsible party with the right to bring a contribution action against other responsible parties for their allocable share of investigative and remedial costs. Our ability to obtain reimbursement for amounts we pay in excess of our allocable share of such costs would be limited by our ability to identify and locate other responsible parties and to prove the extent of their responsibility and by the financial resources of such other parties.
The Clean Air Act of 1970, as amended (“Clean Air Act”)
The Clean Air Act, generally through state implementation of federal requirements, regulates emissions of air pollutants from certain landfills based upon the date the landfill was constructed and the annual volume of emissions. The EPA has promulgated new sourceperformance standards regulating air emissions of certain regulated pollutants (non-methane organic compounds) from municipal solid waste landfills. Landfills located in areas where ambient levels of regulated pollutants exceed certain thresholds may be subject to more extensive air pollution controls and emission limitations. In addition, the EPA has issued standards regulating the disposal of asbestos-containing materials under the Clean Air Act.

16
16
The EPA is also focusing on the emissions of greenhouse gases, or GHG, including carbon dioxide and methane. In December, 2009,the EPA issued its “endangerment finding” that carbon dioxide poses a threat to human health and welfare, providing the basis for the EPA to regulate GHG emissions. In December 2009 the EPA’s “Mandatory Reporting of Greenhouse Gases” rule went into effect, requiring facilities that emit twenty-five thousand metric tons or more per year of GHG emissions to submit annual reports to the EPA.
In June 2010, the EPA issued the so-called “GHG Tailoring Rule”, which described how certain sources that emit GHG would be subject to heightened Clean Air Act PSD / Title V regulation. In July 2011, however, the EPA promulgated a rule that, broadly, deferred for three years the applicability of those regulations with regard to sources emitting carbon dioxide from biomass-fired and other “biogenic” sources. In June 2014, the U.S. Supreme Court issued a decision partially invalidating EPA’s Tailoring Rule. We do not know whether or when the EPA will put those regulations in place following the Supreme Court decision, or what obligations such regulations will impose on our operations.
The adoption of other laws and regulations, which may include the imposition of fees or taxes, could adversely affect our collection and disposal operations. Additionally, certain of the states in which we operate are contemplating air pollution control regulations relating to GHG that may be more stringent than regulations the EPA may promulgate. Changing environmental regulations could require us to take any number of actions, including purchasing emission allowances or installing additional pollution control technology, and could make some operations less profitable, which could adversely affect our results of operations.
Congress also is considering various options, including a cap and trade system, which could impose a limit on and establish a pricing mechanism for GHG emissions and emission allowances. There also is increasing pressure for the United States to join international efforts to control GHG emissions.
The Clean Air Act regulates emissions of air pollutants from our processing facilities. The EPA has enacted standards that apply to those emissions. It is possible that the EPA, or a state where we operate, will enact additional or different emission standards in the future.
All of the federal statutes described above authorize lawsuits by private citizens to enforce certain provisions of the statutes. In addition to a penalty award to the United States, some of those statutes authorize an award of attorney’s fees to private partiessuccessfully advancing such an action.
The Occupational Safety and Health Act of 1970, as amended (“OSHA”)
OSHA establishes employer responsibilities and authorizes the Occupational Safety and Health Administration to promulgate and enforce occupational health and safety standards, including the obligation to maintain a workplace free of recognized hazards likely to cause death or serious injury, to comply with adopted worker protection standards, to maintain certain records, to provide workers with required disclosures and to implement certain health and safety training programs. A variety of those promulgated standards may apply to our operations, including those standards concerning notices of hazards, safety in excavation and demolition work, thehandling of asbestos and asbestos-containing materials, and worker training and emergency response programs.
The Public Utility Regulatory Policies Act of 1978, As Amended (“PURPA”)
PURPA exempts qualifying facilities from most federal and state laws governing the financial organization and rate regulation ofelectric utilities, and generally requires electric utilities to purchase electricity generated by qualifying facilities at a price equal to the utility’s full “avoided cost”. Our four landfill gas-to-energy facilities are self- certified as “qualifying facilities”.
State and Local Regulations
Each state in which we now operate or may operate in the future has laws and regulations governing (1) water and air pollution, and the generation, storage, treatment, handling, processing, transportation, incineration and disposal of solid waste and hazardous waste; (2) in most cases, the siting, design, operation, maintenance, closure and post-closure maintenance of solid waste management facilities; and (3) in some cases, vehicle emissions limits or fuel types, which impact our collection operations. Such standardstypically are as stringent as, and may be more stringent and broader in scope than, federal regulations. Most of the federal statutesnoted above authorize states to enact and enforce laws with standards that are more protective of the environment than the federalanalog. In addition, many states have adopted statutes comparable to, and in some cases more stringent than, CERCLA. These statutes impose requirements for investigation and remediation of contaminated sites and liability for costs and damages associated with such sites, and some authorize the state to impose liens to secure costs expended addressing contamination on property owned by responsible parties. Some of those liens may take priority over previously filed instruments. Some states have enacted statutes that impose liability for substances in addition to the “hazardous substances” listed by EPA under CERCLA.

17
17
Many municipalities in which we currently operate or may operate in the future also have ordinances, laws and regulations affecting our operations. These include zoning and health measures that limit solid waste management activities to specified sites or conduct, flow control provisions that direct the delivery of solid wastes to specific facilities or to facilities in specific areas, laws that grant the right to establish franchises for collection services and then put out for bid the right to provide collection services, and bans or other restrictions on the movement of solid wastes into a municipality.
Some states have enacted laws that allow agencies with jurisdiction over waste management facilities to deny or revoke permits basedon the applicant’s or permit holder’s compliance status. Some states also consider the compliance history of the corporate parent, subsidiaries and affiliates of the applicant or permit holder.
Certain permits and approvals issued under state or local law may limit the types of waste that may be accepted at a solid wastemanagement facility or the quantity of waste that may be accepted at a solid waste management facility during a specific time period.In addition, certain permits and approvals, as well as certain state and local regulations, may limit a solid waste management facility to accepting waste that originates from specified geographic areas or seek to restrict the importation of out-of-state waste or otherwise discriminate against out-of-state waste. Generally, restrictions on importing out-of-state waste have not withstood judicial challenge. However, from time to time federal legislation is proposed which would allow individual states to prohibit the disposal of out-of-statewaste or to limit the amount of out-of-state waste that could be imported for disposal and would require states, under certain circumstances, to reduce the amounts of waste exported to other states. Although such legislation has not been passed by Congress, if similar legislation is enacted, states in which we operate solid waste management facilities could limit or prohibit the importation of out-of-state waste. Such actions could materially and adversely affect the business, financial condition and results of operations of any of our landfills within those states that receive a significant portion of waste originating from out-of-state.
Certain states and localities may restrict the export of waste from their jurisdiction, or require that a specified amount of waste be disposed of at facilities within their jurisdiction. In 1994, the U.S. Supreme Court rejected as unconstitutional and therefore invalid, a local ordinance that sought to limit waste going out of the locality by imposing a requirement that the waste be delivered to aparticular privately-owned facility. However, in 2007, the U.S. Supreme Court upheld a U.S. District Court ruling that the flow control regulations in Oneida and Herkimer counties in New York requiring trash haulers to use publicly-owned transfer stations are constitutional, and therefore valid. Additionally, certain state and local jurisdictions continue to seek to enforce such restrictions. Further, some proposed federal legislation would allow states and localities to impose flow restrictions. Those restrictions could reduce the volume of waste going to solid waste management facilities in certain areas, which may materially adversely affect our ability to operate our facilities and/or affect the prices we can charge for certain services. Those restrictions also may result in higher disposal costs for our collection operations. In sum, flow control restrictions could have a material adverse effect on our business, financial condition and results of operations.
There has been an increasing trend at the state and local levels to mandate or encourage both waste reduction at the source and waste recycling, and to prohibit or restrict the disposal in landfills of certain types of solid wastes, including yard wastes and leaves, food wastes, beverage containers, newspapers, household appliances and electronics such as computers, and batteries. Regulations reducing the volume and types of wastes available for transport to and disposal in landfills could affect our ability to operate our landfillfacilities. Vermont, for example, enacted Act 148, containing among other things, a phased waste ban for recyclables, organics andleaf/yard waste. The bill became effective July 1, 2012, with phased deadlines for compliance beginning 2014 through 2020. Vermont also passed a bill requiring recycling of architectural waste from construction or demolition of a commercial project. The law became effective in January 2015.
Massachusetts revised its regulations governing solid waste management with a framework to encourage the re-use of organic wastematerial and prohibiting such material from disposal for large-scale commercial generators by October 2014.
New York State is considering revisions to its regulations governing solid waste management, 6 NYCRR Part 360.
Although there is no federal law governing extended producer responsibility (“EPR”) regulations; many states have implemented EPRregulations for certain products. EPR regulations are intended to place responsibility for ultimate management or end-of-useful-lifehandling of the products they create. In addition to financial responsibility, an EPR program may include responsibility for local take-back or recycling programs. For example, several states in which we operate have EPR regulations for electronic waste. If broad EPR laws or regulations were adopted and managed under a manufacturer implemented program, it could have an impact on our business.

18
18
Executive Officers of the Registrant
Our executive officers and their respective ages are as follows:
Name Age Position
John W. Casella ............................... 65 Chairman of the Board of Directors, Chief Executive Officer and Secretary Edwin D. Johnson ............................ 58 President and Chief Operating Officer Edmond “Ned” R. Coletta ................ 40 Senior Vice President and Chief Financial Officer Christopher B. Heald ....................... 51 Vice President and Chief Accounting Officer David L. Schmitt .............................. 65 Senior Vice President and General Counsel
John W. Casella has served as Chairman of our Board of Directors since July 2001 and as our Chief Executive Officer since 1993. Mr. Casella also served as our President from 1993 to July 2001 and as Chairman of our Board from 1993 to December 1999. In addition,Mr. Casella has served as Chairman of the Board of Directors of Casella Waste Management, Inc., a wholly-owned subsidiary of ours,since 1977. Mr. Casella is also an executive officer and director of Casella Construction, Inc., a company owned by Mr. Casella and his brother Douglas R. Casella, also a member of our Board of Directors, which specializes in general contracting, soil excavation and heavy equipment work, and which performs landfill-construction and related services for us. Mr. Casella has been a member of numerous industry-related and community service-related state and local boards and commissions, including the National RecyclingCoalition, Board of Directors of the Associated Industries of Vermont, the Association of Vermont Recyclers, the Vermont State Chamber of Commerce, the Rutland Industrial Development Corporation and the Rutland Regional Medical Center. Mr. Casella has also served on various state task forces, serving in an advisory capacity to the Governors of Vermont and New Hampshire on solidwaste issues. Mr. Casella holds an A.S. in Business Management from Bryant & Stratton College and a B.S. in Business Education from Castleton State College.
Edwin D. Johnson has served as our President and Chief Operating Officer since December 2012 and as our Senior Vice President and Chief Financial Officer from July 2010 until December 2012. From March 2007 to July 2010, Mr. Johnson served as Executive Vice President, Chief Financial Officer and Chief Accounting Officer at Waste Services, Inc, a solid waste services company. From November 2004 to March 2007, Mr. Johnson served as Chief Financial Officer of Expert Real Estate Services, Inc., a full service real estate brokerage company. Mr. Johnson is a Certified Public Accountant and holds an MBA from Florida International University and a Bachelor of Science in Accounting and Administration from Washington & Lee University.
Edmond “Ned” R. Coletta has served as our Senior Vice President, Chief Financial Officer and Treasurer since December 2012. Mr. Coletta joined us in December 2004 and has served in positions of increasing responsibility, including most recently as our Vice President of Finance and Investor Relations from January 2011 to December 2012. Prior to that Mr. Coletta served as our Director of Finance and Investor Relations from August 2005 to January 2011. From 2002 until he joined us, Mr. Coletta served as the Chief Financial Officer and was a member of the Board of Directors of Avedro, Inc. (FKA ThermalVision, Inc.), an early stage medical device company that he co-founded. From 1997 to 2001, he served as a research and development engineer for Lockheed Martin Michoud Space Systems. Mr. Coletta holds an MBA from the Tuck School of Business at Dartmouth College and a Bachelor of Science in Materials Science Engineering from Brown University.
Christopher B. Heald has served as our Vice President of Finance and Chief Accounting Officer since January 2013. Mr. Heald joined us in September 2001 and has served in positions of increasing responsibility, including most recently as our Director of FinancialReporting and Analysis from July 2010 to January 2013 and as our Accounting Manager from August 2002 to July 2010. Mr. Heald isa Certified Public Accountant and holds a Bachelor of Science in Business Administration from the University of Vermont.
David L. Schmitt has served as our Senior Vice President and General Counsel since June 2012. Mr. Schmitt joined us in May 2006 as our Vice President, General Counsel. Prior to that, Mr. Schmitt served as President of a privately held consulting firm, and further served from 2002 until 2005 as Vice President and General Counsel of BioEnergy International, LLC, (a predecessor company to Myriant Corporation), a firm specializing in the production of bio-succinic acid. He served from 1995 until 2001, as Senior VicePresident, General Counsel and Secretary of Bradlees, Inc., a retailer in the northeast United States, and from 1986 through 1990, as Vice President and General Counsel of Wheelabrator Technologies, Inc., a multi-faceted corporation specializing in the development,ownership and operation of large-scale power facilities, fueled by solid waste and other alternative fuels.
Available of Reports and Other Information
Our website is www.casella.com. We make available, free of charge through our website, our Annual and Transition Reports on Form 10-K and 10-KT, Quarterly Reports on Form 10-Q, Current Reports on Form 8-K, Proxy Statement on Schedule 14A, and any amendments to those materials filed pursuant to Sections 13(a) and 15(d) of the Securities Exchange Act of 1934, as amended. Wemake these reports available through our website as soon as reasonably practicable after we electronically file such materials with or furnish them to the Securities and Exchange Commission (“SEC”). The information found on our website is not part of this or anyother report we file with or furnish to the SEC.

1919
You may read and copy any materials we file with the SEC at the SEC’s Public Reference Room at 100 F Street, NE, Washington, DC20549. You may obtain information on the operation of the Public Reference Room by calling the SEC at 1-800-SEC-0330. The SEC also maintains an Internet website that contains reports, proxy and information statements, and other information regarding us andother issuers that file electronically with the SEC. The SEC’s Internet website address is www.sec.gov.
ITEM 1A. RISK FACTORS
The following important factors, among others, could cause actual results to differ materially from those indicated by forward-looking statements made in this Annual Report on Form 10-K and presented elsewhere by management from time to time. The risks and uncertainties described below are those that we have identified as material, but are not the only risks and uncertainties facing us. Our business is also subject to general risks and uncertainties that affect many other companies, including overall economic and industry conditions, especially in the northeastern United States, where our operations and customers are principally located, changes in laws or accounting rules or other disruptions of expected economic or business conditions. Additional risks and uncertainties not currently known to us or that we currently believe are not material also may impair our business’s results of operations and financial condition.
Risks Related to Our Business
We face substantial competition in the solid waste services industry, and if we cannot successfully compete in the marketplace, our business, financial condition and results of operations may be materially adversely affected.
The solid waste services industry is highly competitive, has undergone a period of consolidation and requires substantial labor and capital resources. Some of the markets in which we compete are served by, or are adjacent to markets served by, one or more of the large national or super regional solid waste companies, as well as numerous regional and local solid waste companies. Intense competition exists not only to provide services to customers, but also to acquire other businesses within each market. Some of our competitors have significantly greater financial and other resources than we do. From time to time, competitors may reduce the price of their services in an effort to expand market share or to win a competitively bid contract. These practices may require us to reduce the pricing of our services and may result in a loss of business.
As is generally the case in our industry, some municipal contracts are subject to periodic competitive bidding. We may not be thesuccessful bidder to obtain or retain these contracts. If we are unable to compete with larger and better capitalized companies or replace municipal contracts lost through the competitive bidding process with comparable contracts or other revenue sources within a reasonable time period, our revenues would decrease and our operating results could be materially adversely affected.
In our solid waste disposal markets, we also compete with operators of alternative disposal and recycling facilities and with counties, municipalities and solid waste districts that maintain their own solid waste collection, recycling and disposal operations. We are also increasingly competing with companies which seek to use parts of the waste stream as feedstock for renewable energy supplies. Public entities may have financial advantages because of their ability to charge user fees or similar charges, impose taxes and apply resulting revenues, access tax-exempt financing and, in some cases, utilize government subsidies.
The waste management industry is undergoing fundamental change as traditional waste streams are increasingly viewed as renewable resources, which may adversely affect volumes and tipping fees at our landfills.
As we continue to develop our landfill capacity, the waste management industry is increasingly recognizing the value of the wastestream as a renewable resource, and accordingly, new alternatives to landfilling are being developed that seek to maximize the renewable energy and other resource benefits of solid waste. These alternatives may well affect the demand for landfill airspace, which could then affect our ability to operate our landfills at full capacity, as well as the tipping fees and prices that wastemanagement companies generally, and that we in particular, can charge for utilization of landfill airspace. Reduced tipping fees can also affect our willingness to incur the expenditures necessary to increase the permitted capacity of the landfills. As a result, our revenues and operating margins could be materially adversely affected due to these disposal alternatives.
The waste industry is subject to extensive government regulations, including environmental regulations, and we incur substantialcosts to comply with such regulations. Failure to comply with environmental or other regulations, as well as enforcement actionsand litigation arising from an actual or perceived breach of such regulations, could subject us to fines, penalties, and judgments, and impose limits on our ability to operate and expand.
We are subject to potential liability and restrictions under environmental laws, including those relating to transportation, recycling,treatment, storage and disposal of wastes, discharges of pollutants to air and water, and the remediation of contaminated soil, surface water and groundwater. The waste management industry has been and will continue to be subject to regulation, including permittingand related financial assurance requirements, as well as attempts to further regulate the industry, including efforts to regulate the

20
20
emission of greenhouse gases. Our solid waste operations are subject to a wide range of federal, state and, in some cases, localenvironmental, odor and noise and land use restrictions. If we are not able to comply with the requirements that apply to a particular facility or if we operate without the necessary approvals or permits, we could be subject to administrative or civil, and possibly criminal, fines and penalties, and we may be required to spend substantial capital to bring an operation into compliance, to temporarily or permanently discontinue activities, and/or take corrective actions, possibly including removal of landfilled materials. Those costs or actions could be significant to us and affect our results of operations, cash flows, and available capital. We may not have sufficientinsurance coverage for our environmental liabilities, such coverage may not cover all of the potential liabilities we may be subject to and/or we may not be able to obtain insurance coverage in the future at reasonable expense, or at all. Environmental and land use laws also affect our ability to expand and, in the case of our solid waste operations, may dictate those geographic areas from which we must, or, from which we may not, accept solid waste. Those laws and regulations may limit the overall size and daily solid wastevolume that may be accepted by a solid waste operation. If we are not able to expand or otherwise operate one or more of our facilitiesbecause of limits imposed under such laws, we may be required to increase our utilization of disposal facilities owned by third-parties, which could reduce our revenues and/or operating margins. We have historically grown through acquisitions, may make additional acquisitions from time to time in the future, and we have tried and will continue to try to evaluate and limit environmental risks and liabilities presented by businesses to be acquired prior to the acquisition. It is possible that some liabilities, including ones that may exist only because of the past operations of an acquired business, may prove to be more difficult or costly to address than we anticipate. It is also possible that government officials responsible for enforcing environmental laws may believe an issue is more serious than we expect, or that we will fail to identify or fully appreciate an existing liability before we become legally responsible for addressing it. Some of the legal sanctions to which we could become subject could cause the suspension or revocation of a neededpermit, prevent us from, or delay us in, obtaining or renewing permits to operate or expand our facilities, or harm our reputation. As of December 31, 2015, we had recorded $5.2 million in environmental remediation liabilities for the estimated cost of our share of work associated with a consent order issued by the State of New York to remediate a scrap yard and solid waste transfer station owned by one of our acquired subsidiaries, including the recognition of accretion expense. There can be no assurance that the cost of suchcleanup or that our share of that cost will not exceed our estimates.
In addition to the costs of complying with environmental laws and regulations, we incur costs defending against environmental litigation brought by government agencies and private parties. We are, and may be in the future, a defendant in lawsuits brought by parties alleging environmental damage, personal injury, and/or property damage, or seeking to overturn or prevent the issuance of an operating permit or authorization, all of which may result in us incurring significant liabilities. In October 2015, our Southbridge Recycling and Disposal Park subsidiary reported to the Massachusetts Department of Environmental Protection (“MADEP”) results ofanalysis of samples collected pursuant to our existing permit from private drinking water wells located near Southbridge that indicated the presence of contaminants above the levels triggering notice and response obligations under regulations promulgated by MADEPregulations. We are implementing a plan to analyze and better understand the groundwater near the landfill, is carrying out an Immediate Response Action pursuant to state law, and is investigating for the purpose of identifying the source or sources of the elevated levels of contamination measured in the well samples. If it is determined that some or all of the contamination originated at Southbridge, we will evaluate what liability we may have for the related costs and liabilities. In February 2016, we received noticefrom a law firm purporting to represent a number of residents proximate to Southbridge of its intent to file suit against us. The existence of these contaminants and any related lawsuit or other action could delay our ongoing permitting activities at Southbridge and result in costs and liabilities, each of which could have a material impact on our results of operations and financial condition.
In addition to complying with environmental laws and regulations, we are required to obtain government permits to operate our facilities, including all of our landfills. There is no guarantee that we will be able to obtain the requisite permits and, even if we could, that any permit (and any existing permits we currently hold) will be renewed or modified as needed to fit our business needs. Localities where we operate generally seek to regulate some or all landfill and transfer station operations, including siting and expansion of operations. The laws adopted by municipalities in which our landfills and transfer stations are located may limit orprohibit the expansion of a landfill or transfer station, as well as the amount of solid waste that we can accept at the landfill or transfer station on a daily, quarterly or annual basis, and any effort to acquire or expand landfills and transfer stations, which typically involves a significant amount of time and expense. We may not be successful in obtaining new landfill or transfer station sites or expanding the permitted capacity of any of our current landfills and transfer stations. If we are unable to develop additional disposal and transfer station capacity, our ability to achieve economies from the internalization of our waste stream will be limited. If we fail to receive new landfill permits or renew existing permits, we may incur landfill asset impairment and other charges associated with acceleratedclosure.
The conduct of our businesses is also subject to various other laws and regulations administered by federal, state and local governmental agencies, including tax laws, employment laws and competition laws, among others. New laws, regulations or governmental policy and their related interpretations, or changes in any of the foregoing, including taxes or other limitations on our services, may alter the environment in which we do business and, therefore, may impact our results or increase our costs or liabilities.
In certain jurisdictions, we are subject to compliance with specific obligations under competition laws due to our competitive position in those jurisdictions. For example, in May 2002, we entered into an assurance of discontinuance with the Vermont Attorney

2121
General’s Office concerning, among other matters, the conduct of our business in Vermont relating to certain contract terms applicable to our small commercial container customers. In August 2011, a revised final judgment of consent and order was entered by the Vermont Superior Court Washington Unit, Civil Division, as a result of some of our small commercial container customers having been mistakenly issued contracts that did not strictly comply with the terms of the assurance of discontinuance. Pursuant to the order, we paid a civil penalty in an aggregate amount of $1.0 million. Also, in July 2014, we entered into an assurance of discontinuancewith the office of the New York Attorney General in connection with certain of our commercial practices in certain specified counties in New York, pursuant to which we paid the State of New York a sum of $0.1 million. The assurances of discontinuance and order also provide for certain restrictions on our customer contract terms, certain conditions on our business acquisitions, sales and market share and require us to maintain an internal compliance program. Failure to comply with these requirements or other laws or regulations could subject us to enforcement actions or financial penalties which could have a material adverse effect on our business.
See also Item 1, “Business”, Item 3, “Legal Proceedings” and Note 10, Commitments and Contingencies to our consolidated financial statements included under Item 8 of this Annual Report on Form 10-K.
Our results of operations could continue to be affected by fluctuating commodity prices or market requirements for recyclable materials.
Our results of operations have been and may continue to be affected by changing purchase or resale prices or market requirements for recyclable materials. Our recycling business involves the purchase and sale of recyclable materials, some of which are priced on a commodity basis. The market for recyclable materials was affected by unprecedented price decreases in October 2008, resulting in a severe impact on our results of operations. Currently, the commodity markets continues to see ongoing negative pressure on pricing associated with the decline of the fiber market due to less use of paper products such as newspaper and office paper as a result of increased on-line reading. From an export standpoint, China’s slowing economic environment and increasing ability to create its own domestic recyclables has changed the landscape of the recycling markets, which has decreased the demand for U.S fiber. On the domestic front, within the Northeast, there continues to be very little demand for the newspaper grade leading us to turn to the export market throughout all material recovery facilities within our footprint. The plastic grades continue to decline with lower oil prices. Although we may seek to limit our exposure to fluctuating commodity prices through the use of hedging agreements, floorprice contracts and long-term supply contracts with customers and have sought to mitigate commodity price fluctuations by reducing the prices we pay for purchased materials or increasing tip fees at our facilities, these fluctuations have in the past contributed, and may continue to contribute, to significant variability in our period-to-period results of operations. Although, we have the SRA fee to help offset increases in the cost of commodities arising from price volatility, we cannot provide assurance that we can pass this fee on to our customers where their contracts and competition conditions permit.
Our business requires a high level of capital expenditures.
Our business is capital intensive. Our capital expenditure requirements include fixed asset purchases and capital expenditures for landfill development and cell construction, as well as site and cell closure. We use a substantial portion of our cash flows from operating activities toward capital expenditures, which reduces our flexibility to use such cash flows for other purposes, such as reducing our indebtedness. Our capital expenditures could increase if we make acquisitions or further expand our operations, or as a result of factors beyond our control, such as changes in federal, state or local governmental requirements. The amount that we spend on capital expenditures may exceed current expectations, which may require us to obtain additional funding for our operations orimpair our ability to grow our business.
Our business is geographically concentrated and is therefore subject to regional economic downturns.
Our operations and customers are concentrated principally in New England and New York. Therefore, our business, financial condition and results of operations are susceptible to regional economic downturns and other regional factors, including state regulations and budget constraints and severe weather conditions. In addition, as we seek to expand in our existing markets, opportunities for growth within this region will become more limited and the geographic concentration of our business will increase.
Our results of operations and financial condition may be negatively affected if we inadequately accrue for final capping, closureand post-closure costs or by the timing of these costs for our waste disposal facilities.
We have material financial obligations relating to final capping, closure and post-closure costs of our existing owned or operated landfills and will have material financial obligations with respect to any disposal facilities that we may own or operate in the future. Once the permitted capacity of a particular landfill is reached and additional capacity is not authorized, the landfill must be closed and capped, and we must begin post-closure maintenance. We establish accruals for the estimated costs associated with such final capping, closure and post-closure obligations over the anticipated useful life of each landfill on a per ton basis. We have provided and expect that we will in the future provide accruals for financial obligations relating to final capping, closure and post-closure costs of our owned or operated landfills, generally for a term of 30 years after closure of a landfill. Our financial obligations for final capping, closure or post-closure costs could exceed the amounts accrued or amounts otherwise receivable pursuant to trust funds established for

22
22
this purpose. Such a circumstance could result in significant unanticipated charges which would have an adverse effect on our business.
In addition, the timing of any such final capping, closure or post-closure costs, which exceed established accruals, may furthernegatively affect our business. Since we will be unable to control the timing and amounts of such costs, we may be forced to delayinvestments or planned improvements in other parts of our business or we may be unable to meet applicable financial assurance requirements. Any of the foregoing would negatively affect our business and results of operations.
Fluctuations in fuel costs could affect our operating expenses and results.
The price and supply of fuel is unpredictable and fluctuates based on events beyond our control, including among others, geopoliticaldevelopments, supply and demand for oil and gas, actions by the Organization of the Petroleum Exporting Countries and other oil and gas producers, war and unrest in oil producing countries and regional production patterns. Because fuel is needed to run our fleet of trucks, price escalations for fuel increase our operating expenses. In fiscal year 2015, we used approximately 5.0 million gallons of diesel fuel in our solid waste operations. Although, we have a “fuel and oil recovery fee” program, based on a fuel index, to help offset increases in the cost of fuel, oil and lubricants arising from price volatility, we cannot provide assurance that we can pass this fee on to our customers where their contracts and competition conditions permit.
We could be precluded from entering into contracts or obtaining or maintaining permits or certain contracts if we are unable toobtain third-party financial assurance to secure our contractual obligations.
Public solid waste collection, recycling and disposal contracts, and obligations associated with landfill closure typically require performance or surety bonds, letters of credit or other means of financial assurance to secure our contractual performance. We currently obtain performance and surety bonds from Evergreen, in which we hold a 19.9% equity interest. If we are unable to obtainthe necessary financial assurance in sufficient amounts or at acceptable rates, we could be precluded from entering into additional municipal contracts or from obtaining or retaining landfill management contracts or operating permits. Any future difficulty inobtaining insurance could also impair our ability to secure future contracts conditioned upon having adequate insurance coverage.
We may be required to write-off or impair capitalized costs or intangible assets in the future or we may incur restructuring costs or other charges, each of which could harm our earnings.
In accordance with generally accepted accounting principles in the United States, we capitalize certain expenditures and advances relating to our acquisitions, pending acquisitions, landfills, cost method investments and development projects. In addition, we have considerable unamortized assets. From time to time in future periods, we may be required to incur a charge against earnings in an amount equal to any unamortized capitalized expenditures and advances, net of any portion thereof that we estimate will be recoverable, through sale or otherwise, relating to: (1) any operation or other asset that is being sold, permanently shut down or impaired or has not generated or is not expected to generate sufficient cash flow; (2) any pending acquisition that is not consummated; (3) any landfill or development project that is not expected to be successfully completed; and (4) any goodwill or other intangible assets that are determined to be impaired.
In response to such charges and costs and other market factors, we may be required to implement restructuring plans in an effort to reduce the size and cost of our operations and to better match our resources with our market opportunities. As a result of such actions, we would expect to incur restructuring expenses and accounting charges which may be material. Several factors could cause a restructuring to adversely affect our business, financial condition and results of operations. These include potential disruption of our operations, the development of our landfill capacity and recycling technologies and other aspects of our business. Employee moraleand productivity could also suffer and result in unintended employee attrition. Any restructuring would require substantial management time and attention and may divert management from other important work. Moreover, we could encounter delays in executing any restructuring plans, which could cause further disruption and additional unanticipated expense.
See Note 3, Summary of Significant Accounting Policies and Note 16, Divestiture Transactions and Discontinued Operations to our consolidated financial statements included under Item 8 of this Annual Report on Form 10-K for disclosure related to asset impairments recognized during the disclosed reporting periods.
23
23
Our revenues and our operating income experience seasonal fluctuations.
Our transfer and disposal revenues historically have been higher in the late spring, summer and early fall months. This seasonalityreflects the lower volume of solid waste during the late fall, winter and early spring months primarily because:
• the volume of waste relating to C&D activities decreases substantially during the winter months in the northeastern United States; and
• decreased tourism in Vermont, Maine and eastern New York during the winter months tends to lower the volume of solid waste generated by commercial and restaurant customers, which is partially offset by increased volume from the ski industry.
Since certain of our operating and fixed costs remain constant throughout the fiscal year, operating income is impacted by a similarseasonality. In addition, particularly harsh weather conditions typically result in increased operating costs.
Our Recycling business experiences increased volumes of fiber in November and December due to increased newspaper advertising and retail activity during the holiday season.
Adverse weather conditions may limit our operations and increase the costs of collection and disposal.
Our collection and landfill operations could be adversely impacted by extended periods of inclement weather, or by increased severity of weather. Adverse weather could increase our operating costs associated with the collection and disposal of waste, delay the collection and disposal of waste, reduce the volume of waste delivered to our disposal sites, increase the volume of waste collectedunder our existing contracts (without corresponding compensation), decrease the throughput and operating efficiency of our materialsrecycling facilities, or delay construction or expansion of our landfill sites and other facilities. In addition, adverse weather conditions may result in the temporary suspension of our operations, which can significantly affect our operating results in the affected regions during those periods.
We may, in the future, attempt to divest or sell certain parts or components of our business to third-parties, which may result in lower than expected proceeds or losses or the inability to identify potential purchasers.
From time to time in the future, we may sell or divest certain other components of our business. These divestitures may be undertaken for a number of reasons, including to generate proceeds to pay down debt, or as a result of a determination that the specified asset will provide inadequate returns to us, that the asset no longer serves a strategic purpose in connection with our business or that the asset may be more valuable to a third-party. The timing of such sales or divestures may not be entirely within our control. For example, we may need to quickly divest assets to satisfy immediate cash requirements, or we may be forced to sell certain assets prior to canvassing the market or at a time when market conditions for valuations or for financing for buyers are unfavorable. Such sales or divestitures may result in proceeds to us in an amount less than we expect or less than our assessment of the value of those assets. We also may not be able to identify buyers for certain of our assets, particularly given the difficulty that potential acquirers may face in obtaining financing, or we may face opposition from municipalities or communities to a disposition or the proposed buyer. Any sale of our assets could result in a loss on divestiture. Any of the foregoing would have an adverse effect on our business and results of operations.
We may engage in acquisitions in the future with the goal of complementing or expanding our business, including developing additional disposal capacity. However, we may be unable to complete these transactions and, if executed, these transactions maynot improve our business or may pose significant risks and could have a negative effect on our operations.
We have in the past, and we may in the future, make acquisitions in order to acquire or develop additional disposal capacity. These acquisitions may include “tuck-in” acquisitions within our existing markets, acquisitions of assets that are adjacent to or outside of our existing markets, or larger, more strategic acquisitions. In addition, from time to time we may acquire businesses that are complementary to our core business strategy. We may not be able to identify suitable acquisition candidates. If we identify suitable acquisition candidates, we may be unable to successfully negotiate the acquisition at a price or on terms and conditions acceptable to us, including as a result of the limitations imposed by our debt obligations. Furthermore, we may be unable to obtain the necessary regulatory approval to complete potential acquisitions.
Our ability to achieve the benefits from any potential future acquisitions, including cost savings and operating efficiencies, depends in part on our ability to successfully integrate the operations of such acquired businesses with our operations. The integration of acquired businesses and other assets may require significant management time and resources that would otherwise be available for the ongoing management of our existing operations. Any properties or facilities that we acquire may be subject to unknown liabilities, such as undisclosed environmental contamination, for which we would have no recourse, or only limited recourse, to the former owners ofsuch properties. As a result, if a liability were asserted against us based upon ownership of an acquired property, we might be required to pay significant sums to settle it, which could adversely affect our financial results and cash flow.

2424
Efforts by labor unions to organize our employees could divert management attention and increase our operating expenses.
Labor unions regularly make attempts to organize our employees, and these efforts will likely continue in the future. Certain groups of our employees have chosen to be represented by unions, and we have negotiated collective bargaining agreements with these groups.The negotiation of collective bargaining agreements could divert management attention and result in increased operating expenses and lower net income (or increased net loss). If we are unable to negotiate acceptable collective bargaining agreements, we may be subject to union-initiated work stoppages, including strikes. Depending on the type and duration of any labor disruptions, our revenues could decrease and our operating expenses could increase, which could adversely affect our financial condition, results of operations and cash flows. As of January 29, 2016, approximately 4.4% of our employees were represented by unions.
Actions of activist stockholders against us could be disruptive and potentially costly and the possibility that activist stockholders may seek changes that contest, or conflict with, our strategic direction could cause uncertainty about the strategic direction of our business.
Activist stockholders may from time to time attempt to effect changes in our strategic direction and, in furtherance thereof, may seek changes in how we are governed. While our Board of Directors and management team strive to maintain constructive, ongoing communications with all of our stockholders, including activist stockholders, and welcomes their views and opinions with the goal of working together constructively to enhance value for all stockholders, activist campaigns that contest, or conflict with, our strategicdirection could have an adverse effect on us because: • responding to proxy contests and other actions by activist stockholders can disrupt our operations, be costly and time-
consuming, and divert the attention of our Board of Directors and senior management from the pursuit of business strategies, which could adversely affect our results of operations and financial condition;
• perceived uncertainties as to our future direction as a result of changes to the composition of our Board of Directors may lead to the perception of a change in the direction of the business, instability or lack of continuity which may be exploited by our competitors, cause concern to our current or potential customers, may result in the loss of potential business opportunities andmake it more difficult to attract and retain qualified personnel and business partners;
• these types of actions could cause significant fluctuations in our stock price based on temporary or speculative market perceptions or other factors that do not necessarily reflect the underlying fundamentals and prospects of our business; and
• If individuals are elected to our Board of Directors with a specific agenda, it may adversely affect our ability to effectivelyimplement our business strategy and create additional value for our stockholders.
In connection with our 2015 Annual Meeting, an activist investor initially proposed its own slate of director candidates. That activist investor ultimately withdrew its slate of director candidates prior to the 2015 Annual Meeting and all of our director nominees were elected at the 2015 Annual Meeting. That activist investor continues to have a Schedule 13D filed with respect to us and it remains a possibility that such activist investor may still, from time to time, attempt to effect changes in our strategic direction and, in furtherance thereof, may seek changes in how we are governed.
Risks Related to Our Indebtedness
We have substantial debt and have the ability to incur additional debt. The principal and interest payment obligations of such debt may restrict our future operations.
As of December 31, 2015, we had approximately $525.0 million of outstanding principal indebtedness (excluding approximately $26.9 million of outstanding letters of credit issued under the ABL Facility) and an additional $64.1 million of unused commitmentsunder the ABL Facility, which consists of a revolving credit facility with loans thereunder being available up to an aggregate principal amount of $190.0 million, subject to availability under the borrowing base formula as defined in the ABL Facility agreement. Inaddition, the terms of our existing indebtedness permit us to incur additional debt. Our substantial debt, among other things: • requires us to dedicate a substantial portion of any cash flow from operations to the payment of interest and principal due under
our debt, which reduces funds available for other business purposes, including capital expenditures and acquisitions; • places us at a competitive disadvantage compared with some of our competitors that may have less debt and better access to
capital resources; and • limits our ability to obtain additional financing required to fund working capital and capital expenditures and for other general
corporate purposes.
Our ability to satisfy our obligations and to reduce our total debt depends on our future operating performance and on economic,financial, competitive and other factors, many of which are beyond our control. Our business may not generate sufficient cash flow,and future financings may not be available to provide sufficient net proceeds, to meet these obligations or to successfully execute our business strategy.

25
25
To service our indebtedness, we will require a significant amount of cash. However, our ability to generate cash depends on manyfactors beyond our control.
Our ability to make payments on, and to refinance, our indebtedness and to fund planned capital expenditures will depend on ourability to generate cash in the future which, in turn, is subject to general economic, financial, competitive, regulatory and other factors, many of which are beyond our control.
Our business may not generate sufficient cash flows from operations and we may not have available to us future borrowings in anamount sufficient to enable us to pay our indebtedness or to fund our other liquidity needs. In these circumstances, we may need to refinance all or a portion of our indebtedness on or before maturity. We may not be able to refinance any of our indebtedness oncommercially reasonable terms, or at all. Without this financing, we could be forced to sell assets or secure additional financing to make up for any shortfall in our payment obligations under unfavorable circumstances. However, we may not be able to secure additional financing on terms favorable to us or at all and, in addition, the terms of our debt agreements limit our ability to sell assets and also restrict the use of proceeds from such a sale. Moreover, substantially all of our assets have been pledged to secure repayment of our indebtedness under the ABL Facility. In addition, we may not be able to sell assets quickly enough or for amounts sufficient to enable it to meet our obligations.
The agreements governing our various debt obligations impose restrictions on our business and adversely affect our ability to undertake certain corporate actions.
The agreements governing our various debt obligations include covenants imposing significant restrictions on our business. Theserestrictions may affect our ability to operate our business and may limit our ability to take advantage of potential business opportunities as they arise. These covenants place restrictions on our ability to, among other things:
• incur additional debt;
• create liens;
• make certain investments;
• enter into certain transactions with affiliates;
• declare or pay dividends, redeem stock or make other distributions to stockholders; and
• consolidate, merge or transfer or sell assets.
The ABL Facility requires us to meet a number of financial ratios and covenants and restricts our ability to make certain capital expenditures.
Our ability to comply with our debt agreements may be affected by events beyond our control, including prevailing economic, financial and industry conditions. These covenants could have an adverse effect on our business by limiting our ability to takeadvantage of financing, merger and acquisition or other corporate opportunities. Specifically, the ABL Facility requires us to maintain a certain minimum consolidated EBITDA measured at the end of each fiscal quarter. Additionally, during certain periods based upon availability of revolver loans being less than an agreed upon amount, the ABL Facility requires us to meet financial ratios, including, without limitation:
• a minimum consolidated fixed charge coverage ratio; and
• a maximum consolidated first lien funded debt to consolidated EBITDA ratio.
An event of default under any of our debt agreements could permit some of our lenders, including the lenders under the ABL Facility, to declare all amounts borrowed from them to be immediately due and payable, together with accrued and unpaid interest, or, in the case of the ABL Facility, terminate the commitment to make further credit extensions thereunder, which could, in turn, trigger cross-defaults under other debt obligations. If we were unable to repay debt to our lenders, or were otherwise in default under any provision governing our outstanding debt obligations, our secured lenders could proceed against us and against the collateral securing that debt.
Our ability to make acquisitions may be adversely impacted by our outstanding indebtedness and by the price of our stock.
Our ability to make future business acquisitions, particularly those that would be financed solely or in part through cash fromoperations, will be curtailed due to our obligations to make payments of principal and interest on our outstanding indebtedness. We may not have sufficient capital resources, now or in the future, and may be unable to raise sufficient additional capital resources on terms satisfactory to us, if at all, in order to meet our capital requirements for such acquisitions. In addition, the terms of our indebtedness include covenants that directly restrict, or have the effect of restricting, our ability to make certain acquisitions while this

2626
indebtedness remains outstanding. To the extent that the amount of our outstanding indebtedness continues to have a negative impacton our stock price, using our Class A common stock as consideration will be less attractive for potential acquisition candidates. In the past, the trading price of our Class A common stock on the NASDAQ Global Select Market has limited our willingness to use our equity as consideration and the willingness of sellers to accept our shares and as a result has limited, and could continue to limit, the size and scope of our acquisition program. If we are unable to pursue acquisitions that would enhance our business or operations, the potential growth of our business and revenues may be adversely affected.
Risks Related to Our Common Stock
Our Class B common stock is entitled to ten votes per share and is held exclusively by John W. Casella and Douglas R. Casella.
The holders of our Class B common stock are entitled to ten votes per share and the holders of our Class A common stock are entitled to one vote per share. As of December 31, 2015, an aggregate of 988,200 shares of our Class B common stock, representing 9,882,000 votes, were outstanding, all of which were beneficially owned by John W. Casella, our Chairman and Chief Executive Officer, and his brother, Douglas R. Casella, a member of our Board of Directors. Based on the number of shares of common stock outstanding on January 29, 2016, the shares of our Class A common stock and Class B common stock beneficially owned by John W. Casella and Douglas R. Casella represent approximately 22.1% of the aggregate voting power of our stockholders. Consequently, John W. Casellaand Douglas R. Casella may be able to substantially influence certain matters submitted to stockholders for approval, includingproposed amendments to our certificate of incorporation and bylaws requiring an affirmative vote of shares representing at least 75% of the votes that all holders of our Class A common stock and our Class B common stock would be entitled to cast.
ITEM 1B. UNRESOLVED STAFF COMMENTS
None.
ITEM 2. PROPERTIES
Our headquarters is located at 25 Greens Hill Lane, Rutland, Vermont 05701, where we currently lease approximately 12,000 squarefeet of office space.
Our principal property and equipment consists of land, landfills, buildings, machinery and equipment, rolling stock and containers. At January 29, 2016, we operated nine subtitle D landfills, four of which we own and five of which we lease; one landfill permitted to accept C&D materials that we own; 44 transfer stations, 24 of which we own, nine of which we lease and 11 of which we operate under a contract; 34 solid waste collection facilities, 20 of which we own and 14 of which we lease; 18 recycling processing facilities,nine of which we own, six of which we lease and three of which we operate under a contract; four landfill gas-to-energy facilities that we own; and 20 corporate office and other administrative facilities, three of which we own and 17 of which we lease (See Item 1,“Business” of this Annual Report on Form 10-K for property information by operating segment). We believe that our property and equipment are adequately maintained and sufficient for our current operations.
ITEM 3. LEGAL PROCEEDINGS
In the ordinary course of our business and as a result of the extensive governmental regulation of the solid waste industry, we are subject to various judicial and administrative proceedings involving state and local agencies. In these proceedings, an agency may seek to impose fines or to revoke or deny renewal of an operating permit held by us. From time to time, we may also be subject to actions brought by special interest or other groups, adjacent landowners or residents in connection with the permitting and licensing of landfills and transfer stations, or alleging environmental damage or violations of the permits and licenses pursuant to which weoperate. In addition, we have been named defendants in various claims and suits pending for alleged damages to persons and property, alleged violations of certain laws and alleged liabilities arising out of matters occurring during the ordinary operation of a wastemanagement business.
In accordance with FASB ASC 450-20, we accrue for legal proceedings, inclusive of legal costs, when losses become probable and reasonably estimable. As of the end of each applicable reporting period, we review each of our legal proceedings to determine whether it is probable, reasonably possible or remote that a liability has been incurred and, if it is at least reasonably possible, whether a range of loss can be reasonably estimated under the provisions of FASB ASC 450-20. In instances where we determine that a loss is probable and we can reasonably estimate a range of loss we may incur with respect to such a matter, we record an accrual for theamount within the range that constitutes our best estimate of the possible loss. If we are able to reasonably estimate a range, but no amount within the range appears to be a better estimate than any other, we record an accrual in the amount that is the low end of such range. When a loss is reasonably possible, but not probable, we will not record an accrual, but we will disclose our estimate of the possible range of loss where such estimate can be made in accordance with FASB ASC 450-20.

27
27
Expera Old Town, LLC v. Casella Waste Systems, Inc.
On or about November 6, 2015, Expera Old Town, LLC (“Expera”) filed a lawsuit against us in Maine Superior Court, seeking damages for breach of contract and unjust enrichment, and an action for declaratory judgment (the “Lawsuit”). Expera was a successor-in-interest to a contract between us and Old Town Fuel and Fiber (“OTFF”), the former owner of a pulp manufacturing facility (“Facility”) located in Old Town, Maine (the “Contract”). Expera purchased the Facility during the pendency of the bankruptcy of OTFF. Since the filing of the Lawsuit, Expera has sold the Facility and related assets, to MFGR LLC (“MFGR”). MFGR continues to allege that we have the obligation to provide a specialized type of wood fuel to the Facility or, alternatively, that we owe a “Fuel Replacement Fee” of up to $2.0 million a year (subject to the possibility of certain credits against such payments). The Contract expires in 2036. We believe we have meritorious defenses to each of the claims in the Lawsuit, are vigorously contesting these allegations, and have filed a counter claim for funds owed to us by MFGR or Expera.
On or about February 10, 2016, we reached an agreement in principle with MFGR to dismiss this suit with prejudice, and to resolve all outstanding claims of any nature including future claims which could arise under the Contract. The Parties are endeavoring in good faith to enter into a settlement agreement (“SA”) and ancillary agreements. Pursuant to the pending SA, we will pay MFGR $1.3 million upon execution of the SA, and $0.4 million a year for five years following execution of the SA. Accordingly, taking intoaccount the net present value of the settlement payments, we have recorded a reserve of $2.6 million as of December 31, 2015. This includes a contract settlement charge of $1.9 million and $0.7 million of operating expenses recorded in fiscal year 2015. We also reserved $0.1 million as of December 31, 2015 for legal costs associated with the Lawsuit and SA.
We will also enter into a new leachate disposal agreement at market prices with MFGR for the treatment of leachate from JuniperRidge managed by us for the State of Maine located in Old Town, Maine, and MFGR will enter into a waste disposal agreement at market prices with us for the disposal at Juniper Ridge of waste materials produced in the demolition or re-purposing of the Facility.
Greenwood Street Landfill, Worcester, Massachusetts
On July 2, 2014, we received a draft Administrative Consent Order with Penalty and Notice of Noncompliance (“Draft Order”) fromMADEP alleging that a subsidiary, NEWS of Worcester, LLC, had completed substantive closure of a portion of the Greenwood Street Landfill in Worcester, Massachusetts in 2010, at an elevation exceeding the applicable permit condition. While we neitheradmitted nor denied the allegations in the Draft Order, a final Administrative Consent Order with Penalty and Notice of Noncompliance was executed on March 20, 2015 (“Final Order”), and we agreed to pay a civil administrative penalty in a total amount of approximately $0.2 million. MADEP agreed that approximately $0.1 million of that amount could be paid as a Supplemental Environmental Project (“SEP”) for work being done by the Massachusetts Audubon Society at the Broad Meadow Brook Conservation Center & Wildlife Sanctuary in Worcester, Massachusetts. This SEP has been paid in full.
Environmental Remediation Liability
We are subject to liability for environmental damage, including personal injury and property damage, that our solid waste, recycling and power generation facilities may cause to neighboring property owners, particularly as a result of the contamination of drinking water sources or soil, possibly including damage resulting from conditions that existed before we acquired the facilities. We may also be subject to liability for similar claims arising from off-site environmental contamination caused by pollutants or hazardous substances if we or our predecessors arrange or arranged to transport, treat or dispose of those materials. The following matterrepresents our outstanding material claim.
Potsdam Environmental Remediation Liability
On December 20, 2000, the State of New York Department of Environmental Conservation (“DEC”) issued an Order on Consent (“Order”) which named Waste-Stream, Inc. (“WSI”), our subsidiary, General Motors Corporation (“GM”) and Niagara Mohawk Power Corporation (“NiMo”) as Respondents. The Order required that the Respondents undertake certain work on a 25-acre scrap yard and solid waste transfer station owned by WSI in Potsdam, New York, including the preparation of a Remedial Investigation andFeasibility Study (“Study”). A draft of the Study was submitted to the DEC in January 2009 (followed by a final report in May 2009). The Study estimated that the undiscounted costs associated with implementing the preferred remedies would be approximately $10.2million. On February 28, 2011, the DEC issued a Proposed Remedial Action Plan for the site and accepted public comments on the proposed remedy through March 29, 2011. We submitted comments to the DEC on this matter. In April 2011, the DEC issued the final Record of Decision (“ROD”) for the site. The ROD was subsequently rescinded by the DEC for failure to respond to all submitted comments. The preliminary ROD, however, estimated that the present cost associated with implementing the preferred remedies would be approximately $12.1 million. The DEC issued the final ROD in June 2011 with proposed remedies consistent withits earlier ROD. An Order on Consent and Administrative Settlement naming WSI and NiMo as Respondents was executed by the Respondents and DEC with an effective date of October 25, 2013. On January 29, 2016, a Cost-Sharing Agreement was executed between WSI, NiMo, Alcoa Inc. (“Alcoa”) and Reynolds Metal Company (“Reynolds”) whereby Alcoa and Reynolds elected to

2828
voluntarily participate in the onsite remediation activities at a 15% participant share. It is unlikely that any significant expenditures relating to onsite remediation will be incurred until the fiscal year ending December 31, 2017. WSI is jointly and severally liable with NiMo, Alcoa and Reynolds for the total cost to remediate.
We have recorded an environmental remediation liability associated with the Potsdam site based on incurred costs to date and estimated costs to complete the remediation in other accrued liabilities and other long-term liabilities. Our expenditures could be significantly higher if costs exceed estimates. We inflate the estimated costs in current dollars to the expected time of payment and discount the total cost to present value using a risk free interest rate of 1.8%. The changes to the environmental remediation liability associated with the Potsdam environmental remediation liability are as follows:
Fiscal Year EndedDecember 31, 2015
Eight Months Ended December 31, 2014
Beginning balance ............................... $ 5.1 $ 5.3 Accretion expense ..................... 0.1 0.1 Payments ................................... — (0.3)
Ending balance .................................... $ 5.2 $ 5.1
ITEM 4. MINE SAFETY DISCLOSURES
Not applicable.

29 29
PART II
ITEM 5. MARKET FOR REGISTRANT’S COMMON EQUITY, RELATED STOCKHOLDER MATTERS AND ISSUER PURCHASES OF EQUITY SECURITIES
Our Class A common stock trades on the NASDAQ Global Select Market (“NASDAQ Stock Market”) under the symbol CWST. There is no established trading market for our Class B common stock. The following table sets forth the high and low sale prices of our Class A common stock for the periods indicated as quoted on the NASDAQ Stock Market.
Period High Low
Fiscal Year Ended April 30, 2014 ........................................................................First quarter ................................................................................................ $ 4.84 $ 3.81 Second quarter ............................................................................................ $ 6.07 $ 4.64 Third quarter ............................................................................................... $ 6.20 $ 5.00 Fourth quarter ............................................................................................. $ 5.80 $ 4.79
Transition Period Ended December 31, 2014 .......................................................First quarter ................................................................................................ $ 5.58 $ 4.63 Second quarter ............................................................................................ $ 4.99 $ 3.60 Two months ended December 31, 2014 ..................................................... $ 4.52 $ 3.41
Fiscal Year Ended December 31, 2015 ................................................................First quarter ................................................................................................ $ 5.52 $ 3.61 Second quarter ............................................................................................ $ 6.30 $ 5.09 Third quarter ............................................................................................... $ 6.75 $ 5.50 Fourth quarter ............................................................................................. $ 7.24 $ 5.67
On January 29, 2016, the high and low sale prices per share of our Class A common stock as quoted on the NASDAQ Stock Market were $5.98 and $5.82, respectively. As of January 29, 2016 there were approximately 500 holders of record of our Class A commonstock and two holders of record of our Class B common stock.
For purposes of calculating the aggregate market value of the shares of common stock held by non-affiliates, as shown on the cover page of this Annual Report on Form 10-K, we have assumed that all the outstanding shares of Class A common stock were held by non-affiliates except for the shares beneficially held by directors and executive officers and funds represented by them.
Dividends
No dividends have ever been declared or paid on our common stock and we do not anticipate paying any cash dividends on our common stock in the foreseeable future. Our ABL Facility and indentures restrict or condition the payment of dividends on commonstock. The information required by Item 201(d) of Regulation S-K is included in Part III of this Annual Report on Form 10-K.

30
30
Stock Performance Graph
The following performance graph and related information shall not be deemed “soliciting material” or “filed” with the SEC, nor shall such information be incorporated by reference into any future filing under the Securities Act of 1933 or the Securities Exchange Act of 1934, each as amended, except to the extent that we specifically incorporate it by reference into such filing.
The stock performance graph below compares the percentage change in cumulative stockholder return on our Class A common stock for the period from April 30, 2010 through December 31, 2015, with the cumulative total return on the NASDAQ Stock Market (U.S. & Foreign) Index, the Russell 2000 Index, our historical Industry Peer Group and our updated Industry Peer Group. The stock performance graph assumes the investment on April 30, 2010 of $100.00 in our Class A common stock at the closing price on such date, in the NASDAQ Stock Market (U.S. & Foreign) Index, the Russell 2000 Index, our historical Industry Peer Group and our updated Industry Peer Group, and that dividends are reinvested. No dividends have been declared or paid on our Class A common stock.
April 30, 2010
April 30, 2011
April 30, 2012
April 30, 2013
April 30, 2014
December 31,2014
December 31,2015
Casella Waste Systems, Inc. .............................. $ 100.00 $ 131.01 $ 116.86 $ 84.50 $ 98.84 $ 78.29 $ 115.89
NASDAQ Composite ..... $ 100.00 $ 117.60 $ 127.04 $ 141.51 $ 178.00 $ 204.80 $ 216.92 Russell 2000 (1) ............... $ 100.00 $ 122.20 $ 117.00 $ 137.70 $ 165.93 $ 179.07 $ 171.17 Historical Peer Group
(2) ................................ $ 100.00 $ 130.27 $ 126.88 $ 144.52 $ 168.32 $ 181.89 $ 199.96 Peer Group (2) ................ $ 100.00 $ 116.17 $ 109.59 $ 131.89 $ 144.79 $ 164.33 $ 174.39
(1) We changed our broad equity market index from the NASDAQ Stock Market (U.S. & Foreign) Index to the Russell 2000 Index because it is a more comparable benchmark for small-cap companies similar to us.
(2) The historical Industry Peer Group is comprised of Waste Connections Inc. and Progressive Waste Solutions Ltd. The updated Industry Peer Group is comprised of Waste Connections Inc., Progressive Waste Solutions Ltd, Clean Harbors, Inc., Covanta Holding Corp. Waste Management, Inc. and Republic Services, Inc. We revised our Industry Peer Group to align with the peer group that we expect to use in our executive compensation disclosures related to cumulative total shareholder return in our proxy statement for the 2016 Annual Meeting of Stockholders.

31
31
ITEM 6. SELECTED CONSOLIDATED FINANCIAL DATA
The selected consolidated financial and operating data set forth below was derived from the consolidated financial statements included in Item 8 of this Annual Report on Form 10-K and from the consolidated financial statements included in Item 8 of previous AnnualReports on Form 10-K and a Transition Report on Form 10-KT that we filed with the SEC. This information should be read in conjunction with Item 7, “Management’s Discussion and Analysis of Financial Condition and Results of Operations” and our consolidated financial statements and notes thereto included in Item 8 of this Annual Report on Form 10-K.
Fiscal YearEnded
Eight MonthsEnded
December 31, December 31, Fiscal Year Ended April 30,2015 2014 2014 2013 2012 2011
(in thousands, except per share data)Statement of Operations Data: ..................................
Revenues ......................................................... $ 546,500 $ 368,374 $ 497,633 $ 455,335 $ 467,950 $ 454,685 Cost of operations ............................................ 382,615 258,650 354,592 323,014 318,068 306,014 General and administration.............................. 72,892 45,732 61,865 58,205 60,264 63,396 Depreciation and amortization ........................ 62,704 41,485 60,339 56,576 58,415 58,121 Contract settlement charge .............................. 1,940 — — — — — Divestiture transactions ................................... (5,517) (553) 7,455 — 40,746 — Environmental remediation charge .................. — 950 400 — — 549 Development project charge ............................ — — 1,394 — 131 — Severance and reorganization costs ................. — — 586 3,709 — — Expense from divestiture, acquisition and
financing costs ............................................ — — 144 1,410 — — Gain on settlement of acquisition related
contingent consideration ............................. — — (1,058) — — — Legal settlement .............................................. — — — — 1,359 — Asset impairment charge ................................. — — — — — 3,654 Bargain purchase gain ..................................... — — — — — (2,975)Gain on sale of assets ...................................... — — — — — (3,502)
Operating income (loss) ......................... 31,866 22,110 11,916 12,421 (11,033) 29,428 Interest expense, net ........................................ 40,090 25,392 37,863 41,429 44,966 45,489 Other expense (income), net ............................ 2,206 1,825 (436) 23,501 20,111 10,626
Loss from continuing operations before income taxes and discontinued operations .. (10,430) (5,107) (25,511) (52,509) (76,110) (26,687)
Provision (benefit) for income taxes ............... 1,351 703 1,799 (2,526) 1,593 (23,723)
Loss from continuing operations before discontinued operations .............................. (11,781) (5,810) (27,310) (49,983) (77,703) (2,964)
Income (loss) from discontinued operations, net ............................................................... — — 284 (4,480) (614) (2,198)
(Loss) gain on disposal of discontinued operations, net ............................................. — — (378) — 725 43,590
Net (loss) income ............................................ (11,781) (5,810) (27,404) (54,463) (77,592) 38,428 Less: Net income (loss) attributable to
noncontrolling interests ..................... 1,188 208 (4,309) (321) (6) —
Net (loss) income attributable to common stockholders ................................................ $ (12,969) $ (6,018) $ (23,095) $ (54,142) $ (77,586) $ 38,428
Basic and diluted earnings per share: ..............Weighted average common shares
outstanding ................................................. 40,642 40,262 39,820 34,015 26,749 26,105
Net (loss) income per common share (1) ......... $ (0.32) $ (0.15) $ (0.58) $ (1.59) $ (2.90) $ 1.47

32
32
Fiscal Year Ended
Eight MonthsEnded
December 31, December 31, Fiscal Year Ended April 30,2015 2014 2014 2013 2012 2011
(in thousands, except per share data)Other Data: ..................................................
Capital expenditures .......................... $ 49,995 $ 55,061 $ 45,959 $ 55,027 $ 58,363 $ 54,728
Cash flows provided by operating activities ........................................ $ 70,507 $ 38,286 $ 49,642 $ 43,906 $ 64,171 $ 48,209
Cash flows used in investing activities ........................................ $ (48,784) $ (59,697) $ (57,910) $ (89,455) $ (70,634) $ (55,242)
Cash flows (used in) provided by financing activities ........................ $ (21,616) $ 19,322 $ 9,008 $ 44,947 $ 10,229 $ (117,895)
Balance Sheet Data: .................................... Cash and cash equivalents ................. $ 2,312 $ 2,205 $ 2,464 $ 1,755 $ 4,534 $ 1,817
Working capital, net (2) ..................... $ (10,990) $ (9,968) $ (21,405) $ (25,308) $ (18,424) $ (5,362)
Property, plant and equipment, net .... $ 402,252 $ 414,542 $ 403,424 $ 422,502 $ 414,666 $ 452,536
Goodwill ............................................ $ 118,976 $ 119,170 $ 119,139 $ 115,928 $ 101,706 $ 101,204
Total assets ........................................ $ 649,883 $ 669,795 $ 649,897 $ 663,119 $ 633,743 $ 690,581
Long-term debt and capital leases, less current maturities ................... $ 522,199 $ 534,055 $ 507,134 $ 494,987 $ 475,199 $ 463,574
Total stockholders’ (deficit) equity ... $ (21,597) $ (12,020) $ (8,537) $ 15,451 $ 18,231 $ 93,987
(1) Computed as described in Note 3, Summary of Significant Accounting Policies to the consolidated financial statements included in Item 8 of this Annual Report on Form 10-K.
(2) Working capital, net is defined as current assets, excluding cash and cash equivalents, minus current liabilities.
ITEM 7. MANAGEMENT’S DISCUSSION AND ANALYSIS OF FINANCIAL CONDITION AND RESULTS OF OPERATIONS
The following discussion of our financial condition and results of operations should be read in conjunction with the consolidatedfinancial statements and notes thereto, and other financial information, included elsewhere in this Annual Report on Form 10-K. This discussion contains forward-looking statements and involves numerous risks and uncertainties. Our actual results may differ materially from those contained in any forward-looking statements.
Change in Fiscal Year
In June 2014, we elected to change our fiscal year-end from April 30th to December 31st. The change in fiscal year became effective for our fiscal year beginning January 1, 2015 and ending December 31, 2015. As a result of this change, financial results for fiscalyear 2015 are compared to the unaudited financial results for calendar year 2014, and the financial results for transition period 2014 are compared to the unaudited financial results for eight months 2013. When financial results for fiscal year 2014 are compared to financial results for fiscal year 2013, the results are presented on the basis of our previous fiscal year-end on a twelve month basis.
Company Overview
Founded in 1975 with a single truck, Casella Waste Systems, Inc., its wholly-owned subsidiaries and certain partially owned entitiesover which it has a controlling financial interest, is a regional, vertically-integrated solid waste services company. We provideresource management expertise and services to residential, commercial, municipal and industrial customers, primarily in the areas of solid waste collection and disposal, transfer, recycling and organics services. We provide integrated solid waste services in six states: Vermont, New Hampshire, New York, Massachusetts, Maine and Pennsylvania, with our headquarters located in Rutland, Vermont. We manage our solid waste operations on a geographic basis through two regional operating segments, the Eastern and Western regions, each of which provides a full range of solid waste services, and our larger-scale recycling and commodity brokerage operations through our Recycling segment. Organics services, ancillary operations, industrial services, discontinued operations, and earnings from equity method investees, as applicable, are included in our Other segment.

33
33
As of January 29, 2016, we owned and/or operated 34 solid waste collection operations, 44 transfer stations, 18 recycling facilities,nine Subtitle D landfills, four landfill gas-to-energy facilities and one landfill permitted to accept C&D materials.
Acquisitions and Divestitures
Acquisitions
We have a dedicated business development team that identifies acquisition candidates, categorizes the opportunity by strategic fit and perceived level of financial accretion, establishes contact with the appropriate representative of the acquisition candidate and gathers further information on the acquisition candidate.
We have made in the past, and we may make in the future, acquisitions in order to acquire or develop additional disposal capacity.These acquisitions may include “tuck-in” acquisitions within our existing markets, assets that are adjacent to or outside of our existing markets, or larger, more strategic acquisitions. In addition, from time to time, we may acquire businesses that are complementary to our core business strategy. We face considerable competition for acquisition targets, particularly the larger and more meaningful targets, due to among other things, our limited access to and weighted average cost of capital, but we believe that our strong relationships and reputation in New England and the upstate New York area help to offset these factors.
There were no acquisitions in fiscal year 2015.
During transition period 2014, we acquired one solid waste hauling operation in each of the Eastern and Western regions for totalconsideration of $0.4 million, including $0.3 million in cash and $0.1 million in holdbacks to the sellers.
We acquired various businesses during fiscal year 2014, including several solid waste hauling operations, a transfer station, a MRF and an industrial service management business (included in the Other segment) for total consideration of $10.1 million, including $7.9 million in cash, $1.7 million in contingent consideration and holdbacks to the sellers and $0.5 million of other non-cash considerations. We recovered $0.2 million of the purchase price holdback amount we had previously paid and were relieved of anypotential contingent consideration obligation associated with the acquisition of an industrial service management business earlier in fiscal year 2014. As a result, we recorded a $1.1 million gain on settlement of acquisition related contingent consideration in fiscal year 2014.
We acquired various solid waste hauling operations during fiscal year 2013, including the acquisition of all of the outstanding capital stock of BBI in the Eastern region, for total consideration of $27.9 million in cash and approximately 0.6 million shares of our Class A common stock, valued at an aggregate of $2.7 million. We recorded an additional $5.1 million to goodwill for the increased deferred tax liability related to the BBI acquisition based on the impact of temporary differences between the amounts of assets and liabilities recognized for financial reporting purposes and such amount recognized for income tax purposes. See Note 14, Income Taxes to the consolidated financial statements included in Item 8 of this Annual Report on Form 10-K for further discussion. The acquisition of BBI, a provider of solid waste collection, transfer and liquid waste services in New Hampshire and Maine, provided us the opportunity to internalize additional waste and recyclables and to consolidate operations, routes and transportation within the Eastern region.
Divestitures
From time to time, we may sell or divest certain investments or other components of our business. These divestitures may be undertaken for a number of reasons, including: to generate proceeds to pay down debt; as a result of a determination that the specifiedasset will provide inadequate returns to us or that the asset no longer serves a strategic purpose in connection with our business; or as a result of a determination that the asset may be more valuable to a third-party. We will continue to look to divest certain activities and investments that no longer enhance or complement our core business if the right opportunity presents itself.
Sale of Business. In fiscal year 2015, we divested a business, which included the sale of certain assets associated with various waste collection routes in the Western region, for total consideration of $0.9 million, resulting in a gain of $0.6 million.
CARES and Related Transaction. We executed a purchase and sale agreement in fiscal year 2015 pursuant to which we and Altela agreed to sell certain assets of the CARES water treatment facility to a third-party. We sold these assets of CARES for purchaseconsideration of $3.5 million, resulting in a gain of $2.9 million in fiscal year 2015, 49% of which was attributable to Altela, the noncontrolling interest holder. As of December 31, 2015, we continued to pursue the dissolution of CARES in accordance with theCARES agreement.
In connection with this transaction, we also sold certain of our equipment and real estate to the same unrelated third-party for total consideration of $1.1 million, resulting in a gain of $0.9 million in fiscal year 2015.

3434
There were no divestitures in transition period 2014.
GreenFiber. In fiscal year 2014, we and LP executed a purchase and sale agreement with a limited liability company formed by Tenex Capital Partners, L.P., pursuant to which we and LP agreed to sell our membership interests in GreenFiber for total cash consideration of $18.0 million plus an expected working capital true-up less any indebtedness and other unpaid transaction costs of GreenFiber as of the closing date. The transaction was completed for $19.2 million in gross cash proceeds, including a $1.2 million working capitaladjustment. After netting indebtedness of GreenFiber and transaction costs, our 50% of the net cash proceeds amounted to $3.4 million. After considering the $0.6 million impact of our unrealized losses relating to derivative instruments in accumulated other comprehensive loss on our investment in GreenFiber, we recorded a gain on sale of equity method investment of $0.6 million in fiscalyear 2014. We had previously accounted for our 50% membership interest in GreenFiber using the equity method of accounting.
Maine Energy. In fiscal year 2013, we executed a purchase and sale agreement with the City of Biddeford, Maine, pursuant to which we agreed to sell the real property of Maine Energy to the City of Biddeford. We agreed to sell Maine Energy for an undiscountedpurchase consideration of $6.7 million, which is being paid to us in installments over twenty-one years. Later in fiscal year 2013, we closed the transaction, ceased operations of the Maine Energy facility, and initiated the decommissioning, demolition and site remediation process in accordance with the provisions of the agreement. In fiscal year 2015, we completed the demolition process and site remediation under the auspices and in accordance with work plans approved by the Maine Department of Environmental Protection and the EPA. Based on the total incurred costs to fulfill our obligation under the agreement, we reversed a reserve of $1.1 million of excess costs to complete the divestiture in fiscal year 2015.
BioFuels. In fiscal year 2013, we initiated a plan to dispose of BioFuels and as a result, the assets associated with BioFuels were classified as held-for-sale and the results of operations were recorded as income from discontinued operations. Assets of the disposal group previously classified as held-for-sale, and subsequently included in discontinued operations, included certain inventory along with plant and equipment. In fiscal year 2014, we executed a purchase and sale agreement with ReEnergy Lewiston LLC (“ReEnergy”), pursuant to which we agreed to sell certain assets of BioFuels, which was located in our Eastern region, to ReEnergy. We agreed to sell the BioFuels assets for undiscounted purchase consideration of $2.0 million, which was to be paid to us in equal quarterly installments over five years commencing November 1, 2013, subject to the terms of the purchase and sale agreement. Therelated note receivable was paid in full by ReEnergy in transition period 2014. We recognized a $0.4 million loss on disposal ofdiscontinued operations in fiscal year 2014 associated with the disposition. As a part of the divestiture, we agreed to complete certain site improvements at Biofuels, which were completed in transition period 2014. As a result, we recorded a $0.6 million gain in transition period 2014 associated with reversing the excess remaining reserves not needed to complete the site improvements.
Results of Operations
The following table summarizes our revenues and operating expenses (in millions) for the following periods:
Twelve Months Ended Eight Months Ended Fiscal Year EndedDecember 31, December 31, April 30,
2015 2014 2014 2013 2014 2013Unaudited Unaudited
Revenues ........................................................................................ $ 546.5 $ 525.9 $ 368.4 $ 340.1 $ 497.6 $ 455.3
Operating expenses: ....................................................................... Cost of operations ................................................................. 382.6 377.2 258.7 236.1 354.6 323.0 General and administration................................................... 72.9 66.8 45.7 40.8 61.9 58.2 Depreciation and amortization ............................................. 62.7 61.2 41.5 40.6 60.3 56.6 Contract settlement charge ................................................... 1.9 — — — — — Divestiture transactions ........................................................ (5.5) 6.9 (0.6) — 7.5 — Development project charge ................................................. — 1.4 — — 1.4 — Environmental remediation charge ....................................... — 1.0 1.0 0.4 0.4 — Severance and reorganization costs ...................................... — 0.4 — 0.2 0.6 3.7 Gain on settlement of acquisition related contingent
consideration .................................................................... — (1.1) — — (1.1) — Expense from divestiture, acquisition and financing
costs ................................................................................. — — — 0.1 0.1 1.4
514.6 513.8 346.3 318.2 485.7 442.9
Operating income ........................................................................... $ 31.9 $ 12.1 $ 22.1 $ 21.9 $ 11.9 $ 12.4

35
35
Revenues
We manage our solid waste operations, which include a full range of solid waste services, on a geographic basis through two regional operating segments, which we designate as the Eastern and Western regions. Revenues in our Eastern and Western regions consist primarily of fees charged to customers for solid waste collection and disposal, landfill, landfill gas-to-energy, transfer and recyclingservices. We derive a substantial portion of our collection revenues from commercial, industrial and municipal services that aregenerally performed under service agreements or pursuant to contracts with municipalities. The majority of our residential collection services are performed on a subscription basis with individual households. Landfill and transfer customers are charged a tipping fee on a per ton basis for disposing of their solid waste at our disposal facilities and transfer stations. We also generate and sell electricity at certain of our landfill facilities. In addition, revenues from our Recycling segment consist of revenues derived from municipalities and customers in the form of processing fees, tipping fees and commodity sales. Organics services, ancillary operations, major account and industrial services, discontinued operations, and earnings from equity method investees, as applicable, are included in our Other segment. Our revenues are shown net of inter-company eliminations.
The table below shows revenue attributable to services provided (in millions) for the following periods:
Twelve Months Ended Eight Months Ended Fiscal Year EndedDecember 31, December 31, April 30,
2015 2014 2014 2013 2014 2013 Unaudited Unaudited
Collection ............................................................................................. $ 238.3 $ 229.2 $ 157.8 $ 153.2 $ 225.4 $ 209.0 Disposal ............................................................................................... 156.5 138.1 102.3 93.0 128.8 115.0 Power generation ................................................................................. 6.8 9.0 5.0 5.5 9.5 11.3 Processing ............................................................................................ 6.1 9.3 6.7 7.1 8.9 6.9
Solid waste operations ................................................................ 407.7 385.6 271.8 258.8 372.6 342.2 Organics ..................................................................................... 39.1 39.8 27.0 25.0 37.8 35.3 Customer solutions ..................................................................... 53.4 52.2 35.8 27.0 43.4 35.5 Recycling .................................................................................... 46.3 48.3 33.8 29.3 43.8 42.3
Total revenues ...................................................................................... $ 546.5 $ 525.9 $ 368.4 $ 340.1 $ 497.6 $ 455.3
Revenues - Fiscal Year 2015 compared to Unaudited Calendar Year 2014
The following table provides details associated with the period-to-period change in revenues (dollars in millions) attributable to services provided:
Period-to-Period Change for Fiscal Year 2015 vs.
Calandar Year 2014Amount % of Growth
Price ................................................................................................. $ 10.5 2.0% Volume ............................................................................................. 16.2 3.1% Commodity price & volume ............................................................. (3.4) (0.7)%Acquisitions & divestitures .............................................................. 0.4 0.1% Closed landfill .................................................................................. (0.7) (0.1)%Fuel oil and recovery fee .................................................................. (0.9) (0.2)%
Total solid waste ..................................................................... 22.1 4.2%
Organics ........................................................................................... (0.7) (0.1)%
Customer solutions ........................................................................... 1.2 0.2%
Recycling Operations: ......................................................................Price ................................................................................................. (6.2) (1.2)%Volume ............................................................................................. 4.2 0.8%
Total recycling ........................................................................ (2.0) (0.4)%
Total ................................................................................................. $ 20.6 3.9%

3636
Solid waste revenues
Price.
• The price change component in fiscal year 2015 total solid waste revenues growth is the result of $8.9 million from favorablecollection pricing and $1.6 million from favorable disposal pricing associated primarily with our landfills and transfer stations.
Volume.
• The volume change component in fiscal year 2015 total solid waste revenues growth is the result of $16.8 million from higherdisposal volumes (of which $8.4 million relates to higher landfill volumes, $4.1 million relates to higher transfer station volumes associated with two new transfer station contracts and organic growth, and $4.3 million relates to transportation) and $1.4 million from higher collection volumes, partially offset by $2.0 million from lower processing volumes (mainly water treatment and recycling processing).
Commodity price and volume.
• The commodity price and volume change component in fiscal year 2015 total solid waste revenues growth is the result of $2.0 million from unfavorable energy pricing at our landfill gas-to-energy operations, $0.4 million from unfavorable commodity pricing and $1.0 million from lower landfill gas-to-energy and processing commodity volumes.
Acquisitions and divestitures.
• The acquisitions and divestitures change component in fiscal year 2015 total solid waste revenues growth is the result of increased revenues from the acquisition of two solid waste hauling operations in September and October 2014, partially offset by decreased revenues associated primarily with an asset exchange in December 2014 and the divestiture of a business in May 2015.
Closed landfill.
• The closed landfill change component in fiscal year 2015 total solid waste revenues growth is the result of our Worcester landfill, which stopped accepting waste and ceased operations in April 2014 in accordance with its permit.
Fuel and oil recovery fee.
• The fuel and oil recovery fee change component in fiscal year 2015 total solid waste revenues growth is the result of lower revenues generated by our fuel and oil recovery fee program in response to lower diesel fuel index prices on which the surcharge is based.
Organics revenues
• Fiscal year 2015 revenues decreased as the result of lower volumes and a decline in our floating rate fuel and oil recovery fee in response to lower diesel fuel index prices on which the surcharge is based.
Customer solutions revenues
• Fiscal year 2015 revenues increased from higher volumes due to organic business growth, partially offset by the pass throughimpact of unfavorable commodity prices in the marketplace.
Recycling revenues
• Fiscal year 2015 revenues decreased primarily as the result of unfavorable commodity prices in the marketplace, partially offsetby higher commodity volumes and higher tipping fees.

37
37
Revenues – Transition Period 2014 compared to Unaudited Eight Month Period 2013
The following table provides details associated with the period-to-period change in revenues (dollars in millions) attributable to services provided:
Period-to-PeriodChange for the Transition Period 2014 vs. Eight Month Period 2013
Amount % of Growth
Solid Waste Operations: ..............................................Price ............................................................................ $ 2.6 0.8% Volume ........................................................................ 11.7 3.4% Commodity price & volume ........................................ (0.6) (0.2)% Acquisitions & divestitures ......................................... 3.7 1.1% Closed landfill ............................................................. (4.4) (1.3)%
Total solid waste ................................................ 13.0 3.8%
Organics ...................................................................... 2.0 0.6%
Customer solutions ...................................................... 8.9 2.6%
Recycling Operations: .................................................Price ............................................................................ 0.2 0.1% Volume ........................................................................ 3.1 0.9% Acquisitions ................................................................ 1.1 0.3%
Total recycling................................................... 4.4 1.3%
Total ............................................................................ $ 28.3 8.3%
Solid waste revenues
Price.
• The price change component in transition period 2014 total solid waste revenues growth is the result of $2.5 million from favorable collection pricing and $0.1 million from favorable disposal pricing associated with our landfills.
Volume.
• The volume change component in transition period 2014 total solid waste revenues growth is the result of $10.6 million from disposal volume increases (of which $6.4 million relates to higher transfer station volumes associated with a mix shift from landfills to transfer stations and four new transfer station contracts, $3.3 million relates to landfills and $0.9 million relates to transportation) and $1.1 million from collection volume increases.
Commodity price and volume.
• The commodity price and volume change component in transition period 2014 total solid waste revenues growth is the result of$0.6 million from lower power generation and processing commodity volumes.
Acquisitions and divestitures.
• The acquisitions and divestitures change component in transition period 2014 total solid waste revenues growth is the result of increased revenues from various business acquisitions, including several solid waste hauling operations and a transfer station,completed between August 2013 and October 2014.
Closed landfill.
• The closed landfill change component in transition period 2014 total solid waste revenues growth is the result of our Worcesterlandfill, which ceased operations in April 2014 in accordance with its permit.

3838
Organics revenues
• The increase in revenues for transition period 2014 is the result of higher volumes associated with organic business growth.
Customer solutions revenues
• The increase in revenues for transition period 2014 is the result of $7.9 million from higher volumes and $1.0 million from the acquisition of an industrial service management business in September 2013.
Recycling revenues
• The increase in revenues for transition period 2014 is primarily the result of higher commodity volumes and the acquisition of the remaining 50% membership interest of Tompkins in December 2013.
Revenues – Fiscal Year 2014 compared to Fiscal Year 2013
The following table provides details associated with the period-to-period change in revenues (dollars in millions) attributable to services provided:
Period-to-PeriodChange for the Fiscal Years
2014 vs. 2013Amount % of Growth
Price ................................................................................... $ 2.5 0.5% Volume ............................................................................... 19.0 4.2% Commodity price & volume ............................................... 0.7 0.2% Acquisitions & divestitures ................................................ 9.3 2.0% Closed landfill .................................................................... (0.5) (0.1)% Fuel oil and recovery fee .................................................... (0.6) (0.1)%
Total solid waste ....................................................... 30.4 6.7%
Organics ............................................................................. 2.5 0.5%
Customer solutions ............................................................. 7.9 1.7%
Recycling Operations: ........................................................Price ................................................................................... 0.1 0.0% Volume ............................................................................... 1.0 0.3% Acquisitions ....................................................................... 0.4 0.1%
Total recycling .......................................................... 1.5 0.4%
Total ................................................................................... $ 42.3 9.3%
Solid waste revenues
Price.
• The price change component in fiscal year 2014 total solid waste revenues growth is the result of $2.9 million from favorablecollection pricing, partially offset by $0.4 million from unfavorable disposal pricing associated with our landfills.
Volume.
• The volume change component in fiscal year 2014 total solid waste revenues growth is the result of $15.1 million from disposalvolume increases (of which $7.3 million relates to landfills, $5.3 million relates to transfer stations and $2.5 million relates to transportation), $3.1 million from collection volume increases and $0.8 million from processing volume increases.

39
39
Commodity price and volume.
• The commodity price and volume change component in fiscal year 2014 total solid waste revenues growth is the result of $2.5 million from favorable commodity pricing within power generation, partially offset by $1.4 million from lower power generation and processing volumes and $0.4 million from unfavorable commodity pricing within processing.
Acquisitions and divestitures.
• The acquisitions and divestitures change component in fiscal year 2014 total solid waste revenues growth is the result of $16.7 million in increased revenues from acquisitions, primarily associated with our acquisition of BBI in December 2012, and our acquisition of four solid waste hauling operations and a transfer station in fiscal year 2014. Increased revenues were partiallyoffset by $7.4 million in decreased revenues associated with the Maine Energy divestiture.
Closed landfill.
• The closed landfill change component in fiscal year 2014 total solid waste revenues growth is the result of our Worcester landfill, which stopped accepting waste and ceased operations in April 2014 in accordance with its permit.
Fuel and oil recovery fee.
• The fuel and oil recovery fee change component in fiscal year 2014 total solid waste revenues growth is the result of lower revenues being generated by our fuel and oil recovery fee program in response to lower diesel fuel index prices on which the surcharge is based.
Organics revenues
• The increase in revenues for fiscal year 2014 is primarily the result of higher volumes.
Customer solutions revenues
• The increase in revenues for fiscal year 2014 is the result of $2.6 million from higher volumes and $5.3 million from the acquisition of an industrial service management business.
Recycling revenues
• The increase in revenues for fiscal year 2014 is primarily the result of higher commodity volumes and the acquisition of theremaining 50% membership interest of Tompkins.
Operating Expenses
The following table summarizes our cost of operations, general and administration expenses and depreciation and amortization expenses as a percentage of revenues for the following periods:
Twelve Months EndedDecember 31,
Eight Months EndedDecember 31,
Fiscal Year EndedApril 30,
2015 2014 2014 2013 2014 2013 Unaudited Unaudited
Cost of operations ..................................................................... 70.0% 71.7% 70.2% 69.4% 71.3% 70.9% General and administration ....................................................... 13.3% 12.7% 12.4% 12.0% 12.4% 12.8% Depreciation and amortization .................................................. 11.5% 11.6% 11.3% 11.9% 12.1% 12.4%
Cost of Operations
Cost of operations includes labor costs, tipping fees paid to third-party disposal facilities, fuel costs, maintenance and repair costs of vehicles and equipment, workers’ compensation and vehicle insurance costs, the cost of purchasing materials to be recycled, third-party transportation costs, district and state taxes, host community fees and royalties. Cost of operations also includes accretion expense related to final capping, closure and post-closure obligations, leachate treatment and disposal costs and depletion of landfill operating lease obligations.

4040
Cost of Operations – Fiscal Year 2015 compared to Unaudited Calendar Year 2014
Our cost of operations increased $5.4 million, decreasing 1.7% as a percentage of revenues, for fiscal year 2015 when compared to calendar year 2014.
The period-to-period changes in cost of operations can be primarily attributed to the following:
• Direct operational costs increased $4.2 million due to: higher equipment rental costs; higher operating costs (including grounds maintenance and gas control) at certain of our landfills; and higher leachate disposal costs at certain of our landfills due tounusually high rainfall earlier in the year. These cost increases were partially offset by lower gas treatment costs at JuniperRidge and lower depletion of landfill operating lease obligations at Southbridge and certain of our Western region landfills.
• Maintenance and repair costs increased $3.9 million due to: higher fleet maintenance costs in the Eastern and Western regionsand higher facility maintenance costs associated with our Recycling segment and our Eastern region landfills.
• Labor and related benefit costs increased $3.3 million due to: additional labor costs due to higher collection and transfer station volumes in the Eastern region associated with new municipal contracts and organic customer growth; processing of higher commodity volumes due to new contracts and facilities in the Recycling segment; and lower productivity as a result of prolonged inclement winter weather into the early spring of 2015.
• Third-party direct costs increased $0.2 million due to: higher collection and disposal volumes from organic customer growth, including various new contracts, and various acquisitions; and higher commodity volumes in the Recycling segment. These cost increases were offset by lower purchased material costs associated with declining commodity prices within the Recycling segment; lower purchased material costs in our Customer Solutions business; and the expiration of an out-of-market put-or-pay waste disposal contract in the Eastern region.
• Fuel costs decreased $6.0 million due to lower diesel fuel prices in the marketplace. The favorable impact associated with lower diesel fuel prices was more than offset by interrelated higher recycling tipping fees, lower fuel and oil recovery fees, lower recycling commodity pricing and lower energy pricing revenues during fiscal year 2015.
Cost of Operations – Transition Period 2014 compared to Unaudited Eight Month Period 2013
Our cost of operations increased $22.6 million, or 0.8% as a percentage of revenues, for transition period 2014 when compared toeight month period 2013.
The period-to-period change in cost of operations can be primarily attributed to the following:
• Third-party direct costs increased $11.8 million due to: organic and acquisition growth in our Customer Solutions business, which has a higher inherent direct cost structure; higher collection and disposal volumes from organic customer growth and the acquisition of a transfer station in the Eastern region; higher volumes in our Organics business; and higher disposal volumes associated with four new transfer station contracts and the acquisition of various hauling operations in the Western region.
• Maintenance and repair costs increased $4.8 million due to: higher facility maintenance costs associated with our Recycling segment, our hauling operations, certain landfills in our Western and Eastern regions, and the acquisition of a transfer station in the Eastern region; and higher fleet repair and maintenance costs associated with hauling operations.
• Labor and related benefit costs increased $4.9 million due to: increased overall healthcare costs and increased labor costs associated with higher collection and transfer station volumes in the Eastern region and new contracts and facilities in the Recycling segment.
• Direct operational costs increased $1.5 million due to: higher depletion of landfill operating lease obligations associated with increased volumes received at our landfills; an increase in host community fees and royalties; higher equipment rental costs associated with an increase in fleet and landfill equipment rentals; an increase in gas treatment costs at Juniper Ridge; and alower gain on sale of fixed assets in transition period 2014.
• Fuel costs decreased $0.6 million primarily due to lower diesel fuel prices in the marketplace.
Cost of Operations – Fiscal Year 2014 compared to Fiscal Year 2013
Our cost of operations increased $31.6 million, or 0.4% as a percentage of revenues, for fiscal years 2014 when compared to fiscalyear 2013.

41
41
The period-to-period change in cost of operations can be primarily attributed to the following:
• Third-party direct costs increased $17.4 million due to: organic and acquisition growth in our Customer Solutions business; higher volumes in our Organics business; higher collection and disposal volumes from organic customer growth and the acquisition of BBI and other tuck-in acquisitions; and an increase in state, local and other disposal fees associated with higherdisposal volumes and higher taxes due to a shift in waste mix type.
• Direct operational costs increased $5.6 million due to: higher costs at our landfills (including increases in leachate treatment costs due to the timing of cell development, landfill gas treatment costs and maintenance costs); higher equipment rental costsassociated with an increase in fleet and landfill equipment rentals; an increase in host and royalty fees and higher depletion of landfill operating lease obligations due to increased volumes received at our landfills; and an increase in vehicle insurance costs.
• Maintenance costs increased $4.8 million due to: higher vehicle maintenance costs associated with the integration of the BBI vehicle fleet; higher facility costs associated with unplanned maintenance activities within the Recycling segment; and higher container repair costs.
• Labor and related benefit costs increased $2.3 million due to: the acquisition of BBI; processing higher volumes of commoditiesthrough our Recycling segment; and lower productivity as a result of prolonged inclement winter weather.
General and Administration
General and administration expenses include management, clerical and administrative compensation and overhead, professional services and costs associated with marketing, sales force and community relations efforts.
General and Administration – Fiscal Year 2015 compared to Unaudited Calendar Year 2014
Our general and administration expenses increased $6.1 million, or 0.6% as a percentage of revenues, for fiscal year 2015 when compared to calendar year 2014.
The period-to-period change in general and administration expenses can be primarily attributed to the following:
• Labor and related benefit costs increased $3.7 million due to higher wages and salaries, higher incentive compensation costs,and higher equity compensation costs.
• Professional fees increased $1.1 million due to $1.9 million of consulting and legal fees resulting from our responses to theadvance notice of nomination sent to us by an activist investor nominating its own candidates for election as directors at our 2015 Annual Meeting in opposition to the three candidates whom we recommended. That activist investor ultimately withdrew its slate of director candidates prior to the 2015 Annual Meeting and all of our director nominees were elected at the 2015 Annual Meeting by our stockholders. These costs were partially offset by lower accounting and audit fees associated with timing changes based on our change in fiscal year-end to December 31st.
• Other costs increased $1.2 million due to higher property taxes, insurance costs and service agreements.
General and Administration – Transition Period 2014 compared to Unaudited Eight Month Period 2013
Our general and administration expenses increased $4.9 million, or 0.4% as a percentage of revenues, when comparing transition period 2014 to eight month period 2013.
The period-to-period change in general and administration expenses can be primarily attributed to the following:
• Labor and related benefit costs increased $3.8 million due to: additional labor costs associated with growth in our Customer Solutions business; increased overall healthcare costs; and increased incentive compensation costs.
• Professional fees increased $0.9 million due to: accounting and auditing services associated with the change in fiscal year-end; higher legal costs associated with third-party legal advice, including a legal settlement with the New York Attorney General; and a loss accrued for a potential legal settlement with the MADEP. See discussion in Part I, Item 3, “Legal Proceedings” of this Annual Report on Form 10-K.
General and Administration – Fiscal Year 2014 compared to Fiscal Year 2013
Our general and administration expense increased $3.7 million, or 0.4% as a percentage of revenues, for fiscal year 2014 when compared to fiscal year 2013.

42
42
The period-to-period change in general and administration expenses can be primarily attributed to the following:
• Labor and related benefit costs increased $5.7 million due to additional personnel costs associated with acquisitions, growth in our Customer Solutions business, recruitment and relocation, and an increase in incentive compensation costs.
• Professional fees decreased $1.3 million due to lower legal costs associated with fewer ongoing legal proceedings and lower consulting costs.
Depreciation and Amortization
Depreciation and amortization includes: (i) depreciation of property and equipment, including assets recorded for capital leases, on a straight-line basis over the estimated useful life of the assets; (ii) amortization of landfill costs (including those costs incurred and all estimated future costs for landfill development and construction, along with asset retirement costs arising from closure and post-closure obligations) on a units-of-consumption method as landfill airspace is consumed over the total estimated remaining capacity of a site, which includes both permitted capacity and unpermitted expansion capacity that meets our criteria for amortization purposes; (iii) amortization of landfill asset retirement costs arising from final capping obligations on a units-of-consumption method as airspace is consumed over the estimated capacity associated with each final capping event and (iv) amortization of intangible assets with a definite life, using either an economic benefit provided approach or a straight-line basis over the definitive terms of the relatedagreements.
The table below shows, for the periods indicated, the components of depreciation and amortization expense (in millions):
Twelve Months Ended Eight Months Ended Fiscal Year EndedDecember 31, December 31, April 30,
2015 2014 2014 2013 2014 2013Unaudited Unaudited
Depreciation expense ..................................................................... $ 33.2 $ 32.8 $ 21.6 $ 21.8 $ 33.1 $ 34.1 Landfill amortization expense ........................................................ 27.0 25.4 17.9 17.2 24.7 21.2 Other amortization expense ........................................................... 2.5 3.0 2.0 1.6 2.5 1.3
$ 62.7 $ 61.2 $ 41.5 $ 40.6 $ 60.3 $ 56.6
Depreciation and Amortization – Fiscal Year 2015 compared to Unaudited Calendar Year 2014
The change in the components of depreciation and amortization expense when comparing fiscal year 2015 to calendar year 2014 canprimarily be attributed to the following:
• Depreciation expense increased due to: changes in our depreciable asset base as a result of the timing of various capital expenditures, including fleet upgrades and repairs and container purchases, made late in calendar year 2014, partially offset bythe impact of various divestitures and asset sales, and the impairment of the asset group of CARES.
• Landfill amortization expense increased due to: an increase in landfill volumes at our Eastern region landfills and at certain of our landfills within the Western region; and an amortization rate adjustment as a result of updating cost estimates and other assumptions associated with the annual year-end review of our landfills.
Depreciation and Amortization – Transition Period 2014 compared to Unaudited Eight Month Period 2013
The change in the components of depreciation and amortization expense when comparing transition period 2014 to eight month period2013 can primarily be attributed to the following:
• Landfill amortization expense increased during transition period 2014 due to: an increase in landfill volumes at our Southbridge landfill in the Eastern region and at certain of our landfills within the Western region; and an increase in estimated final capping and closure costs at our Worcester landfill.
• Other amortization expense increased during transition period 2014 due to an increase in our intangible assets due to acquisitions made in transition period 2014 and the timing of various acquisitions made in fiscal year 2014.

4343
Depreciation and Amortization – Fiscal Year 2014 compared to Fiscal Year 2013
The change in the components of depreciation and amortization expense when comparing fiscal year 2014 to fiscal year 2013 can primarily be attributed to the following:
• Depreciation expense decreased $1.0 million due to the divestiture of Maine Energy in the third quarter of fiscal year 2013,which reduced our depreciable asset base for all of fiscal year 2014.
• Landfill amortization expense increased $3.5 million due to: an increase in landfill volumes in the Eastern region and at certainof our landfills within the Western region; an increase in estimated final capping and closure costs associated with our Worcester landfill in the Eastern region; and additional post-closure costs associated with the extension of our post-closure commitment at various closed landfills.
• Other amortization expense increased $1.2 million associated with an increase in our amortizable intangible assets due to acquisitions made in fiscal year 2014 and the acquisition of BBI in December 2012.
Divestiture Transactions
Sale of Business. In fiscal year 2015, we divested a business, which included the sale of certain assets associated with various waste collection routes in the Western region, for total consideration of $0.9 million, resulting in a gain of $0.6 million.
Maine Energy. In fiscal year 2013, we executed a purchase and sale agreement with the City of Biddeford, Maine, pursuant to which we agreed to sell the real property of Maine Energy to the City of Biddeford. We agreed to sell Maine Energy for an undiscountedpurchase consideration of $6.7 million, which is being paid to us in installments over twenty-one years. Later in fiscal year 2013, we closed the transaction, ceased operations of the Maine Energy facility, and initiated the decommissioning, demolition and site remediation process in accordance with the provisions of the agreement. In fiscal year 2015, we completed the demolition process and site remediation under the auspices and in accordance with work plans approved by the Maine Department of Environmental Protection and the EPA. Based on the total incurred costs to fulfill our obligation under the agreement, we reversed a reserve of $1.1 million of excess costs to complete the divestiture in fiscal year 2015.
CARES and Related Transaction. CARES is a joint venture that owned and operated a water and leachate treatment facility for the natural gas drilling industry in Pennsylvania. Our joint venture partner in CARES is Altela. As of December 31, 2015, our ownership interest in CARES is 51%. In accordance with the FASB ASC 810-10-15, we consolidate the assets, liabilities, noncontrolling interest and results of operations of CARES into our consolidated financial statements due to our controlling financial interest in the joint venture.
In fiscal year 2014, we determined that assets of the CARES water treatment facility were no longer operational or were not operating within product performance parameters. As a result, we initiated a plan to abandon and shut down the operations of CARES. It wasdetermined that the carrying value of the assets of CARES was no longer recoverable and, as a result, the carrying value of the asset group was assessed for impairment and impaired. As a result, we recorded an impairment charge of $7.5 million in each of fiscal year 2014 and calendar year 2014 to the asset group of CARES in the Western region.
We executed a purchase and sale agreement in fiscal year 2015 pursuant to which we and Altela agreed to sell certain assets of the CARES water treatment facility to a third-party. We sold these assets of CARES for purchase consideration of $3.5 million, resulting in a gain of $2.9 million in fiscal year 2015, 49% of which was attributable to Altela, the noncontrolling interest holder. As of December 31, 2015, we continued to pursue the dissolution of CARES in accordance with the CARES agreement.
In connection with this transaction, we also sold certain of our equipment and real estate to the same third-party for total consideration of $1.1 million, resulting in a gain of $0.9 million in fiscal year 2015.
BioFuels. As a part of the disposition of BioFuels, we agreed to complete certain site improvements that were completed in transition period 2014. As a result, we recorded a $0.6 million gain in each of transition period 2014 and calendar year 2014 associated with reversing the excess remaining reserves not needed to complete the site improvements.
Contract Settlement Charge
In fiscal year 2015, we recorded a contract settlement charge of $1.9 million associated with the Expera Old Town, LLC v. Casella Waste Systems, Inc. legal matter. See Item 3, “Legal Proceedings” and Note 10, Commitments and Contingencies to our consolidated financial statements included under Item 8 of this Annual Report on Form 10-K for further disclosure.

44
44
Development Project Charge
In each of fiscal year 2014 and calendar year 2014, we recorded a charge of $1.4 million for deferred costs associated with a gas pipeline development project no longer deemed viable.
Environmental Remediation Charge
In each of transition period 2014 and calendar year 2014, we recorded an environmental remediation charge of $1.0 million associated with remediation performed at our Southbridge landfill in the Eastern region. We had previously recorded an environmental remediation charge of $0.4 million in eight month period 2013 and fiscal year 2014 associated with remediating this site.
Severance and Reorganization Costs
In calendar year 2014, eight month period 2013 and fiscal year 2014, we recorded charges of $0.4 million, $0.2 million and $0.6million, respectively, for severance costs associated with various planned reorganization efforts including the divestiture of Maine Energy.
In fiscal 2013, we recorded a charge of $3.7 million for severance costs associated primarily with the realignment of our operations in order to streamline functions and improve our cost structure, the closure of Maine Energy and a reorganization of senior management. Through the realignment of our operations we improved certain aspects of the sales function to facilitate customer service and retention, pricing growth and support of strategic growth initiatives; align transportation, route management and maintenance functions at the local level; and reduce corporate overhead and staff to match organizational needs and reduce costs.
Expense from Divestiture, Acquisition and Financing Costs
The $0.1 million expense from divestiture, acquisition and financing costs recorded in each of eight month period 2013 and fiscal year 2014 is primarily associated with legal costs related to the acquisition of the remaining 50% membership interest of Tompkins.
The $1.4 million expense from divestiture, acquisition and financing costs recorded in fiscal year 2013 is associated with the following fiscal year 2013 events: a $0.3 million write-off of costs associated with the full refinancing of our 11.0% senior second lien notes (“Second Lien Notes”) in fiscal year 2013, $0.6 million of legal costs associated with the Maine Energy divestiture transaction, and $0.5 million of costs associated with the BBI acquisition.
Gain on Settlement of Acquisition Related Contingent Consideration
In each of fiscal year 2014 and calendar year 2014, we recovered a portion of the purchase price holdback amount we had previouslypaid and were relieved of any potential contingent consideration obligation associated with the acquisition of an industrial servicemanagement business earlier in fiscal year 2014. As a result, we recorded a $1.1 million gain on settlement of acquisition relatedcontingent consideration in each of fiscal year 2014 and calendar year 2014.
Other Expenses
Interest Expense, net
Interest Expense, net – Fiscal Year 2015 compared to Unaudited Calendar Year 2014
Our interest expense, net increased $2.0 million in fiscal year 2015 as compared to calendar year 2014 due to higher average debt balances combined with changes to our capitalization structure associated with various tax exempt debt borrowings, the issuance of additional 2019 Notes and the refinancing of our Senior Credit Facility. In fiscal year 2015, we also experienced interest savings when we repurchased and permanently retired $14.7 million aggregate principal amount of 2019 Notes, our most expensive debt, at a weighted average repurchase price of $101.0.
Interest Expense, net – Transition Period 2014 compared to Unaudited Eight Month Period 2013
Our interest expense, net increased $0.2 million in transition period 2014 as compared to eight month period 2013 as interest expense associated with higher average debt balances in transition period 2014 was partially offset by interest savings associated with a reduction to our outstanding letters of credit.
45
45
Interest Expense, net – Fiscal Year 2014 compared to Fiscal Year 2013
Our interest expense, net decreased $3.5 million in fiscal year 2014 when compared to fiscal year 2013. The decrease in interestexpense, net during fiscal year 2014 can primarily be attributed to lower interest rates associated with the refinancing in October and November 2012 of $180.0 million in aggregate principal amount of Second Lien Notes. Interest savings were partially offset by anincrease in interest expense associated with higher average debt balances in fiscal year 2014, associated primarily with borrowings under our Senior Credit Facility to help fund operations and meet cash flow needs.
Loss from Equity Method Investment and Gain on Sale of Equity Method Investment
In December 2013, we sold our 50% membership interest in GreenFiber and purchased the remaining 50% membership interest of Tompkins, both of which were previously accounted for using the equity method of accounting.
As a result of the sale of our 50% membership interest in GreenFiber, we recorded a gain on sale of equity method investment of $0.8 million in eight month period 2013, which included a $0.2 million working capital adjustment to the purchase price that was finalizedupon closing of the transaction in January 2014. We had initially recorded a gain on sale of equity method investment of $0.6 million in fiscal year 2014 as a result of the sale.
We no longer account for our investment in Tompkins using the equity method of accounting and began including the accounts of Tompkins in our consolidated financial statements.
Prior to these transactions, we recorded income from equity method investments of $0.1 million in calendar year 2014 and losses from our equity method investments of $1.0 million, $0.9 million and $4.4 million in eight month period 2013, fiscal year 2014 and fiscalyear 2013.
Impairment of Investments
As of December 31, 2015, we owned 5.3% of the outstanding common stock of Recycle Rewards, Inc. (“Recycle Rewards”), a company that markets an incentive based recycling service. In both fiscal year 2015 and transition period 2014, it was determinedbased on the operating performance of Recycle Rewards that our cost method investment in Recycle Rewards was potentially impaired. As a result, we performed a valuation analysis in fiscal year 2015, and had a valuation analysis performed by a third-party valuation specialist in transition period 2014, both of which used an income approach based on discounted cash flows to determine an equity value for Recycle Rewards in order to properly value our cost method investment in Recycle Rewards. Based on these analyses,it was determined in each case that the fair value of our cost method investment in Recycle Rewards was less than the carrying amount and, therefore, we recorded other-than-temporary investment impairment charges of $1.1 million in fiscal year 2015 and $2.3 million in each of calendar year 2014 and transition period 2014. As of December 31, 2015, the carrying amount of our cost method investment in Recycle Rewards is $1.1 million.
As of December 31, 2015, we owned 9.8% of the outstanding equity value of GreenerU, Inc. (“GreenerU”), a services company focused on providing energy efficiency, sustainability and renewable energy solutions to colleges and universities. In fiscal year 2015, it was determined based on the operating performance and recent third-party interest in GreenerU that our cost method investment in GreenerU was potentially impaired. A valuation analysis was performed by a third-party valuation specialist using a market approach based on an option pricing methodology to determine an equity value and fair market value per share for GreenerU. Based on thisanalysis, it was determined that the fair value of our cost method investment in GreenerU was less than the carrying amount and,therefore, we recorded an other-than-temporary investment impairment charge of $0.7 million in fiscal year 2015. As of December 31, 2015, the carrying amount of our cost method investment in GreenerU is $0.3 million.
As of December 31, 2015, we owned 17.0% and 16.2% of the outstanding common stock of AGreen Energy LLC (“AGreen”) and BGreen Energy LLC (“BGreen”), respectively. In fiscal year 2015, AGreen and BGreen, both of which we account for as cost methodinvestments, entered into agreements that resulted in the contribution and sale of certain assets and liabilities of AGreen and BGreen to a limited liability company in exchange for partial ownership interests in a parent of that limited liability company. As a result of the transactions, we performed an analysis to determine whether an other-than-temporary impairment in the carrying value of our cost method investments had occurred. Based on the analysis performed, which measured the fair value of our cost method investments using an in-exchange valuation premise under the market approach that utilized the estimated purchase consideration received, werecorded an other-than-temporary investment impairment charge of $0.3 million in fiscal year 2015.
46
46
Loss on Derivative Instruments
In the fiscal year ended April 30, 2012, we entered into two forward starting interest rate derivative agreements that were initiallybeing used to hedge the interest rate risk associated with the forecasted financing transaction to redeem our Second Lien Notes. The total notional amount of these agreements was $150.0 million and required us to receive interest based on changes in LIBOR and pay interest at a rate of approximately 1.40%. During fiscal year 2013, we dedesignated both of the $75.0 million forward starting interest rate derivative agreements and discontinued hedge accounting in accordance with FASB ASC 815-30 because the interest payments associated with the forecasted financing transaction were no longer deemed probable. We recognized a $3.6 million loss, reclassified from accumulated other comprehensive loss, as loss on derivative instruments in fiscal year 2013 and recognize the change in fairvalue of the interest rate swaps along with any cash settlements through earnings as gain or loss on derivative instruments. Theagreements were both scheduled to mature on March 15, 2016. However, in February 2015 we settled one of the forward starting interest rate derivative agreements for $0.8 million.
Loss on Debt Extinguishment
Senior Subordinated Notes. In fiscal year 2015, we repurchased and permanently retired $14.7 million aggregate principal amount of 2019 Notes at a weighted average repurchase price of $101.0 in order to maximize interest savings by paying down our most expensive debt. As a result of the repurchases, we recorded a charge of $0.5 million in fiscal year 2015 as a loss on debt extinguishment primarily related to the non-cash write off of deferred financing costs and unamortized original issue discount inproportion with the settlement amount.
Senior Credit Facility. In fiscal year 2015, we recorded a charge of $0.5 million as a loss on debt extinguishment related to the write-off of deferred financing costs in connection with changes to the borrowing capacity from the Senior Credit Facility to the ABLFacility. The remaining unamortized deferred financing costs of the Senior Credit Facility, along with fees paid to the creditor and third-party costs incurred for the ABL Facility, are to be amortized over the term of the ABL Facility.
Second Lien Notes. In fiscal year 2013, we recorded a charge of $15.6 million as a loss on debt extinguishment related to the full refinancing of our Second Lien Notes. The loss on debt extinguishment consisted of a $2.8 million non-cash write off of deferredfinancing costs, a $2.1 million non-cash write off of the unamortized original issue discount and a $10.7 million charge associatedwith the early tender premium and tender fees associated with the redemption of the Second Lien Notes.
Provision (Benefit) for Income Taxes
Our provision for income taxes from continuing operations for fiscal year 2015 increased $0.1 million to $1.4 million from $1.3million in calendar year 2014. The provision (benefit) for income taxes decreased $0.5 million in transition period 2014 to $0.7million from $1.2 million in eight month period 2013, and increased $4.3 million in fiscal year 2014 to $1.8 million from ($2.5)million in fiscal year 2013. The provisions for income taxes for fiscal year 2015 and calendar year 2014 include deferred tax provisions of $0.8 and $1.2 million, respectively, and transition period 2014 and eight month period 2013 include deferred tax provisions of $0.6 million and $1.0 million, respectively. The change in the provisions for income taxes and the total deferred tax provisions in these periods are primarily related to the deferred tax liability for indefinite lived assets. Since we cannot determine when the deferred tax liability related to indefinite lived assets will reverse, this amount cannot be used as a future source of taxable income against which to benefit deferred tax assets. The change in the provisions (benefits) for income taxes for fiscal year 2014 and fiscal year 2013 is primarily related to a ($5.1) million deferred tax benefit in fiscal year 2013 due to a reduction of the valuation allowance in connection with the recording of deferred tax liabilities related to the BBI acquisition, offset by $0.8 million in fiscal year 2013 related to a settlement with the State of New York for corporate franchise tax for tax years April 30, 2004 through April 30, 2010.
Discontinued Operations
Income (Loss) from Discontinued Operations, net
Discontinued operations in eight month period 2013 and fiscal years 2014 and 2013 represent the result of operations related to the business disposition of BioFuels. In fiscal year 2014, we executed a purchase and sale agreement with ReEnergy, pursuant to whichwe agreed to sell certain assets of BioFuels, which is located in our Eastern region, to ReEnergy.
Our loss from discontinued operations, net in fiscal year 2013 includes a $3.3 million loss associated with the adjustment to thecarrying value of BioFuels to its fair value as a result of the planned business disposition of BioFuels.

4747
The operating results of the operations discussed above have been included in discontinued operations in the accompanying consolidated financial statements.
Loss on Disposal of Discontinued Operations
We recognized a $0.4 million loss on disposal of discontinued operations in fiscal year 2014 associated with the BioFuels disposition.
Segment Reporting
The table below shows, for the periods indicated, revenues (in millions) based on our operating segments:
Twelve Months Ended Eight Months Ended Fiscal Year EndedDecember 31, December 31, April 30,
2015 2014 2014 2013 2014 2013Unaudited Unaudited
Eastern .................................................................................... $ 167.5 $ 152.5 $ 108.4 $ 103.3 $ 147.3 $ 129.9 Western ................................................................................... 232.0 224.3 156.9 149.5 216.9 205.7 Recycling ................................................................................ 46.3 48.3 33.8 29.3 43.8 42.3 Other ....................................................................................... 100.7 100.8 69.3 58.0 89.6 77.4
Total ........................................................................................ $ 546.5 $ 525.9 $ 368.4 $ 340.1 $ 497.6 $ 455.3
The table below shows, for the periods indicated, operating income (loss) (in millions) based on our operating segments:
Twelve Months Ended Eight Months Ended Fiscal Year EndedDecember 31, December 31, April 30,
2015 2014 2014 2013 2014 2013Unaudited Unaudited
Eastern ....................................................................................... $ 7.4 $ (1.6) $ 3.4 $ 3.9 $ (1.1) $ (5.3)Western ...................................................................................... 26.0 15.0 18.8 17.2 13.3 20.0 Recycling ................................................................................... (2.4) (1.7) (0.2) (1.0) (2.4) (0.7)Other .......................................................................................... 0.9 0.4 0.1 1.8 2.1 (1.6)
Total ........................................................................................... $ 31.9 $ 12.1 $ 22.1 $ 21.9 $ 11.9 $ 12.4
Eastern Region
Eastern Region – Fiscal Year 2015 compared to Unaudited Calendar Year 2014
The following table provides details associated with the period-to-period change in revenues (dollars in millions) attributable to services provided:
Period-to-PeriodChange for Fiscal Year 2015 vs.
Calendar Year 2014Eastern Region Amount % of Growth
Price ............................................................................................ $ 4.2 2.7% Volume ........................................................................................ 10.7 7.0% Fuel oil and recovery fee ............................................................. (0.2) (0.1)%Commodity price & volume ........................................................ 0.1 0.1% Acquisitions & divestitures ......................................................... 0.9 0.6% Closed landfill ............................................................................. (0.7) (0.5)%
Total solid waste ................................................................ $ 15.0 9.8%
Price.
• The price change component in fiscal year 2015 total solid waste revenues growth is the result of $3.1 million from favorablecollection pricing and $1.1 million from favorable disposal pricing related to landfills and transfer stations.

4848
Volume.
• The volume change component in fiscal year 2015 total solid waste revenues growth is primarily the result of $6.7 million fromhigher disposal volumes and $3.7 million from higher collection volumes.
Acquisitions and divestitures.
• The acquisitions and divestitures change component in fiscal year 2015 total solid waste revenues growth is the result of increased revenues from the acquisition of a solid waste hauling operation in October 2014.
Closed landfill.
• The closed landfill change component in fiscal year 2015 total solid waste revenues growth is the result of our Worcester landfill, which ceased operations in April 2014 in accordance with its permit.
Eastern region operating income increased $9.0 million during fiscal year 2015 when compared to calendar year 2014. This improvement is primarily attributable to revenue growth outlined above and the following cost changes:
• Cost of operations: Cost of operations increased by $1.8 million primarily due to: additional labor costs due to higher collection and transfer station volumes associated with new municipal contracts and organic customer growth; higher operating costs at one of our landfills; and higher facility and fleet maintenance costs. These costs were partially offset by lower diesel fuel prices,lower gas treatment costs at Juniper Ridge, lower operating costs associated with our Worcester landfill closing and the expiration of an out-of-market put-or-pay waste disposal contract.
• General and administration: General and administration expenses increased by $4.5 million primarily due to higher shared overhead costs and an increase in incentive compensation.
• Depreciation and amortization: Depreciation and amortization expense increased by $1.0 million due to an increase in landfill volumes and an amortization rate adjustment at one of our landfills as a result of updating cost estimates and other assumptionsassociated with the annual year-end review of our landfills.
• Other: Other significant charges include the contract settlement charge of $1.9 million in fiscal year 2015, the reversal of $1.1 million of excess costs to complete the divestiture of Maine Energy in fiscal year 2015, the $1.0 million environmental remediation charge associated with the environmental remediation at our Southbridge landfill in calendar year 2014, severance costs associated with various planned reorganization efforts in calendar year 2014, and a $1.4 million write off of deferred costs associated with a gas pipeline development project no longer deemed to be viable in calendar year 2014.
Eastern Region – Transition Period 2014 compared to Unaudited Eight Month Period 2013
The following table provides details associated with the period-to-period change in revenues (dollars in millions) attributable to services provided:
Period-to-PeriodChange for the Eight Months
2014 vs. 2013Eastern Region Amount % of Growth
Price ................................................................................................. $ 0.8 0.8%Volume ............................................................................................. 5.8 5.6%Commodity price & volume ............................................................. (0.1) (0.1)%Acquisitions & divestitures .............................................................. 2.9 2.8%Closed landfill .................................................................................. (4.3) (4.2)%
Total solid waste ..................................................................... $ 5.1 4.9%
Price.
• The price change component in transition period 2014 total solid waste revenues growth is the result of $0.8 million from favorable collection pricing.

4949
Volume.
• The volume change component in transition period 2014 total solid waste revenues growth is the result of $3.1 million from higher disposal volumes (which includes a mix shift in volumes from landfills to transfer stations), $2.5 million from higher collection volumes and $0.2 million from higher processing volumes.
Commodity price and volume.
• The solid waste operations commodity price and volume change component in transition period 2014 total solid waste revenues growth is the result of $0.2 million from lower power generation and processing commodity volumes, partially offset by $0.1 million from favorable commodity pricing within power generation.
Acquisitions and divestitures.
• The acquisitions and divestitures change component in transition period 2014 total solid waste revenues growth is the result of the acquisition of two solid waste hauling operations, one in September 2013 and another in October 2014, and a transfer stationin November 2013.
Closed landfill.
• The closed landfill change component in transition period 2014 total solid waste revenues growth is the result of our Worcesterlandfill, which ceased operations in April 2014 in accordance with its permit.
Eastern region operating income decreased $0.5 million during transition period 2014 when compared to eight month period 2013. The change in operating income is primarily attributable to the following cost changes:
• Cost of operations: Cost of operations increased by $9.5 million, resulting in margin erosion as costs increased at a greater rate than revenues. The change was primarily due to: an increase in third-party direct costs associated with higher collection and disposal volumes from new municipal contracts, organic customer growth and the acquisition of a transfer station; and an increase in other operational costs, including labor (which is driven by higher collection and transfer volumes), healthcare, depletion of landfill operating lease obligations at Southbridge, and maintenance costs associated with hauling operations and certain of our landfills. These costs were partially offset by a decrease in fleet and landfill equipment rentals, as well as host community fees and royalties; lower accretion expense related to accrued final capping, closure and post-closure costs associated with our Worcester landfill; and lower leachate treatment costs.
• General and administration: General and administration expenses increased $0.9 million primarily due to: an increase in bad debt expense in transition period 2014 associated with increased customer growth and bad debt recoveries in eight month period 2013; an increase in incentive compensation costs; and a loss accrued for a potential legal settlement with MADEP. See discussion in Part I, Item 3, “Legal Proceedings” of this Annual Report on Form 10-K.
• Depreciation and amortization: Depreciation and amortization costs remained flat primarily due to lower landfill amortization associated with our Worcester landfill, which no longer accepted waste in transition period 2014, offset by an increase in otheramortization associated with acquired intangible assets.
• Other: Other charges impacting operating income included a $1.0 million environmental remediation charge recorded in transition period 2014 and a $0.4 million environmental remediation charge recorded in eight month period 2013 associated with the environmental remediation at Southbridge.
Eastern Region – Fiscal Year 2014 compared to Fiscal Year 2013
The following table provides details associated with the period-to-period change in revenues (dollars in millions) attributable to services provided:
Period-to-PeriodChange for the Fiscal Years Ended
2014 vs. 2013Eastern Region Amount % of Growth
Price .......................................................................................... $ — 0.0%Volume ...................................................................................... 11.0 8.5%Fuel oil and recovery fee ........................................................... (0.2) (0.2)%Commodity price & volume ...................................................... 0.1 0.1%Acquisitions & divestitures ....................................................... 7.0 5.4%Closed landfill ........................................................................... (0.5) (0.4)%
Total solid waste .............................................................. $ 17.4 13.4%

5050
Price.
• The price change component in fiscal year 2014 total solid waste revenues growth is the result of $0.6 million from favorablecollection pricing, offset by $0.6 million from unfavorable disposal pricing related primarily to landfills.
Volume.
• The volume change component in fiscal year 2014 total solid waste revenues growth is the result of $7.9 million from higher disposal volumes (of which $7.2 million relates to higher landfill volumes and $3.6 million relates to higher transfer station volumes, partially offset by $2.9 million in volumes that were not retained after the divestiture of Maine Energy), $2.8 millionfrom higher collection volumes and $0.3 million from higher processing volumes.
Commodity price and volume.
• The commodity price and volume change component in fiscal year 2014 total solid waste revenues growth remained consistent year over year with increased revenues from higher commodity volumes slightly eclipsing decreased revenues from unfavorable pricing.
Acquisitions and divestitures.
• The acquisitions and divestitures change component in fiscal year 2014 total solid waste revenues growth is the result of $14.4 million from the acquisition of BBI, partially offset by $7.4 million from the divestiture of Maine Energy.
Closed landfill.
• The closed landfill change component in fiscal year 2014 total solid waste revenues growth is the result of our Worcester landfill, which stopped accepting waste in fiscal year 2013 based on the attainment of its permitted capacity. The impact of theclosure was limited in fiscal year 2014 as we were granted a permit in May 2013 to accept an additional 0.2 million tons of waste. We began placing additional waste pursuant to the permit at the end of June 2013 and ceased placing tons in April 2014.
Eastern region operating loss decreased $4.2 million during fiscal year 2014 when compared to fiscal year 2013. The change in operating income is primarily attributable to the following cost changes:
• Cost of operations: Cost of operations increased by $19.1 million in fiscal year 2014 primarily due to: an increase in third-party direct costs associated with higher disposal volumes from organic customer growth and the acquisition of BBI and other operations, partially offset by a reduction of transportation costs associated with the divestiture of Maine Energy; and an increase in direct operational costs including labor, fuel, equipment rentals, landfill gas treatment costs at one of our landfillsand fleet maintenance and repair costs associated with the integration of the BBI vehicle fleet, partially offset by a reduction of facility costs associated with the divestiture of Maine Energy.
• General and administration: General and administration costs increased $0.9 million in fiscal year 2014 primarily due to additional personnel costs associated with the BBI acquisition and an increase in estimated incentive compensation costs.
• Depreciation and amortization: Depreciation and amortization costs increased $1.4 million in fiscal year 2014 due to the following: an increase in landfill amortization costs associated with higher landfill volumes; an increase in estimated costs associated with our Worcester landfill in closure status; and depreciation expense savings associated with the divestiture of Maine Energy.
• Other: Other charges impacting operating loss in fiscal year 2014 include: a $1.4 million write off of deferred costs in fiscal year2014 associated with a gas pipeline development project no longer deemed to be viable; a $0.4 million environmental remediation charge recorded in fiscal year 2014 associated with the remediation of Southbridge; severance costs associated primarily with realignment and the streamlining of functions to improve our cost structure and the divestiture of Maine Energy in the third quarter of fiscal year 2013; legal costs associated with the Maine Energy divestiture transaction; and costs associated directly with the BBI acquisition.

5151
Western Region
Western Region – Fiscal Year 2015 compared to Unaudited Calendar Year 2014
The following table provides details associated with the period-to-period change in revenues (dollars in millions) attributable to services provided:
Period-to-PeriodChange for Fiscal Year 2015 vs.
Calandar Year 2014Western Region Amount % of Growth
Price .............................................................................................. $ 6.2 2.8%Volume .......................................................................................... 6.1 2.7%Fuel and oil recovery fee ............................................................... (0.6) (0.3)%Commodity price & volume .......................................................... (3.5) (1.6)%Acquisitions & divestitures ........................................................... (0.5) (0.2)%
Total solid waste .................................................................. $ 7.7 3.4%
Price.
• The price change component in fiscal year 2015 total solid waste revenues growth is primarily the result of favorable collection pricing.
Volume.
• The volume change component in fiscal year 2015 total solid waste revenues growth is the result of $10.7 million from higherdisposal volumes (of which $5.0 million relates to higher landfill volumes, $4.9 million relates to higher transportation volumesand $0.8 million relates to higher transfer station volumes associated with two new transfer station contracts), partially offset by $2.3 million from lower processing volumes and $2.3 million from lower collection volumes.
Fuel and oil recovery fee.
• The fuel and oil recovery fee change component in fiscal year 2015 total solid waste revenues growth is the result of lower revenues generated by our fuel and oil recovery fee program in response to lower diesel fuel index prices on which the surcharge is based.
Commodity price and volume.
• The commodity price and volume change component in fiscal year 2015 total solid waste revenues growth is the result of unfavorable energy pricing within our landfill gas-to-energy operations, unfavorable commodity pricing, and lower landfill gas-to-energy and processing commodity volumes.
Acquisitions and divestitures.
• The acquisitions and divestitures change component in fiscal year 2015 total solid waste revenues growth is the result of increased revenues from the acquisition of a solid waste hauling operations in September 2014, partially offset by decreased revenues associated primarily with an asset exchange in December 2014 and the divestiture of a business in May 2015.
Western region operating income increased $11.0 million during fiscal year 2015 when compared to the calendar year 2014. This improvement is primarily attributable to revenue growth outlined above and the following cost changes:
• Cost of operations: Cost of operations increased by $2.0 million due to: higher disposal volumes associated with organic customer growth, two new transfer station contracts and the acquisition of a solid waste hauling operation; higher equipment rental costs; higher third-party landfill disposal costs; higher operating and leachate disposal costs at certain landfills; and higher fleet maintenance costs. Increased costs were partially offset by lower diesel fuel prices, lower depletion of landfill operating lease obligations at a landfill due to a decrease in tons and a favorable rate impact associated with the annual year-end review of our landfills, lower purchased material costs and lower benefit costs.
• General and administration: General and administration expenses increased by $3.0 million primarily due to higher shared overhead costs, higher bad debt expense associated with an increase in the reserve for a specific landfill customer and higher personnel costs.

5252
• Depreciation and amortization: Depreciation and amortization expenses increased $0.1 million due to higher amortization expense associated with an increase in overall landfill tons and changes to certain of our landfill amortization rates as a part of the annual year-end review of our landfills, mostly offset by a decrease in depreciation expense associated with a lower depreciable asset base.
• Other: We recorded a $0.6 million gain associated with the divestiture of a business, which included the sale of certain assets associated with various waste collection routes, and a $3.8 million gain associated with the disposal of certain assets of the CARES water treatment facility and certain of our equipment and real estate in a related transaction in fiscal year 2015. In fiscalyear 2014, we recorded an impairment charge of $7.5 million to the abandoned asset group of CARES.
Western Region – Transition Period 2014 compared to Unaudited Eight Month Period 2013
The following table provides details associated with the period-to-period change in revenues (dollars in millions) attributable to services provided:
Period-to-PeriodChange for the Eight Months
2014 vs. 2013Western Region Amount % of Growth
Price ................................................................................................. $ 1.8 1.2%Volume ............................................................................................. 5.4 3.6%Commodity price & volume ............................................................. (0.6) (0.4)%Acquisitions & divestitures .............................................................. 0.8 0.5%
Total solid waste ..................................................................... $ 7.4 4.9%
Price.
• The price change component in transition period 2014 total solid waste revenues growth is the result of $1.7 million from favorable collection pricing and $0.1 million from favorable disposal pricing related to transfer stations.
Volume.
• The volume change component in transition period 2014 total solid waste revenues growth is the result of $7.0 million from higher disposal volumes (of which $4.4 million relates to higher landfill volumes, $2.2 million relates to higher transfer station volumes associated with two new transfer station contracts, and $0.4 million relates to higher transportation volumes), partiallyoffset by $1.3 million from lower collection volumes and $0.3 million from lower processing volumes.
Commodity price and volume.
• The commodity price and volume change component in transition period 2014 total solid waste revenues growth is primarily theresult of lower power generation and processing commodity volumes.
Acquisitions and divestitures.
• The acquisitions and divestitures change component in transition period 2014 total solid waste revenues growth is the result of various solid waste hauling operation acquisitions completed between August 2013 and September 2014.
Western region operating income increased $1.6 million during transition period 2014 as compared to eight month period 2013. Thechange in operating income is primarily attributable to the solid waste revenues growth discussed above combined with the following cost changes:
• Cost of operations: Cost of operations increased by $6.0 million due to: an increase in third-party direct costs associated with higher hauling costs driven by transfer station volume growth (including the addition of new operating contracts for municipality-owned transfer stations) and landfill volume growth, partially offset by lower disposal costs driven by the windingdown of business at CARES and lower collection volumes; an increase in other operational costs, including healthcare, depletion of landfill operating lease obligations (due to increased landfill volumes), host community fees and royalties fees, and maintenance costs associated with our fleet, hauling facilities and landfill facilities. These costs were partially offset by decreased fuel costs associated with lower diesel fuel prices in the marketplace.

53
53
• General and administration: General and administration costs remained flat due to a higher than normal bad debt expense in eight month period 2013 due to collectability issues associated with two disposal customers being offset by higher healthcare costs and increased incentive compensation costs.
• Depreciation and amortization: Depreciation and amortization costs increased $0.7 million period-to-period primarily due to an increase in landfill amortization associated with higher landfill volumes at certain landfills.
Western Region – Fiscal Year 2014 compared to Fiscal Year 2013
The following table provides details associated with the period-to-period change in revenues (dollars in millions) attributable to services provided:
Period-to-PeriodChange for the Fiscal Years Ended
2014 vs. 2013Western Region Amount % of Growth
Price ........................................................................................ $ 2.4 1.2% Volume .................................................................................... 6.3 3.1% Fuel and oil recovery fee ......................................................... (0.4) (0.2)%Commodity price & volume .................................................... 0.5 0.2% Acquisitions & divestitures ..................................................... 2.3 1.1%
Total solid waste ............................................................ $ 11.1 5.4%
Price.
• The price change component in fiscal year 2014 total solid waste revenues growth is the result of $2.3 million from favorablecollection pricing and $0.1 million from favorable disposal pricing related primarily to transfer stations.
Volume.
• The volume change component in fiscal year 2014 total solid waste revenues growth is the result of $5.6 million from higher disposal volumes (of which $3.0 million relates to landfill volumes, $1.6 million relates to transfer station volumes and $0.9 million relates to transportation volumes), $0.5 million from higher processing volumes and $0.2 million from higher collectionvolumes.
Fuel and oil recovery fee.
• Solid waste revenues in fiscal year 2014 generated by our fuel and oil recovery fee program, which is based on a fuel index, decreased when compared to the prior fiscal year as our floating rate recovery fee declined in response to lower diesel fuel index prices on which the surcharge is based.
Commodity price and volumes.
• The commodity price and volume change component in fiscal year 2014 total solid waste revenues growth is the result of $2.2 million from favorable commodity pricing, primarily within power generation, partially offset by $1.7 million from lower volumes within power generation and processing.
Acquisitions and divestitures.
• The acquisitions and divestitures change component in fiscal year 2014 total solid waste revenues growth is the result of $2.3million in higher collection revenues from the acquisition of various tuck-in collection operations.
Western region operating income for fiscal year 2014 decreased by $6.7 million when compared to fiscal year 2013. The change tooperating income in fiscal year 2014 is primarily attributable to the following:
• Cost of operations: Cost of operations increased by $12.0 million primarily due to: an increase in third-party direct costs related to increased collection and transfer station volumes, a shift in volumes to external haulers, and an increase in state, local and other disposal fees associated with higher taxes due to a shift in mix type; an increase in direct operational costs associated with higher labor, equipment rentals and leases, depletion of landfill operating lease obligations and host community fees; and an increase in vehicle and facility maintenance costs.

54
54
• General and administration: General and administration costs increased by $2.0 million primarily due to: an increase in personnel costs, including recruitment and relocation costs, and an increase in bad debt expense primarily due to collectabilityissues associated with two disposal customers.
• Depreciation and amortization: Depreciation and amortization costs increased by $2.2 million primarily due to to increased landfill amortization associated with the allocation of landfill volumes.
• Other: Other charges impacting operating income include the CARES impairment in fiscal year 2014 and severance costs associated with realignment and streamlining of functions to improve our cost structure in fiscal year 2013.
Recycling
Recycling – Fiscal Year 2015 compared to Unaudited Calendar Year 2014
Recycling revenues decreased $2.0 million during fiscal year 2015 when compared to calendar year 2014. The decrease in revenues is the result of unfavorable commodity prices in the marketplace, partially offset by higher commodity volumes and higher tipping fees.
Recycling operating loss increased by $0.7 million during fiscal year 2015 when compared to calendar year 2014 as operating results were negatively impacted by unfavorable commodity prices, higher hauling and labor costs, increased facility maintenance activitiesand higher shared overhead costs, partially offset by higher processing fees charged to third-party and intercompany customers.
Recycling – Transition Period 2014 compared to Unaudited Eight Month Period 2013
Recycling revenues increased $4.5 million during transition period 2014 when compared to eight month period 2013. The increase in revenues is primarily the result of higher commodity volumes, and the acquisition of the remaining 50% membership interest of Tompkins.
Recycling operating loss decreased by $0.8 million during transition period 2014 when compared to eight month period 2013 due toincreased revenues and improved operating efficiencies, partially eroded by higher commodity purchased material costs, higher labor and healthcare costs, and increased facility maintenance activities.
Recycling – Fiscal Year 2014 compared to Fiscal Year 2013
Recycling revenues increased $1.5 million during fiscal year 2014 when compared to fiscal year 2013. The increase in revenues is due to higher commodity volumes and the acquisition of the remaining 50% membership interest of Tompkins.
Recycling operating loss for fiscal year 2014 increased by $1.7 million when compared to fiscal year 2013 due to extended inclement weather that resulted in lower operating productivity and reduced processing throughput, along with unplanned maintenance activities.
Other
Other – Fiscal Year 2015 compared to Unaudited Calendar Year 2014
Other revenues decreased $0.1 million during fiscal year 2015 when compared to calendar year 2014 primarily due to volume declines in our Organics business associated with lower commodity volumes and a decline in our floating rate fuel and oil recovery fee inresponse to lower diesel fuel index prices on which the surcharge is based, and a decline in transportation volumes. This was partiallyoffset by organic business growth within our Customer Solutions business.
Other operating income increased by $0.5 million during fiscal year 2015 when compared to calendar year 2014 based on the operating performance of our Customer Solutions business. Profitability in the Customer Solutions business improved as we continued to gain leverage on higher revenues and lower general and administration costs.
Other – Transition Period 2014 compared to Unaudited Eight Month Period 2013
Other revenues increased $11.3 million during transition period 2014 as compared to eight month period 2013 primarily as a result of higher volumes associated with organic business growth within our Customer Solutions business and, to a lesser extent, the acquisition of an industrial service management business in September 2013 and commodity volume increases within our Organics business.

55
55
Other operating income decreased by $1.7 million during transition period 2014 when compared to eight month period 2013 as increased revenues were more than offset by increased third-party direct costs (including hauling and purchased material costs associated primarily with our Customer Solutions business and, to a lesser extent, hauling costs associated with our Organics business) and labor and related benefit costs associated with growth in our Customer Solutions business.
Other – Fiscal Year 2014 compared to Fiscal Year 2013
Other revenues increased $12.2 million during fiscal year 2014 when compared to fiscal year 2013. Increased revenues for fiscal year 2014 was primarily the result of higher volumes within our Organics business and organic growth and the acquisition of an industrial service management business within our Customer Solutions business in fiscal year 2014.
Other operating income for fiscal year 2014 increased by $3.8 million when compared to fiscal year 2013 as increased revenues, combined with cost savings associated with a change in our organizational and management structure and the head count reductionthat took place as a part of the reorganization fiscal year 2013, more than offset increased hauling and transportation costs associatedwith our Organics business and transportation services and increased third-party direct costs associated with the acquisition of an industrial service management business within our Customer Solutions business.
Liquidity and Capital Resources
We continually monitor our actual and forecasted cash flows, our liquidity and our capital requirements in order to properly manageour cash needs based on the capital intensive nature of our business. Our capital requirements include fixed asset purchases (including capital expenditures for vehicles), debt servicing, landfill development and cell construction, landfill site and cell closure, as well as acquisitions. We generally meet our liquidity needs from operating cash flows and borrowings from a revolving credit facility.
The following is a summary of our cash and cash equivalents, restricted assets and debt balances (in millions):
December 31, 2015
December 31, 2014
April 30, 2014
Cash and cash equivalents .......................................... $ 2.3 $ 2.2 $ 2.5
Restricted assets: Capital projects .................................................. $ 1.4 $ 5.8 $ — Landfill closure ................................................. 0.9 0.8 0.7
Total restricted assets .................................................. $ 2.3 $ 6.6 $ 0.7
Long-term debt: Current portion .................................................. $ 1.4 $ 1.6 $ 0.9 Long-term portion ............................................. 522.2 534.1 507.1
Total long-term debt ................................................... $ 523.6 $ 535.7 $ 508.0
Summary of Cash Flow Activity
The following table summarizes our cash flows (in millions) for the periods indicated:
Twelve Months Ended December 31,
Eight Months Ended December 31,
Fiscal Year Ended April 30,
2015 2014 2014 2013 2014 2013Unaudited Unaudited
Net cash provided by operating activities .............................. $ 70.5 $ 62.2 $ 38.3 $ 25.8 $ 49.6 $ 43.9 Net cash used in investing activites ....................................... $ (48.8) $ (71.8) $ (59.7) $ (45.8) $ (57.9) $ (89.5)Net cash (used in) provided by financing activities ............... $ (21.6) $ 7.2 $ 19.3 $ 21.1 $ 9.0 $ 44.9 Net cash provided by (used in) discontinued operations ........ $ — $ 1.9 $ 1.8 $ (0.1) $ — $ (2.2)

56
56
Cash Flow Activity – Fiscal Year 2015 compared to Unaudited Calendar Year 2014
Net cash provided by operating activities. Cash flows from operating activities increased by $8.3 million during fiscal year 2015 when compared to calendar year 2014.
The following is a summary of our operating cash flows (in millions) for fiscal year 2015 and calendar year 2014:
Twelve Months Ended December 31
2015 2014Unaudited
Net loss............................................................................................................... $ (11.8) $ (29.1)Adjustments to reconcile net loss to net cash provided by operating activities:
Gain on sale of property and equipment ................................................... (0.1) (0.5)Depletion of landfill operating lease obligations ...................................... 9.4 10.7 Interest accretion on landfill and environmental remediation liabilities ...... 3.4 3.6 Stock-based compensation ....................................................................... 3.1 2.4 Depreciation and amortization .................................................................. 62.7 61.2 Divestiture transactions ............................................................................ (5.5) 6.9 Development project charge ..................................................................... — 1.4 Gain on settlement of acquisition related contingent consideration ......... — (1.1)Amortization of discount on long-term debt ............................................. 0.4 0.3 Loss on debt extinguishment .................................................................... 1.0 — Loss on derivative instruments ................................................................. 0.2 0.6 Impairment of investments ....................................................................... 2.1 2.3 Income from equity method investments .................................................. — (0.1)Loss on sale of equity method investment ................................................ — 0.2 Excess tax benefit on the vesting of share based awards .......................... (0.2) (0.1)Deferred income taxes .............................................................................. 0.8 1.2
Adjusted net income before changes in assets and liabilities, net ...................... 65.5 59.9 Changes in assets and liabilites, net ................................................................... 5.0 2.3
Net cash provided by operating activities .......................................................... $ 70.5 $ 62.2
The most significant items affecting the change in our operating cash flows are summarized below:
• Improved operational performance in fiscal year 2015 as revenues increased by $20.6 million, whereas cost of operations and general and administration costs increased only $11.5 million, a decrease of 1.1% as a percentage of revenues.
• Improved cash flow impact associated with the changes in our assets and liabilities, net of effects of acquisitions and divestitures, which are affected by both cost changes and the timing of payments. The improvement in fiscal year 2015 was the result of the favorable cash flow impacts associated with prepaid expenses, inventories and other assets and accrued expenses and other liabilities due to lower final capping, closure and post-closure payments, partially offset by the unfavorable cash flowimpacts associated with accounts payable and accounts receivable.
Net cash used in investing activities. Cash flows used in investing activities decreased by $23.0 million during fiscal year 2015 when compared to calendar year 2014.
The most significant items affecting the change in our investing cash flows are summarized below:
• Capital expenditures. Capital expenditures were $17.5 million lower in the fiscal year 2015 due to the timing of various landfill development projects, along with various calendar year 2014 capital expenditures associated with a new recycling facility contract, various transfer stations and the installation of a landfill gas treatment system at Juniper Ridge.
• Proceeds from divestiture transactions. We divested a business, certain assets of the CARES water treatment facility, and other equipment of ours as a result of the CARES transaction for cash consideration of $5.3 million in fiscal year 2015.
Net cash (used in) provided by financing activities. Cash flows from financing activities decreased $28.8 million during fiscal year 2015 when compared to calendar year 2014.

5757
The most significant items affecting the change in our financing cash flows are summarized below:
• Debt activity. We issued an additional $60.0 million of 2019 Notes and refinanced our Senior Credit Facility resulting in an increase in both debt borrowings and debt payments in fiscal year 2015. In the aggregate, we were able to pay down $15.8 million, net, of long-term debt in fiscal year 2015, including the purchase for settlement of $14.7 million aggregate principalamount 2019 Notes, whereas we increased our long-term debt by $15.3M, net in calendar year 2014.
• Payments of financing costs. We had a $6.4 million increase in deferred financing cost payments in fiscal year 2015 related primarily to the issuance of an additional $60.0 million of 2019 Notes and $15.0 million of Finance Authority of Maine Solid Waste Disposal Revenue Bonds Series 2015 (“FAME Bonds 2015”) and the refinancing of our Senior Credit Facility.
• Distribution to noncontrolling interest holder. In fiscal year 2015, we distributed $1.5 million to Altela representing its pro-rata share of the proceeds associated with the disposal of certain assets of CARES.
• Change in restricted cash. We added $5.6 million of restricted assets associated with the issuance of the FAME Bonds 2015 that represent restricted cash reserved for repayment of costs incurred to fund certain capital projects in the State of Maine, and used$10.0 million of the restricted cash associated with the issuance of the FAME Bonds 2015 and the $5.8 million of New York State Environmental Facilities Corporation Solid Waste Disposal Revenue Bonds Series 2014 (“New York Bonds”) issued in calendar year 2014, to pay down ABL Facility borrowings used to finance certain capital projects in the States of New York and Maine.
Cash Flow Activity – Transition Period 2014 compared to Unaudited Eight Month Period 2013
Net cash flows provided by operating activities. Cash flows from operating activities increased by $12.5 million for transition period 2014 when compared to eight month period 2013.
The following is a summary of our operating cash flows (in millions) for transition period 2014 and eight month period 2013:
Eight Months Ended December 31,
2014 2013Unaudited
Net loss ............................................................................................................................. $ (5.8) $ (4.1)Adjustments to reconcile net loss to net cash provided by operating activities
Discontinued operations, net of tax ........................................................................ — 0.1 Gain on divestiture .................................................................................................. (0.5) — Gain on sale of property and equipment ................................................................. (0.2) (0.5)Depreciation and amortization ................................................................................ 41.5 40.6 Depletion of landfill operating lease obligations .................................................... 7.8 7.0 Interest accretion on landfill and environmental remediation liabilities ................. 2.4 2.7 Amortization of discount on second lien notes and senior subordinated notes ....... 0.2 0.2 Impairment of investments ..................................................................................... 2.3 — Loss from equity method investments .................................................................... — 0.8 Gain on sale of equity method investment .............................................................. — (0.6)Loss (gain) on derivative instruments ..................................................................... 0.2 (0.1)Stock-based compensation ...................................................................................... 1.6 1.7 Excess tax benefit on the vesting of share based awards ........................................ (0.1) — Deferred income taxes ............................................................................................ 0.6 1.0
Adjusted net loss before changes in assets and liabilities, net .......................................... 50.0 48.8 Changes in assets and liabilites, net ................................................................................. (11.7) (23.0)
Net cash provided by operating activities ........................................................................ $ 38.3 $ 25.8
The most significant items affecting the change in our operating cash flows are summarized below:
• Improved operational performance in the transition period 2014 as revenues increased by $28.3 million, partially offset by higher cost of operations and general and administration costs, which increased by $27.5 million or 1.2% as a percentage of revenues.

58
58
• Improved cash flow impact associated with the changes in our assets and liabilities, net of effects of acquisitions and divestitures, which are affected by both cost changes and the timing of payments. This improvement is primarily due to the favorable impact associated with the change in accounts payable based on the timing of payments. This was partially offset by the unfavorable impact associated with the change in accrued expenses and other liabilities (associated primarily with the amount and timing of capping, closure and post closure payments and the timing of accrued interest payments) and the unfavorable impact associated with the change in prepaid expenses, inventories and other assets.
• Cash interest payments decreased $0.3 million from $18.7 million for eight month period 2013 to $18.4 million for transitionperiod 2014 primarily due to the timing of payments associated with changes to our capitalization structure.
Net cash used in investing activities. Cash flows used in investing activities increased by $13.9 million for transition period 2014 when compared to eight month period 2013.
The most significant items affecting the change in our investing cash flows are summarized below:
• Capital expenditures. Capital expenditures were $21.6 million higher primarily due to organic business growth (including increased spending on our fleet), the installation of a gas treatment system at Juniper Ridge, various landfill development costs,and other capital investments associated with certain new contracts and a new MRF in Lewiston, Maine.
• Proceeds from the sale of equity method investment. During eight month period 2013, we and LP sold our membership interests in GreenFiber. After netting indebtedness of GreenFiber and transaction costs, our 50% of the net cash proceeds amounted to $2.8 million.
• Payments related to investments. During eight month period 2013, we made investments in unconsolidated entities totaling $2.0 million, whereas we made no payments related to investments in transition period 2014.
• Acquisitions, net of cash acquired. During eight month period 2013, cash outflows associated with acquisitions totaled $8.5 million as compared to $0.4 million in transition period 2014 based on the respective acquisition activity. The timing and size of acquisitions are dependent upon opportunity and our access to capital.
Net cash provided by financing activities. Cash flows provided by financing activities decreased $1.8 million during transition period 2014 when compared to eight month period 2013.
The most significant items affecting the change in our financing cash flows are summarized below:
• Change in restricted cash. We had $5.8 million in restricted cash associated with the issuance of the New York Bonds.
• Payments of financing costs. We had a $2.2 million increase in deferred financing cost payments related to the issuance of the New York Bonds, the issuance of $11.0 million in aggregate principal amount of tax-exempt Solid Waste Disposal Revenue Bonds Series 2013 issued by the Business Finance Authority of the State of New Hampshire (“New Hampshire Bonds”), and the refinancing of our Senior Credit Facility.
• Debt activity. We had both an increase in debt borrowings, $26.6 million (associated with the issuance of the New York and New Hampshire Bonds, along with higher capital expenditures), and debt payments, $20.6 million (associated with the pay down of our Senior Credit Facility using the net proceeds from the issuance of New York Bonds and New Hampshire Bonds).
Net cash provided by (used in) discontinued operations. Cash flows from discontinued operations increased $1.9 million during transition period 2014 when compared to eight month period 2013 due to repayment in full of the remainder of the $2.0 million note receivable associated with the business disposition of BioFuels.
Cash Flow Activity – Fiscal Year 2014 compared to Fiscal Year 2013
Net cash flows provided by operating activities. Cash flows provided by operating activities increased by $5.7 million for fiscal year 2014 when compared to fiscal year 2013.

5959
The following is a summary of our operating cash flows (in millions) for fiscal year 2014 and fiscal year 2013:
Fiscal Year Ended April 30,
2014 2013
Net loss ............................................................................................................................. $ (27.4) $ (54.5)Adjustments to reconcile net loss to net cash provided by operating activities: ...............
(Income) loss from discontinued operations, net of tax .......................................... (0.3) 4.5 Loss on disposal of discontinued operations, net of tax .......................................... 0.4 — Gain on sale of property and equipment ................................................................. (0.8) (0.4)Depreciation and amortization ................................................................................ 60.3 56.6 Depletion of landfill operating lease obligations .................................................... 9.9 9.4 Interest accretion on landfill and environmental remediation liabilities ................. 4.0 3.7 Asset impairment charge ......................................................................................... 7.5 — Development project charge ................................................................................... 1.4 — Change in fair value of acquisition related contingent consideration ...................... (1.1) — Amortization of discount on second lien notes and senior subordinated notes ....... 0.2 0.6 Loss from equity method investments .................................................................... 0.9 4.4 Impairment of investments ...................................................................................... — — Gain on sale of equity method investment .............................................................. (0.6) — Loss on derivative instruments ................................................................................ 0.3 4.5 Loss on debt extinguishment ................................................................................... — 15.6 Stock-based compensation and related severance expense ..................................... 2.4 2.5 Excess tax benefit on the vesting of share based awards ........................................ — (0.1)Deferred income taxes............................................................................................. 1.6 (3.5)
Adjusted net loss before changes in assets and liabilities, net .......................................... 58.7 43.3 Changes in assets and liabilites, net .................................................................................. (9.1) 0.6
Net cash provided by operating activities ......................................................................... $ 49.6 $ 43.9
The most significant items affecting the change in our operating cash flows are summarized below:
• Improved operational performance in fiscal year 2014 as revenues increased by $42.3 million, whereas cost of operations and general and administration costs increased only $35.3 million and remained consistent as a percentage of revenues.
• Interest payments decreased $6.2 million in fiscal year 2014 due to the timing of payments, as well as lower interest rates as a result of the refinancing in October and November of 2012 of $180.0 million in aggregate principal amount of 11.0% Second Lien Notes. This reduction was partially offset by an increase in interest payments associated with higher average debt balances.
• Increases were partially offset by the cash flow impact associated with the changes in our assets and liabilities, net of effects of acquisitions and divestitures, which are affected by both cost changes and the timing of payments. This decline is due to the unfavorable impact associated with the change in accounts payable, the unfavorable impact associated with the change in prepaid expenses, inventories and other assets and the unfavorable impact associated with the change in accounts receivable, partially offset by the favorable impact associated with the change in accrued expenses and other liabilities.
Net cash used in investing activities. Cash flows used in investing activities decreased by $31.6 million for fiscal year 2014 when compared to fiscal year 2013.
The most significant items affecting the change in our investing cash flows are summarized below:
• Acquisitions, net of cash acquired. During fiscal year 2014, we acquired various businesses including several solid waste hauling operations, a transfer station, a MRF and an industrial service management business (included in the Other segment) fortotal consideration of $10.1 million, of which we have made $8.5 million in cash payments. In the fourth quarter of fiscal year2014, we recovered $0.2 million of the purchase price holdback amount we had previously paid and were relieved of any potential contingent consideration obligation associated with the acquisition of an industrial service management business in fiscal year 2014. This is compared to fiscal year 2013, when we acquired six solid waste hauling operations in the Western region and acquired all of the outstanding capital stock of BBI in the Eastern region for total consideration of $28.0 million, of which we paid $24.8 million in cash and made $0.5 million in holdback payments in fiscal year 2013.

6060
• Investments in unconsolidated entities. During fiscal year 2014, we made investments in unconsolidated entities totaling $2.1 million compared to $3.2 million in fiscal year 2013.
• Capital expenditures. Lower capital expenditures of $9.1 million in fiscal year 2014 related primarily to the timing of landfill development projects and a decrease in spending related to facilities.
Net cash provided by financing activities. Cash flows provided by financing activities decreased $35.9 million for fiscal year 2014 when compared to fiscal year 2013.
The most significant items affecting the change in our financing cash flows are summarized below:
• Stock issuance. We sold 11.5 million shares of Class A common stock in fiscal year 2013 and received net proceeds from the registered public offering of $42.2 million, after deducting underwriting discounts, commissions and offering expenses.
• Debt activity. We experienced a reduction in both debt payments, by $208.5 million, due primarily to the full redemption of the Second Lien Notes in fiscal year 2013, and debt borrowings, by $214.7 million, due primarily to the offering of $125.0 million in additional 2019 Notes in fiscal year 2013, resulting in a $6.2 million decrease in cash flows related to debt activity in fiscalyear 2014 compared to fiscal year 2013.
• Payment of financing costs. We made lower payments of financing costs of $4.2 million in fiscal year 2014 due primarily to the offering of $125.0 million in additional 2019 Notes in fiscal year 2013.
• Tender premium and costs. We paid a tender premium and tender costs of $10.7 million in fiscal year 2013 in connection with the redemption of the Second Lien Notes.
Net cash used in discontinued operations. Cash flows used in discontinued operations decreased $2.2 million for fiscal year 2014 when compared to fiscal year 2013. These fluctuations in net cash flows from discontinued operations are the result of the business disposition of BioFuels in exchange for a $2.0 million note receivable, which was to be paid to us in equal quarterly installments commencing November 1, 2013.
Outstanding Long-Term Debt
Asset-Based Lending Facility
The ABL Facility consists of a revolving credit facility with loans thereunder being available up to an aggregate principal amount of $190.0 million, subject to availability under a borrowing base formula as defined in the ABL Facility agreement. We have the right to request, at our discretion, an increase in the amount of loans under the ABL facility by an aggregate amount of $100.0 million, subject to the terms and conditions set forth in the ABL Facility agreement. Interest accrues at LIBOR plus between 1.75% and 2.50%, subject to the terms of the ABL Facility agreement and is set at LIBOR plus 2.25% as of December 31, 2015. The ABL Facility matures on February 26, 2020. If we fail to refinance the 2019 Notes on or before November 16, 2018, the maturity date of the ABLFacility will be November 16, 2018. The ABL Facility is guaranteed jointly and severally, fully and unconditionally by all of our significant wholly-owned subsidiaries and is collateralized by certain qualified accounts receivable-trade, inventory and property, plant and equipment.
The ABL Facility agreement requires us to maintain minimum consolidated EBITDA for the twelve months preceding the measurement date measured at the end of each fiscal quarter. Minimum consolidated EBITDA is a non-GAAP financial measure that should not be considered an alternative to any measure of financial performance calculated and presented in accordance with generally accepted accounting principles in the United States. As of December 31, 2015, we were in compliance with the minimum consolidatedEBITDA financial covenant contained in the ABL Facility agreement as follows (in millions):
Asset-Based Revolving Credit Facility Financial CovenantsFiscal Year Ended December 31, 2015
Covenant Requirements at December 31, 2015
Minimum consolidated EBITDA (1) ....................... $ 110.5 $ 75.0 Min.

61
61
(1) Minimum consolidated EBITDA is based on operating results for the twelve months preceding the measurement date, December 31, 2015. Based on the minimum consolidated EBITDA, our consolidated leverage ratio, as defined in the ABL Facility, was 4.75 as of December 31, 2015. The consolidated leverage ratio is used to set pricing according to the ABL Facilityagreement and there is no financial covenant associated with this ratio. A reconciliation of net cash provided by operating activities to minimum consolidated EBITDA is as follows (in millions):
Fiscal Year Ended December 31,
2015
Net cash provided by operating activities ............................................................... $ 70.5
Changes in assets and liabilities, net of effects of acquisitions and divestitures .... (5.0)Divestiture transactions .......................................................................................... 5.5 Gain on sale of property and equipment ................................................................. 0.1 Loss on debt extinguishment .................................................................................. (1.0)Stock based compensation, net of excess tax benefit.............................................. (2.9)Impairment of investments ..................................................................................... (2.1)Loss on derivative instruments ............................................................................... (0.2)Interest expense, less discount on long-term debt .................................................. 40.1 Provision for income taxes, net of deferred taxes ................................................... 0.6 EBITDA adjustment as allowed by the ABL Facility agreement ........................... (2.5)Other adjustments as allowed by the ABL Facility agreement ............................... 7.4
Minimum consolidated EBITDA ........................................................................... $ 110.5
If the borrowing availability is less than a minimum availability threshold determined in accordance with the ABL Facility agreement, we are then subject to additional financial ratio covenants. As of December 31, 2015, our borrowing availability was greater than the minimum availability threshold as follows (in millions):
AmountMinimum Availability
Threshold
Availability (2) ....................................................... $ 64.1 $ 23.8
(2) As of December 31, 2015, borrowing availability was calculated as a borrowing base of $148.5 million, less revolver borrowings of $57.5 million, less outstanding irrevocable letters of credit totaling $26.9 million, at which date no amount hadbeen drawn.
As of December 31, 2015, our additional financial ratio covenants, as defined in the ABL Facility agreement (if they would have been applicable) were as follows:
Asset-Based Revolving Credit Facility Financial Ratio CovenantsFiscal Year Ended December 31, 2015
Limits at December 31, 2015
Minimum fixed charge coverage ratio ................................ 1.81 1.00 Min. Maximum consolidated first lien leverage ratio .................. 0.55 2.00 Max.
Based on the seasonality of our business, operating results in the late fall, winter and early spring months are generally lower than the remainder of our fiscal year. Given the cash flow impact that this seasonality, the capital intensive nature of our business and the timing of debt payments has on our business, we typically incur higher debt borrowings from the ABL Facility in order to meet ourliquidity needs during these times. Consequently, our availability and performance against our financial covenants tighten during these times as well.
In addition to the financial covenants described above, the ABL Facility agreement also contains a number of important customaryaffirmative and negative covenants which restrict, among other things, our ability to sell assets, incur additional debt, create liens, make investments, and pay dividends. As of December 31, 2015, we were in compliance with all covenants under the ABL Facility agreement. We do not believe that these restrictions impact our ability to meet future liquidity needs.

62
62
Tax-Exempt Financings
New York Bonds
In transition period 2014, we completed a financing transaction involving the issuance of $25.0 million in aggregate principal amount of New York Bonds. We borrowed the proceeds of the New York Bonds to repay borrowings under our Senior Credit Facility for qualifying property, plant and equipment assets purchased in the state of New York.
As of December 31, 2015, we had outstanding $25.0 million aggregate principal amount of New York Bonds. The New York Bonds, which are unsecured and guaranteed jointly and severally, fully and unconditionally by all of our significant wholly-owned subsidiaries, accrue interest at 3.75% per annum through December 1, 2019, at which time they may be converted from a fixed rate to a variable rate, and interest is payable on June 1 and December 1 of each year. An additional $15.0 million aggregate principal amount of New York Bonds may be offered under the same indenture in the future. The New York Bonds mature on December 1, 2044.
Maine Bonds
As of December 31, 2015, we had outstanding $21.4 million aggregate principal amount of Finance Authority of Maine Solid Waste Disposal Revenue Bonds Series 2005R-2 (“FAME Bonds 2005R-2”). The FAME Bonds 2005R-2, which are unsecured and guaranteed jointly and severally, fully and unconditionally by all of our significant wholly-owned subsidiaries, accrue interest at 6.25% per annum through January 31, 2017, at which time they may be converted from a fixed to a variable rate, and interest is payable semiannually in arrears on February 1 and August 1 of each year. The FAME Bonds 2005R-2 mature on January 1, 2025.
As of December 31, 2015, we had outstanding $3.6 million aggregate principal amount of Finance Authority of Maine Solid Waste Disposal Revenue Bonds Series 2005R-1 (“FAME Bonds 2005R-1”). The FAME Bonds 2005R-1 are variable rate bonds secured by a letter of credit issued by our administrative agent bank and interest is payable semiannually in arrears on February 1 and August 1 of each year. The FAME Bonds 2005R-1 mature on January 1, 2025. We borrowed the proceeds of the FAME Bonds 2005R-1 and 2005R-2 to pay for certain costs relating to the following: landfill development and construction; the acquisition of vehicles,containers and related equipment for solid waste collection and transportation services; improvements to existing solid waste disposal, hauling, transfer station and other facilities; other infrastructure improvements; and the acquisition of machinery and equipment for solid waste disposal operations owned and operated by us, or a related party, all located in Maine.
In fiscal year 2015, we completed a financing transaction involving the issuance of $15.0 million in aggregate principal amount of FAME Bonds 2015. We borrowed the proceeds of the offering of the FAME Bonds 2015 to finance or refinance the costs of certain ofour solid waste landfill facilities and solid waste collection, organics and transfer, recycling and hauling facilities, and to pay for the costs of the issuance of the FAME Bonds 2015. As of December 31, 2015, we had $1.3 million of restricted cash reserved for repayment of costs incurred to fund certain capital projects in the State of Maine as a result of this financing.
As of December 31, 2015, we had outstanding $15.0 million aggregate principal amount of FAME Bonds 2015. The FAME Bonds 2015, which are unsecured and guaranteed jointly and severally, fully and unconditionally by all of our significant wholly-ownedsubsidiaries, accrue interest at 5.125% per annum through August 1, 2025, at which time they may be converted from a fixed to avariable rate, and interest is payable semiannually in arrears on February 1 and August 1 of each year. An additional $15.0 million aggregate principal amount of FAME Bonds 2015 may be offered under the same indenture in the future. The FAME Bonds 2015 mature on August 1, 2035.
Vermont Bonds
As of December 31, 2015, we had outstanding $16.0 million aggregate principal amount Vermont Economic Development Authority Solid Waste Disposal Long-Term Revenue Bonds Series 2013 (“Vermont Bonds”). The Vermont Bonds, which are unsecured and guaranteed jointly and severally, fully and unconditionally by all of our significant wholly-owned subsidiaries, accrue interest at 4.75% per annum through April 1, 2018, at which time they may be converted from a fixed rate to a variable rate, and interest ispayable semiannually in arrears on April 1 and October 1 of each year. The Vermont Bonds mature on April 1, 2036. We borrowed the proceeds of the Vermont Bonds to repay borrowings under our Senior Credit Facility for qualifying property, plant and equipment assets purchased in the state of Vermont.
New Hampshire Bonds
In transition period 2014, we completed a financing transaction involving the issuance of $11.0 million in aggregate principal amount of New Hampshire Bonds, consisting of the conversion and remarketing of $5.5 million principal amount New Hampshire Bonds from a variable rate to a fixed term rate and the issuance of an additional $5.5 million principal amount fixed term rate New HampshireBonds.

6363
As of December 31, 2015, we had outstanding $11.0 million aggregate principal amount of New Hampshire Bonds. The New Hampshire Bonds, which are unsecured and guaranteed jointly and severally, fully and unconditionally by all of our significant wholly-owned subsidiaries, accrue interest at 4.00% per annum through October 1, 2019, at which time they may be converted from a fixed rate to a variable rate, and interest is payable in arrears on April 1 and October 1 of each year. The New Hampshire Bondsmature on April 1, 2029. We borrowed the proceeds of the New Hampshire Bonds to repay borrowings under our Senior Credit Facility for qualifying property, plant and equipment assets purchased in the state of New Hampshire.
Senior Subordinated Notes
In fiscal year 2015, we issued an additional $60.0 million aggregate principal amount of 2019 Notes. The additional 2019 Notes,which are both fungible and issued under the same indenture as the $325.0 million 2019 Notes previously issued, were issued at adiscount of $0.5 million to be accreted over the remaining term of the 2019 Notes. We used the net proceeds from this issuance,together with the initial borrowings under our new ABL Facility, to refinance our Senior Credit Facility. Additionally, in fiscal year 2015, we repurchased and permanently retired $14.7 million aggregate principal amount of 2019 Notes at a weighted average repurchase price of $101.0 in order to maximize interest savings by paying down our most expensive debt.
As of December 31, 2015, we had outstanding $370.3 million aggregate principal amount of 2019 Notes, which will mature on February 15, 2019. The 2019 Notes accrue interest at the rate of 7.75% per annum and interest is payable semiannually in arrears on February 15 and August 15 of each year. The 2019 Notes are fully and unconditionally guaranteed on a senior subordinated basis by substantially all of our existing and future domestic restricted subsidiaries that guarantee our ABL Facility.
The indenture governing the 2019 Notes contains certain negative covenants which restrict, among other things, our ability to sellassets, make investments in joint ventures, pay dividends, repurchase stock, incur debt, grant liens and issue preferred stock. As of December 31, 2015, we were in compliance with all covenants under the indenture governing the 2019 Notes, and we do not believethat these restrictions impact our ability to meet future liquidity needs except that they may impact our ability to increase our investments in non-wholly owned entities, including the joint ventures to which we are already party.
Shelf Registration
We have filed a universal shelf registration statement with the SEC pursuant to which we may from time to time issue securities in an amount of up to $190.0 million, after giving consideration to the $60.0 million aggregate principal amount of additional 2019 Notes we issued in February 2015 pursuant to this registration statement.
Contractual Obligations
The following table summarizes our significant contractual obligations and commitments as of December 31, 2015 (in thousands) and the anticipated effect of these obligations on our liquidity in future years:
Less than one year 1 - 3 years 3 - 5 years
More than 5years Total
Long-term debt and capital leases ................................. $ 1,448 $ 1,489 $ 429,382 $ 92,699 $ 525,018 Interest obligations (1) .................................................. 35,940 71,700 15,582 56,114 179,336 Non-cancellable operating leases (2) ............................ 17,591 35,792 29,737 117,224 200,344 Capping / closure / post-closure .................................... 732 3,399 11,577 113,691 129,399
Total contractual cash obligations (3) ........................... $ 55,711 $ 112,380 $ 486,278 $ 379,728 $ 1,034,097
(1) Based on debt and capital lease balances as of December 31, 2015. Interest obligations related to variable rate debt were calculated using variable rates in effect at December 31, 2015.
(2) Includes obligations related to landfill operating lease contracts. (3) Contractual cash obligations do not include accounts payable or accrued liabilities, which will be paid in the fiscal year ending
December 31, 2016.
In addition to the above obligations, we have unrecognized tax benefits at December 31, 2015 of approximately $0.4 million. Due to the uncertainty with respect to the timing of future cash flows associated with the unrecognized tax benefits at December 31, 2015, we are unable to make reasonably reliable estimates as to the timing of cash settlements. For a description of our commitments andcontingencies, see Note 8, Final Capping, Closure and Post-Closure Costs, Note 10, Commitments and Contingencies and Note 14, Income Taxes, of our consolidated financial statements included in Item 8 of this Annual Report on Form 10-K.

6464
Inflation
Although inflationary increases in costs have affected our historical operating margins, we believe that inflation generally has not had a significant impact on our operating results. Consistent with industry practice, most of our contracts provide for a pass-through of certain costs to our customers, including increases in landfill tipping fees and in some cases fuel costs, intended to mitigate the impact of inflation on our operating results. We have also implemented a number of operating efficiency programs that seek to improve productivity and reduce our service costs and a fuel and oil recovery fee, which is designed to recover escalating fuel price fluctuations above an annually reset floor. Based on these implementations, we believe we should be able to sufficiently offset most cost increases resulting from inflation. However, competitive factors may require us to absorb at least a portion of these cost increases. Additionally, management’s estimates associated with inflation have had, and will continue to have, an impact on our accounting for landfill and environmental remediation liabilities.
Regional Economic Conditions
Our business is primarily located in the northeastern United States. Therefore, our business, financial condition and results ofoperations are susceptible to downturns in the general economy in this geographic region and other factors affecting the region, such as state regulations and severe weather conditions. We are unable to forecast or determine the timing and/or the future impact of a sustained economic slowdown.
Limitations on Ownership of Notes
Pursuant to Section 2.19 of the indenture governing the 2019 Notes and the provisions of the FAME Bonds 2015, FAME Bonds 2005R-2, New Hampshire Bonds, New York Bonds and Vermont Bonds, no beneficial holder of the 2019 Notes, FAME Bonds 2015, FAME Bonds 2005R-2, New Hampshire Bonds, New York Bonds and/or Vermont Bonds is permitted to knowingly acquire 2019 Notes, FAME Bonds 2015, FAME Bonds 2005R-2, New Hampshire Bonds, New York Bonds and/or Vermont Bonds if such person would own 10% or more of the consolidated debt for which relevant subsidiaries of ours are obligated (and must dispose of 2019 Notes, FAME Bonds 2015, FAME Bonds 2005R-2, New Hampshire Bonds, New York Bonds and/or Vermont Bonds or other debt of ours to the extent such person becomes aware of exceeding such threshold), if such ownership would require consent of any regulatoryauthority under applicable law or regulation governing solid waste operators and such consent has not been obtained. We will furnish to the holders of the 2019 Notes, FAME Bonds 2015, FAME Bonds 2005R-2, New Hampshire Bonds, New York Bonds and Vermont Bonds, in each quarterly and annual report, the dollar amount of our debt that would serve as the threshold for evaluating a beneficial holder’s compliance with these ownership restrictions. As of December 31, 2015, that dollar amount was $51.6 million.
Critical Accounting Estimates and Assumptions
The preparation of our financial statements requires management to make estimates and assumptions that affect the reported amounts of assets and liabilities and the disclosure of contingent assets and liabilities, as applicable, at the date of the financial statements and the reported amounts of revenues and expenses during the reporting period. On an on-going basis, management evaluates its estimates and judgments which are based on historical experience and on various other factors that are believed to be reasonable under thecircumstances. The results of their evaluation form the basis for making judgments about the carrying values of assets and liabilities.Actual results may differ from these estimates under different assumptions and circumstances. Our significant accounting policies are more fully discussed in Note 3, Summary of Significant Accounting Policies of our consolidated financial statements included in Item 8 of this Annual Report on Form 10-K.
Landfill Accounting
Landfill Development Costs
We estimate the total cost to develop each of our landfill sites to its remaining permitted and expansion capacity (see landfilldevelopment costs discussed within the “Property, Plant and Equipment” accounting policy more fully discussed in Note 3, Summary of Significant Accounting Policies of our consolidated financial statements included in Item 8 of this Annual Report on Form 10-K). The projection of these landfill costs is dependent, in part, on future events. The remaining amortizable basis of each landfill includes costs to develop a site to its remaining permitted and expansion capacity and includes amounts previously expended and capitalized,net of accumulated airspace amortization, and projections of future purchase and development costs including capitalized interest. The interest capitalization rate is based on our weighted average interest rate incurred on borrowings outstanding during the period.
Under life-cycle accounting, all costs related to acquisition and construction of landfill sites are capitalized and charged to expense based on tonnage placed into each site. Landfill permitting, acquisition and preparation costs are amortized on the units-of-consumption method as landfill airspace is consumed. In determining the amortization rate for our landfills, preparation costs include the total estimated costs to complete construction of the landfills’ permitted and expansion capacity.

6565
Final Landfill Capping, Closure and Post-Closure Costs
The cost estimates for final capping, closure and post-closure activities at landfills for which we have responsibility are estimated based on our interpretations of current requirements and proposed or anticipated regulatory changes. We also estimate additional costs based on the amount a third-party would charge us to perform such activities even when we expect to perform these activities internally. We estimate the airspace to be consumed related to each final capping event and the timing of construction related to each final capping event and of closure and post-closure activities. Because landfill final capping, closure and post-closure obligations are measured at estimated fair value using present value techniques, changes in the estimated timing of construction of future landfill final capping and closure and post-closure activities would have an effect on these liabilities, related assets and results of operations.
Final capping activities include the installation of liners, drainage, compacted soil layers and topsoil over areas of a landfill where total airspace has been consumed and waste is no longer being received. Final capping activities occur throughout the life of the landfill. Our engineering personnel estimate the cost for each final capping event based on the acreage to be capped, along with the finalcapping materials and activities required. The estimates also consider when these costs would actually be paid and factor in inflation and discount rates. The engineers then quantify the landfill capacity associated with each final capping event and the costs for each event are amortized over that capacity as waste is received at the landfill.
Closure and post-closure costs represent future estimated costs related to monitoring and maintenance of a solid waste landfill after a landfill facility ceases to accept waste and closes. We estimate, based on input from our engineers, lawyers, accounting personnel and consultants, our future cost requirements for closure and post-closure monitoring and maintenance based on our interpretation of the technical standards of the Subtitle D regulations and the air emissions standards under the Clean Air Act of 1970, as amended, as they are being applied on a state-by-state basis. Closure and post-closure accruals for the cost of monitoring and maintenance include site inspection, groundwater monitoring, leachate management, methane gas control and recovery, and operation and maintenance costs to be incurred for a period which is generally for a term of 30 years after final closure of a landfill. In determining estimated future closure and post-closure costs, we consider costs associated with permitted and permittable airspace.
Remaining Permitted Airspace
Our engineers, in consultation with third-party engineering consultants and surveyors, are responsible for determining remainingpermitted airspace at our landfills. The remaining permitted airspace is determined by an annual survey, which is then used to compare the existing landfill topography to the expected final landfill topography.
Expansion Airspace
We currently include unpermitted expansion airspace in our estimate of remaining permitted and expansion airspace in certain circumstances. To be considered expansion airspace all of the following criteria must be met:
• we control the land on which the expansion is sought;
• all technical siting criteria have been met or a variance has been obtained or is reasonably expected to be obtained;
• we have not identified any legal or political impediments which we believe will not be resolved in our favor;
• we are actively working on obtaining any necessary permits and we expect that all required permits will be received; and
• senior management has approved the project.
For unpermitted airspace to be included in our estimate of remaining permitted and expansion airspace, the expansion effort must meet all of the criteria listed above. These criteria are evaluated annually by our engineers, accountants, lawyers, managers and others to identify potential obstacles to obtaining the permits. Once the remaining permitted and expansion airspace is determined in cubicyards, an airspace utilization factor (“AUF”) is established to calculate the remaining permitted and expansion capacity in tons. The AUF is established using the measured density obtained from previous annual surveys. When we include the expansion airspace in our calculation of remaining permitted and expansion airspace, we include the projected costs for development, as well as the projectedasset retirement costs related to final capping, closure and post-closure of the expansion airspace in the amortization basis of the landfill.
After determining the costs and the remaining permitted and expansion capacity at each of our landfills, we determine the per ton rates that will be expensed as waste is received and deposited at the landfill by dividing the costs by the corresponding number of tons. We calculate per ton amortization rates for assets associated with each final capping event, for assets related to closure and post-closure activities and for all other costs capitalized or to be capitalized in the future for each landfill. These rates per ton are updated annually, or more frequently, as significant facts change.

6666
It is possible that actual results, including the amount of costs incurred, the timing of final capping, closure and post-closure activities, our airspace utilization or the success of our expansion efforts could ultimately turn out to be significantly different from our estimates and assumptions. To the extent that such estimates or related assumptions prove to be significantly different than actual results, lower profitability may be experienced due to higher amortization rates, higher final capping, closure or post-closure rates, or higher expenses. Higher profitability may result if the opposite occurs. Most significantly, if it is determined that the expansion capacity should no longer be considered in calculating the recoverability of the landfill asset, we may be required to recognize an assetimpairment. If it is determined that the likelihood of receiving an expansion permit has become remote, the capitalized costs related to the expansion effort are expensed immediately.
Environmental Remediation Liabilities
We have recorded environmental remediation liabilities representing our estimate of the most likely outcome of the matters for which we have determined that a liability is probable. These liabilities include potentially responsible party investigations, settlements, certain legal and consultant fees, as well as costs directly associated with site investigation and clean up, such as materials and incremental internal costs directly related to the remedy. We provide for expenses associated with environmental remediation obligations when such amounts are probable and can be reasonably estimated. We estimate costs required to remediate sites where it is probable that a liability has been incurred based on site-specific facts and circumstances. Estimates of the cost for the likely remedy are developed using third-party environmental engineers or other service providers. Where we believe that both the amount of a particular environmental remediation liability and timing of payments are reliably determinable, we inflate the cost in current dollars until the expected time of payment and discount the cost to present value.
Accounts Receivable – Trade, Net of Allowance for Doubtful Accounts
Accounts receivable – trade represent receivables from customers for collection, transfer, recycling, disposal and other services. Our accounts receivable – trade are recorded when billed or when related revenue is earned, if earlier, and represent claims against third-parties that will be settled in cash. The carrying value of our accounts receivable – trade, net of allowance for doubtful accounts, represents its estimated net realizable value. Estimates are used in determining our allowance for doubtful accounts based on our historical collection experience, current trends, credit policy and a review of our accounts receivable – trade by aging category. Our reserve is evaluated and revised on a monthly basis. Past-due accounts receivable-trade are written off when deemed to be uncollectible.
Goodwill and Other Intangibles
We annually assess goodwill impairment at the end of our fiscal year or more frequently if events or circumstances indicate thatimpairment may exist. Historically, we have performed our annual goodwill impairment test using our fiscal year-end, or April 30th, as the measurement date. Effective with the change in our fiscal year-end from April 30th to December 31st, we have voluntarily changed our goodwill impairment measurement date from April 30th to December 31st to coincide with the change in our fiscal year-end. The voluntary change in our goodwill impairment measurement date was applied prospectively as it represents the modification of an existing principle based on new facts and circumstances.
We may assess whether a goodwill impairment exists using either a qualitative or a quantitative assessment. If we perform a qualitative assessment, it involves determining whether events or circumstances exist that indicate it is more likely than not that the fair value of a reporting unit is less than its carrying amount, including goodwill. If based on this qualitative assessment we determine it is not more likely than not that the fair value of a reporting unit is less than its carrying amount, we will not perform a quantitative assessment. If the qualitative assessment indicates that it is more likely than not that the fair value of a reporting unit is less than its carrying amount, or if we elect not to perform a qualitative assessment, we perform a quantitative assessment, or two-step impairment test, to determine whether goodwill impairment exists at the reporting unit.
In the first step (defined as “Step 1”) of testing for goodwill impairment, we estimate the fair value of each reporting unit, which we have determined to be our geographic operating segments, our Recycling segment and our Customer Solutions business, which is included in the Other segment, and compare the fair value with the carrying value of the net assets of each reporting unit. If the fair value is less than its carrying value, then we would perform a second step (defined as “Step 2”) and determine the fair value of the goodwill. In Step 2, the fair value of goodwill is determined by deducting the fair value of a reporting unit’s identifiable assets and liabilities from the fair value of the reporting unit as a whole, as if that reporting unit had just been acquired and the purchase price were being initially allocated.
To determine the fair value of each of our reporting units as a whole we use discounted cash flow analyses, which require significant assumptions and estimates about the future operations of each reporting unit. Significant judgments inherent in this analysis include the determination of appropriate discount rates, the amount and timing of expected future cash flows and growth rates. The cash flows

6767
employed in our discounted cash flow analyses are based on financial forecasts developed internally by management. Our discountrate assumptions are based on an assessment of our risk adjusted discount rate, applicable for each reporting unit. In assessing the reasonableness of our determined fair values of our reporting units, we evaluate our results against our current market capitalization
If the fair value of the goodwill is less than its carrying value for a reporting unit, an impairment charge would be recorded to earnings. The loss recognized cannot exceed the carrying amount of goodwill. After a goodwill impairment loss is recognized, theadjusted carrying amount of goodwill becomes its new accounting basis.
In addition to an annual goodwill impairment assessment, we would evaluate a reporting unit for impairment if events or circumstances change between annual tests indicating a possible impairment. Examples of such events or circumstances include thefollowing:
• a significant adverse change in legal status or in the business climate;
• an adverse action or assessment by a regulator;
• a more likely than not expectation that a segment or a significant portion thereof will be sold; or
• the testing for recoverability of a significant asset group within the segment.
We elected to perform a quantitative analysis as part of our annual goodwill impairment test in fiscal year 2015. As of December 31, 2015, the Step 1 testing for goodwill impairment performed for the Eastern, Western, Recycling and Customer Solutions reportingunits indicated that the fair value of each reporting unit exceeded its carrying amount, including goodwill. Furthermore, the Step 1 test indicated that in each case the fair value of the Eastern, Western, Recycling and Customer Solutions reporting units exceeded itscarrying value by in excess of 22.9%. We incurred no impairment of goodwill as a result of our annual goodwill impairment tests in fiscal year 2015 and transition period 2014. However, there can be no assurance that goodwill will not be impaired at any time in the future.
Intangible assets consist primarily of covenants not-to-compete and customer lists. Intangible assets are recorded at fair value and are amortized based on the economic benefit provided or using the straight-line method over their estimated useful lives. Covenants not-to-compete and customer lists are typically amortized over a term of no more than 10 years.
Recovery of Long-Lived Assets
We continually assess whether events or changes in circumstances have occurred that may warrant revision of the estimated usefullives of our long-lived assets (other than goodwill) or whether the remaining balances of those assets should be evaluated for possible impairment. Long-lived assets include, for example, capitalized landfill costs, other property and equipment, and identifiable intangible assets. Events or changes in circumstances that may indicate that an asset may be impaired include the following:
• a significant decrease in the market price of an asset or asset group;
• a significant adverse change in the extent or manner in which an asset or asset group is being used or in its physical condition;
• a significant adverse change in legal factors or in the business climate that could affect the value of an asset or asset group, including an adverse action or assessment by a regulator;
• an accumulation of costs significantly in excess of the amount originally expected for the acquisition or construction of a long-lived asset;
• a current period operating or cash flow loss combined with a history of operating or cash flow losses or a projection or forecastthat demonstrates continuing losses associated with the use of a long-lived asset or asset group;
• a current expectation that, more likely than not, a long-lived asset or asset group will be sold or otherwise disposed of significantly before the end of its previously estimated useful life; or
• an impairment of goodwill at a reporting unit.
There are certain indicators listed above that require significant judgment and understanding of the waste industry when applied to landfill development or expansion. For example, a regulator may initially deny a landfill expansion permit application although the expansion permit is ultimately granted. In addition, management may periodically divert waste from one landfill to another to conserve remaining permitted landfill airspace. Therefore, certain events could occur in the ordinary course of business and notnecessarily be considered indicators of impairment due to the unique nature of the waste industry.

68
68
If an impairment indicator occurs, we perform a test of recoverability by comparing the carrying value of the asset or asset group to its undiscounted expected future cash flows. We group our long-lived assets for this purpose at the lowest level for which identifiablecash flows are primarily independent of the cash flows of other assets or asset groups. If the carrying values are in excess ofundiscounted expected future cash flows, we measure any impairment by comparing the fair value of the asset or asset group to itscarrying value.
To determine fair value, we use discounted cash flow analyses and estimates about the future cash flows of the asset or asset group. This analysis includes a determination of an appropriate discount rate, the amount and timing of expected future cash flows andgrowth rates. The cash flows employed in our discounted cash flow analyses are typically based on financial forecasts developedinternally by management. The discount rate used is commensurate with the risks involved. We may also rely on third-party valuations and or information available regarding the market value for similar assets.
If the fair value of an asset or asset group is determined to be less than the carrying amount of the asset or asset group, impairment in the amount of the difference is recorded in the period that the impairment occurs. Estimating future cash flows requires significantjudgment and projections may vary from the cash flows eventually realized.
See Note 3, Summary of Significant Accounting Policies and Note 16, Divestiture Transactions and Discontinued Operations to our consolidated financial statements included under Item 8 of this Annual Report on Form 10-K for further disclosure.
Investments in Unconsolidated Entities
Investments in unconsolidated entities over which we have significant influence over the investees’ operating and financing activities are accounted for under the equity method of accounting, as applicable. Investments in affiliates in which we do not have the ability to exert significant influence over the investees’ operating and financing activities are accounted for under the cost method of accounting.
We monitor and assess the carrying value of our investments throughout the year for potential impairment and write them down totheir fair value when other-than-temporary declines exist. Fair value is generally based on (i) other third-party investors’ recent transactions in the securities; (ii) other information available regarding the current market for similar assets and/or (iii) a market or income approach, as deemed appropriate.
When we assess the carrying value of our investments for potential impairment, determining the fair value of our investments is reliant upon the availability of market information and/or other information provided by third-parties to be able to develop an estimate of fair value. Additionally, considerable judgment is required in interpreting market data to develop the estimates of fair value. Accordingly, our estimates are not necessarily indicative of the amounts that we, or other holders of these investments, could realize in a current market exchange. The use of different assumptions and/or estimation methodologies could have a significant effect on the estimated fair values. The current estimates of fair value could differ significantly from the amounts presented.
See Note 3, Summary of Significant Accounting Policies to our consolidated financial statements included under Item 8 of this Annual Report on Form 10-K for further disclosure.
Self-Insurance Liabilities and Related Costs
We are self-insured for vehicles and workers’ compensation with reinsurance coverage limiting our maximum exposure. Our maximum exposure in fiscal year 2015 under the workers’ compensation plan was $1.0 million per individual event. Our maximum exposure in fiscal year 2015 under the automobile plan was $1.2 million per individual event. The liability for unpaid claims andassociated expenses, including incurred but not reported losses, is determined by management with the assistance of a third-partyactuary and reflected in our consolidated balance sheet as an accrued liability. We use a third-party to track and evaluate actual claims experience for consistency with the data used in the annual actuarial valuation. The actuarially determined liability is calculated based on historical data, which considers both the frequency and settlement amount of claims. Our estimated accruals for these liabilitiescould be significantly different than our ultimate obligations if variables such as the frequency or severity of future events differ significantly from our assumptions.
See Note 3, Summary of Significant Accounting Policies to our consolidated financial statements included under Item 8 of this Annual Report on Form 10-K for further disclosure.

6969
Income Taxes
We use estimates to determine our provision for income taxes and related assets and liabilities and any valuation allowance recorded against our net deferred tax assets. Valuation allowances have been established for the possibility that tax benefits may not be realized for certain deferred tax assets. Deferred income taxes are recognized based on the expected future tax consequences of differencesbetween the financial statement basis and the tax basis of assets and liabilities, calculated using currently enacted tax rates. We record net deferred tax assets to the extent we believe these assets will more likely than not be realized. In making this determination, we consider all available positive and negative evidence, including scheduled reversals of deferred tax liabilities, projected future taxable income, tax planning strategies and recent financial operations. In the event we determine that we would be able to realize ourdeferred income tax assets in the future in excess of their net recorded amount, we will make an adjustment to the valuation allowance which would reduce the provision for income taxes.
We account for income tax uncertainties according to guidance on the recognition, de-recognition and measurement of potential taxbenefits associated with tax positions. We recognize interest and penalties relating to income tax matters as a component of income tax expense.
See Note 14, Income Taxes to our consolidated financial statements included under Item 8 of this Annual Report on Form 10-K for further disclosure.
Contingent Liabilities
We are subject to various legal proceedings, claims and regulatory matters, the outcomes of which are subject to significant uncertainty. We determine whether to disclose or accrue for loss contingencies based on an assessment of whether the risk of loss is remote, reasonably possible or probable, and whether it can be reasonably estimated. We analyze our litigation and regulatory mattersbased on available information to assess the potential liabilities. Management’s assessment is developed based on an analysis ofpossible outcomes under various strategies. We accrue for loss contingencies when such amounts are probable and reasonably estimable. If a contingent liability is only reasonably possible, we will disclose the potential range of the loss, if estimable. We record losses related to contingencies in cost of operations or general and administration expenses, depending on the nature of the underlying transaction leading to the loss contingency. Contingent liabilities accounted for under purchase accounting are recorded at their fair values. These fair values may be different from the values we would have otherwise recorded, had the contingent liability not been assumed as part of an acquisition of a business. See Note 4, Business Acquisitions for disclosure over a contingent liability assumed as part of the acquisition of a business.
See Note 4, Business Combinations and Note 10, Commitments and Contingencies to our consolidated financial statements included under Item 8 of this Annual Report on Form 10-K for further disclosure.
Stock-Based Compensation
All share-based compensation cost is measured at the grant date, based on the estimated fair value of the award, and is recognized as expense over the employee’s requisite service period. Stock-based compensation expense is based on the number of awards ultimately expected to vest and is therefore reduced for an estimate of the awards that are expected to be forfeited prior to vesting.
The fair value of each stock option is estimated using a Black-Scholes option pricing model, which requires extensive use of accounting judgment and financial estimation, including estimates of the expected term option holders will retain their vested stock options before exercising them and the estimated volatility of our common stock price over the expected term.
See Note 11, Stockholders Deficit to our consolidated financial statements included under Item 8 of this Annual Report on Form 10-K for further disclosure.
New Accounting Standards
For a description of the new accounting standards that may affect us, see Note 2, Accounting Changes to our consolidated financial statements included in Item 8 of this Annual Report on Form 10-K.
ITEM 7A. QUANTITATIVE AND QUALITATIVE DISCLOSURE ABOUT MARKET RISK
In the normal course of business we are exposed to market risks, including changes in interest rates and certain commodity prices. We have a variety of strategies to mitigate these market risks, including at times using derivative instruments to hedge some portion of these risks.

7070
Interest Rate Volatility
We had interest rate risk relating to approximately $61.0 million of long-term debt at December 31, 2015. The weighted average interest rate on the variable rate portion of long-term debt was approximately 2.9% at December 31, 2015. Should the average interestrate on the variable rate portion of long-term debt change by 100 basis points, we estimate that our annual interest expense would increase or decrease by approximately $0.6 million. The remainder of our long-term debt is at fixed rates and not subject to interestrate risk.
Our strategy to hedge against fluctuations in variable interest rates involves entering into interest rate derivative agreements to hedge against adverse movements in interest rates. As of December 31, 2015, we were currently party to one interest rate derivative agreement that is not deemed to be an effective cash flow hedge. The total notional amount of this agreement is $75.0 million and requires us to receive interest based on changes in LIBOR and pay interest at a rate of 1.45%. This agreement matures on March 15, 2016.
Commodity Price Volatility
Through our Recycling operation, we market a variety of materials, including fibers such as old corrugated cardboard and old newsprint, plastics, glass, ferrous and aluminum metals. We may use a number of strategies to mitigate impacts from commodity pricefluctuations including: (1) charging collection customers a floating sustainability recycling adjustment fee to offtake recyclingcommodity risks; (2) in-bound MRF customers receiving a revenue share or indexed materials purchases in higher commodity price markets, or charging these same customers a processing cost or tipping fee per ton lower commodity price markets; (3) selling recycling commodities to out-bound MRF customers through floor price or fixed price agreements or (4) by entering into fixed pricecontracts and entering into hedges which mitigate the variability in cash flows generated from the sales of recycled paper at floating prices . We do not use financial instruments for trading purposes and are not a party to any leveraged derivatives. As of December 31, 2015, we were not party to any commodity hedging agreements.
Should commodity prices change by 10%, we estimate that our annual operating income margin would change by approximately $0.8 million. Our sensitivity to changes in commodity prices is complex because each customer contract is unique relative to revenuesharing, tipping or processing fees and other arrangements. The above estimated ranges of operating income impact may not be indicative of future operating results and actual results may vary materially.
71
71
ITEM 8. FINANCIAL STATEMENTS AND SUPPLEMENTARY DATA
Report of Independent Registered Public Accounting Firm
To the Board of Directors and Stockholders of Casella Waste Systems, Inc.:
We have audited the accompanying consolidated balance sheets of Casella Waste Systems, Inc. and subsidiaries (the “Company”) asof December 31, 2015, December 31, 2014 and April 30, 2014, and the related consolidated statements of operations, comprehensiveloss, stockholders’ (deficit) equity and cash flows for the fiscal year ended December 31, 2015, the eight months ended December 31, 2014, and for the fiscal years ended April 30, 2014 and April 30, 2013. Our audits also included the financial statement schedules of Casella Waste Systems, Inc. and subsidiaries listed in Item 15(a)(2). We also have audited the Company’s internal control over financial reporting as of December 31, 2015, based on criteria established in Internal Control — Integrated Framework issued by the Committee of Sponsoring Organizations of the Treadway Commission in 2013. The Company’s management is responsible for these financial statements and financial statement schedules, for maintaining effective internal control over financial reporting, and for its assessment of the effectiveness of internal control over financial reporting included in the accompanying Management’s Report onInternal Control over Financial Reporting. Our responsibility is to express an opinion on these financial statements and schedules and an opinion on the Company’s internal control over financial reporting based on our audits.
We conducted our audits in accordance with the standards of the Public Company Accounting Oversight Board (United States). Thosestandards require that we plan and perform the audits to obtain reasonable assurance about whether the financial statements are free of material misstatement and whether effective internal control over financial reporting was maintained in all material respects. Our audits of the financial statements included examining, on a test basis, evidence supporting the amounts and disclosures in the financial statements, assessing the accounting principles used and significant estimates made by management, and evaluating the overall financial statement presentation. Our audit of internal control over financial reporting included obtaining an understanding of internal control over financial reporting, assessing the risk that a material weakness exists, and testing and evaluating the design and operating effectiveness of internal control based on the assessed risk. Our audits also included performing such other procedures as we considered necessary in the circumstances. We believe that our audits provide a reasonable basis for our opinions.
A company’s internal control over financial reporting is a process designed to provide reasonable assurance regarding the reliability of financial reporting and the preparation of financial statements for external purposes in accordance with generally accepted accounting principles. A company’s internal control over financial reporting includes those policies and procedures that (a) pertain to the maintenance of records that, in reasonable detail, accurately and fairly reflect the transactions and dispositions of the assets of the company; (b) provide reasonable assurance that transactions are recorded as necessary to permit preparation of financial statements in accordance with generally accepted accounting principles, and that receipts and expenditures of the company are being made only in accordance with authorizations of management and directors of the company; and (c) provide reasonable assurance regarding prevention or timely detection of unauthorized acquisition, use, or disposition of the company’s assets that could have a material effect on the financial statements.
Because of its inherent limitations, internal control over financial reporting may not prevent or detect misstatements. Also, projections of any evaluation of effectiveness to future periods are subject to the risk that controls may become inadequate because of changes in conditions, or that the degree of compliance with the policies or procedures may deteriorate.
In our opinion, the consolidated financial statements referred to above present fairly, in all material respects, the financial position of Casella Waste Systems, Inc. and subsidiaries as of December 31, 2015, December 31, 2014 and April 30, 2014, and the results of their operations and their cash flows for the fiscal year ended December 31, 2015, the eight months ended December 31, 2014, and the fiscal years ended April 30, 2014 and April 30, 2013, in conformity with accounting principles generally accepted in the United States of America, and in our opinion, the related financial statement schedules, when considered in relation to the basic consolidatedfinancial statements taken as a whole, presents fairly in all material respects the information set forth therein. Also in our opinion, Casella Waste Systems, Inc. and subsidiaries maintained, in all material respects, effective internal control over financial reporting as of December 31, 2015, based on criteria established in Internal Control — Integrated Framework issued by the Committee of Sponsoring Organizations of the Treadway Commission in 2013.
/s/ RSM US LLP
Boston, Massachusetts March 2, 2016

7272
CASELLA WASTE SYSTEMS, INC. AND SUBSIDIARIES CONSOLIDATED BALANCE SHEETS
(in thousands)
December 31, 2015
December 31,2014
April 30, 2014
ASSETSCURRENT ASSETS: .........................................................................................................
Cash and cash equivalents ............................................................................... $ 2,312 $ 2,205 $ 2,464 Restricted cash ................................................................................................. — 76 76 Accounts receivable - trade, net of allowance for doubtful accounts of $988,
$2,153 and $1,672, respectively .................................................................. 60,167 55,750 52,603 Refundable income taxes ................................................................................. 651 554 465 Prepaid expenses .............................................................................................. 7,670 8,763 7,176 Inventory .......................................................................................................... 4,282 4,374 3,905 Deferred income taxes ..................................................................................... — 2,095 2,502 Other current assets .......................................................................................... 1,586 4,852 1,255 Current assets of discontinued operations ........................................................ — — 359
Total current assets ............................................................................................................. 76,668 78,669 70,805
Property, plant and equipment, net of accumulated depreciation and amortization of $789,766, $736,839 and $695,935, respectively 402,252 414,542 403,424
Goodwill ............................................................................................................................. 118,976 119,170 119,139 Intangible assets, net ........................................................................................................... 9,252 11,808 13,420 Restricted assets .................................................................................................................. 2,251 6,632 681 Cost method investments .................................................................................................... 12,333 14,432 16,752 Other non-current assets ..................................................................................................... 28,151 24,542 24,205 Non-current assets of discontinued operations ................................................................... — — 1,471
Total assets ................................................................................................................ $ 649,883 $ 669,795 $ 649,897
The accompanying notes are an integral part of these consolidated financial statements.
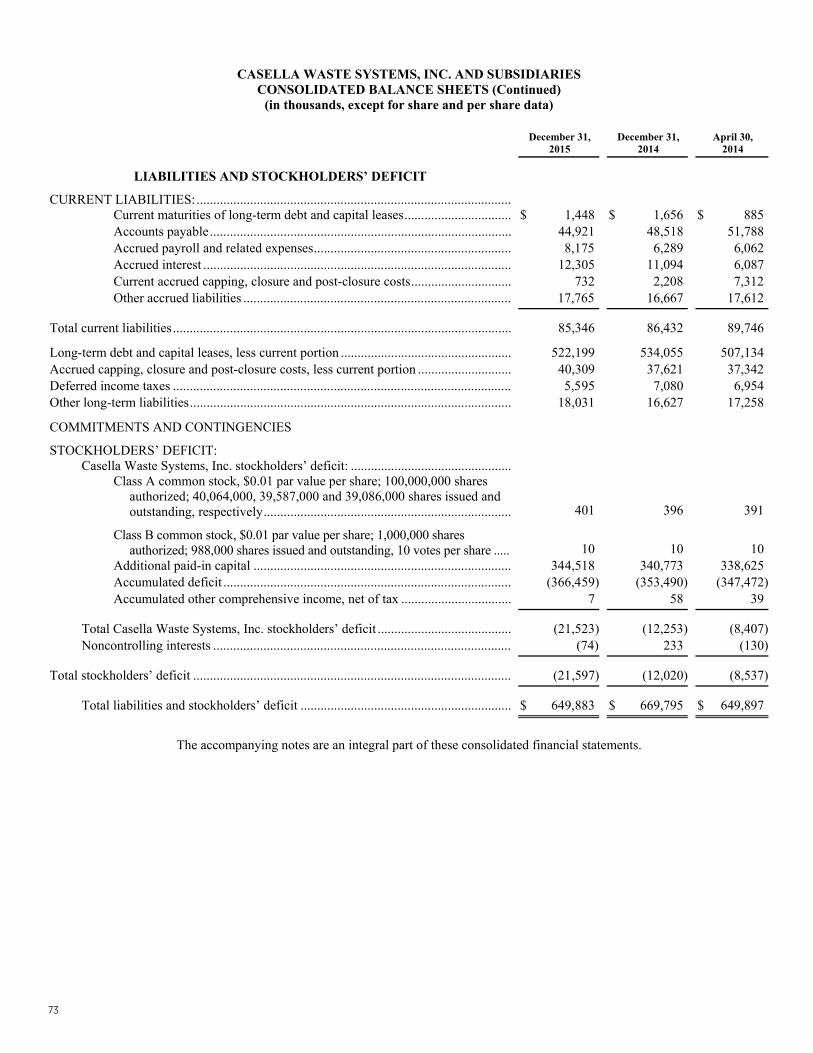
7373
CASELLA WASTE SYSTEMS, INC. AND SUBSIDIARIES CONSOLIDATED BALANCE SHEETS (Continued)
(in thousands, except for share and per share data)
December 31, 2015
December 31,2014
April 30, 2014
LIABILITIES AND STOCKHOLDERS’ DEFICIT
CURRENT LIABILITIES: ..............................................................................................Current maturities of long-term debt and capital leases ................................ $ 1,448 $ 1,656 $ 885 Accounts payable .......................................................................................... 44,921 48,518 51,788Accrued payroll and related expenses ........................................................... 8,175 6,289 6,062 Accrued interest ............................................................................................ 12,305 11,094 6,087 Current accrued capping, closure and post-closure costs .............................. 732 2,208 7,312 Other accrued liabilities ................................................................................ 17,765 16,667 17,612
Total current liabilities ..................................................................................................... 85,346 86,432 89,746
Long-term debt and capital leases, less current portion ................................................... 522,199 534,055 507,134 Accrued capping, closure and post-closure costs, less current portion ............................ 40,309 37,621 37,342 Deferred income taxes ..................................................................................................... 5,595 7,080 6,954 Other long-term liabilities ................................................................................................ 18,031 16,627 17,258
COMMITMENTS AND CONTINGENCIES
STOCKHOLDERS’ DEFICIT: Casella Waste Systems, Inc. stockholders’ deficit: ................................................
Class A common stock, $0.01 par value per share; 100,000,000 shares authorized; 40,064,000, 39,587,000 and 39,086,000 shares issued and outstanding, respectively .......................................................................... 401 396 391
Class B common stock, $0.01 par value per share; 1,000,000 shares authorized; 988,000 shares issued and outstanding, 10 votes per share ...... 10 10 10
Additional paid-in capital ............................................................................. 344,518 340,773 338,625 Accumulated deficit ...................................................................................... (366,459) (353,490) (347,472)Accumulated other comprehensive income, net of tax ................................. 7 58 39
Total Casella Waste Systems, Inc. stockholders’ deficit ........................................ (21,523) (12,253) (8,407)Noncontrolling interests ......................................................................................... (74) 233 (130)
Total stockholders’ deficit ............................................................................................... (21,597) (12,020) (8,537)
Total liabilities and stockholders’ deficit ............................................................... $ 649,883 $ 669,795 $ 649,897
The accompanying notes are an integral part of these consolidated financial statements.

7474
CASELLA WASTE SYSTEMS, INC. AND SUBSIDIARIES CONSOLIDATED STATEMENTS OF OPERATIONS
(in thousands)
Fiscal Year Ended
December 31,
Eight Months Ended
December 31,Fiscal Year Ended
April 30,2015 2014 2014 2013
Revenues .................................................................................................... $ 546,500 $ 368,374 $ 497,633 $ 455,335
Operating expenses: ...................................................................................Cost of operations ............................................................................. 382,615 258,650 354,592 323,014 General and administration............................................................... 72,892 45,732 61,865 58,205 Depreciation and amortization ......................................................... 62,704 41,485 60,339 56,576 Contract settlement charge ............................................................... 1,940 — — — Divestiture transactions .................................................................... (5,517) (553) 7,455 — Environmental remediation charge ................................................... — 950 400 — Development project charge ............................................................. — — 1,394 — Severance and reorganization costs .................................................. — — 586 3,709 Expense from divestiture, acquisition and financing costs ............... — — 144 1,410 Gain on settlement of acquisition related contingent
consideration ................................................................................ — — (1,058) —
514,634 346,264 485,717 442,914
Operating income ....................................................................................... 31,866 22,110 11,916 12,421 Other expense (income): ............................................................................
Interest income ................................................................................. (330) (247) (312) (141)Interest expense ................................................................................ 40,420 25,639 38,175 41,570Loss on debt extinguishment ............................................................ 999 — — 15,584 Loss on derivative instruments ......................................................... 227 225 280 4,512 Impairment of investments ............................................................... 2,099 2,320 — — Loss from equity method investments .............................................. — — 936 4,441 Gain on sale of equity method investment ....................................... — — (593) — Other income .................................................................................... (1,119) (720) (1,059) (1,036)
Other expense, net ...................................................................................... 42,296 27,217 37,427 64,930
Loss from continuing operations before income taxes and discontinued operations (10,430) (5,107) (25,511) (52,509)
Provision (benefit) for income taxes .......................................................... 1,351 703 1,799 (2,526)
Loss from continuing operations before discontinued operations (11,781) (5,810) (27,310) (49,983)
Discontinued operations: Income (loss) from discontinued operations (net of income
tax benefit of $0, $0, $0 and $0, respectively) ................... — — 284 (4,480)Loss on disposal of discontinued operations (net of income
tax provision of $0, $0, $0 and $0, respectively) ............... — — (378) —
Net loss ...................................................................................................... (11,781) (5,810) (27,404) (54,463)
Less: Net income (loss) attributable to noncontrolling interests .............................................................................. 1,188 208 (4,309) (321)
Net loss attributable to common stockholders ........................................... $ (12,969) $ (6,018) $ (23,095) $ (54,142)
The accompanying notes are an integral part of these consolidated financial statements.

7575
CASELLA WASTE SYSTEMS, INC. AND SUBSIDIARIES CONSOLIDATED STATEMENTS OF OPERATIONS (Continued)
(in thousands, except for per share data)
Fiscal Year Ended
December 31,
Eight Months Ended
December 31,Fiscal Year Ended
April 30,2015 2014 2014 2013
Net loss attributable to common stockholders: ...........................................
Continuing operations, net of tax ...................................................... $ (12,969) $ (6,018) $ (23,001) $ (49,662)Discontinued operations, net of tax ................................................... — — (94) (4,480)
Net loss .................................................................................... $ (12,969) $ (6,018) $ (23,095) $ (54,142)
Weighted average common shares outstanding: .........................................Basic and diluted ...................................................................... 40,642 40,262 39,820 34,015
Basic and diluted earnings per share: ..........................................................
Continuing operations, net of tax ...................................................... $ (0.32) $ (0.15) $ (0.58) $ (1.46)Discontinued operations, net of tax ................................................... — — — (0.13)
Net loss per common share ...................................................... $ (0.32) $ (0.15) $ (0.58) $ (1.59)
The accompanying notes are an integral part of these consolidated financial statements.

7676
CASELLA WASTE SYSTEMS, INC. AND SUBSIDIARIES CONSOLIDATED STATEMENTS OF
COMPREHENSIVE LOSS (in thousands)
Fiscal YearEnded
December 31,
Eight Months Ended
December 31,Fiscal Year Ended
April 30,
2015 2014 2014 2013
Net loss ................................................................................................................ $ (11,781) $ (5,810) $ (27,404) $ (54,463)Other comprehensive (loss) income, net of taxes: ...............................................
Unrealized loss resulting from changes in fair value of derivative instruments ............................................................................................ — — (36) (2,910)
Realized loss on derivative instruments reclassified into earnings ............. — — 655 4,247 Unrealized (loss) gain resulting from changes in fair value of marketable
securities ................................................................................................ (51) 19 12 23
Other comprehensive (loss) income ..................................................................... (51) 19 631 1,360
Comprehensive loss ............................................................................................. (11,832) (5,791) (26,773) (53,103)
Less: Comprehensive income (loss) attributable to noncontrolling interests .................................................................................................. 1,188 208 (4,309) (321)
Comprehensive loss attributable to common stockholders .................................. $ (13,020) $ (5,999) $ (22,464) $ (52,782)
The accompanying notes are an integral part of these consolidated financial statements.

77
77
CASELLA WASTE SYSTEMS, INC. AND SUBSIDIARIESCONSOLIDATED STATEMENT OF
STOCKHOLDERS’ EQUITY (DEFICIT) Casella Waste Systems, Inc. Stockholders’ Equity (Deficit)
Class A Common Stock
Class B Common Stock Additional
Paid-In Capital
Accumulated Deficit
Accumulated Other
Comprehensive Income (Loss)
NoncontrollingInterestsTotal Shares Amount Shares Amount
Balance, April 30, 2012 ..................................... $ 18,231 25,991 $ 260 988 $ 10 $ 288,348 $ (270,235) $ (1,952) $ 1,800 Net loss .............................................................. (54,463) — — — — — (54,142) — (321) Other comprehensive income ............................ 1,360 — — — — — — 1,360 — Issuances of Class A common stock ................. 2,840 1,171 12 — — 2,828 — — — Sale of Class A common stock, net ................... 42,184 11,500 115 — — 42,069 — — — Stock-based compensation and related
severance expense ........................................ 2,516 — — — — 2,516 — — — Contributions from noncontrolling interest
holders .......................................................... 2,687 — — — — — — — 2,687 Other.................................................................. 96 — — — — 96 — — — Balance, April 30, 2013 ..................................... $ 15,451 38,662 $ 387 988 $ 10 $ 335,857 $ (324,377) $ (592) $ 4,166 Net loss .............................................................. (27,404) — — — — — (23,095) — (4,309) Other comprehensive income ............................ 631 — — — — — — 631 — Issuances of Class A common stock ................. 368 424 4 — — 364 — — — Stock-based compensation ................................ 2,404 — — — — 2,404 — — — Contributions from noncontrolling interest
holders .......................................................... 13 — — — — — — — 13 Balance, April 30, 2014 ..................................... $ (8,537) 39,086 $ 391 988 $ 10 $ 338,625 $ (347,472) $ 39 $ (130) Net loss .............................................................. (5,810) — — — — — (6,018) — 208Other comprehensive income ............................ 19 — — — — — — 19 — Issuances of Class A common stock ................. 429 501 5 — — 424 — — — Stock-based compensation ................................ 1,639 — — — — 1,639 — — — Contributions from noncontrolling interest
holders .......................................................... 155 — — — — — — — 155 Other.................................................................. 85 — — — — 85 — — — Balance, December 31, 2014 ............................. $ (12,020) 39,587 $ 396 988 $ 10 $ 340,773 $ (353,490) $ 58 $ 233Net loss .............................................................. (11,781) — — — — — (12,969) — 1,188 Other comprehensive loss ................................. (51) — — — — — — (51) — Issuances of Class A common stock ................. 486 477 5 — — 481 — — — Stock-based compensation ................................ 3,079 — — — — 3,079 — — — Distributions to noncontrolling interest
holders .......................................................... (1,495) — — — — — — — (1,495) Other.................................................................. 185 — — — — 185 — — — Balance, December 31, 2015 ............................. $ (21,597) 40,064 $ 401 988 $ 10 $ 344,518 $ (366,459) $ 7 $ (74)
The accompanying notes are an integral part of these consolidated financial statements.

7878
CASELLA WASTE SYSTEMS, INC. AND SUBSIDIARIES CONSOLIDATED STATEMENTS OF CASH FLOWS
(in thousands) Fiscal Year
Ended December 31,
2015
Eight Months Ended
December 31, 2014
Fiscal Year EndedApril 30,
2014 2013Cash Flows from Operating Activities: ................................................................................Net loss ................................................................................................................................ $ (11,781) $ (5,810) $ (27,404) $ (54,463)Adjustments to reconcile net loss to net cash provided by operating activities: ...................
(Income) loss from discontinued operations, net of tax ............................................ — — (284) 4,480 Loss on disposal of discontinued operations, net of tax ............................................ — — 378 — Gain on sale of property and equipment ................................................................... (131) (197) (840) (407)Depletion of landfill operating lease obligations ...................................................... 9,428 7,799 9,948 9,372 Interest accretion on landfill and environmental remediation liabilities ................... 3,449 2,366 3,985 3,675 Stock-based compensation and related severance expense ....................................... 3,079 1,639 2,404 2,516 Depreciation and amortization .................................................................................. 62,704 41,485 60,339 56,576 Divestiture transactions ............................................................................................ (5,517) (553) 7,455 — Development project charge ..................................................................................... — — 1,394 — Gain on settlement of acquisition related contingent consideration .......................... — — (1,058) — Amortization of discount on long-term debt ............................................................. 364 173 243 626 Loss on debt extinguishment .................................................................................... 999 — — 15,584 Loss on derivative instruments ................................................................................. 227 225 280 4,512 Impairment of investments ....................................................................................... 2,099 2,320 — — Loss from equity method investments ...................................................................... — — 936 4,441Gain on sale of equity method investment ................................................................ — — (593) — Excess tax benefit on the vesting of share based awards .......................................... (185) (84) — (96)Deferred income taxes .............................................................................................. 795 605 1,579 (3,543)Changes in assets and liabilities, net of effects of acquisitions and divestitures: ......
Accounts receivable ....................................................................................... (4,419) (3,147) (3,418) 139 Accounts payable ........................................................................................... (3,597) (3,270) (186) 4,152 Prepaid expenses, inventories and other assets .............................................. 8,853 (3,550) (463) 4,056 Accrued expenses and other liabilities ........................................................... 4,140 (1,715) (5,053) (7,714)
Net cash provided by operating activities ............................................................................ 70,507 38,286 49,642 43,906 Cash Flows from Investing Activities: .................................................................................
Acquisitions, net of cash acquired ............................................................................ — (360) (8,305) (25,225)Acquisition related additions to property, plant and equipment ................................ — (45) (2,633) (1,746)Additions to property, plant and equipment .............................................................. (49,995) (55,016) (43,326) (53,281)Payments on landfill operating lease contracts ......................................................... (5,385) (4,739) (6,505) (6,261)Proceeds from divestiture transactions...................................................................... 5,335 — — —Payments for capital related to divestiture ................................................................ — — — (618)Proceeds from sale of property and equipment ......................................................... 715 463 1,524 883 Proceeds from sale of equity method investment ...................................................... — — 3,442 — Proceeds from property insurance settlement ........................................................... 546 — — — Payments related to investments ............................................................................... — — (2,107) (3,207)
Net cash used in investing activities .................................................................................... (48,784) (59,697) (57,910) (89,455)Cash Flows from Financing Activities: ................................................................................
Proceeds from long-term borrowings ....................................................................... 355,229 136,800 161,650 376,346 Principal payments on long-term debt ...................................................................... (370,996) (109,281) (152,380) (360,858)Change in restricted cash .......................................................................................... 4,471 (5,819) — — Payments of financing costs ..................................................................................... (9,025) (2,605) (405) (4,609)Payments of debt extinguishment costs .................................................................... (146) — — (10,743)Proceeds from the exercise of share based awards .................................................... 161 143 143 — Excess tax benefit on the vesting of share based awards .......................................... 185 84 — 96 Net proceeds from the sale of Class A common stock .............................................. — — — 42,184 (Distribution to) contribution from noncontrolling interest holder ........................... (1,495) — — 2,531
Net cash (used in) provided by financing activities ............................................................. (21,616) 19,322 9,008 44,947 Discontinued Operations:.....................................................................................................
Net cash used in operating activities ......................................................................... — — (201) (1,037)Net cash provided by (used in) investing activities ................................................... — 1,830 170 (1,140)
Net cash provided by (used in) discontinued operations ...................................................... — 1,830 (31) (2,177)Net increase (decrease) in cash and cash equivalents ........................................................... 107 (259) 709 (2,779)Cash and cash equivalents, beginning of period .................................................................. 2,205 2,464 1,755 4,534 Cash and cash equivalents, end of period ............................................................................ $ 2,312 $ 2,205 $ 2,464 $ 1,755
The accompanying notes are an integral part of these consolidated financial statements.

7979
CASELLA WASTE SYSTEMS, INC. AND SUBSIDIARIES CONSOLIDATED STATEMENTS OF CASH FLOWS (Continued)
(in thousands)
Fiscal YearEnded
December 31,
Eight Months Ended
December 31,Fiscal Year Ended
April 30,2015 2014 2014 2013
Supplemental Disclosures of Cash Flow Information: ............................................ Cash paid during the period for: .....................................................................
Interest .................................................................................................. $ 35,232 $ 18,439 $ 35,162 $ 41,348 Income taxes, net of refunds ................................................................. $ 282 $ 182 $ 532 $ (253)
Supplemental Disclosures of Non-Cash Investing and Financing Activities: .......... Receivable due from noncontrolling interest holder ............................. $ — $ 152 $ — $ — Property, plant and equipment acquired through long-term
obligations ........................................................................................ $ 3,264 $ — $ 2,301 $ —
The accompanying notes are an integral part of these consolidated financial statements.

8080
CASELLA WASTE SYSTEMS, INC. AND SUBSIDIARIES NOTES TO CONSOLIDATED FINANCIAL STATEMENTS
(in thousands, except for per share data)
1. BASIS OF PRESENTATION
Casella Waste Systems, Inc. (“Parent”), and its consolidated subsidiaries (collectively, “we”, “us” or “our”), is a regional, vertically integrated solid waste services company that provides collection, transfer, disposal, landfill, landfill gas-to-energy, recycling and organics services in the northeastern United States. We market recyclable metals, aluminum, plastics, paper and corrugated cardboard, which have been processed at our recycling facilities, as well as recyclables purchased from third-parties. We manage our solid waste operations on a geographic basis through two regional operating segments, the Eastern and Western regions, each of which provides a full range of solid waste services, and our larger-scale recycling and commodity brokerage operations through our Recycling segment. Organics services, ancillary operations, major account and industrial services, discontinued operations and earnings from equitymethod investees, as applicable, are included in our Other segment.
The accompanying consolidated financial statements, which include the accounts of the Parent, our wholly-owned subsidiaries andany partially owned entities over which we have a controlling financial interest, have been prepared in accordance with generallyaccepted accounting principles in the United States (“GAAP”) pursuant to the rules and regulations of the Securities and ExchangeCommission (“SEC”). All significant intercompany accounts and transactions are eliminated in consolidation. Investments in entitiesin which we do not have a controlling financial interest are accounted for under either the equity method or the cost method ofaccounting, as appropriate.
For comparative purposes, certain prior period amounts in the consolidated statements of operations have been reclassified to confirm to the current fiscal year presentation. The reclassifications had no effect on the previously reported results of operations or retained earnings.
2. ACCOUNTING CHANGES
Adoption of New Accounting Pronouncements
Income Taxes
In November 2015, the Financial Accounting Standards Board (“FASB”) issued an accounting standards update for the accounting fordeferred income taxes. The update provides that deferred tax liabilities and assets be classified as noncurrent amounts in a classified statement of financial position. This guidance is effective prospectively or retrospectively for annual reporting periods, and interim reporting periods within those reporting periods, beginning after December 15, 2016, with early adoption permitted. We adopted this guidance effective December 31, 2015 in order to simplify the presentation of deferred income taxes. This guidance impacts the balance sheet presentation of our deferred tax liabilities and assets. Prior periods were not retrospectively adjusted.
Discontinued Operations
In April 2014, the FASB issued an accounting standards update for the requirements of reporting discontinued operations. The update provides that an entity, a group of components of an entity, or a business is required to be reported in discontinued operations once it meets the held for sale criteria, is disposed of by sale, or is disposed of other than by sale only if the disposal represents a strategic shift that has, or will have, a major effect on an entity’s operations and financial results. The update also requires that additional disclosures about discontinued operations be made. This guidance is effective prospectively for annual reporting periods, and interim reporting periods within those reporting periods, beginning after December 15, 2014. We adopted this guidance effective January 1, 2015 with no impact on our consolidated financial position or results of operations.
New Accounting Pronouncements Pending Adoption
Business Combinations
In September 2015, the FASB issued an accounting standards update for the accounting of measurement-period adjustments in business combinations. The update provides that an acquirer recognize adjustments to provisional amounts that are identified during the measurement period in the reporting period in which the adjustment amounts are determined as if the accounting had been completed at the acquisition date. This includes the acquirer presenting separately on the face of the income statement or disclosing in the notes thereto the portion of the amount recorded in current-period earnings by line item that would have been recorded in previous reporting periods if the adjustment to the provisional amounts had been recognized as of the acquisition date. This guidance iseffective for annual reporting periods, and interim periods within those reporting periods, beginning after December 15, 2015, withearly adoption permitted. We expect that this guidance will have no impact on our consolidated financial position or results ofoperations upon adoption.
8181
Debt Issuance Costs
In April 2015, the FASB issued an accounting standards update for the presentation of debt issuance costs. The update provides that debt issuance costs related to a recognized debt liability be presented in the balance sheet as a direct deduction from the carrying amount of the debt liability. This guidance is effective on a retrospective basis for annual reporting periods, and interim periods within those reporting periods, beginning after December 15, 2015, with early adoption permitted. This guidance will impact the balancesheet presentation of our debt issuance costs and related debt liabilities upon adoption.
Consolidation
In February 2015, the FASB issued an accounting standards update for the requirements of consolidation. The update provides changes to the analysis that an entity must perform to determine whether it should consolidate certain types of legal entities because in certain situations deconsolidated financial statements are necessary to better analyze the reporting entity’s economic and operational results. This guidance is effective for annual reporting periods, and interim periods within those reporting periods, beginning after December 15, 2015, with early adoption permitted provided that the guidance is applied from the beginning of the fiscal year ofadoption. We are currently assessing the potential impact this guidance may have on our consolidated financial statements as a result of adopting this standard.
Extraordinary and Unusual Items
In January 2015, the FASB issued an accounting standards update that eliminates the GAAP concept of extraordinary items. The update provides for the elimination of the requirements to consider whether an underlying event or transaction is extraordinary, but retains the presentation and disclosure guidance for items that are unusual in nature or occur infrequently and expands upon it to include items that are both unusual in nature and infrequently occurring. This guidance is effective prospectively or retrospectively for annual reporting periods, and interim periods within those reporting periods, beginning after December 15, 2015, with early adoption permitted provided that the guidance is applied from the beginning of the fiscal year of adoption. We expect that this guidance will have no impact on our consolidated financial position or results of operations upon adoption.
Revenue Recognition
In May 2014, the FASB issued an accounting standards update for the recognition of revenue, which supersedes existing revenue recognition requirements and most industry-specific guidance. The update provides that an entity should recognize revenue to depict the transfer of promised goods or services to customers in an amount that reflects the consideration to which the entity expects to be entitled in exchange for those goods or services. This guidance is effective for annual reporting periods, and interim reporting periods within those reporting periods, beginning after December 15, 2017 under either full or modified retrospective adoption. Early application is permitted only as of annual reporting periods, and interim reporting periods within those reporting periods, beginning after December 15, 2016. We are currently assessing the potential impact this guidance may have on our consolidated financial statements as a result of adopting this standard.
3. SUMMARY OF SIGNIFICANT ACCOUNTING POLICIES
Management’s Estimates and Assumptions
Preparation of our consolidated financial statements in accordance with GAAP requires management to make certain estimates and assumptions. These estimates and assumptions affect the accounting for and recognition and disclosure of assets, liabilities, equity, revenues and expenses. We must make these estimates and assumptions because certain information that we use is dependent on future events, cannot be calculated with a high degree of precision given the available data or simply cannot be readily calculated. In some cases, these estimates are difficult to determine, and we must exercise significant judgment. In preparing our consolidatedfinancial statements, the estimates and assumptions that we consider to be significant and present the greatest amount of uncertainty relate to our accounting for landfills, environmental remediation liabilities, asset impairments, accounts receivable valuationallowance, self-insurance reserves, deferred taxes and uncertain tax positions, estimates of the fair values of assets acquired and liabilities assumed in any acquisition, contingent liabilities and stock-based compensation. In the opinion of management, theseconsolidated financial statements include all adjustments, which include normal recurring and nonrecurring adjustments, necessary for a fair presentation of the financial position, results of operations, and cash flows for the periods presented. Actual results may differ materially from the estimates and assumptions that we use in the preparation of our consolidated financial statements.

82
82
Change in Fiscal Year
In June 2014, we elected to change our fiscal year-end from April 30th to December 31st. This change in fiscal year became effective for our fiscal year beginning January 1, 2015 and ended December 31, 2015. As a result of this change, we filed a Transition Report on Form 10-KT for the eight-month transition period ended December 31, 2014. The references in these notes to the consolidated financial statements to the terms below reflect the respective reporting periods presented in the consolidated financial statements:
Term Financial Reporting Period
fiscal year 2015 January 1, 2015 through December 31, 2015 transition period 2014 May 1, 2014 through December 31, 2014 fiscal year 2014 May 1, 2013 through April 30, 2014 fiscal year 2013 May 1, 2012 through April 30, 2013
Cash and Cash Equivalents
We consider all highly liquid investments purchased with original maturities of three months or less to be cash equivalents.
Concentrations of Credit Risk
Financial instruments that potentially subject us to concentrations of credit risk consist of cash and cash equivalents, restricted cash, accounts receivable-trade and derivative instruments. We maintain cash and cash equivalents and restricted cash with banks that at times exceed applicable insurance limits. We reduce our exposure to credit risk by maintaining such deposits with high quality financial institutions. Our concentration of credit risk with respect to accounts receivable-trade is limited because our customer base is comprised of a large number of geographically diverse customers, thus reducing the credit risk associated with any one customergroup. As of December 31, 2015 no single customer or customer group represented greater than 5% of total accounts receivable-trade. We manage credit risk through credit evaluations, credit limits, monitoring procedures and, at times, credit insurance, but generally do not require collateral to support accounts receivable -trade. We reduce our exposure to credit risk associated with derivative instruments by entering into agreements with high quality financial institutions and by evaluating and regularly monitoring theircreditworthiness.
Accounts Receivable – Trade, Net of Allowance for Doubtful Accounts
Accounts receivable – trade represent receivables from customers for collection, transfer, recycling, disposal and other services. Our accounts receivable – trade are recorded when billed or when related revenue is earned, if earlier, and represent claims against third-parties that will be settled in cash. The carrying value of our accounts receivable – trade, net of allowance for doubtful accounts, represents its estimated net realizable value. Estimates are used in determining our allowance for doubtful accounts based on our historical collection experience, current trends, credit policy and a review of our accounts receivable – trade by aging category. Our reserve is evaluated and revised on a monthly basis. Past-due accounts receivable-trade are written off when deemed to be uncollectible. As of December 31, 2015, $44,707 of our accounts receivable – trade served as eligible collateral under our senior secured asset-based revolving credit and letter of credit facility (“ABL Facility”).
Inventory
Inventory includes secondary fibers, recyclables ready for sale, and parts and supplies. Inventory is stated at the lower of cost (first-in, first-out) or market. As of December 31, 2015, $219 of our recyclables ready for sale served as eligible collateral under our ABLFacility.

83
83
Property, Plant and Equipment
Property, plant and equipment is recorded at cost, less accumulated depreciation and amortization. We provide for depreciation and amortization using the straight-line method by charges to operations in amounts that allocate the cost of the assets over their estimated useful lives as follows:
Asset ClassificationEstimatedUseful Life
Buildings and improvements ....................................... 10-30 years Machinery and equipment ........................................... 5-10 years Rolling stock ............................................................... 5-10 years Containers ................................................................... 5-12 years Furniture and Fixtures ................................................. 3-8 years
The cost of maintenance and repairs is charged to operations as incurred.
Landfill development costs are included in property, plant and equipment. Landfill development costs include costs to develop each of our landfill sites, including such costs related to landfill liner material and installation, excavation for airspace, landfill leachate collection systems, landfill gas collection systems, environmental monitoring equipment for groundwater and landfill gas, directlyrelated engineering, capitalized interest, on-site road construction, and other capital infrastructure. Additionally, landfill development costs include all land purchases within the landfill footprint and the purchase of any required landfill buffer property. Under life-cycle accounting, these costs are capitalized and charged to expense based on tonnage placed into each site. See the “Landfill Accounting”accounting policy below for disclosure over the amortization of landfill development costs and Note 6, Property, Plant and Equipmentfor disclosure over property, plant and equipment.
Landfill Accounting
Life Cycle Accounting
Under life-cycle accounting, all costs related to acquisition and construction of landfill sites are capitalized and charged to expense based on tonnage placed into each site. Landfill permitting, acquisition and preparation costs are amortized on the units-of-consumption method as landfill airspace is consumed. In determining the amortization rate for our landfills, preparation costs include the total estimated costs to complete construction of the landfills’ permitted and expansion capacity.
Landfill Development Costs
We estimate the total cost to develop each of our landfill sites to its remaining permitted and expansion capacity (see landfilldevelopment costs discussed within the “Property, Plant and Equipment” accounting policy above). The projection of these landfill costs is dependent, in part, on future events. The remaining amortizable basis of each landfill includes costs to develop a site to its remaining permitted and expansion capacity and includes amounts previously expended and capitalized, net of accumulated airspaceamortization, and projections of future purchase and development costs including capitalized interest. The interest capitalization rate is based on our weighted average interest rate incurred on borrowings outstanding during the period. Interest capitalized during fiscalyear 2015, transition period 2014, fiscal year 2014 and fiscal year 2013 was $62, $333, $256 and $368, respectively.
Landfill Airspace
We apply the following guidelines in determining a landfill’s remaining permitted and expansion airspace:
Remaining Permitted Airspace. Our engineers, in consultation with third-party engineering consultants and surveyors, are responsible for determining remaining permitted airspace at our landfills. The remaining permitted airspace is determined by an annual survey,which is then used to compare the existing landfill topography to the expected final landfill topography.
Expansion Airspace. We currently include unpermitted expansion airspace in our estimate of remaining permitted and expansion airspace in certain circumstances. To be considered expansion airspace all of the following criteria must be met:
• we control the land on which the expansion is sought;
• all technical siting criteria have been met or a variance has been obtained or is reasonably expected to be obtained;
• we have not identified any legal or political impediments which we believe will not be resolved in our favor;

84
84
• we are actively working on obtaining any necessary permits and we expect that all required permits will be received; and
• senior management has approved the project.
For unpermitted airspace to be included in our estimate of remaining permitted and expansion airspace, the expansion effort must meet all of the criteria listed above. These criteria are evaluated annually by our engineers, accountants, lawyers, managers and others to identify potential obstacles to obtaining the permits. Once the remaining permitted and expansion airspace is determined in cubicyards, an airspace utilization factor (“AUF”) is established to calculate the remaining permitted and expansion capacity in tons. The AUF is established using the measured density obtained from previous annual surveys. When we include the expansion airspace in our calculation of remaining permitted and expansion airspace, we include the projected costs for development, as well as the projectedasset retirement costs related to final capping, closure and post-closure of the expansion airspace in the amortization basis of the landfill.
After determining the costs and the remaining permitted and expansion capacity at each of our landfills, we determine the per ton rates that will be expensed as waste is received and deposited at the landfill by dividing the costs by the corresponding number of tons. We calculate per ton amortization rates for assets associated with each final capping event, for assets related to closure and post-closure activities and for all other costs capitalized or to be capitalized in the future for each landfill. These rates per ton are updated annually, or more frequently, as significant facts change.
It is possible that actual results, including the amount of costs incurred, the timing of final capping, closure and post-closure activities, our airspace utilization or the success of our expansion efforts could ultimately turn out to be significantly different from our estimates and assumptions. To the extent that such estimates or related assumptions prove to be significantly different than actual results, lower profitability may be experienced due to higher amortization rates, higher final capping, closure or post-closure rates, or higher expenses. Higher profitability may result if the opposite occurs. Most significantly, if it is determined that the expansion capacity should no longer be considered in calculating the recoverability of the landfill asset, we may be required to recognize an assetimpairment. If it is determined that the likelihood of receiving an expansion permit has become remote, the capitalized costs related to the expansion effort are expensed immediately.
Final Capping, Closure and Post-Closure Costs
The following is a description of our landfill asset retirement activities and related accounting:
Final Capping Costs. Final capping activities include the installation of liners, drainage, compacted soil layers and topsoil over areas of a landfill where total airspace has been consumed and waste is no longer being received. Final capping activities occur throughout the life of the landfill. Our engineering personnel estimate the cost for each final capping event based on the acreage to be capped, along with the final capping materials and activities required. The estimates also consider when these costs would actually be paid and factor in inflation and discount rates. The engineers then quantify the landfill capacity associated with each final capping event and the costs for each event are amortized over that capacity as waste is received at the landfill.
Closure and Post-Closure Costs. Closure and post-closure costs represent future estimated costs related to monitoring and maintenance of a solid waste landfill after a landfill facility ceases to accept waste and closes. We estimate, based on input from our engineers, lawyers, accounting personnel and consultants, our future cost requirements for closure and post-closure monitoring and maintenance based on our interpretation of the technical standards of the Subtitle D regulations and the air emissions standards under the Clean Air Act of 1970, as amended, as they are being applied on a state-by-state basis. Closure and post-closure accruals for the cost of monitoring and maintenance include site inspection, groundwater monitoring, leachate management, methane gas control andrecovery, and operation and maintenance costs to be incurred for a period which is generally for a term of 30 years after final closure of a landfill. In determining estimated future closure and post-closure costs, we consider costs associated with permitted and permittable airspace.
Our estimated future closure and post-closure costs, based on our interpretation of current requirements and proposed regulatorychanges, are intended to approximate fair value. Absent quoted market prices, our cost estimates are based on historical experience, professional engineering judgment and quoted or actual prices paid for similar work. Our estimate of costs to discharge final capping, closure and post-closure asset retirement obligations for landfills are developed in today’s dollars. These costs are then inflated to the period of performance using an estimate of inflation, which is updated annually (2.0% as of December 31, 2015). Final capping, closure and post-closure liabilities are discounted using the credit adjusted risk-free rate in effect at the time the obligation is incurred. The weighted average rate applicable to our asset retirement obligations as of December 31, 2015 is between approximately 9.1% and 9.5%, the range of the credit adjusted risk free rates effective since the adoption of guidance associated with asset retirementobligations in the fiscal year ended April 30, 2004. Accretion expense is necessary to increase the accrued final capping, closure and post-closure liabilities to the future anticipated obligation. To accomplish this, we accrete our final capping, closure and post-closure accrual balances using the same credit-adjusted risk-free rate that was used to calculate the recorded liability. Accretion expense on

85
85
recorded landfill liabilities is recorded to cost of operations from the time the liability is recognized until the costs are paid. Accretion expense on recorded landfill liabilities amounted to $3,370, $2,275, $3,967 and $3,538 in fiscal year 2015, transition period 2014, fiscal year 2014 and fiscal year 2013, respectively.
We provide for the accrual and amortization of estimated future obligations for closure and post-closure based on tonnage placed into each site. With regards to final capping, the liability is recognized and the costs are amortized based on the airspace related to the specific final capping event. See Note 8, Final Capping, Closure and Post-Closure Costs for disclosure over final capping, closure and post-closure costs asset retirement obligations.
We operate in states which require a certain portion of landfill final capping, closure and post-closure obligations to be secured by financial assurance, which may take the form of surety bonds, letters of credit and restricted cash. Surety bonds securing closure and post-closure obligations at December 31, 2015, December 31, 2014 and April 30, 2014 totaled $156,163, $144,633 and 133,847, respectively. Letters of credit securing closure and post-closure obligations as of December 31, 2015, December 31, 2014 and April 30, 2014 totaled $1,000, $1,104 and $1,104, respectively. See Note 5, Restricted Cash / Restricted Assets for disclosure over restricted cash securing closure and post-closure obligations.
Landfill Operating Lease Contracts
We entered into three landfill operation and management agreements in the fiscal year ended April 30, 2004 and one landfill operation and management agreement in the fiscal year ended April 30, 2006. These agreements are long-term landfill operating contracts with government bodies whereby we receive tipping revenue, pay normal operating expenses and assume future final capping, closure andpost-closure liabilities. The government body retains ownership of the landfill. There is no bargain purchase option and title to the property does not pass to us at the end of the lease term. We allocate the consideration paid to the landfill airspace rights and underlying land lease based on the relative fair values.
In addition to up-front or one-time payments, the landfill operating agreements require us to make future minimum rental payments,including success/expansion fees, other direct costs and final capping, closure and post-closure costs. The value of all future minimum rental payments is amortized and charged to cost of operations over the life of the contract. We amortize the consideration allocated to airspace rights as airspace is utilized on a units-of-consumption basis and such amortization is charged to cost of operations as airspace is consumed (e.g., as tons are placed into the landfill). The underlying value of any land lease is amortized to cost ofoperations on a straight-line basis over the estimated life of the operating agreement. See Note 6, Property, Plant and Equipment for disclosure over depletion of landfill operating lease contracts.
Leases
We lease property and equipment in the ordinary course of our business. Our most significant lease obligations are for property and equipment specific to our industry. Our leases have varying terms. Some may include renewal or purchase options, escalation clauses, restrictions, lease concessions, capital project funding, penalties or other obligations that we consider in determining minimum rental payments. Leases are classified as either operating leases or capital leases, as appropriate.
Operating Leases. Many of our leases are operating leases. This classification generally can be attributed to either (i) relatively low fixed minimum rental payments or (2) minimum lease terms that are much shorter than the assets’ economic useful lives. We expectthat, in the normal course of business, our operating leases will be replaced by other leases, or replaced with fixed asset expenditures. See Note 10, Commitments and Contingencies for disclosure over future minimum lease payments related to our operating leases.
Capital Leases. We capitalize assets acquired under capital leases at the inception of each lease and amortize them to depreciation expense over the lesser of the useful life of the asset or the lease term, as appropriate. The present value of the related lease payments is recorded as a debt obligation. See Note 9, Long-Term Debt and Capital Leases for disclosure over our future maturities of debt, which includes capital lease payments.
Goodwill and Intangible Assets
Goodwill. Goodwill is the excess of our purchase cost over the fair value of the net assets of acquired businesses. We do not amortize goodwill, but as discussed in the “Asset Impairments” accounting policy below, we assess our goodwill for impairment at least annually. See Note 7, Goodwill and Intangible Assets for disclosure over goodwill.

86
86
Intangible Assets. Intangible assets consist primarily of covenants not-to-compete and customer lists. Intangible assets are recorded at fair value and are amortized based on the economic benefit provided or using the straight-line method over their estimated useful lives. Covenants not-to-compete and customer lists are typically amortized over a term of no more than 10 years. See Note 7, Goodwill and Intangible Assets for disclosure over intangible assets.
Investments in Unconsolidated Entities
Investments in unconsolidated entities over which we have significant influence over the investees’ operating and financing activities are accounted for under the equity method of accounting. Investments in affiliates in which we do not have the ability to exertsignificant influence over the investees’ operating and financing activities are accounted for under the cost method of accounting. As of December 31, 2015, December 31, 2014 and April 30, 2014, we had no investments accounted for under the equity method of accounting.
We monitor and assess the carrying value of our investments throughout the year for potential impairment and write them down totheir fair value when other-than-temporary declines exist. Fair value is generally based on (i) other third-party investors’ recent transactions in the securities; (ii) other information available regarding the current market for similar assets and/or (iii) a market or income approach, as deemed appropriate.
When we assess the carrying value of our investments for potential impairment, determining the fair value of our investments is reliant upon the availability of market information and/or other information provided by third-parties to be able to develop an estimate of fair value. Additionally, considerable judgment is required in interpreting market data to develop the estimates of fair value. Accordingly, our estimates are not necessarily indicative of the amounts that we, or other holders of these investments, could realize in a current market exchange. The use of different assumptions and/or estimation methodologies could have a significant effect on the estimated fair values. The current estimates of fair value could differ significantly from the amounts presented. See “Asset Impairments” accounting policy below and Note 12, Fair Value of Financial Instruments for further disclosure over our investments.
Equity Method Investments
GreenFiber. In the fiscal year ended April 30, 2001, we entered into a joint venture agreement with Louisiana-Pacific Corporation (“LP”) to combine our respective cellulose insulation businesses into a single operating entity, US GreenFiber LLC (“GreenFiber”). In fiscal year 2014, we and LP executed a purchase and sale agreement with a limited liability company formed by Tenex Capital Partners, L.P., pursuant to which we and LP agreed to sell our membership interests in GreenFiber for total cash consideration of $18,000 plus an expected working capital true up less any indebtedness and other unpaid transaction costs of GreenFiber as of the closing date. The transaction was completed in fiscal year 2014 for $19,194 in gross cash proceeds, including a $1,194 working capital adjustment. After netting indebtedness of GreenFiber and transaction costs, our portion of the net cash proceeds based on our 50%membership interest amounted to $3,442. After considering the $593 impact of our unrealized losses relating to derivative instruments in accumulated other comprehensive loss on our investment in GreenFiber, we recorded a gain on sale of equity method investment of $593 in fiscal year 2014. We had previously accounted for our 50% membership interest in GreenFiber using the equity method of accounting.
Tompkins. In the fiscal year ended April 30, 2012, we finalized the terms of a joint venture agreement with FCR, LLC (“FCR”) to form Tompkins County Recycling LLC (“Tompkins”), a joint venture that operates a material recovery facility (“MRF”) located in Tompkins County, New York and processes and sells commodities delivered to the Tompkins MRF. In fiscal year 2014, we purchased the remaining 50% membership interest of Tompkins for total cash consideration of $425. The acquisition-date fair value of our investment in Tompkins, which was determined using the cost approach based on an assessment of the price to purchase the acquiredassets of Tompkins, prior to the acquisition date was $300. We recognized a $106 gain through loss from equity method investments due to the remeasurement in fiscal year 2014. As a result of the purchase, we no longer account for our investment in Tompkins using the equity method of accounting and began including the results of Tompkins in our consolidated financial statements.
Fair Value of Financial Instruments
Our financial instruments include cash and cash equivalents, accounts receivable-trade, restricted cash and investments held in trust on deposit with various banks as collateral for our obligations relative to our landfill final capping, closure and post-closure costs and restricted cash reserved to finance certain capital projects, interest rate derivatives, trade payables and long-term debt. Accounting standards include disclosure requirements around fair values used for certain financial instruments and establish a fair value hierarchy. The three-tier hierarchy prioritizes valuation inputs into three levels based on the extent to which inputs used in measuring fair value are observable in the market. Each fair value measurement is reported in one of three levels: Level 1, defined as quoted market prices in active markets for identical assets or liabilities; Level 2, defined as inputs other than Level 1 that are observable, either directly or

87 87
indirectly, such as quoted prices for similar assets or liabilities; and Level 3, defined as unobservable inputs that are not corroborated by market data. See Note 9, Long-Term Debt and Capital Leases and Note 12, Fair Value of Financial Instruments for fair value disclosure over long-term debt and financial instruments, respectively. See the “Derivatives and Hedging” accounting policy below for the fair value disclosure over interest rate derivatives.
Business Combinations
We acquire businesses in the waste industry, including non-hazardous waste collection, transfer station, recycling and disposaloperations, as part of our growth strategy. Businesses are included in the consolidated financial statements from the date of acquisition.
We recognize, separately from goodwill, the identifiable assets acquired and liabilities assumed at their estimated acquisition-date fair values. We measure and recognize goodwill as of the acquisition date as the excess of: (a) the aggregate of the fair value of consideration transferred, the fair value of any noncontrolling interest in the acquiree (if any) and the acquisition date fair value of our previously held equity interest in the acquiree (if any), over (b) the fair value of net assets acquired and liabilities assumed. If information about facts and circumstances existing as of the acquisition date is incomplete by the end of the reporting period in which a business combination occurs, we will report provisional amounts for the items for which the accounting is incomplete. The measurement period ends once we receive the information we were seeking; however, this period will not extend beyond one year from the acquisition date. Any material adjustments recognized during the measurement period will be recognized retrospectively in the consolidated financial statements of the current period. All acquisition related transaction and restructuring costs are to be expensed as incurred. See Note 4, Business Combinations for disclosure over business acquisitions.
Environmental Remediation Liabilities
We have recorded environmental remediation liabilities representing our estimate of the most likely outcome of the matters for which we have determined that a liability is probable. These liabilities include potentially responsible party investigations, settlements, certain legal and consultant fees, as well as costs directly associated with site investigation and clean up, such as materials and incremental internal costs directly related to the remedy. We provide for expenses associated with environmental remediation obligations when such amounts are probable and can be reasonably estimated. We estimate costs required to remediate sites where it is probable that a liability has been incurred based on site-specific facts and circumstances. Estimates of the cost for the likely remedy are developed using third-party environmental engineers or other service providers. Where we believe that both the amount of a particular environmental remediation liability and timing of payments are reliably determinable, we inflate the cost in current dollars until the expected time of payment and discount the cost to present value. See Note 10, Commitments and Contingencies for disclosure over environmental remediation liabilities.
Self-Insurance Liabilities and Related Costs
We are self-insured for vehicles and workers’ compensation with reinsurance coverage limiting our maximum exposure. Our maximum exposure in fiscal year 2015 under the workers’ compensation plan is $1,000 per individual event. Our maximum exposure in fiscal year 2015 under the automobile plan is $1,200 per individual event. The liability for unpaid claims and associated expenses, including incurred but not reported losses, is determined by management with the assistance of a third-party actuary and reflected in our consolidated balance sheet as an accrued liability. We use a third-party to track and evaluate actual claims experience forconsistency with the data used in the annual actuarial valuation. The actuarially determined liability is calculated based on historical data, which considers both the frequency and settlement amount of claims. Our self-insurance reserves totaled $11,560, $10,863 and $10,280 as of December 31, 2015, December 31, 2014 and April 30, 2014, respectively. Our estimated accruals for these liabilitiescould be significantly different than our ultimate obligations if variables such as the frequency or severity of future events differ significantly from our assumptions.
Income Taxes
We use estimates to determine our provision for income taxes and related assets and liabilities and any valuation allowance recorded against our net deferred tax assets. Valuation allowances have been established for the possibility that tax benefits may not be realized for certain deferred tax assets. Deferred income taxes are recognized based on the expected future tax consequences of differencesbetween the financial statement basis and the tax basis of assets and liabilities, calculated using currently enacted tax rates. We record net deferred tax assets to the extent we believe these assets will more likely than not be realized. In making this determination, we consider all available positive and negative evidence, including scheduled reversals of deferred tax liabilities, projected future taxable income, tax planning strategies and recent financial operations. In the event we determine that we would be able to realize ourdeferred income tax assets in the future in excess of their net recorded amount, we will make an adjustment to the valuation allowance which would reduce the provision for income taxes.

8888
We account for income tax uncertainties according to guidance on the recognition, de-recognition and measurement of potential taxbenefits associated with tax positions. We recognize interest and penalties relating to income tax matters as a component of income tax expense. See Note 14, Income Taxes for disclosure related to income taxes.
Derivatives and Hedging
We account for derivatives and hedging activities in accordance with derivatives and hedging accounting guidance that establishesaccounting and reporting standards requiring that every derivative instrument (including certain derivative instruments embedded in other contracts) be recorded in the balance sheet as either an asset or liability measured at its fair value. The guidance also requires that changes in the derivative’s fair value be recognized currently in earnings unless specific hedge accounting criteria are met. Our objective for utilizing derivative instruments is to reduce our exposure to fluctuations in cash flows due to changes in the commodity prices of recycled paper and adverse movements in interest rates.
Our strategy to hedge against fluctuations in the commodity prices of recycled paper is to enter into hedges to mitigate the variability in cash flows generated from the sales of recycled paper at floating prices, resulting in a fixed price being received from these sales. We evaluate the hedges and ensure that these instruments qualify for hedge accounting pursuant to derivative and hedging guidance. Designated as effective cash flow hedges, the change in the fair value of these derivatives is recorded in our stockholders’ equity (deficit) as a component of accumulated other comprehensive income (loss) until the hedged item is settled and recognized as part of commodity revenue.
If the price per short ton of the underlying commodity, as reported on the Official Board Market, is less than the contract price per short ton, we receive the difference between the average price and the contract price (multiplied by the notional tons) from therespective counter-party. If the price per short ton of the underlying commodity exceeds the contract price per short ton, we pay the calculated difference to the counter-party.
The fair value of commodity hedges are obtained or derived from our counter-parties using valuation models that take into consideration market price assumptions for commodities based on underlying active markets. We were not party to any commodity hedge contracts as of December 31, 2015.
Our strategy to hedge against fluctuations in variable interest rates involves entering into interest rate derivative agreements to hedge against adverse movements in interest rates. For interest rate derivatives deemed to be effective cash flow hedges, the change in fair value is recorded in our stockholders’ equity (deficit) as a component of accumulated other comprehensive income (loss) and included in interest expense at the same time as interest expense is affected by the hedged transaction. Differences paid or received over the life of the agreements are recorded as additions to or reductions of interest expense on the underlying debt. We were not party to any interest rate derivative agreements deemed to be effective cash flow hedges as of December 31, 2015.
For interest rate derivatives deemed to be ineffective cash flow hedges, the change in fair value is recorded through earnings andincluded in loss (gain) on derivative instruments. We are currently party to one interest rate swap deemed to be an ineffective cash flow hedge that is scheduled to mature on March 15, 2016 and were party to another interest rate swap deemed to be an ineffectivecash flow hedge that was settled in fiscal year 2015 for $830 in conjunction with the refinancing of our senior revolving credit and letter of credit facility that was due March 18, 2016 (“Senior Credit Facility”). See Note 12, Fair Value of Financial Instruments for fair value disclosure over derivative instruments.
Contingent Liabilities
We are subject to various legal proceedings, claims and regulatory matters, the outcomes of which are subject to significant uncertainty. We determine whether to disclose or accrue for loss contingencies based on an assessment of whether the risk of loss is remote, reasonably possible or probable, and whether it can be reasonably estimated. We analyze our litigation and regulatory mattersbased on available information to assess the potential liabilities. Management’s assessment is developed based on an analysis ofpossible outcomes under various strategies. We accrue for loss contingencies when such amounts are probable and reasonably estimable. If a contingent liability is only reasonably possible, we will disclose the potential range of the loss, if estimable. We record losses related to contingencies in cost of operations or general and administration expenses, depending on the nature of the underlying transaction leading to the loss contingency. See Note 10, Commitments and Contingencies for disclosure over loss contingencies. Contingent liabilities accounted for under purchase accounting are recorded at their fair values. These fair values may be different from the values we would have otherwise recorded, had the contingent liability not been assumed as part of an acquisition of a business. See Note 4, Business Combinations for disclosure over a contingent liability assumed as part of the acquisition of a business.

8989
Revenue Recognition
We recognize collection, transfer, recycling and disposal revenues as the services are provided. Certain customers are billed inadvance and, accordingly, recognition of the related revenues is deferred until the services are provided.
Revenues from the sale of recycled materials are recognized upon shipment. Rebates to certain municipalities based on sales of recyclable materials are recorded upon the sale of such recyclables to third-parties and are included as a reduction of revenues. Revenues for processing of recyclable materials are recognized when the related service is provided. Revenues from the brokerage of recycled materials are recognized on a net basis at the time of shipment.
Asset Impairments
Recovery of Long-Lived Assets. We continually assess whether events or changes in circumstances have occurred that may warrant revision of the estimated useful lives of our long-lived assets (other than goodwill) or whether the remaining balances of those assets should be evaluated for possible impairment. Long-lived assets include, for example, capitalized landfill costs, other property, plant and equipment, and identifiable intangible assets. Events or changes in circumstances that may indicate that an asset may be impaired include the following:
• a significant decrease in the market price of an asset or asset group;
• a significant adverse change in the extent or manner in which an asset or asset group is being used or in its physical condition;
• a significant adverse change in legal factors or in the business climate that could affect the value of an asset or asset group, including an adverse action or assessment by a regulator;
• an accumulation of costs significantly in excess of the amount originally expected for the acquisition or construction of a long-lived asset;
• a current period operating or cash flow loss combined with a history of operating or cash flow losses or a projection or forecastthat demonstrates continuing losses associated with the use of a long-lived asset or asset group;
• a current expectation that, more likely than not, a long-lived asset or asset group will be sold or otherwise disposed of significantly before the end of its previously estimated useful life; or
• an impairment of goodwill at a reporting unit.
There are certain indicators listed above that require significant judgment and understanding of the waste industry when applied to landfill development or expansion. For example, a regulator may initially deny a landfill expansion permit application although the expansion permit is ultimately granted. In addition, management may periodically divert waste from one landfill to another to conserve remaining permitted landfill airspace. Therefore, certain events could occur in the ordinary course of business and notnecessarily be considered indicators of impairment due to the unique nature of the waste industry.
If an impairment indicator occurs, we perform a test of recoverability by comparing the carrying value of the asset or asset group to its undiscounted expected future cash flows. We group our long-lived assets for this purpose at the lowest level for which identifiablecash flows are primarily independent of the cash flows of other assets or asset groups. If the carrying values are in excess ofundiscounted expected future cash flows, we measure any impairment by comparing the fair value of the asset or asset group to itscarrying value.
To determine fair value, we use discounted cash flow analyses and estimates about the future cash flows of the asset or asset group. This analysis includes a determination of an appropriate discount rate, the amount and timing of expected future cash flows andgrowth rates. The cash flows employed in our discounted cash flow analyses are typically based on financial forecasts developedinternally by management. The discount rate used is commensurate with the risks involved. We may also rely on third-party valuations and or information available regarding the market value for similar assets.
If the fair value of an asset or asset group is determined to be less than the carrying amount of the asset or asset group, impairment in the amount of the difference is recorded in the period that the impairment occurs. Estimating future cash flows requires significantjudgment and projections may vary from the cash flows eventually realized.
See Note 15, Other Items and Charges for disclosure related to long-lived asset impairments recognized during the reporting periods.
Goodwill. We annually assess goodwill impairment at the end of our fiscal year or more frequently if events or circumstances indicate that impairment may exist. Historically, we have performed our annual goodwill impairment test using our fiscal year-end, or April 30th, as the measurement date. Effective with the change in our fiscal year-end from April 30th to December 31st, we have

9090
voluntarily changed our goodwill impairment measurement date from April 30th to December 31st to coincide with the change in our fiscal year-end. The voluntary change in our goodwill impairment measurement date was applied prospectively as it represents themodification of an existing principle based on new facts and circumstances.
We may assess whether a goodwill impairment exists using either a qualitative or a quantitative assessment. If we perform a qualitative assessment, it involves determining whether events or circumstances exist that indicate it is more likely than not that the fair value of a reporting unit is less than its carrying amount, including goodwill. If based on this qualitative assessment we determine it is not more likely than not that the fair value of a reporting unit is less than its carrying amount, we will not perform a quantitative assessment. If the qualitative assessment indicates that it is more likely than not that the fair value of a reporting unit is less than its carrying amount, or if we elect not to perform a qualitative assessment, we perform a quantitative assessment, or two-step impairment test, to determine whether goodwill impairment exists at the reporting unit.
In the first step (defined as “Step 1”) of testing for goodwill impairment, we estimate the fair value of each reporting unit, which we have determined to be our geographic operating segments, our Recycling segment and our Customer Solutions business, which is included in the Other segment, and compare the fair value with the carrying value of the net assets of each reporting unit. If the fair value is less than its carrying value, then we would perform a second step (defined as “Step 2”) and determine the fair value of the goodwill. In Step 2, the fair value of goodwill is determined by deducting the fair value of a reporting unit’s identifiable assets and liabilities from the fair value of the reporting unit as a whole, as if that reporting unit had just been acquired and the purchase price were being initially allocated.
To determine the fair value of each of our reporting units as a whole we use discounted cash flow analyses, which require significant assumptions and estimates about the future operations of each reporting unit. Significant judgments inherent in this analysis include the determination of appropriate discount rates, the amount and timing of expected future cash flows and growth rates. The cash flows employed in our discounted cash flow analyses are based on financial forecasts developed internally by management. Our discountrate assumptions are based on an assessment of our risk adjusted discount rate, applicable for each reporting unit. In assessing the reasonableness of our determined fair values of our reporting units, we evaluate our results against our current market capitalization.
If the fair value of the goodwill is less than its carrying value for a reporting unit, an impairment charge would be recorded to earnings. The loss recognized cannot exceed the carrying amount of goodwill. After a goodwill impairment loss is recognized, theadjusted carrying amount of goodwill becomes its new accounting basis.
In addition to an annual goodwill impairment assessment, we would evaluate a reporting unit for impairment if events or circumstances change between annual tests indicating a possible impairment. Examples of such events or circumstances include thefollowing:
• a significant adverse change in legal status or in the business climate;
• an adverse action or assessment by a regulator;
• a more likely than not expectation that a segment or a significant portion thereof will be sold; or
• the testing for recoverability of a significant asset group within the segment.
We elected to perform a quantitative analysis as part of our annual goodwill impairment test in fiscal year 2015. As of December 31, 2015, the Step 1 testing for goodwill impairment performed for the Eastern, Western, Recycling and Customer Solutions reportingunits indicated that the fair value of each reporting unit exceeded its carrying amount, including goodwill. Furthermore, the Step 1 test indicated that in each case the fair value of the Eastern, Western, Recycling and Customer Solutions reporting units exceeded itscarrying value by in excess of 22.9%. We incurred no impairment of goodwill as a result of our annual goodwill impairment tests in fiscal year 2015, transition period 2014, fiscal year 2014 and fiscal year 2013. However, there can be no assurance that goodwill will not be impaired at any time in the future.
Cost Method Investments. As of December 31, 2015, we owned 5.3% of the outstanding common stock of Recycle Rewards, Inc. (“Recycle Rewards”), a company that markets an incentive based recycling service. In both fiscal year 2015 and transition period2014, it was determined based on the operating performance of Recycle Rewards that our cost method investment in Recycle Rewardswas potentially impaired. As a result, we performed a valuation analysis in fiscal year 2015, and had a valuation analysis performed by a third-party valuation specialist in transition period 2014, both of which used an income approach based on discounted cash flows to determine an equity value for Recycle Rewards in order to properly value our cost method investment in Recycle Rewards. Based onthese analyses, it was determined in each case that the fair value of our cost method investment in Recycle Rewards was less than the carrying amount and, therefore, we recorded other-than-temporary investment impairment charges of $1,090 and $2,320 in fiscal year2015 and transition period 2014, respectively. As of December 31, 2015, the carrying amount of our cost method investment in Recycle Rewards was $1,070.

9191
As of December 31, 2015, we owned 9.8% of the outstanding equity value of GreenerU, Inc. (“GreenerU”), a services company focused on providing energy efficiency, sustainability and renewable energy solutions to colleges and universities. In fiscal year 2015, it was determined based on the operating performance and recent indications of third-party interest in GreenerU that our cost method investment in GreenerU was potentially impaired. A valuation analysis was performed by a third-party valuation specialist using a market approach based on an option pricing methodology to determine an equity value and fair market value per share for GreenerU. Based on this analysis, it was determined that the fair value of our cost method investment in GreenerU was less than the carrying amount and, therefore, we recorded an other-than-temporary investment impairment charge of $691 in fiscal year 2015. As of December 31, 2015, the carrying amount of our cost method investment in GreenerU was $309.
As of December 31, 2015, we owned 17.0% and 16.2% of the outstanding common stock of AGreen Energy LLC (“AGreen”) and BGreen Energy LLC (“BGreen”), respectively. In fiscal year 2015, AGreen and BGreen, both of which we account for as cost methodinvestments, entered into agreements that resulted in the contribution and sale of certain assets and liabilities of AGreen and BGreen to a limited liability company in exchange for partial ownership interests in a parent of that limited liability company. As a result of the transactions, we performed an analysis to determine whether an other-than-temporary impairment in the carrying value of our cost method investments had occurred. Based on the analysis performed, which measured the fair value of our cost method investments using an in-exchange valuation premise under the market approach that utilized the estimated purchase consideration received, werecorded an investment impairment charge of $318 in fiscal year 2015. As of December 31, 2015, the carrying amount of our cost method investment in AGreen and BGreen was $297.
Stock-Based Compensation
All share-based compensation cost is measured at the grant date, based on the estimated fair value of the award, and is recognized as expense-in general and administration expense over the employee’s requisite service period. Stock-based compensation expense isbased on the number of awards ultimately expected to vest and is therefore reduced for an estimate of the awards that are expected to be forfeited prior to vesting.
The fair value of each stock option is estimated using a Black-Scholes option pricing model, which requires extensive use of accounting judgment and financial estimation, including estimates of the expected term option holders will retain their vested stock options before exercising them and the estimated volatility of our common stock price over the expected term.
See Note 11, Stockholders Deficit for disclosure over stock-based compensation.
Earnings per Share
Basic earnings per share is computed by dividing the net loss from continuing operations attributable to common stockholders by the weighted average number of common shares outstanding during the period. Diluted earnings per share is calculated based on the combined weighted average number of common shares and potentially dilutive shares, which include, where appropriate, the assumedexercise of employee stock options, unvested restricted stock awards, unvested restricted stock units and unvested performance stockunits. In computing diluted earnings per share, we utilize the treasury stock method. See Note 17, Earnings Per Share for disclosure over the calculation of earnings per share.
Discontinued Operations
We analyze our operations that have been divested or classified as held-for-sale to determine if they qualify for discontinued operations accounting. A component of an entity, a group of components of an entity, or a business is required to be reported indiscontinued operations once it meets the held for sale criteria, is disposed of by sale, or is disposed of other than by sale. A disposal is required to be reported in discontinued operations if the disposal represents a strategic shift that has, or will have, a major effect on an entity’s operations and financial results. See Note 16, Divestiture Transactions and Discontinued Operations for disclosure over discontinued operations.
Subsequent Events
Except as disclosed, no material subsequent events have occurred since December 31, 2015 through the date of this filing that would require recognition or disclosure in our current period consolidated financial statements.

92
92
4. BUSINESS COMBINATIONS
We acquired various businesses during transition period 2014, fiscal year 2014 and fiscal year 2013, including several solid wastehauling operations, a transfer station, a MRF and an industrial service management business (included in the Other segment). Theoperating results of these businesses are included in the accompanying audited consolidated statements of operations from each date of acquisition, and the purchase price has been allocated to the net assets acquired based on fair values at each date of acquisition, with the residual amounts recorded as goodwill. Acquired intangible assets other than goodwill that are subject to amortization include client lists and non-compete covenants. These are amortized over a five to ten year period from the date of acquisition. All amounts recorded to goodwill, except amounts related to the acquisition of Bestway Disposal Services and BBI Waste Services (“BBI”) in fiscal year 2013, are expected to be deductible for tax purposes. See Note 14, Income Taxes for disclosure over the tax impact associated with the acquisition of BBI. We did not acquire any businesses during fiscal year 2015.
The purchase price paid for these acquisitions and the allocation of the purchase price is as follows:
Eight Months Ended
December 31,2014
Fiscal Years Ended April 30,
2014 2013
Purchase Price:................................................................................Cash used in acquisitions, net of cash acquired ..................... $ 314 $ 7,860 $ 25,225 Common stock issued............................................................ — — 2,650 Other non-cash considerations .............................................. — 555 — Contingent consideration and holdbacks (1) ......................... 67 1,653 33
Total ................................................................................................ 381 10,068 27,908 Current assets ........................................................................ — 814 1,422 Equipment ............................................................................. 99 2,010 9,423 Other liabilities, net ............................................................... — (241) (7,009) Intangible assets .................................................................... 251 4,302 9,850
Fair value of assets acquired and liabilities assumed ...................... 350 6,885 13,686
Excess purchase price to be allocated to goodwill .......................... $ 31 $ 3,183 $ 14,222
(1) In fiscal year 2014, we recovered a portion of the purchase price holdback amount we had previously paid and were relieved of any potential contingent consideration obligation associated with the acquisition of an industrial service management business completed earlier in fiscal year 2014. As a result, we recorded a $1,058 gain on settlement of acquisition related contingent consideration in fiscal year 2014.
The following unaudited pro forma combined information shows our operational results as though each of the acquisitions completedin transition period 2014, fiscal year 2014 and fiscal year 2013 had occurred as of May 1, 2012.
Eight Months Ended
December 31,2014
Fiscal Year Ended April 30,
2014 2013
Revenue ...................................................................................... $ 368,641 $ 502,304 $ 478,630 Operating income ........................................................................ $ 22,143 $ 12,770 $ 14,820 Net loss attributable to common stockholders ............................ $ (6,015) $ (22,775) $ (53,759) Basic net loss per common share attributable to common
stockholders ........................................................................... $ (0.15) $ (0.57) $ (1.58)
Basic and diluted weighted average shares outstanding ............. 40,262 39,820 34,015
The pro forma results have been prepared for comparative purposes only and are not necessarily indicative of the actual results of operations had the acquisitions taken place as of May 1, 2012 or the results of our future operations. Furthermore, the pro forma results do not give effect to all cost savings or incremental costs that may occur as a result of the integration and consolidation of the completed acquisitions.

9393
5. RESTRICTED CASH / RESTRICTED ASSETS
Restricted cash / restricted assets consist of cash and investments held in trust on deposit with various banks as collateral for our obligations relative to our landfill final capping, closure and post-closure costs and restricted cash reserved to finance certain capital projects.
A summary of restricted cash / restricted assets is as follows:
December 31, April 30,20142015 2014
Current:Restricted assets - landfill closure ......................... $ — $ 76 $ 76
Non Current:Restricted assets - capital projects ......................... $ 1,348 $ 5,819 $ — Restricted assets - landfill closure ......................... 903 813 681
$ 2,251 $ 6,632 $ 681
6. PROPERTY, PLANT AND EQUIPMENT
Property, plant and equipment consists of the following:
December 31, April 30,2015 2014 2014
Land ................................................................................... $ 24,161 $ 21,671 $ 21,445 Landfills ............................................................................. 536,577 513,851 496,515 Landfill operating lease contracts ...................................... 125,991 120,607 115,867 Buildings and improvements .............................................. 140,046 139,461 134,787 Machinery and equipment .................................................. 131,384 127,359 117,193 Rolling stock ...................................................................... 139,557 138,201 128,155 Containers .......................................................................... 94,302 90,231 85,397
1,192,018 1,151,381 1,099,359 Less: accumulated depreciation and amortization .............. 789,766 736,839 695,935
$ 402,252 $ 414,542 $ 403,424
Depreciation expense for fiscal year 2015, transition period 2014, fiscal year 2014 and fiscal year 2013 was $33,168, $21,599, $33,094 and $34,065, respectively. Landfill amortization expense for fiscal year 2015, transition period 2014, fiscal year 2014 and fiscal year 2013 was $26,969, $17,912, $24,689 and $21,206, respectively. Depletion expense on landfill operating lease contracts for fiscal year 2015, transition period 2014, fiscal year 2014 and fiscal year 2013 was $9,428, $7,799, $9,948 and $9,372, respectively, and was recorded in cost of operations.
As of December 31, 2015, $103,904 of our property, plant and equipment served as eligible collateral under our ABL Facility.
7. GOODWILL AND INTANGIBLE ASSETS
A summary of the activity and balances related to goodwill by reporting segment is as follows:
December 31, 2014 Other (1) December 31, 2015
Eastern region ............................................................ $ 17,429 $ — $ 17,429 Western region .......................................................... 87,697 (194) 87,503 Recycling ................................................................... 12,315 — 12,315 Other .......................................................................... 1,729 — 1,729
Total .......................................................................... $ 119,170 $ (194) $ 118,976

94
94
April 30, 2014 Acquisitions December 31, 2014
Eastern region ............................................................. $ 17,429 $ — $ 17,429 Western region ............................................................ 87,666 31 87,697 Recycling .................................................................... 12,315 — 12,315 Other ........................................................................... 1,729 — 1,729
Total ............................................................................ $ 119,139 $ 31 $ 119,170
April 30, 2013 Acquisitions Other (2) April 30, 2014
Eastern region ..................................................................... $ 16,858 $ 539 $ 32 $ 17,429Western region .................................................................... 86,880 790 (4) 87,666Recycling ............................................................................ 12,190 125 — 12,315Other ................................................................................... — 1,729 — 1,729
Total .................................................................................... $ 115,928 $ 3,183 $ 28 $ 119,139
(1) Goodwill adjustment related to the allocation of goodwill to a business that was divested in fiscal year 2015. (2) Goodwill adjustments related to acquisition activity, including the finalization of the deferred tax liability associated with the
December 5, 2012 BBI acquisition.
Intangible assets consist of the following:
CovenantsNot-to-Compete Client Lists Total
Balance, December 31, 2015 .......................................Intangible assets ................................................. $ 17,266 $ 16,065 $ 33,331 Less accumulated amortization .......................... (16,198) (7,881) (24,079)
$ 1,068 $ 8,184 $ 9,252
CovenantsNot-to-Compete Client Lists Total
Balance, December 31, 2014 .......................................Intangible assets ................................................. $ 17,296 $ 16,071 $ 33,367 Less accumulated amortization .......................... (15,730) (5,829) (21,559)
$ 1,566 $ 10,242 $ 11,808
CovenantsNot-to-Compete Client Lists Total
Balance, April 30, 2014 ...............................................Intangible assets ................................................. $ 17,245 $ 15,760 $ 33,005 Less accumulated amortization .......................... (15,363) (4,222) (19,585)
$ 1,882 $ 11,538 $ 13,420
Intangible amortization expense for fiscal year 2015, transition period 2014, fiscal year 2014 and fiscal year 2013 was $2,567, $1,974, $2,556 and $1,306, respectively.

95
95
The intangible amortization expense estimated for the five fiscal years following fiscal year 2015 and thereafter is as follows:
Estimated Future Amortization Expense as of December 31, 2015:
For the fiscal year ending December 31, 2016 .................... $ 2,048 For the fiscal year ending December 31, 2017 .................... $ 1,784 For the fiscal year ending December 31, 2018 .................... $ 1,581 For the fiscal year ending December 31, 2019 .................... $ 1,213 For the fiscal year ending December 31, 2020 .................... $ 1,020 Thereafter ............................................................................ $ 1,606
8. FINAL CAPPING, CLOSURE AND POST-CLOSURE COSTS
Accrued final capping, closure and post-closure costs include the current and non-current portion of costs associated with obligations for final capping closure and post-closure of our landfills. We estimate our future final capping, closure and post-closure costs in order to determine the final capping, closure and post-closure expense per ton of waste placed into each landfill as further described in Note 3, Summary of Significant Accounting Policies to these consolidated financial statements. The anticipated timeframe for paying these costs varies based on the remaining useful life of each landfill, as well as the duration of the post-closure monitoring period. The changes to accrued final capping, closure and post-closure liabilities are as follows:
Fiscal Year Ended Eight Months Ended Fiscal Year EndedDecember 31, 2015 December 31, 2014 April 30, 2014
Beginning balance ........................................... $ 39,829 $ 44,654 $ 43,170 Obligations incurred ............................... 1,798 2,169 3,621 Revisions in estimates (1) ...................... (2,030) (3,378) (3,728) Accretion expense .................................. 3,370 2,275 3,967 Obligations settled (2) ............................ (1,926) (5,891) (2,376)
Ending balance................................................. $ 41,041 $ 39,829 $ 44,654
(1) The revisions in estimates for final capping, closure and post-closure for fiscal year 2015, transition period 2014 and fiscal year 2014 consist of changes in cost estimates and the timing of final capping and closure events, as well as changes to expansion airspace and tonnage placement assumptions.
(2) Includes amounts paid and amounts that are being processed through accounts payable as a part of our disbursement cycle.
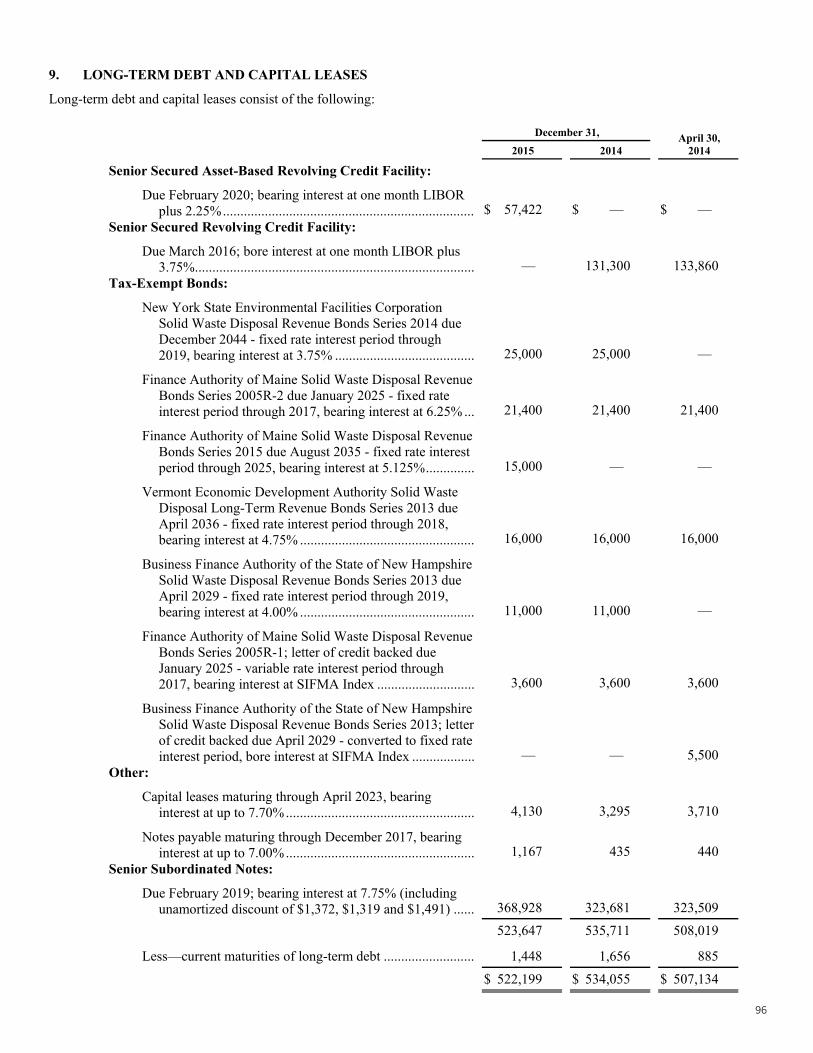
96
96
9. LONG-TERM DEBT AND CAPITAL LEASES
Long-term debt and capital leases consist of the following:
December 31, April 30,2015 2014 2014
Senior Secured Asset-Based Revolving Credit Facility:
Due February 2020; bearing interest at one month LIBOR plus 2.25% ........................................................................ $ 57,422 $ — $ —
Senior Secured Revolving Credit Facility:
Due March 2016; bore interest at one month LIBOR plus 3.75% ................................................................................ — 131,300 133,860
Tax-Exempt Bonds:
New York State Environmental Facilities Corporation Solid Waste Disposal Revenue Bonds Series 2014 due December 2044 - fixed rate interest period through 2019, bearing interest at 3.75% ........................................ 25,000 25,000 —
Finance Authority of Maine Solid Waste Disposal Revenue Bonds Series 2005R-2 due January 2025 - fixed rate interest period through 2017, bearing interest at 6.25% ... 21,400 21,400 21,400
Finance Authority of Maine Solid Waste Disposal Revenue Bonds Series 2015 due August 2035 - fixed rate interest period through 2025, bearing interest at 5.125% .............. 15,000 — —
Vermont Economic Development Authority Solid Waste Disposal Long-Term Revenue Bonds Series 2013 due April 2036 - fixed rate interest period through 2018, bearing interest at 4.75% .................................................. 16,000 16,000 16,000
Business Finance Authority of the State of New Hampshire Solid Waste Disposal Revenue Bonds Series 2013 due April 2029 - fixed rate interest period through 2019, bearing interest at 4.00% .................................................. 11,000 11,000 —
Finance Authority of Maine Solid Waste Disposal Revenue Bonds Series 2005R-1; letter of credit backed due January 2025 - variable rate interest period through 2017, bearing interest at SIFMA Index ............................ 3,600 3,600 3,600
Business Finance Authority of the State of New Hampshire Solid Waste Disposal Revenue Bonds Series 2013; letter of credit backed due April 2029 - converted to fixed rate interest period, bore interest at SIFMA Index .................. — — 5,500
Other:
Capital leases maturing through April 2023, bearing interest at up to 7.70% ...................................................... 4,130 3,295 3,710
Notes payable maturing through December 2017, bearing interest at up to 7.00% ...................................................... 1,167 435 440
Senior Subordinated Notes:
Due February 2019; bearing interest at 7.75% (including unamortized discount of $1,372, $1,319 and $1,491) ...... 368,928 323,681 323,509
523,647 535,711 508,019
Less—current maturities of long-term debt .......................... 1,448 1,656 885
$ 522,199 $ 534,055 $ 507,134

9797
ABL Facility
In fiscal year 2015, we issued an additional $60,000 aggregate principal amount of 7.75% senior subordinated notes due February 15, 2019 (“2019 Notes”). The additional 2019 Notes, which are fungible with and issued under the same indenture as the $325,000 2019Notes previously issued, were issued at a discount of approximately $476 to be accreted over the remaining term of the 2019 Notes.We used the net proceeds from this issuance, together with the initial borrowings under our new ABL Facility, to refinance our Senior Credit Facility.
Our ABL Facility consists of a revolving credit facility with loans thereunder being available up to an aggregate principal amount of $190,000, subject to availability under a borrowing base formula as defined in the ABL Facility agreement. We have the right torequest, at our discretion, an increase in the amount of loans under the ABL Facility by an aggregate amount of $100,000, subject to the terms and conditions set forth in the ABL Facility agreement. Interest accrues at one month LIBOR plus between 1.75% and 2.50%, subject to the terms of the ABL Facility agreement and is set at LIBOR plus 2.25% as of December 31, 2015. The ABL Facility matures on February 26, 2020. If we fail to refinance the 2019 Notes on or before November 16, 2018, the maturity date for the ABL Facility will be November 16, 2018. The ABL Facility is guaranteed jointly and severally, fully and unconditionally by all of our significant wholly-owned subsidiaries and is collateralized by certain qualified accounts receivable, trade, inventory and property, plant and equipment. As of December 31, 2015, our borrowing availability under the ABL Facility was $64,112 and was calculated asa borrowing base of $148,473, less revolver borrowings of $57,422, less outstanding irrevocable letters of credit totaling $26,939, at which date no amount had been drawn.
The ABL Facility requires us to maintain a certain minimum consolidated EBITDA measured at the end of each fiscal quarter. Additionally, if borrowing availability does not meet certain thresholds as defined in the ABL Facility agreement, the ABL Facilityrequires us to meet additional covenants, including, without limitation:
• a minimum fixed charge coverage ratio; and
• a maximum consolidated first lien funded debt to consolidated EBITDA ratio.
An event of default under any of our debt agreements could permit some of our lenders, including the lenders under the ABL Facility, to declare all amounts borrowed from them to be immediately due and payable, together with accrued and unpaid interest, or, in the case of the ABL Facility, terminate the commitment to make further credit extensions thereunder, which could, in turn, trigger cross-defaults under other debt obligations. If we were unable to repay debt to our lenders, or were otherwise in default under any provision governing our outstanding debt obligations, our secured lenders could proceed against us and against the collateral securingthat debt.
Tax-Exempt Financings
New York Bonds. In transition period 2014, we completed a financing transaction involving $25,000 in aggregate principal amount of New York State Environmental Facilities Corporation Solid Waste Disposal Revenue Bonds Series 2014 (“New York Bonds”). We borrowed the proceeds of the New York Bonds to repay borrowings under our Senior Credit Facility for qualifying property, plant and equipment assets purchased in the state of New York.
As of December 31, 2015, we had outstanding $25,000 aggregate principal amount of senior unsecured New York Bonds. The New York Bonds, which are guaranteed jointly and severally, fully and unconditionally by all of our significant wholly-owned subsidiaries,accrue interest at 3.75% per annum through December 1, 2019, at which time they may be converted from a fixed rate to a variablerate. During the fixed interest rate period, the New York Bonds will not be supported by a letter of credit. Interest is payable on June 1 and December 1 of each year. An additional $15,000 aggregate principal amount of New York Bonds may be offered under the same indenture in the future. The New York Bonds mature on December 1, 2044.
Maine Bonds. As of December 31, 2015, we had outstanding $21,400 aggregate principal amount of senior unsecured Finance Authority of Maine Solid Waste Disposal Revenue Bonds Series 2005R-2 (“FAME Bonds 2005R-2”). The FAME Bonds 2005R-2, which are guaranteed jointly and severally, fully and unconditionally by all of our significant wholly-owned subsidiaries, accrueinterest at 6.25% per annum through January 31, 2017, at which time they may be converted from a fixed to a variable rate. During the fixed interest rate period, the FAME Bonds 2005R-2 will not be supported by a letter of credit. Interest is payable semiannually in arrears on February 1 and August 1 of each year. The FAME Bonds 2005R-2 mature on January 1, 2025.
As of December 31, 2015, we had outstanding $3,600 aggregate principal amount of Finance Authority of Maine Solid Waste Disposal Revenue Bonds Series 2005R-1 (“FAME Bonds 2005R-1”). The FAME Bonds 2005R-1 are variable rate bonds secured by a letter of credit issued by our administrative agent bank and interest is payable semiannually in arrears on February 1 and August 1 of each year. The FAME Bonds 2005R-1 mature on January 1, 2025. We borrowed the proceeds of the FAME Bonds 2005R-1 and 2005R-2 to pay for certain costs relating to the following: landfill development and construction; the acquisition of vehicles,

98
98
containers and related equipment for solid waste collection and transportation services; improvements to existing solid waste disposal, hauling, transfer station and other facilities; other infrastructure improvements; and the acquisition of machinery and equipment for solid waste disposal operations owned and operated by us, or a related party, all located in Maine.
In fiscal year 2015, we completed a financing transaction involving the issuance by the Finance Authority of Maine of $15,000 aggregate principal amount of Finance Authority of Maine Solid Waste Disposal Revenue Bonds Series 2015 (“FAME Bonds 2015”). We borrowed the proceeds of the offering of the FAME Bonds 2015 to finance or refinance the costs of certain of our solid wastelandfill facilities and solid waste collection, organics and transfer, recycling and hauling facilities, and to pay for the costs of the issuance of the FAME Bonds 2015.
As of December 31, 2015, we had outstanding $15,000 aggregate principal amount of senior unsecured FAME Bonds 2015. The FAME Bonds 2015, which are and guaranteed jointly and severally, fully and unconditionally by all of our significant wholly-ownedsubsidiaries, accrue interest at 5.125% per annum through August 1, 2025, at which time they may be converted from a fixed to avariable rate. During the fixed interest rate period, the FAME Bonds 2015 will not be supported by a letter of credit. Interest is payable semiannually in arrears on February 1 and August 1 of each year. An additional $15,000 aggregate principal amount of FAME Bonds2015 may be offered under the same indenture in the future. The FAME Bonds 2015 mature on August 1, 2035.
Vermont Bonds. As of December 31, 2015, we had outstanding $16,000 aggregate principal amount of senior unsecured Vermont Economic Development Authority Solid Waste Disposal Long-Term Revenue Bonds Series 2013 (“Vermont Bonds”). The Vermont Bonds, which are guaranteed jointly and severally, fully and unconditionally by all of our significant wholly-owned subsidiaries,accrue interest at 4.75% per annum through April 1, 2018, at which time they may be converted from a fixed rate to a variable rate.During the fixed interest rate period, the Vermont Bonds will not be supported by a letter of credit. Interest is payable semiannually in arrears on April 1 and October 1 of each year. The Vermont Bonds mature on April 1, 2036. We borrowed the proceeds of the Vermont Bonds to repay borrowings under our Senior Credit Facility for qualifying property, plant and equipment assets purchased in the state of Vermont.
New Hampshire Bonds. In transition period 2014, we completed a financing transaction involving $11,000 aggregate principal amount of tax-exempt Solid Waste Disposal Revenue Bonds Series 2013 issued by the Business Finance Authority of the State of New Hampshire (“New Hampshire Bonds”), consisting of the conversion and remarketing of $5,500 principal amount New Hampshire Bonds from a variable rate to a fixed term rate and the issuance of an additional $5,500 principal amount fixed term rate New Hampshire Bonds.
As of December 31, 2015, we had outstanding $11,000 aggregate principal amount of senior unsecured New Hampshire Bonds. The New Hampshire Bonds, which are guaranteed jointly and severally, fully and unconditionally by all of our significant wholly-ownedsubsidiaries, accrue interest at 4.00% per annum through October 1, 2019, at which time they may be converted from a fixed rate to a variable rate. During the fixed interest rate period, the New Hampshire Bonds will not be supported by a letter of credit. Interest is payable in arrears on April 1 and October 1 of each year. The New Hampshire Bonds mature on April 1, 2029. We borrowed the proceeds of the New Hampshire Bonds to repay borrowings under our Senior Credit Facility for qualifying property, plant and equipment assets purchased in the state of New Hampshire.
Senior Subordinated Notes
In fiscal year 2015, we issued an additional $60,000 aggregate principal amount of 2019 Notes. The additional 2019 Notes, which are both fungible and issued under the same indenture as the $325,000 2019 Notes previously issued, were issued at a discount of $476 to be accreted over the remaining term of the 2019 Notes. We used the net proceeds from this issuance, together with the initial borrowings under our new ABL Facility, to refinance our Senior Credit Facility. Additionally, in fiscal year 2015 we repurchased and permanently retired $14,700 aggregate principal amount of 2019 Notes at a weighted average repurchase price of $101.0 in order to maximize interest savings by paying down our most expensive debt.
As of December 31, 2015, we had outstanding $370,300 aggregate principal amount of 2019 Notes, which will mature on February 15, 2019. The 2019 Notes accrue interest at the rate of 7.75% per annum and interest is payable semiannually in arrears on February 15 and August 15 of each year. The 2019 Notes are fully and unconditionally guaranteed on a senior subordinated basis by substantially all of our existing and future domestic restricted subsidiaries that guarantee our ABL Facility.
The indenture governing the 2019 Notes contains certain negative covenants which restrict, among other things, our ability to sellassets, make investments in joint ventures, pay dividends, repurchase stock, incur debt, grant liens and issue preferred stock. As of December 31, 2015, we were in compliance with all covenants under the indenture governing the 2019 Notes, and we do not believethat these restrictions impact our ability to meet future liquidity needs except that they may impact our ability to increase our investments in non-wholly owned entities, including the joint ventures to which we are already party.

9999
Loss on Debt Extinguishment
Senior Subordinated Notes. In fiscal year 2015, we repurchased and permanently retired $14,700 aggregate principal amount of 2019 Notes at a weighted average repurchase price of $101.0 in order to maximize interest savings by paying down our most expensive debt. As a result of the repurchase, we recorded a charge of $478 in fiscal year 2015 as a loss on debt extinguishment primarily related to the non-cash write off of deferred financing costs and unamortized original issue discount in proportion with the settlement amount.
Senior Credit Facility. In fiscal year 2015, we recorded a charge of $521 as a loss on debt extinguishment related to the write-off of deferred financing costs in connection with changes to the borrowing capacity from the Senior Credit Facility to the ABL Facility. The remaining unamortized deferred financing costs of the Senior Credit Facility, along with fees paid to the creditor and third-party costs incurred for the ABL Facility, are to be amortized over the term of the ABL Facility.
Second Lien Notes. In fiscal year 2013, we recorded a charge of $15,584 as a loss on debt extinguishment related to the full refinancing of our 11.0% senior second lien notes (“Second Lien Notes”). The loss on debt extinguishment consisted of a $2,767 non-cash write off of deferred financing costs, a $2,074 non-cash write off of the unamortized original issue discount and a $10,743 charge associated with the early tender premium and tender fees associated with the redemption of the Second Lien Notes.
Interest Expense
The components of interest expense are as follows:
Fiscal Year Ended Eight Months EndedFiscal Year Ended
April 30,December 31, 2015 December 31, 2014 2014 2013
Interest expense on long-term debt and capital leases .......... $ 35,868 $ 23,065 $ 34,216 $ 36,955 Amortization of debt financing costs ................................... 3,613 2,020 2,757 3,325 Amortization of debt discounts ............................................ 364 173 243 626 Letter of credit fees .............................................................. 637 714 1,215 1,032 Less: capitalized interest ...................................................... (62) (333) (256) (368)
Total interest expense ........................................................... $ 40,420 $ 25,639 $ 38,175 $ 41,570
Fair Value of Debt
As of December 31, 2015, the fair value of our fixed rate debt, including our 2019 Notes, FAME Bonds 2005R-2, FAME Bonds 2015, Vermont Bonds, New York Bonds and New Hampshire Bonds was approximately $458,775 and the carrying value was $458,700. The fair value of the 2019 Notes are considered to be Level 1 within the fair value hierarchy as the fair value is based off of a quoted market price in an active market. The fair value of the FAME Bonds 2005R-2, the FAME Bonds 2015, the Vermont Bonds, the New York Bonds and the New Hampshire Bonds is considered to be Level 2 within the fair value hierarchy as the fair value is determinedusing market approach pricing provided by a third-party that utilizes pricing models and pricing systems, mathematical tools andjudgment to determine the evaluated price for the security based on the market information of each of the bonds or securities with similar characteristics.
Although we have determined the estimated fair value amounts of the FAME Bonds 2005R-2, the FAME Bonds 2015, the Vermont Bonds, the New York Bonds and the New Hampshire Bonds using available market information and commonly accepted valuation methodologies, a change in available market information, and/or the use of different assumptions and/or estimation methodologiescould have a material effect on the estimated fair values. These amounts have not been revalued, and current estimates of fair value could differ significantly from the amounts presented. As of December 31, 2015, the fair value of our ABL Facility approximated its carrying value of $57,422 based on current borrowing rates for similar types of borrowing arrangements, or Level 2 inputs. The carrying value of our remaining material variable rate debt, the FAME Bonds 2005R-1, approximates fair value because the interestrate for the debt instrument is based on a market index that approximates current market rates for instruments with similar risk and maturities.

100
100
Future Maturities of Debt
Aggregate principal maturities of long-term debt and capital leases are as follows:
Estimated Future Payments as of December 31, 2015:2016 ........................................................................................................... $ 1,448 2017 ........................................................................................................... 8562018 ........................................................................................................... 6332019 (1) ..................................................................................................... 369,609 2020 ........................................................................................................... 58,402Thereafter .................................................................................................. 92,699
$ 523,647
(1) Includes unamortized discount of $1,372 on 2019 Notes.
10. COMMITMENTS AND CONTINGENCIES
Lease Commitments
We lease operating facilities and equipment in the ordinary course of our business under various operating leases with monthly payments varying up to $36. Future minimum rental payments are recognized on a straight-line basis over the minimum lease term.Total rent expense under operating leases charged to operations was $9,392, $4,868, $5,651 and $5,372 in fiscal year 2015, transition period 2014, fiscal year 2014 and fiscal year 2013, respectively.
Future minimum rental payments under non-cancellable operating leases, which include landfill operating leases, are as follows:
Estimated Future Minimum Lease Payments as of December 31, 2015: .......................................................................................................
2016 ............................................................................................................. $ 17,591 2017 ............................................................................................................. 17,8382018 ............................................................................................................. 17,9542019 ............................................................................................................. 16,5192020 ............................................................................................................. 13,218Thereafter .................................................................................................... 117,224 Total minimum lease payments ................................................................... $ 200,344
Legal Proceedings
In the ordinary course of our business and as a result of the extensive governmental regulation of the solid waste industry, we are subject to various judicial and administrative proceedings involving state and local agencies. In these proceedings, an agency may seek to impose fines or to revoke or deny renewal of an operating permit held by us. From time to time, we may also be subject to actions brought by special interest or other groups, adjacent landowners or residents in connection with the permitting and licensing of landfills and transfer stations, or alleging environmental damage or violations of the permits and licenses pursuant to which weoperate. In addition, we have been named defendants in various claims and suits pending for alleged damages to persons and property, alleged violations of certain laws and alleged liabilities arising out of matters occurring during the ordinary operation of a wastemanagement business.
In accordance with FASB Accounting Standards Codification (“ASC”) 450-20, we accrue for legal proceedings, inclusive of legal costs, when losses become probable and reasonably estimable. As of the end of each applicable reporting period, we review each of our legal proceedings to determine whether it is probable, reasonably possible or remote that a liability has been incurred and, if it is at least reasonably possible, whether a range of loss can be reasonably estimated under the provisions of FASB ASC 450-20. In instances where we determine that a loss is probable and we can reasonably estimate a range of loss we may incur with respect to such a matter,we record an accrual for the amount within the range that constitutes our best estimate of the possible loss. If we are able to reasonably estimate a range, but no amount within the range appears to be a better estimate than any other, we record an accrual in the amount that is the low end of such range. When a loss is reasonably possible, but not probable, we will not record an accrual, but we willdisclose our estimate of the possible range of loss where such estimate can be made in accordance with FASB ASC 450-20.

101 101
Expera Old Town, LLC v. Casella Waste Systems, Inc.
On or about November 6, 2015, Expera Old Town, LLC (“Expera”) filed a lawsuit against us in Maine Superior Court, seeking damages for breach of contract and unjust enrichment, and an action for declaratory judgment (the “Lawsuit”). Expera was a successor-in-interest to a contract between us and Old Town Fuel and Fiber (“OTFF”), the former owner of a pulp manufacturing facility (“Facility”) located in Old Town, Maine (the “Contract”). Expera purchased the Facility during the pendency of the bankruptcy of OTFF. Since the filing of the Lawsuit, Expera has sold the Facility and related assets, to MFGR LLC (“MFGR”). MFGR continues to allege that we have the obligation to provide a specialized type of wood fuel to the Facility or, alternatively, that we owe a “Fuel Replacement Fee” of up to $2,000 a year (subject to the possibility of certain credits against such payments). TheContract expires in 2036. We believe we have meritorious defenses to each of the claims in the Lawsuit, are vigorously contesting these allegations, and have filed a counter claim for funds owed to us by MFGR or Expera.
On or about February 10, 2016, we reached an agreement in principle with MFGR to dismiss this suit with prejudice, and to resolve all outstanding claims of any nature including future claims which could arise under the Contract. The Parties are endeavoring in good faith to enter into a settlement agreement (“SA”) and ancillary agreements. Pursuant to the pending SA, we will pay MFGR $1,250upon execution of the SA, and $350 a year for five years following execution of the SA. Accordingly, taking into account the netpresent value of the settlement payments, we have recorded a reserve of $2,616 as of December 31, 2015. This includes a contractsettlement charge of $1,940 and $676 of operating expenses recorded in fiscal year 2015. We also reserved $75 as of December 31,2015 for legal costs associated with the Lawsuit and SA.
We will also enter into a new leachate disposal agreement at market prices with MFGR for the treatment of leachate from the landfillmanaged by us for the State of Maine located in Old Town, Maine (“Juniper Ridge”), and MFGR will enter into a waste disposal agreement at market prices with us for the disposal at the Juniper Ridge of waste materials produced in the demolition or re-purposing of the Facility.
Greenwood Street Landfill, Worcester, Massachusetts
On July 2, 2014, we received a draft Administrative Consent Order with Penalty and Notice of Noncompliance (“Draft Order”) fromthe Massachusetts Department of Environmental Protection (“MADEP”) alleging that a subsidiary, NEWS of Worcester, LLC, had completed substantive closure of a portion of the Greenwood Street Landfill in Worcester, Massachusetts in 2010, at an elevationexceeding the applicable permit condition. While we neither admitted nor denied the allegations in the Draft Order, a final Administrative Consent Order with Penalty and Notice of Noncompliance was executed on March 20, 2015 (“Final Order”), and we agreed to pay a civil administrative penalty in a total amount of $172. MADEP agreed that $129 of that amount could be paid as aSupplemental Environmental Project (“SEP”) for work being done by the Massachusetts Audubon Society at the Broad Meadow Brook Conservation Center & Wildlife Sanctuary in Worcester, Massachusetts. This SEP has been paid in full.
Environmental Remediation Liability
We are subject to liability for environmental damage, including personal injury and property damage, that our solid waste, recycling and power generation facilities may cause to neighboring property owners, particularly as a result of the contamination of drinking water sources or soil, possibly including damage resulting from conditions that existed before we acquired the facilities. We may also be subject to liability for similar claims arising from off-site environmental contamination caused by pollutants or hazardous substances if we or our predecessors arrange or arranged to transport, treat or dispose of those materials. The following matterrepresents our outstanding material claim.
Potsdam Environmental Remediation Liability
On December 20, 2000, the State of New York Department of Environmental Conservation (“DEC”) issued an Order on Consent (“Order”) which named Waste-Stream, Inc. (“WSI”), our subsidiary, General Motors Corporation (“GM”) and Niagara Mohawk Power Corporation (“NiMo”) as Respondents. The Order required that the Respondents undertake certain work on a 25-acre scrap yard and solid waste transfer station owned by WSI in Potsdam, New York, including the preparation of a Remedial Investigation andFeasibility Study (“Study”). A draft of the Study was submitted to the DEC in January 2009 (followed by a final report in May 2009). The Study estimated that the undiscounted costs associated with implementing the preferred remedies would be approximately $10,219. On February 28, 2011, the DEC issued a Proposed Remedial Action Plan for the site and accepted public comments on the proposed remedy through March 29, 2011. We submitted comments to the DEC on this matter. In April 2011, the DEC issued the final Record of Decision (“ROD”) for the site. The ROD was subsequently rescinded by the DEC for failure to respond to all submitted comments. The preliminary ROD, however, estimated that the present cost associated with implementing the preferred remedies would be approximately $12,130. The DEC issued the final ROD in June 2011 with proposed remedies consistent with its earlier ROD. An Order on Consent and Administrative Settlement naming WSI and NiMo as Respondents was executed by the Respondents and DEC with an effective date of October 25, 2013. On January 29, 2016, a Cost-Sharing Agreement was executed

102102
between WSI, NiMo, Alcoa Inc. (“Alcoa”) and Reynolds Metal Company (“Reynolds”) whereby Alcoa and Reynolds elected to voluntarily participate in the onsite remediation activities at a 15% participant share. It is unlikely that any significant expenditures relating to onsite remediation will be incurred until the fiscal year ending December 31, 2017. WSI is jointly and severally liable with NiMo, Alcoa and Reynolds for the total cost to remediate.
We have recorded an environmental remediation liability associated with the Potsdam site based on incurred costs to date and estimated costs to complete the remediation in other accrued liabilities and other long-term liabilities. Our expenditures could be significantly higher if costs exceed estimates. We inflate the estimated costs in current dollars to the expected time of payment and discount the total cost to present value using a risk free interest rate of 1.8%. The changes to the environmental remediation liability associated with the Potsdam environmental remediation liability are as follows:
Fiscal Year Ended Eight Months Ended Fiscal Year EndedDecember 31, 2015 December 31, 2014 April 30, 2014
Beginning balance ........................................... $ 5,142 $ 5,320 $ 5,297 Obligations incurred ............................... — — 31 Revisions in estimates (1) ...................... — — (118) Accretion expense .................................. 79 92 138 Payments ................................................ — (270) (28)
Ending balance................................................. $ 5,221 $ 5,142 $ 5,320
The total expected environmental remediation payments, in today’s dollars, for each of the five succeeding fiscal years and theaggregate amount thereafter are as follows:
Estimated Future Environmental Remediation Payments as of December 31, 2015:2016 .......................................................................................................................... $ 273 2017 .......................................................................................................................... 3,256 2018 .......................................................................................................................... 855 2019 .......................................................................................................................... 40 2020 .......................................................................................................................... 25 Thereafter ................................................................................................................. 749
Total ......................................................................................................................... $ 5,198
A reconciliation of the expected aggregate non-inflated, undiscounted environmental remediation liability to the amount recognized in the statement of financial position is as follows:
Undiscounted liability ................................................................. $ 5,198 Plus inflation ............................................................................... 23
Liability balance - December 31, 2015 ....................................... $ 5,221
Any substantial liability incurred by us arising from environmental damage could have a material adverse effect on our business,financial condition and results of operations. We are not presently aware of any other situations that would have a material adverse impact on our business, financial condition, results of operations or cash flows.
Employment Contracts
We have entered into employment contracts with four of our executive officers. The contracts are dated June 18, 2001, March 31,2006, July 6, 2010 and September 1, 2012. Each contract had an initial term between one and three years and a covenant not-to-compete ranging from one to two years from the date of termination. These contracts automatically extend for a one year period at the end of the initial term and any renewal period. Total annual commitments for salaries under these contracts are $1,425. In the event of a change in control of us, or in the event of involuntary termination without cause, the employment contracts provide for a payment ranging from one to three years of salary and bonuses. We also have other employment contracts or arrangements with employees who are not executive officers.

103
103
11. STOCKHOLDERS’ DEFICIT
Common Stock
The holders of the Class A common stock are entitled to one vote for each share held. The holders of the Class B common stock areentitled to ten votes for each share held, except for the election of one director, who is elected by the holders of the Class A common stock exclusively. The Class B common stock is convertible into Class A common stock on a share-for-share basis at the option of the shareholder.
In fiscal year 2013, we sold 11,500 shares of Class A common stock at an average price of $4.00 per share in a registered publicoffering. The net proceeds received from the registered public offering, after deducting underwriting discounts, commissions andoffering expenses, were $42,184 and were used to refinance our Second Lien Notes.
Preferred Stock
We are authorized to issue up to 944 shares of preferred stock in one or more series. As of December 31, 2015 and December 31, 2014 we had no shares issued.
Stock Based Compensation
Stock Incentive Plans
1997 Stock Option Plan. In the fiscal year ended April 30, 1998, we adopted the 1997 Stock Option Plan (“1997 Plan”) a stock option plan for employees, officers and directors of, and consultants and advisors to us. The 1997 Plan terminated as of July 31, 2007 and as a result no additional awards may be made pursuant to the 1997 Plan.
2006 Stock Incentive Plan. In the fiscal year ended April 30, 2007, we adopted the 2006 Stock Incentive Plan (“2006 Plan”). The 2006 Plan was amended in the fiscal year ended April 30, 2010. Under the 2006 Plan, we may grant awards up to an aggregate amount ofshares equal to the sum of: (i) 2,475 shares of Class A common stock (subject to adjustment in the event of stock splits and other similar events), plus (ii) such additional number of shares of Class A common stock as were subject to options granted under our 1993 Incentive Stock Option Plan, 1994 Non-statutory Stock Option Plan, 1996 Stock Option Plan, and 1997 Plan (“Prior Plans”), whichwere not actually issued under the Prior Plans because such stock options expire or otherwise result in shares not being issued. As of December 31, 2015, there were 956 Class A common stock equivalents available for future grant under the 2006 Plan, inclusive ofadditional Class A common stock equivalents that were previously issued under our terminated plans and have become available forgrant because such awards expired or otherwise resulted in shares not being issued. No award may be granted under the 2006 Planafter October 10, 2016 and accordingly we expect to implement a new stock incentive plan which would be recommended to stockholders for approval at the 2016 Annual Meeting of Stockholders.
Stock options granted under the 2006 Plan are granted at a price equal to the prevailing fair market value of our Class A commonstock at the date of grant. Generally, stock options granted have a term not to exceed ten years and vest over a one to four year period from the date of grant.
We grant restricted stock awards, restricted stock units and performance stock units under the 2006 Plan at a price equal to the fair market value of our Class A common stock at the date of grant. Restricted stock awards granted to non-employee directors vest incrementally over a three year period beginning on the first anniversary of the date of grant. Restricted stock units vest incrementally over an identified service period beginning on the grant date based on continued employment. Performance stock units vest at a future date following the grant date and are based on the attainment of a performance target.

104
104
Stock Options
The following table summarizes stock option activity:
WeightedAverage
Weighted RemainingAverage Contractual Aggregate
Stock Options Exercise Price Term (years) Intrinsic Value
Outstanding, December 31, 2014 ............................................ 1,380 $ 7.70 Granted .................................................................................... 150 $ 7.17 Exercised ................................................................................. (33) $ 4.85 Forfeited .................................................................................. (200) $ 12.16
Outstanding, December 31, 2015 ............................................ 1,297 $ 7.03 5.5 $ 1,156
Exercisable, December 31, 2015 ............................................. 942 $ 7.47 4.2 $ 928
Expected to vest, December 31, 2015 ..................................... 1,296 $ 7.03 5.5 $ 1,155
During fiscal year 2015, transition period 2014, fiscal year 2014 and fiscal year 2013, stock-based compensation expense for stock options was $671, $386, $464, and $528, respectively.
During fiscal year 2015, transition period 2014, fiscal year 2014 and fiscal year 2013, the aggregate intrinsic value of stock options exercised was $52, $31, $23 and $0.
As of December 31, 2015, total unrecognized stock-based compensation expense related to outstanding stock options was $1,225, which will be recognized over a weighted average period of 2.3 years.
Our calculation of stock-based compensation expense associated with stock options granted was made using the Black-Scholes valuation model. The weighted average fair value of stock options granted during fiscal year 2015, transition period 2014, fiscal year 2014 and fiscal year 2013 were $5.35, $3.62, $4.22 and $3.03 per option, respectively, which were calculated assuming no expecteddividend yield using the following weighted average assumptions:
Fiscal Year Ended Eight Months EndedFiscal Year Ended
April 30,December 31, 2015 December 31, 2014 2014 2013
Expected life .................................................................. 7.24 years 7.00 years 6.79 years 6.82 years Risk-free interest rate .................................................... 2.02% 2.15% 2.22% 1.14% Expected volatility ......................................................... 81.31% 82.76% 83.96% 84.40%
Expected life is calculated based on the weighted average historical life of the vested stock options, giving consideration to vesting schedules and historical exercise patterns. Risk-free interest rate is based on the U.S. Treasury yield curve for the period of the expected life of the stock option. Expected volatility is calculated using the weekly historical volatility of our Class A common stock over the expected life.
The Black-Scholes valuation model requires extensive use of accounting judgment and financial estimation, including estimates of the expected term option holders will retain their vested stock options before exercising them, the estimated volatility of our Class A common stock price over the expected term and the number of stock options that will be forfeited prior to the completion of theirvesting requirements. Application of alternative assumptions could produce significantly different estimates of the fair value of stock-based compensation and consequently, the related amounts recognized in the consolidated statements of operations.

105
105
Other Stock Awards
The following table summarizes restricted stock, restricted stock unit and performance stock unit activity:
Restricted Stock, Weighted AverageRestricted Stock Units, Weighted Remainingand Performance Stock Average Contractual Term Aggregate Intrinsic
Units (1) Grant Price (years) Value
Outstanding, December 31, 2014 ...................... 1,048 $ 4.79 Granted .............................................................. 624 $ 4.40 Class A Common Stock Vested ........................ (410) $ 4.68 Forfeited ............................................................ (300) $ 5.09
Outstanding, December 31, 2015 ...................... 962 $ 4.49 1.8 $ 1,449
Expected to vest, December 31, 2015 ............... 825 $ 4.51 1.8 $ 1,228
(1) Performance stock units are included at the 100% attainment level. As of December 31, 2015, no performance stock units remain outstanding.
The following table summarizes the grant activity for other stock:
Granted
Weighted Average
Grant Date Fair Value
Unissued at December 31,
2015
Fiscal year 2013 grants ..........................................................Restricted stock units ................................................... 340 $ 5.15 — Performance stock units ............................................... 316 $ 5.17 — Restricted stock awards ................................................ 79 $ 4.45 —
Total .................................................................... 735 —
Fiscal year 2014 grants ..........................................................Restricted stock units ................................................... 482 $ 4.09 135 Restricted stock awards ................................................ 60 $ 5.81 14
Total .................................................................... 542 149
Transition period 2014 grants ................................................Restricted stock units ................................................... 277 $ 5.28 171 Restricted stock awards ................................................ 93 $ 3.78 44
Total .................................................................... 370 215
Fiscal year 2015 grants ..........................................................Restricted stock units ................................................... 562 $ 4.20 541 Restricted stock awards ................................................ 62 $ 6.25 57
Total .................................................................... 624 598
During fiscal year 2015, transition period 2014, fiscal year 2014 and fiscal year 2013, stock-based compensation expense related to restricted stock, restricted stock units and performance stock units was $2,314, $1,202, $1,861 and $1,609, respectively. Stock-based compensation expense related to restricted stock and restricted stock units during fiscal year 2015 included $270 of incrementalcompensation expense resulting from the modification of restricted stock awards associated with the retirement of two members of our Board of Directors. There was $19, $0, $0 and $0 of tax benefit in the provision for income taxes associated with stock-based compensation expense during fiscal year 2015, transition period 2014, fiscal year 2014 and fiscal year 2013.
During fiscal year 2015, transition period 2014, fiscal year 2014 and fiscal year 2013, the total fair value of other stock awards vested was $2,340, $1,866, $1,458 and $2,475, respectively.

106
106
As of December 31, 2015, total unrecognized stock-based compensation expense related to restricted stock and restricted stock units was $2,674, which will be recognized over a weighted average period of 1.8 years. We recorded a tax benefit of $185, $84, $0 and $96 to additional paid-in-capital related to the exercise of various share based awards in fiscal year 2015, transition period 2014, fiscal year 2014 and fiscal year 2013, respectively. Tax savings from stock-based compensation resulting from tax deductions in excess of expense are reflected as a financing cash flow in our consolidated financial statements.
We also recorded $94, $52, $79 and $99 of stock-based compensation expense related to our Amended and Restated 1997 Employee Stock Purchase Plan during fiscal year 2015, transition period 2014, fiscal year 2014 and fiscal year 2013, respectively.
Accumulated Other Comprehensive Income
Accumulated other comprehensive income is a component of stockholders’ deficit included in the accompanying consolidated balancesheets and includes, as applicable, the effective portion of changes in the fair value of our cash flow hedges that consist of commodity hedges and interest rate swaps, the changes in fair value of our marketable securities, as well as our portion of the changes in the fair value of GreenFiber’s commodity hedges up until the date of divestiture.
The changes in the balances of each component of accumulated other comprehensive income (loss) are as follows:
MarketableSecurities
Commodity Hedges
Interest Rate Swaps Total
Balance as of April 30, 2012 .................................................................... $ 4 $ 413 $ (2,369) $ (1,952)
Other comprehensive income (loss) before reclassifications .......... 23 (1,653) (1,257) (2,887)Amounts reclassified from accumulated other comprehensive
loss ............................................................................................. — 621 3,626 4,247
Net current-period other comprehensive income (loss) .................. 23 (1,032) 2,369 1,360
Balance as of April 30, 2013 .................................................................... 27 (619) — (592)
Other comprehensive income (loss) before reclassifications .......... 12 (36) — (24)Amounts reclassified from accumulated other comprehensive
loss ............................................................................................. — 655 — 655
Net current-period other comprehensive income ............................ 12 619 — 631
Balance as of April 30, 2014 .................................................................... 39 — — 39 Other comprehensive income ......................................................... 19 — — 19
Balance as of December 31, 2014 ............................................................ 58 — — 58 Other comprehensive loss ............................................................... (51) — — (51)
Balance as of December 31, 2015 ............................................................ $ 7 $ — $ — $ 7

107
107
A summary of reclassifications out of accumulated other comprehensive income (loss) for fiscal year 2015, transition period 2014,fiscal year 2014 and fiscal year 2013 is as follows:
Fiscal Year Eight MonthsEnded Ended Fiscal Year Ended
December 31, December 31, April 30,2015 2014 2014 2013
Details about Accumulated OtherComprehensive Income (Loss) Components
Amount Reclassified Out of Accumulated OtherComprehensive Income (Loss)
Affected Line Item in the ConsolidatedStatements of Operations
Loss on derivative instruments: GreenFiber commodity hedges ..
$ — $ — $ (405) $ (621) Loss from equity method investments
Interest rate contracts ................. — —
— (3,626) Loss on derivative instruments
— — (405) (4,247)
Loss from continuing operations before income taxes and discontinued operations
— — (250) —
Benefit for income taxes
$ — $ — $ (655) $ (4,247)
Loss from continuing operations before discontinued operations
12. FAIR VALUE OF FINANCIAL INSTRUMENTS
We use a three-tier fair value hierarchy to classify and disclose all assets and liabilities measured at fair value on a recurring basis, as well as assets and liabilities measured at fair value on a non-recurring basis, in periods subsequent to their initial measurement. These tiers include: Level 1, defined as quoted market prices in active markets for identical assets or liabilities; Level 2, defined as inputs other than Level 1 that are observable, either directly or indirectly, such as quoted prices for similar assets or liabilities; and Level 3, defined as unobservable inputs that are not corroborated by market data.
We use valuation techniques that maximize the use of market prices and observable inputs and minimize the use of unobservable inputs. In measuring the fair value of our financial assets and liabilities, we rely on market data or assumptions which we believe market participants would use in pricing an asset or a liability.
Assets and Liabilities Accounted for at Fair Value on a Recurring Basis
Our financial instruments include cash and cash equivalents, restricted investments held in trust on deposit with various banks as collateral for our obligations relative to our landfill final capping, closure and post-closure costs, restricted cash reserved to finance certain capital projects, trade receivables, interest rate derivatives, trade payables and long-term debt. The carrying values of cash and cash equivalents, trade receivables and trade payables approximate their respective fair values due to their short-term nature. The fair value of restricted investments held in trust and escrow accounts is included as restricted assets in the Level 1 tier below, along with restricted cash reserved for repayment of costs incurred to fund certain capital projects.
The fair value of the interest rate derivative as of December 31, 2015, included in the Level 2 tier below, is calculated based on a valuation obtained from our counter-party based primarily on the three month LIBOR yield curve that is observable at commonly quoted intervals for the full term of the swap. Previously, it was calculated by us based on the three month LIBOR yield curve that is observable at commonly quoted intervals for the full term of the swap, adjusted by the credit risk of our counter-party and us based on observable credit default swap rates. The change in valuation method is due to the immaterial credit risk impact of our counter-party and us based on the short term nature of the interest rate swap, which matures on March 15, 2016. We recognize all derivatives on the balance sheet at fair value. See Note 9, Long-Term Debt and Capital Leases for disclosure over the fair value of debt.

108
108
Recurring Fair Value Measurements
Our financial assets and liabilities that are measured at fair value on a recurring basis include the following:
Fair Value Measurement at December 31, 2015 Using:
Quoted Prices inActive Markets for Significant Other Significant
Identical Assets Observable Inputs Unobservable Inputs(Level 1) (Level 2) (Level 3)
Assets: .................................................... Restricted assets - capital
projects .................................... $ 1,348 $ — $ — Restricted assets - landfill
closure ..................................... 903 — —
$ 2,251 $ — $ —
Liabilities: .............................................. Interest rate derivative .................. $ — $ 178 $ —
Fair Value Measurement at December 31, 2014 Using:
Quoted Prices inActive Markets for Significant Other Significant
Identical Assets Observable Inputs Unobservable Inputs(Level 1) (Level 2) (Level 3)
Assets: Restricted assets - capital
projects .................................... $ 5,819 $ — $ — Restricted assets - landfill
closure ..................................... 813 — —
$ 6,632 $ — $ —
Liabilities: Interest rate derivatives ................ $ — $ 1,668 $ —
Fair Value Measurement at April 30, 2014 Using:
Quoted Prices inActive Markets for Significant Other Significant
Identical Assets Observable Inputs Unobservable Inputs(Level 1) (Level 2) (Level 3)
Assets: Restricted assets - landfill
closure ..................................... $ 681 $ — $ —
Liabilities: Interest rate derivatives ................ $ — $ 2,770 $ —

109109
Non-Recurring Fair Value Measurements
Our assets and liabilities that are measured at fair value on a non-recurring basis include the following:
Fair Value Measurement at December 31, 2015 Using:
Quoted Prices in Active Markets for
Identical Assets (Level 1)
Significant Other Observable Inputs
(Level 2)
SignificantUnobservable Inputs
(Level 3)
Assets: Cost method investment -
GreenerU ................................. $ — $ — $ 309 Cost method investment -
Recycle Rewards ..................... — — 1,069
$ — $ — $ 1,378
As of December 31, 2015, our financial assets and liabilities recorded at fair value on a non-recurring basis include our cost method investments in GreenerU and Recycle Rewards. The fair value of our cost method investment in GreenerU was measured by a third-party valuation specialist who completed a valuation analysis using a market approach based on an option pricing methodology thatconsiders comparable publicly traded companies revenue multiples to determine an equity value and fair market value per share for GreenerU, which we used to properly value our cost method investment in GreenerU. The fair value of our cost method investment in RecycleRewards was measured by us when we completed a valuation analysis using an income approach based on discounted cash flows to determine an equity value for Recycle Rewards in order to properly value our cost method investment in Recycle Rewards.
Fair Value Measurement at December 31, 2014 Using:
Quoted Prices in Active Markets for
Identical Assets(Level 1)
Significant Other Observable Inputs
(Level 2)
SignificantUnobservable Inputs
(Level 3)
Assets: Cost method investment -
Recycle Rewards ..................... $ — $ — $ 2,160
As of December 31, 2014, our financial assets and liabilities recorded at fair value on a non-recurring basis include our cost method investment in Recycle Rewards. The fair value of our cost method investment was measured by a third-party valuation specialist who completed a valuation analysis using an income approach based on discounted cash flows to determine an equity value for RecycleRewards in order to properly value our cost method investment in Recycle Rewards.
Fair Value Measurement at April 30, 2014 Using:
Quoted Prices in Active Markets for
Identical Assets(Level 1)
Significant Other Observable Inputs
(Level 2)
SignificantUnobservable Inputs
(Level 3)
Assets: Asset group - CARES .................. $ — $ — $ 650
As of April 30, 2014, our financial assets and liabilities recorded at fair value on a non-recurring basis include our assets related to Casella-Altela Regional Environmental Services, LLC (“CARES”). The fair value of our CARES asset group was measured using an in-exchange valuation premise under the market approach derived from quoted market prices of similar assets, adjusted based on qualitative factors specific to the asset group.

110110
13. EMPLOYEE BENEFIT PLANS
Defined Contribution Plan
We offer our eligible employees the opportunity to contribute to a 401(k) plan (“401(k) Plan”). Under the provisions of the 401(k) Plan participants may direct us to defer a portion of their compensation to the 401(k) Plan, subject to Internal Revenue Code limitations. We provide an employer matching contribution equal to fifty cents for every dollar an employee invests in the 401(k) Plan up to our maximum match of one thousand dollars per employee per calendar year, subject to revision. Participants vest in employer contributions ratably over a three year period. Employer contributions for fiscal year 2015, transition period 2014, fiscal year 2014 and fiscal year 2013 amounted to $1,033, $497, $784 and $645, respectively.
Employee Stock Purchase Plan
In the fiscal year ended April 30, 1998, we implemented our employee stock purchase plan. Under this plan, qualified employees may purchase shares of Class A common stock by payroll deduction at a 15% discount from the market price. An aggregate of 1,200 sharesof Class A common stock were initially reserved for this purpose. During fiscal year 2015, transition period 2014, fiscal year 2014 and fiscal year 2013, 80, 79, 70 and 76 shares, respectively, of Class A common stock remained issued under this plan. As of December 31, 2015, 255 shares of Class A common stock were available for distribution under this plan.
14. INCOME TAXES
The provision (benefit) for income taxes from continuing operations consists of the following:
Fiscal Year Ended
December 31,
Eight Months Ended
December 31,Fiscal Year Ended
April 30,2015 2014 2014 2013
Federal— Current ............................................................................ $ 2,899 $ 2,231 $ — $ — Current benefit of loss carryforwards ............................. (2,899) (2,231) — — Deferred .......................................................................... 395 463 1,262 (2,827)
395 463 1,262 (2,827)
State—Current ............................................................................ 1,112 500 219 1,040 Current benefit of loss carryforwards ............................. (557) (402) — (22)Deferred .......................................................................... 401 142 318 (717)
956 240 537 301
$ 1,351 $ 703 $ 1,799 $ (2,526)
Included in the current state tax provision for fiscal year 2013 is an $800 settlement with New York State, comprised of $430 of tax and $370 of interest. New York State had alleged that we were not permitted to file a single combined corporation franchise tax return with our subsidiaries. On January 18, 2011, the State had assessed a liability of $3,852, comprising $2,220 tax and $1,632 penaltiesand interest, for tax years ending April 30, 2004 through April 30, 2006. We had filed Petitions of Redetermination with the State of New York Division of Tax Appeals and had been scheduled for an administrative hearing on April 18-19, 2013. Tax years ending April 30, 2007 through April 30, 2009 were also being audited for the same tax matter. The settlement, which represented less than 8% of the potential cumulative liability for the years settled, was a monetary settlement without any change to our filing combined returns in New York and it closed tax years ending April 30, 2004 through April 30, 2010. Subsequent to the settlement of that audit, the State of New York began an audit of the tax years ended April 30, 2011 through April 30, 2013 and raised the same issue. Wecontinued to believe that our position related to the filing of our State of New York tax returns was correct, and, based on the prior settlement and subsequent favorable litigation related to similar issues, we concluded at December 31, 2014 that no reserve would be required for our State of New York filings. During fiscal year 2015, we reached a settlement with the State of New York for the tax years ended April 30, 2011 through April 30, 2013 on a basis similar to the prior settlement to minimize out-of-pocket costs. Included in the current state tax provision for fiscal year 2015 is a $180 settlement paid to the State of New York for 2011-2013, which includes $168 tax and $12 interest. No audit has been initiated for tax years after 2013. Due to a change in law, we are permitted to and plan to elect to file a single combined corporation franchise tax return with our subsidiaries in New York beginning with 2015. We have not established any reserve under ASC 740 for the tax years ended April 30, 2014 and December 31, 2014, since we believed our position would more likely than not be successful.

111 111
The differences in the provision (benefit) for income taxes and the amounts determined by applying the Federal statutory rate toincome before provision (benefit) for income taxes are as follows:
Fiscal Year Ended
December 31,
Eight Months Ended
December 31,Fiscal Year Ended
April 30,2015 2014 2014 2013
Federal statutory rate .................................................... 35% 35% 35% 35%Tax at statutory rate ...................................................... $ (3,650) $ (1,787) $ (8,929) $ (18,378) State income taxes, net of federal benefit ..................... 198 (59) (1,271) (1,076) Other increase in valuation allowance 5,272 2,532 13,605 22,510 Non-deductible expenses .............................................. 467 505 505 494 Tax credits .................................................................... (671) (380) (598) (660) Non-deductible equity income in subsidiaries and
GreenFiber goodwill impairment (415) (73) 1,548 180 Decrease in valuation allowance due to BBI
acquisition — — — (5,084) Tax over book basis in GreenFiber on sale .................. — — (2,570) — Other, net ...................................................................... 150 (35) (491) (512)
$ 1,351 $ 703 $ 1,799 $ (2,526)
Deferred income taxes reflect the impact of temporary differences between the amounts of assets and liabilities recognized for financial reporting purposes and such amounts recognized for income tax purposes. Deferred tax assets and liabilities consist of the following:
December 31, April 30,2015 2014 2014
Deferred tax assets: ..............................................................Book over tax depreciation of property and
equipment .............................................................. $ 37,383 $ 31,535 $ 28,868 Net operating loss carryforwards ............................... 36,187 40,357 36,594 Accrued expenses and reserves .................................. 31,611 28,929 30,690 Alternative minimum tax credit carryforwards .......... 3,766 3,457 3,330 General business tax credit carryforwards ................. 3,379 2,921 2,666 Stock awards .............................................................. 1,338 1,082 1,315 Unrealized loss on hedges and swaps ......................... 71 672 1,115 Capital loss carryforwards .......................................... — — 2,510 Other ........................................................................... 2,707 2,106 1,496
Total deferred tax assets ................................... 116,442 111,059 108,584 Less: valuation allowance ................................. (93,007) (87,121) (84,540)
Total deferred tax assets after valuation allowance ..................................................... 23,435 23,938 24,044
Deferred tax liabilities: ........................................................Amortization of intangibles ........................................ (28,935) (28,659) (28,210) Other ........................................................................... (95) (264) (286)
Total deferred tax liabilities .............................. (29,030) (28,923) (28,496)
Net deferred tax liability ................................... $ (5,595) $ (4,985) $ (4,452)
As of December 31, 2015 we have, for federal income tax purposes, net operating loss carryforwards of approximately $72,873 thatexpire in the fiscal years ending December 31, 2032 through 2033 and state net operating loss carryforwards of approximately $86,351 that expire in the fiscal years ending December 31, 2016 through 2035. The net operating loss carryforwards include approximately $383 for which a benefit will be recorded in additional paid-in capital when realized. In addition, we have $3,766minimum tax credit carryforwards available that are not subject to a time limitation and $3,379 general business credit carryforwards which expire in the fiscal years ending December 31, 2023 through 2035. Sections 382 and 383 of the Internal Revenue Code can

112112
limit the amount of net operating loss and credit carryforwards which may be used in a tax year in the event of certain stock ownership changes. We are not currently subject to these limitations but could become subject to them if there were significant changes in the ownership of our stock.
In assessing the realizability of carryforwards and other deferred tax assets, management considers whether it is more likely than not that some portion or all of the deferred tax assets will not be realized. We adjust the valuation allowance in the period management determines it is more likely than not that deferred tax assets will or will not be realized.
The net increase in the valuation allowance was $5,886 for fiscal year 2015 and $2,581 for transition period 2014. For fiscal year2013, the valuation allowance decreased by $5,084 due to the recognition of additional reversing temporary differences from thedeferred tax liability recorded through goodwill related to the BBI acquisition. The $5,084 deferred tax liability related to the BBI acquisition resulted from temporary differences related to the amounts of assets and liabilities recognized for financial reporting purposes and such amounts recognized for income tax purposes.
In determining the need for a valuation allowance, we have assessed the available means of recovering deferred tax assets, including the ability to carryback net operating losses, the existence of reversing temporary differences, the availability of tax planning strategies, and available sources of future taxable income. We have also considered the ability to implement certain strategies, such as a potential sale of assets that would, if necessary, be implemented to accelerate taxable income and use expiring deferred tax assets. We believe we are able to support the deferred tax assets recognized as of the end of the year based on all of the available evidence. The net deferred tax liability as of December 31, 2015 includes deferred tax liabilities related to amortizable goodwill, which are anticipated to reverse in an indefinite future period and which are not currently available as a source of taxable income.
The provisions of FASB ASC 740-10-25-5 prescribe the minimum recognition threshold that a tax position is required to meet beforebeing recognized in the financial statements. Additionally, FASB ASC 740-10-25-5 provides guidance on de-recognition, measurement, classification, interest and penalties, accounting in interim periods, disclosure and transition. Under FASB ASC 740-10-25-5, an entity may only recognize or continue to recognize tax positions that meet a “more likely than not” threshold. A reconciliation of the beginning and ending amount of gross unrecognized tax benefits is as follows:
Fiscal Year Ended
December 31, 2015
Eight Months Ended
December 31, 2014
Fiscal Year Ended
April 30, 2014
Unrecognized tax benefits at beginning of period ........ $ 3,073 $ 3,061 $ 3,879 Gross increases for tax positions of prior years ............ 168 14 22 Gross decreases for tax positions of prior years ........... (1) (1) (229) Reductions resulting from lapse of statute of
limitations (409) (1) (611) Gross increases resulting from reversal of benefit
from lapse of statute of limitations 716 — — Settlements .................................................................... (168) — —
Unrecognized tax benefits at end of period .................. $ 3,379 $ 3,073 $ 3,061
The gross increases for tax positions of prior years for fiscal year 2015 includes $168 tax from the settlement with New York State,which is offset by the ($168) settlements for fiscal year 2015. Included in the balances at December 31, 2015, December 31, 2014 and April 30, 2014 are $279, $0 and $0, respectively, of unrecognized tax benefits (net of the federal benefit on state issues) that, if recognized, would favorably affect the effective income tax rate in future periods. We anticipate a decrease of $270 to unrecognized tax benefits within the next 12 months due to the expiration of the applicable statute of limitations.
Our continuing practice is to recognize interest and penalties related to income tax matters in income tax expense. Related to uncertain tax positions during fiscal year 2015, transition period 2014, fiscal year 2014 and fiscal year 2013, we have accrued interest of $92, $143, $116 and $76 and penalties of $8, $8, $8 and $9, respectively. We accrued ($51), $26, $40 and $41 for interest and penalties in income tax expense related to uncertain tax positions during fiscal year 2015, transition period 2014, fiscal year 2014 and fiscal year 2013, respectively. To the extent interest and penalties are not assessed with respect to uncertain tax positions, amounts accrued will be reduced and reflected as a reduction of the overall income tax provision.
We are subject to U.S. federal income tax, as well as income tax of multiple state jurisdictions. Due to Federal and state net operating loss carryforwards, income tax returns from years ending in 1998 through 2015 remain open for examination, with limited exceptions.

113
113
15. OTHER ITEMS AND CHARGES
Environmental Remediation Charge
In transition period 2014, we recorded an environmental remediation charge of $950 associated with remediation performed at Southbridge in the Eastern region. We had previously recorded an environmental remediation charge of $400 in fiscal year 2014 associated with remediating this site.
Expense from Divestiture, Acquisition and Financing Costs
In fiscal year 2014, we incurred $144 of expenses primarily associated with legal costs for the acquisition of the remaining 50%membership interest of Tompkins. See Note 3, Summary of Significant Accounting Policies for disclosure over the acquisition of Tompkins.
In fiscal year 2013, we incurred $1,410 of expenses including a $303 write-off of costs associated with the attempted refinancing of our Second Lien Notes, $602 of legal costs associated with the divestiture of Maine Energy Recovery Company, LP (“Maine Energy”)divestiture transaction, as discussed in Note 16, Divestiture Transactions and Discontinued Operations, and $505 of costs associated with the BBI acquisition.
Development Project Charge
In fiscal year 2014, we recorded a charge of $1,394 for deferred costs associated with a gas pipeline development project in Maine no longer deemed viable.
Severance and Reorganization Costs
In fiscal year 2014, we recorded a charge of $586 for severance costs associated with various planned reorganization efforts including the divestiture of Maine Energy.
In fiscal year 2013, we recorded a charge of $3,709 for severance costs associated primarily with the realignment of our operations in order to streamline functions and improve our cost structure, the closure of Maine Energy and a reorganization of senior management. Through the realignment of our operations we improved certain aspects of the sales function to better facilitate customer service and retention, pricing growth, and support of strategic growth initiatives; better aligned transportation, route management and maintenance functions at the local level; and reduced corporate overhead and staff to match organizational needs and reduce costs.
16. DIVESTITURE TRANSACTIONS AND DISCONTINUED OPERATIONS
We review planned business dispositions based on available information and events that have occurred to determine whether or not a business or disposal group qualifies for discontinued operations treatment. We analyze our operations that have been divested orclassified as held-for-sale to determine if they qualify for discontinued operations accounting. A component of an entity, a group of components of an entity, or a business is required to be reported in discontinued operations once it meets the held for sale criteria, is disposed of by sale, or is disposed of other than by sale. A disposal is required to be reported in discontinued operations if the disposal represents a strategic shift that has, or will have, a major effect on an entity’s operations and financial results. We evaluate whether the component has met the criteria to be classified as held-for-sale. To be classified as held-for-sale, the criteria established by FASB ASC 360-10 must be met as of the reporting date, including an active program to market the business and the disposition of the businesswithin one year. A business that has not been disposed of may not be classified as discontinued operations until the held-for-salecriteria are met. No depreciation is recorded during the periods in which a disposal group is classified as held-for-sale.
Discontinued Operations
In fiscal year 2013, we initiated a plan to dispose of BioFuels and as a result, the assets associated with BioFuels were classified as held-for-sale and the results of operations were recorded as income from discontinued operations. Assets of the disposal group previously classified as held-for-sale, and subsequently included in discontinued operations, included certain inventory along with plant and equipment. In the first quarter of fiscal year 2014, we executed a purchase and sale agreement with ReEnergy Lewiston LLC (“ReEnergy”), pursuant to which we agreed to sell certain assets of BioFuels, which was located in our Eastern region, to ReEnergy. We agreed to sell the BioFuels assets for undiscounted purchase consideration of $2,000, which was to be paid to us in equal quarterly installments over five years commencing November 1, 2013, subject to the terms of the purchase and sale agreement. The related note receivable was paid in full by ReEnergy in transition period 2014. We recognized a $378 loss on disposal of discontinued operations in fiscal year 2014 associated with the disposition.

114114
The operating results of these operations, including those related to prior years, have been reclassified from continuing to discontinued operations in the accompanying consolidated financial statements. Revenues and loss before income taxes attributable to discontinued operations are as follows:
Fiscal Year Ended
December 31,
Eight Months Ended
December 31,Fiscal Year Ended
April 30,2015 2014 2014 2013
Revenues $ — $ — $ 3,316 $ 12,033 Income (loss) before income taxes .......................................... $ — $ — $ 284 $ (4,480)
We allocate interest expense to discontinued operations. We have also eliminated inter-company activity associated with discontinued operations.
Divestiture Transactions
Sale of Business. In fiscal year 2015, we divested of a business, which included the sale of certain assets associated with various waste collection routes in the Western region, for total consideration of $872, resulting in a gain of $590.
Maine Energy. In fiscal year 2013, we executed a purchase and sale agreement with the City of Biddeford, Maine, pursuant to which we agreed to sell the real property of Maine Energy to the City of Biddeford. We agreed to sell Maine Energy for an undiscountedpurchase consideration of $6,650, which was to be paid to us in installments over twenty-one years. The transaction closed in November 2012. In December 2012, we ceased operations of the Maine Energy facility and initiated the decommissioning, demolitionand site remediation process in accordance with the provisions of the agreement. We have completed the demolition process and site remediation under the auspices and in accordance with work plans approved by the Maine Department of Environmental Protection and the U.S. Environmental Protection Agency. Based on the total incurred costs to fulfill our obligation under the agreement, wereversed a reserve of $1,149 of excess costs to complete the divestiture in fiscal year 2015. As of December 31, 2015, we had noremaining costs to complete the divestiture accrued as we had fulfilled our obligation under the agreement.
CARES and Related Transaction. CARES is a joint venture that owned and operated a water and leachate treatment facility for the natural gas drilling industry in Pennsylvania. Our joint venture partner in CARES is Altela, Inc. (“Altela”). We held an ownership interest in CARES of 51% and, in accordance with FASB ASC 810-10-15, we consolidated the assets, liabilities and results of operations of CARES into our consolidated financial statements due to our controlling financial interest in the joint venture. In fiscal year 2014, we determined that assets of the CARES water treatment facility were no longer operational or were not operating within product performance parameters. As a result, we initiated a plan to abandon and shut down the operations of CARES. It was determined that the carrying value of the assets of CARES was no longer recoverable and, as a result, the carrying value of the asset group was assessed for impairment and impaired in transition period 2014. As a result, we recorded an impairment charge of $7,455 transition period 2014 to the asset group of CARES in the Western region.
We executed a purchase and sale agreement in fiscal year 2015 pursuant to which we and Altela agreed to sell certain assets of the CARES water treatment facility to an unrelated third-party. We sold these assets of CARES for purchase consideration of $3,500,resulting in a gain of $2,850 in fiscal year 2015, 49% of which was attributable to Altela, the noncontrolling interest holder. As of December 31, 2015, we continued to pursue the dissolution of CARES in accordance with the CARES agreement.
In connection with this transaction, we also sold certain of our equipment and real estate to the same unrelated third-party for total consideration of $1,050, resulting in a gain of $928 in fiscal year 2015.
BioFuels. In transition period 2014, we recorded a $553 gain associated with the disposition of BioFuels in fiscal year 2014. As a part of the divestiture, we agreed to complete certain site improvements at BioFuels which were completed in December 2014. The gainrecorded is the result of reversing the excess remaining reserves not needed to complete the site improvements.

115 115
17. EARNINGS PER SHARE
The following table sets forth the numerator and denominator used in the computation of earnings per share:
Fiscal Year Ended
December 31,
Eight Months Ended
December 31,Fiscal Year Ended
April 30,2015 2014 2014 2013
Numerator: Loss from continuing operations before discontinued
operations attributable to common stockholders $ (12,969) $ (6,018) $ (23,001) $ (49,662)
Denominator: Number of shares outstanding, end of period: Class A common stock ....................................................... 40,064 39,587 39,086 38,662 Class B common stock ....................................................... 988 988 988 988 Unvested restricted stock .................................................... (115) (159) (130) (134)Effect of weighted average shares outstanding .................. (295) (154) (124) (5,501)
Weighted average common shares outstanding .................. 40,642 40,262 39,820 34,015
Antidilutive potentially issuable shares .............................. 2,259 2,178 2,190 2,074
18. RELATED PARTY TRANSACTIONS
Services
During fiscal year 2015, transition period 2014, fiscal year 2014 and fiscal year 2013, we retained the services of CCI, a companywholly owned by John Casella, our Chairman and Chief Executive Officer, and Douglas Casella, a member of our Board of Directors,as a contractor in developing or closing certain landfills owned by us. Total purchased services charged to operations or capitalized to landfills for fiscal year 2015, transition period 2014, fiscal year 2014 and fiscal year 2013 were $1,341, $5,562, $7,818 and $6,574, respectively, of which $28, $2 and $890 were outstanding and included in either accounts payable or other current liabilities as of December 31, 2015, December 31, 2014 and April 30, 2014, respectively.
In addition to the total purchased services, CCI contributed $350 in cash and $390 in non-compensable services for work performed at the Southbridge landfill to assist in the remediation of the site. See Note 15, Other Items and Charges for discussion over the Southbridge landfill environmental remediation.
Leases
In the fiscal year ended April 30, 1994, we entered into two leases for operating facilities with a partnership of which John Casella,our Chairman and Chief Executive Officer, and Douglas Casella, a member of our Board of Directors, are the general partners. Theleases have since been extended through April 2018 with a five year option to extend the terms. The terms of the lease agreementsrequire monthly payments of approximately $27. Total expense charged to operations for fiscal year 2015, transition period 2014,fiscal year 2014 and fiscal year 2013 under these agreements was $384, $263, $386 and $286, respectively.
Landfill Post-closure
We have agreed to pay the cost of post-closure on a landfill owned by John Casella, our Chairman and Chief Executive Officer, and Douglas Casella, a member of our Board of Directors. We paid the cost of closing this landfill in 1992, and the post-closure maintenance obligations are expected to last until the fiscal year ending December 31, 2024. In fiscal year 2015, transition period 2014, fiscal year 2014 and fiscal year 2013, we paid $9, $8, $8, and $8, respectively, pursuant to this agreement. As of December 31, 2015, December 31, 2014 and April 30, 2014, we have accrued $75, $84 and $94, respectively, for costs associated with its post-closure obligations.

116116
Employee Loan
In fiscal year 2014, we entered into an agreement with an employee to amend a promissory note, whereas the outstanding balance of$149, which had been included in Notes receivable – related party in the accompanying consolidated balance sheet, will be deemedpaid in full in exchange for continued employment and the employee forgoing participation in the annual cash incentive plan andrestricted stock program for a period of time specified in the amended note. Upon entering into the amended note, interest ceasedaccruing on the note and we recorded a charge of $149 in general and administration to reserve for the note.
19. SEGMENT REPORTING
We report selected information about operating segments in a manner consistent with that used for internal management reporting. We classify our solid waste operations on a geographic basis through regional operating segments, the Western and Eastern regions.Revenues associated with our solid waste operations are derived mainly from solid waste collection and disposal, landfill, landfill gas-to-energy, transfer and recycling services in the northeastern United States. Our revenues in the Recycling segment are derived from municipalities and customers in the form of processing fees, tipping fees and commodity sales. Organics services, ancillary operations, major account and industrial services, discontinued operations, and earnings from equity method investees, as applicable, are included in our Other segment.
Fiscal Year Ended December 31, 2015
SegmentOutside revenues
Inter-company revenue
Depreciation andamortization
Operating income (loss)
Interest expense, net
Capitalexpenditures Goodwill Total assets
Eastern ............. $ 167,467 $ 43,560 $ 25,977 $ 7,338 $ (200) $ 24,840 $ 17,429 $ 212,922 Western ............ 231,951 68,284 29,488 26,035 165 20,282 87,503 318,730 Recycling ......... 46,338 995 4,480 (2,406) 25 1,770 12,315 49,355 Other ................ 100,744 1,014 2,759 899 40,100 3,103 1,729 68,876 Eliminations ..... — (113,853) — — — — — —
Total ................. $ 546,500 $ — $ 62,704 $ 31,866 $ 40,090 $ 49,995 $ 118,976 $ 649,883
Eight Months Ended December 31, 2014
SegmentOutside revenues
Inter-company revenue
Depreciation andamortization
Operating income (loss)
Interest expense, net
Capitalexpenditures Goodwill Total assets
Eastern ............. $ 108,423 $ 31,840 $ 17,195 $ 3,434 $ (315) $ 27,354 $ 17,429 $ 211,020 Western ............ 156,877 50,235 19,775 18,840 (6) 21,884 87,697 333,028 Recycling ......... 33,741 (175) 2,876 (238) — 3,016 12,315 52,016 Other ................ 69,333 1,763 1,639 74 25,713 2,807 1,729 73,731 Eliminations ..... — (83,663) — — — — — —
Total ................. $ 368,374 $ — $ 41,485 $ 22,110 $ 25,392 $ 55,061 $ 119,170 $ 669,795
Fiscal Year Ended April 30, 2014
SegmentOutside revenues
Inter-company revenue
Depreciation andamortization
Operating income (loss)
Interest expense, net
Capitalexpenditures Goodwill Total assets
Eastern ............. $ 147,330 $ 38,946 $ 24,961 $ (1,105) $ (272) $ 19,870 $ 17,429 $ 200,235 Western ............ 216,911 70,809 28,693 13,298 112 20,471 87,666 331,304 Recycling ......... 43,825 (139 ) 4,262 (2,435) — 1,111 12,315 49,652 Other ................ 89,567 2,019 2,423 2,158 38,023 4,507 1,729 68,706 Eliminations ..... — (111,635 ) — — — — — —
Total ................. $ 497,633 $ — $ 60,339 $ 11,916 $ 37,863 $ 45,959 $ 119,139 $ 649,897

117 117
Fiscal Year Ended April 30, 2013
SegmentOutside revenues
Inter-company revenue
Depreciation andamortization
Operating income (loss)
Interest expense, net
Capitalexpenditures Goodwill Total assets
Eastern ............. $ 129,889 $ 30,933 $ 23,518 $ (5,291) $ 27,054 $ 20,383 $ 16,858 $ 198,710 Western ............ 205,747 65,390 26,446 20,058 (1,311 ) 30,384 86,880 348,455 Recycling ......... 42,273 116 4,303 (697) 5,553 935 12,190 50,921 Other ................ 77,426 3,933 2,309 (1,649) 10,133 3,325 — 65,033 Eliminations ..... — (100,372 ) — — — — — —
Total ................. $ 455,335 $ — $ 56,576 $ 12,421 $ 41,429 $ 55,027 $ 115,928 $ 663,119
Amount of our total revenue attributable to services provided are as follows:
Fiscal Year Ended Eight Months Ended Fiscal Year Ended April 30,December 31, 2015 December 31, 2014 2014 2013
Collection................................. $ 238,301 43.6% $ 157,809 42.8% $ 225,441 45.3% $ 208,973 45.9%Disposal ................................... 156,536 28.6% 102,304 27.8% 128,778 25.9% 115,049 25.3%Power generation ..................... 6,796 1.2% 5,049 1.4% 9,512 1.9% 11,354 2.4%Processing ................................ 6,061 1.1% 6,643 1.8% 8,852 1.8% 6,901 1.5%
Solid waste operations .... 407,694 74.5% 271,805 73.8% 372,583 74.9% 342,277 75.1%Organics ......................... 39,134 7.2% 27,012 7.3% 37,829 7.6% 35,330 7.8%Customer solutions ......... 53,334 9.8% 35,816 9.7% 43,396 8.7% 35,455 7.8%Recycling ........................ 46,338 8.5% 33,741 9.2% 43,825 8.8% 42,273 9.3%
Total revenues .......................... $ 546,500 100.0% $ 368,374 100.0% $ 497,633 100.0% $ 455,335 100.0%
20. QUARTERLY FINANCIAL INFORMATION (UNAUDITED)
The following is a summary of certain items in the consolidated statements of operations by quarter. The impact of discontinuedoperations, as described in Note 16, Divestiture Transactions and Discontinued Operations is included in all periods in the tables below.
Fiscal Year 2015First
QuarterSecondQuarter
ThirdQuarter
Fourth Quarter
Revenues ................................................................................... $ 116,577 $ 143,714 $ 146,185 $ 140,024 Operating income ...................................................................... $ 3,126 $ 11,342 $ 12,696 $ 4,702 Net (loss) income ...................................................................... $ (7,963) $ 943 $ 2,259 $ (7,020)(Loss) income attributable to common stockholders from
continuing operations $ (9,271) $ 1,025 $ 2,296 $ (7,019)Net (loss) income attributable to common stockholders ........... $ (9,271) $ 1,025 $ 2,296 $ (7,019)Earnings per common share: —
Basic and diluted: ............................................................ — (Loss) income attributable to common
stockholders from continuing operations ........... $ (0.23) $ 0.03 $ 0.06 $ (0.17)Net (loss) income attributable to common
stockholders ....................................................... $ (0.23) $ 0.03 $ 0.06 $ (0.17)

118118
Transition Period 2014First
QuarterSecondQuarter
Two Months Ended
December 31,2014
Revenues ................................................................................................. $ 141,387 $ 141,341 $ 85,646 Operating income .................................................................................... $ 9,338 $ 10,064 $ 2,708 Net (loss) income .................................................................................... $ (154) $ 361 $ (6,017)(Loss) income attributable to common stockholders from continuing
operations ........................................................................................... $ (290) $ 259 $ (5,987)Net (loss) income attributable to common stockholders ......................... $ (290) $ 259 $ (5,987)Earnings common share:
Basic and diluted: ..........................................................................(Loss) income attributable to common stockholders from
continuing operations ...................................................... $ (0.01) $ 0.01 $ (0.15)Net (loss) income attributable to common stockholders ...... $ (0.01) $ 0.01 $ (0.15)
Fiscal Year 2014First
QuarterSecondQuarter
ThirdQuarter
Fourth Quarter
Revenues .................................................................................. $ 128,558 $ 132,296 $ 117,852 $ 118,927 Operating income (loss) ........................................................... $ 9,737 $ 9,450 $ (1,298) $ (5,973)Net loss ..................................................................................... $ (163) $ (575) $ (11,033) $ (15,633)Loss attributable to common stockholders from continuing
operations ............................................................................ $ (142) $ (294) $ (10,750) $ (11,815)Net loss attributable to common stockholders .......................... $ (191) $ (339) $ (10,750) $ (11,815)Earnings per common share:
Basic and diluted: ...........................................................Loss attributable to common stockholders from
continuing operations ....................................... $ (0.00) $ (0.01) $ (0.27) $ (0.30)Net loss attributable to common stockholders ....... $ (0.00) $ (0.01) $ (0.27) $ (0.30)
Fiscal Year 2013First
QuarterSecondQuarter
ThirdQuarter
Fourth Quarter
Revenues .................................................................................. $ 117,638 $ 116,836 $ 112,167 $ 108,694 Operating income ..................................................................... $ 5,807 $ 4,426 $ 78 $ 2,110 Net loss ..................................................................................... $ (8,379) $ (21,092) $ (11,474) $ (13,518)Loss attributable to common stockholders from continuing
operations ............................................................................ $ (8,155) $ (20,732) $ (11,079) $ (9,696)Net loss attributable to common stockholders .......................... $ (8,371) $ (20,967) $ (11,407) $ (13,397)Earnings per common share:
Basic and diluted: ...........................................................Loss attributable to common stockholders from
continuing operations ....................................... $ (0.30) $ (0.67) $ (0.28) $ (0.25)Net loss attributable to common stockholders ....... $ (0.31) $ (0.68) $ (0.29) $ (0.34)
Our transfer and disposal revenues historically have been lower from the months of November through March. This seasonality reflects the lower volume of waste during the late fall, winter and early spring months. Since certain of our operating and fixed costs remain constant throughout fiscal year, operating income is impacted by a similar seasonality. In addition, particularly harsh weather conditions typically result in increased operating costs.
Our recycling business experiences increased volumes of newspaper in November and December due to increased newspaper advertising and retail activity during the holiday season.
21. SUBSIDIARY GUARANTORS Our 2019 Notes are guaranteed jointly and severally, fully and unconditionally, by our significant wholly-owned subsidiaries. TheParent is the issuer and a non-guarantor of the 2019 Notes and the Parent has no independent assets or operations. The information which follows presents the condensed consolidating financial position, the consolidating results of operations and comprehensiveincome (loss) and the condensed consolidating statements of cash flows of (a) the Parent company only, (b) the combined guarantors (the “Guarantors”), each of which is 100% wholly-owned by the Parent, (c) the combined non-guarantors (the “Non-Guarantors”), (d) eliminating entries and (e) the consolidated total.

119
119
CASELLA WASTE SYSTEMS, INC. AND SUBSIDIARIES CONDENSED CONSOLIDATING BALANCE SHEET
AS OF DECEMBER 31, 2015 (in thousands)
Non-ASSETS Parent Guarantors Guarantors Elimination Consolidated
CURRENT ASSETS: Cash and cash equivalents ........................................... $ 1,939 $ 252 $ 121 $ — $ 2,312 Accounts receivable - trade, net .................................. 438 59,729 — — 60,167 Refundable income taxes ............................................. 651 — — — 651 Prepaid expenses ......................................................... 2,612 5,058 — — 7,670 Inventory ..................................................................... — 4,282 — — 4,282 Other current assets ..................................................... 520 1,066 — — 1,586
Total current assets ............................................................... 6,160 70,387 121 — 76,668
Property, plant and equipment, net ....................................... 6,220 396,032 — — 402,252 Goodwill ............................................................................... — 118,976 — — 118,976 Intangible assets, net ............................................................. 8 9,244 — — 9,252 Restricted assets .................................................................... 1,348 903 — — 2,251 Cost method investments ...................................................... 12,333 1,932 — (1,932) 12,333 Investments in subsidiaries ................................................... 23,316 — — (23,316) — Other non-current assets ....................................................... 17,801 10,350 — — 28,151
61,026 537,437 — (25,248) 573,215
Intercompany receivable ....................................................... 484,405 (447,360) (38,977) 1,932 —
$ 551,591 $ 160,464 $ (38,856) $ (23,316) $ 649,883
LIABILITIES AND STOCKHOLDERS’ (DEFICIT) EQUITY Parent GuarantorsNon -
Guarantors Elimination Consolidated
CURRENT LIABILITIES: Current maturities of long-term debt and capital
leases ...................................................................... $ 96 $ 1,352 $ — $ — $ 1,448 Accounts payable ........................................................ 16,203 28,504 214 — 44,921 Accrued payroll and related expenses ......................... 2,994 5,181 — — 8,175 Accrued interest ........................................................... 12,292 13 — — 12,305 Current accrued capping, closure and post-closure
costs ........................................................................ — 729 3 — 732 Other accrued liabilities ............................................... 7,693 10,072 — — 17,765
Total current liabilities .......................................................... 39,278 45,851 217 — 85,346 Long-term debt and capital leases, less current maturities 519,163 3,036 — — 522,199 Accrued capping, closure and post-closure costs, less
current portion — 40,279 30 — 40,309 Deferred income taxes .......................................................... 5,595 — — — 5,595 Other long-term liabilities ..................................................... 9,078 8,953 — — 18,031
— STOCKHOLDERS’ (DEFICIT) EQUITY:
Casella Waste Systems, Inc. stockholders’ (deficit) equity ...................................................................... (21,523) 62,345 (39,029) (23,316) (21,523)
Noncontrolling interests .............................................. — — (74) — (74)
Total stockholders’ (deficit) equity ....................................... (21,523) 62,345 (39,103) (23,316) (21,597)
$ 551,591 $ 160,464 $ (38,856) $ (23,316) $ 649,883

120120
CASELLA WASTE SYSTEMS, INC. AND SUBSIDIARIES CONDENSED CONSOLIDATING BALANCE SHEET
AS OF DECEMBER 31, 2014 (in thousands, except for share and per share data)
ASSETS Parent GuarantorsNon-
Guarantors Elimination Consolidated
CURRENT ASSETS: ...........................................................Cash and cash equivalents ........................................... $ 1,596 $ 253 $ 356 $ — $ 2,205 Restricted cash ............................................................. — 76 — — 76 Accounts receivable - trade, net .................................. 597 55,053 100 — 55,750 Refundable income taxes ............................................. 554 — — — 554 Prepaid expenses ......................................................... 3,622 5,136 5 — 8,763 Inventory ..................................................................... — 4,345 29 — 4,374 Deferred income taxes ................................................. 2,095 — — — 2,095 Other current assets ..................................................... 296 4,549 7 — 4,852
Total current assets ............................................................... 8,760 69,412 497 — 78,669
Property, plant and equipment, net ....................................... 5,049 408,843 650 — 414,542 Goodwill ............................................................................... — 119,170 — — 119,170 Intangible assets, net ............................................................. 98 11,710 — — 11,808 Restricted assets .................................................................... 5,819 813 — — 6,632 Cost method investments ...................................................... 14,432 1,932 — (1,932) 14,432 Investments in subsidiaries ................................................... (9,888) — — 9,888 — Other non-current assets ....................................................... 14,611 9,931 — — 24,542
30,121 552,399 650 7,956 591,126
Intercompany receivable ....................................................... 537,228 (500,267) (38,893) 1,932 —
$ 576,109 $ 121,544 $ (37,746) $ 9,888 $ 669,795
LIABILITIES AND STOCKHOLDERS’ (DEFICIT) EQUITY Parent GuarantorsNon -
Guarantors Elimination Consolidated
CURRENT LIABILITIES: ...................................................Current maturities of long-term debt and capital
leases ...................................................................... $ 89 $ 1,567 $ — $ — $ 1,656 Accounts payable ........................................................ 17,953 30,040 525 — 48,518 Accrued payroll and related expenses ......................... 1,536 4,751 2 — 6,289 Accrued interest ........................................................... 11,083 11 — — 11,094 Current accrued capping, closure and post-closure
costs ........................................................................ — 2,205 3 — 2,208 Other accrued liabilities ............................................... 8,618 7,957 92 — 16,667
Total current liabilities .......................................................... 39,279 46,531 622 — 86,432
Long-term debt and capital leases, less current maturities .... 532,889 1,166 — — 534,055 Accrued capping, closure and post-closure costs, less
current portion .................................................................. — 37,589 32 — 37,621 Deferred income taxes .......................................................... 7,080 — — — 7,080 Other long-term liabilities ..................................................... 9,114 7,433 80 — 16,627
STOCKHOLDERS’ (DEFICIT) EQUITY: ..........................Casella Waste Systems, Inc. stockholders’ (deficit)
equity ...................................................................... (12,253) 28,825 (38,713) 9,888 (12,253)Noncontrolling interests .............................................. — — 233 — 233
Total stockholders’ (deficit) equity ....................................... (12,253) 28,825 (38,480) 9,888 (12,020)
$ 576,109 $ 121,544 $ (37,746) $ 9,888 $ 669,795

121 121
CASELLA WASTE SYSTEMS, INC. AND SUBSIDIARIES CONDENSED CONSOLIDATING BALANCE SHEET
AS OF APRIL 30, 2014 (in thousands, except for share and per share data)
ASSETS Parent GuarantorsNon-
Guarantors Elimination Consolidated
CURRENT ASSETS: ...........................................................Cash and cash equivalents ........................................... $ 2,151 $ 271 $ 42 $ — $ 2,464 Restricted cash ............................................................. — 76 — — 76 Accounts receivable - trade, net .................................. 534 51,983 86 — 52,603 Refundable income taxes ............................................. 465 — — — 465 Prepaid expenses ......................................................... 2,617 4,557 2 — 7,176 Inventory ..................................................................... — 3,852 53 — 3,905 Deferred income taxes ................................................. 2,502 — — — 2,502 Other current assets ..................................................... 312 936 7 — 1,255 Current assets of discontinued operations ................... — 359 — — 359
Total current assets ............................................................... 8,581 62,034 190 — 70,805
Property, plant and equipment, net ....................................... 4,104 398,670 650 — 403,424 Goodwill ............................................................................... — 119,139 — — 119,139 Intangible assets, net ............................................................. 159 13,261 — — 13,420 Restricted assets .................................................................... — 681 — — 681 Cost method investments ...................................................... 16,752 1,932 — (1,932) 16,752 Investments in subsidiaries ................................................... (36,006) — — 36,006 — Other non-current assets ....................................................... 13,874 10,331 — — 24,205 Non-current assets of discontinued operations ..................... — 1,471 — — 1,471
(1,117) 545,485 650 34,074 579,092
Intercompany receivable ....................................................... 543,291 (506,348) (38,875) 1,932 —
$ 550,755 $ 101,171 $ (38,035) $ 36,006 $ 649,897
LIABILITIES AND STOCKHOLDERS’ (DEFICIT) EQUITY Parent GuarantorsNon -
Guarantors Elimination Consolidated
CURRENT LIABILITIES: ...................................................Current maturities of long-term debt and capital
leases ...................................................................... $ 84 $ 801 $ — $ — $ 885 Accounts payable ........................................................ 22,678 28,286 824 — 51,788 Accrued payroll and related expenses ......................... 1,212 4,849 1 — 6,062 Accrued interest ........................................................... 6,084 3 — — 6,087 Current accrued capping, closure and post-closure
costs ........................................................................ — 7,309 3 — 7,312 Other accrued liabilities ............................................... 7,289 10,081 242 — 17,612
Total current liabilities .......................................................... 37,347 51,329 1,070 — 89,746
Long-term debt and capital leases, less current maturities .... 504,836 2,298 — — 507,134 Accrued capping, closure and post-closure costs, less
current portion .................................................................. — 37,306 36 — 37,342 Deferred income taxes .......................................................... 6,954 — — — 6,954 Other long-term liabilities ..................................................... 10,025 7,149 84 — 17,258
STOCKHOLDERS’ (DEFICIT) EQUITY: ..........................Casella Waste Systems, Inc. stockholders’ (deficit)
equity ...................................................................... (8,407) 3,089 (39,095) 36,006 (8,407)Noncontrolling interests .............................................. — — (130) — (130)
Total stockholders’ (deficit) equity ....................................... (8,407) 3,089 (39,225) 36,006 (8,537)$ 550,755 $ 101,171 $ (38,035) $ 36,006 $ 649,897
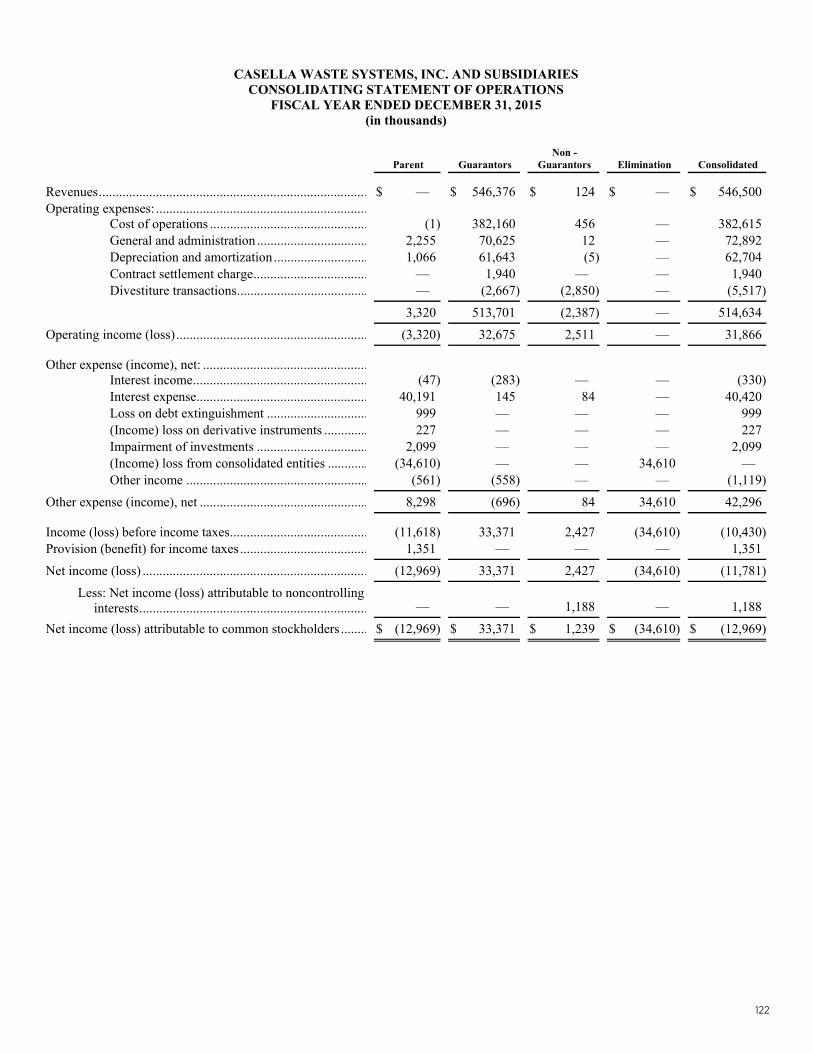
122122
CASELLA WASTE SYSTEMS, INC. AND SUBSIDIARIES CONSOLIDATING STATEMENT OF OPERATIONS
FISCAL YEAR ENDED DECEMBER 31, 2015 (in thousands)
Parent GuarantorsNon -
Guarantors Elimination Consolidated
Revenues ................................................................................ $ — $ 546,376 $ 124 $ — $ 546,500 Operating expenses: ...............................................................
Cost of operations ............................................... (1) 382,160 456 — 382,615 General and administration ................................. 2,255 70,625 12 — 72,892 Depreciation and amortization ............................ 1,066 61,643 (5) — 62,704 Contract settlement charge .................................. — 1,940 — — 1,940 Divestiture transactions ....................................... — (2,667) (2,850) — (5,517)
3,320 513,701 (2,387) — 514,634
Operating income (loss) ......................................................... (3,320) 32,675 2,511 — 31,866
Other expense (income), net: .................................................Interest income .................................................... (47) (283) — — (330)Interest expense................................................... 40,191 145 84 — 40,420 Loss on debt extinguishment .............................. 999 — — — 999 (Income) loss on derivative instruments ............. 227 — — — 227 Impairment of investments ................................. 2,099 — — — 2,099 (Income) loss from consolidated entities ............ (34,610) — — 34,610 — Other income ...................................................... (561) (558) — — (1,119)
Other expense (income), net .................................................. 8,298 (696) 84 34,610 42,296
Income (loss) before income taxes ......................................... (11,618) 33,371 2,427 (34,610) (10,430)Provision (benefit) for income taxes ...................................... 1,351 — — — 1,351
Net income (loss) ................................................................... (12,969) 33,371 2,427 (34,610) (11,781)
Less: Net income (loss) attributable to noncontrolling interests .................................................................... — — 1,188 — 1,188
Net income (loss) attributable to common stockholders ........ $ (12,969) $ 33,371 $ 1,239 $ (34,610) $ (12,969)

123 123
CASELLA WASTE SYSTEMS, INC. AND SUBSIDIARIES CONSOLIDATING STATEMENT OF OPERATIONS
EIGHT MONTHS ENDED DECEMBER 31, 2014 (in thousands)
Parent GuarantorsNon -
Guarantors Elimination Consolidated
Revenues ................................................................................ $ — $ 367,576 $ 798 $ — $ 368,374
Operating expenses: ...............................................................Cost of operations ............................................... 175 258,142 333 — 258,650 General and administration ................................. 2,681 43,011 40 — 45,732 Depreciation and amortization ............................ 548 40,942 (5) — 41,485 Environmental remediation charge ..................... — 950 — — 950 Divestiture transactions ....................................... — (553) — — (553)
3,404 342,492 368 — 346,264
Operating income (loss) ......................................................... (3,404) 25,084 430 — 22,110
Other expense (income), net: .................................................Interest income .................................................... — (247) — — (247)Interest expense................................................... 25,815 (176) — — 25,639 (Gain) loss on derivative instruments ................. 225 — — — 225 Impairment of investments ................................. 2,320 — — — 2,320 (Income) loss from consolidated entities ............ (26,148) — — 26,148 — Other income ...................................................... (301) (419) — — (720)
Other expense (income), net .................................................. 1,911 (842) — 26,148 27,217
Income (loss) from continuing operations before income taxes .................................................................................. (5,315) 25,926 430 (26,148) (5,107)
Provision (benefit) for income taxes ...................................... 703 — — — 703
Net income (loss) ................................................................... (6,018) 25,926 430 (26,148) (5,810)
Less: Net income (loss) attributable to noncontrolling interests .................................................................... — — 208 — 208
Net income (loss) attributable to common stockholders ........ $ (6,018) $ 25,926 $ 222 $ (26,148) $ (6,018)

124124
CASELLA WASTE SYSTEMS, INC. AND SUBSIDIARIES CONSOLIDATING STATEMENT OF OPERATIONS
FISCAL YEAR ENDED APRIL 30, 2014 (in thousands)
Parent GuarantorsNon -
Guarantors Elimination Consolidated
Revenues ................................................................................ $ — $ 495,391 $ 2,242 $ — $ 497,633
Operating expenses: Cost of operations ............................................... (23) 351,829 2,786 — 354,592 General and administration ................................. 1,377 60,446 42 — 61,865 Depreciation and amortization ............................ 935 58,651 753 — 60,339 Divestiture transactions ....................................... — — 7,455 — 7,455 Development project charge ............................... — 1,394 — — 1,394 Severance and reorganization costs .................... 4 582 — — 586 Environmental remediation charge ..................... — 400 — — 400 Expense from divestiture, acquisition and
financing costs................................................ — 144 — — 144 Change in fair value of acquisition related
contingent consideration ................................ — (1,058) — — (1,058)
2,293 472,388 11,036 — 485,717
Operating income (loss) ......................................................... (2,293) 23,003 (8,794) — 11,916
Other expense (income), net: Interest income .................................................... (4) (308) — — (312)Interest expense................................................... 38,095 80 — — 38,175 (Gain) loss on derivative instruments ................. 280 — — — 280 (Income) loss from equity method
investments .................................................... (18,811) (169) 1,105 18,811 936 (Gain) loss on sale of equity method
investment ...................................................... — — (593) — (593)Other income ...................................................... (557) (501) (1) — (1,059)
Other expense (income), net .................................................. 19,003 (898) 511 18,811 37,427
Income (loss) from continuing operations before income taxes .................................................................................. (21,296) 23,901 (9,305) (18,811) (25,511)
Provision (benefit) for income taxes ...................................... 1,799 — — — 1,799
Income (loss) from continuing operations ............................. (23,095) 23,901 (9,305) (18,811) (27,310)
Discontinued operations: .......................................................Income (loss) from discontinued operations, net .......... — 284 — — 284 Gain (loss) on disposal of discontinued operations,
net ............................................................................ — (378) — — (378)
Net income (loss) ................................................................... (23,095) 23,807 (9,305) (18,811) (27,404)Less: Net income (loss) attributable to noncontrolling
interests .................................................................... — — (4,309) — (4,309)
Net income (loss) attributable to common stockholders ........ $ (23,095) $ 23,807 $ (4,996) $ (18,811) $ (23,095)

125 125
CASELLA WASTE SYSTEMS, INC. AND SUBSIDIARIES CONSOLIDATING STATEMENT OF OPERATIONS
FISCAL YEAR ENDED APRIL 30, 2013 (in thousands)
Parent GuarantorsNon -
Guarantors Elimination Consolidated
Revenues ................................................................................ $ — $ 453,589 $ 1,746 $ — $ 455,335
Operating expenses: ...............................................................Cost of operations ............................................... (295) 321,382 1,927 — 323,014 General and administration ................................. 220 57,898 87 — 58,205 Depreciation and amortization ............................ 1,017 55,142 417 — 56,576 Severance and reorganization costs .................... 1,766 1,943 — — 3,709 Expense from divestiture, acquisition and
financing costs................................................ 303 1,107 — — 1,410
3,011 437,472 2,431 — 442,914
Operating income (loss) ......................................................... (3,011) 16,117 (685) — 12,421
Other expense (income), net: .................................................Interest income .................................................... (32,896) (113) — 32,868 (141)Interest expense................................................... 42,405 32,033 — (32,868) 41,570 Loss on debt extinguishment .............................. 15,584 — — — 15,584 Loss on derivative instruments ........................... 4,512 — — — 4,512 Loss (income) from equity method
investments .................................................... 24,723 36 4,405 (24,723) 4,441 Other income ...................................................... (671) (365) — — (1,036)
Other expense (income), net .................................................. 53,657 31,591 4,405 (24,723) 64,930
Income (loss) from continuing operations before income taxes .................................................................................. (56,668) (15,474) (5,090) 24,723 (52,509)
Provision (benefit) for income taxes ...................................... (2,526) — — — (2,526)
Income (loss) from continuing operations ............................. (54,142) (15,474) (5,090) 24,723 (49,983)
Discontinued operations: .......................................................Income (loss) from discontinued operations, net .......... — (4,480) — — (4,480)Gain (loss) on disposal of discontinued operations,
net ............................................................................ — — — — —
Net income (loss) ................................................................... (54,142) (19,954) (5,090) 24,723 (54,463)Less: Net income (loss) attributable to noncontrolling
interest ..................................................................... — — (321) — (321)
Net income (loss) attributable to common stockholders ........ $ (54,142) $ (19,954) $ (4,769) $ 24,723 $ (54,142)

126126
CASELLA WASTE SYSTEMS, INC. AND SUBSIDIARIES CONSOLIDATING STATEMENT OF COMPREHENSIVE INCOME (LOSS)
FISCAL YEAR ENDED DECEMBER 31, 2015 (in thousands)
Parent GuarantorsNon -
Guarantors Elimination Consolidated
Net income (loss) ................................................................................... $ (12,969) $ 33,371 $ 2,427 $ (34,610) $ (11,781)Other comprehensive income (loss), net of tax:
Unrealized gain (loss) resulting from changes in fair value of marketable securities ............................................................... — (51) — — (51)
Other comprehensive income (loss), net of tax ...................................... — (51) — — (51)
Comprehensive income (loss) ................................................................ (12,969) 33,320 2,427 (34,610) (11,832)
Less: Comprehensive income (loss) attributable to noncontrolling interests ........................................................... — — 1,188 — 1,188
Comprehensive income (loss) attributable to common stockholders ..... $ (12,969) $ 33,320 $ 1,239 $ (34,610) $ (13,020)

127127
CASELLA WASTE SYSTEMS, INC. AND SUBSIDIARIES CONSOLIDATING STATEMENT OF COMPREHENSIVE INCOME (LOSS)
EIGHT MONTHS ENDED DECEMBER 31, 2014 (in thousands)
Parent GuarantorsNon -
Guarantors Elimination Consolidated
Net income (loss) ...................................................................................... $ (6,018) $ 25,926 $ 430 $ (26,148) $ (5,810)Other comprehensive income (loss), net of tax:
Unrealized gain (loss) resulting from changes in fair value of marketable securities .................................................................. — 19 — — 19
Other comprehensive income (loss), net of tax ......................................... — 19 — — 19
Comprehensive income (loss) ................................................................... (6,018) 25,945 430 (26,148) (5,791)
Less: Comprehensive income (loss) attributable to noncontrolling interests ....................................................................................... — — 208 — 208
Comprehensive income (loss) attributable to common stockholders ........ $ (6,018) $ 25,945 $ 222 $ (26,148) $ (5,999)

128128
CASELLA WASTE SYSTEMS, INC. AND SUBSIDIARIES CONSOLIDATING STATEMENT OF COMPREHENSIVE INCOME (LOSS)
FISCAL YEAR ENDED APRIL 30, 2014 (in thousands)
Parent GuarantorsNon -
Guarantors Elimination Consolidated
Net income (loss) ................................................................................... $ (23,095) $ 23,807 $ (9,305) $ (18,811) $ (27,404)Other comprehensive income (loss), net of taxes:
Unrealized gain (loss) resulting from changes in fair value of derivative instruments .............................................................. — — (36) — (36)
Realized loss (gain) on derivative instruments reclassified into earnings ................................................................................... — — 655 — 655
Unrealized gain (loss) resulting from changes in fair value of marketable securities ............................................................... — 12 — — 12
Other comprehensive income (loss) ....................................................... — 12 619 — 631
Comprehensive income (loss) ................................................................ (23,095) 23,819 (8,686) (18,811) (26,773)
Less: Comprehensive income (loss) attributable to noncontrolling interests ........................................................... — — (4,309) — (4,309)
Comprehensive income (loss) attributable to common stockholders ..... $ (23,095) $ 23,819 $ (4,377) $ (18,811) $ (22,464)

129129
CASELLA WASTE SYSTEMS, INC. AND SUBSIDIARIES CONSOLIDATING STATEMENT OF COMPREHENSIVE INCOME (LOSS)
FISCAL YEAR ENDED APRIL 30, 2013 (in thousands)
Parent GuarantorsNon -
Guarantors Elimination Consolidated
Net income (loss) ................................................................................... $ (54,142) $ (19,954) $ (5,090) $ 24,723 $ (54,463)Other comprehensive income (loss), net of taxes:
Unrealized gain (loss) resulting from changes in fair value of derivative instruments .............................................................. (1,257) — (1,653) — (2,910)
Realized loss (gain) on derivative instruments reclassified into earnings ................................................................................... 3,626 — 621 — 4,247
Unrealized gain (loss) resulting from changes in fair value of marketable securities ............................................................... — 23 — — 23
Other comprehensive income (loss) ....................................................... 2,369 23 (1,032) — 1,360
Comprehensive income (loss) ................................................................ (51,773) (19,931) (6,122) 24,723 (53,103)
Less: Comprehensive income (loss) attributable to noncontrolling interest ............................................................. — — (321) — (321)
Comprehensive income (loss) attributable to common stockholders ..... $ (51,773) $ (19,931) $ (5,801) $ 24,723 $ (52,782)
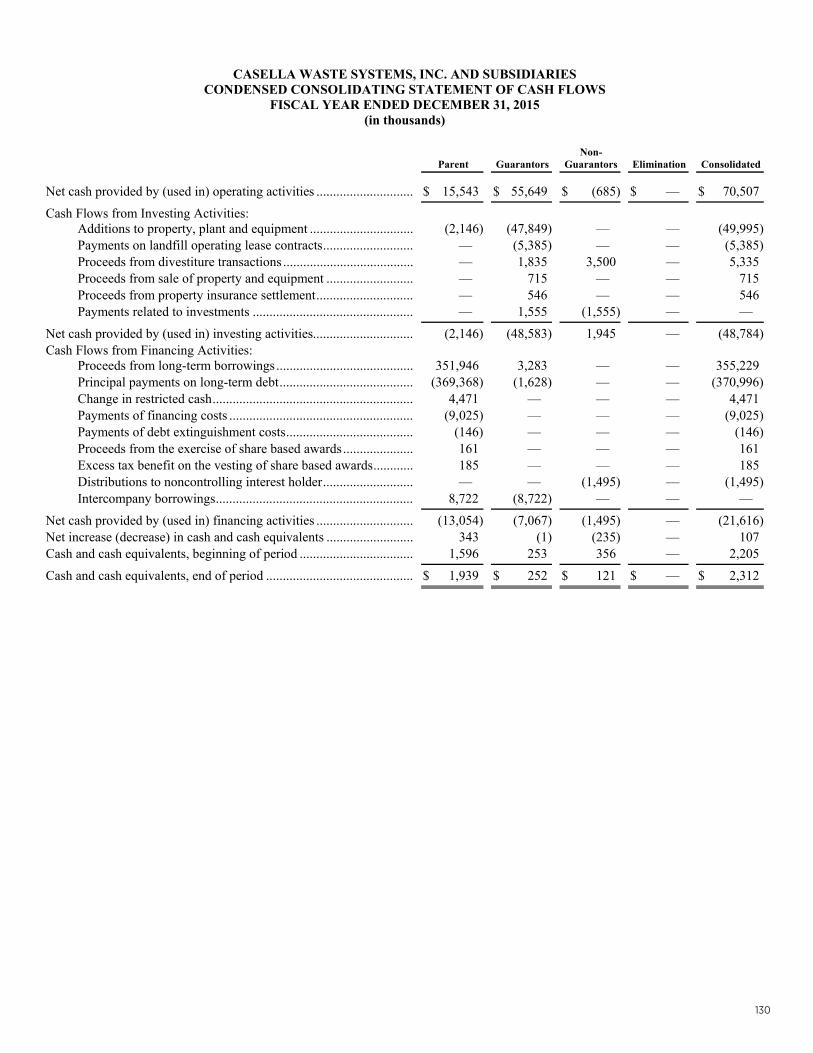
130130
CASELLA WASTE SYSTEMS, INC. AND SUBSIDIARIES CONDENSED CONSOLIDATING STATEMENT OF CASH FLOWS
FISCAL YEAR ENDED DECEMBER 31, 2015 (in thousands)
Parent GuarantorsNon-
Guarantors Elimination Consolidated
Net cash provided by (used in) operating activities ............................. $ 15,543 $ 55,649 $ (685) $ — $ 70,507
Cash Flows from Investing Activities: Additions to property, plant and equipment ............................... (2,146) (47,849) — — (49,995)Payments on landfill operating lease contracts ........................... — (5,385) — — (5,385)Proceeds from divestiture transactions ....................................... — 1,835 3,500 — 5,335 Proceeds from sale of property and equipment .......................... — 715 — — 715 Proceeds from property insurance settlement ............................. — 546 — — 546 Payments related to investments ................................................ — 1,555 (1,555) — —
Net cash provided by (used in) investing activities .............................. (2,146) (48,583) 1,945 — (48,784)Cash Flows from Financing Activities:
Proceeds from long-term borrowings ......................................... 351,946 3,283 — — 355,229 Principal payments on long-term debt ........................................ (369,368) (1,628) — — (370,996)Change in restricted cash ............................................................ 4,471 — — — 4,471 Payments of financing costs ....................................................... (9,025) — — — (9,025)Payments of debt extinguishment costs ...................................... (146) — — — (146)Proceeds from the exercise of share based awards ..................... 161 — — — 161 Excess tax benefit on the vesting of share based awards ............ 185 — — — 185 Distributions to noncontrolling interest holder ........................... — — (1,495) — (1,495)Intercompany borrowings ........................................................... 8,722 (8,722) — — —
Net cash provided by (used in) financing activities ............................. (13,054) (7,067) (1,495) — (21,616)Net increase (decrease) in cash and cash equivalents .......................... 343 (1) (235) — 107 Cash and cash equivalents, beginning of period .................................. 1,596 253 356 — 2,205
Cash and cash equivalents, end of period ............................................ $ 1,939 $ 252 $ 121 $ — $ 2,312
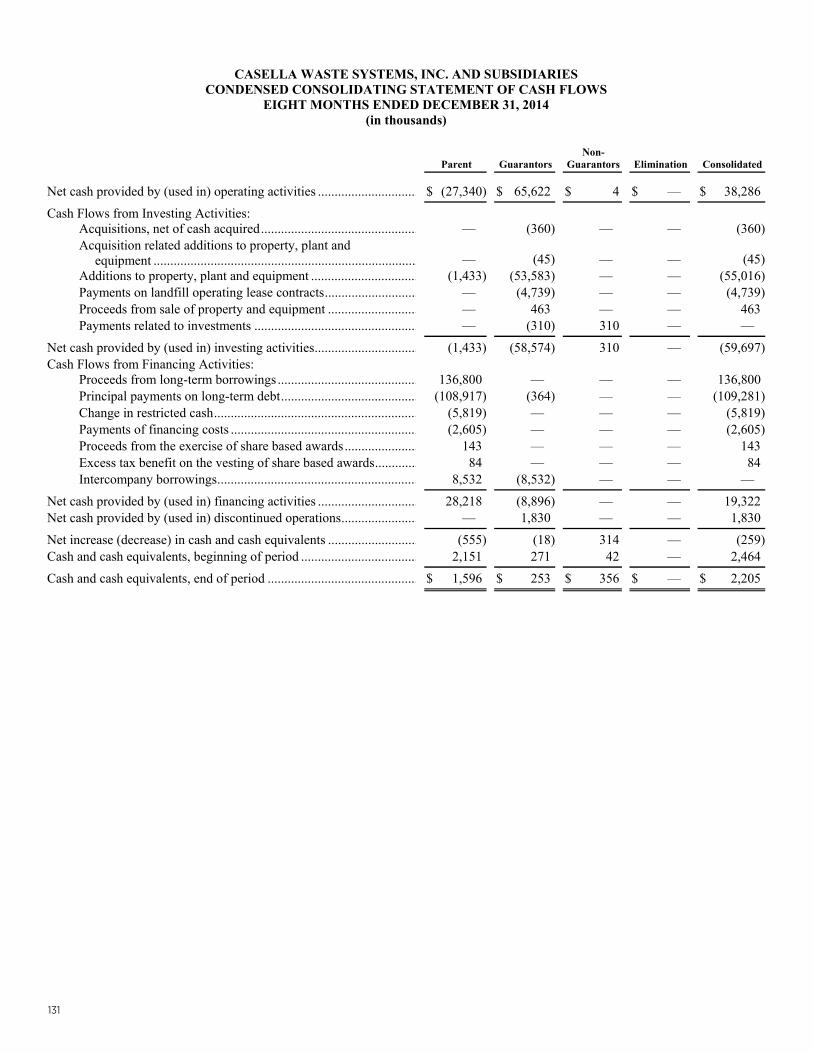
131131
CASELLA WASTE SYSTEMS, INC. AND SUBSIDIARIES CONDENSED CONSOLIDATING STATEMENT OF CASH FLOWS
EIGHT MONTHS ENDED DECEMBER 31, 2014 (in thousands)
Parent GuarantorsNon-
Guarantors Elimination Consolidated
Net cash provided by (used in) operating activities .............................. $ (27,340) $ 65,622 $ 4 $ — $ 38,286
Cash Flows from Investing Activities: Acquisitions, net of cash acquired ............................................... — (360) — — (360)Acquisition related additions to property, plant and
equipment ............................................................................... — (45) — — (45)Additions to property, plant and equipment ................................ (1,433) (53,583) — — (55,016)Payments on landfill operating lease contracts ............................ — (4,739) — — (4,739)Proceeds from sale of property and equipment ........................... — 463 — — 463 Payments related to investments ................................................. — (310) 310 — —
Net cash provided by (used in) investing activities ............................... (1,433) (58,574) 310 — (59,697)Cash Flows from Financing Activities:
Proceeds from long-term borrowings .......................................... 136,800 — — — 136,800 Principal payments on long-term debt ......................................... (108,917) (364) — — (109,281)Change in restricted cash ............................................................. (5,819) — — — (5,819)Payments of financing costs ........................................................ (2,605) — — — (2,605)Proceeds from the exercise of share based awards ...................... 143 — — — 143 Excess tax benefit on the vesting of share based awards ............. 84 — — — 84 Intercompany borrowings ............................................................ 8,532 (8,532) — — —
Net cash provided by (used in) financing activities .............................. 28,218 (8,896) — — 19,322 Net cash provided by (used in) discontinued operations ....................... — 1,830 — — 1,830
Net increase (decrease) in cash and cash equivalents ........................... (555) (18) 314 — (259)Cash and cash equivalents, beginning of period ................................... 2,151 271 42 — 2,464
Cash and cash equivalents, end of period ............................................. $ 1,596 $ 253 $ 356 $ — $ 2,205

132132
CASELLA WASTE SYSTEMS, INC. AND SUBSIDIARIES CONDENSED CONSOLIDATING STATEMENT OF CASH FLOWS
FISCAL YEAR ENDED APRIL 30, 2014 (in thousands)
Parent GuarantorsNon-
Guarantors Elimination Consolidated
Net cash provided by (used in) operating activities ............................. $ (40,365) $ 89,792 $ 215 $ — $ 49,642
Cash Flows from Investing Activities: Acquisitions, net of cash acquired .............................................. — (8,305) — — (8,305)Acquisition related additions to property, plant and
equipment .............................................................................. — (2,633) — — (2,633)Additions to property, plant and equipment ............................... (1,675) (41,236) (415) — (43,326)Payments on landfill operating lease contracts ........................... — (6,505) — — (6,505)Proceeds from sale of property and equipment .......................... — 1,524 — — 1,524 Proceeds from sale of equity method investment ....................... 3,442 — — — 3,442 Payments related to investments ................................................ (2,107) — — — (2,107)
Net cash provided by (used in) investing activities .............................. (340) (57,155) (415) — (57,910)Cash Flows from Financing Activities:
Proceeds from long-term borrowings ......................................... 160,487 1,163 — — 161,650 Principal payments on long-term debt ........................................ (151,074) (1,306) — — (152,380)Payments of financing costs ....................................................... (405) — — — (405)Proceeds from the exercise of share based awards ..................... — 143 — — 143 Intercompany borrowings ........................................................... 32,588 (32,588) — — —
Net cash provided by (used in) financing activities ............................. 41,596 (32,588) — — 9,008 Net cash provided by (used in) discontinued operations ...................... — (31) — — (31)
Net increase (decrease) in cash and cash equivalents ................. 891 18 (200) — 709 Cash and cash equivalents, beginning of period ......................... 1,260 253 242 — 1,755
Cash and cash equivalents, end of period ............................................ $ 2,151 $ 271 $ 42 $ — $ 2,464

133133
CASELLA WASTE SYSTEMS, INC. AND SUBSIDIARIES CONDENSED CONSOLIDATING STATEMENT OF CASH FLOWS
FISCAL YEAR ENDED APRIL 30, 2013 (in thousands)
Parent GuarantorsNon-
Guarantors Elimination Consolidated
Net cash provided by (used in) operating activities ............................. $ (5,319) $ 50,527 $ (1,302) $ — $ 43,906
Cash Flows from Investing Activities: Acquisitions, net of cash acquired .............................................. — (25,225) — — (25,225)Acquisition related additions to property, plant and
equipment .............................................................................. — (1,746) — — (1,746)Additions to property, plant and equipment ............................... (203) (48,058) (5,020) — (53,281)Payments on landfill operating lease contracts ........................... — (6,261) — — (6,261)Payment for capital related to divestiture ................................... — (618) — — (618)Proceeds from sale of property and equipment .......................... — 883 — — 883 Payments related to investments ................................................ (4,166) (2,707) 3,666 — (3,207)
Net cash provided by (used in) investing activities .............................. (4,369) (83,732) (1,354) — (89,455)Cash Flows from Financing Activities:
Proceeds from long-term borrowings ......................................... 376,185 161 — — 376,346 Principal payments on long-term debt ........................................ (359,342) (1,516) — — (360,858)Payments of financing costs ....................................................... (4,609) — — — (4,609)Payments of debt extinguishment costs ...................................... (10,743) — — — (10,743)Excess tax benefit on the vesting of share based awards ............ 96 — — — 96 Net proceeds from the issuance of class A common stock ......... 42,184 — — — 42,184 Contributions from noncontrolling interest holder ..................... — — 2,531 — 2,531 Intercompany borrowings ........................................................... (36,622) 36,622 — — —
Net cash provided by (used in) financing activities ............................. 7,149 35,267 2,531 — 44,947 Discontinued Operations: Net cash provided by (used in) discontinued operations ...................... — (2,177) — — (2,177)
Net increase (decrease) in cash and cash equivalents ................. (2,539) (115) (125) — (2,779)Cash and cash equivalents, beginning of period ......................... 3,799 368 367 — 4,534
Cash and cash equivalents, end of period ............................................ $ 1,260 $ 253 $ 242 $ — $ 1,755

134
134
ITEM 9. CHANGES IN AND DISAGREEMENTS WITH ACCOUNTANTS ON ACCOUNTING AND FINANCIAL DISCLOSURE
None.
ITEM 9A. CONTROLS AND PROCEDURES
Management’s Report on Internal Control Over Financial Reporting
Our management is responsible for establishing and maintaining adequate internal control over financial reporting, as defined in Rule 13a-15(f) under the Securities Exchange Act of 1934, as amended. Because of its inherent limitations, internal control over financial reporting may not prevent or detect misstatements. Also, projections of any evaluation of effectiveness to future periods are subject to the risk that controls may become inadequate because of changes in conditions, or that the degree of compliance with the policies or procedures may deteriorate. Our management assessed the effectiveness of our internal control over financial reporting as of December 31, 2015. In making this assessment, our management used the criteria set forth by the Committee of Sponsoring Organizations of the Treadway Commission in Internal Control-Integrated Framework in 2013. Based on its assessment, management concluded that, as of December 31, 2015, our internal control over financial reporting is effective based on those criteria. Theeffectiveness of our internal control over financial reporting as of December 31, 2015 has been audited by RSM US LLP, an independent registered public accounting firm. RSM US LLP has issued an attestation report on our internal control over financialreporting, which is included herein.
Evaluation of Disclosure Controls and Procedures
Our management, with the participation of our chief executive officer and chief financial officer, evaluated the effectiveness of our disclosure controls and procedures as of December 31, 2015. The term “disclosure controls and procedures,” as defined in Rules 13a-15(e) and 15d-15(e) under the Securities Exchange Act of 1934, as amended,, means controls and other procedures of a company that are designed to ensure that information required to be disclosed by a company in the reports that it files or submits under the Securities Exchange Act of 1934, as amended, is recorded, processed, summarized and reported, within the time periods specified in the SEC’s rules and forms. Disclosure controls and procedures include, without limitation, controls and procedures designed to ensure thatinformation required to be disclosed by a company in the reports that it files or submits under the Securities Exchange Act of 1934, as amended, is accumulated and communicated to the company’s management, including its principal executive and principal financialofficers, as appropriate to allow timely decisions regarding required disclosure. Management recognizes that any controls and procedures, no matter how well designed and operated, can provide only reasonable assurance of achieving their objectives and management necessarily applies its judgment in evaluating the cost-benefit relationship of possible controls and procedures. Based on the evaluation of our disclosure controls and procedures as of December 31, 2015, our chief executive officer and chief financialofficer concluded that, as of such date, our disclosure controls and procedures were effective at the reasonable assurance level.
The independent registered public accounting firm’s related audit report is included in Item 8 of this Annual Report on Form 10-K and is incorporated herein by reference.
No change in our internal control over financial reporting occurred during the fiscal quarter ended December 31, 2015 that has materially affected, or is reasonably likely to materially affect, our internal control over financial reporting.
PART III
ITEM 10. DIRECTORS, EXECUTIVE OFFICERS AND CORPORATE GOVERNANCE
The information required by this Item 10 (except for information required with respect to our executive officers which is set forth under “Executive Officers of the Registrant” in Item 1 of Part I of this Annual Report on Form 10-K will be contained in a Form 10-K/A that we intend to file with the Securities and Exchange Commission within 120 days after the end of our fiscal year ended December 31, 2015.
ITEM 11. EXECUTIVE COMPENSATION
The information required by this Item will be contained in a Form 10-K/A that we intend to file with the Securities and ExchangeCommission within 120 days after the end of our fiscal year ended December 31, 2015 and is incorporated herein by reference.

135135
ITEM 12. SECURITY OWNERSHIP OF CERTAIN BENEFICIAL OWNERS AND MANAGEMENT AND RELATED STOCKHOLDER MATTERS
The information required by this Item (except for the information required with respect to equity compensation plan information,which is set forth under “Equity Compensation Plan Information” below) will be contained in a Form 10-K/A that we intend to filewith the Securities and Exchange Commission within 120 days after the end of our fiscal year ended December 31, 2015 and is incorporated herein by reference.
Equity Compensation Plan Information
The following table shows information about the securities authorized for issuance under our equity compensation plans as of December 31, 2015:
(a) (b) (c)
Plan Category
Number of securities
to be issued upon exercise of
outstandingoptions, warrants
and rights (1)
Weighted-average exercise price of
outstandingoptions, warrants
and rights (2)
Number of securities remaining
available for future issuance
under equity compensation
plans (excluding securities reflected in column (a) (3))
Equity compensation plans approved by security holders .......... 2,143,710 $ 7.03 1,210,365
Equity compensation plans not approved by security holders .... — — —
(1) In addition to being available for future issuance in the form of options, 955,579 shares of our Class A common stock under our 2006 Stock Incentive Plan may instead be issued in the form of restricted stock units or other equity-based awards.
(2) The weighted average exercise price of outstanding options, warrants and rights excludes restricted stock units, which do not have an exercise price.
(3) Includes 254,786 shares of our Class A common stock issuable under our Amended and Restated 1997 Employee Stock Purchase Plan.
ITEM 13. CERTAIN RELATIONSHIPS AND RELATED TRANSACTIONS, AND DIRECTOR INDEPENDENCE
The information required by this Item will be contained in a Form 10-K/A that we intend to file with the Securities and ExchangeCommission within 120 days after the end of our fiscal year ended December 31, 2015 and is incorporated herein by reference.
ITEM 14. PRINCIPAL ACCOUNTANT FEES AND SERVICES
The information required by this Item will be contained in a Form 10-K/A that we intend to file with the Securities and ExchangeCommission within 120 days after the end of fiscal year ended December 31, 2015 and is incorporated herein by reference.

136
136
PART IV
ITEM 15. EXHIBITS AND FINANCIAL STATEMENT SCHEDULES
(a)(1) Consolidated Financial Statements included under Item 8. Report of Independent Registered Public Accounting Firm – RSM US LLP. Consolidated Balance Sheets as of December 31, 2015, December 31, 2014 and April 30, 2014. Consolidated Statements of Operations for fiscal year 2015, transition period 2014, fiscal year 2014 and fiscal year 2013. Consolidated Statements of Comprehensive Loss for fiscal year 2015, transition period 2014, fiscal year 2014 and fiscal
year 2013. Consolidated Statements of Stockholders’ Equity (Deficit) for fiscal year 2015, transition period 2014, fiscal year 2014 and
fiscal year 2013. Consolidated Statements of Cash Flows for fiscal year 2015, transition period 2014, fiscal year 2014 and fiscal year 2013. Notes to Consolidated Financial Statements.
(a)(2) Financial Statement Schedules: Schedule II – Valuation and Qualifying Accounts.
All other schedules have been omitted because the required information is not significant or is included in the consolidated financial statements or notes thereto, or is not applicable.
(a)(3) Exhibits: The Exhibits that are filed as part of this Annual Report on Form 10-K or that are incorporated by reference herein are set forth in the Exhibit Index hereto.

137 137
SIGNATURES
Pursuant to the requirements of the Securities Exchange Act of 1934, the Registrant has duly caused this report to be signed on its behalf by the undersigned, thereunto duly authorized.
CASELLA WASTE SYSTEMS, INC.
Dated: March 2, 2016 By: /s/ John W. Casella John W. Casella Chairman of the Board of Directors and Chief Executive Officer (Principal Executive Officer)
Pursuant to the requirements of the Securities Exchange Act of 1934, this report has been signed below by the following persons on behalf of the registrant and in the capacities and on the date indicated.
Signature Title Date
/s/ John W. Casella John W. Casella
Chairman of the Board of Directors and Chief Executive Officer (Principal Executive Officer)
March 2, 2016
/s/ Edmond R. Coletta Edmond R. Coletta
Senior Vice President and Chief Financial Officer (Principal Financial Officer)
March 2, 2016
/s/ Christopher B. Heald Christopher B. Heald
Vice President and Chief Accounting Officer (Principal Accounting Officer)
March 2, 2016
/s/ Douglas R. Casella Douglas R. Casella
Director March 2, 2016
/s/ Joseph G. Doody Joseph G. Doody
Director March 2, 2016
/s/ Gregory B. Peters Gregory B. Peters
Director March 2, 2016
/s/ James F. Callahan, Jr. James F. Callahan, Jr.
Director March 2, 2016
/s/ James E. O’Connor James E. O’Connor
Director March 2, 2016
/s/ William P. Hulligan William P. Hulligan
Director March 2, 2016
/s/ Michael K. Burke Michael K. Burke
Director March 2, 2016
/s/ Emily Nagle Green Emily Nagle Green
Director March 2, 2016

138138
FINANCIAL STATEMENT SCHEDULES
Schedule II Valuation Accounts
Allowance for Doubtful Accounts (in thousands)
Fiscal YearEnded
December 31,2015
Eight MonthsEnded
December 31,2014
Fiscal Year EndedApril 30,
2014 2013
Balance at beginning of period ........................................................................ $ 2,153 $ 1,672 $ 1,332 $ 740 Additions—charged to expense ....................................................................... 1,344 1,524 1,586 1,682 Deductions—bad debts written off, net of recoveries (2,509) (1,043) (1,246) (1,090)
Balance at end of period .................................................................................. $ 988 $ 2,153 $ 1,672 $ 1,332

139 139
EXHIBIT INDEX
ExhibitNo. Description
2.1 Agreement and Plan of Merger dated as of January 12, 1999 and as amended by Amendments No. 1, 2 and 3 thereto, among Casella Waste Systems, Inc. (“Casella”), KTI, Inc. (“KTI”) and Rutland Acquisition Sub, Inc. (incorporated herein by reference to Annex A to the registration statement on Form S-4 of Casella as filed November 12, 1999 (file no. 333-90913)).
2.2 Purchase and Sale Agreement dated as of January 23, 2011 among Casella, KTI, CE Holdings II, LLC and CE Holding Company, LLC (incorporated herein by reference to Exhibit 2.1 to the quarterly report on Form 10-Q of Casella as filed on March 3, 2011 (file no. 000-23211)).
2.3 Stock Purchase Agreement dated as of December 6, 2012 among Casella, Blow Bros., the stockholders of Blow Bros. named therein, Arthur E. St. Hilaire (solely in his capacity as the Representative), and Trash Lady, LLC and Trash Lady NH, LLC (incorporated herein by reference to Exhibit 10.1 to the current report on Form 8-K of Casella as filed on December 10, 2012 (file no. 000-23211)).
2.4 Membership Interest Purchase Agreement dated December 5, 2013, by and among Casella Waste Systems, Inc. and the other parties named therein (incorporated herein by reference to Exhibit 10.1 to the current report on Form 8-K of Casella as filed on December 5, 2013 (file no. 000-23211)).
3.1 Second Amended and Restated Certificate of Incorporation of Casella Waste Systems, Inc., as amended (incorporated herein by reference to Exhibit 3.1 to the quarterly report on Form 10-Q of Casella as filed on December 7, 2007 (file no. 000-23211)).
3.2 Third Amended and Restated By-Laws of Casella Waste Systems, Inc., as amended (incorporated herein by reference to Exhibit 3.1 to the current report on Form 8-K of Casella as filed on February 27, 2009 (file no. 000-23211)).
4.1 Form of stock certificate of Casella Class A common stock (incorporated herein by reference to Exhibit 4 to Amendment No. 2 to the registration statement on Form S-1 of Casella as filed on October 9, 1997 (file no. 333-33135)).
4.2 Certificate of Designation creating Series A Convertible Preferred Stock (incorporated herein by reference to Exhibit 4.1 to the current report on Form 8-K of Casella as filed on August 18, 2000 (file no. 000-23211)).
4.3 Indenture, dated February 7, 2011, by and among Casella, the Guarantors named therein and U.S. Bank National Association, as Trustee, governing the 7.75% Senior Subordinated Notes due 2019 (incorporated herein by reference to Exhibit 4.2 to the current report on Form 8-K of Casella as filed on February 8, 2011 (file no. 000-23211)).
4.4 Registration Rights Agreement, dated as of February 7, 2011, by and among Casella, Merrill Lynch, Pierce, Fenner & Smith Incorporated, J.P. Morgan Securities LLC, Credit Agricole Securities (USA) Inc. and Comerica Securities, Inc., relating to the 7.75% Senior Subordinated Notes due 2019 (incorporated herein by reference to Exhibit 99.1 to the current report on Form 8-K of Casella as filed on February 8, 2011 (file no. 000-23211)).
4.5 Registration Rights Agreement, dated October 9, 2012, by and among Casella, the Guarantors named therein and Merrill Lynch, Pierce, Fenner & Smith Incorporated, J.P. Morgan Securities LLC, Comerica Securities, Inc. and KeyBanc Capital Markets Inc., governing the 7.75% Senior Subordinated Notes due 2019 (incorporated herein by reference to Exhibit 10.1 to the current report on Form 8- K of Casella as filed on October 9, 2012 (file no. 000-23211)).
4.6 Form of 7.75% Senior Subordinated Notes due 2019 (incorporated herein by reference to Exhibit A to Exhibit 4.2 to the current report on Form 8-K of Casella as filed on February 8, 2011 (file no. 000-23211)).
4.7 FAME Financing Agreement, dated as of August 1, 2015, between Casella and the Finance Authority of Maine (incorporated herein by reference to Exhibit 4.1 to the current report on Form 8-K of Casella as filed on August 27, 2015 (file no. 000-23211)).
4.8 FAME Guaranty Agreement, dated as of August 1, 2015, by and between the guarantors named therein and U.S. Bank National Association, as trustee (incorporated herein by reference to Exhibit 4.2 to the current report on Form 8-K of Casella as filed on August 27, 2015 (file no. 000-23211)).
4.9 Loan Agreement, dated as of December 1, 2014, between New York State Environmental Facilities Corporation and Casella (incorporated herein by reference to Exhibit 4.1 to the current report on Form 8-K of Casella as filed on December 18, 2014 (file no. 000-23211)).

140140
ExhibitNo. Description
4.10 NYSEFC Guaranty Agreement, dated as of December 1, 2014, by and between the guarantors named therein and U.S. Bank National Association, as Trustee (incorporated herein by reference to Exhibit 4.2 to the current report on Form 8-K of Casella as filed on December 18, 2014 (file no. 000-23211)).
4.11 BFA Guaranty Agreement, dated as of October 1, 2014, by and among U.S. Bank National Association, as Trustee, and the guarantors identified therein (incorporated herein by reference to Exhibit 10.1 to the current report on Form 8-K of Casella as filed on October 16, 2014 (file no. 000-23211)).
4.12 Financing Agreement dated as of March 1, 2013 between Casella and the Vermont Economic Development Authority, relating to issuance of Vermont Economic Development Authority Solid Waste Disposal Revenue Bonds (incorporated herein by reference to Exhibit 10.1 to the current report on Form 8-K of Casella as filed April 5, 2013 (file no. 000-23211)).
4.13 VEDA Guaranty Agreement, dated as of March 1, 2013, by and among U.S. Bank National Association, as Trustee, and the guarantors identified therein (incorporated herein by reference to Exhibit 4.8 to the annual report on Form 10-K of Casella as filed on June 27, 2014 (file no. 000-23211)).
4.14 Financing Agreement dated as of March 1, 2013 between Casella and the Business Finance Authority of the State of New Hampshire, relating to issuance of Business Finance Authority of the State of New Hampshire Solid Waste Disposal Revenue Bonds (incorporated herein by reference to Exhibit 10.2 to the current report on Form 8-K of Casella as filed on April 5, 2013 (file no. 000-23211)).
4.15 Financing Agreement between Casella and Finance Authority of Maine, dated as of December 1, 2005, relating to issuance of Finance Authority of Maine Solid Waste Disposal Revenue Bonds (Casella Waste Services, Inc. Project) Series 2005 (incorporated herein by reference to Exhibit 10.1 to the current report on Form 8-K of Casella as filed on January 4, 2006 (file no. 000-23211)).
4.16 First Amendment dated as of January 29, 2012 to Financing Agreement dated as of December 1, 2005, by and among Finance Authority of Maine, U.S. Bank National Association, as Trustee, Bank of America, as Credit Provider, and Casella (incorporated herein by reference to Exhibit 10.1 to the quarterly report on Form 10-Q of Casella as filed on March 2, 2012 (file no. 000-23211)).
4.17 FAME Guaranty Agreement, dated as of January 29, 2012, by and among U.S. Bank National Association, as Trustee, and the guarantors identified therein (incorporated herein by reference to Exhibit 10.2 to the quarterly report on Form 10-Q of Casella as filed on March 2, 2012 (file no. 000-23211)).
10.1* 1997 Non-Employee Director Stock Option Plan (incorporated herein by reference to Exhibit 10.5 to Amendment No. 1 to the registration statement on Form S-1 of Casella as filed on September 24, 1997 (file no. 333-33135)).
10.2* Form of Nonstatutory Stock Option Agreement granted under the Amended and Restated 1997 Non-Employee Director Stock Option Plan (incorporated herein by reference to Exhibit 10.2 to the quarterly report on Form 10-Q of Casella as filed on September 9, 2004 (file no. 000-23211)).
10.3* Amended and Restated 1997 Stock Incentive Plan (incorporated herein by reference to Appendix 1 to the Definitive Proxy Statement on Schedule 14A of Casella as filed on September 21, 1998).
10.4* Form of Incentive Stock Option Agreement granted under the Amended and Restated 1997 Stock Incentive Plan (incorporated herein by reference to Exhibit 10.1 to the quarterly report on Form 10-Q of Casella as filed on September 9, 2004 (file no. 000-23211)).
10.5 Lease Agreement, as Amended, between Casella Associates and Casella Waste Management, Inc., dated August 1, 1993 (Rutland lease) (incorporated herein by reference to Exhibit 10.17 to the registration statement on Form S-1 of Casella as filed on August 7, 1997 (file no. 333-33135)).
10.6 Second Amendment to Lease Agreement, by and between Casella Associates and Casella Waste Management, Inc., dated as of November 20, 1997 (Rutland lease). (incorporated herein by reference to Exhibit 10.25 to the registration statement on Form S-1 of Casella as filed on June 25, 1998 (file no. 333-57745)).
10.7 Amendment to Lease Agreement dated as of March 13, 2008, between Casella Associates and Casella, amending Lease Agreement dated August 1, 1993, as amended (Rutland lease) (incorporated herein by reference to Exhibit 10.7 to the annual report on Form 10-K of Casella as filed on June 27, 2014 (file no. 000-23211)).

141 141
ExhibitNo. Description
10.8 Lease Agreement, as Amended, between Casella Associates and Casella Waste Management, Inc., dated August 1, 1993 (Montpelier lease) (incorporated herein by reference to Exhibit 10.18 to the registration statement on Form S-1 of Casella as filed on August 7, 1997 (file no. 333-33135)).
10.9 Amendment to Lease Agreement dated as of March 13, 2008, between Casella Associates and Casella, amending Lease Agreement dated August 1, 1993, as amended (Montpelier lease) (incorporated herein by reference to Exhibit 10.9 to the annual report on Form 10-K of Casella as filed on June 27, 2014 (file no. 000-23211)).
10.10 Lease, Operations and Maintenance Agreement between CV Landfill, Inc. and Casella Waste Systems, Inc. dated June 30, 1994 (incorporated herein by reference to Exhibit 10.20 to the registration statement on Form S-1 of Casella as filed on August 7, 1997 (file no. 333-33135)).
10.11* Employment Agreement between Casella and John W. Casella dated December 8, 1999 (incorporated herein by reference to Exhibit 10.43 to the annual report on Form 10-K of Casella as filed on August 4, 2000 (file no. 000-23211)).
10.12* Amendment to Employment Agreement by and between Casella and John W. Casella dated as of December 30, 2008 (incorporated herein by reference to Exhibit 10.3 to the quarterly report on Form 10-Q of Casella as filed on March 6, 2009 (file no. 000-23211)).
10.13+* 2006 Stock Incentive Plan, as amended.
10.14* Form of Incentive Stock Option Agreement granted under 2006 Stock Incentive Plan (incorporated herein by reference to Exhibit 10.14 to the annual report on Form 10-K of Casella as filed on June 27, 2014 (file no. 000-23211)).
10.15* Form of Restricted Stock Agreement granted under 2006 Stock Incentive Plan (incorporated herein by reference to Exhibit 10.15 to the annual report on Form 10-K of Casella as filed on June 27, 2014 (file no. 000-23211)).
10.16* Form of Restricted Share Unit Agreement granted under 2006 Stock Incentive Plan (employee with employment contract) (incorporated herein by reference to Exhibit 10.16 to the annual report on Form 10-K of Casella as filed on June 27, 2014 (file no. 000-23211)).
10.17* Form of Restricted Share Unit Agreement granted under 2006 Stock Incentive Plan (employee with no employment contract) (incorporated herein by reference to Exhibit 10.17 to the annual report on Form 10-K of Casella as filed on June 27, 2014 (file no. 000-23211)).
10.18* Form of Restricted Stock Unit Agreement granted under 2006 Stock Incentive Plan (employee with employment contract) (incorporated herein by reference to Exhibit 10.18 to the annual report on Form 10-K of Casella as filed on June 27, 2014 (file no. 000-23211)).
10.19* Form of Restricted Stock Unit Agreement granted under 2006 Stock Incentive Plan (employee with no employment contract) (incorporated herein by reference to Exhibit 10.19 to the annual report on Form 10-K of Casella as filed on June 27, 2014 (file no. 000-23211)).
10.20* Form of Performance Share Unit Agreement granted under 2006 Stock Incentive Plan (incorporated herein by reference to Exhibit 10.2 to the quarterly report on Form 10-Q of Casella as filed on September 4, 2008 (file no. 000-23211)).
10.21 Amended and Restated Credit Agreement, dated as of March 18, 2011, by and among Bank of America, N.A., as Administrative Agent, Bank of America, N.A., as Lender, and the other lenders party thereto, Casella and Casella’s subsidiaries identified therein (incorporated herein by reference to Exhibit 10.1 to the current report on Form 8-K of Casella as filed on March 24, 2011 (file no. 000-23211)).
10.22 First Amendment to Amended and Restated Credit Agreement and Consent, dated as of April 27, 2012, by and among Casella, Bank of America, N.A., as Administrative Agent, Swing Line Lender and L/C Issuer, and the Lenders party thereto (incorporated herein by reference to Exhibit 10.50 to the annual report on Form 10-K of Casella as filed on June 28, 2012 (file no. 000-23211)).
10.23 Second Amendment to Amended and Restated Credit Agreement and Consent, dated as of September 20, 2012, by and among Casella, Bank of America, N.A., as Administrative Agent, Swing Line Lender and LIC Issuer, and the Lenders party thereto (incorporated herein by reference to Exhibit 10.3 to the quarterly report on Form 10-Q of Casella as filed on December 4, 2012 (file no. 000-23211)).
10.24 Third Amendment to Amended and Restated Credit Agreement, dated as of June 25, 2013, by and among Casella, Bank of America, N.A., as Administrative Agent, Swing Line Lender and LIC Issuer, and the Lenders party thereto (incorporated herein by reference to Exhibit 10.1 to the current report on Form 8- K of Casella as filed on June 26, 2013 (file no. 000-23211)).

142142
ExhibitNo. Description
10.25 Loan and Security Agreement, dated as of February 27, 2015, among Casella, the subsidiaries of Casella identified therein and Bank of America, N.A., as agent for the lenders party thereto (incorporated herein by reference to Exhibit 10.1 to the current report on Form 8-K of Casella as filed on March 3, 2015 (file no. 00-23211)).
10.26 First Amendment to Loan and Security Agreement, dated as of June 26, 2015, by and among Casella, its subsidiaries listed in Schedule 1 to the Loan and Security Agreement, dated as of February 27, 2015, the lenders from time to time party thereto, and Bank of America, N.A., as Agent (incorporated herein by reference to Exhibit 10.1 to the current report on Form 8-K of Casella as filed on March 3, 2015 (file no. 00-23211)).
10.27* Employment Agreement between Casella and Edwin D. Johnson dated as of July 6, 2010 (incorporated herein by reference to Exhibit 10.1 to the quarterly report on Form 10-Q of Casella as filed on September 3, 2010 (file no. 000-23211)).
10.28* Letter Agreement between Casella and Edwin D. Johnson dated as of February 12, 2013 (incorporated herein by reference to Exhibit 10.26 to the annual report on Form 10-K of Casella as filed on June 27, 2014 (file no. 000-23211)).
10.29* Employment Agreement between Casella and David L. Schmitt dated as of May 31, 2006, as amended (incorporated herein by reference to Exhibit 10.27 to the annual report on Form 10-K of Casella as filed on June 27, 2014 (file no. 000-23211)).
10.30* Employment Agreement between Casella and Edmond Coletta dated as of September 1, 2012 (incorporated herein by reference to Exhibit 10.28 to the annual report on Form 10-K of Casella as filed on June 27, 2014 (file no. 000-23211)).
10.31 Extension of Lease Agreements dated as of April 23, 2013, between Casella Associates and Casella, amending (i) Lease Agreement dated August 1, 1993, as amended (Montpelier lease) and (ii) Lease Agreement dated August 1, 1993, as amended (Rutland lease) (incorporated herein by reference to Exhibit 10.29 to the annual report on Form 10-K of Casella as filed on June 27, 2014 (file no. 000-23211)).
12.1 + Statement of Computation of Ratio of Earnings to Fixed Charges and Earnings to Combined Fixed Charges and Preferred Stock Dividends.
21.1 + Subsidiaries of Casella Waste Systems, Inc.
23.1 + Consent of RSM US LLP
31.1 + Certification of Principal Executive Officer required by Rule 13a-14(a) or Rule 15d-14(a) of the Securities Exchange Actof 1934, as amended.
31.2 + Certification of Principal Financial Officer required by Rule 13a-14(a) or Rule 15d-14(a) of the Securities Exchange Actof 1934, as amended.
32.1 + Certification of Chief Executive Officer and Chief Financial Officer pursuant to 18 U.S.C. Section 1350, as adopted pursuant to Section 906 of the Sarbanes- Oxley Act of 2002.
101.INS XBRL Instance Document.**
101.SCH XBRL Taxonomy Extension Schema Document.**
101.CAL XBRL Taxonomy Calculation Linkbase Document.**
101.LAB XBRL Taxonomy Label Linkbase Document.**
101.PRE XBRL Taxonomy Presentation Linkbase Document.**
101.DEF XBRL Taxonomy Extension Definition Linkbase Document.**
+ Filed herewith * This is a management contract or compensatory plan or arrangement. ** Submitted Electronically Herewith. Attached as Exhibit 101 to this report are the following formatted in XBRL (Extensible
Business Reporting Language): (i) Consolidated Balance Sheets as of December 31, 2015, December 31, 2014 and April 30, 2014, (ii) Consolidated Statements of Operations for fiscal year 2015, transition period 2014, fiscal year 2014 and fiscal year2013, (iii) Consolidated Statements of Comprehensive Loss for fiscal year 2015, transition period 2014, fiscal year 2014 and fiscal year 2013, (iv) Consolidated Statement of Stockholders’ Equity (Deficit) for fiscal year 2015, transition period 2014, fiscal year 2014 and fiscal year 2013, (v) Consolidated Statements of Cash Flows for fiscal year 2015, transition period 2014, fiscal year 2014 and fiscal year 2013, and (vi) Notes to Consolidated Financial Statements.

143
NON-GAAP FINANCIAL MEASURESIn addition to disclosing financial results prepared in accordance with Generally Accepted Accounting Principles in the United States (“GAAP”), the company also discloses earnings before interest, taxes, and depreciation and amortization, adjusted for accretion, depletion of landfill operating lease obligations, gains on asset sales, development project charge write-offs, contract settlement charges, legal settlement costs, tax settlement costs, bargain purchase gains, asset impairment charges, environmental remediation charges, severance and reorganization costs, expenses from divestiture, acquisition and financing costs, gains on the settlement of acquisition related contingent consideration, fiscal year-end transition costs, proxy contest costs, as well as impacts from divestiture transactions (“Adjusted EBITDA”), which is a non-GAAP measure.
The company also discloses net cash provided by operating activities, less capital expenditures (excluding acquisition related capital expenditures), less payments on landfill operating lease contracts, plus proceeds from divestiture transactions, plus proceeds from the sale of property and equipment, plus proceeds from property insurance settlements, less contributions from (distributions to) noncontrolling interest holders (“Free Cash Flow”), which is a non-GAAP measure.
Adjusted EBITDA is reconciled to net loss, while Free Cash Flow is reconciled to net cash provided by operating activities. The company presents Adjusted EBITDA and Free Cash Flow, because it considers them important supplemental measures of its performance and believes they are frequently used by securities analysts, investors and other interested parties in the evaluation of the company’s results. Management uses these non-GAAP measures to further understand the company’s “core operating performance.” The company believes its “core operating performance” is helpful in understanding its ongoing performance in the ordinary course of operations. The company believes that providing Adjusted EBITDA and Free Cash Flow to investors, in addition to corresponding income statement and cash flow statement measures, affords investors the benefit of viewing its performance using the same financial metrics that the management team uses in making many key decisions and understanding how the core business and its results of operations has performed. The company further believes that providing this information allows its investors greater transparency and a better understanding of its core financial performance. In addition, the instruments governing the company’s indebtedness use EBITDA (with additional adjustments) to measure its compliance with financial covenants and to determine the applicable margin.
Non-GAAP financial measures are not in accordance with or an alternative for GAAP. Adjusted EBITDA and Free Cash Flow should not be considered in isolation from or as a substitute for financial information presented in accordance with GAAP, and may be different from Adjusted EBITDA or Free Cash Flow presented by other companies.

144

145
COMPANY OFFICERSJohn W. CasellaChairman, Chief Executive Officer & Secretary
Edmond “Ned” R. ColettaSenior Vice President, Chief Financial Officer & Treasurer
Edwin D. JohnsonPresident & Chief Operating Officer
David L. SchmittSenior Vice President & General Counsel
Christopher B. HealdVice President of Finance & Chief Accounting Officer
BOARD OF DIRECTORSJohn W. CasellaChairman, Chief Executive Officer & Secretary
Michael K. BurkeSenior Financial Executive
James F. Callahan, Jr.Retired Partner, Arthur Andersen, LLP
Douglas R. CasellaVice Chairman, President, Casella Construction, Inc.
Joseph G. DoodyVice Chairman, Staples, Inc.
Emily N. GreenSenior Business Executive
William P. HulliganRetired President & Chief Operating Officer, Progressive Waste Solutions Ltd.
James E. O’ConnorRetired Chairman & Chief Executive Officer, Republic Services, Inc.
Gregory B. PetersManaging General Partner, Lake Champlain Capital Management, LLC

146
SHAREHOLDER INFORMATION
SAFE HARBOR STATEMENTCertain matters discussed in this annual report, including, but not limited to, the statements regarding financial results and guidance, are "forward-looking statements" intended to qualify for the safe harbors from liability established by the Private Securities Litigation Reform Act of 1995. These forward-looking statements can generally be identified as such by the context of the statements, including words such as “believe,” “expect,” “anticipate,” “plan,” “may,” “would,” “intend,” “estimate,” “guidance” and other similar expressions, whether in the negative or affirmative. These forward-looking statements are based on current expectations, estimates, forecasts and projections about the industry and markets in which we operate and management’s beliefs and assumptions. We cannot guarantee that we actually will achieve the financial results, plans, intentions, expectations or guidance disclosed in the forward-looking statements made. Such forward-looking statements, and all phases of our operations, involve a number of risks and uncertainties, any one or more of which could cause actual results to differ materially from those described in our forward-looking statements. Such risks and uncertainties include or relate to, among other things: adverse weather conditions that have negatively impacted and may continue to negatively impact our revenues and our operating margin; current economic conditions that have adversely affected and may continue to adversely affect our revenues and our operating margin; we may be unable to increase volumes at our landfills or improve our route profitability; our need to service our indebtedness may limit our ability to invest in our business; we may be unable to reduce costs or increase pricing or volumes sufficiently to achieve estimated Adjusted EBITDA and other targets; landfill operations and permit status may be affected by factors outside our control; groundwater contamination discovered near our Southbridge landfill may delay our permitting activities at that landfill and result in costs and liabilities as well as impacting our disposal revenues at that site, each of which could impact our results of operations; we may be required to incur capital expenditures in excess of our estimates; fluctuations in energy pricing or the commodity pricing of our recyclables may make it more difficult for us to predict our results of operations or meet our estimates; we may incur environmental charges or asset impairments in the future; and actions of activist investors could require us to incur cost and disruption in responding to those actions. There are a number of other important risks and uncertainties that could cause our actual results to differ materially from those indicated by such forward-looking statements. These additional risks and uncertainties include, without limitation, those detailed in Item 1A, “Risk Factors” in our Form 10-K for the fiscal year ended December 31, 2015.
We undertake no obligation to update publicly any forward-looking statements whether as a result of new information, future events or otherwise, except as required by law.
Annual Meeting of ShareholdersKillington Grand HotelKillington, VTThursday, November 17, 201610:00 a.m.
Casella Waste Systems, Inc.25 Greens Hill LaneRutland, VT 05701Telephone: (802) 775-0325
Direct inquiries to:Ned ColettaTelephone: (802) 772-2239E-mail: [email protected]
AuditorsRSM US LLP80 City SquareBoston, MA 02129
Legal CounselWilmer Cutler Pickering Hale and Dorr LLP60 State StreetBoston, MA 02109
Transfer Agent & RegistrarComputersharePO Box 43078Providence, RI 02940-3078Shareholder Inquiries:(781) 575-2879
Stock ExchangeCasella Waste System, Inc.is traded on the NASDAQGlobal Select Market underthe ticker symbol “CWST.”

(THIS PAGE WAS INTENTIONALLY LEFT BLANK)

25 Greens Hill Lane • Rutland, Vermont 05701 p. 802.775.0325 • f. 802.775.6198
casella.com
CREATING CUSTOMER VALUE
TRUST
PROVIDE CUSTOMER VALUE
RESOURCE MANAGEMENT
ALIGNMENT
TOTAL SHAREHOLDER RETURNS
GROWTH
ECONOMIC VALUE ADDED
CORE BUSINESS FOCUSSOURCE REDUCTION
LEVERAGING BEST PRACTICES TO DELIVER VALUABLE SOLUTIONS
RECYCLING/REUSE PARTNERSHIP
ANAEROBIC DIGESTION COMMODITY MARKETS
BIOSOLIDSCREATE
VALUE
SAFECNGFUELNH LOCAL
GOALSWELL-RUN
GREENGOVERNANCE
ZERO-SORT® RECYCLINGALIGNED INCENTIVES WITH SHAREHOLDERS RESOURCE RECOVERY
COST EFFICIENCIES
INTEGRITYVALUE-ADDED RESOURCE SOLUTIONS
STRATEGIC EXECUTION
STRATEGIC PARTNERSHIPS
ALKALINE STABILIZATION
STANDARDIZED TRUCK FLEET
VIEWING WASTE AS RESOURCES
REUSE
SUSTAINABILITY/RECYCLING ADJUSTMENTCONTINUOUS IMPROVEMENT OPERATIONAL EFFICIENCY
ALTERNATIVE FUEL CONSUMPTION
COLLECTION
GHG FOOTPRINTON-SITE PERSONNEL AND EQUIPMENT
ORGANICSFOUNDATIONTALENT
EARTHLIFE® PRODUCTS
OPTIMIZED WASTE COMPACTIONCUSTOMIZED DIVERSION PROGRAMS RECOVER AND TRANSFORM
LEADERSHIP SKILLSCIRCULAR ECONOMY
MARKET LEADERSHIP
PROSPER
HELP OTHERS MILESTONESCOMMUNITY INVOLVEMENT
TARGETS AND INITIATIVES
ROUTE OPTIMIZATION
WASTE STREAM
CREATIVE AND PRACTICAL SOLUTIONSPUTTING WASTE TO WORK
ORGANICS RECYCLING FINANCIAL GOALS
TIN
CARBON FOOTPRINT REDUCTIONGIVING RESOURCES NEW LIFE
BE CONSISTENT IMPROVING OUR ENVIRONMENTAL IMPACTCREATING VALUE EVERY DAYPRIDE
NET PRODUCER OF ELECTRICITY
ZERO WASTE CYCLE
RESOURCE RENEWAL VISION
LANDFILL HEAT RECOVERY
ENVIRONMENTAL PROTECTION
HOMEGROWN PERSPECTIVE ON SUSTAINABILITY
LOW EMISSION LANDFILLS