2013 economic impact of domestic travel in virginia
TRANSCRIPT
The Economic Impact of Domestic Travel
On Virginia Counties 2013
A Study Prepared For Virginia Tourism Authority
Doing Business as Virginia Tourism Corporation
By the U.S. Travel Association
August 2014
Preface
PREFACE This study was conducted by the Research Department of the U.S. Travel Association for the Virginia Tourism Corporation. The study presents 2013 domestic travel economic impact on Virginia State and its 134 counties and independent cities (county equivalents). Estimates include travel expenditures, travel-generated employment and payroll income, as well as tax revenues for federal, state and local government. For the purpose of comparison, 2012 impact data are displayed in this report.
U.S. Travel Association Washington, D.C.
August 2014
Table of Contents
TABLE OF CONTENTS INTRODUCTION ....................................................................................................................................................... 1
EXECUTIVE SUMMARY ......................................................................................................................................... 2
NATIONAL SUMMARY 2013 .................................................................................................................................. 3
U.S. TRAVEL VOLUME IN 2013.................................................................................................................................. 4 TRAVEL EXPENDITURES IN 2013 ............................................................................................................................... 5 TRAVEL EMPLOYMENT IN 2013 ................................................................................................................................. 7
DIRECT TRAVEL IMPACT ON THE UNITED STATES IN 2013 ...................................................................... 9
DOMESTIC TRAVEL IMPACT ON VIRGINIA .................................................................................................. 11
TRAVEL EXPENDITURES .................................................................................................................................. 12 TRAVEL-GENERATED EMPLOYMENT ........................................................................................................... 15 TRAVEL-GENERATED PAYROLL .................................................................................................................... 19 TRAVEL-GENERATED TAX REVENUES ......................................................................................................... 21
DOMESTIC TRAVEL IMPACT ON VIRGINIA COUNTIES AND INDEPENDENT CITIES (COUNTY EQUIVALENTS) – 2013 ........................................................................................................................................... 23
COUNTY (CITY) TABLES...................................................................................................................................... 25
APPENDICES ............................................................................................................................................................ 46
APPENDIX A: TRAVEL ECONOMIC IMPACT MODEL ................................................................................................. 47 APPENDIX B: GLOSSARY OF TERMS – TEIM ........................................................................................................... 50 APPENDIX C: TRAVEL-RELATED INDUSTRY BY NAICS .......................................................................................... 51 APPENDIX D: MAJOR INDUSTRY SECTORS IN THE U.S. ECONOMY BY NAICS ........................................................ 52 APPENDIX E: SOURCES OF DATA ............................................................................................................................. 53

List of Tables
LIST OF TABLES
Table 1: Overall U.S. Economic Indicators, 2011-2013 .............................................................................. 4
Table 2: Travel Expenditures - U.S. Nationwide .......................................................................................... 6
Table 3: Travel Generated Employment - U.S. Nationwide ......................................................................... 7
Table 4: U.S. Travel Forecasts ..................................................................................................................... 8
Table 5: Domestic Travel Expenditures in Virginia by Industry Sector, 2012-2013 .................................. 13
Table 6: Domestic Travel-Generated Employment in Virginia by Industry Sector, 2012-2013 ................. 16
Table 6a: Top Six Non-farm Industries by Employment ............................................................................. 17
Table 7: Domestic Travel-Generated Payroll in Virginia by Industry Sector, 2012-2013......................... 20
Table 8: Domestic Travel-Generated Tax Revenue in Virginia by level of Government, 2012-2013 ........ 22
Table 9: Domestic Travel Impact in Virginia - Top 5 Counties (Cities*), 2012-2013 ............................... 24
Table A: Alphabetical by County (City*), 2013 ......................................................................................... 26
Table B: Ranking of Counties (Cities*) by Expenditure Levels, 2013 ........................................................ 30
Table C: Percent Distribution by County (City*), 2013 ............................................................................. 34
Table D: Percent Change From 2012 ........................................................................................................ 38
Table E: Alphabetical by County (City*), 2012 .......................................................................................... 42
Introduction
1
INTRODUCTION This report presents preliminary 2013 estimates of the impact of traveler spending by U.S. residents in the Commonwealth of Virginia and its 134 counties and independent cities (county equivalents), as well as the employment, payroll income and tax revenue directly generated by the spending. In addition, the multiplier impact of travel spending in Virginia is included. For the purpose of comparison, 2012 impact data are also in this report. Traveler spending, travel-generated payroll and tax revenue are calculated in current dollars. All estimates of the economic impact of travel contained in this volume are the product of the U.S. Travel Association's Travel Economic Impact Model (TEIM), a proprietary economic model developed expressly to indicate the expenditures, employment, payroll, and tax revenue generated by travel away from home in the United States. The TEIM was created to capture the highly complex nature of the U.S. travel industry at national, regional, state and local levels. The TEIM was designed so that economic impact estimates could be compared across all fifty states and the District of Columbia, thereby allowing states and localities to assess their market share nationally, regionally or within the state. The domestic component of TEIM is based on national surveys conducted by the U.S. Travel Association and other travel-related data developed by the U.S. Travel Association, various federal agencies, state government, and private travel organizations each year. A summary of the methodology is provided in Appendix B. U.S. residents traveling in Virginia include both state residents and out-of-state visitors traveling away from home overnight in paid accommodations, or on any overnight and day trips to places 50 miles or more away from home. Commuting to and from work; travel by those operating an airplane, bus, truck, train or other form of common carrier transportation; military travel on active duty; and travel by students away at school are all excluded from the model. In addition, the payroll and employment estimates represent impact generated in the private sector and exclude government supported payroll and employment. Since additional data relating to travel and its economic impact in 2013 will become available subsequent to this study, the U.S. Travel Association reserves the right to revise these estimates in the future.
Executive Summary
2
EXECUTIVE SUMMARY Domestic travel expenditures increased 1.4% percent to $21.5 billion in 2013, not adjusted
by inflation.
Domestic travel expenditures directly supported 213,000 jobs within Virginia in 2013, comprising 7.0 percent of total private industry employment in Virginia. The travel industry is the fifth largest private employer in Virginia.
On average, every $100,998 spent by domestic travelers in Virginia during 2013 supported one job.
Domestic travel supported employees in Virginia earned nearly $4.9 billion in payroll
income during 2013, representing a 3.6 percent increase from 2012. Domestic travel in Virginia directly generated more than $2.8 billion in tax revenue for
federal, state and local governments in 2013, up 3.6 percent from 2012. Arlington County received more than to $2.8 billion in domestic travel expenditures leading
all of Virginia’s 134 counties and independent cities. Fairfax County followed Arlington County closely, ranking second with $2.7 billion. Loudoun County ranked third with $1.5 billion.
Forty-one of Virginia’s 134 counties and independent cities received over $100 million in
domestic travel expenditures in 2013. Forty-one counties and independent cities in Virginia realized one thousand or more jobs that
were directly supported by domestic travelers during 2013.
National Summary 2013
3
NATIONAL SUMMARY 2013
The U.S. recovery grew at a moderate pace in the first part of 2013 before achieving more robust economic growth in the second part. Real GDP in the United States (in chained 2009 dollars) increased 2.2 percent annually in 2013, slightly slower than the 2.3 percent increase in 2012. However, when looking at the year as two halves, one can see that the first two quarters were rebounds from a sputtering end of 2012, and the last two quarters highlighted stronger growth particularly in business investment and exports. For the year overall, consumer spending and service exports grew faster in 2013 than in 2012. These improvements, however, were more than offset by decelerations in investment spending and goods exports. As a result, the pace of real GDP growth in 2013 was only slightly slower than in 2012, despite the negative impacts of the third quarter government shutdown. The U.S. employment situation continued to improve as well: non-farm employment increased by 2.3 million to 136 million jobs, with total travel-related employment counted at 14.9 million in 2013. This indicates that one in nine U.S. non-farm jobs directly or indirectly relies on the travel industry. This includes 7.9 million jobs directly supported by traveler spending in 2013, and 7.0 million jobs supported by secondary effects of traveler spending, be it through indirect (e.g., utility use for restaurants) or induced (e.g., spending from travel industry employees) means. The Consumer Price Index (CPI) rose 1.5 percent in 2013 and U.S. Travel Association’s Travel Price Index (TPI) increased at 0.9 percent during the same period. Decreased motor fuel price during 2013 is the major reason why the TPI grew at a slower rate than CPI. U.S. economic growth slowed in the first quarter of 2014. Real GDP, in chained 2009 dollar, contracted by 2.1 percent (annualized) in the first quarter of 2014, a drop from the 3.5 percent increase in the fourth quarter of 2013. The primary reasons for this contraction were the polar vortex freezing consumer spending, downward revisions to government spending after the less-than-stellar rollout of the Affordable Care Act, and downward adjustments in business inventories. However, consumer spending in services has remained strong. Through the first seven months of 2014, the unemployment rate decreased to 6.1 percent in July, and a total of nearly 1.5 million jobs have been added since December 2013. In July 2014, both CPI and TPI increased 2.0 percent compared with July 2013; air fare decreased 0.2 percent and motor fuel prices increased 1.0 percent and during the same period.
National Summary 2013
4
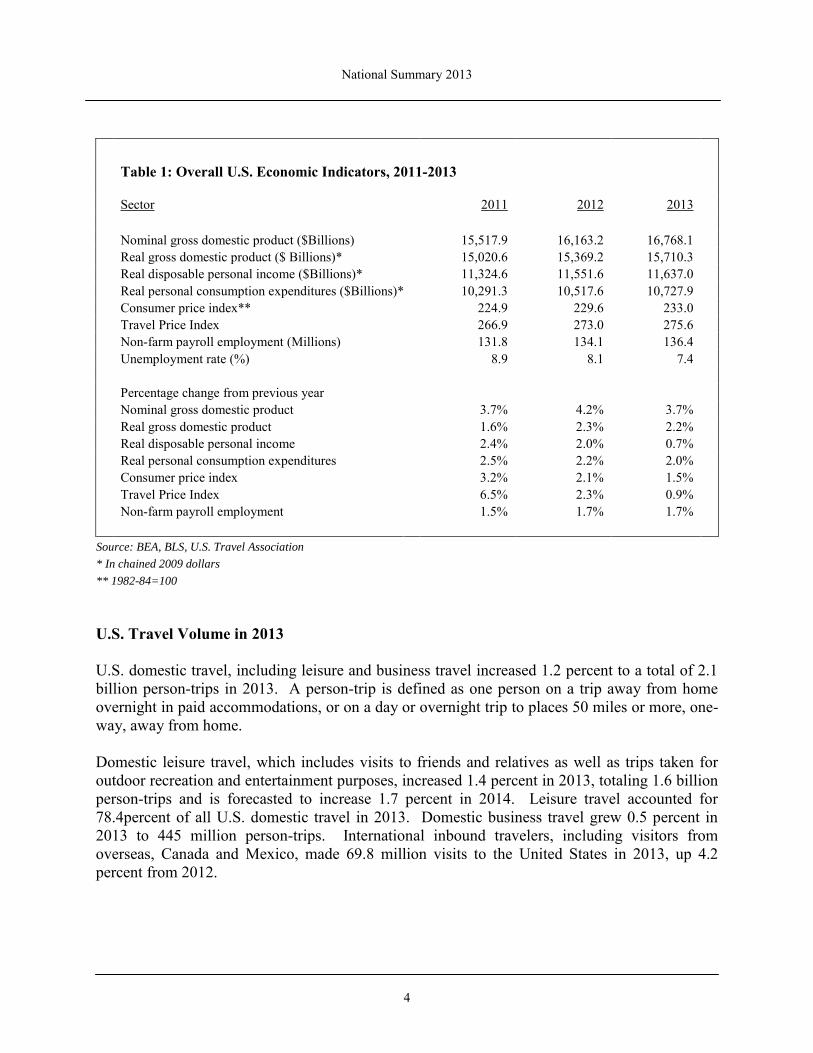
Table 1: Overall U.S. Economic Indicators, 2011-2013
Sector 2011 2012 2013 Nominal gross domestic product ($Billions) 15,517.9 16,163.2 16,768.1 Real gross domestic product ($ Billions)* 15,020.6 15,369.2 15,710.3 Real disposable personal income ($Billions)* 11,324.6 11,551.6 11,637.0 Real personal consumption expenditures ($Billions)* 10,291.3 10,517.6 10,727.9 Consumer price index** 224.9 229.6 233.0 Travel Price Index 266.9 273.0 275.6 Non-farm payroll employment (Millions) 131.8 134.1 136.4 Unemployment rate (%) 8.9 8.1 7.4 Percentage change from previous year Nominal gross domestic product 3.7% 4.2% 3.7% Real gross domestic product 1.6% 2.3% 2.2% Real disposable personal income 2.4% 2.0% 0.7% Real personal consumption expenditures 2.5% 2.2% 2.0% Consumer price index 3.2% 2.1% 1.5% Travel Price Index 6.5% 2.3% 0.9% Non-farm payroll employment 1.5% 1.7% 1.7%
Source: BEA, BLS, U.S. Travel Association
* In chained 2009 dollars
** 1982-84=100
U.S. Travel Volume in 2013 U.S. domestic travel, including leisure and business travel increased 1.2 percent to a total of 2.1 billion person-trips in 2013. A person-trip is defined as one person on a trip away from home overnight in paid accommodations, or on a day or overnight trip to places 50 miles or more, one-way, away from home. Domestic leisure travel, which includes visits to friends and relatives as well as trips taken for outdoor recreation and entertainment purposes, increased 1.4 percent in 2013, totaling 1.6 billion person-trips and is forecasted to increase 1.7 percent in 2014. Leisure travel accounted for 78.4percent of all U.S. domestic travel in 2013. Domestic business travel grew 0.5 percent in 2013 to 445 million person-trips. International inbound travelers, including visitors from overseas, Canada and Mexico, made 69.8 million visits to the United States in 2013, up 4.2 percent from 2012.
National Summary 2013
5
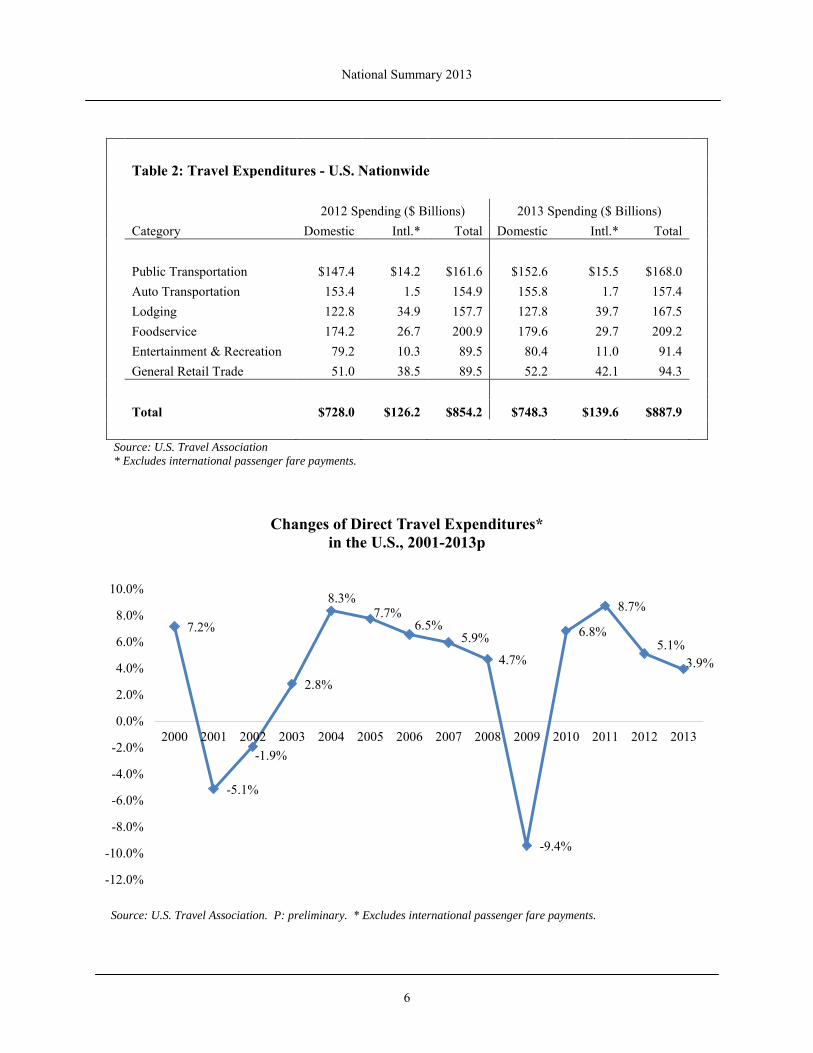
Travel Expenditures in 2013 Domestic and international travel spending in the U.S. totaled $887.9 billion, a 3.9 percent increase from 2012. Leisure traveler spending totaled $621.4 billion-and grew by 4.3 percent from 2012. Business travelers’ spending increased 3.2 percent over 2012 to $266.5 billion in 2013. Of this total, meeting and convention travelers spent $105.4 billion. Domestic travelers directly spent $748.3 billion in 2013, a 2.8 percent increase from 2012. This was the slowest increase during the current recovery period following the 2009 recession. Slower growth in 2013 was due to more moderate increases in both travel volume and travel prices than in prior years. Domestic travel expenditures are expected to accelerate in 2014 and increase 4.8 percent. International travelers spent $139.6 billion in the U.S. during 2013, up 10.6 percent from 2012. In addition, international travelers paid a total of $41.6 billion to U.S. air carriers on international passenger fares in 2012, an increase of 5.8 percent from 2012. As a result, a $57.1 billion travel trade surplus was generated in 2013, the largest surplus in the past 50 years and $9.7 billion greater than the 2012 travel trade surplus. Without the travel trade surplus, the U.S. trade balance deficit would be 12% higher than its current $474.9 billion. International traveler spending in the U.S. is estimated to increase 4.3 percent in 2014. Increasing for a fourth consecutive year, real travel spending (in chained 2009 dollars) rose 3.0 percent in 2013. The price of travel goods and services increased only slightly in 2013 (0.9%), according to the U.S. Travel Association’s Travel Price Index (TPI). Motor fuel prices declined from previous year for the first year since 2010. The TPI is expected to increase 1.7 in 2014.
National Summary 2013
6
Table 2: Travel Expenditures - U.S. Nationwide 2012 Spending ($ Billions) 2013 Spending ($ Billions) Category Domestic Intl.* Total Domestic Intl.* Total Public Transportation $147.4 $14.2 $161.6 $152.6 $15.5 $168.0 Auto Transportation 153.4 1.5 154.9 155.8 1.7 157.4 Lodging 122.8 34.9 157.7 127.8 39.7 167.5 Foodservice 174.2 26.7 200.9 179.6 29.7 209.2 Entertainment & Recreation 79.2 10.3 89.5 80.4 11.0 91.4 General Retail Trade 51.0 38.5 89.5 52.2 42.1 94.3 Total $728.0 $126.2 $854.2 $748.3 $139.6 $887.9 Source: U.S. Travel Association * Excludes international passenger fare payments.
Source: U.S. Travel Association. P: preliminary. * Excludes international passenger fare payments.
7.2%
-5.1%
-1.9%
2.8%
8.3% 7.7%
6.5% 5.9%
4.7%
-9.4%
6.8%
8.7%
5.1% 3.9%
-12.0%
-10.0%
-8.0%
-6.0%
-4.0%
-2.0%
0.0%
2.0%
4.0%
6.0%
8.0%
10.0%
2000 2001 2002 2003 2004 2005 2006 2007 2008 2009 2010 2011 2012 2013
Changes of Direct Travel Expenditures* in the U.S., 2001-2013p
National Summary 2013
7
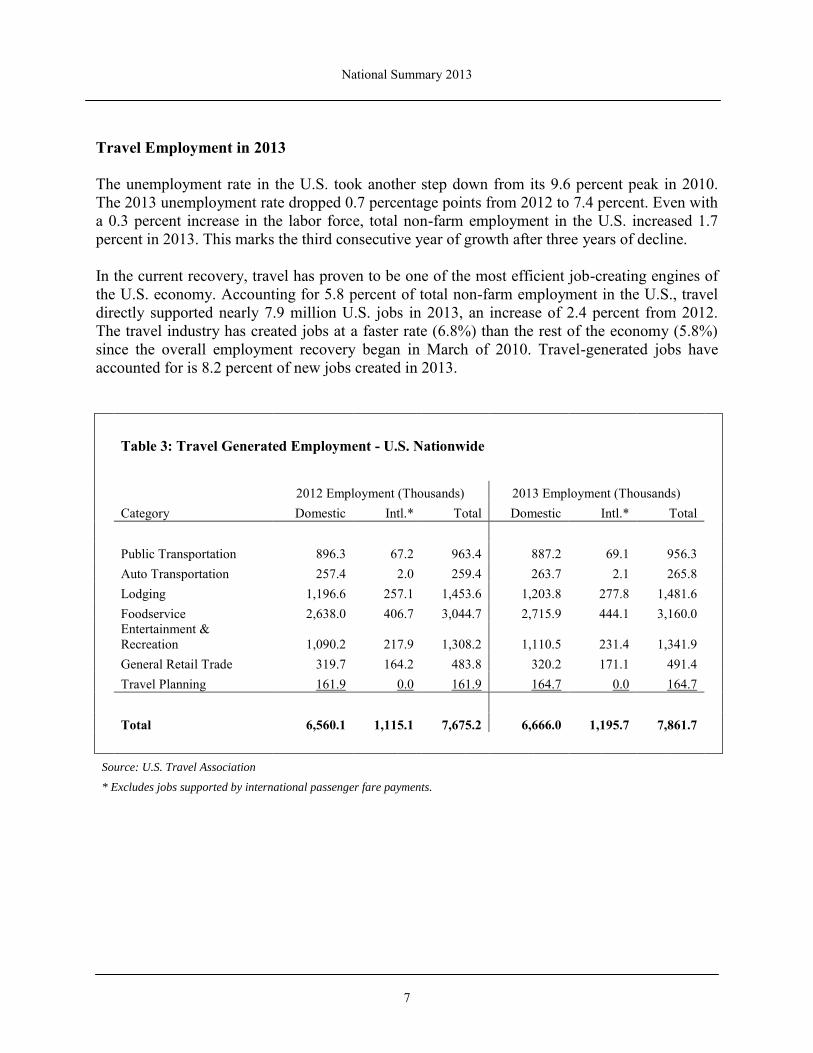
Travel Employment in 2013 The unemployment rate in the U.S. took another step down from its 9.6 percent peak in 2010. The 2013 unemployment rate dropped 0.7 percentage points from 2012 to 7.4 percent. Even with a 0.3 percent increase in the labor force, total non-farm employment in the U.S. increased 1.7 percent in 2013. This marks the third consecutive year of growth after three years of decline. In the current recovery, travel has proven to be one of the most efficient job-creating engines of the U.S. economy. Accounting for 5.8 percent of total non-farm employment in the U.S., travel directly supported nearly 7.9 million U.S. jobs in 2013, an increase of 2.4 percent from 2012. The travel industry has created jobs at a faster rate (6.8%) than the rest of the economy (5.8%) since the overall employment recovery began in March of 2010. Travel-generated jobs have accounted for is 8.2 percent of new jobs created in 2013. Table 3: Travel Generated Employment - U.S. Nationwide
2012 Employment (Thousands) 2013 Employment (Thousands) Category Domestic Intl.* Total Domestic Intl.* Total Public Transportation 896.3 67.2 963.4 887.2 69.1 956.3 Auto Transportation 257.4 2.0 259.4 263.7 2.1 265.8 Lodging 1,196.6 257.1 1,453.6 1,203.8 277.8 1,481.6 Foodservice 2,638.0 406.7 3,044.7 2,715.9 444.1 3,160.0
Entertainment & Recreation 1,090.2 217.9 1,308.2 1,110.5 231.4 1,341.9
General Retail Trade 319.7 164.2 483.8 320.2 171.1 491.4 Travel Planning 161.9 0.0 161.9 164.7 0.0 164.7 Total 6,560.1 1,115.1 7,675.2 6,666.0 1,195.7 7,861.7 Source: U.S. Travel Association
* Excludes jobs supported by international passenger fare payments.
U.S. Travel Trends, 2008-2017
8
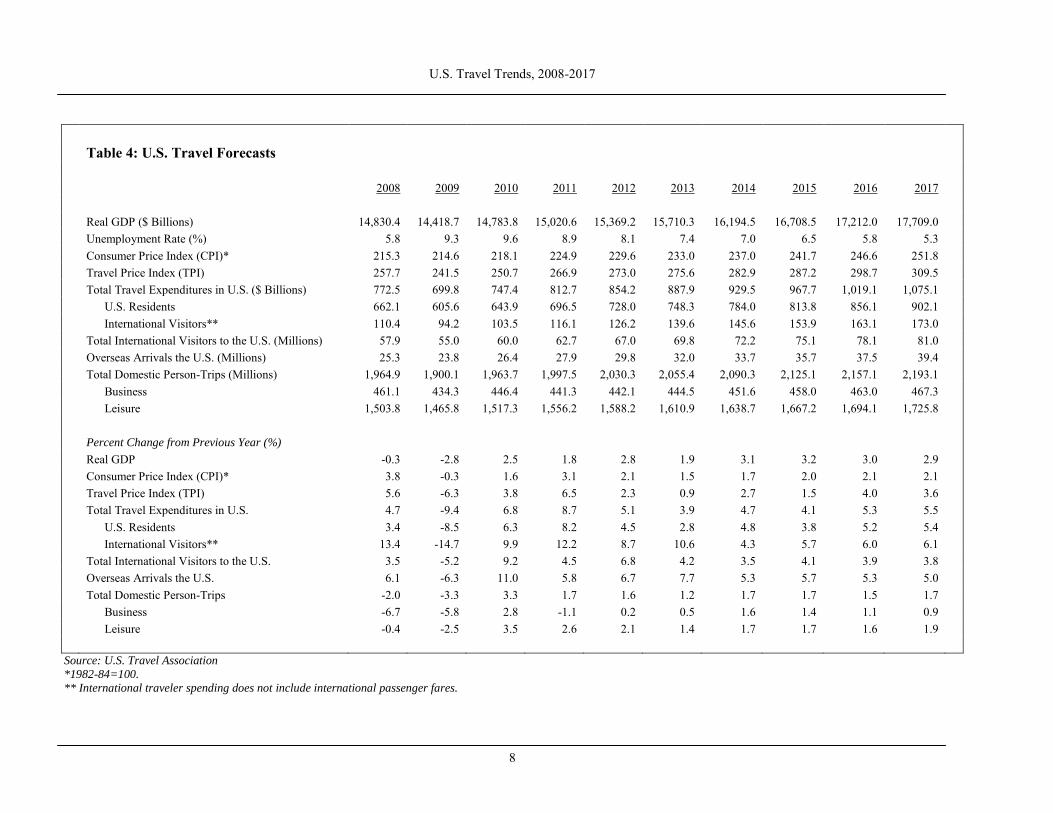
Table 4: U.S. Travel Forecasts 2008 2009 2010 2011 2012 2013 2014 2015 2016 2017
Real GDP ($ Billions) 14,830.4 14,418.7 14,783.8 15,020.6 15,369.2 15,710.3 16,194.5 16,708.5 17,212.0 17,709.0 Unemployment Rate (%) 5.8 9.3 9.6 8.9 8.1 7.4 7.0 6.5 5.8 5.3 Consumer Price Index (CPI)* 215.3 214.6 218.1 224.9 229.6 233.0 237.0 241.7 246.6 251.8 Travel Price Index (TPI) 257.7 241.5 250.7 266.9 273.0 275.6 282.9 287.2 298.7 309.5 Total Travel Expenditures in U.S. ($ Billions) 772.5 699.8 747.4 812.7 854.2 887.9 929.5 967.7 1,019.1 1,075.1 U.S. Residents 662.1 605.6 643.9 696.5 728.0 748.3 784.0 813.8 856.1 902.1 International Visitors** 110.4 94.2 103.5 116.1 126.2 139.6 145.6 153.9 163.1 173.0 Total International Visitors to the U.S. (Millions) 57.9 55.0 60.0 62.7 67.0 69.8 72.2 75.1 78.1 81.0 Overseas Arrivals the U.S. (Millions) 25.3 23.8 26.4 27.9 29.8 32.0 33.7 35.7 37.5 39.4 Total Domestic Person-Trips (Millions) 1,964.9 1,900.1 1,963.7 1,997.5 2,030.3 2,055.4 2,090.3 2,125.1 2,157.1 2,193.1 Business 461.1 434.3 446.4 441.3 442.1 444.5 451.6 458.0 463.0 467.3 Leisure 1,503.8 1,465.8 1,517.3 1,556.2 1,588.2 1,610.9 1,638.7 1,667.2 1,694.1 1,725.8 Percent Change from Previous Year (%) Real GDP -0.3 -2.8 2.5 1.8 2.8 1.9 3.1 3.2 3.0 2.9 Consumer Price Index (CPI)* 3.8 -0.3 1.6 3.1 2.1 1.5 1.7 2.0 2.1 2.1 Travel Price Index (TPI) 5.6 -6.3 3.8 6.5 2.3 0.9 2.7 1.5 4.0 3.6 Total Travel Expenditures in U.S. 4.7 -9.4 6.8 8.7 5.1 3.9 4.7 4.1 5.3 5.5 U.S. Residents 3.4 -8.5 6.3 8.2 4.5 2.8 4.8 3.8 5.2 5.4 International Visitors** 13.4 -14.7 9.9 12.2 8.7 10.6 4.3 5.7 6.0 6.1 Total International Visitors to the U.S. 3.5 -5.2 9.2 4.5 6.8 4.2 3.5 4.1 3.9 3.8 Overseas Arrivals the U.S. 6.1 -6.3 11.0 5.8 6.7 7.7 5.3 5.7 5.3 5.0 Total Domestic Person-Trips -2.0 -3.3 3.3 1.7 1.6 1.2 1.7 1.7 1.5 1.7 Business -6.7 -5.8 2.8 -1.1 0.2 0.5 1.6 1.4 1.1 0.9 Leisure -0.4 -2.5 3.5 2.6 2.1 1.4 1.7 1.7 1.6 1.9
Source: U.S. Travel Association
*1982-84=100.
** International traveler spending does not include international passenger fares.
Direct Travel Impact on the United States in 2013
9
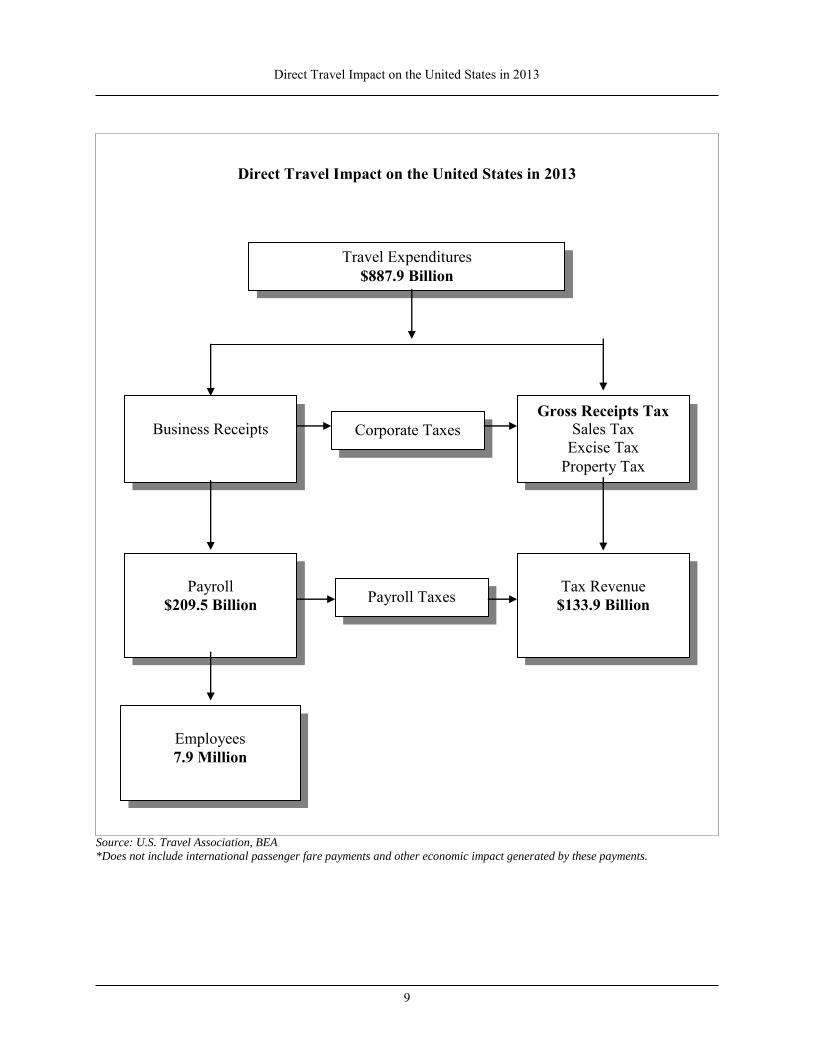
Direct Travel Impact on the United States in 2013
Source: U.S. Travel Association, BEA
*Does not include international passenger fare payments and other economic impact generated by these payments.
Travel Expenditures $887.9 Billion
Corporate Taxes
Business Receipts
Gross Receipts Tax Sales Tax
Excise Tax Property Tax
Tax Revenue
$133.9 Billion
Payroll
$209.5 Billion
Payroll Taxes
Employees 7.9 Million

10
This page intentionally left blank.
Domestic Travel Impact on Virginia
11
DOMESTIC TRAVEL IMPACT ON VIRGINIA

Domestic Travel Expenditures
12
TRAVEL EXPENDITURES In 2013, domestic travelers spent $21.5 billion on transportation, lodging, food, amusement and recreation, as well as retail shopping in Virginia. This represents a 1.4 percent increase from 2012. Foodservices, auto transportation, and lodging are the top three spending categories for domestic travelers in Virginia. Domestic travelers spent $6.1 billion on food services including restaurants and other eating and drinking places in 2013, up 3.1 percent from 2012. Domestic travelers spent $5.2 billion on auto transportation including variable costs of operating an automobile, camper, or other recreational vehicle on a trip, such as gasoline, oil, tires, and repairs. The costs of renting an automobile or other motor vehicle are included in this category as well. Spending on lodging including hotels/ motels, campgrounds, time share and vacation homes rentals was nearly $3.9 billion in 2013, accounting for 18.0 percent of domestic travelers’ spending. Domestic travelers spent $2.9 billion on public transportation in 2013, up 0.2 percent from 2012. This includes domestic travelers’ purchases on air, bus, rail, boat/ship and taxicab or limousine services, as well as any sightseeing transportation. Retail shopping is one of the major activities of people traveling in Virginia. In 2013, domestic travelers spent $2.0 billion on purchases at retail stores. Retail shopping accounted for 9.2 percent of domestic travelers’ trip spending in Virginia. In 2013, travelers spent more than $1.5 billion on recreation facility user fees, admissions at amusement parks and attractions, attendance at nightclubs, movies, legitimate shows, sports events, and other forms of entertainment and recreation services.
Public Transportation
13.6%
Auto Transportation
24.0%
Lodging 18.0%
Foodservice 28.3%
Entertainment & Recreation
7.0%
General Retail Trade
9.2%
Domestic Travel Expenditures in Virginia by Industry Sector - 2013

Domestic Travel Expenditures
13
Table 5: Domestic Travel Expenditures in Virginia by Industry Sector, 2012-2013 2013 Total % of Total ($ Millions) Public Transportation $2,917.5 13.6% Auto Transportation 5,157.0 24.0% Lodging 3,866.6 18.0% Foodservice 6,089.1 28.3% Entertainment & Recreation 1,512.2 7.0% General Retail Trade 1,969.6 9.2% Total $21,512.0 100.0%
2012 Public Transportation $2,910.5 13.7% Auto Transportation 5,060.9 23.9% Lodging 3,923.1 18.5% Foodservice 5,904.0 27.8% Entertainment & Recreation 1,500.6 7.1% General Retail Trade 1,914.9 9.0% Total $21,214.0 100.0% Percent Change 2013 over 2012 Public Transportation 0.2% Auto Transportation 1.9% Lodging -1.4% Foodservice 3.1% Entertainment & Recreation 0.8% General Retail Trade 2.9% Total 1.4%
Source: U.S. Travel Association
Notes:
1. Auto transportation sector includes privately-owned vehicles that are used for trips (e.g., automobiles, trucks, campers or
other recreational vehicles), gasoline service stations, and automotive rental.
2. Foodservice sector includes restaurants, grocery stores and other eating and drinking establishments.
3. Public transportation sector comprises air, intercity bus, rail, boat or ship, and taxicab or limousine service.
4. Lodging sector consists of hotels and motels, campgrounds, and ownership or rental of vacation or second homes.
5. General retail trade sector includes gifts, clothes, souvenirs and other incidental retail purchases.

Domestic Travel Expenditures
14
6.Entertainment and recreation sector includes amusement parks and attractions, attendance at nightclubs, movies, legitimate
shows, sports events, and other forms of entertainment and recreation while traveling.
Domestic Travel-Generated Employment
15
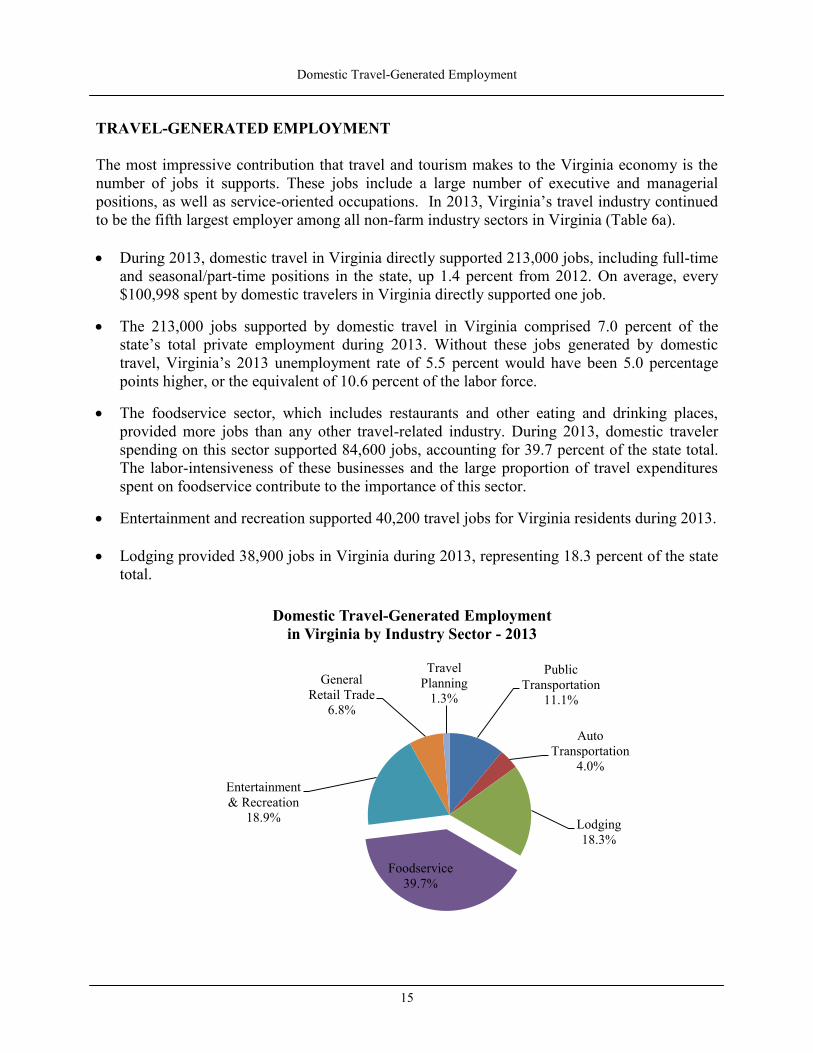
TRAVEL-GENERATED EMPLOYMENT The most impressive contribution that travel and tourism makes to the Virginia economy is the number of jobs it supports. These jobs include a large number of executive and managerial positions, as well as service-oriented occupations. In 2013, Virginia’s travel industry continued to be the fifth largest employer among all non-farm industry sectors in Virginia (Table 6a). During 2013, domestic travel in Virginia directly supported 213,000 jobs, including full-time
and seasonal/part-time positions in the state, up 1.4 percent from 2012. On average, every $100,998 spent by domestic travelers in Virginia directly supported one job.
The 213,000 jobs supported by domestic travel in Virginia comprised 7.0 percent of the state’s total private employment during 2013. Without these jobs generated by domestic travel, Virginia’s 2013 unemployment rate of 5.5 percent would have been 5.0 percentage points higher, or the equivalent of 10.6 percent of the labor force.
The foodservice sector, which includes restaurants and other eating and drinking places, provided more jobs than any other travel-related industry. During 2013, domestic traveler spending on this sector supported 84,600 jobs, accounting for 39.7 percent of the state total. The labor-intensiveness of these businesses and the large proportion of travel expenditures spent on foodservice contribute to the importance of this sector.
Entertainment and recreation supported 40,200 travel jobs for Virginia residents during 2013.
Lodging provided 38,900 jobs in Virginia during 2013, representing 18.3 percent of the state total.
Public Transportation
11.1%
Auto Transportation
4.0%
Lodging 18.3%
Foodservice 39.7%
Entertainment & Recreation
18.9%
General Retail Trade
6.8%
Travel Planning
1.3%
Domestic Travel-Generated Employment in Virginia by Industry Sector - 2013
Domestic Travel-Generated Employment
16
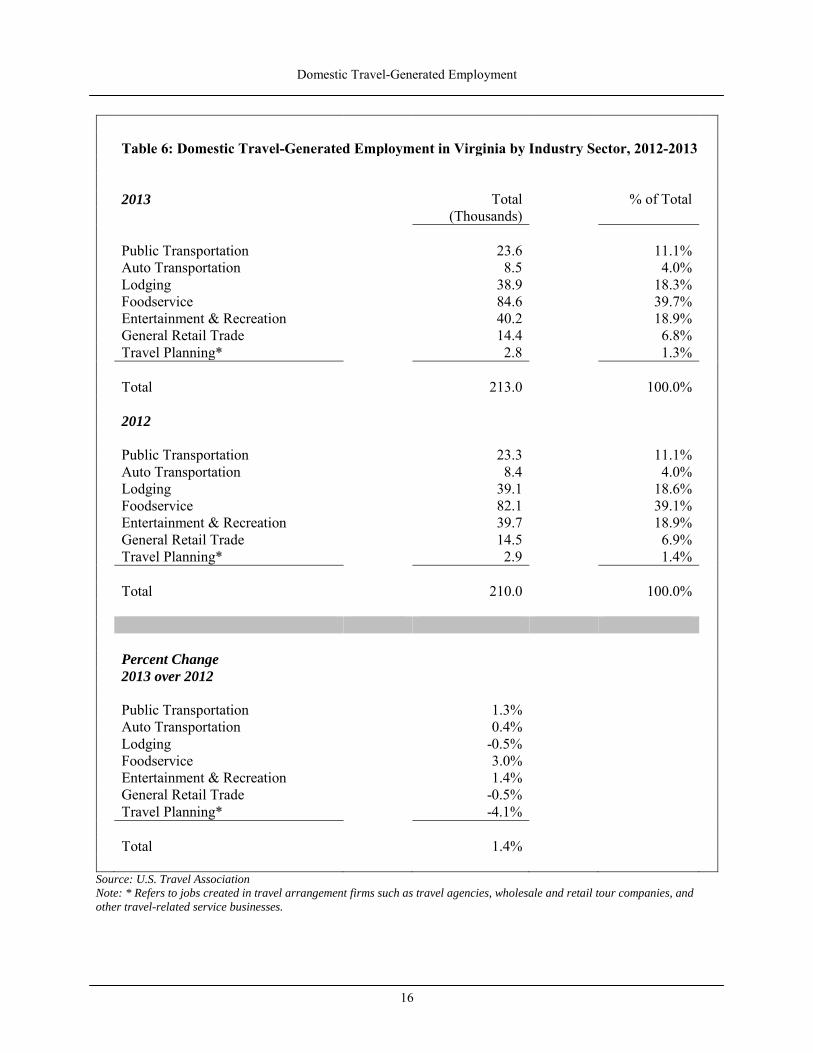
Table 6: Domestic Travel-Generated Employment in Virginia by Industry Sector, 2012-2013 2013 Total % of Total (Thousands) Public Transportation 23.6 11.1% Auto Transportation 8.5 4.0% Lodging 38.9 18.3% Foodservice 84.6 39.7% Entertainment & Recreation 40.2 18.9% General Retail Trade 14.4 6.8% Travel Planning* 2.8 1.3% Total 213.0 100.0% 2012 Public Transportation 23.3 11.1% Auto Transportation 8.4 4.0% Lodging 39.1 18.6% Foodservice 82.1 39.1% Entertainment & Recreation 39.7 18.9% General Retail Trade 14.5 6.9% Travel Planning* 2.9 1.4% Total 210.0 100.0% Percent Change 2013 over 2012 Public Transportation 1.3% Auto Transportation 0.4% Lodging -0.5% Foodservice 3.0% Entertainment & Recreation 1.4% General Retail Trade -0.5% Travel Planning* -4.1% Total 1.4%
Source: U.S. Travel Association
Note: * Refers to jobs created in travel arrangement firms such as travel agencies, wholesale and retail tour companies, and
other travel-related service businesses.
Domestic Travel-Generated Employment
17
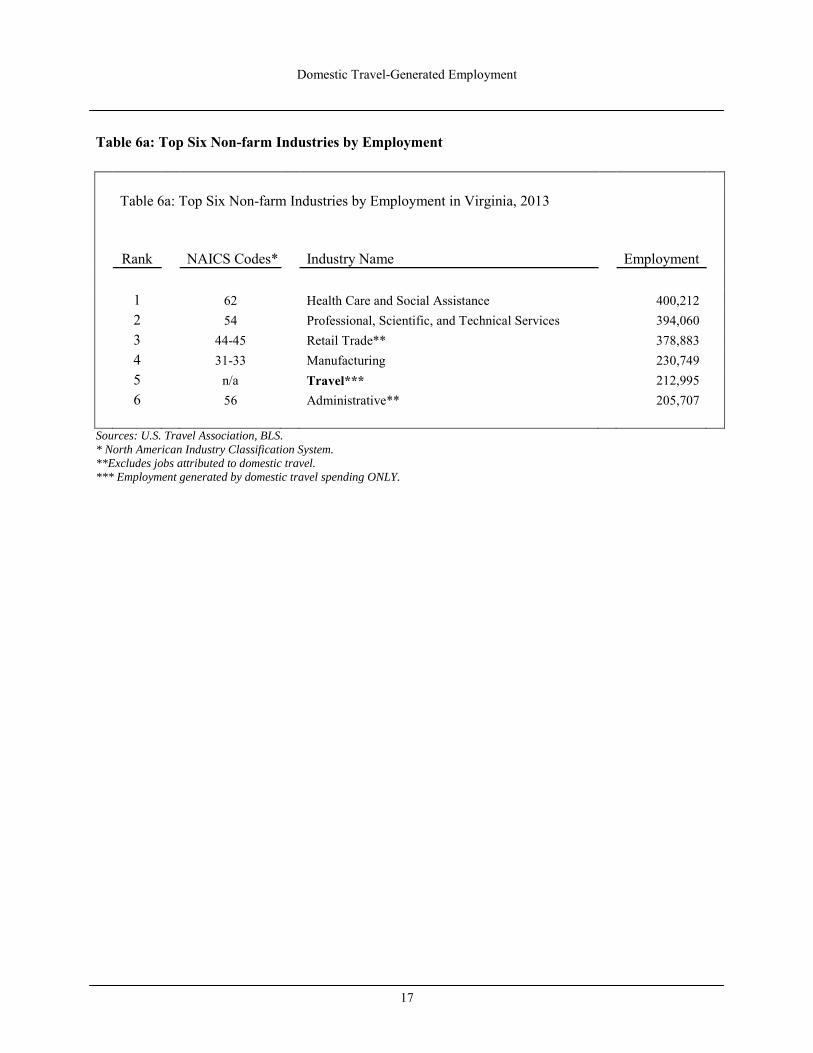
Table 6a: Top Six Non-farm Industries by Employment
Table 6a: Top Six Non-farm Industries by Employment in Virginia, 2013
Rank NAICS Codes* Industry Name Employment
1 62 Health Care and Social Assistance 400,212
2 54 Professional, Scientific, and Technical Services 394,060
3 44-45 Retail Trade** 378,883
4 31-33 Manufacturing 230,749
5 n/a Travel*** 212,995
6 56 Administrative** 205,707
Sources: U.S. Travel Association, BLS.
* North American Industry Classification System.
**Excludes jobs attributed to domestic travel.
*** Employment generated by domestic travel spending ONLY.

18
This page intentionally left blank.
Domestic Travel-Generated Payroll
19
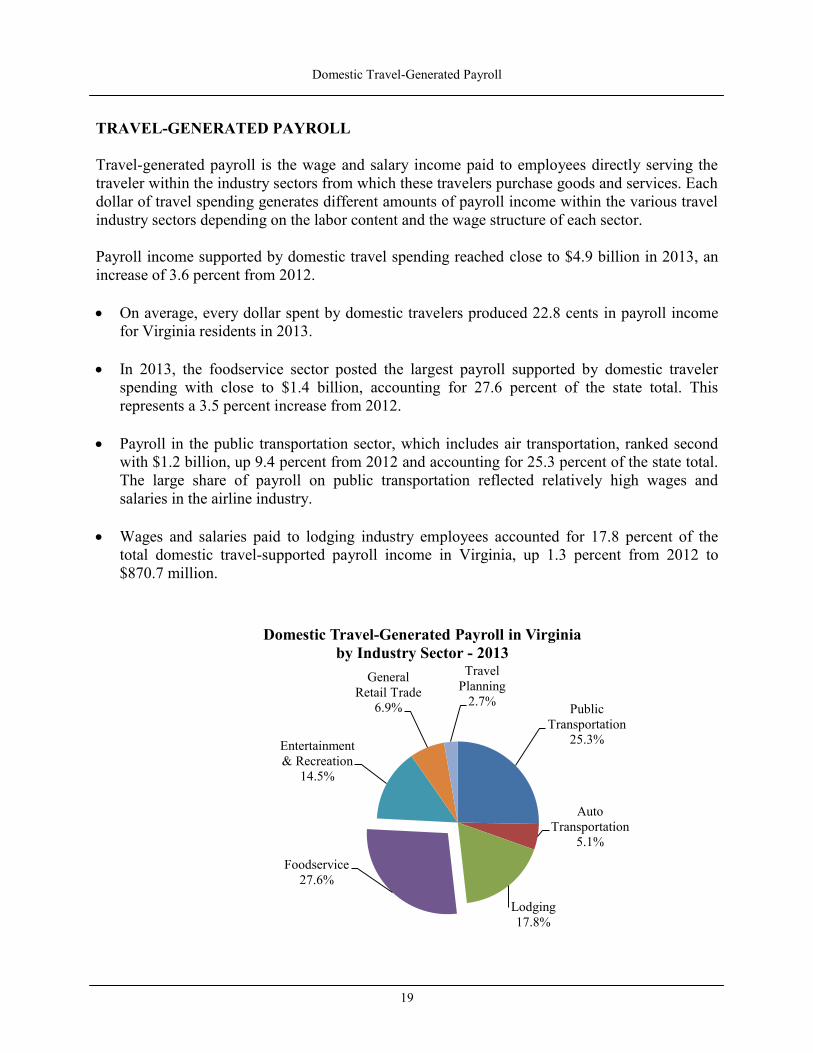
TRAVEL-GENERATED PAYROLL Travel-generated payroll is the wage and salary income paid to employees directly serving the traveler within the industry sectors from which these travelers purchase goods and services. Each dollar of travel spending generates different amounts of payroll income within the various travel industry sectors depending on the labor content and the wage structure of each sector. Payroll income supported by domestic travel spending reached close to $4.9 billion in 2013, an increase of 3.6 percent from 2012.
On average, every dollar spent by domestic travelers produced 22.8 cents in payroll income
for Virginia residents in 2013. In 2013, the foodservice sector posted the largest payroll supported by domestic traveler
spending with close to $1.4 billion, accounting for 27.6 percent of the state total. This represents a 3.5 percent increase from 2012.
Payroll in the public transportation sector, which includes air transportation, ranked second
with $1.2 billion, up 9.4 percent from 2012 and accounting for 25.3 percent of the state total. The large share of payroll on public transportation reflected relatively high wages and salaries in the airline industry.
Wages and salaries paid to lodging industry employees accounted for 17.8 percent of the
total domestic travel-supported payroll income in Virginia, up 1.3 percent from 2012 to $870.7 million.
Public Transportation
25.3%
Auto Transportation
5.1%
Lodging 17.8%
Foodservice 27.6%
Entertainment & Recreation
14.5%
General Retail Trade
6.9%
Travel Planning
2.7%
Domestic Travel-Generated Payroll in Virginia by Industry Sector - 2013
Domestic Travel-Generated Payroll
20
Table 7: Domestic Travel-Generated Payroll in Virginia by Industry Sector, 2012-2013 2013 Total % of Total ($ Millions) Public Transportation $1,237.9 25.3% Auto Transportation 250.9 5.1% Lodging 870.7 17.8% Foodservice 1,350.5 27.6% Entertainment & Recreation 710.9 14.5% General Retail Trade 340.0 6.9% Travel Planning* 133.6 2.7% Total $4,894.6 100.0% 2012 Public Transportation $1,131.7 24.0% Auto Transportation 249.8 5.3% Lodging 859.4 18.2% Foodservice 1,304.5 27.6% Entertainment & Recreation 698.7 14.8% General Retail Trade 340.4 7.2% Travel Planning* 140.0 3.0% Total $4,724.4 100.0% Percent Change 2013 over 2012 Public Transportation 9.4% Auto Transportation 0.4% Lodging 1.3% Foodservice 3.5% Entertainment & Recreation 1.8% General Retail Trade -0.1% Travel Planning* -4.6% Total 3.6%
Source: U.S. Travel Association
Note: * Refers to payroll income that goes to travel agents, tour operators, and other travel service employees who arrange
passenger transportation, lodging, tours and other related services.
Domestic Travel-Generated Tax Revenue
21
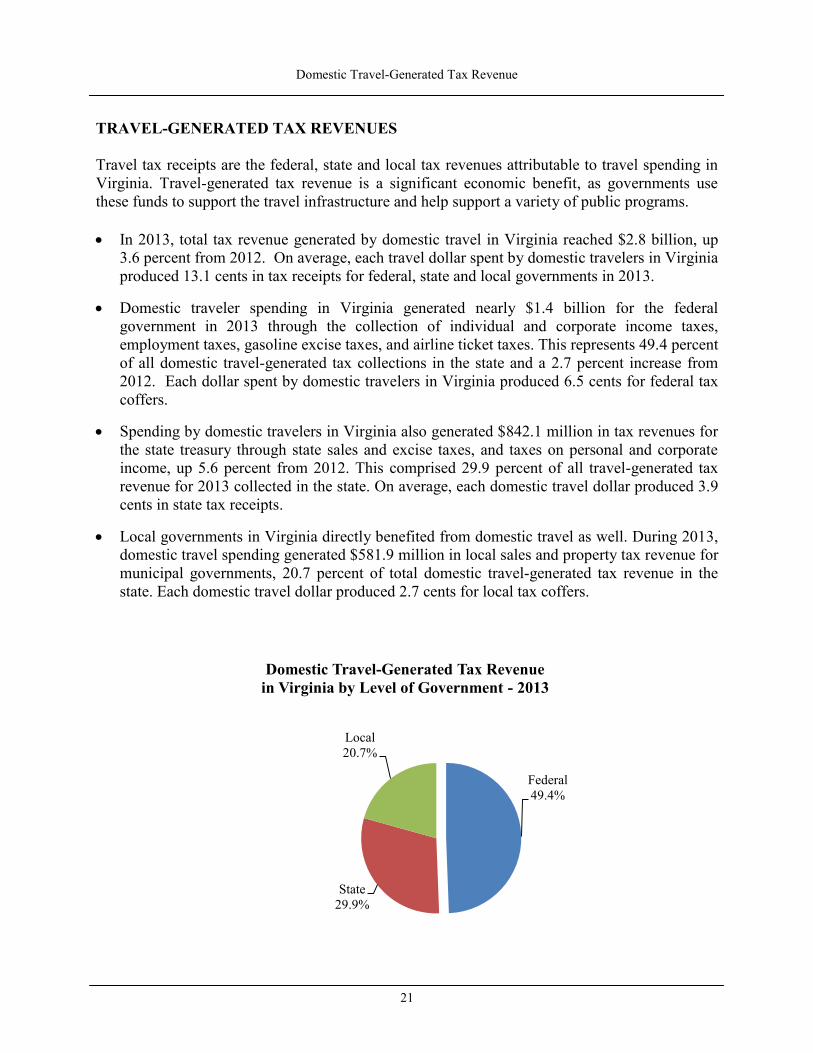
TRAVEL-GENERATED TAX REVENUES Travel tax receipts are the federal, state and local tax revenues attributable to travel spending in Virginia. Travel-generated tax revenue is a significant economic benefit, as governments use these funds to support the travel infrastructure and help support a variety of public programs. In 2013, total tax revenue generated by domestic travel in Virginia reached $2.8 billion, up
3.6 percent from 2012. On average, each travel dollar spent by domestic travelers in Virginia produced 13.1 cents in tax receipts for federal, state and local governments in 2013.
Domestic traveler spending in Virginia generated nearly $1.4 billion for the federal government in 2013 through the collection of individual and corporate income taxes, employment taxes, gasoline excise taxes, and airline ticket taxes. This represents 49.4 percent of all domestic travel-generated tax collections in the state and a 2.7 percent increase from 2012. Each dollar spent by domestic travelers in Virginia produced 6.5 cents for federal tax coffers.
Spending by domestic travelers in Virginia also generated $842.1 million in tax revenues for the state treasury through state sales and excise taxes, and taxes on personal and corporate income, up 5.6 percent from 2012. This comprised 29.9 percent of all travel-generated tax revenue for 2013 collected in the state. On average, each domestic travel dollar produced 3.9 cents in state tax receipts.
Local governments in Virginia directly benefited from domestic travel as well. During 2013, domestic travel spending generated $581.9 million in local sales and property tax revenue for municipal governments, 20.7 percent of total domestic travel-generated tax revenue in the state. Each domestic travel dollar produced 2.7 cents for local tax coffers.
Federal 49.4%
State 29.9%
Local 20.7%
Domestic Travel-Generated Tax Revenue in Virginia by Level of Government - 2013

Domestic Travel-Generated Tax Revenue
22
Table 8: Domestic Travel-Generated Tax Revenue in Virginia by level of Government, 2012-2013
2013 Total % of Total ($ Millions) Federal Tax $1,390.5 49.4% State tax 842.1 29.9% Local Tax 581.9 20.7% Total $2,814.4 100.0% 2012 Federal Tax $1,353.6 49.8% State tax 797.7 29.4% Local Tax 564.2 20.8% Total $2,715.5 100.0% Percent Change 2013 over 2012 Federal Tax 2.7% State tax 5.6% Local Tax 3.1% Total 3.6%
Source: U.S. Travel Association
Domestic Travel Impact on Virginia Counties and Independent Cities (County Equivalents) - 2013
23
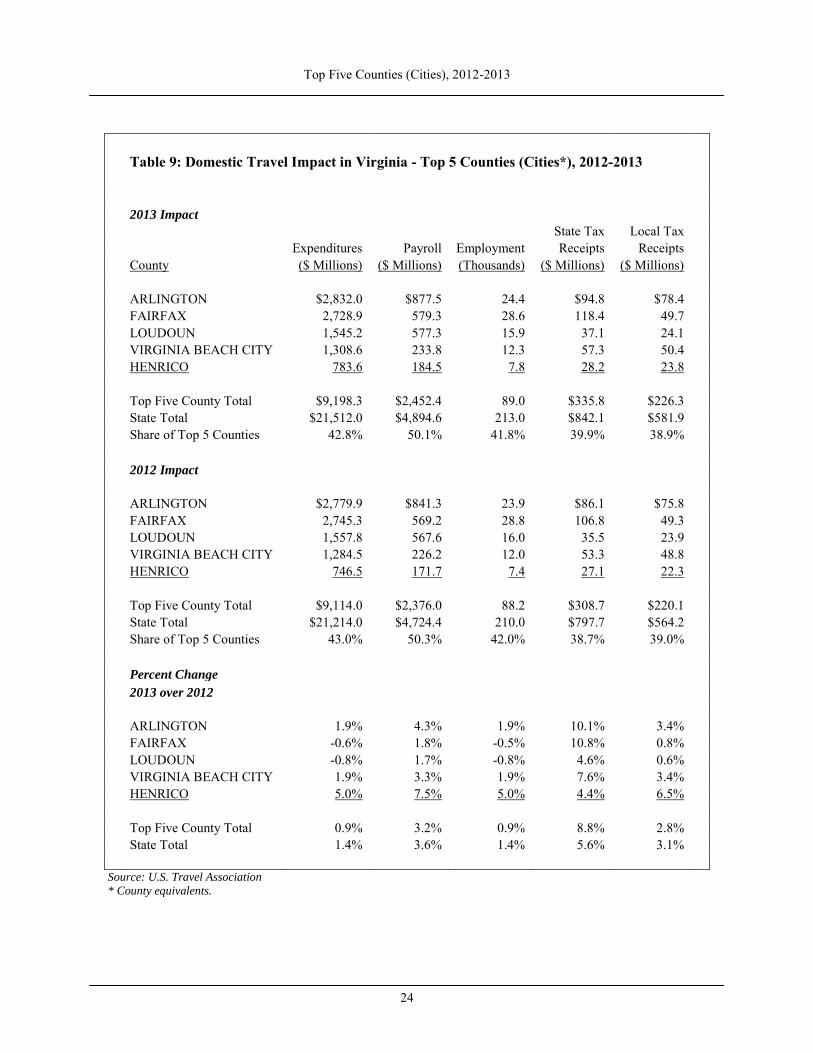
DOMESTIC TRAVEL IMPACT ON VIRGINIA COUNTIES AND INDEPENDENT CITIES (COUNTY EQUIVALENTS) – 2013 Domestic travelers spent $21.5 billion while traveling in Virginia during 2013, up 1.4 percent from 2012. The top five localities in Virginia received close to $9.2 billion in direct domestic travel expenditures, accounting for 42.8 percent of the state total. Domestic traveler spending in the top five counties supported close to $2.5 billion in payroll (50.1% of the state total) and 89,000 jobs (41.8% of the state total) in 2013. Additionally, domestic traveler expenditures in the top five localities generated $335.8 million in tax revenue for the state treasury (39.9 % of the state total) and $226.3 million in tax revenue for local governments (38.9% of the state total) during 2013. Domestic Travel Impact in the Top 5 Counties Arlington County led all counties in travel expenditures and payroll income directly supported by domestic traveler spending in 2013. Domestic travel expenditures in Arlington County reached $2.8 billion, accounting for 13.2 percent of the state total. These expenditures supported $877.5 million in payroll income and 24,400 jobs for county residents. Fairfax County followed Arlington County closely with $2.7 billion in domestic traveler spending in 2013, representing 12.7 percent of the state total. The payroll income and jobs directly attributable to domestic travel spending reached $579.3 million and 28,600 jobs. Loudoun County posted third in rank with $1.5 billion in domestic expenditures that accounted for 7.2 percent of the state total. These expenditures supported $577.3 million in payroll as well as 15,900 jobs within the county. Virginia Beach City received $1.3 billion from domestic travelers, 6.1 percent of the state total. These travel expenditures benefited county residents with $233.8 million in payroll income and 12,300 jobs. Henrico County ranked fifth with $783.6 million in domestic traveler expenditures in 2013. These expenditures by domestic travelers supported $184.5 million in payroll income and 7,800 jobs for county residents.
Top Five Counties (Cities), 2012-2013
24
Table 9: Domestic Travel Impact in Virginia - Top 5 Counties (Cities*), 2012-2013
2013 Impact
State Tax Local Tax
Expenditures Payroll Employment Receipts Receipts
County ($ Millions) ($ Millions) (Thousands) ($ Millions) ($ Millions)
ARLINGTON $2,832.0 $877.5 24.4 $94.8 $78.4
FAIRFAX 2,728.9 579.3 28.6 118.4 49.7
LOUDOUN 1,545.2 577.3 15.9 37.1 24.1
VIRGINIA BEACH CITY 1,308.6 233.8 12.3 57.3 50.4
HENRICO 783.6 184.5 7.8 28.2 23.8
Top Five County Total $9,198.3 $2,452.4 89.0 $335.8 $226.3
State Total $21,512.0 $4,894.6 213.0 $842.1 $581.9
Share of Top 5 Counties 42.8% 50.1% 41.8% 39.9% 38.9%
2012 Impact
ARLINGTON $2,779.9 $841.3 23.9 $86.1 $75.8
FAIRFAX 2,745.3 569.2 28.8 106.8 49.3
LOUDOUN 1,557.8 567.6 16.0 35.5 23.9
VIRGINIA BEACH CITY 1,284.5 226.2 12.0 53.3 48.8
HENRICO 746.5 171.7 7.4 27.1 22.3
Top Five County Total $9,114.0 $2,376.0 88.2 $308.7 $220.1
State Total $21,214.0 $4,724.4 210.0 $797.7 $564.2
Share of Top 5 Counties 43.0% 50.3% 42.0% 38.7% 39.0%
Percent Change
2013 over 2012
ARLINGTON 1.9% 4.3% 1.9% 10.1% 3.4%
FAIRFAX -0.6% 1.8% -0.5% 10.8% 0.8%
LOUDOUN -0.8% 1.7% -0.8% 4.6% 0.6%
VIRGINIA BEACH CITY 1.9% 3.3% 1.9% 7.6% 3.4%
HENRICO 5.0% 7.5% 5.0% 4.4% 6.5%
Top Five County Total 0.9% 3.2% 0.9% 8.8% 2.8%
State Total 1.4% 3.6% 1.4% 5.6% 3.1%
Source: U.S. Travel Association
* County equivalents.
Domestic Travel Impact on Virginia Counties and Independent Cities (County Equivalents)
25
COUNTY (CITY) TABLES The following tables list the results of the County Economic Impact Component of the U.S. Travel Association’s Travel Economic Impact Model for Virginia in 2013 and 2012. The estimates presented are for direct domestic travel expenditures and related economic impact.
Table A shows the counties and cities listed alphabetically, with 2013 domestic travel
expenditures, travel-generated payroll and employment, and state tax revenue and local tax revenue for each.
Table B ranks the localities in order of 2013 travel expenditures from highest to lowest. Table C shows the percent distribution for each impact measure in 2013. Table D shows the percent change in 2013 over 2012 estimates for each of the measures of
economic impact. Table E shows the counties and cities listed alphabetically, with 2012 travel expenditures,
travel-generated payroll and employment, and state tax revenue and local tax revenue for each.
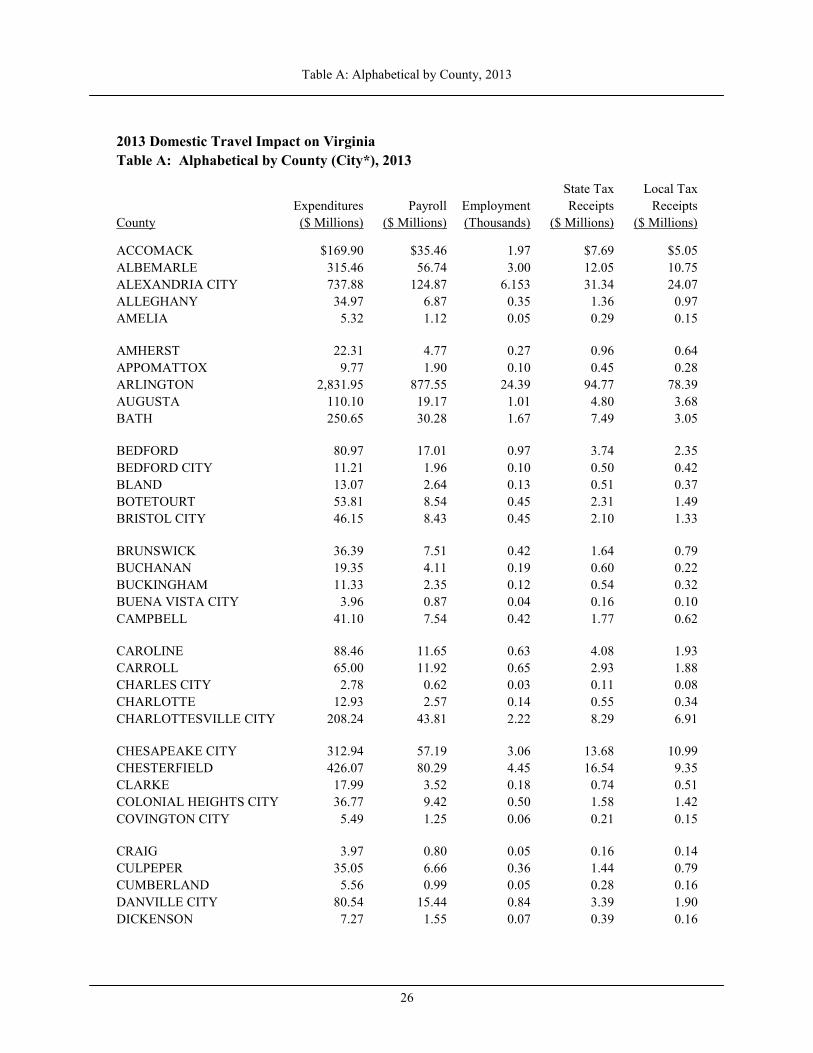
Table A: Alphabetical by County, 2013
26
2013 Domestic Travel Impact on Virginia Table A: Alphabetical by County (City*), 2013
State Tax Local Tax Expenditures Payroll Employment Receipts Receipts County ($ Millions) ($ Millions) (Thousands) ($ Millions) ($ Millions)
ACCOMACK $169.90 $35.46 1.97 $7.69 $5.05 ALBEMARLE 315.46 56.74 3.00 12.05 10.75 ALEXANDRIA CITY 737.88 124.87 6.153 31.34 24.07 ALLEGHANY 34.97 6.87 0.35 1.36 0.97 AMELIA 5.32 1.12 0.05 0.29 0.15
AMHERST 22.31 4.77 0.27 0.96 0.64 APPOMATTOX 9.77 1.90 0.10 0.45 0.28 ARLINGTON 2,831.95 877.55 24.39 94.77 78.39 AUGUSTA 110.10 19.17 1.01 4.80 3.68 BATH 250.65 30.28 1.67 7.49 3.05
BEDFORD 80.97 17.01 0.97 3.74 2.35 BEDFORD CITY 11.21 1.96 0.10 0.50 0.42 BLAND 13.07 2.64 0.13 0.51 0.37 BOTETOURT 53.81 8.54 0.45 2.31 1.49 BRISTOL CITY 46.15 8.43 0.45 2.10 1.33
BRUNSWICK 36.39 7.51 0.42 1.64 0.79 BUCHANAN 19.35 4.11 0.19 0.60 0.22 BUCKINGHAM 11.33 2.35 0.12 0.54 0.32 BUENA VISTA CITY 3.96 0.87 0.04 0.16 0.10 CAMPBELL 41.10 7.54 0.42 1.77 0.62
CAROLINE 88.46 11.65 0.63 4.08 1.93 CARROLL 65.00 11.92 0.65 2.93 1.88 CHARLES CITY 2.78 0.62 0.03 0.11 0.08 CHARLOTTE 12.93 2.57 0.14 0.55 0.34 CHARLOTTESVILLE CITY 208.24 43.81 2.22 8.29 6.91
CHESAPEAKE CITY 312.94 57.19 3.06 13.68 10.99 CHESTERFIELD 426.07 80.29 4.45 16.54 9.35 CLARKE 17.99 3.52 0.18 0.74 0.51 COLONIAL HEIGHTS CITY 36.77 9.42 0.50 1.58 1.42 COVINGTON CITY 5.49 1.25 0.06 0.21 0.15
CRAIG 3.97 0.80 0.05 0.16 0.14 CULPEPER 35.05 6.66 0.36 1.44 0.79 CUMBERLAND 5.56 0.99 0.05 0.28 0.16 DANVILLE CITY 80.54 15.44 0.84 3.39 1.90 DICKENSON 7.27 1.55 0.07 0.39 0.16

Table A: Alphabetical by County, 2013
27
2013 Domestic Travel Impact on Virginia Table A: Alphabetical by County (City*), 2013 (Continued)
State Tax Local Tax Expenditures Payroll Employment Receipts Receipts County ($ Millions) ($ Millions) (Thousands) ($ Millions) ($ Millions)
DINWIDDIE 12.99 2.66 0.13 0.52 0.39 EMPORIA CITY 25.21 4.01 0.20 1.48 0.96 ESSEX 30.19 6.45 0.36 1.33 0.87 FAIRFAX 2,728.88 579.28 28.63 118.37 49.68 FAIRFAX CITY 119.89 23.71 1.32 5.04 3.30 FALLS CHURCH CITY 33.81 10.16 0.48 2.35 1.32 FAUQUIER 156.48 30.10 1.68 7.20 2.60 FLOYD 22.29 4.08 0.21 0.96 0.64 FLUVANNA 52.48 10.25 0.53 2.37 0.69 FRANKLIN 96.59 20.99 1.19 3.63 2.79 FRANKLIN CITY 13.46 2.38 0.12 0.79 0.52 FREDERICK 124.64 23.51 1.25 5.22 3.65 FREDERICKSBURG CITY 156.14 28.08 1.50 6.58 6.07 GALAX CITY 16.17 2.89 0.15 0.76 0.38 GILES 24.76 4.34 0.23 1.16 0.75 GLOUCESTER 43.43 8.22 0.45 1.90 1.25 GOOCHLAND 21.75 3.99 0.23 0.71 0.43 GRAYSON 13.95 3.11 0.14 0.56 0.40 GREENE 17.69 4.40 0.22 0.89 0.51 GREENSVILLE 15.74 2.50 0.13 0.69 0.35 HALIFAX 43.02 9.21 0.52 1.61 0.79 HAMPTON CITY 222.56 40.81 2.24 9.83 7.52 HANOVER 210.71 45.33 2.43 8.34 4.30 HARRISONBURG CITY 106.88 20.12 1.06 4.49 3.94 HENRICO 783.60 184.52 7.82 28.24 23.77 HENRY 45.40 9.50 0.52 1.90 0.88 HIGHLAND 16.61 3.34 0.18 0.80 0.48 HOPEWELL CITY 23.80 4.43 0.24 1.09 0.96 ISLE OF WIGHT 36.17 6.96 0.37 1.61 0.81 JAMES CITY 386.47 69.21 3.77 17.89 15.70 KING AND QUEEN 3.57 0.74 0.04 0.17 0.10 KING GEORGE 20.19 4.18 0.22 0.93 0.59 KING WILLIAM 9.08 2.06 0.09 0.35 0.22 LANCASTER 82.56 14.05 0.75 3.55 2.21 LEE 11.79 3.17 0.17 0.56 0.28
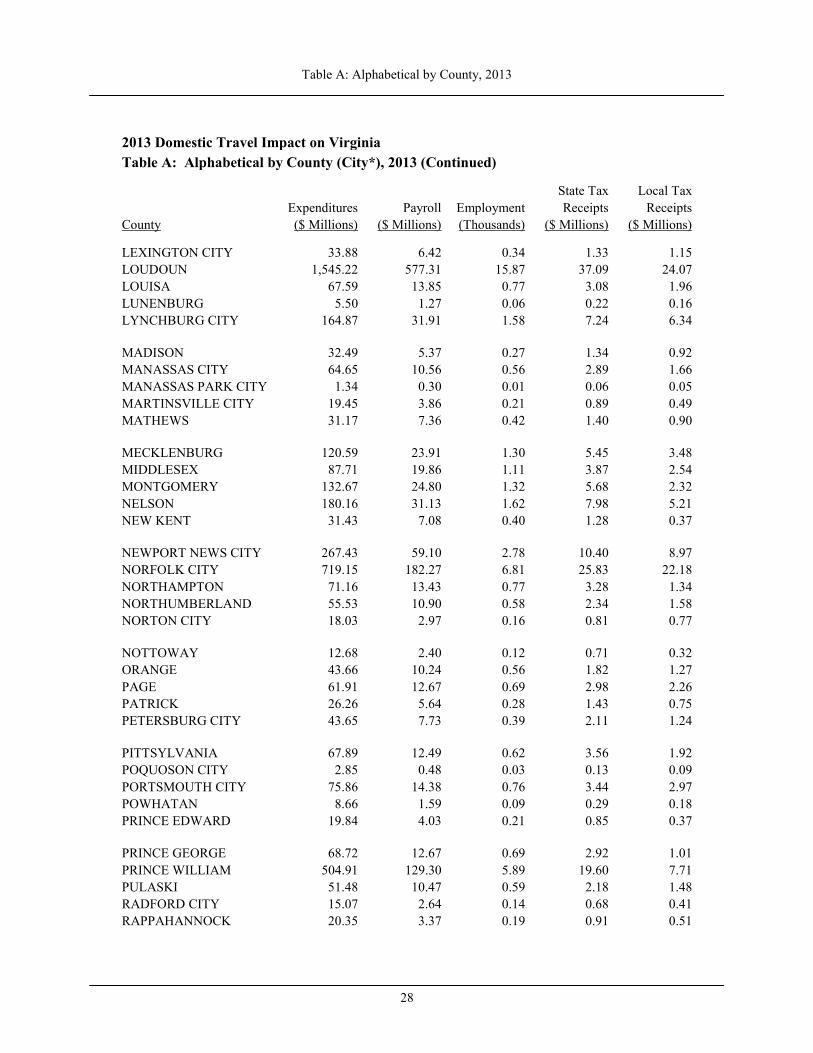
Table A: Alphabetical by County, 2013
28
2013 Domestic Travel Impact on Virginia Table A: Alphabetical by County (City*), 2013 (Continued)
State Tax Local Tax Expenditures Payroll Employment Receipts Receipts County ($ Millions) ($ Millions) (Thousands) ($ Millions) ($ Millions)
LEXINGTON CITY 33.88 6.42 0.34 1.33 1.15 LOUDOUN 1,545.22 577.31 15.87 37.09 24.07 LOUISA 67.59 13.85 0.77 3.08 1.96 LUNENBURG 5.50 1.27 0.06 0.22 0.16 LYNCHBURG CITY 164.87 31.91 1.58 7.24 6.34
MADISON 32.49 5.37 0.27 1.34 0.92 MANASSAS CITY 64.65 10.56 0.56 2.89 1.66 MANASSAS PARK CITY 1.34 0.30 0.01 0.06 0.05 MARTINSVILLE CITY 19.45 3.86 0.21 0.89 0.49 MATHEWS 31.17 7.36 0.42 1.40 0.90
MECKLENBURG 120.59 23.91 1.30 5.45 3.48 MIDDLESEX 87.71 19.86 1.11 3.87 2.54 MONTGOMERY 132.67 24.80 1.32 5.68 2.32 NELSON 180.16 31.13 1.62 7.98 5.21 NEW KENT 31.43 7.08 0.40 1.28 0.37
NEWPORT NEWS CITY 267.43 59.10 2.78 10.40 8.97 NORFOLK CITY 719.15 182.27 6.81 25.83 22.18 NORTHAMPTON 71.16 13.43 0.77 3.28 1.34 NORTHUMBERLAND 55.53 10.90 0.58 2.34 1.58 NORTON CITY 18.03 2.97 0.16 0.81 0.77
NOTTOWAY 12.68 2.40 0.12 0.71 0.32 ORANGE 43.66 10.24 0.56 1.82 1.27 PAGE 61.91 12.67 0.69 2.98 2.26 PATRICK 26.26 5.64 0.28 1.43 0.75 PETERSBURG CITY 43.65 7.73 0.39 2.11 1.24
PITTSYLVANIA 67.89 12.49 0.62 3.56 1.92 POQUOSON CITY 2.85 0.48 0.03 0.13 0.09 PORTSMOUTH CITY 75.86 14.38 0.76 3.44 2.97 POWHATAN 8.66 1.59 0.09 0.29 0.18 PRINCE EDWARD 19.84 4.03 0.21 0.85 0.37
PRINCE GEORGE 68.72 12.67 0.69 2.92 1.01 PRINCE WILLIAM 504.91 129.30 5.89 19.60 7.71 PULASKI 51.48 10.47 0.59 2.18 1.48 RADFORD CITY 15.07 2.64 0.14 0.68 0.41 RAPPAHANNOCK 20.35 3.37 0.19 0.91 0.51

Table A: Alphabetical by County, 2013
29
2013 Domestic Travel Impact on Virginia Table A: Alphabetical by County (City*), 2013 (Continued)
State Tax Local Tax Expenditures Payroll Employment Receipts Receipts County ($ Millions) ($ Millions) (Thousands) ($ Millions) ($ Millions)
RICHMOND 29.04 10.59 0.35 0.93 0.65 RICHMOND CITY 636.63 145.08 6.57 23.02 21.54 ROANOKE 156.35 29.20 1.59 6.27 5.09 ROANOKE CITY 384.74 78.92 3.51 14.77 13.23 ROCKBRIDGE 119.24 18.24 0.93 5.16 2.60
ROCKINGHAM 183.29 34.00 1.88 6.79 4.78 RUSSELL 12.15 2.77 0.15 0.59 0.19 SALEM CITY 63.21 12.35 0.71 2.51 2.29 SCOTT 16.25 3.19 0.17 0.76 0.39 SHENANDOAH 192.20 31.08 1.66 8.54 5.54
SMYTH 22.76 4.43 0.23 1.32 0.45 SOUTHAMPTON 14.49 2.92 0.15 0.75 0.27 SPOTSYLVANIA 247.38 52.95 2.85 5.75 4.77 STAFFORD 116.10 23.24 1.26 4.72 3.43 STAUNTON CITY 49.61 9.95 0.53 1.96 1.81
SUFFOLK CITY 64.93 11.71 0.62 3.46 1.95 SURRY 9.84 2.21 0.10 0.42 0.28 SUSSEX 9.18 1.96 0.09 0.54 0.18 TAZEWELL 48.91 10.20 0.57 2.06 0.66 VIRGINIA BEACH CITY 1,308.63 233.77 12.26 57.31 50.39
WARREN 125.21 27.33 1.53 5.44 2.43 WASHINGTON 96.47 20.51 1.14 4.23 2.30 WAYNESBORO CITY 33.67 6.68 0.36 1.45 1.10 WESTMORELAND 56.58 12.83 0.70 2.50 1.64 WILLIAMSBURG CITY 528.32 104.83 5.60 20.76 17.84
WINCHESTER CITY 100.89 18.63 0.99 4.19 3.39 WISE 32.31 6.66 0.37 1.41 0.45 WYTHE 133.43 19.04 0.95 6.16 3.86 YORK 202.66 35.41 1.86 9.00 7.56 STATE TOTALS $21,511.98 $4,894.57 213.00 $842.09 $581.85
----------------------------------------------
©2014 U.S. Travel Association
*County equivalents
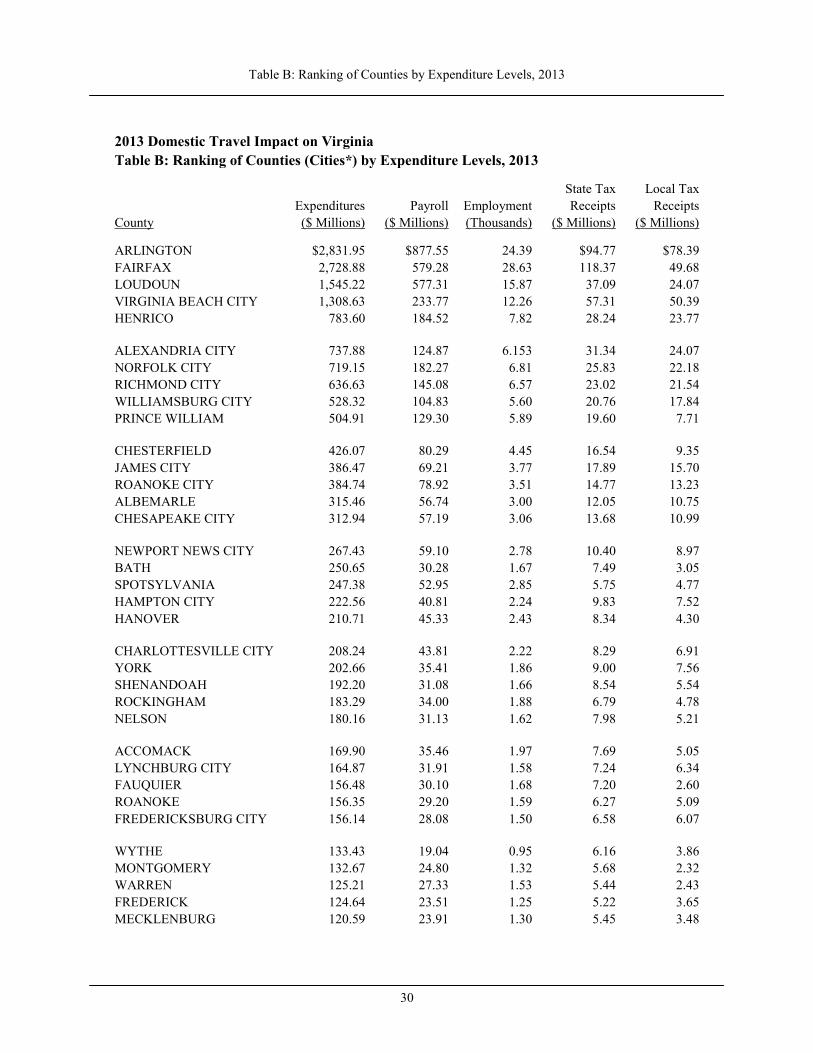
Table B: Ranking of Counties by Expenditure Levels, 2013
30
2013 Domestic Travel Impact on Virginia Table B: Ranking of Counties (Cities*) by Expenditure Levels, 2013
State Tax Local Tax Expenditures Payroll Employment Receipts Receipts County ($ Millions) ($ Millions) (Thousands) ($ Millions) ($ Millions)
ARLINGTON $2,831.95 $877.55 24.39 $94.77 $78.39 FAIRFAX 2,728.88 579.28 28.63 118.37 49.68 LOUDOUN 1,545.22 577.31 15.87 37.09 24.07 VIRGINIA BEACH CITY 1,308.63 233.77 12.26 57.31 50.39 HENRICO 783.60 184.52 7.82 28.24 23.77
ALEXANDRIA CITY 737.88 124.87 6.153 31.34 24.07 NORFOLK CITY 719.15 182.27 6.81 25.83 22.18 RICHMOND CITY 636.63 145.08 6.57 23.02 21.54 WILLIAMSBURG CITY 528.32 104.83 5.60 20.76 17.84 PRINCE WILLIAM 504.91 129.30 5.89 19.60 7.71
CHESTERFIELD 426.07 80.29 4.45 16.54 9.35 JAMES CITY 386.47 69.21 3.77 17.89 15.70 ROANOKE CITY 384.74 78.92 3.51 14.77 13.23 ALBEMARLE 315.46 56.74 3.00 12.05 10.75 CHESAPEAKE CITY 312.94 57.19 3.06 13.68 10.99
NEWPORT NEWS CITY 267.43 59.10 2.78 10.40 8.97 BATH 250.65 30.28 1.67 7.49 3.05 SPOTSYLVANIA 247.38 52.95 2.85 5.75 4.77 HAMPTON CITY 222.56 40.81 2.24 9.83 7.52 HANOVER 210.71 45.33 2.43 8.34 4.30
CHARLOTTESVILLE CITY 208.24 43.81 2.22 8.29 6.91 YORK 202.66 35.41 1.86 9.00 7.56 SHENANDOAH 192.20 31.08 1.66 8.54 5.54 ROCKINGHAM 183.29 34.00 1.88 6.79 4.78 NELSON 180.16 31.13 1.62 7.98 5.21
ACCOMACK 169.90 35.46 1.97 7.69 5.05 LYNCHBURG CITY 164.87 31.91 1.58 7.24 6.34 FAUQUIER 156.48 30.10 1.68 7.20 2.60 ROANOKE 156.35 29.20 1.59 6.27 5.09 FREDERICKSBURG CITY 156.14 28.08 1.50 6.58 6.07
WYTHE 133.43 19.04 0.95 6.16 3.86 MONTGOMERY 132.67 24.80 1.32 5.68 2.32 WARREN 125.21 27.33 1.53 5.44 2.43 FREDERICK 124.64 23.51 1.25 5.22 3.65 MECKLENBURG 120.59 23.91 1.30 5.45 3.48

Table B: Ranking of Counties by Expenditure Levels, 2013
31
2013 Domestic Travel Impact on Virginia
Table B: Ranking of Counties (Cities*) by Expenditure Levels, 2013 (Continued)
State Tax Local Tax Expenditures Payroll Employment Receipts Receipts County ($ Millions) ($ Millions) (Thousands) ($ Millions) ($ Millions)
FAIRFAX CITY 119.89 23.71 1.32 5.04 3.30 ROCKBRIDGE 119.24 18.24 0.93 5.16 2.60 STAFFORD 116.10 23.24 1.26 4.72 3.43 AUGUSTA 110.10 19.17 1.01 4.80 3.68 HARRISONBURG CITY 106.88 20.12 1.06 4.49 3.94
WINCHESTER CITY 100.89 18.63 0.99 4.19 3.39 FRANKLIN 96.59 20.99 1.19 3.63 2.79 WASHINGTON 96.47 20.51 1.14 4.23 2.30 CAROLINE 88.46 11.65 0.63 4.08 1.93 MIDDLESEX 87.71 19.86 1.11 3.87 2.54
LANCASTER 82.56 14.05 0.75 3.55 2.21 BEDFORD 80.97 17.01 0.97 3.74 2.35 DANVILLE CITY 80.54 15.44 0.84 3.39 1.90 PORTSMOUTH CITY 75.86 14.38 0.76 3.44 2.97 NORTHAMPTON 71.16 13.43 0.77 3.28 1.34
PRINCE GEORGE 68.72 12.67 0.69 2.92 1.01 PITTSYLVANIA 67.89 12.49 0.62 3.56 1.92 LOUISA 67.59 13.85 0.77 3.08 1.96 CARROLL 65.00 11.92 0.65 2.93 1.88 SUFFOLK CITY 64.93 11.71 0.62 3.46 1.95
MANASSAS CITY 64.65 10.56 0.56 2.89 1.66 SALEM CITY 63.21 12.35 0.71 2.51 2.29 PAGE 61.91 12.67 0.69 2.98 2.26 WESTMORELAND 56.58 12.83 0.70 2.50 1.64 NORTHUMBERLAND 55.53 10.90 0.58 2.34 1.58
BOTETOURT 53.81 8.54 0.45 2.31 1.49 FLUVANNA 52.48 10.25 0.53 2.37 0.69 PULASKI 51.48 10.47 0.59 2.18 1.48 STAUNTON CITY 49.61 9.95 0.53 1.96 1.81 TAZEWELL 48.91 10.20 0.57 2.06 0.66
BRISTOL CITY 46.15 8.43 0.45 2.10 1.33 HENRY 45.40 9.50 0.52 1.90 0.88 ORANGE 43.66 10.24 0.56 1.82 1.27 PETERSBURG CITY 43.65 7.73 0.39 2.11 1.24 GLOUCESTER 43.43 8.22 0.45 1.90 1.25
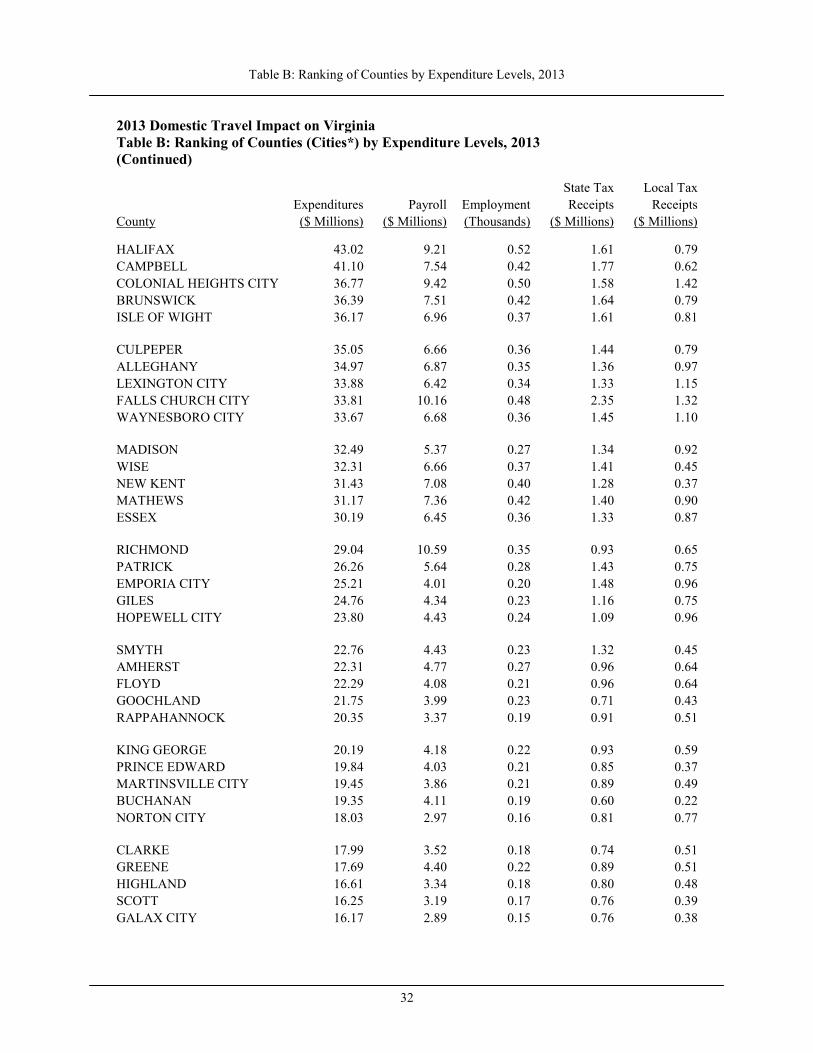
Table B: Ranking of Counties by Expenditure Levels, 2013
32
2013 Domestic Travel Impact on Virginia
Table B: Ranking of Counties (Cities*) by Expenditure Levels, 2013 (Continued)
State Tax Local Tax Expenditures Payroll Employment Receipts Receipts County ($ Millions) ($ Millions) (Thousands) ($ Millions) ($ Millions)
HALIFAX 43.02 9.21 0.52 1.61 0.79 CAMPBELL 41.10 7.54 0.42 1.77 0.62 COLONIAL HEIGHTS CITY 36.77 9.42 0.50 1.58 1.42 BRUNSWICK 36.39 7.51 0.42 1.64 0.79 ISLE OF WIGHT 36.17 6.96 0.37 1.61 0.81
CULPEPER 35.05 6.66 0.36 1.44 0.79 ALLEGHANY 34.97 6.87 0.35 1.36 0.97 LEXINGTON CITY 33.88 6.42 0.34 1.33 1.15 FALLS CHURCH CITY 33.81 10.16 0.48 2.35 1.32 WAYNESBORO CITY 33.67 6.68 0.36 1.45 1.10
MADISON 32.49 5.37 0.27 1.34 0.92 WISE 32.31 6.66 0.37 1.41 0.45 NEW KENT 31.43 7.08 0.40 1.28 0.37 MATHEWS 31.17 7.36 0.42 1.40 0.90 ESSEX 30.19 6.45 0.36 1.33 0.87
RICHMOND 29.04 10.59 0.35 0.93 0.65 PATRICK 26.26 5.64 0.28 1.43 0.75 EMPORIA CITY 25.21 4.01 0.20 1.48 0.96 GILES 24.76 4.34 0.23 1.16 0.75 HOPEWELL CITY 23.80 4.43 0.24 1.09 0.96
SMYTH 22.76 4.43 0.23 1.32 0.45 AMHERST 22.31 4.77 0.27 0.96 0.64 FLOYD 22.29 4.08 0.21 0.96 0.64 GOOCHLAND 21.75 3.99 0.23 0.71 0.43 RAPPAHANNOCK 20.35 3.37 0.19 0.91 0.51
KING GEORGE 20.19 4.18 0.22 0.93 0.59 PRINCE EDWARD 19.84 4.03 0.21 0.85 0.37 MARTINSVILLE CITY 19.45 3.86 0.21 0.89 0.49 BUCHANAN 19.35 4.11 0.19 0.60 0.22 NORTON CITY 18.03 2.97 0.16 0.81 0.77
CLARKE 17.99 3.52 0.18 0.74 0.51 GREENE 17.69 4.40 0.22 0.89 0.51 HIGHLAND 16.61 3.34 0.18 0.80 0.48 SCOTT 16.25 3.19 0.17 0.76 0.39 GALAX CITY 16.17 2.89 0.15 0.76 0.38

Table B: Ranking of Counties by Expenditure Levels, 2013
33
2013 Domestic Travel Impact on Virginia
Table B: Ranking of Counties (Cities*) by Expenditure Levels, 2013 (Continued)
State Tax Local Tax Expenditures Payroll Employment Receipts Receipts County ($ Millions) ($ Millions) (Thousands) ($ Millions) ($ Millions)
GREENSVILLE 15.74 2.50 0.13 0.69 0.35 RADFORD CITY 15.07 2.64 0.14 0.68 0.41 SOUTHAMPTON 14.49 2.92 0.15 0.75 0.27 GRAYSON 13.95 3.11 0.14 0.56 0.40 FRANKLIN CITY 13.46 2.38 0.12 0.79 0.52
BLAND 13.07 2.64 0.13 0.51 0.37 DINWIDDIE 12.99 2.66 0.13 0.52 0.39 CHARLOTTE 12.93 2.57 0.14 0.55 0.34 NOTTOWAY 12.68 2.40 0.12 0.71 0.32 RUSSELL 12.15 2.77 0.15 0.59 0.19
LEE 11.79 3.17 0.17 0.56 0.28 BUCKINGHAM 11.33 2.35 0.12 0.54 0.32 BEDFORD CITY 11.21 1.96 0.10 0.50 0.42 SURRY 9.84 2.21 0.10 0.42 0.28 APPOMATTOX 9.77 1.90 0.10 0.45 0.28
SUSSEX 9.18 1.96 0.09 0.54 0.18 KING WILLIAM 9.08 2.06 0.09 0.35 0.22 POWHATAN 8.66 1.59 0.09 0.29 0.18 DICKENSON 7.27 1.55 0.07 0.39 0.16 CUMBERLAND 5.56 0.99 0.05 0.28 0.16
LUNENBURG 5.50 1.27 0.06 0.22 0.16 COVINGTON CITY 5.49 1.25 0.06 0.21 0.15 AMELIA 5.32 1.12 0.05 0.29 0.15 CRAIG 3.97 0.80 0.05 0.16 0.14 BUENA VISTA CITY 3.96 0.87 0.04 0.16 0.10
KING AND QUEEN 3.57 0.74 0.04 0.17 0.10 POQUOSON CITY 2.85 0.48 0.03 0.13 0.09 CHARLES CITY 2.78 0.62 0.03 0.11 0.08 MANASSAS PARK CITY 1.34 0.30 0.01 0.06 0.05 STATE TOTALS $21,511.98 $4,894.57 213.00 $842.09 $581.85 ----------------------------------------------
©2014 U.S. Travel Association *County equivalents.
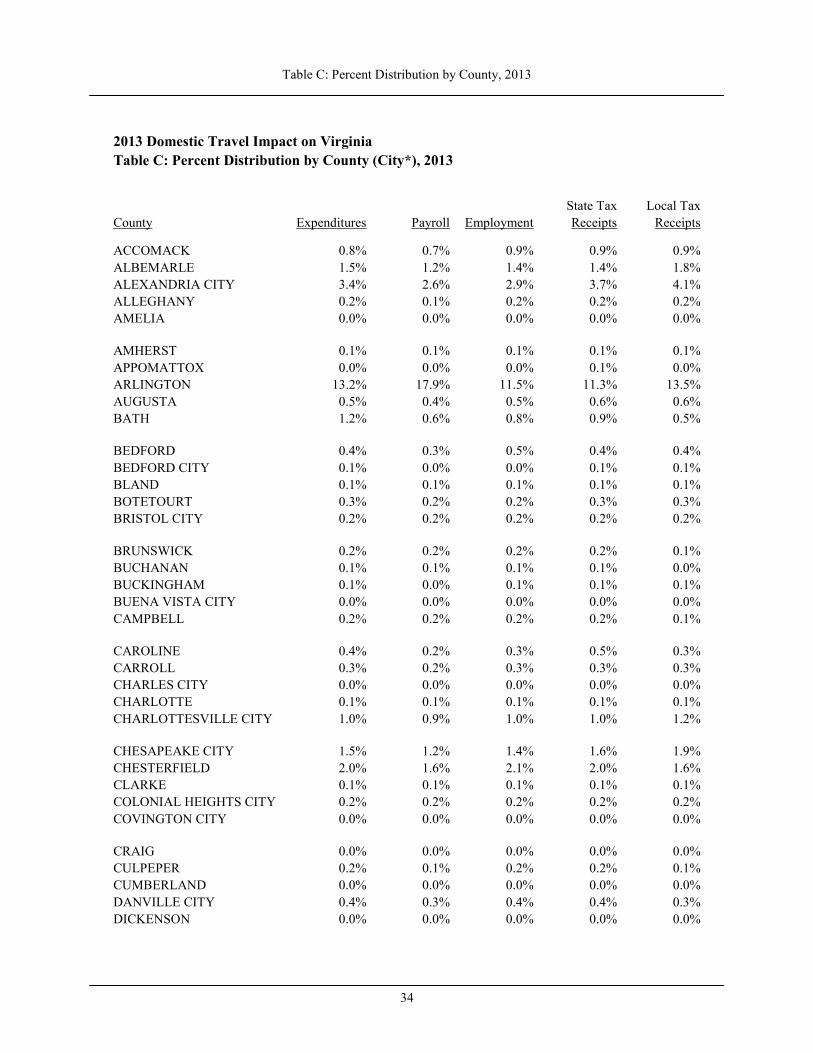
Table C: Percent Distribution by County, 2013
34
2013 Domestic Travel Impact on Virginia Table C: Percent Distribution by County (City*), 2013
State Tax Local Tax County Expenditures Payroll Employment Receipts Receipts
ACCOMACK 0.8% 0.7% 0.9% 0.9% 0.9% ALBEMARLE 1.5% 1.2% 1.4% 1.4% 1.8% ALEXANDRIA CITY 3.4% 2.6% 2.9% 3.7% 4.1% ALLEGHANY 0.2% 0.1% 0.2% 0.2% 0.2% AMELIA 0.0% 0.0% 0.0% 0.0% 0.0%
AMHERST 0.1% 0.1% 0.1% 0.1% 0.1% APPOMATTOX 0.0% 0.0% 0.0% 0.1% 0.0% ARLINGTON 13.2% 17.9% 11.5% 11.3% 13.5% AUGUSTA 0.5% 0.4% 0.5% 0.6% 0.6% BATH 1.2% 0.6% 0.8% 0.9% 0.5%
BEDFORD 0.4% 0.3% 0.5% 0.4% 0.4% BEDFORD CITY 0.1% 0.0% 0.0% 0.1% 0.1% BLAND 0.1% 0.1% 0.1% 0.1% 0.1% BOTETOURT 0.3% 0.2% 0.2% 0.3% 0.3% BRISTOL CITY 0.2% 0.2% 0.2% 0.2% 0.2%
BRUNSWICK 0.2% 0.2% 0.2% 0.2% 0.1% BUCHANAN 0.1% 0.1% 0.1% 0.1% 0.0% BUCKINGHAM 0.1% 0.0% 0.1% 0.1% 0.1% BUENA VISTA CITY 0.0% 0.0% 0.0% 0.0% 0.0% CAMPBELL 0.2% 0.2% 0.2% 0.2% 0.1%
CAROLINE 0.4% 0.2% 0.3% 0.5% 0.3% CARROLL 0.3% 0.2% 0.3% 0.3% 0.3% CHARLES CITY 0.0% 0.0% 0.0% 0.0% 0.0% CHARLOTTE 0.1% 0.1% 0.1% 0.1% 0.1% CHARLOTTESVILLE CITY 1.0% 0.9% 1.0% 1.0% 1.2%
CHESAPEAKE CITY 1.5% 1.2% 1.4% 1.6% 1.9% CHESTERFIELD 2.0% 1.6% 2.1% 2.0% 1.6% CLARKE 0.1% 0.1% 0.1% 0.1% 0.1% COLONIAL HEIGHTS CITY 0.2% 0.2% 0.2% 0.2% 0.2% COVINGTON CITY 0.0% 0.0% 0.0% 0.0% 0.0%
CRAIG 0.0% 0.0% 0.0% 0.0% 0.0% CULPEPER 0.2% 0.1% 0.2% 0.2% 0.1% CUMBERLAND 0.0% 0.0% 0.0% 0.0% 0.0% DANVILLE CITY 0.4% 0.3% 0.4% 0.4% 0.3% DICKENSON 0.0% 0.0% 0.0% 0.0% 0.0%
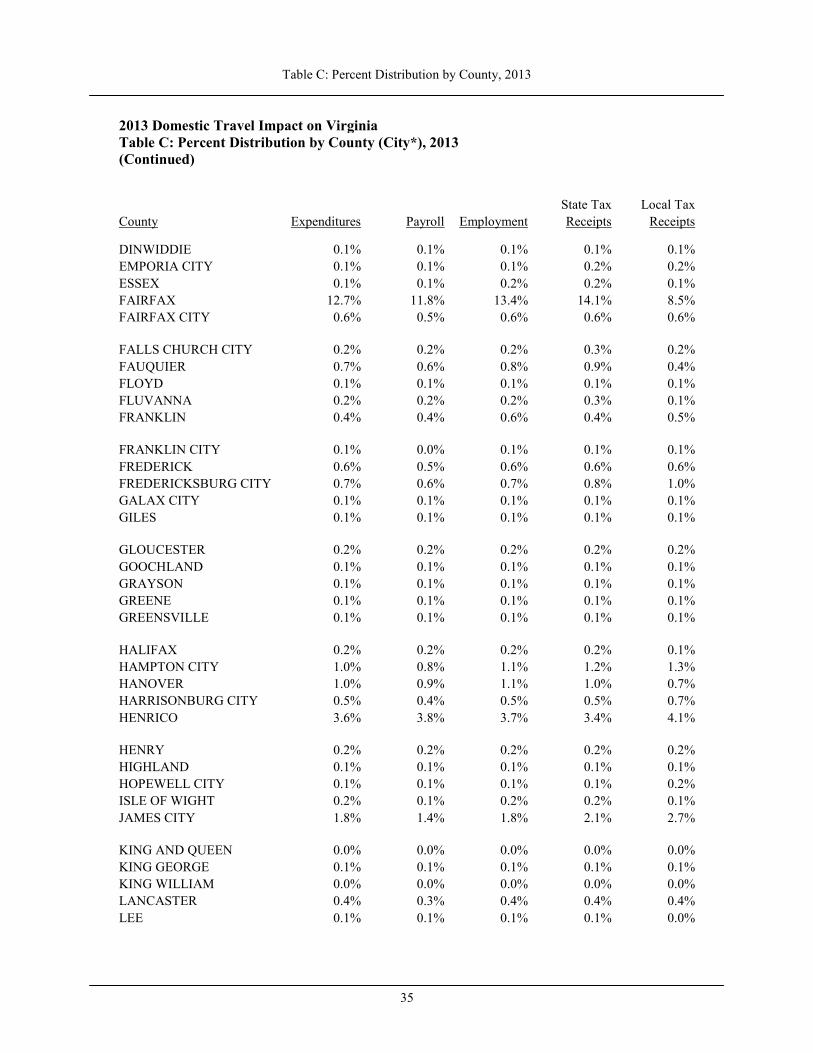
Table C: Percent Distribution by County, 2013
35
2013 Domestic Travel Impact on Virginia
Table C: Percent Distribution by County (City*), 2013 (Continued)
State Tax Local Tax County Expenditures Payroll Employment Receipts Receipts
DINWIDDIE 0.1% 0.1% 0.1% 0.1% 0.1% EMPORIA CITY 0.1% 0.1% 0.1% 0.2% 0.2% ESSEX 0.1% 0.1% 0.2% 0.2% 0.1% FAIRFAX 12.7% 11.8% 13.4% 14.1% 8.5% FAIRFAX CITY 0.6% 0.5% 0.6% 0.6% 0.6%
FALLS CHURCH CITY 0.2% 0.2% 0.2% 0.3% 0.2% FAUQUIER 0.7% 0.6% 0.8% 0.9% 0.4% FLOYD 0.1% 0.1% 0.1% 0.1% 0.1% FLUVANNA 0.2% 0.2% 0.2% 0.3% 0.1% FRANKLIN 0.4% 0.4% 0.6% 0.4% 0.5%
FRANKLIN CITY 0.1% 0.0% 0.1% 0.1% 0.1% FREDERICK 0.6% 0.5% 0.6% 0.6% 0.6% FREDERICKSBURG CITY 0.7% 0.6% 0.7% 0.8% 1.0% GALAX CITY 0.1% 0.1% 0.1% 0.1% 0.1% GILES 0.1% 0.1% 0.1% 0.1% 0.1%
GLOUCESTER 0.2% 0.2% 0.2% 0.2% 0.2% GOOCHLAND 0.1% 0.1% 0.1% 0.1% 0.1% GRAYSON 0.1% 0.1% 0.1% 0.1% 0.1% GREENE 0.1% 0.1% 0.1% 0.1% 0.1% GREENSVILLE 0.1% 0.1% 0.1% 0.1% 0.1%
HALIFAX 0.2% 0.2% 0.2% 0.2% 0.1% HAMPTON CITY 1.0% 0.8% 1.1% 1.2% 1.3% HANOVER 1.0% 0.9% 1.1% 1.0% 0.7% HARRISONBURG CITY 0.5% 0.4% 0.5% 0.5% 0.7% HENRICO 3.6% 3.8% 3.7% 3.4% 4.1%
HENRY 0.2% 0.2% 0.2% 0.2% 0.2% HIGHLAND 0.1% 0.1% 0.1% 0.1% 0.1% HOPEWELL CITY 0.1% 0.1% 0.1% 0.1% 0.2% ISLE OF WIGHT 0.2% 0.1% 0.2% 0.2% 0.1% JAMES CITY 1.8% 1.4% 1.8% 2.1% 2.7%
KING AND QUEEN 0.0% 0.0% 0.0% 0.0% 0.0% KING GEORGE 0.1% 0.1% 0.1% 0.1% 0.1% KING WILLIAM 0.0% 0.0% 0.0% 0.0% 0.0% LANCASTER 0.4% 0.3% 0.4% 0.4% 0.4% LEE 0.1% 0.1% 0.1% 0.1% 0.0%
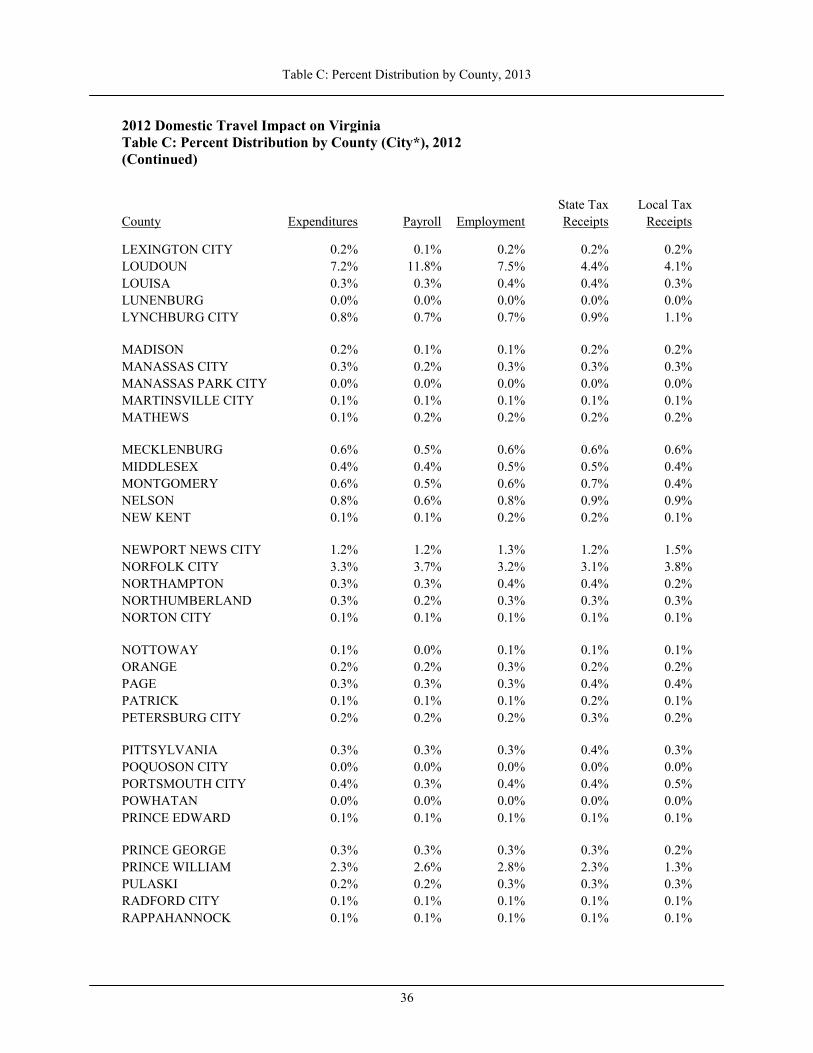
Table C: Percent Distribution by County, 2013
36
2012 Domestic Travel Impact on Virginia
Table C: Percent Distribution by County (City*), 2012 (Continued)
State Tax Local Tax County Expenditures Payroll Employment Receipts Receipts
LEXINGTON CITY 0.2% 0.1% 0.2% 0.2% 0.2% LOUDOUN 7.2% 11.8% 7.5% 4.4% 4.1% LOUISA 0.3% 0.3% 0.4% 0.4% 0.3% LUNENBURG 0.0% 0.0% 0.0% 0.0% 0.0% LYNCHBURG CITY 0.8% 0.7% 0.7% 0.9% 1.1%
MADISON 0.2% 0.1% 0.1% 0.2% 0.2% MANASSAS CITY 0.3% 0.2% 0.3% 0.3% 0.3% MANASSAS PARK CITY 0.0% 0.0% 0.0% 0.0% 0.0% MARTINSVILLE CITY 0.1% 0.1% 0.1% 0.1% 0.1% MATHEWS 0.1% 0.2% 0.2% 0.2% 0.2%
MECKLENBURG 0.6% 0.5% 0.6% 0.6% 0.6% MIDDLESEX 0.4% 0.4% 0.5% 0.5% 0.4% MONTGOMERY 0.6% 0.5% 0.6% 0.7% 0.4% NELSON 0.8% 0.6% 0.8% 0.9% 0.9% NEW KENT 0.1% 0.1% 0.2% 0.2% 0.1%
NEWPORT NEWS CITY 1.2% 1.2% 1.3% 1.2% 1.5% NORFOLK CITY 3.3% 3.7% 3.2% 3.1% 3.8% NORTHAMPTON 0.3% 0.3% 0.4% 0.4% 0.2% NORTHUMBERLAND 0.3% 0.2% 0.3% 0.3% 0.3% NORTON CITY 0.1% 0.1% 0.1% 0.1% 0.1%
NOTTOWAY 0.1% 0.0% 0.1% 0.1% 0.1% ORANGE 0.2% 0.2% 0.3% 0.2% 0.2% PAGE 0.3% 0.3% 0.3% 0.4% 0.4% PATRICK 0.1% 0.1% 0.1% 0.2% 0.1% PETERSBURG CITY 0.2% 0.2% 0.2% 0.3% 0.2%
PITTSYLVANIA 0.3% 0.3% 0.3% 0.4% 0.3% POQUOSON CITY 0.0% 0.0% 0.0% 0.0% 0.0% PORTSMOUTH CITY 0.4% 0.3% 0.4% 0.4% 0.5% POWHATAN 0.0% 0.0% 0.0% 0.0% 0.0% PRINCE EDWARD 0.1% 0.1% 0.1% 0.1% 0.1%
PRINCE GEORGE 0.3% 0.3% 0.3% 0.3% 0.2% PRINCE WILLIAM 2.3% 2.6% 2.8% 2.3% 1.3% PULASKI 0.2% 0.2% 0.3% 0.3% 0.3% RADFORD CITY 0.1% 0.1% 0.1% 0.1% 0.1% RAPPAHANNOCK 0.1% 0.1% 0.1% 0.1% 0.1%
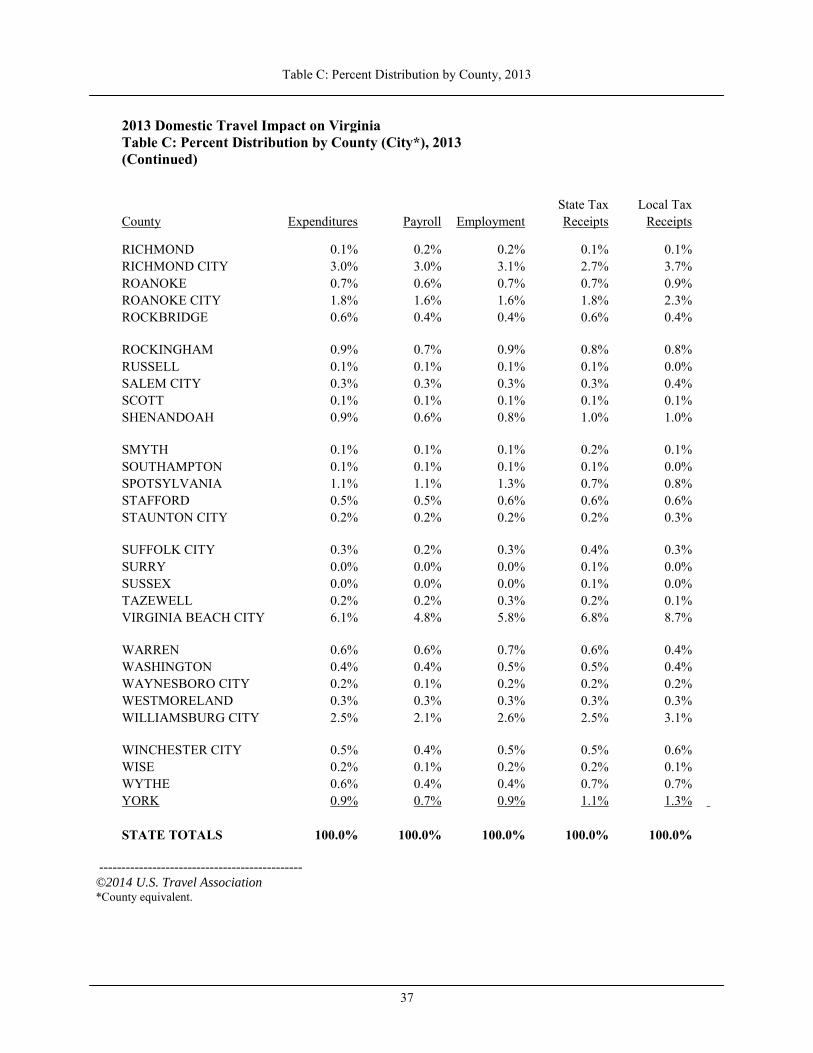
Table C: Percent Distribution by County, 2013
37
2013 Domestic Travel Impact on Virginia
Table C: Percent Distribution by County (City*), 2013 (Continued)
State Tax Local Tax County Expenditures Payroll Employment Receipts Receipts
RICHMOND 0.1% 0.2% 0.2% 0.1% 0.1% RICHMOND CITY 3.0% 3.0% 3.1% 2.7% 3.7% ROANOKE 0.7% 0.6% 0.7% 0.7% 0.9% ROANOKE CITY 1.8% 1.6% 1.6% 1.8% 2.3% ROCKBRIDGE 0.6% 0.4% 0.4% 0.6% 0.4%
ROCKINGHAM 0.9% 0.7% 0.9% 0.8% 0.8% RUSSELL 0.1% 0.1% 0.1% 0.1% 0.0% SALEM CITY 0.3% 0.3% 0.3% 0.3% 0.4% SCOTT 0.1% 0.1% 0.1% 0.1% 0.1% SHENANDOAH 0.9% 0.6% 0.8% 1.0% 1.0%
SMYTH 0.1% 0.1% 0.1% 0.2% 0.1% SOUTHAMPTON 0.1% 0.1% 0.1% 0.1% 0.0% SPOTSYLVANIA 1.1% 1.1% 1.3% 0.7% 0.8% STAFFORD 0.5% 0.5% 0.6% 0.6% 0.6% STAUNTON CITY 0.2% 0.2% 0.2% 0.2% 0.3%
SUFFOLK CITY 0.3% 0.2% 0.3% 0.4% 0.3% SURRY 0.0% 0.0% 0.0% 0.1% 0.0% SUSSEX 0.0% 0.0% 0.0% 0.1% 0.0% TAZEWELL 0.2% 0.2% 0.3% 0.2% 0.1% VIRGINIA BEACH CITY 6.1% 4.8% 5.8% 6.8% 8.7%
WARREN 0.6% 0.6% 0.7% 0.6% 0.4% WASHINGTON 0.4% 0.4% 0.5% 0.5% 0.4% WAYNESBORO CITY 0.2% 0.1% 0.2% 0.2% 0.2% WESTMORELAND 0.3% 0.3% 0.3% 0.3% 0.3% WILLIAMSBURG CITY 2.5% 2.1% 2.6% 2.5% 3.1%
WINCHESTER CITY 0.5% 0.4% 0.5% 0.5% 0.6% WISE 0.2% 0.1% 0.2% 0.2% 0.1% WYTHE 0.6% 0.4% 0.4% 0.7% 0.7% YORK 0.9% 0.7% 0.9% 1.1% 1.3% STATE TOTALS 100.0% 100.0% 100.0% 100.0% 100.0%
----------------------------------------------
©2014 U.S. Travel Association *County equivalent.
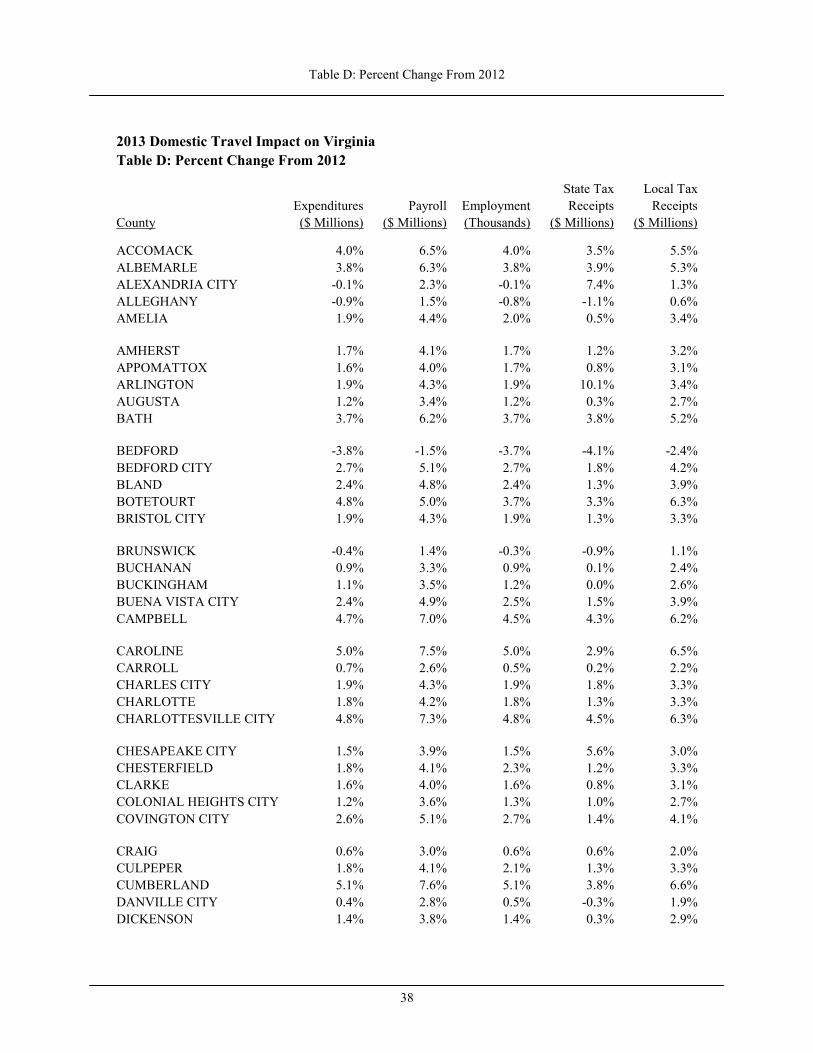
Table D: Percent Change From 2012
38
2013 Domestic Travel Impact on Virginia Table D: Percent Change From 2012
State Tax Local Tax Expenditures Payroll Employment Receipts Receipts County ($ Millions) ($ Millions) (Thousands) ($ Millions) ($ Millions)
ACCOMACK 4.0% 6.5% 4.0% 3.5% 5.5% ALBEMARLE 3.8% 6.3% 3.8% 3.9% 5.3% ALEXANDRIA CITY -0.1% 2.3% -0.1% 7.4% 1.3% ALLEGHANY -0.9% 1.5% -0.8% -1.1% 0.6% AMELIA 1.9% 4.4% 2.0% 0.5% 3.4%
AMHERST 1.7% 4.1% 1.7% 1.2% 3.2% APPOMATTOX 1.6% 4.0% 1.7% 0.8% 3.1% ARLINGTON 1.9% 4.3% 1.9% 10.1% 3.4% AUGUSTA 1.2% 3.4% 1.2% 0.3% 2.7% BATH 3.7% 6.2% 3.7% 3.8% 5.2%
BEDFORD -3.8% -1.5% -3.7% -4.1% -2.4% BEDFORD CITY 2.7% 5.1% 2.7% 1.8% 4.2% BLAND 2.4% 4.8% 2.4% 1.3% 3.9% BOTETOURT 4.8% 5.0% 3.7% 3.3% 6.3% BRISTOL CITY 1.9% 4.3% 1.9% 1.3% 3.3%
BRUNSWICK -0.4% 1.4% -0.3% -0.9% 1.1% BUCHANAN 0.9% 3.3% 0.9% 0.1% 2.4% BUCKINGHAM 1.1% 3.5% 1.2% 0.0% 2.6% BUENA VISTA CITY 2.4% 4.9% 2.5% 1.5% 3.9% CAMPBELL 4.7% 7.0% 4.5% 4.3% 6.2%
CAROLINE 5.0% 7.5% 5.0% 2.9% 6.5% CARROLL 0.7% 2.6% 0.5% 0.2% 2.2% CHARLES CITY 1.9% 4.3% 1.9% 1.8% 3.3% CHARLOTTE 1.8% 4.2% 1.8% 1.3% 3.3% CHARLOTTESVILLE CITY 4.8% 7.3% 4.8% 4.5% 6.3%
CHESAPEAKE CITY 1.5% 3.9% 1.5% 5.6% 3.0% CHESTERFIELD 1.8% 4.1% 2.3% 1.2% 3.3% CLARKE 1.6% 4.0% 1.6% 0.8% 3.1% COLONIAL HEIGHTS CITY 1.2% 3.6% 1.3% 1.0% 2.7% COVINGTON CITY 2.6% 5.1% 2.7% 1.4% 4.1%
CRAIG 0.6% 3.0% 0.6% 0.6% 2.0% CULPEPER 1.8% 4.1% 2.1% 1.3% 3.3% CUMBERLAND 5.1% 7.6% 5.1% 3.8% 6.6% DANVILLE CITY 0.4% 2.8% 0.5% -0.3% 1.9% DICKENSON 1.4% 3.8% 1.4% 0.3% 2.9%
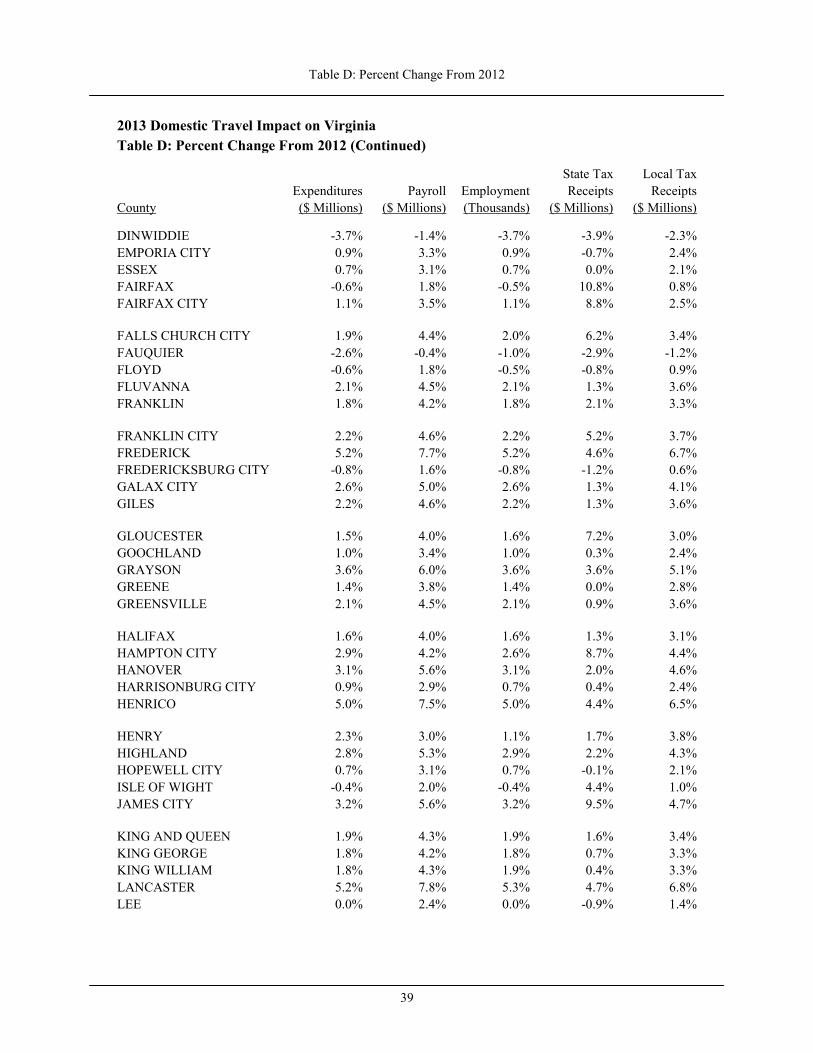
Table D: Percent Change From 2012
39
2013 Domestic Travel Impact on Virginia Table D: Percent Change From 2012 (Continued)
State Tax Local Tax Expenditures Payroll Employment Receipts Receipts County ($ Millions) ($ Millions) (Thousands) ($ Millions) ($ Millions)
DINWIDDIE -3.7% -1.4% -3.7% -3.9% -2.3% EMPORIA CITY 0.9% 3.3% 0.9% -0.7% 2.4% ESSEX 0.7% 3.1% 0.7% 0.0% 2.1% FAIRFAX -0.6% 1.8% -0.5% 10.8% 0.8% FAIRFAX CITY 1.1% 3.5% 1.1% 8.8% 2.5%
FALLS CHURCH CITY 1.9% 4.4% 2.0% 6.2% 3.4% FAUQUIER -2.6% -0.4% -1.0% -2.9% -1.2% FLOYD -0.6% 1.8% -0.5% -0.8% 0.9% FLUVANNA 2.1% 4.5% 2.1% 1.3% 3.6% FRANKLIN 1.8% 4.2% 1.8% 2.1% 3.3%
FRANKLIN CITY 2.2% 4.6% 2.2% 5.2% 3.7% FREDERICK 5.2% 7.7% 5.2% 4.6% 6.7% FREDERICKSBURG CITY -0.8% 1.6% -0.8% -1.2% 0.6% GALAX CITY 2.6% 5.0% 2.6% 1.3% 4.1% GILES 2.2% 4.6% 2.2% 1.3% 3.6%
GLOUCESTER 1.5% 4.0% 1.6% 7.2% 3.0% GOOCHLAND 1.0% 3.4% 1.0% 0.3% 2.4% GRAYSON 3.6% 6.0% 3.6% 3.6% 5.1% GREENE 1.4% 3.8% 1.4% 0.0% 2.8% GREENSVILLE 2.1% 4.5% 2.1% 0.9% 3.6%
HALIFAX 1.6% 4.0% 1.6% 1.3% 3.1% HAMPTON CITY 2.9% 4.2% 2.6% 8.7% 4.4% HANOVER 3.1% 5.6% 3.1% 2.0% 4.6% HARRISONBURG CITY 0.9% 2.9% 0.7% 0.4% 2.4% HENRICO 5.0% 7.5% 5.0% 4.4% 6.5%
HENRY 2.3% 3.0% 1.1% 1.7% 3.8% HIGHLAND 2.8% 5.3% 2.9% 2.2% 4.3% HOPEWELL CITY 0.7% 3.1% 0.7% -0.1% 2.1% ISLE OF WIGHT -0.4% 2.0% -0.4% 4.4% 1.0% JAMES CITY 3.2% 5.6% 3.2% 9.5% 4.7%
KING AND QUEEN 1.9% 4.3% 1.9% 1.6% 3.4% KING GEORGE 1.8% 4.2% 1.8% 0.7% 3.3% KING WILLIAM 1.8% 4.3% 1.9% 0.4% 3.3% LANCASTER 5.2% 7.8% 5.3% 4.7% 6.8% LEE 0.0% 2.4% 0.0% -0.9% 1.4%
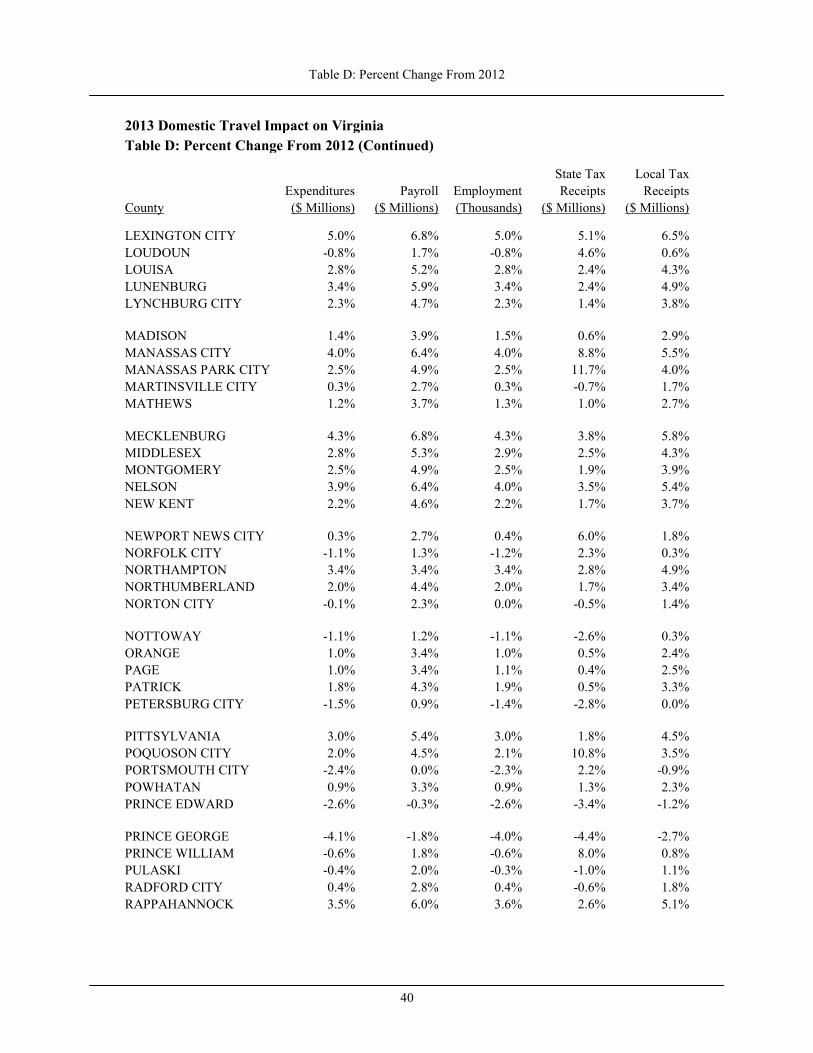
Table D: Percent Change From 2012
40
2013 Domestic Travel Impact on Virginia Table D: Percent Change From 2012 (Continued)
State Tax Local Tax Expenditures Payroll Employment Receipts Receipts County ($ Millions) ($ Millions) (Thousands) ($ Millions) ($ Millions)
LEXINGTON CITY 5.0% 6.8% 5.0% 5.1% 6.5% LOUDOUN -0.8% 1.7% -0.8% 4.6% 0.6% LOUISA 2.8% 5.2% 2.8% 2.4% 4.3% LUNENBURG 3.4% 5.9% 3.4% 2.4% 4.9% LYNCHBURG CITY 2.3% 4.7% 2.3% 1.4% 3.8%
MADISON 1.4% 3.9% 1.5% 0.6% 2.9% MANASSAS CITY 4.0% 6.4% 4.0% 8.8% 5.5% MANASSAS PARK CITY 2.5% 4.9% 2.5% 11.7% 4.0% MARTINSVILLE CITY 0.3% 2.7% 0.3% -0.7% 1.7% MATHEWS 1.2% 3.7% 1.3% 1.0% 2.7%
MECKLENBURG 4.3% 6.8% 4.3% 3.8% 5.8% MIDDLESEX 2.8% 5.3% 2.9% 2.5% 4.3% MONTGOMERY 2.5% 4.9% 2.5% 1.9% 3.9% NELSON 3.9% 6.4% 4.0% 3.5% 5.4% NEW KENT 2.2% 4.6% 2.2% 1.7% 3.7%
NEWPORT NEWS CITY 0.3% 2.7% 0.4% 6.0% 1.8% NORFOLK CITY -1.1% 1.3% -1.2% 2.3% 0.3% NORTHAMPTON 3.4% 3.4% 3.4% 2.8% 4.9% NORTHUMBERLAND 2.0% 4.4% 2.0% 1.7% 3.4% NORTON CITY -0.1% 2.3% 0.0% -0.5% 1.4%
NOTTOWAY -1.1% 1.2% -1.1% -2.6% 0.3% ORANGE 1.0% 3.4% 1.0% 0.5% 2.4% PAGE 1.0% 3.4% 1.1% 0.4% 2.5% PATRICK 1.8% 4.3% 1.9% 0.5% 3.3% PETERSBURG CITY -1.5% 0.9% -1.4% -2.8% 0.0%
PITTSYLVANIA 3.0% 5.4% 3.0% 1.8% 4.5% POQUOSON CITY 2.0% 4.5% 2.1% 10.8% 3.5% PORTSMOUTH CITY -2.4% 0.0% -2.3% 2.2% -0.9% POWHATAN 0.9% 3.3% 0.9% 1.3% 2.3% PRINCE EDWARD -2.6% -0.3% -2.6% -3.4% -1.2%
PRINCE GEORGE -4.1% -1.8% -4.0% -4.4% -2.7% PRINCE WILLIAM -0.6% 1.8% -0.6% 8.0% 0.8% PULASKI -0.4% 2.0% -0.3% -1.0% 1.1% RADFORD CITY 0.4% 2.8% 0.4% -0.6% 1.8% RAPPAHANNOCK 3.5% 6.0% 3.6% 2.6% 5.1%
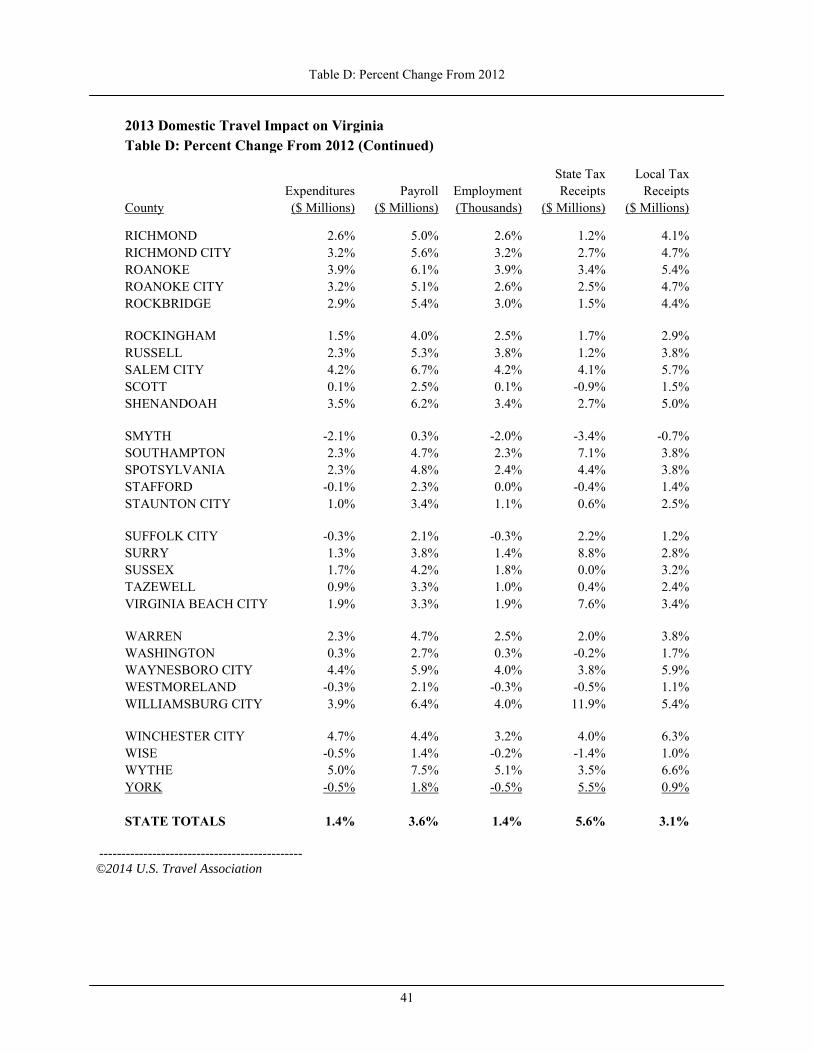
Table D: Percent Change From 2012
41
2013 Domestic Travel Impact on Virginia Table D: Percent Change From 2012 (Continued)
State Tax Local Tax Expenditures Payroll Employment Receipts Receipts County ($ Millions) ($ Millions) (Thousands) ($ Millions) ($ Millions)
RICHMOND 2.6% 5.0% 2.6% 1.2% 4.1% RICHMOND CITY 3.2% 5.6% 3.2% 2.7% 4.7% ROANOKE 3.9% 6.1% 3.9% 3.4% 5.4% ROANOKE CITY 3.2% 5.1% 2.6% 2.5% 4.7% ROCKBRIDGE 2.9% 5.4% 3.0% 1.5% 4.4%
ROCKINGHAM 1.5% 4.0% 2.5% 1.7% 2.9% RUSSELL 2.3% 5.3% 3.8% 1.2% 3.8% SALEM CITY 4.2% 6.7% 4.2% 4.1% 5.7% SCOTT 0.1% 2.5% 0.1% -0.9% 1.5% SHENANDOAH 3.5% 6.2% 3.4% 2.7% 5.0%
SMYTH -2.1% 0.3% -2.0% -3.4% -0.7% SOUTHAMPTON 2.3% 4.7% 2.3% 7.1% 3.8% SPOTSYLVANIA 2.3% 4.8% 2.4% 4.4% 3.8% STAFFORD -0.1% 2.3% 0.0% -0.4% 1.4% STAUNTON CITY 1.0% 3.4% 1.1% 0.6% 2.5%
SUFFOLK CITY -0.3% 2.1% -0.3% 2.2% 1.2% SURRY 1.3% 3.8% 1.4% 8.8% 2.8% SUSSEX 1.7% 4.2% 1.8% 0.0% 3.2% TAZEWELL 0.9% 3.3% 1.0% 0.4% 2.4% VIRGINIA BEACH CITY 1.9% 3.3% 1.9% 7.6% 3.4%
WARREN 2.3% 4.7% 2.5% 2.0% 3.8% WASHINGTON 0.3% 2.7% 0.3% -0.2% 1.7% WAYNESBORO CITY 4.4% 5.9% 4.0% 3.8% 5.9% WESTMORELAND -0.3% 2.1% -0.3% -0.5% 1.1% WILLIAMSBURG CITY 3.9% 6.4% 4.0% 11.9% 5.4%
WINCHESTER CITY 4.7% 4.4% 3.2% 4.0% 6.3% WISE -0.5% 1.4% -0.2% -1.4% 1.0% WYTHE 5.0% 7.5% 5.1% 3.5% 6.6% YORK -0.5% 1.8% -0.5% 5.5% 0.9% STATE TOTALS 1.4% 3.6% 1.4% 5.6% 3.1%
----------------------------------------------
©2014 U.S. Travel Association

Table E: Alphabetical by County, 2012
42
2012 Domestic Travel Impact on Virginia Table E: Alphabetical by County (City*), 2012
State Tax Local Tax Expenditures Payroll Employment Receipts Receipts County ($ Millions) ($ Millions) (Thousands) ($ Millions) ($ Millions)
ACCOMACK $163.39 $33.30 1.89 $7.42 $4.78 ALBEMARLE 303.98 53.40 2.89 11.60 10.21 ALEXANDRIA CITY 738.75 122.09 6.1578 29.17 23.75 ALLEGHANY 35.27 6.77 0.35 1.38 0.97 AMELIA 5.22 1.07 0.05 0.29 0.14
AMHERST 21.94 4.58 0.26 0.94 0.62 APPOMATTOX 9.62 1.82 0.10 0.45 0.27 ARLINGTON 2,779.94 841.30 23.93 86.10 75.84 AUGUSTA 108.77 18.53 1.00 4.78 3.58 BATH 241.72 28.52 1.61 7.21 2.90
BEDFORD 84.16 17.27 1.01 3.90 2.40 BEDFORD CITY 10.92 1.87 0.10 0.49 0.40 BLAND 12.77 2.52 0.13 0.50 0.36 BOTETOURT 51.36 8.13 0.43 2.24 1.41 BRISTOL CITY 45.30 8.08 0.44 2.07 1.29
BRUNSWICK 36.53 7.40 0.42 1.65 0.78 BUCHANAN 19.18 3.97 0.19 0.60 0.21 BUCKINGHAM 11.20 2.27 0.12 0.54 0.32 BUENA VISTA CITY 3.87 0.83 0.04 0.15 0.10 CAMPBELL 39.25 7.05 0.40 1.70 0.59
CAROLINE 84.27 10.83 0.60 3.97 1.81 CARROLL 64.52 11.62 0.64 2.93 1.83 CHARLES CITY 2.73 0.60 0.03 0.11 0.08 CHARLOTTE 12.70 2.47 0.13 0.54 0.32 CHARLOTTESVILLE CITY 198.73 40.83 2.12 7.93 6.50
CHESAPEAKE CITY 308.35 55.03 3.01 12.95 10.67 CHESTERFIELD 418.53 77.11 4.35 16.35 9.06 CLARKE 17.71 3.38 0.18 0.74 0.49 COLONIAL HEIGHTS CITY 36.32 9.09 0.50 1.56 1.39 COVINGTON CITY 5.34 1.19 0.05 0.21 0.14
CRAIG 3.95 0.78 0.05 0.16 0.13 CULPEPER 34.42 6.40 0.35 1.42 0.76 CUMBERLAND 5.29 0.92 0.05 0.27 0.15 DANVILLE CITY 80.20 15.02 0.83 3.40 1.86 DICKENSON 7.17 1.49 0.07 0.39 0.16
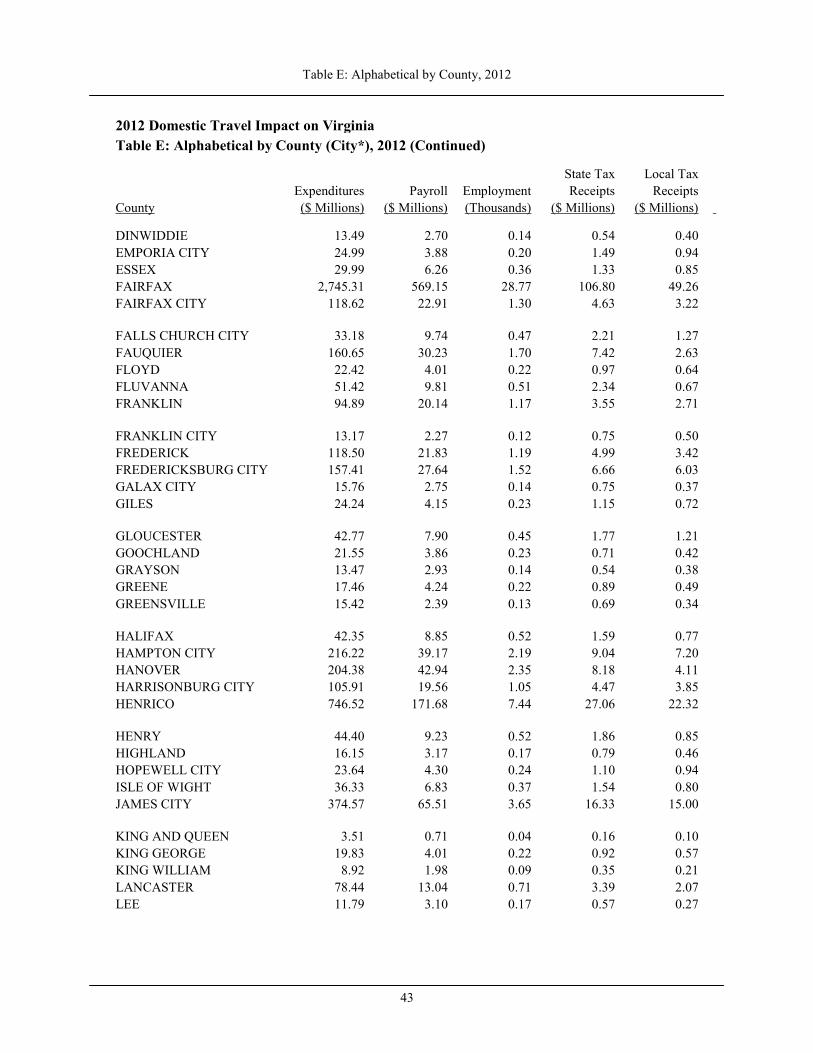
Table E: Alphabetical by County, 2012
43
2012 Domestic Travel Impact on Virginia Table E: Alphabetical by County (City*), 2012 (Continued)
State Tax Local Tax Expenditures Payroll Employment Receipts Receipts County ($ Millions) ($ Millions) (Thousands) ($ Millions) ($ Millions)
DINWIDDIE 13.49 2.70 0.14 0.54 0.40 EMPORIA CITY 24.99 3.88 0.20 1.49 0.94 ESSEX 29.99 6.26 0.36 1.33 0.85 FAIRFAX 2,745.31 569.15 28.77 106.80 49.26 FAIRFAX CITY 118.62 22.91 1.30 4.63 3.22
FALLS CHURCH CITY 33.18 9.74 0.47 2.21 1.27 FAUQUIER 160.65 30.23 1.70 7.42 2.63 FLOYD 22.42 4.01 0.22 0.97 0.64 FLUVANNA 51.42 9.81 0.51 2.34 0.67 FRANKLIN 94.89 20.14 1.17 3.55 2.71
FRANKLIN CITY 13.17 2.27 0.12 0.75 0.50 FREDERICK 118.50 21.83 1.19 4.99 3.42 FREDERICKSBURG CITY 157.41 27.64 1.52 6.66 6.03 GALAX CITY 15.76 2.75 0.14 0.75 0.37 GILES 24.24 4.15 0.23 1.15 0.72
GLOUCESTER 42.77 7.90 0.45 1.77 1.21 GOOCHLAND 21.55 3.86 0.23 0.71 0.42 GRAYSON 13.47 2.93 0.14 0.54 0.38 GREENE 17.46 4.24 0.22 0.89 0.49 GREENSVILLE 15.42 2.39 0.13 0.69 0.34
HALIFAX 42.35 8.85 0.52 1.59 0.77 HAMPTON CITY 216.22 39.17 2.19 9.04 7.20 HANOVER 204.38 42.94 2.35 8.18 4.11 HARRISONBURG CITY 105.91 19.56 1.05 4.47 3.85 HENRICO 746.52 171.68 7.44 27.06 22.32
HENRY 44.40 9.23 0.52 1.86 0.85 HIGHLAND 16.15 3.17 0.17 0.79 0.46 HOPEWELL CITY 23.64 4.30 0.24 1.10 0.94 ISLE OF WIGHT 36.33 6.83 0.37 1.54 0.80 JAMES CITY 374.57 65.51 3.65 16.33 15.00
KING AND QUEEN 3.51 0.71 0.04 0.16 0.10 KING GEORGE 19.83 4.01 0.22 0.92 0.57 KING WILLIAM 8.92 1.98 0.09 0.35 0.21 LANCASTER 78.44 13.04 0.71 3.39 2.07 LEE 11.79 3.10 0.17 0.57 0.27
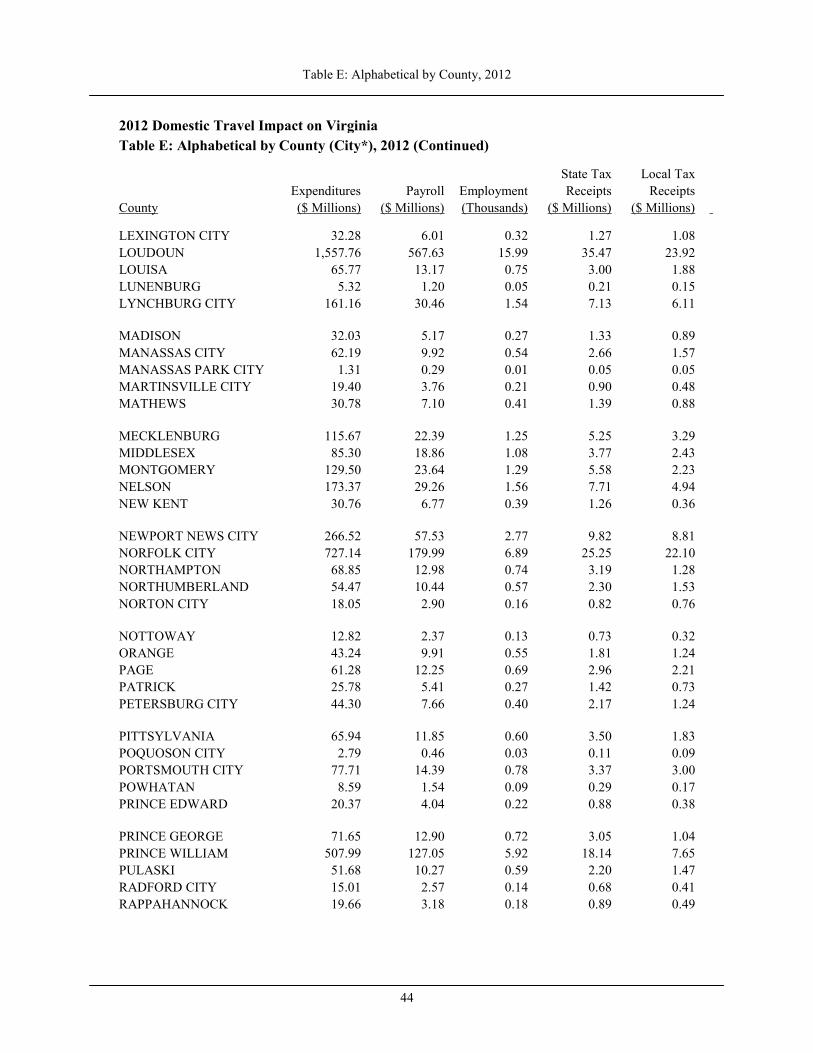
Table E: Alphabetical by County, 2012
44
2012 Domestic Travel Impact on Virginia Table E: Alphabetical by County (City*), 2012 (Continued)
State Tax Local Tax Expenditures Payroll Employment Receipts Receipts County ($ Millions) ($ Millions) (Thousands) ($ Millions) ($ Millions)
LEXINGTON CITY 32.28 6.01 0.32 1.27 1.08 LOUDOUN 1,557.76 567.63 15.99 35.47 23.92 LOUISA 65.77 13.17 0.75 3.00 1.88 LUNENBURG 5.32 1.20 0.05 0.21 0.15 LYNCHBURG CITY 161.16 30.46 1.54 7.13 6.11
MADISON 32.03 5.17 0.27 1.33 0.89 MANASSAS CITY 62.19 9.92 0.54 2.66 1.57 MANASSAS PARK CITY 1.31 0.29 0.01 0.05 0.05 MARTINSVILLE CITY 19.40 3.76 0.21 0.90 0.48 MATHEWS 30.78 7.10 0.41 1.39 0.88
MECKLENBURG 115.67 22.39 1.25 5.25 3.29 MIDDLESEX 85.30 18.86 1.08 3.77 2.43 MONTGOMERY 129.50 23.64 1.29 5.58 2.23 NELSON 173.37 29.26 1.56 7.71 4.94 NEW KENT 30.76 6.77 0.39 1.26 0.36
NEWPORT NEWS CITY 266.52 57.53 2.77 9.82 8.81 NORFOLK CITY 727.14 179.99 6.89 25.25 22.10 NORTHAMPTON 68.85 12.98 0.74 3.19 1.28 NORTHUMBERLAND 54.47 10.44 0.57 2.30 1.53 NORTON CITY 18.05 2.90 0.16 0.82 0.76
NOTTOWAY 12.82 2.37 0.13 0.73 0.32 ORANGE 43.24 9.91 0.55 1.81 1.24 PAGE 61.28 12.25 0.69 2.96 2.21 PATRICK 25.78 5.41 0.27 1.42 0.73 PETERSBURG CITY 44.30 7.66 0.40 2.17 1.24
PITTSYLVANIA 65.94 11.85 0.60 3.50 1.83 POQUOSON CITY 2.79 0.46 0.03 0.11 0.09 PORTSMOUTH CITY 77.71 14.39 0.78 3.37 3.00 POWHATAN 8.59 1.54 0.09 0.29 0.17 PRINCE EDWARD 20.37 4.04 0.22 0.88 0.38
PRINCE GEORGE 71.65 12.90 0.72 3.05 1.04 PRINCE WILLIAM 507.99 127.05 5.92 18.14 7.65 PULASKI 51.68 10.27 0.59 2.20 1.47 RADFORD CITY 15.01 2.57 0.14 0.68 0.41 RAPPAHANNOCK 19.66 3.18 0.18 0.89 0.49
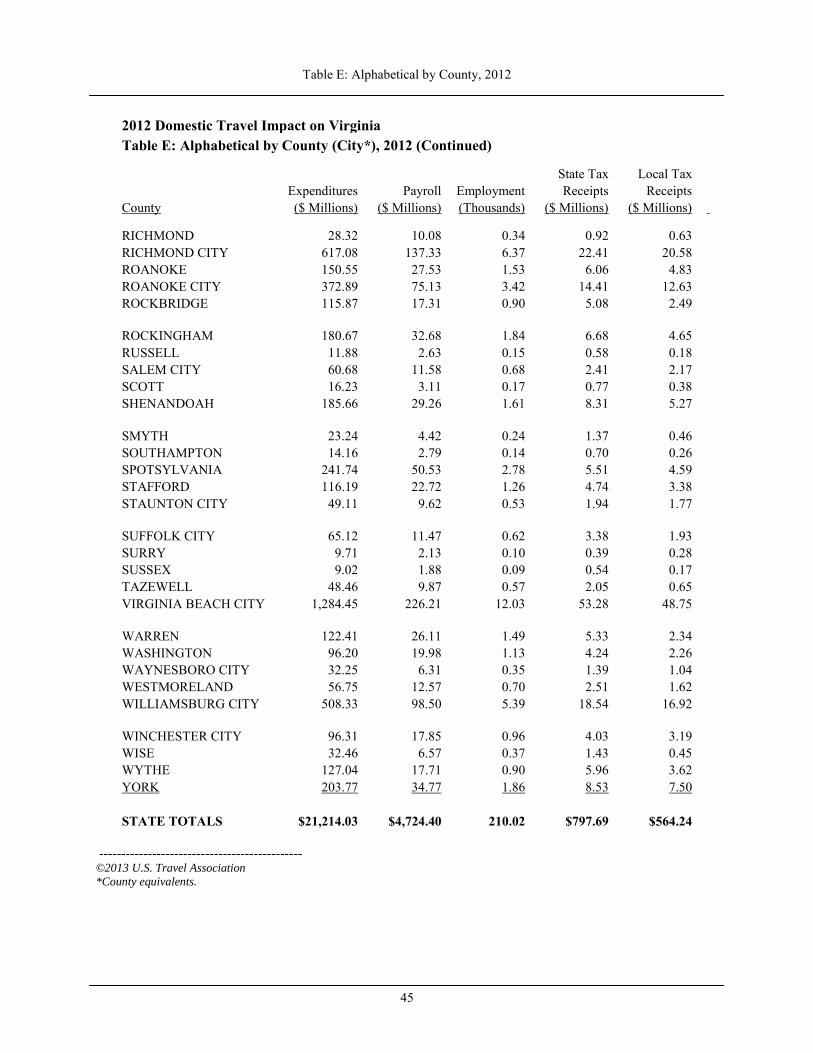
Table E: Alphabetical by County, 2012
45
2012 Domestic Travel Impact on Virginia Table E: Alphabetical by County (City*), 2012 (Continued)
State Tax Local Tax Expenditures Payroll Employment Receipts Receipts County ($ Millions) ($ Millions) (Thousands) ($ Millions) ($ Millions)
RICHMOND 28.32 10.08 0.34 0.92 0.63 RICHMOND CITY 617.08 137.33 6.37 22.41 20.58 ROANOKE 150.55 27.53 1.53 6.06 4.83 ROANOKE CITY 372.89 75.13 3.42 14.41 12.63 ROCKBRIDGE 115.87 17.31 0.90 5.08 2.49
ROCKINGHAM 180.67 32.68 1.84 6.68 4.65 RUSSELL 11.88 2.63 0.15 0.58 0.18 SALEM CITY 60.68 11.58 0.68 2.41 2.17 SCOTT 16.23 3.11 0.17 0.77 0.38 SHENANDOAH 185.66 29.26 1.61 8.31 5.27
SMYTH 23.24 4.42 0.24 1.37 0.46 SOUTHAMPTON 14.16 2.79 0.14 0.70 0.26 SPOTSYLVANIA 241.74 50.53 2.78 5.51 4.59 STAFFORD 116.19 22.72 1.26 4.74 3.38 STAUNTON CITY 49.11 9.62 0.53 1.94 1.77
SUFFOLK CITY 65.12 11.47 0.62 3.38 1.93 SURRY 9.71 2.13 0.10 0.39 0.28 SUSSEX 9.02 1.88 0.09 0.54 0.17 TAZEWELL 48.46 9.87 0.57 2.05 0.65 VIRGINIA BEACH CITY 1,284.45 226.21 12.03 53.28 48.75
WARREN 122.41 26.11 1.49 5.33 2.34 WASHINGTON 96.20 19.98 1.13 4.24 2.26 WAYNESBORO CITY 32.25 6.31 0.35 1.39 1.04 WESTMORELAND 56.75 12.57 0.70 2.51 1.62 WILLIAMSBURG CITY 508.33 98.50 5.39 18.54 16.92
WINCHESTER CITY 96.31 17.85 0.96 4.03 3.19 WISE 32.46 6.57 0.37 1.43 0.45 WYTHE 127.04 17.71 0.90 5.96 3.62 YORK 203.77 34.77 1.86 8.53 7.50 STATE TOTALS $21,214.03 $4,724.40 210.02 $797.69 $564.24
----------------------------------------------
©2013 U.S. Travel Association
*County equivalents.

Appendices
46
APPENDICES
Appendix A: Travel Economic Impact Model
47
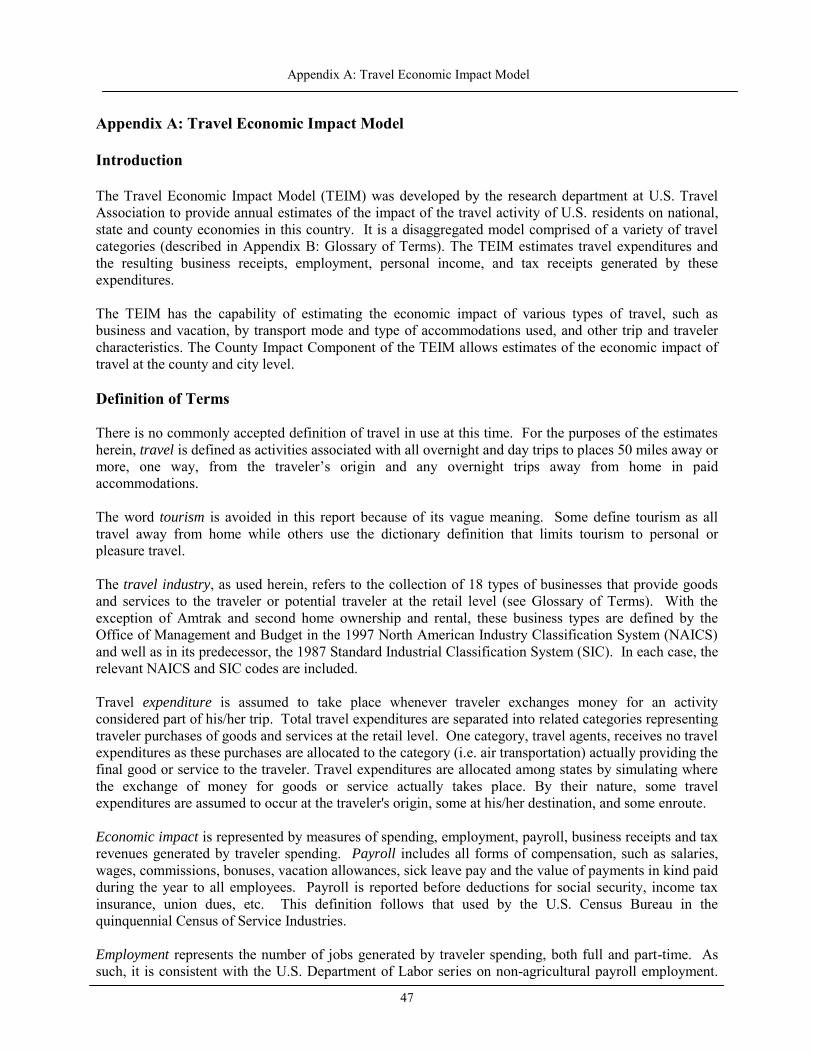
Appendix A: Travel Economic Impact Model Introduction The Travel Economic Impact Model (TEIM) was developed by the research department at U.S. Travel Association to provide annual estimates of the impact of the travel activity of U.S. residents on national, state and county economies in this country. It is a disaggregated model comprised of a variety of travel categories (described in Appendix B: Glossary of Terms). The TEIM estimates travel expenditures and the resulting business receipts, employment, personal income, and tax receipts generated by these expenditures. The TEIM has the capability of estimating the economic impact of various types of travel, such as business and vacation, by transport mode and type of accommodations used, and other trip and traveler characteristics. The County Impact Component of the TEIM allows estimates of the economic impact of travel at the county and city level. Definition of Terms There is no commonly accepted definition of travel in use at this time. For the purposes of the estimates herein, travel is defined as activities associated with all overnight and day trips to places 50 miles away or more, one way, from the traveler’s origin and any overnight trips away from home in paid accommodations. The word tourism is avoided in this report because of its vague meaning. Some define tourism as all travel away from home while others use the dictionary definition that limits tourism to personal or pleasure travel. The travel industry, as used herein, refers to the collection of 18 types of businesses that provide goods and services to the traveler or potential traveler at the retail level (see Glossary of Terms). With the exception of Amtrak and second home ownership and rental, these business types are defined by the Office of Management and Budget in the 1997 North American Industry Classification System (NAICS) and well as in its predecessor, the 1987 Standard Industrial Classification System (SIC). In each case, the relevant NAICS and SIC codes are included. Travel expenditure is assumed to take place whenever traveler exchanges money for an activity considered part of his/her trip. Total travel expenditures are separated into related categories representing traveler purchases of goods and services at the retail level. One category, travel agents, receives no travel expenditures as these purchases are allocated to the category (i.e. air transportation) actually providing the final good or service to the traveler. Travel expenditures are allocated among states by simulating where the exchange of money for goods or service actually takes place. By their nature, some travel expenditures are assumed to occur at the traveler's origin, some at his/her destination, and some enroute. Economic impact is represented by measures of spending, employment, payroll, business receipts and tax revenues generated by traveler spending. Payroll includes all forms of compensation, such as salaries, wages, commissions, bonuses, vacation allowances, sick leave pay and the value of payments in kind paid during the year to all employees. Payroll is reported before deductions for social security, income tax insurance, union dues, etc. This definition follows that used by the U.S. Census Bureau in the quinquennial Census of Service Industries. Employment represents the number of jobs generated by traveler spending, both full and part-time. As such, it is consistent with the U.S. Department of Labor series on non-agricultural payroll employment.
Appendix A: Travel Economic Impact Model
48
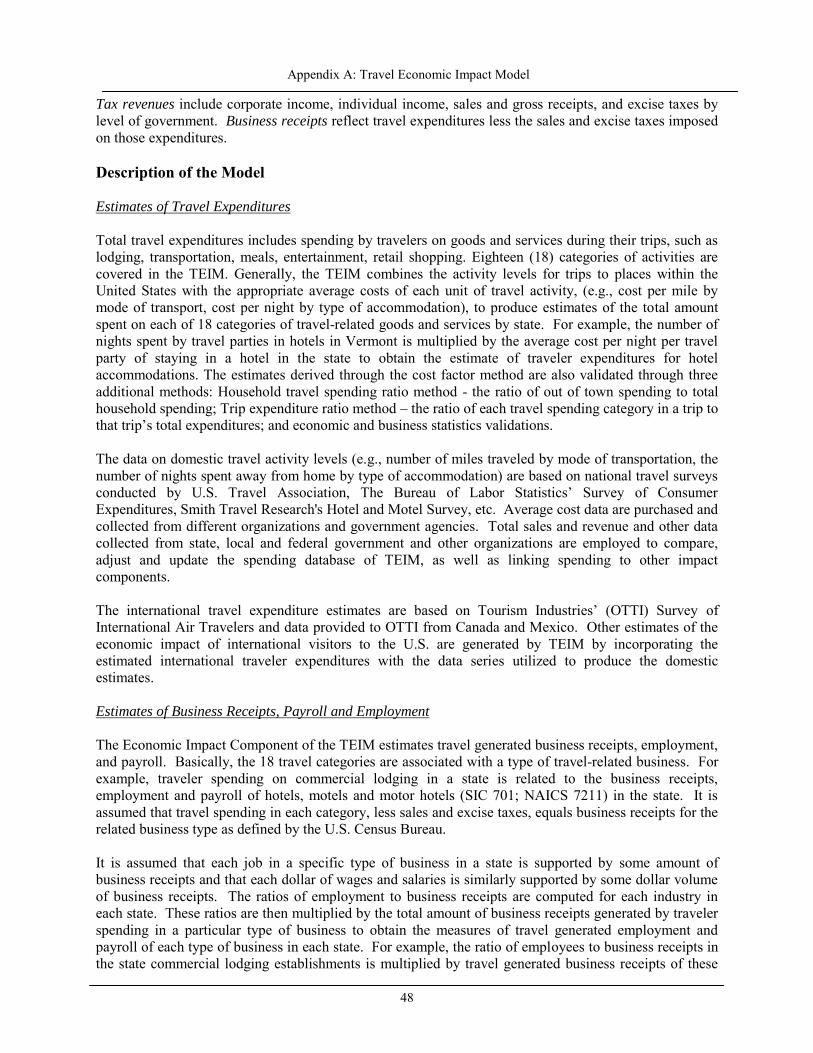
Tax revenues include corporate income, individual income, sales and gross receipts, and excise taxes by level of government. Business receipts reflect travel expenditures less the sales and excise taxes imposed on those expenditures. Description of the Model Estimates of Travel Expenditures
Total travel expenditures includes spending by travelers on goods and services during their trips, such as lodging, transportation, meals, entertainment, retail shopping. Eighteen (18) categories of activities are covered in the TEIM. Generally, the TEIM combines the activity levels for trips to places within the United States with the appropriate average costs of each unit of travel activity, (e.g., cost per mile by mode of transport, cost per night by type of accommodation), to produce estimates of the total amount spent on each of 18 categories of travel-related goods and services by state. For example, the number of nights spent by travel parties in hotels in Vermont is multiplied by the average cost per night per travel party of staying in a hotel in the state to obtain the estimate of traveler expenditures for hotel accommodations. The estimates derived through the cost factor method are also validated through three additional methods: Household travel spending ratio method - the ratio of out of town spending to total household spending; Trip expenditure ratio method – the ratio of each travel spending category in a trip to that trip’s total expenditures; and economic and business statistics validations. The data on domestic travel activity levels (e.g., number of miles traveled by mode of transportation, the number of nights spent away from home by type of accommodation) are based on national travel surveys conducted by U.S. Travel Association, The Bureau of Labor Statistics’ Survey of Consumer Expenditures, Smith Travel Research's Hotel and Motel Survey, etc. Average cost data are purchased and collected from different organizations and government agencies. Total sales and revenue and other data collected from state, local and federal government and other organizations are employed to compare, adjust and update the spending database of TEIM, as well as linking spending to other impact components. The international travel expenditure estimates are based on Tourism Industries’ (OTTI) Survey of International Air Travelers and data provided to OTTI from Canada and Mexico. Other estimates of the economic impact of international visitors to the U.S. are generated by TEIM by incorporating the estimated international traveler expenditures with the data series utilized to produce the domestic estimates. Estimates of Business Receipts, Payroll and Employment
The Economic Impact Component of the TEIM estimates travel generated business receipts, employment, and payroll. Basically, the 18 travel categories are associated with a type of travel-related business. For example, traveler spending on commercial lodging in a state is related to the business receipts, employment and payroll of hotels, motels and motor hotels (SIC 701; NAICS 7211) in the state. It is assumed that travel spending in each category, less sales and excise taxes, equals business receipts for the related business type as defined by the U.S. Census Bureau. It is assumed that each job in a specific type of business in a state is supported by some amount of business receipts and that each dollar of wages and salaries is similarly supported by some dollar volume of business receipts. The ratios of employment to business receipts are computed for each industry in each state. These ratios are then multiplied by the total amount of business receipts generated by traveler spending in a particular type of business to obtain the measures of travel generated employment and payroll of each type of business in each state. For example, the ratio of employees to business receipts in the state commercial lodging establishments is multiplied by travel generated business receipts of these
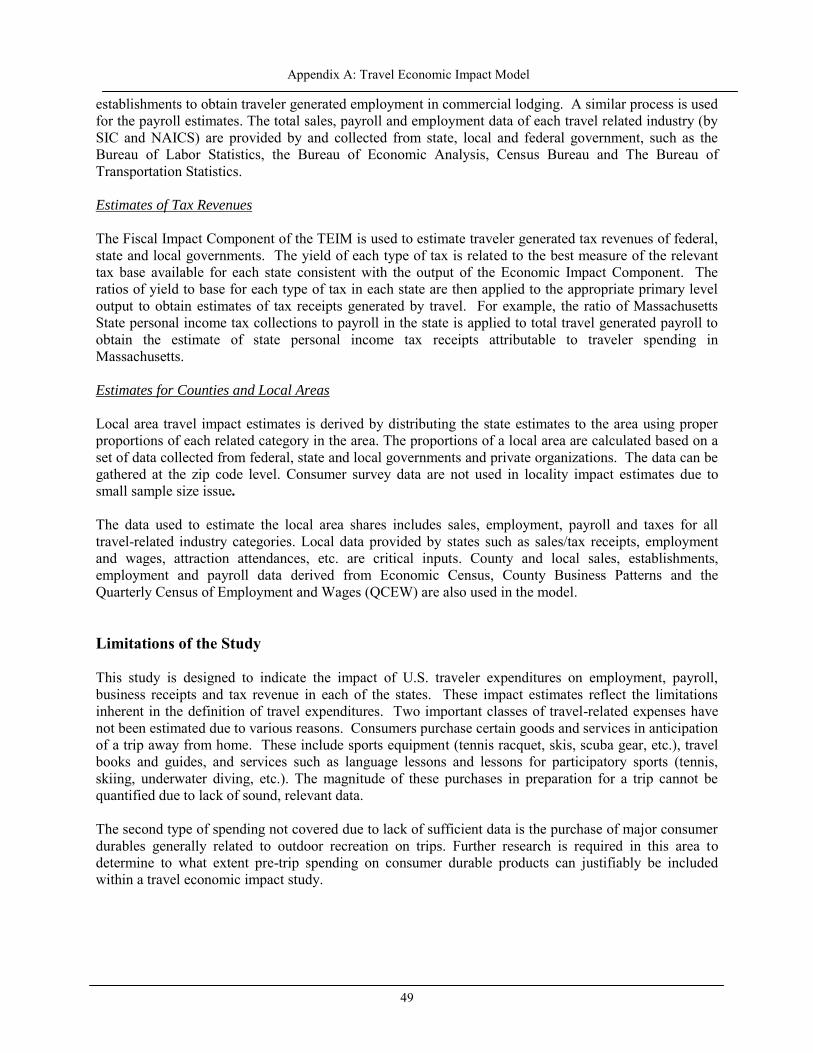
Appendix A: Travel Economic Impact Model
49
establishments to obtain traveler generated employment in commercial lodging. A similar process is used for the payroll estimates. The total sales, payroll and employment data of each travel related industry (by SIC and NAICS) are provided by and collected from state, local and federal government, such as the Bureau of Labor Statistics, the Bureau of Economic Analysis, Census Bureau and The Bureau of Transportation Statistics. Estimates of Tax Revenues
The Fiscal Impact Component of the TEIM is used to estimate traveler generated tax revenues of federal, state and local governments. The yield of each type of tax is related to the best measure of the relevant tax base available for each state consistent with the output of the Economic Impact Component. The ratios of yield to base for each type of tax in each state are then applied to the appropriate primary level output to obtain estimates of tax receipts generated by travel. For example, the ratio of Massachusetts State personal income tax collections to payroll in the state is applied to total travel generated payroll to obtain the estimate of state personal income tax receipts attributable to traveler spending in Massachusetts. Estimates for Counties and Local Areas
Local area travel impact estimates is derived by distributing the state estimates to the area using proper proportions of each related category in the area. The proportions of a local area are calculated based on a set of data collected from federal, state and local governments and private organizations. The data can be gathered at the zip code level. Consumer survey data are not used in locality impact estimates due to small sample size issue. The data used to estimate the local area shares includes sales, employment, payroll and taxes for all travel-related industry categories. Local data provided by states such as sales/tax receipts, employment and wages, attraction attendances, etc. are critical inputs. County and local sales, establishments, employment and payroll data derived from Economic Census, County Business Patterns and the Quarterly Census of Employment and Wages (QCEW) are also used in the model. Limitations of the Study This study is designed to indicate the impact of U.S. traveler expenditures on employment, payroll, business receipts and tax revenue in each of the states. These impact estimates reflect the limitations inherent in the definition of travel expenditures. Two important classes of travel-related expenses have not been estimated due to various reasons. Consumers purchase certain goods and services in anticipation of a trip away from home. These include sports equipment (tennis racquet, skis, scuba gear, etc.), travel books and guides, and services such as language lessons and lessons for participatory sports (tennis, skiing, underwater diving, etc.). The magnitude of these purchases in preparation for a trip cannot be quantified due to lack of sound, relevant data. The second type of spending not covered due to lack of sufficient data is the purchase of major consumer durables generally related to outdoor recreation on trips. Further research is required in this area to determine to what extent pre-trip spending on consumer durable products can justifiably be included within a travel economic impact study.
Appendix B: Glossary of Terms – TEIM
50
Appendix B: Glossary of Terms – TEIM Automobile Transportation Expenditure. This category includes a prorated share of the fixed costs of owning an automobile, truck, camper, or other recreational vehicle, such as insurance, license fees, tax, and depreciation costs. Also included are the variable costs of operating an automobile, truck, camper, or other recreational vehicle on a trip, such as gasoline, oil, tires, and repairs. The costs of renting an automobile or other motor vehicle are included in this category as well. Entertainment/Recreation Expenditure. Traveler spending on recreation facility user fees, admissions at amusement parks and attractions, attendance at nightclubs, movies, legitimate shows, sports events, and other forms of entertainment and recreation while traveling. Food Expenditure. Traveler spending in commercial eating facilities and grocery stores or carry-outs, as well as on food purchased for off-premise consumption. Incidental Purchase Expenditure. Traveler spending on retail trade purchases including gifts for others, medicine, cosmetics, clothing, personal services, souvenirs, and other items of this nature. Lodging Expenditure. Traveler spending on hotels and motels, B&Bs, campgrounds and trailer parks, rental of vacation homes and other types of lodging. Public Transportation Expenditures. This includes traveler spending on air, bus, rail and boat/ship transportation, and taxicab or limousine service between airports and central cities. Also included are expenditures on other transportation. Travel-generated Tax Receipts. Those federal, state and local tax revenues attributable to travel in an area. For a given state locality, all or some of the taxes may apply. "Local" includes county, city or municipality, and township units of government actually collecting the receipts and not the level that may end up receiving it through intergovernmental transfers.
Federal. These receipts include corporate income taxes, individual income taxes, employment taxes, gasoline excise taxes, and airline ticket taxes. State. These receipts include corporate income taxes, individual income taxes, sales and gross receipts taxes, and excise taxes. Local. These include county and city receipts from individual and corporate income taxes, sales, excise and gross receipts taxes, and property taxes.
Appendix C: Travel-Related Industry by NAICS
51
Appendix C: Travel-Related Industry by NAICS
Travel industry categories: With the transition to NAICS, the U.S. Travel Association has adjusted its selection of the travel-related business types using the new NAICS codes and brought its travel economic research into conformity with NAICS. For measurement purposes, U.S. Travel Association’s Travel Economic Impact Model tracks business activity in seven (7) major travel-related industry groups. The industry groups and subcategories used in the model are outlined below, followed by a detailed table of NAICS Codes. The share of travel in each of listed industries will depend on travel spending estimates for the related categories and are different from industries and areas. Automobile Transportation: Gasoline service stations, passenger car rental, motor vehicle/parts dealers, automotive repairs and maintenance. Entertainment/Recreation industry: Entertainment, art and recreation industry.
Foodservice industry: Eating & drinking places, and grocery stores. Retail Trade industry: General merchandise group stores and miscellaneous retail stores, including gift and souvenir shops, and other retail stores. Lodging industry: This industry includes hotels, motels, and motor hotels, camps and trailer parks. Public Transportation industry: Air transportation, taxicab companies, interurban & rural bus transportation, railroad passenger transportation (Amtrak) and water passenger transportation. Also is the “dummy” industry of “other transportation.” Travel Arrangement industry: This includes travel agencies, tour operators, and other travel arrangement & reservation services.
TRAVEL REALTED INDUSTRY BY NAICS
Accommodations 7211 Traveler Accommodations 7212 Recreational Vehicle Parks & Campgrounds
Auto Transportation 532111 Passenger Car Rental 447 Gasoline Stations 4411 Automobile Dealers 4412 Other Motor Vehicle Dealers 4413 Automotive Parts, Accessories and Tire Stores 8111 Automotive Repair and Maintenance
Entertainment and Recreation 711 Performing Arts, Spectator Sports & Related Industries 712 Museums, Historical Sites & Similar Institutions 713 Amusement, Gambling & Recreation
Food 7221 Full service Restaurants 7222 Limited Service Eating Places 7224 Drinking Places 445 Food and Beverage stores
Public Transportation 481 Passenger Air Transportation 4881 Airport Support Activities 4821 Rail Transportation 4852 Interurban and Rural Bus Transportation 4853 Taxi & Limousine Services 485510 Charter Bus 483112 Deep Sea Passenger Transportation 483114 Coastal and Great Lakes Passenger Transportation 483212 Inland Water Passenger Transportation 487 Scenic & Sightseeing Transportation
Retail 451 Sporting Goods, Hobby, Book, and Music Stores 452 General Merchandise Stores 453 Miscellaneous Store Retailers 443 Electronics and Appliance Stores 444 Building Material and Garden Equipment and Supplies Dealers 446 Health and Personal Care Stores 448 Clothing and Clothing Accessories Stores
Travel Arrangement 5615 Travel Arrangement & Reservation Services (includes travel agencies and tour operators)

Appendix D: Major Industry Sectors in the U.S. Economy by NAICS
52
Appendix D: Major Industry Sectors in the U.S. Economy by NAICS Appendix F: Industry Sectors in the U.S. Economy NAICS* NAICS Industry Names NAICS 11: Agriculture, forestry, fishing and hunting NAICS 21: Mining NAICS 22: Utilities NAICS 23: Construction NAICS 31-33: Manufacturing NAICS 42: Wholesale Trade NAICS 44-45: Retail Trade NAICS 48-49: Transportation and Warehousing NAICS 51: Information NAICS 52: Finance and insurance NAICS 53: Real estate and rental and leasing NAICS 54: Professional, Scientific, and Technical Services NAICS 55 Management of companies and enterprises NAICS 56: Administrative and Support and Waste Management and Remediation Services NAICS 61: Educational Services NAICS 62: Health Care and Social Assistance NAICS 71: Arts, entertainment, and recreation NAICS 72: Accommodation and Food Services NAICS 81: Other services, except public administration
*The North American Industry Classification System (NAICS) is the standard used by Federal statistical agencies in classifying
business establishments for the purpose of collecting, analyzing, and publishing statistical data related to the U.S. business
economy. NAICS was developed under the auspices of the Office of Management and Budget (OMB), and adopted in 1997 to
replace the Standard Industrial Classification (SIC) system. It was developed jointly by the U.S. Economic Classification Policy
Committee (ECPC), Statistics Canada, and Mexico's Instituto Nacional de Estadistica y Geografia, to allow for a high level of
comparability in business statistics among the North American countries.
Appendix E: Source of Data
53
Appendix E: Sources of Data This appendix presents the sources of data used in this report. Organizations
Airlines for America (A4A), (formerly known as Air Transport Association of America - ATA) American Automobile Association Amtrak Bureau of Census, U.S. Department of Commerce Bureau of Economic Analysis, U.S. Department of Commerce Bureau of Labor Statistics, U.S. Department of Labor Bureau of Transportation Statistics, U.S. Department of Commerce Federal Aviation Administration, U.S. Department of Transportation Federal Highway Administration, U.S. Department of Transportation National Park Service Virginia Tourism Authority Virginia Department of Taxation Smith Travel Research Office of Travel and Tourism Industries/International Trade Administration, U.S. Department of Commerce U.S. Travel Association
x