u.s. travel outlook…look out. what we’re going to review today the economy and the consumer...
TRANSCRIPT
U.S. Travel Outlook…Look Out
What We’re Going to Review Today
• The Economy and the Consumer• Domestic Leisure Travel• Domestic Business Travel• The Lodging Industry• The Airline Industry• International Travel• New and Continued Challenges• What You Can Do
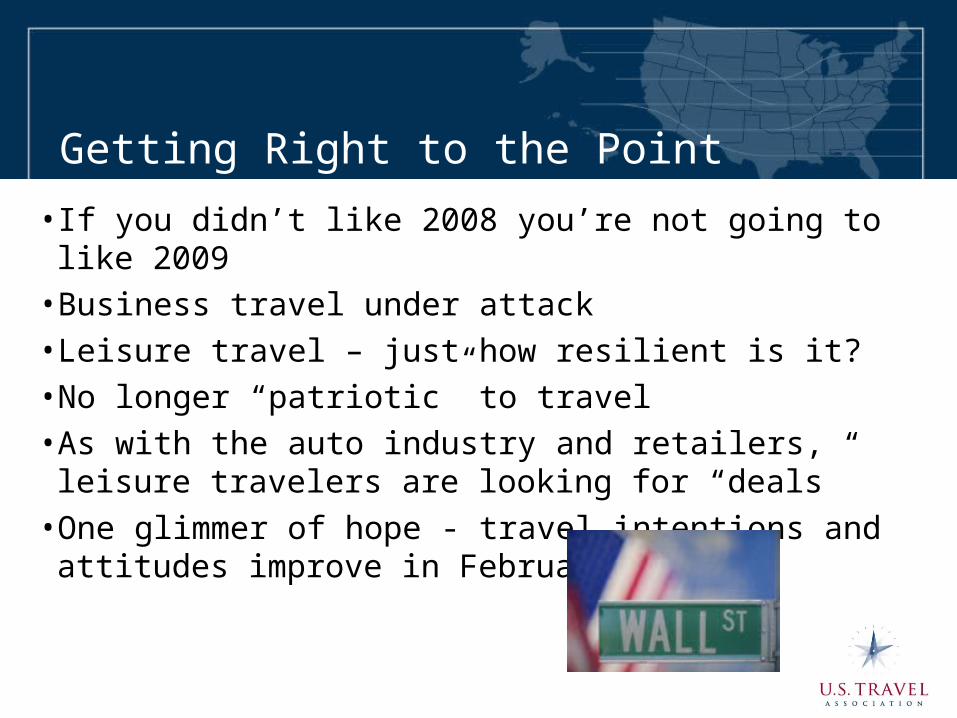
Getting Right to the Point
• If you didn’t like 2008 you’re not going to like 2009• Business travel under attack• Leisure travel – just how resilient is it?• No longer “patriotic” to travel • As with the auto industry and retailers, leisure travelers are
looking for “deals”• One glimmer of hope - travel intentions and attitudes
improve in February 2009
The Economy and Consumer Pessimism
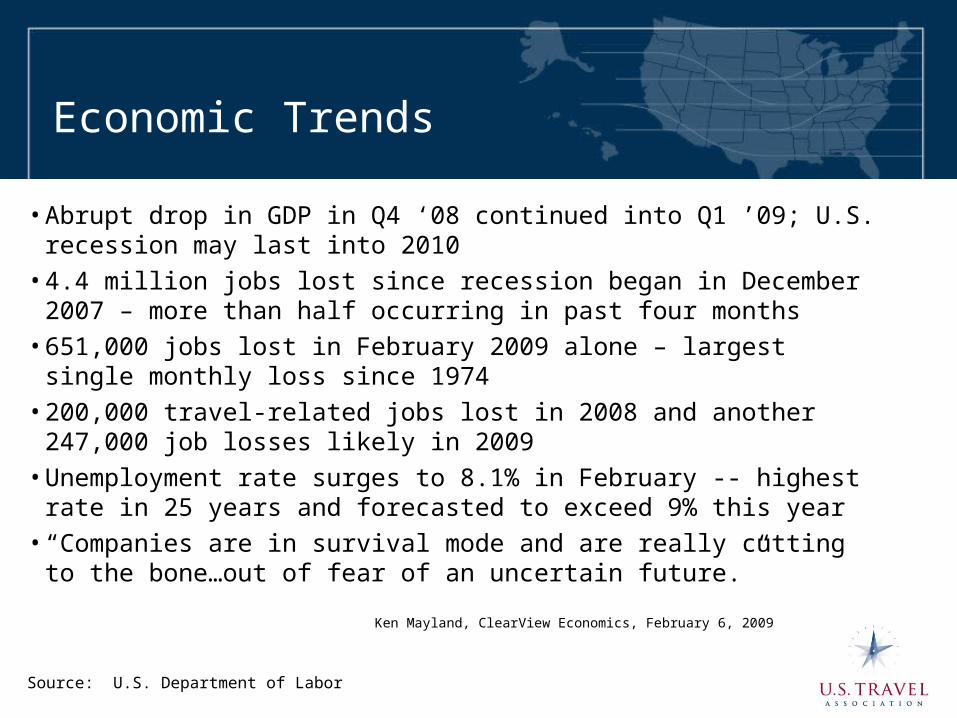
Economic Trends
• Abrupt drop in GDP in Q4 ‘08 continued into Q1 ’09; U.S. recession may last into 2010
• 4.4 million jobs lost since recession began in December 2007 – more than half occurring in past four months
• 651,000 jobs lost in February 2009 alone – largest single monthly loss since 1974
• 200,000 travel-related jobs lost in 2008 and another 247,000 job losses likely in 2009
• Unemployment rate surges to 8.1% in February -- highest rate in 25 years and forecasted to exceed 9% this year
• “Companies are in survival mode and are really cutting to the bone…out of fear of an uncertain future.”
Ken Mayland, ClearView Economics, February 6, 2009
Source: U.S. Department of Labor
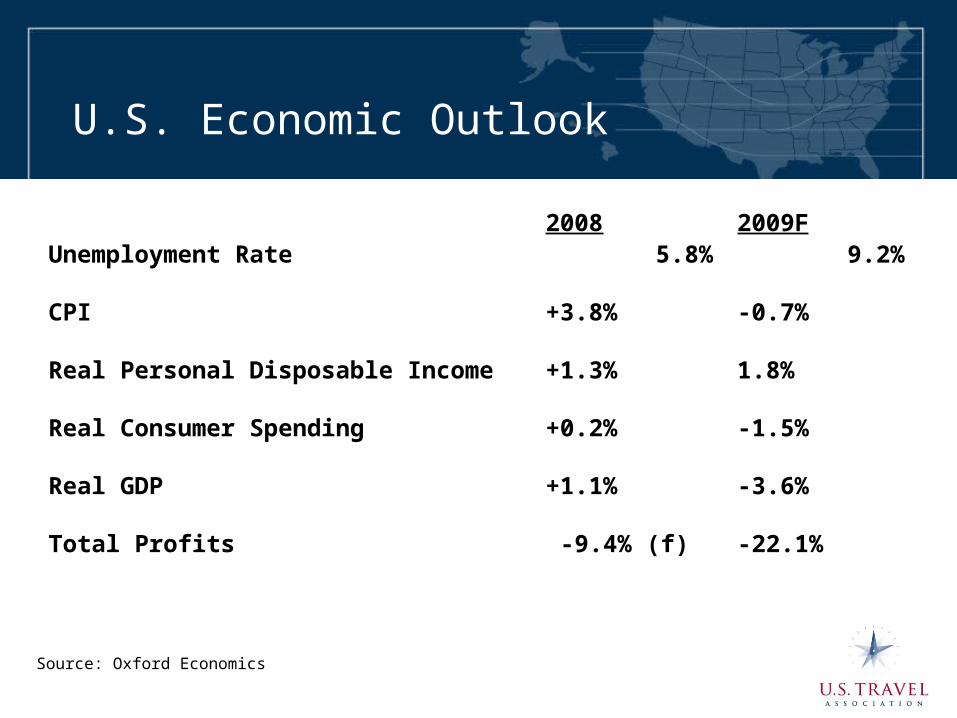
U.S. Economic Outlook
2008 2009FUnemployment Rate 5.8% 9.2%
CPI +3.8% -0.7%
Real Personal Disposable Income +1.3% 1.8%
Real Consumer Spending +0.2% -1.5%
Real GDP +1.1% -3.6%
Total Profits -9.4% (f) -22.1%
Source: Oxford Economics
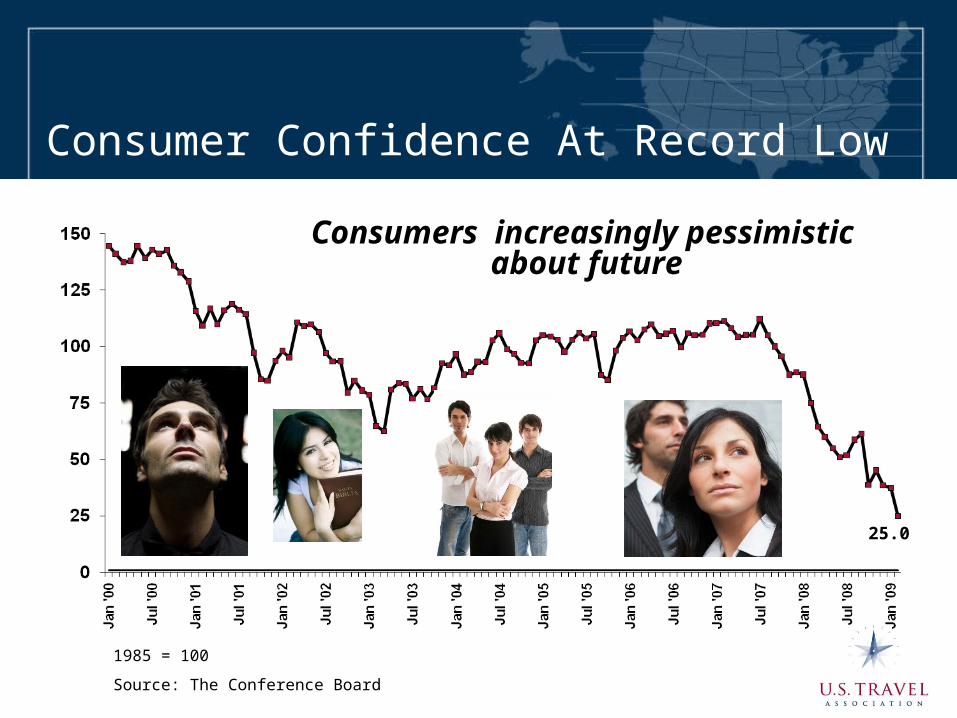
Consumer Confidence At Record Low
1985 = 100
Source: The Conference Board
25.0
Consumers increasingly pessimistic about future
March 2007 = 100Source: U.S. Travel Association/YPartnership Travelhorizons™
90.091.1
91.1
82.4
78.3
89.4
96.2
100
75
80
85
90
95
100
105
Mar '07 Apr '07 Jun '07 Aug '07 Oct '07 Dec '07 Feb '08 Apr '08 July '08 Oct '08 Feb '09
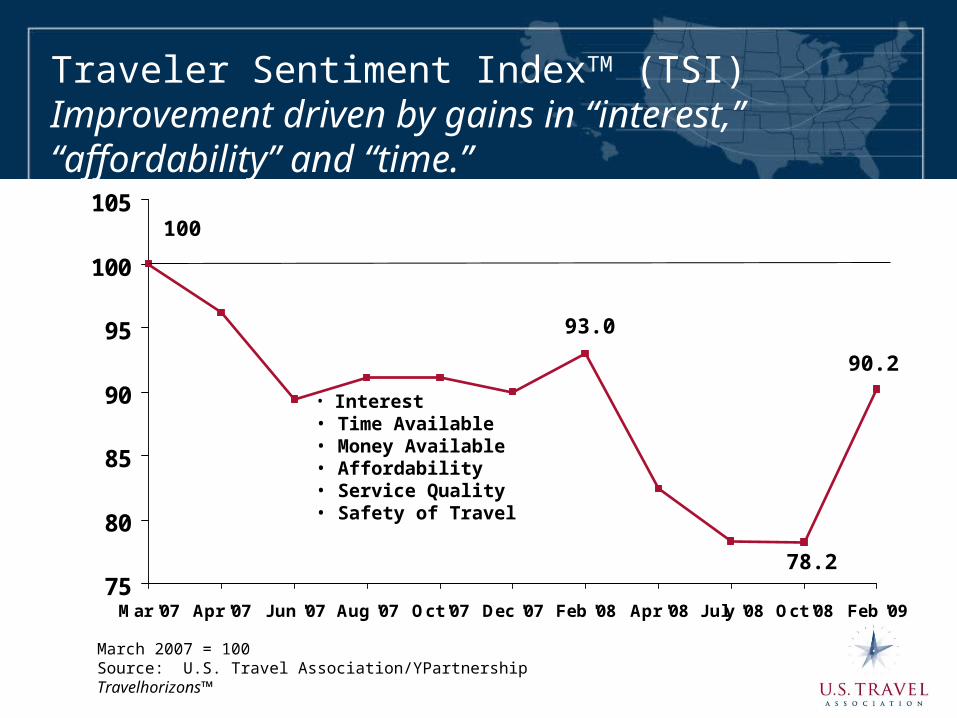
Traveler Sentiment IndexTM (TSI)Improvement driven by gains in “interest,” “affordability” and “time.”
78.2
93.0
100
• Interest• Time Available• Money Available• Affordability• Service Quality• Safety of Travel
90.2

March 2007 = 100Source: U.S. Travel/YPartnership Travelhorizons™
Traveler Sentiment Affordability IndexPerceived affordability of travel rises…
104.7
53.1
39.1
79.983.6
100
0
20
40
60
80
100
120
Mar'07
Apr '07 Jun '07 Aug'07
Oct '07 Dec'07
Feb '08 Apr '08 Jul '08 Oct '08 Feb '09

Largely based on smaller increases or declines in travel-related costs(Percent change YTD through February 2009/2008)
-40%
-5%-1%
+2%+5%
-45.0
-40.0
-35.0
-30.0
-25.0
-20.0
-15.0
-10.0
-5.0
0.0
5.0
10.0
Food away from home
Recreation Airfares Lodging
MotorFuel
Source: U.S. Travel Association – Travel Price Index
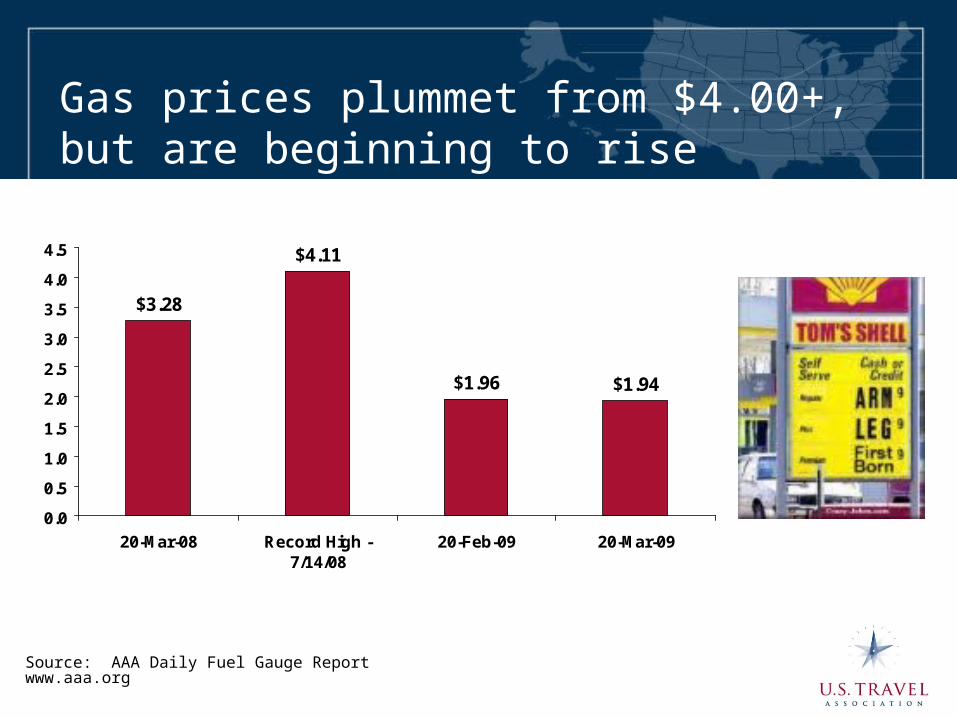
Gas prices plummet from $4.00+, but are beginning to rise
$1.94$1.96
$4.11
$3.28
0.0
0.5
1.0
1.5
2.0
2.5
3.0
3.5
4.0
4.5
20-Mar-08 Record High -7/14/08
20-Feb-09 20-Mar-09
Source: AAA Daily Fuel Gauge Reportwww.aaa.org
Leisure Travel Trends
• First half of 2008 was doing well, flat summer and then fall off in 4th quarter
• Shorter, closer-to-home• Less costly – quest for values and “deals” • Trading down, not out• Most Americans still view leisure travel as a “right” and will forego spending on other items to travel
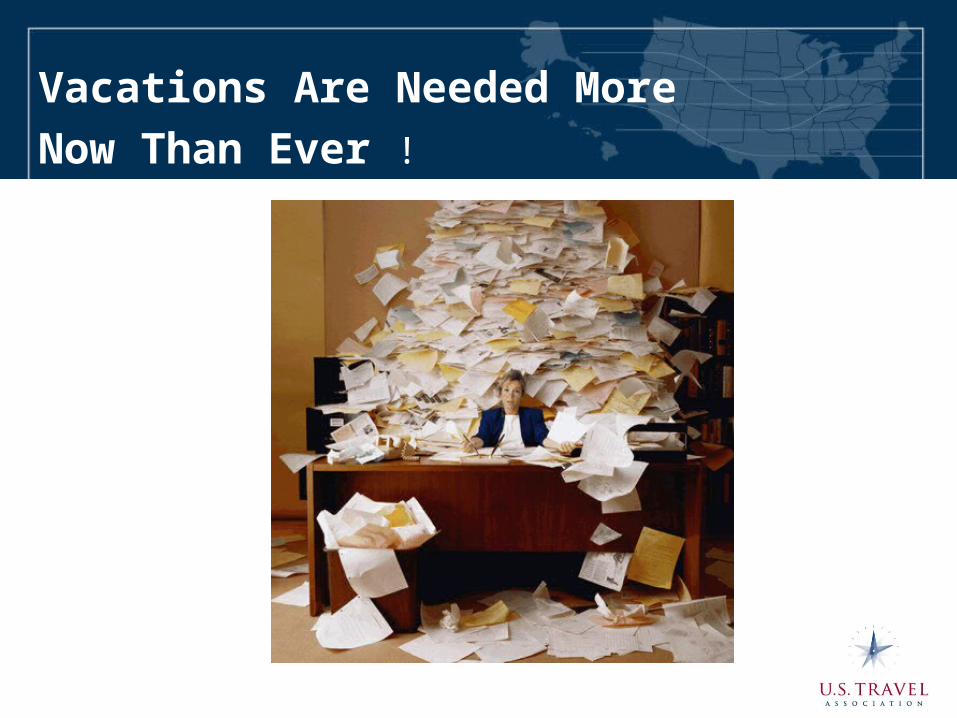
Vacations Are Needed More
Now Than Ever !
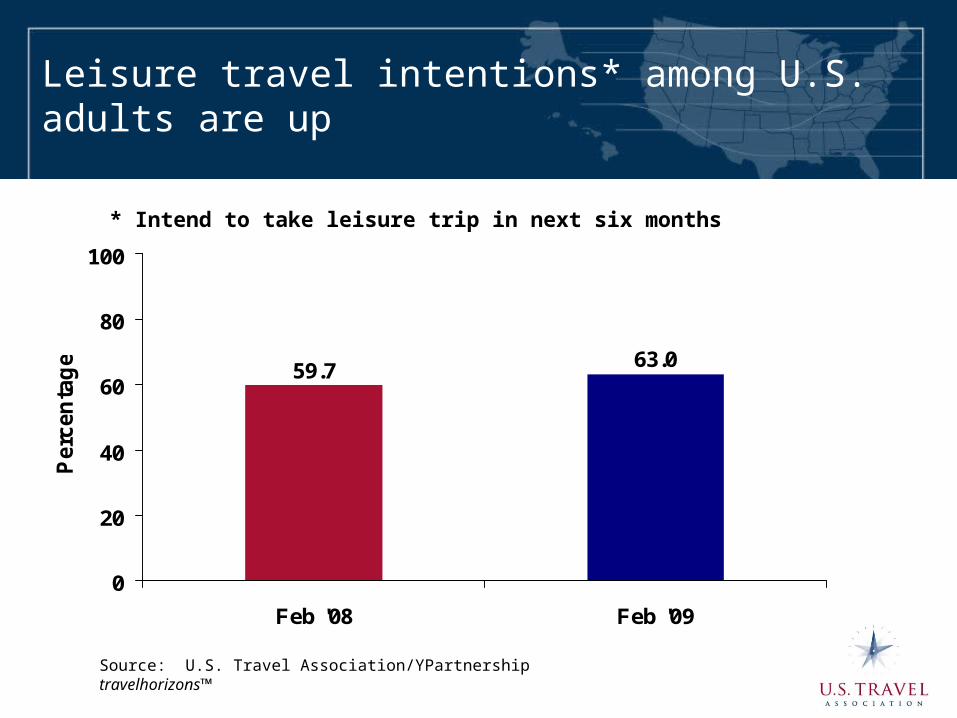
Leisure travel intentions* among U.S. adults are up
63.059.7
0
20
40
60
80
100
Feb '08 Feb '09
Perc
en
tag
e
* Intend to take leisure trip in next six months
Source: U.S. Travel Association/YPartnership travelhorizons™
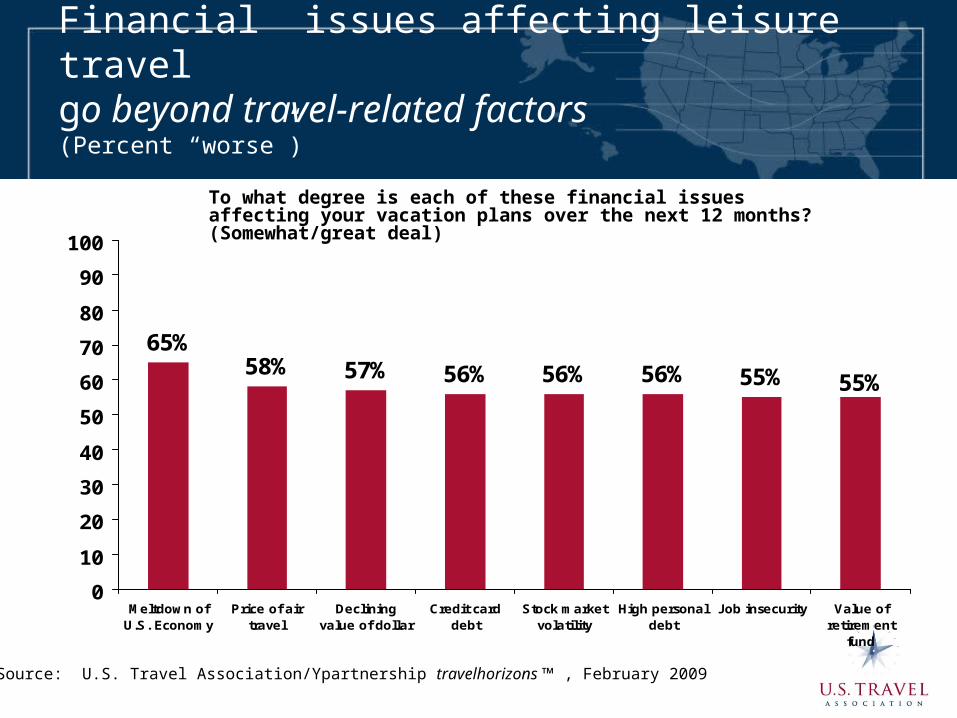
Financial issues affecting leisure travel go beyond travel-related factors(Percent “worse”)
55%55%56%56%56%57%58%65%
0
10
20
30
40
50
60
70
80
90
100
Meltdown ofU.S. Economy
Price of airtravel
Decliningvalue of dollar
Credit carddebt
Stock marketvolatility
High personaldebt
Job insecurity Value ofretirement
fund
Source: U.S. Travel Association/Ypartnership travelhorizons ™ , February 2009
To what degree is each of these financial issues affecting your vacation plans over the next 12 months? (Somewhat/great deal)
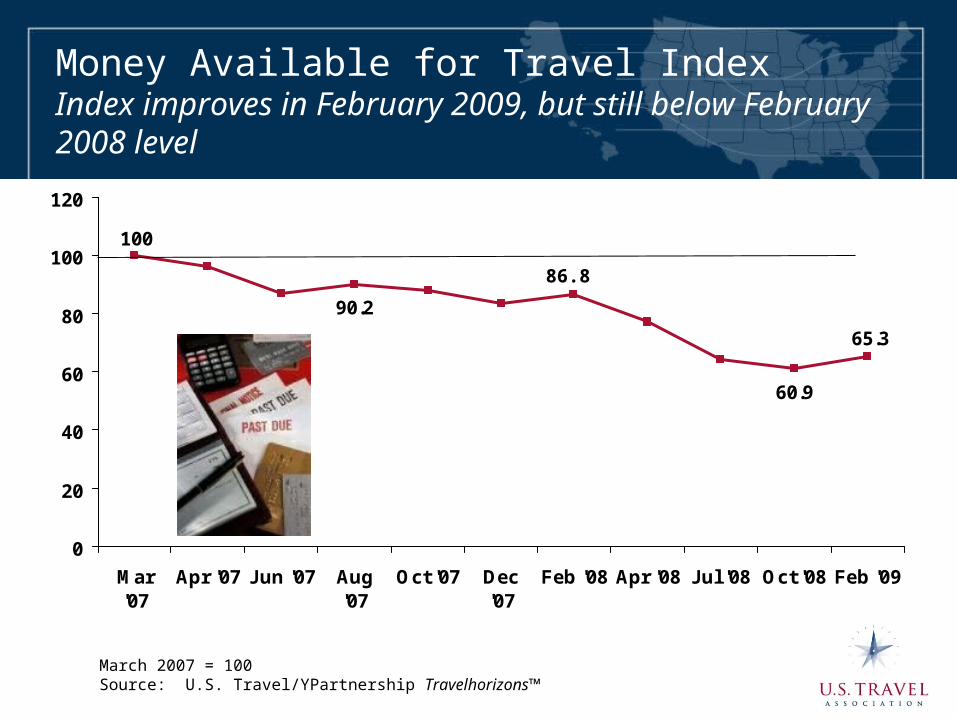
March 2007 = 100Source: U.S. Travel/YPartnership Travelhorizons™
Money Available for Travel IndexIndex improves in February 2009, but still below February 2008 level
65.3
100
90.2
60.9
0
20
40
60
80
100
120
Mar'07
Apr '07 Jun '07 Aug'07
Oct '07 Dec'07
Feb '08 Apr '08 Jul '08 Oct '08 Feb '09
86.8
Looking for Deals and Deep Cost Savings
• Level of motivation by type of discount varies by generation– Need to look at target markets to determine
which programs have best chance to succeed
• Discounts can motivate vacation travel, but some more effective than others– $25 gift or gas cards not enough– Free golf – forget it

Deep discounts needed to influence Americans’ travel decisions
52%
10%
40%
7%
33%
17%
46%
22%
62%
5%
010203040506070
20
% o
ff p
ub
lish
ed
roo
m r
ate
50
% o
ff p
ub
lish
ed
roo
m r
ate
$1
00
pe
r p
ers
on
ho
tel
cre
dit
$2
00
pe
r p
ers
on
ho
tel
cre
dit
$1
00
pe
r ro
om
ho
tel
cre
dit
$2
00
pe
r ro
om
ho
tel
cre
dit
30
% o
ff p
ub
lish
ed
cru
ise
fa
re
50
% o
ff p
ub
lish
ed
cru
ise
fa
re
$2
5 g
ift
ca
rd
$5
0 g
ift
ca
rd
Source: U.S. Travel Association/Ypartnership travelhorizons™, February 2009
Which of the following incentives would be likely to influence your decision to select one destination or travel supplier over another?

The deals are out there!

This Week's Top Pick from The Palms Las Vegas $79 -- Trendy Las Vegas Hotel incl.
$50 Dining CreditYou'll also get 25% OFF spa services
This Week's Top Pick from TripRes.com
$33 & up -- Sahara on The Strip, 30% OFF
This Week's Top Pick from CondoDirect.com
$55 -- Las Vegas 1-Bedroom Condo, incl. WeekendsStay near the Strip and save more than 50% OFF
Las Vegas is largely on sale

Cruise Line Deals
Carnival – Free Upgrades!
Celebrity – Extra $200 Off!Royal Caribbean – EXTRA $200 Off!NCL – $250 FREE Spending!Azamara – $600 FREE Spending!
Discounts of 50% or more, especially for “last minute” trips, are common
Destinations promoting special deals to generate both leisure and meeting travel
HAWAII CVB LAUNCHES HOT RATES, HOT DATES PROGRAM.
• To help generate new business bookings through 2010
• In partnership with HCVB member hotels and resorts statewide
• Provides money-saving deals on accommodations, meeting facilities and other specials.
• BusinessAloha.com (HVCB's business meetings Website) has an online clearing house
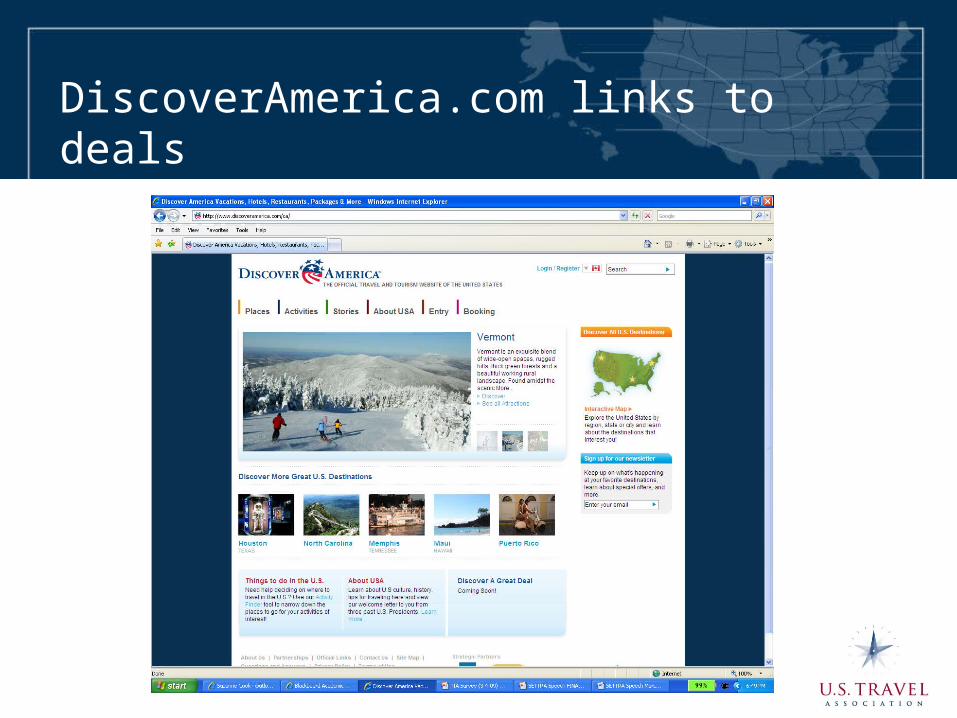
DiscoverAmerica.com links to deals
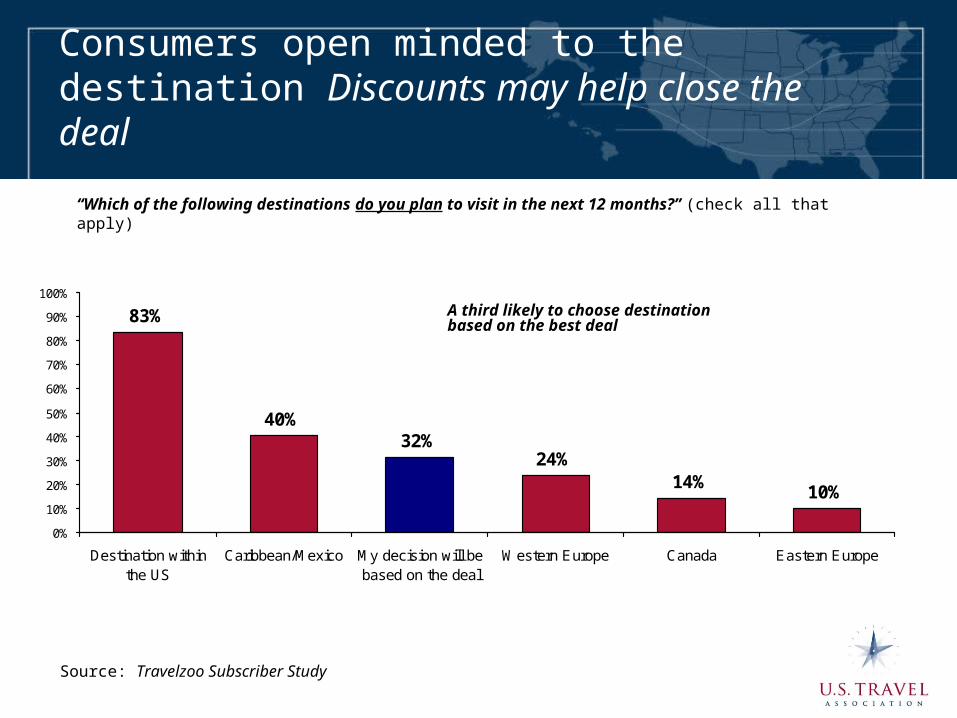
83%
40%32%
24%14%
10%
0%
10%
20%
30%
40%
50%
60%
70%
80%
90%
100%
Destination withinthe US
Caribbean/Mexico My decision will bebased on the deal
Western Europe Canada Eastern Europe
“Which of the following destinations do you plan to visit in the next 12 months?” (check all that apply)
Consumers open minded to the destination Discounts may help close the deal
Source: Travelzoo Subscriber Study
A third likely to choose destinationbased on the best deal
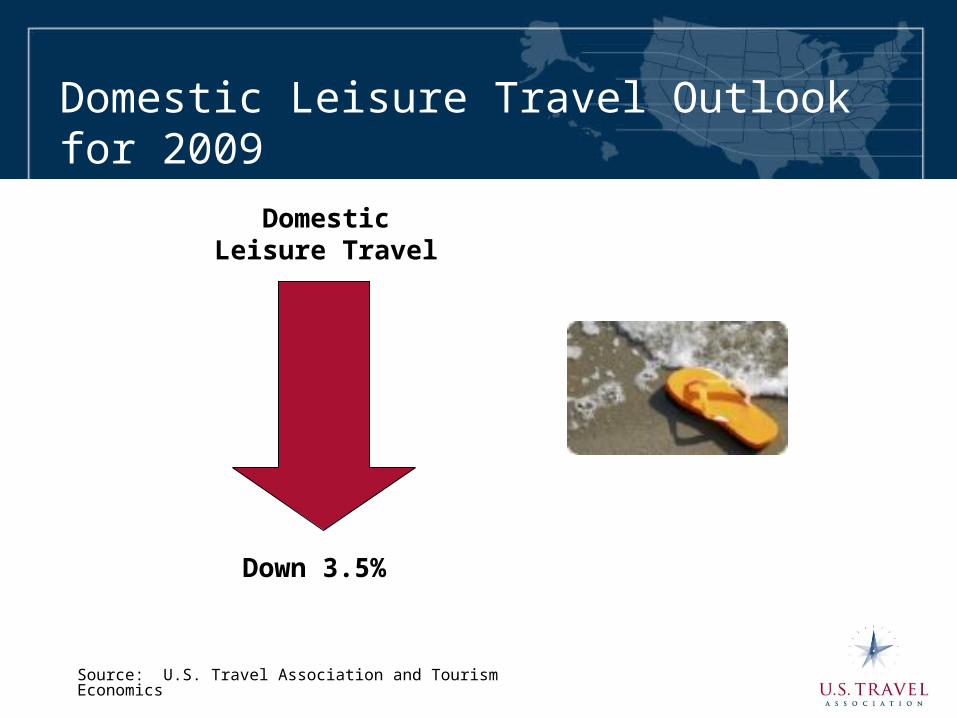
Domestic Leisure Travel Outlook for 2009
DomesticLeisure Travel
Down 3.5%
Source: U.S. Travel Association and Tourism Economics
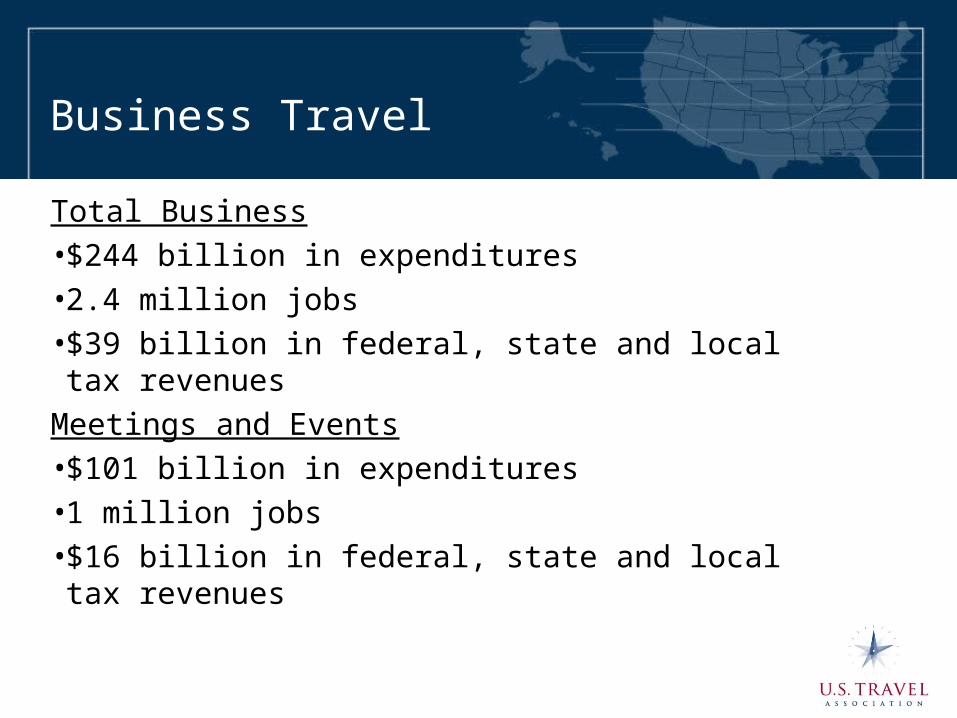
Business Travel
Total Business• $244 billion in expenditures• 2.4 million jobs• $39 billion in federal, state and local tax revenues
Meetings and Events• $101 billion in expenditures• 1 million jobs• $16 billion in federal, state and local tax revenues
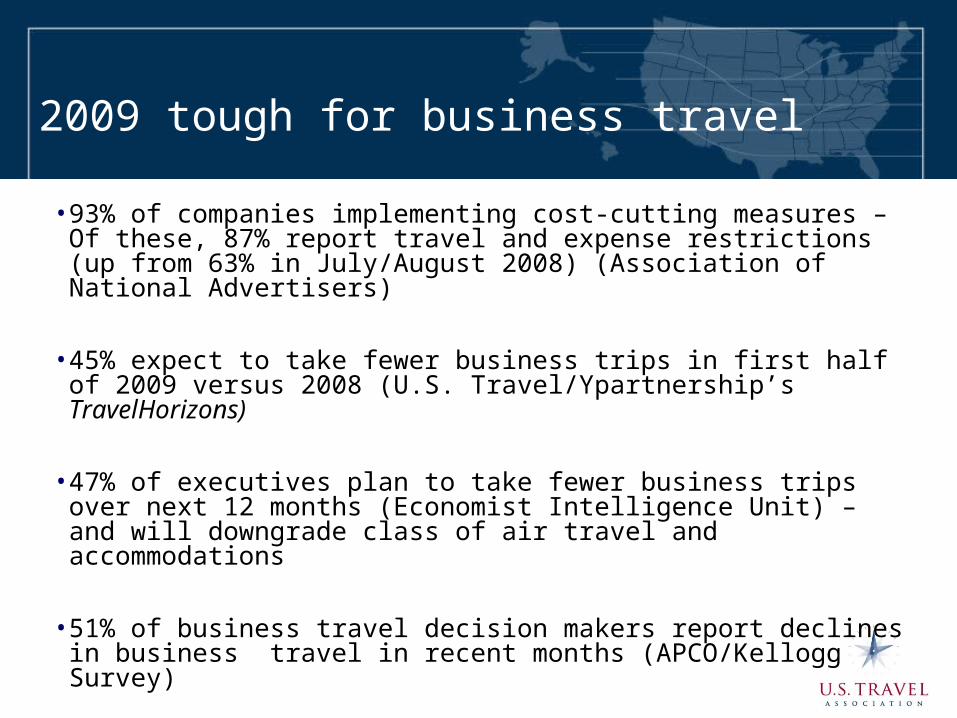
2009 tough for business travel
• 93% of companies implementing cost-cutting measures – Of these, 87% report travel and expense restrictions (up from 63% in July/August 2008) (Association of National Advertisers)
• 45% expect to take fewer business trips in first half of 2009 versus 2008 (U.S. Travel/Ypartnership’s TravelHorizons)
• 47% of executives plan to take fewer business trips over next 12 months (Economist Intelligence Unit) – and will downgrade class of air travel and accommodations
• 51% of business travel decision makers report declines in business travel in recent months (APCO/Kellogg Survey)
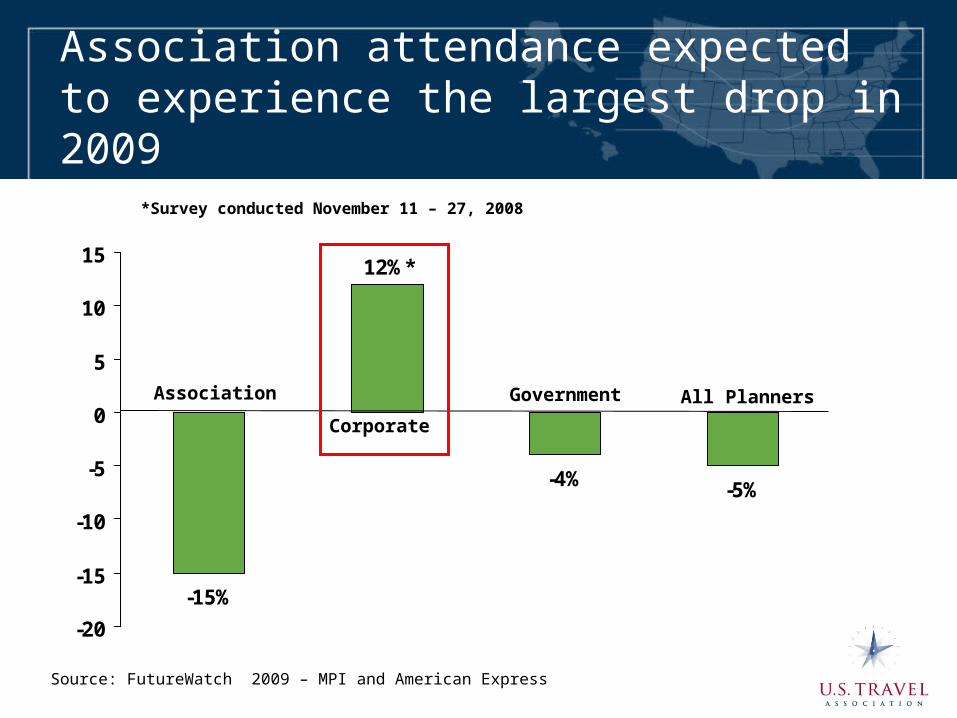
Association attendance expected to experience the largest drop in 2009
-5%-4%
12%*
-15%
-20
-15
-10
-5
0
5
10
15
Association
Corporate
Government All Planners
Source: FutureWatch 2009 – MPI and American Express
*Survey conducted November 11 – 27, 2008
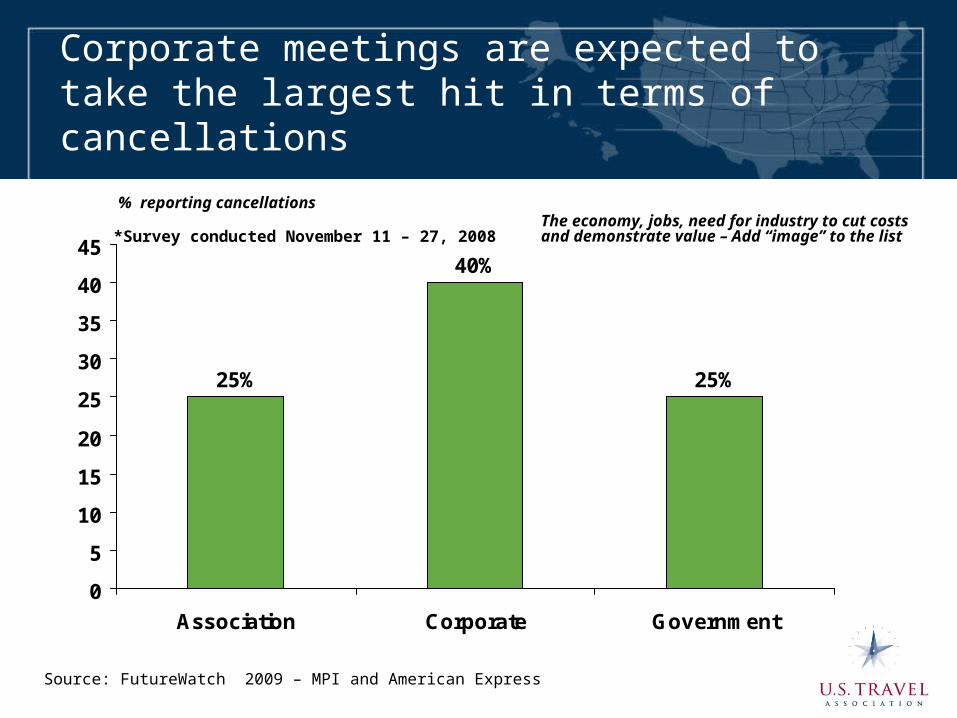
Corporate meetings are expected to take the largest hit in terms of cancellations
25%
40%
25%
0
5
10
15
20
25
30
35
40
45
Association Corporate Government
Source: FutureWatch 2009 – MPI and American Express
The economy, jobs, need for industry to cut costs and demonstrate value – Add “image” to the list*Survey conducted November 11 – 27, 2008
% reporting cancellations
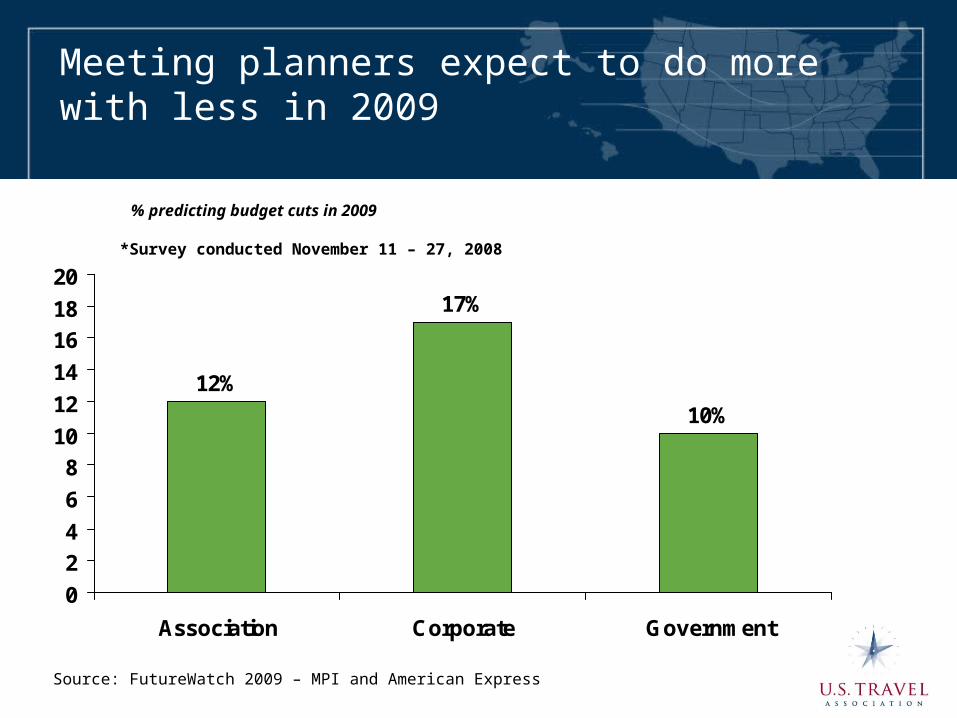
Meeting planners expect to do more with less in 2009
10%
17%
12%
0
2
4
6
8
10
12
14
16
18
20
Association Corporate Government
Source: FutureWatch 2009 – MPI and American Express
*Survey conducted November 11 – 27, 2008
% predicting budget cuts in 2009
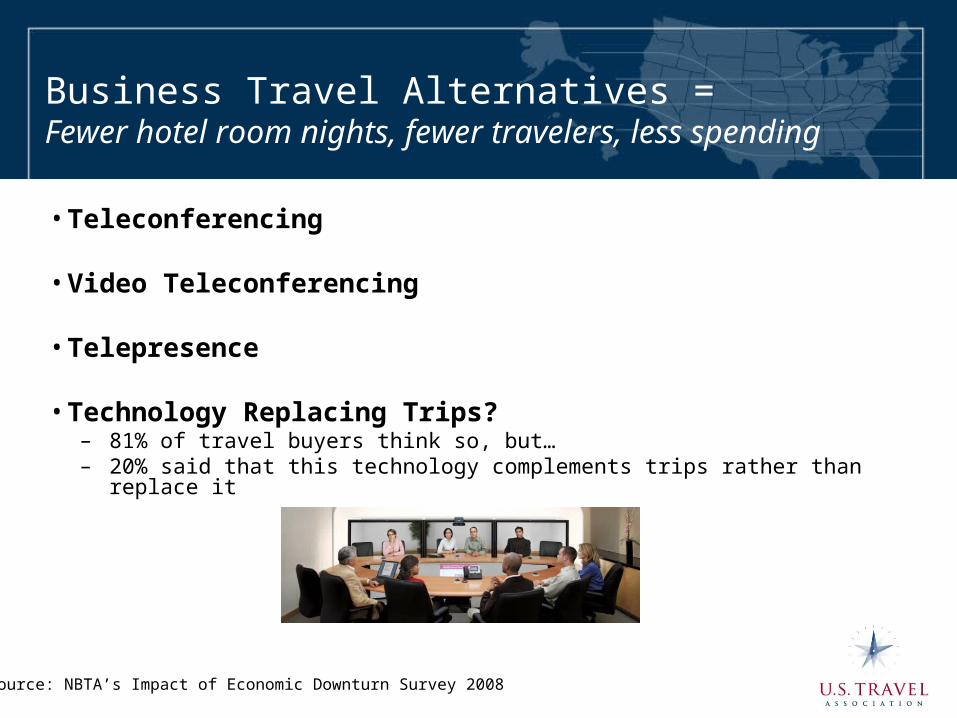
Business Travel Alternatives =Fewer hotel room nights, fewer travelers, less spending
• Teleconferencing
• Video Teleconferencing
• Telepresence
• Technology Replacing Trips? – 81% of travel buyers think so, but…– 20% said that this technology complements trips rather than replace it
Source: NBTA’s Impact of Economic Downturn Survey 2008
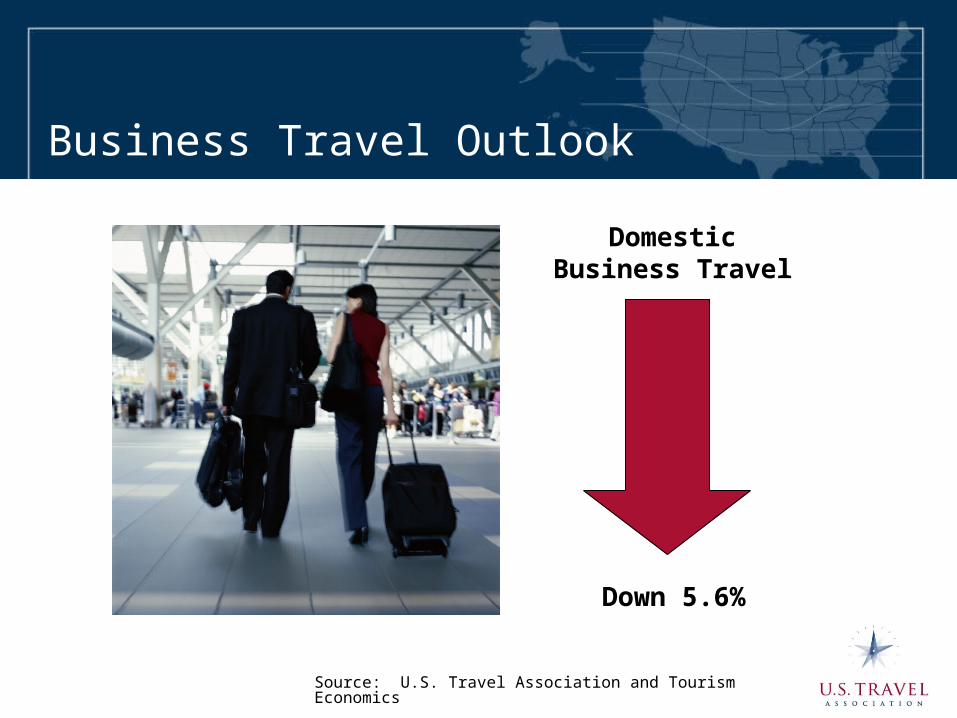
Business Travel Outlook
DomesticBusiness Travel
Down 5.6%
Source: U.S. Travel Association and Tourism Economics

Lodging Industry Feels the Impact
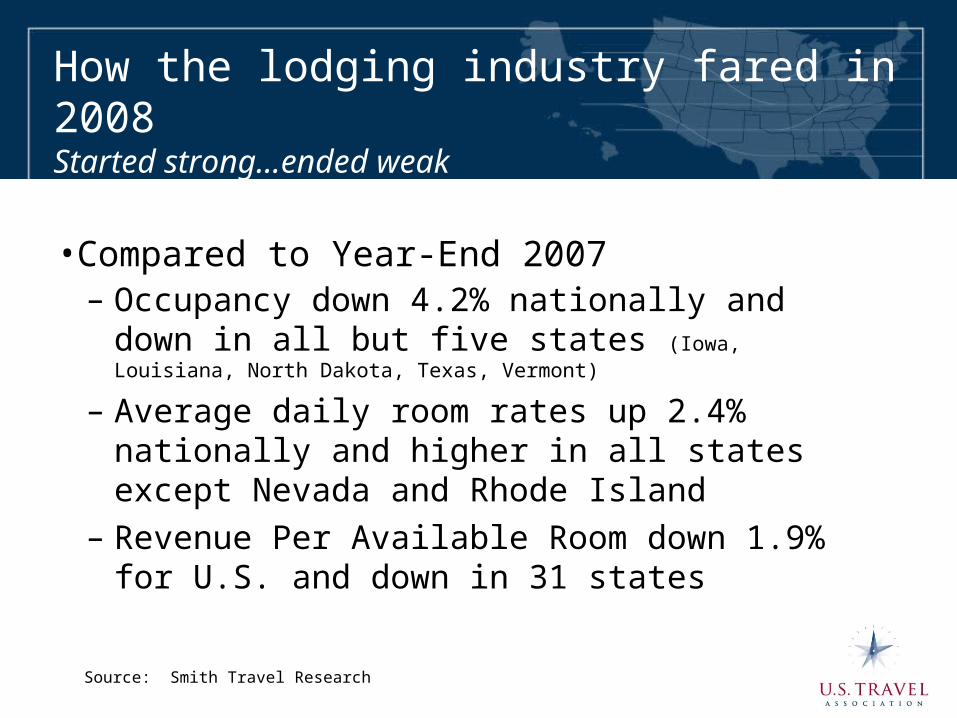
How the lodging industry fared in 2008Started strong…ended weak
• Compared to Year-End 2007 – Occupancy down 4.2% nationally and down in
all but five states (Iowa, Louisiana, North Dakota, Texas, Vermont)
– Average daily room rates up 2.4% nationally and higher in all states except Nevada and Rhode Island
– Revenue Per Available Room down 1.9% for U.S. and down in 31 states
Source: Smith Travel Research
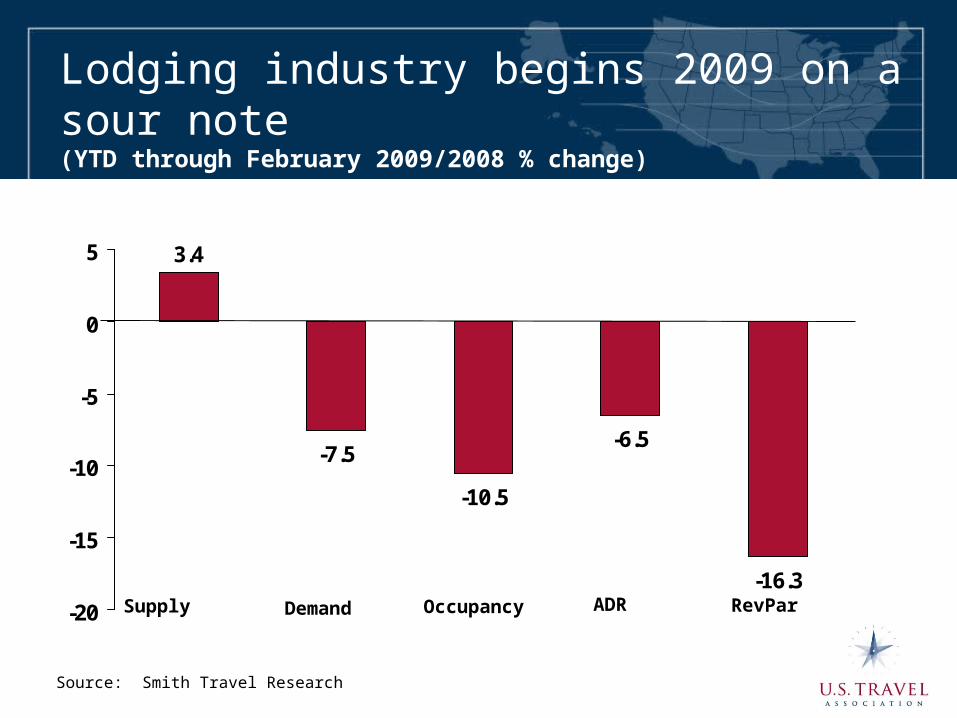
Lodging industry begins 2009 on a sour note(YTD through February 2009/2008 % change)
3.4
-7.5
-10.5
-6.5
-16.3
-20
-15
-10
-5
0
5
Supply Demand Occupancy ADR RevPar
Source: Smith Travel Research
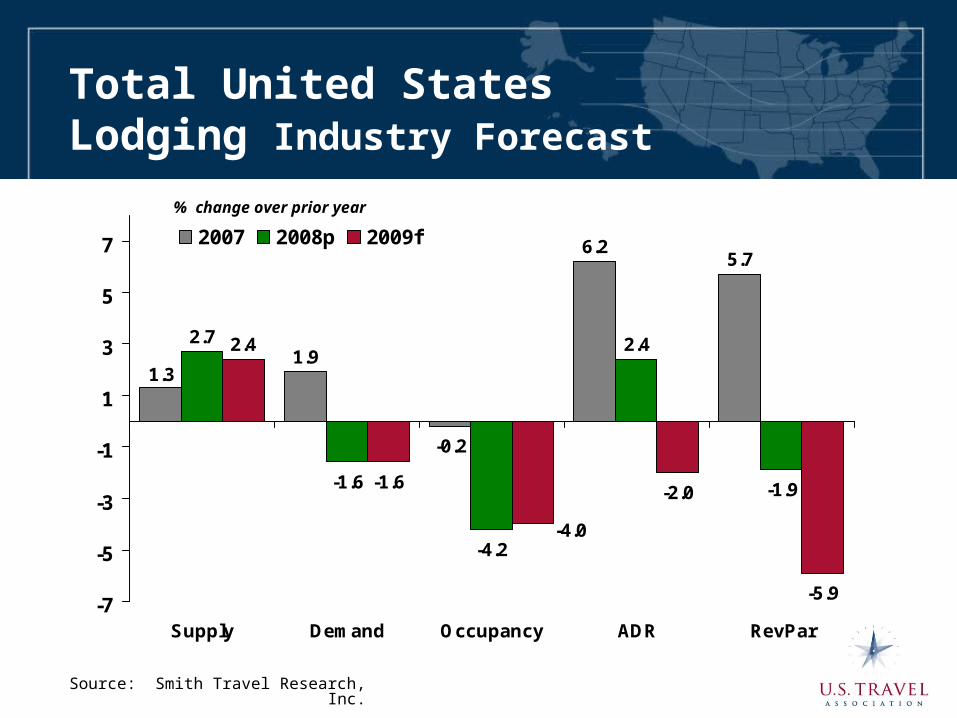
1.9
-0.2
6.25.7
2.7
-1.6
-4.2
2.4
-1.9
2.4
-1.6-2.0
-5.9
1.3
-4.0
-7
-5
-3
-1
1
3
5
7
Supply Demand Occupancy ADR RevPar
2007 2008p 2009f
Total United StatesLodging Industry Forecast
Source: Smith Travel Research, Inc.
% change over prior year
But other forecasts much more pessimistic
• PKF-HR – Current decline in U.S. lodging industry will be deeper and last longer
than previously predicted.
• Rev-Par now expected to drop 13.7% in 2009
• 5.4% decline in demand, 7.8% decline in occupancy and 6.4% drop in ADR
expected
• 30.1% decline in profits projected for 2009
• Greatest declines expected in Q1 2009 and should begin to subside by mid-2009
The State of the Airline Industry
• Not so good…
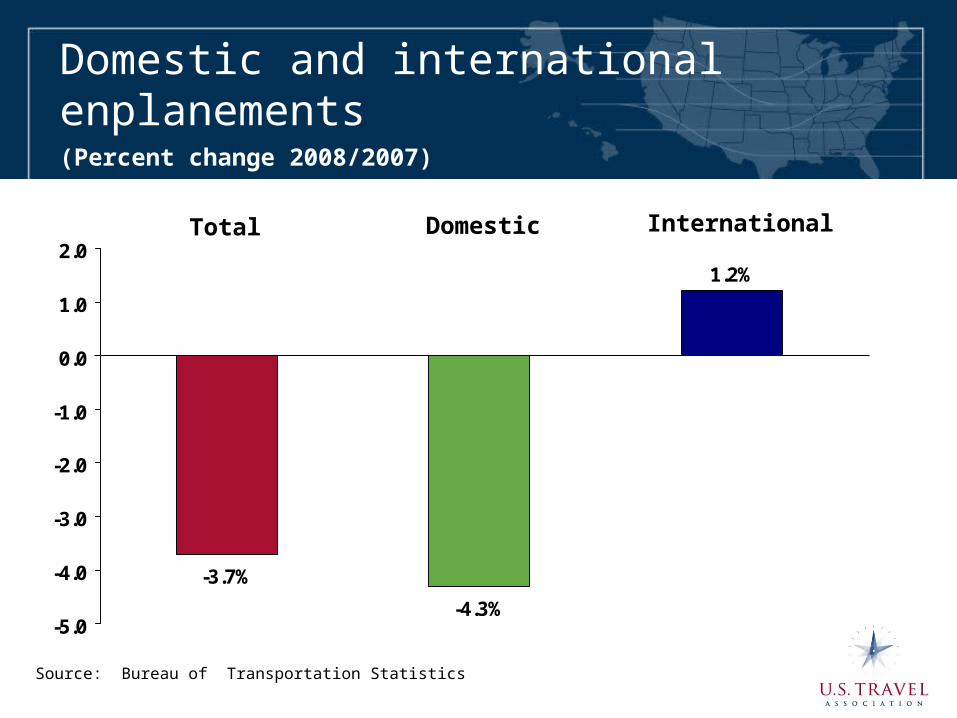
Domestic and international enplanements (Percent change 2008/2007)
1.2%
-4.3%
-3.7%
-5.0
-4.0
-3.0
-2.0
-1.0
0.0
1.0
2.0Total Domestic International
Source: Bureau of Transportation Statistics
Air Capacity Cuts
•10% reduction annually through 2011
•Flights dropped 7% worldwide in Q4
•Cuts impact business and leisure travel
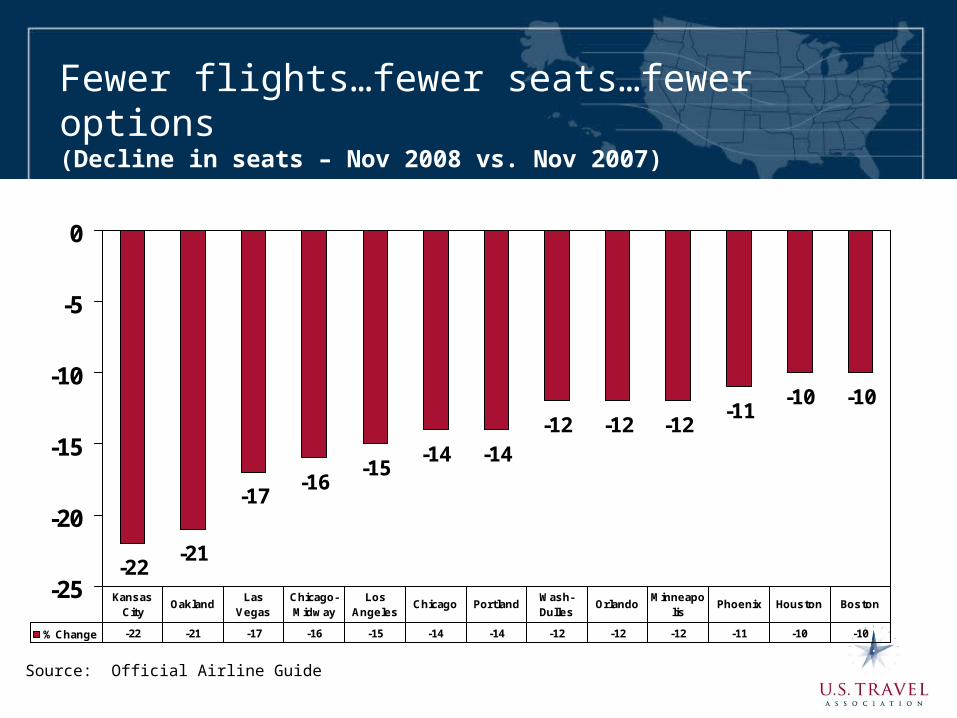
Fewer flights…fewer seats…fewer options(Decline in seats – Nov 2008 vs. Nov 2007)
-22-21
-17-16
-15-14 -14
-12 -12 -12-11
-10 -10
-25
-20
-15
-10
-5
0
% Change -22 -21 -17 -16 -15 -14 -14 -12 -12 -12 -11 -10 -10
Kansas City
OaklandLas
VegasChicago-Midway
Los Angeles
Chicago PortlandWash-Dulles
OrlandoMinneapo
lisPhoenix Houston Boston
Source: Official Airline Guide
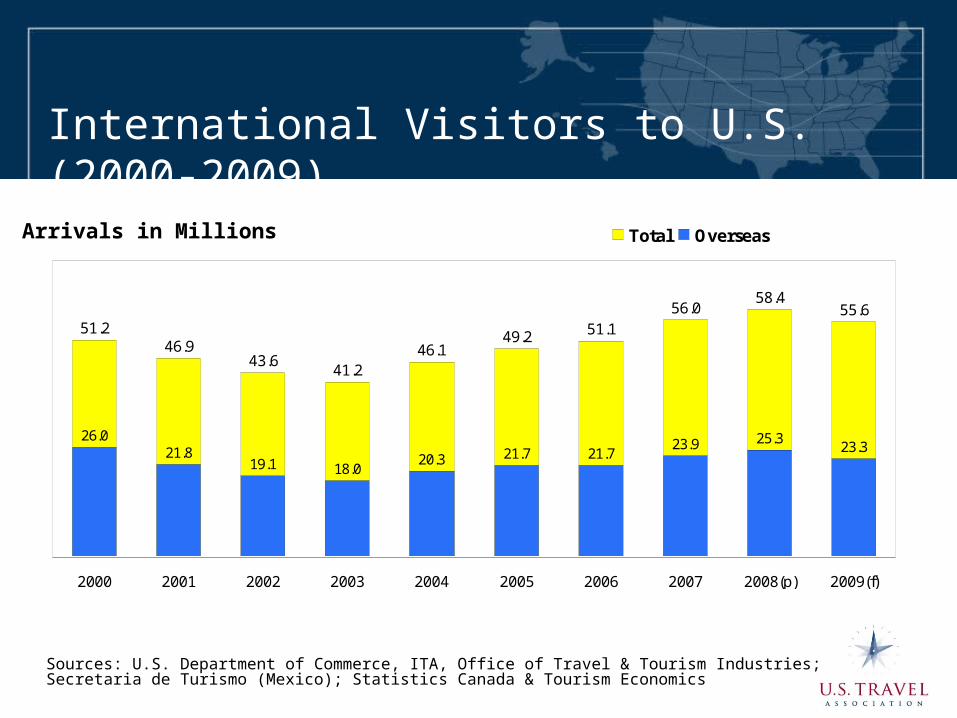
Arrivals in Millions
Sources: U.S. Department of Commerce, ITA, Office of Travel & Tourism Industries; Secretaria de Turismo (Mexico); Statistics Canada & Tourism Economics
51.246.9
43.641.2
46.149.2 51.1
56.058.4
55.6
26.021.8
19.1 18.020.3 21.7 21.7
23.9 25.323.3
2000 2001 2002 2003 2004 2005 2006 2007 2008(p) 2009(f)
Total Overseas
International Visitors to U.S. (2000-2009)
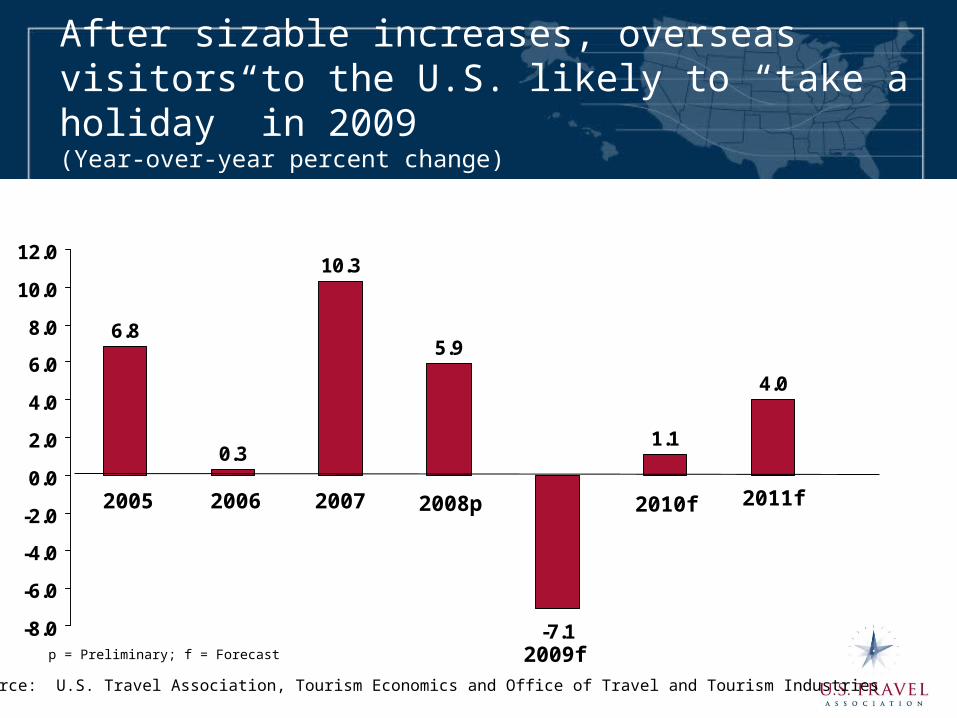
After sizable increases, overseas visitors to the U.S. likely to “take a holiday” in 2009 (Year-over-year percent change)
6.8
10.3
-7.1
1.1
4.0
0.3
5.9
-8.0
-6.0
-4.0
-2.0
0.0
2.0
4.0
6.0
8.0
10.0
12.0
2005
2009f
2008p20072006 2011f2010f
p = Preliminary; f = Forecast
Source: U.S. Travel Association, Tourism Economics and Office of Travel and Tourism Industries
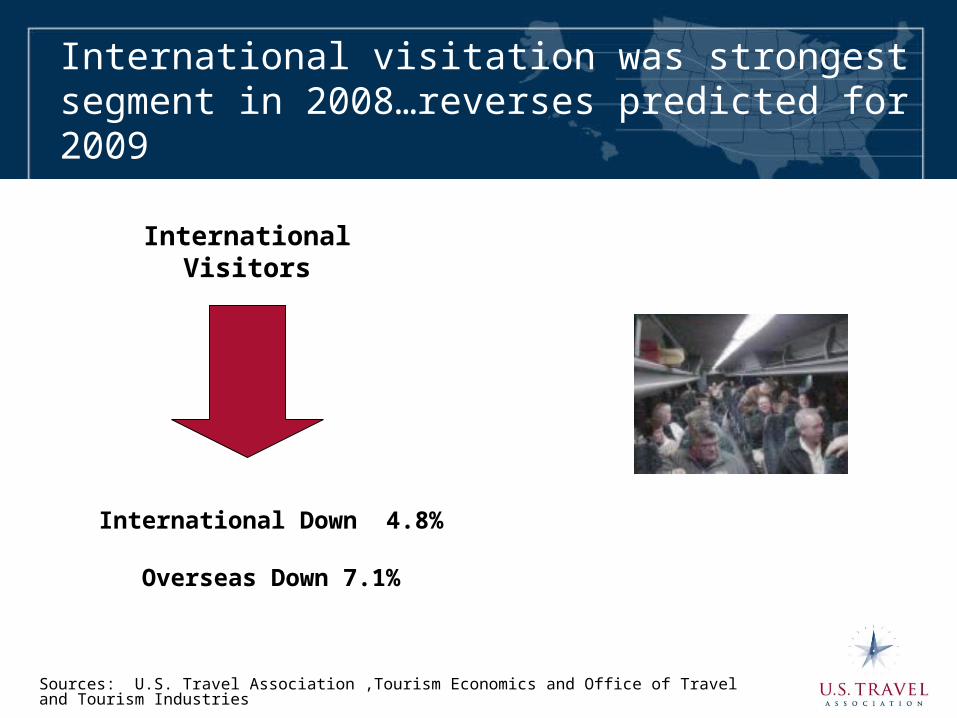
International visitation was strongest segment in 2008…reverses predicted for 2009
International Down 4.8%
Overseas Down 7.1%
InternationalVisitors
Sources: U.S. Travel Association ,Tourism Economics and Office of Travel and Tourism Industries
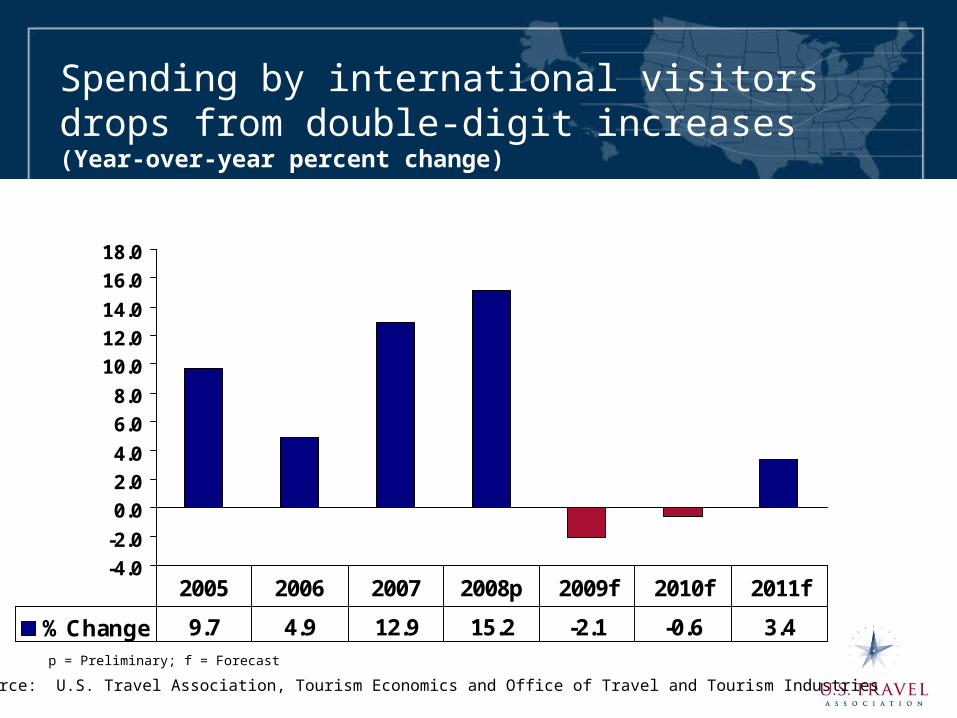
Spending by international visitors drops from double-digit increases(Year-over-year percent change)
-4.0
-2.0
0.0
2.0
4.0
6.0
8.0
10.0
12.0
14.0
16.0
18.0
% Change 9.7 4.9 12.9 15.2 -2.1 -0.6 3.4
2005 2006 2007 2008p 2009f 2010f 2011f
Source: U.S. Travel Association, Tourism Economics and Office of Travel and Tourism Industries
p = Preliminary; f = Forecast
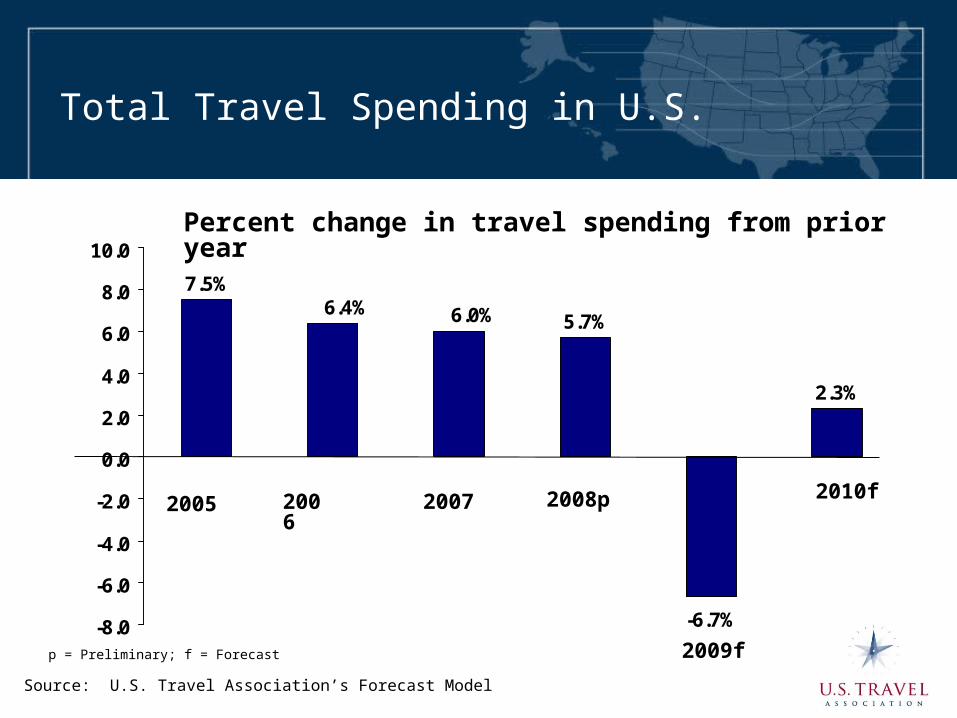
Total Travel Spending in U.S.
2.3%
-6.7%
6.0%
7.5%6.4%
5.7%
-8.0
-6.0
-4.0
-2.0
0.0
2.0
4.0
6.0
8.0
10.0
2005
2009f
2008p20072006 2010f
Source: U.S. Travel Association’s Forecast Model
p = Preliminary; f = Forecast
Percent change in travel spending from prior year
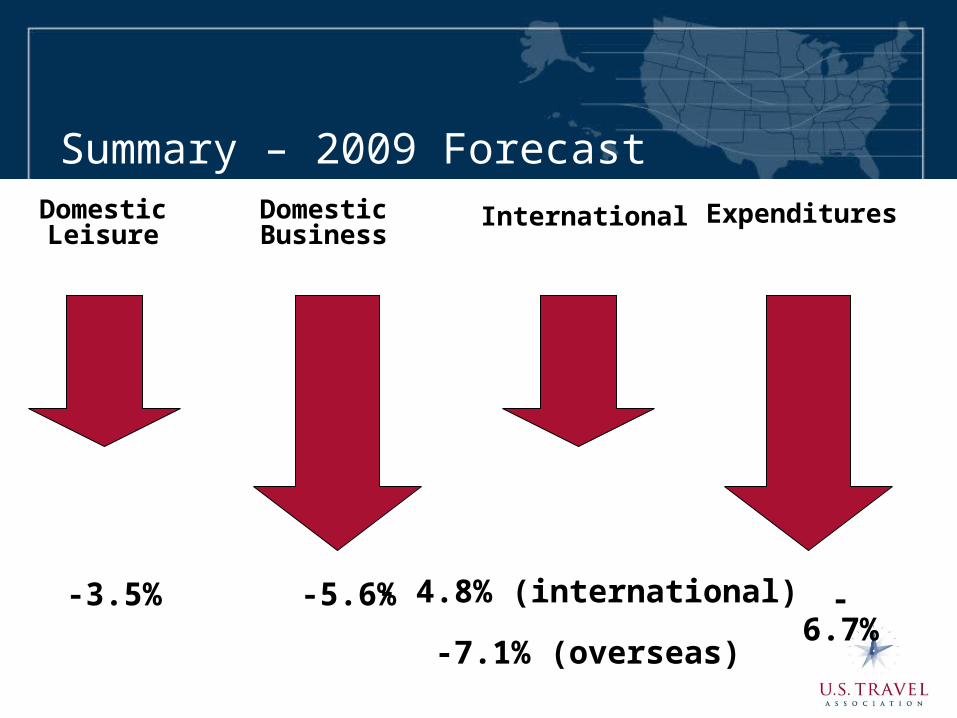
Summary – 2009 ForecastDomesticLeisure
DomesticBusiness
International Expenditures
-3.5% -5.6% - 4.8% (international)
-7.1% (overseas)
-6.7%
Challenges Facing the Travel & Tourism Industry
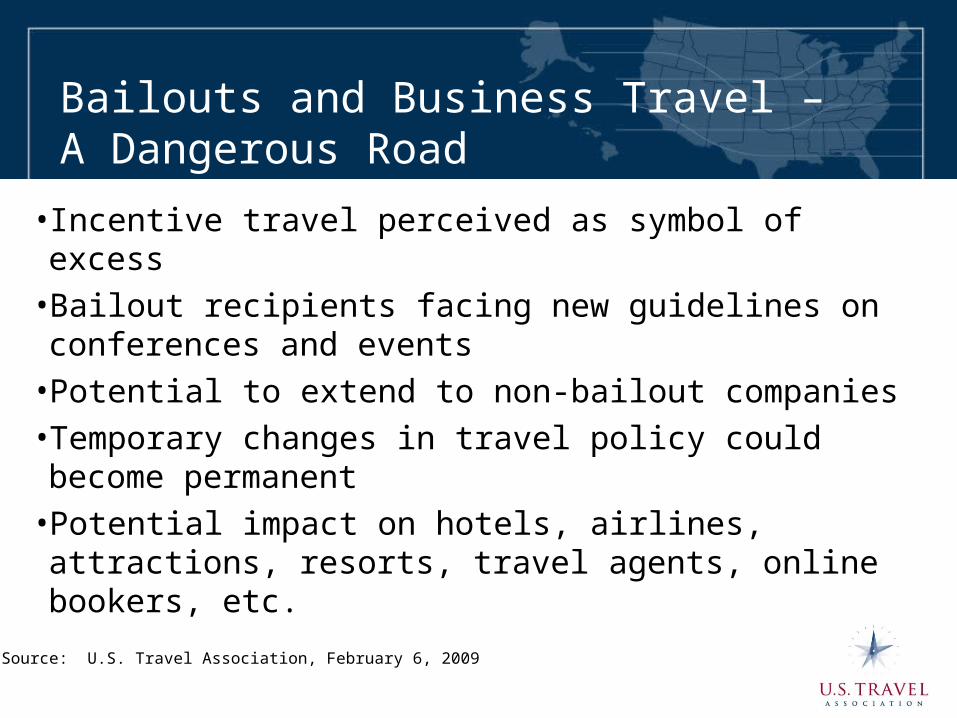
Bailouts and Business Travel – A Dangerous Road
• Incentive travel perceived as symbol of excess• Bailout recipients facing new guidelines on conferences and events
• Potential to extend to non-bailout companies• Temporary changes in travel policy could become permanent
• Potential impact on hotels, airlines, attractions, resorts, travel agents, online bookers, etc.
Source: U.S. Travel Association, February 6, 2009

Barriers to International Travel
• The global economic meltdown• U.S. does not make entry easy for visitors• United States lacking national program to promote the U.S. internationally (Tourism Promotion Act)
• Late to the table in signing MOU with China

Importance of travel and tourism to the economy
• Industry has little success convincing elected officials and budget analysts that travel and tourism is tax revenue generator
• State travel office budgets being slashed– Budget increases = opportunity to gain market share
• Destination marketing organization budgets should not be cut, especially in an economic downturn
• Argument for “police versus tourists” hard to make• U.S. Travel working with destinations to develop compelling
argument for relevance of travel and tourism promotion

What TO DO to Survive?(beyond learning to swim & tread water)
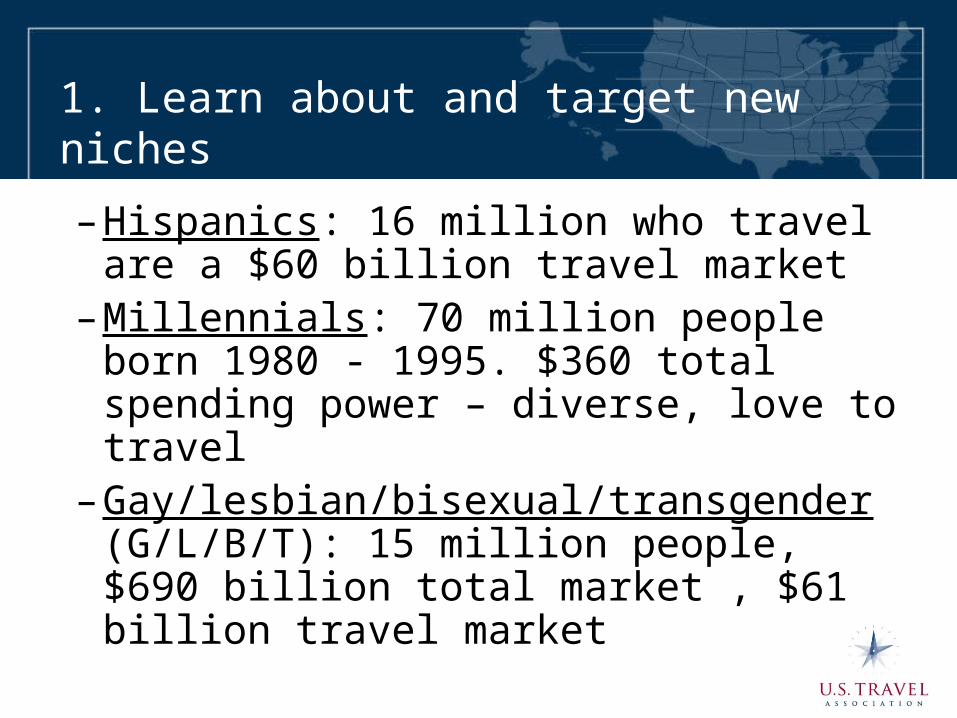
1. Learn about and target new niches
–Hispanics: 16 million who travel are a $60 billion travel market
–Millennials: 70 million people born 1980 - 1995. $360 total spending power – diverse, love to travel
–Gay/lesbian/bisexual/transgender (G/L/B/T): 15 million people, $690 billion total market , $61 billion travel market
2. Offer value
• Flat out price reductions may back fire• Price reductions may jeopardize your market position and product perceptions
• Price reductions lessen your ability to raise prices too strongly when the market recovers
• People want a good value for their money
3. Deliver outstanding customer service
• Distinguishes you from your competition• Makes the experience (positive) memorable• Brings customers back
4. Heighten customer engagement at each step of the experience
• Social media, feedback and excellent service are ways to increase customer engagement
• High engagement shown to have strongest impacts on loyalty and repeat visitation
• Need to look at (and address) every facet of the operation from the initial media contact up through the minute of departure
5. Don’t despair!! Be resourceful
• Perception ≠ Reality• Create own reality• Use existing resources• Use existing data• Market smarter not necessarily more• Competition can be a partner• Look at new ways of doing business – the market has changed – you must change with it!
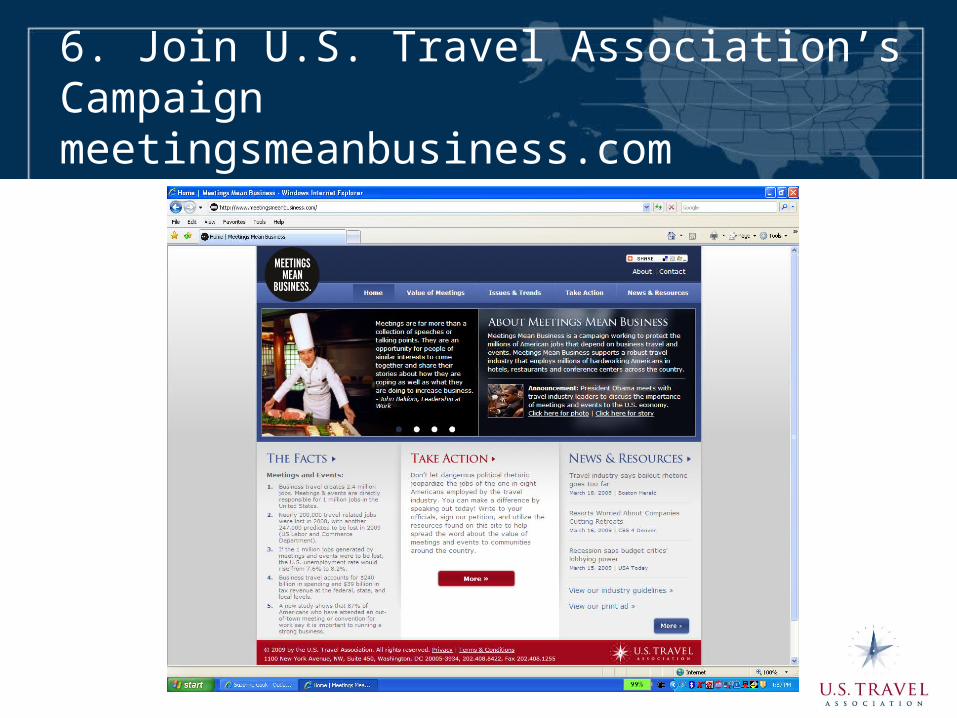
6. Join U.S. Travel Association’s Campaign meetingsmeanbusiness.com
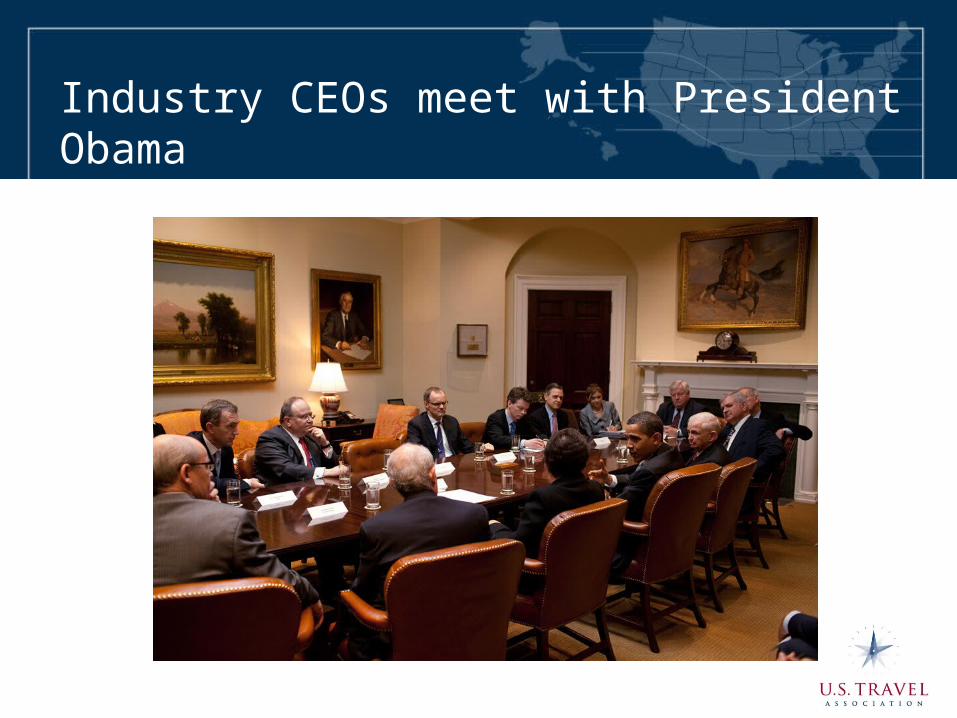
Industry CEOs meet with President Obama
6. Join our Campaign
• Write to your officials, sign our petition, and utilize the resources found on this site to help spread the word about the value of meetings and events to communities around the country.
• Watch for and use new research