2013 demographic report - ed
TRANSCRIPT
Office of English Language Learners
2013 Demographic Report
New York City Department of Education’s Division of Students with Disabilities and English
Language Learners
1
2013 Demographic Report
Acknowledgments
This report is being offered to educators, interested members of the public, and advocacy communities who seek to
become better acquainted with recent and relevant demographic information about New York City Department of
Education’s English language learners (ELLs).
Nick Pandey, the Office of ELLs’ Data Director, compiled the data presented in the pages that follow; Kara Hughes,
Director of Communication, prepared the report.
Introduction
Our aim is for this report to be both digestible and informative. After providing context about the NYC Department of
Education’s (DOE) ELLs, the report will delve into more detailed information so as to enable comparisons to be drawn
regarding geography, academic performance, and sub-groups. The goal of this report is to provide readers with an
enriched sense of our ELLs.
A note about data collection:
Each DOE school must report information about their ELL students into Automate the Schools’ (ATS) Bilingual Education
Student Information Survey (BESIS). Beginning in November of each school year, the Division of Information and
Instructional Technology compiles this data, which is reviewed and verified throughout the year to strengthen its
reliability and make ELL funding more responsive to schools with changing ELL populations. The 2011-2012 BESIS data in
this report was gathered during the annual October 2011 condition and has been reviewed, revised, and verified by ELL
Compliance and Performance Specialists during the winter months. Unless otherwise noted, the data in this report does
not include charter school students.
Current ELLs are a distinct student population and should not be used as a proxy for immigrant students. Graphs
presented in the pages that follow have been sourced and dated. All narrative writing aims to describe the populations
and conditions discussed as accurately as possible based on the available data.
Readers who are interested in learning more about school-based demographic information can visit any school’s website
and explore their “statistics” link, through which data for the last three school years can be located.
Becoming an ELL
When enrolling their child in a DOE school, parents and guardians must fill out a Home Language Identification Survey
(HLIS). If parents indicate that a language other than English is spoken in their home,1 their child is given a test called
the Language Assessment Battery-Revised (LAB-R), which is designed to determine language proficiency. Those students
who score below a State-determined level on the assessment become ELLs. During the spring of each school year, ELLs
in grades K to 12 take the New York State English as a Second Language Achievement Test (NYSESLAT), which is designed
to measure language development. Students remain current ELLs until they earn proficient scores on the NYSESLAT;
those students who pass the test are considered former ELLs.
1 There are 180 languages spoken in the homes of DOE students citywide.
2
ELLs within the context of the entire DOE student population
Just over 41% of the students enrolled in New York City public schools speak a language other than English at home.
That means that there are 438,131 students living in households where English is not the primary language spoken. To
contextualize this number, think about it this way: the number of students who speak a language other than English at
home is larger than the population of 41 state capitals, and it’s nearly half of Delaware’s entire state population.2
ELLs make up 14.4% of the entire DOE student population, as there are 159,162 ELLs enrolled in the school system. The
DOE has slightly more male than female ELLs, as 88,567 or 55.6% of our ELLs are male. 69.2% of our ELLs receive free
lunch, which is higher than the citywide average of 55.6%.
Nearly half (47.5%) of the DOE’s ELLs were born in another country. Data compiled evidences that the largest portion of
these students moved to the United States from the Dominican Republic (30.8% of foreign-born ELLs, or 22,804
students). The remaining majority of ELLs born abroad came to the U.S. from China (16.4%, 12,137 students), Mexico
(6.8%, 5,041), Bangladesh (5.0%, 3,719), Ecuador (4.7%, 3,471) and Haiti (4.7%, 3,463).
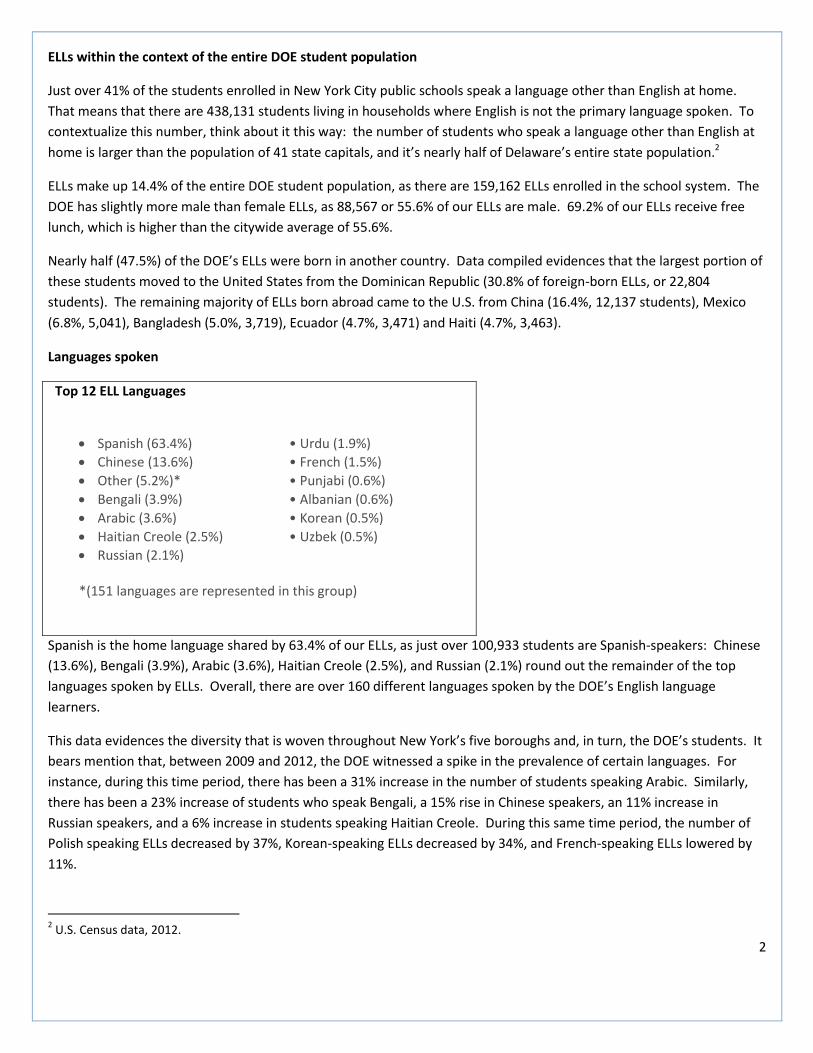
Languages spoken
Top 12 ELL Languages
Spanish (63.4%) • Urdu (1.9%)
Chinese (13.6%) • French (1.5%)
Other (5.2%)* • Punjabi (0.6%)
Bengali (3.9%) • Albanian (0.6%)
Arabic (3.6%) • Korean (0.5%)
Haitian Creole (2.5%) • Uzbek (0.5%)
Russian (2.1%) *(151 languages are represented in this group)
Spanish is the home language shared by 63.4% of our ELLs, as just over 100,933 students are Spanish-speakers: Chinese
(13.6%), Bengali (3.9%), Arabic (3.6%), Haitian Creole (2.5%), and Russian (2.1%) round out the remainder of the top
languages spoken by ELLs. Overall, there are over 160 different languages spoken by the DOE’s English language
learners.
This data evidences the diversity that is woven throughout New York’s five boroughs and, in turn, the DOE’s students. It
bears mention that, between 2009 and 2012, the DOE witnessed a spike in the prevalence of certain languages. For
instance, during this time period, there has been a 31% increase in the number of students speaking Arabic. Similarly,
there has been a 23% increase of students who speak Bengali, a 15% rise in Chinese speakers, an 11% increase in
Russian speakers, and a 6% increase in students speaking Haitian Creole. During this same time period, the number of
Polish speaking ELLs decreased by 37%, Korean-speaking ELLs decreased by 34%, and French-speaking ELLs lowered by
11%.
2 U.S. Census data, 2012.
3
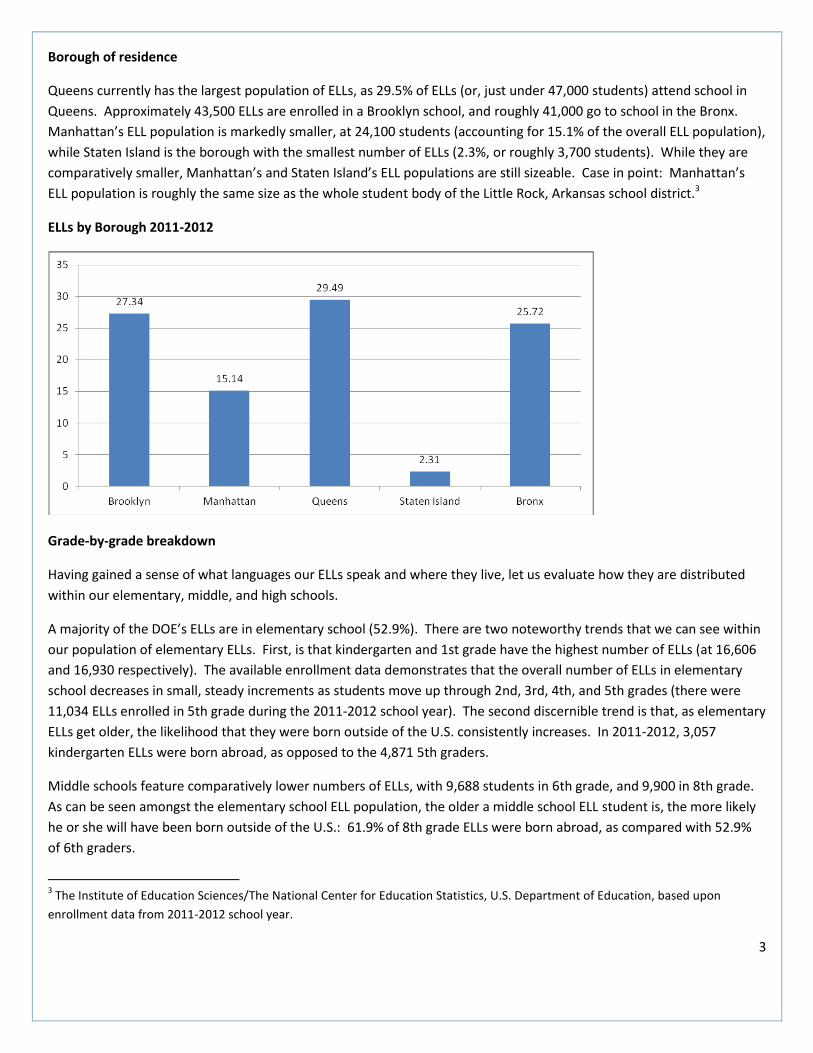
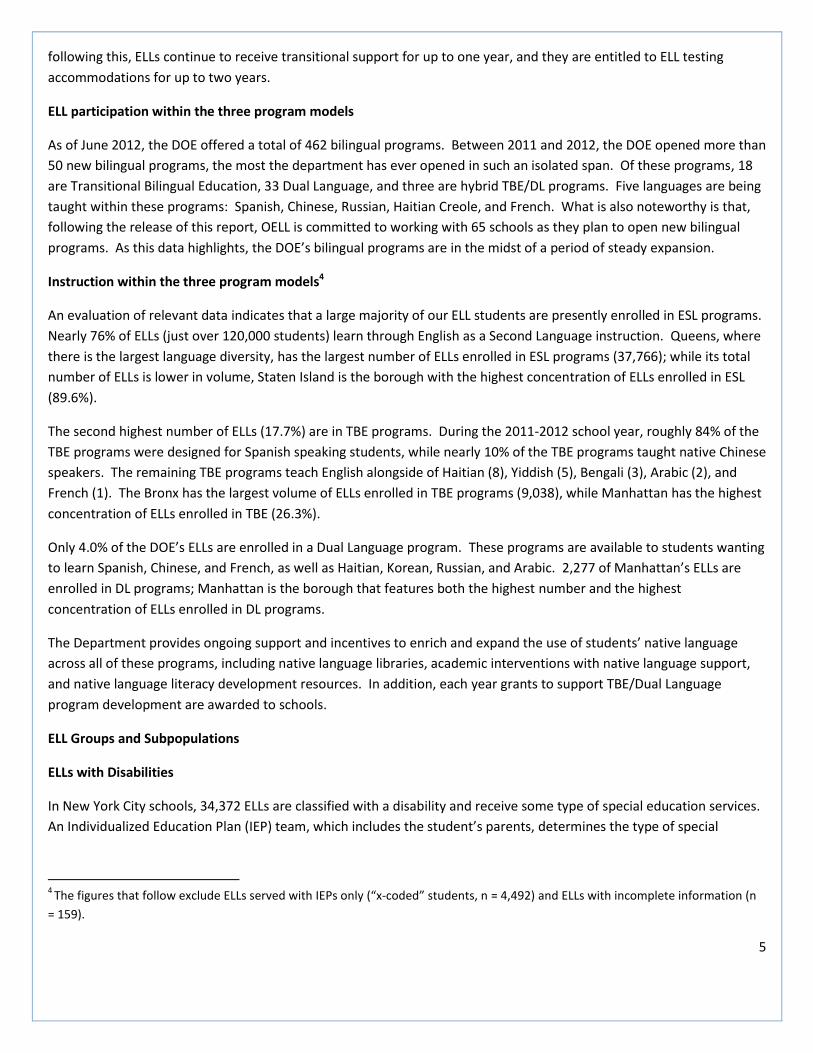
Borough of residence
Queens currently has the largest population of ELLs, as 29.5% of ELLs (or, just under 47,000 students) attend school in
Queens. Approximately 43,500 ELLs are enrolled in a Brooklyn school, and roughly 41,000 go to school in the Bronx.
Manhattan’s ELL population is markedly smaller, at 24,100 students (accounting for 15.1% of the overall ELL population),
while Staten Island is the borough with the smallest number of ELLs (2.3%, or roughly 3,700 students). While they are
comparatively smaller, Manhattan’s and Staten Island’s ELL populations are still sizeable. Case in point: Manhattan’s
ELL population is roughly the same size as the whole student body of the Little Rock, Arkansas school district.3
ELLs by Borough 2011-2012
Grade-by-grade breakdown
Having gained a sense of what languages our ELLs speak and where they live, let us evaluate how they are distributed
within our elementary, middle, and high schools.
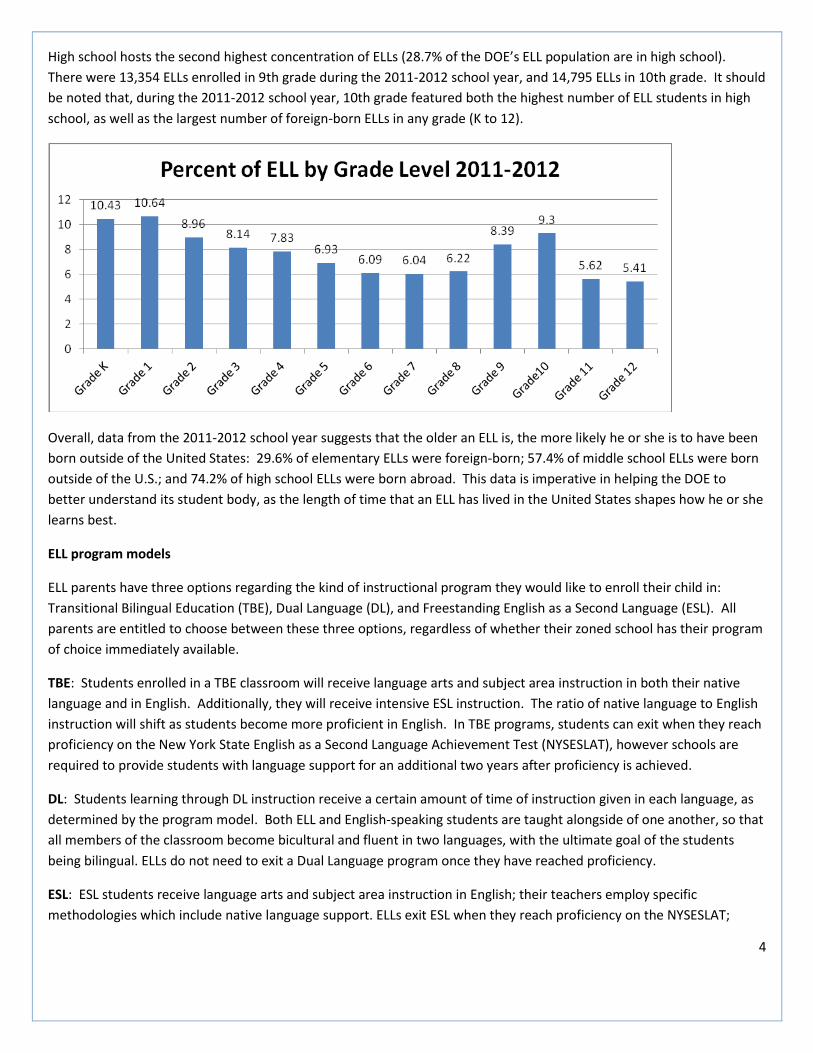
A majority of the DOE’s ELLs are in elementary school (52.9%). There are two noteworthy trends that we can see within
our population of elementary ELLs. First, is that kindergarten and 1st grade have the highest number of ELLs (at 16,606
and 16,930 respectively). The available enrollment data demonstrates that the overall number of ELLs in elementary
school decreases in small, steady increments as students move up through 2nd, 3rd, 4th, and 5th grades (there were
11,034 ELLs enrolled in 5th grade during the 2011-2012 school year). The second discernible trend is that, as elementary
ELLs get older, the likelihood that they were born outside of the U.S. consistently increases. In 2011-2012, 3,057
kindergarten ELLs were born abroad, as opposed to the 4,871 5th graders.
Middle schools feature comparatively lower numbers of ELLs, with 9,688 students in 6th grade, and 9,900 in 8th grade.
As can be seen amongst the elementary school ELL population, the older a middle school ELL student is, the more likely
he or she will have been born outside of the U.S.: 61.9% of 8th grade ELLs were born abroad, as compared with 52.9%
of 6th graders.
3 The Institute of Education Sciences/The National Center for Education Statistics, U.S. Department of Education, based upon
enrollment data from 2011-2012 school year.
4
High school hosts the second highest concentration of ELLs (28.7% of the DOE’s ELL population are in high school).
There were 13,354 ELLs enrolled in 9th grade during the 2011-2012 school year, and 14,795 ELLs in 10th grade. It should
be noted that, during the 2011-2012 school year, 10th grade featured both the highest number of ELL students in high
school, as well as the largest number of foreign-born ELLs in any grade (K to 12).
Overall, data from the 2011-2012 school year suggests that the older an ELL is, the more likely he or she is to have been
born outside of the United States: 29.6% of elementary ELLs were foreign-born; 57.4% of middle school ELLs were born
outside of the U.S.; and 74.2% of high school ELLs were born abroad. This data is imperative in helping the DOE to
better understand its student body, as the length of time that an ELL has lived in the United States shapes how he or she
learns best.
ELL program models
ELL parents have three options regarding the kind of instructional program they would like to enroll their child in:
Transitional Bilingual Education (TBE), Dual Language (DL), and Freestanding English as a Second Language (ESL). All
parents are entitled to choose between these three options, regardless of whether their zoned school has their program
of choice immediately available.
TBE: Students enrolled in a TBE classroom will receive language arts and subject area instruction in both their native
language and in English. Additionally, they will receive intensive ESL instruction. The ratio of native language to English
instruction will shift as students become more proficient in English. In TBE programs, students can exit when they reach
proficiency on the New York State English as a Second Language Achievement Test (NYSESLAT), however schools are
required to provide students with language support for an additional two years after proficiency is achieved.
DL: Students learning through DL instruction receive a certain amount of time of instruction given in each language, as
determined by the program model. Both ELL and English-speaking students are taught alongside of one another, so that
all members of the classroom become bicultural and fluent in two languages, with the ultimate goal of the students
being bilingual. ELLs do not need to exit a Dual Language program once they have reached proficiency.
ESL: ESL students receive language arts and subject area instruction in English; their teachers employ specific
methodologies which include native language support. ELLs exit ESL when they reach proficiency on the NYSESLAT;
5
following this, ELLs continue to receive transitional support for up to one year, and they are entitled to ELL testing
accommodations for up to two years.
ELL participation within the three program models
As of June 2012, the DOE offered a total of 462 bilingual programs. Between 2011 and 2012, the DOE opened more than
50 new bilingual programs, the most the department has ever opened in such an isolated span. Of these programs, 18
are Transitional Bilingual Education, 33 Dual Language, and three are hybrid TBE/DL programs. Five languages are being
taught within these programs: Spanish, Chinese, Russian, Haitian Creole, and French. What is also noteworthy is that,
following the release of this report, OELL is committed to working with 65 schools as they plan to open new bilingual
programs. As this data highlights, the DOE’s bilingual programs are in the midst of a period of steady expansion.
Instruction within the three program models4
An evaluation of relevant data indicates that a large majority of our ELL students are presently enrolled in ESL programs.
Nearly 76% of ELLs (just over 120,000 students) learn through English as a Second Language instruction. Queens, where
there is the largest language diversity, has the largest number of ELLs enrolled in ESL programs (37,766); while its total
number of ELLs is lower in volume, Staten Island is the borough with the highest concentration of ELLs enrolled in ESL
(89.6%).
The second highest number of ELLs (17.7%) are in TBE programs. During the 2011-2012 school year, roughly 84% of the
TBE programs were designed for Spanish speaking students, while nearly 10% of the TBE programs taught native Chinese
speakers. The remaining TBE programs teach English alongside of Haitian (8), Yiddish (5), Bengali (3), Arabic (2), and
French (1). The Bronx has the largest volume of ELLs enrolled in TBE programs (9,038), while Manhattan has the highest
concentration of ELLs enrolled in TBE (26.3%).
Only 4.0% of the DOE’s ELLs are enrolled in a Dual Language program. These programs are available to students wanting
to learn Spanish, Chinese, and French, as well as Haitian, Korean, Russian, and Arabic. 2,277 of Manhattan’s ELLs are
enrolled in DL programs; Manhattan is the borough that features both the highest number and the highest
concentration of ELLs enrolled in DL programs.
The Department provides ongoing support and incentives to enrich and expand the use of students’ native language
across all of these programs, including native language libraries, academic interventions with native language support,
and native language literacy development resources. In addition, each year grants to support TBE/Dual Language
program development are awarded to schools.
ELL Groups and Subpopulations
ELLs with Disabilities
In New York City schools, 34,372 ELLs are classified with a disability and receive some type of special education services.
An Individualized Education Plan (IEP) team, which includes the student’s parents, determines the type of special
4
The figures that follow exclude ELLs served with IEPs only (“x-coded” students, n = 4,492) and ELLs with incomplete information (n
= 159).
6
education services and the language in which the special education services are delivered to this subpopulation of ELLs.
The IEP’s determination may include bilingual and/or ESL services.
Citywide, 21.6% of ELLs have IEPs. The Bronx has the highest number of ELLs with disabilities: 10,090 such students
attend school in the Bronx, accounting for 24.6% of the borough’s overall ELL population. Queens has the second
highest number of ELLs with IEPs (9,039). While both Brooklyn and Manhattan have higher numbers of ELLs with
disabilities than Staten Island, SI is the borough with the highest concentration of ELLs with disabilities, as 34.8% of their
ELL population falls into this category.
ELL newcomers
The DOE’s Automate the School’s Immigrant Survey data provides information about students who are new immigrants,
defining newcomers as foreign-born students who have been admitted for the first time in a City school at some point
during the last three years. The percentage of ELLs who are newcomers has risen since 2010, moving from 61.5% to
63.1% of the overall ELL population. Since 2010, there has been an increase in newcomers in grades 3 to 8 (1.7%
increase) and in grades 9 to 12 (2.4% increase). The Department provides outreach to immigrants and their families not
only through ELL services, but also by providing access to language-specific resources and programming in schools,
networks, districts, and through various DOE websites.
As stated above, 63.1% of the 159,162 ELLs enrolled in schools citywide are newcomers. Notably, all five boroughs
feature ELL populations that are comprised of more than 50% newcomers. Queens has the highest number of
newcomers (31,485) as well as the highest concentration of new immigrants (67.1%). Brooklyn has the second highest
number of newcomers (28,920) and the second highest concentration of new immigrants (66.5%). Staten Island is the
borough with the lowest number of newcomer ELLs (2,153) and the lowest concentration of new immigrants within its
ELL population (58.5%).
Long-term ELLs
Long-term ELLs are students who, after six years of ELL services, continue to require them. These students often
demonstrate oral proficiency in English, but low academic literacy in both English and their home language. The
percentage of ELLs who have completed six years of study without passing the NYSESLAT has remained consistent since
2010; the figure has dropped only slightly, from 12.8% to 12.6% during this time.
The Bronx has both the highest number of long-term ELLs (6,723) as well as the highest concentration of long-term ELLs
(16.4%). While the total number of long-term ELLs enrolled in Queens schools (4,478) and Brooklyn schools (4,398) is
higher than the long-term ELLs enrolled in Manhattan schools, Manhattan has a higher concentration of long-term ELLs
(16.2%, compared to Queens’ 9.5% and Brooklyn’s 10.1%). Notably, at 9.5%, Queens is the borough that features the
lowest concentration of long-term ELLs. Although Staten Island has the fewest long-term ELLs (491), these students
account for 13.3% of their overall ELL population. The citywide data reveals that, across all five boroughs, on average,
long-term ELLs account for 12.6% of a school’s total ELL population.
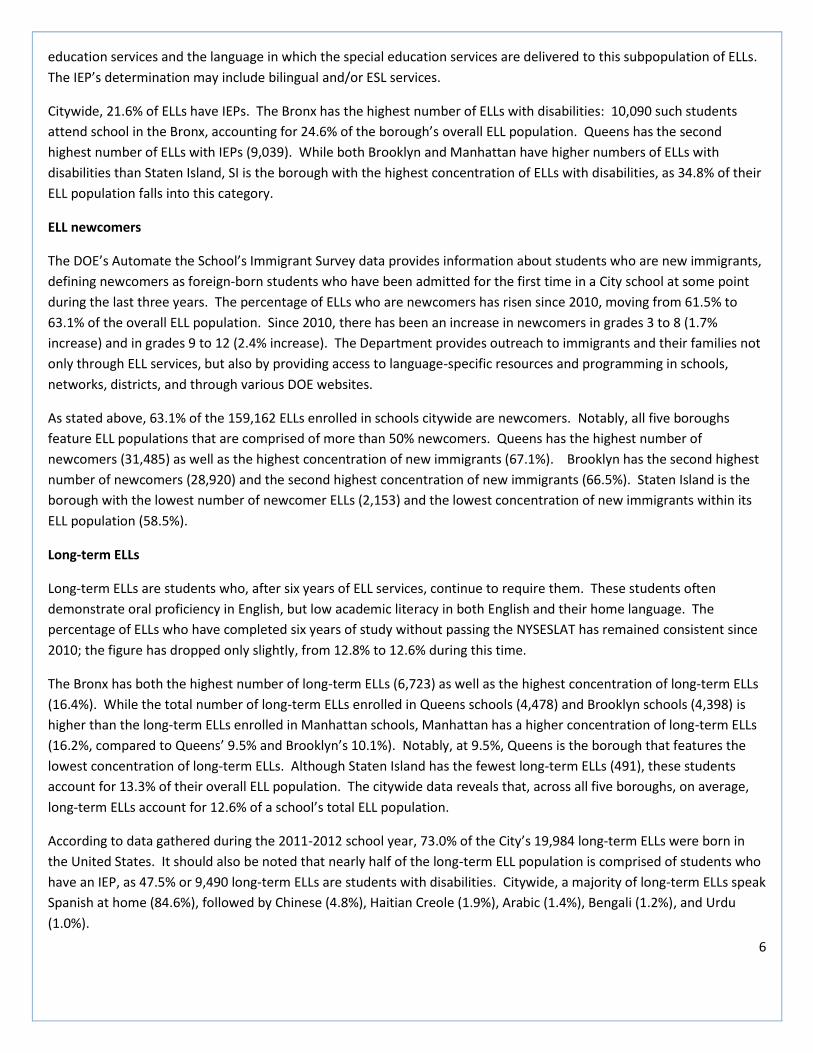
According to data gathered during the 2011-2012 school year, 73.0% of the City’s 19,984 long-term ELLs were born in
the United States. It should also be noted that nearly half of the long-term ELL population is comprised of students who
have an IEP, as 47.5% or 9,490 long-term ELLs are students with disabilities. Citywide, a majority of long-term ELLs speak
Spanish at home (84.6%), followed by Chinese (4.8%), Haitian Creole (1.9%), Arabic (1.4%), Bengali (1.2%), and Urdu
(1.0%).
7
Through a partnership with the City University of New York’s Graduate Center, the Department funds research on
understanding the characteristics and academic needs of the DOE’s long-term ELLs. Findings show that a common
characteristics of general education long-terms ELLs is educational inconsistency, including students who move back and
forth between the U.S. and their native countries, and students with inconsistent U.S. schooling who have moved
between DOE programs (bilingual, ESL, and monolingual English classes). The number of long-term ELLs reported by
New York City is most likely a conservative estimate, as BESIS data only tracks the years of ELL service that students have
received in New York City schools (as opposed to their participation in or attendance at any school nationwide). The
New York State Education Department uses a broader definition, designating long-term ELLs as those who still require
language services after six years of having been enrolled in a school program within any U.S. district.
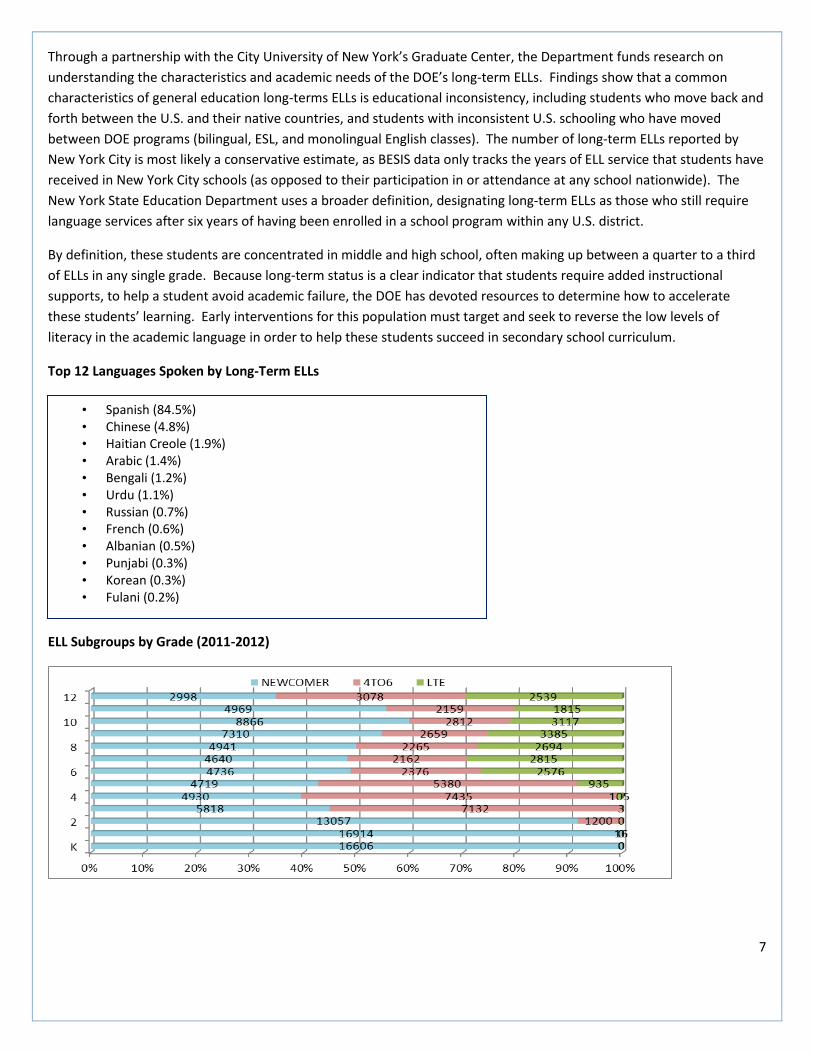
By definition, these students are concentrated in middle and high school, often making up between a quarter to a third
of ELLs in any single grade. Because long-term status is a clear indicator that students require added instructional
supports, to help a student avoid academic failure, the DOE has devoted resources to determine how to accelerate
these students’ learning. Early interventions for this population must target and seek to reverse the low levels of
literacy in the academic language in order to help these students succeed in secondary school curriculum.
Top 12 Languages Spoken by Long-Term ELLs
ELL Subgroups by Grade (2011-2012)
• Spanish (84.5%) • Chinese (4.8%) • Haitian Creole (1.9%) • Arabic (1.4%) • Bengali (1.2%) • Urdu (1.1%) • Russian (0.7%) • French (0.6%) • Albanian (0.5%) • Punjabi (0.3%) • Korean (0.3%) • Fulani (0.2%)
8
Students with Interrupted Formal Education (SIFE)
Students with Interrupted Formal Education (SIFE) is a designation that was created by the New York State Education
Department, which includes students who: come from a home where a language other than English is spoken; have had
at least two years less schooling than their peers; function at least two years below expected grade level in reading and
mathematics; and may be pre-literate in their first language. In 2012, there were 15,844 SIFE enrolled in the DOE; these
students accounted for 9.8% of our total ELL population. SIFE are two times as likely to be enrolled in grades 9 to 12
than they are to be in grades 3 to 8.
More than half of new SIFE speak Spanish at home (64.5%), and roughly three out of four SIFE have come to the U.S.
from the Dominican Republic. Other predominate languages among SIFE include Chinese speakers (who account for
9.1% of all SIFE), Haitian Creole (5.7%), Arabic (4.8%, a majority of whom are from Yemen), and Bengali (4.4%). Other
languages among new SIFE that are not reflected in high-incidence languages include French, Urdu, Russian, Tibetan,
and Fulani.
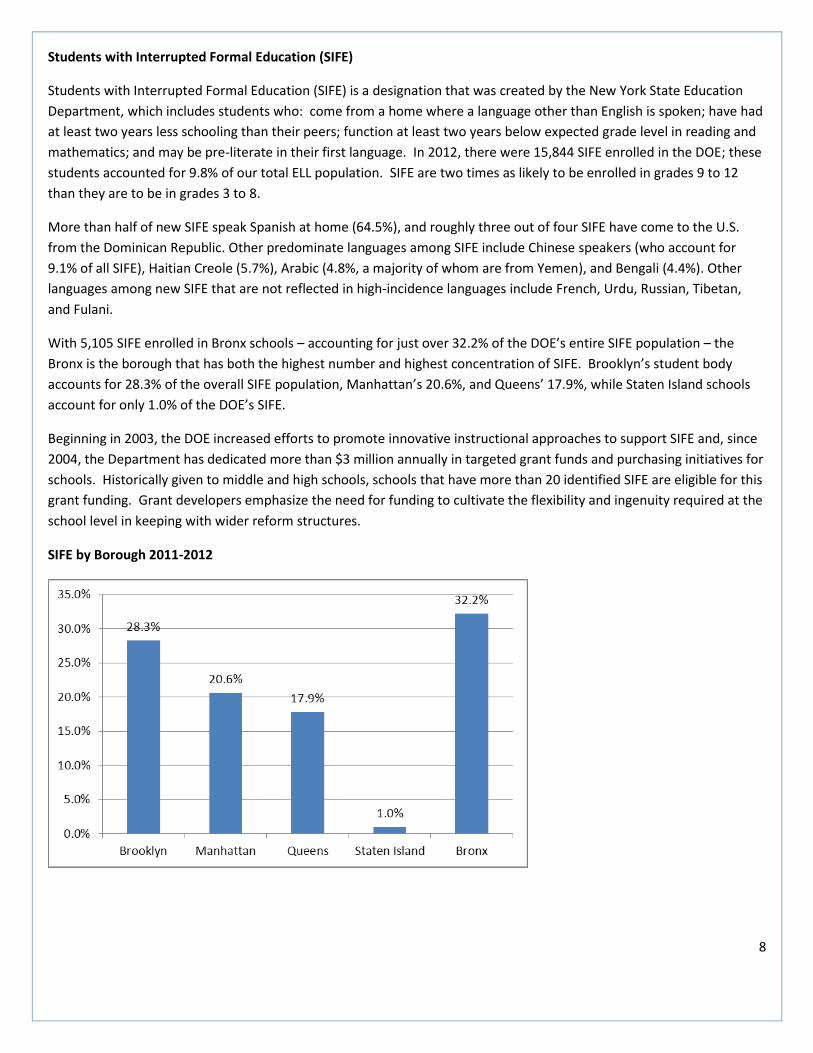
With 5,105 SIFE enrolled in Bronx schools – accounting for just over 32.2% of the DOE’s entire SIFE population – the
Bronx is the borough that has both the highest number and highest concentration of SIFE. Brooklyn’s student body
accounts for 28.3% of the overall SIFE population, Manhattan’s 20.6%, and Queens’ 17.9%, while Staten Island schools
account for only 1.0% of the DOE’s SIFE.
Beginning in 2003, the DOE increased efforts to promote innovative instructional approaches to support SIFE and, since
2004, the Department has dedicated more than $3 million annually in targeted grant funds and purchasing initiatives for
schools. Historically given to middle and high schools, schools that have more than 20 identified SIFE are eligible for this
grant funding. Grant developers emphasize the need for funding to cultivate the flexibility and ingenuity required at the
school level in keeping with wider reform structures.
SIFE by Borough 2011-2012
9
ELLs with Diverse Needs
Newcomers, students with long-term ELL statuses, and SIFE may face similar academic and social challenges, as many
grapple with diverse family and work situations, and unstable immigration status, as well as varied levels of language
proficiency in their native language and in English. As would be the case with any student, ELLs who experience
inconsistent schooling place their academic literacy and performance at risk across all subject matters. Along with
adolescent newcomers, all of these groups share the common challenge of needing to accelerate their academic
language development while acquiring the content needed to meet state graduation requirements. This recognized,
even though these groups of students share some common conditions, newcomers, SIFE, and long-term ELLs respond
best to different methods and forms of instruction.
Just over 75% of ELLs have specialized learning and social needs beyond general English language acquisition. Beginning
in middle school, ELLs with disabilities, long-term ELLs, SIFE, or students with a combination thereof begin to make up a
larger share of ELLs requiring specialized attention. In 3rd grade and above, ELLs who are newcomers, students with
disabilities, long-term ELLs, or SIFE outnumber general ELLs. This dramatic statistic highlights the DOE’s need to offer
invigorated and innovative approaches within its secondary ELL instruction.
ELL programs (which typically are designed for students who have had continuous and consistent schooling) may not
provide the specialized literacy or academic language supports necessary for struggling learners. Given these statistics,
enhanced attention is being paid to:
create effective ways of identifying students with inconsistent schooling
understand the academic and literacy competencies of long-term ELLs and SIFE
identify and study the level of accelerated learning that academic interventions produce
build a strong native language arts development continuum so that ELLs can enter the DOE at any level, from
pre-literacy to Advanced Placement
identify native language resources to fill subject matter and conceptual learning gaps
provide all teachers of ELLs with academic language and literacy professional development
enrich secondary educators’ repertoire of skills and strategies to effectively accelerate the achievement of
diverse ELL subgroups
In order to promote ELLs’ academic achievement, OELL offers extensive professional development, institutes, workshops, online resources and tools, and support for pilot programs, all of which are designed to illustrate Common Core Learning Standard-aligned work that schools can do to with ELL academic achievement in mind. An emphasis is also placed on schools providing supports to ensure that their English language learners are continuing to use their native languages to accelerate learning. The resources, research, professional development, and expertise offered to address the needs of all our ELLs are disseminated through OELL’s ELL specialists, educators’ portals, and the Department’s website.
10
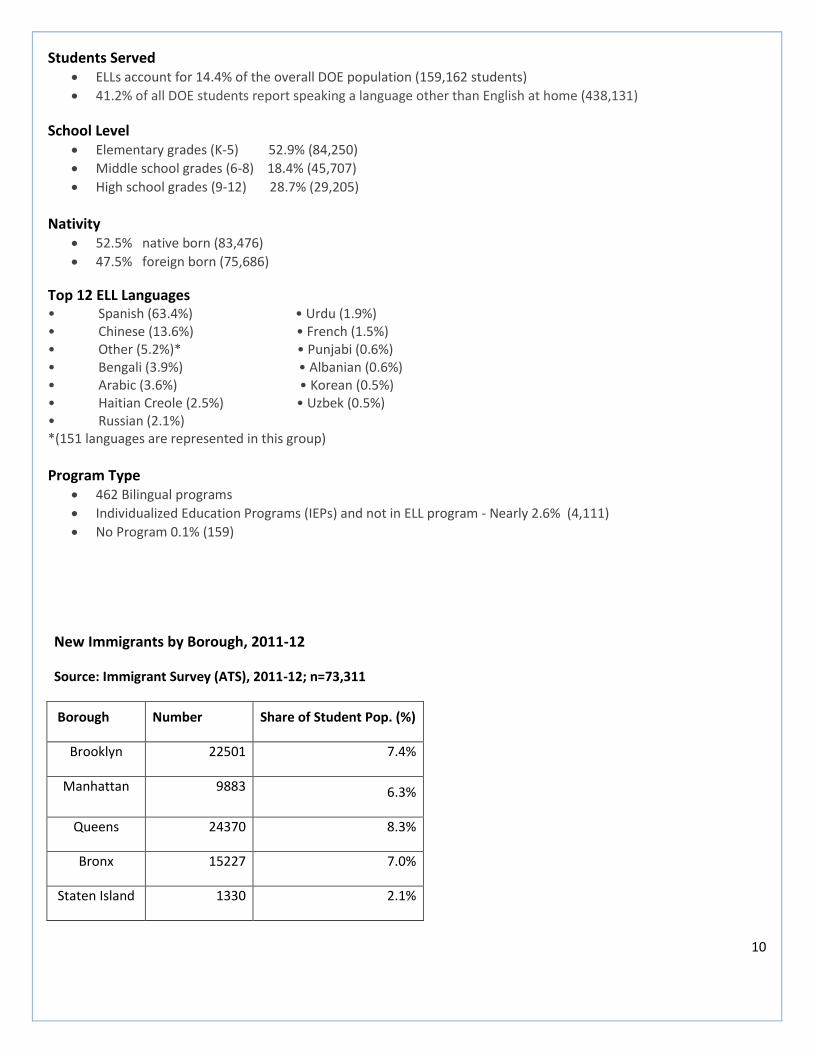
Students Served ELLs account for 14.4% of the overall DOE population (159,162 students)
41.2% of all DOE students report speaking a language other than English at home (438,131)
School Level Elementary grades (K-5) 52.9% (84,250)
Middle school grades (6-8) 18.4% (45,707)
High school grades (9-12) 28.7% (29,205)
Nativity 52.5% native born (83,476)
47.5% foreign born (75,686)
Top 12 ELL Languages • Spanish (63.4%) • Urdu (1.9%) • Chinese (13.6%) • French (1.5%) • Other (5.2%)* • Punjabi (0.6%) • Bengali (3.9%) • Albanian (0.6%) • Arabic (3.6%) • Korean (0.5%) • Haitian Creole (2.5%) • Uzbek (0.5%) • Russian (2.1%) *(151 languages are represented in this group)
Program Type 462 Bilingual programs
Individualized Education Programs (IEPs) and not in ELL program - Nearly 2.6% (4,111)
No Program 0.1% (159)
New Immigrants by Borough, 2011-12
Source: Immigrant Survey (ATS), 2011-12; n=73,311
Borough Number Share of Student Pop. (%)
Brooklyn 22501 7.4%
Manhattan 9883 6.3%
Queens 24370 8.3%
Bronx 15227 7.0%
Staten Island 1330 2.1%
11
11
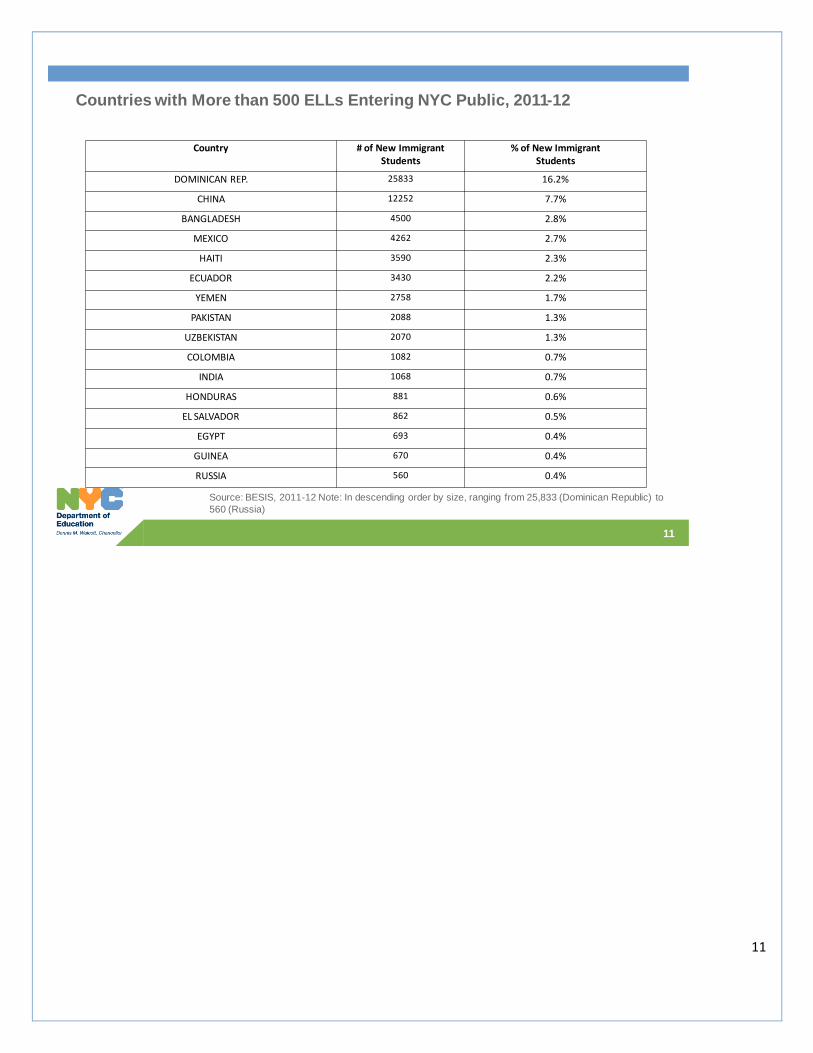
Country # of New Immigrant Students
% of New Immigrant Students
DOMINICAN REP. 25833 16.2%
CHINA 12252 7.7%
BANGLADESH 4500 2.8%
MEXICO 4262 2.7%
HAITI 3590 2.3%
ECUADOR 3430 2.2%
YEMEN 2758 1.7%
PAKISTAN 2088 1.3%
UZBEKISTAN 2070 1.3%
COLOMBIA 1082 0.7%
INDIA 1068 0.7%
HONDURAS 881 0.6%
EL SALVADOR 862 0.5%
EGYPT 693 0.4%
GUINEA 670 0.4%
RUSSIA 560 0.4%
Countries with More than 500 ELLs Entering NYC Public, 2011-12
Source: BESIS, 2011-12 Note: In descending order by size, ranging from 25,833 (Dominican Republic) to
560 (Russia)
12
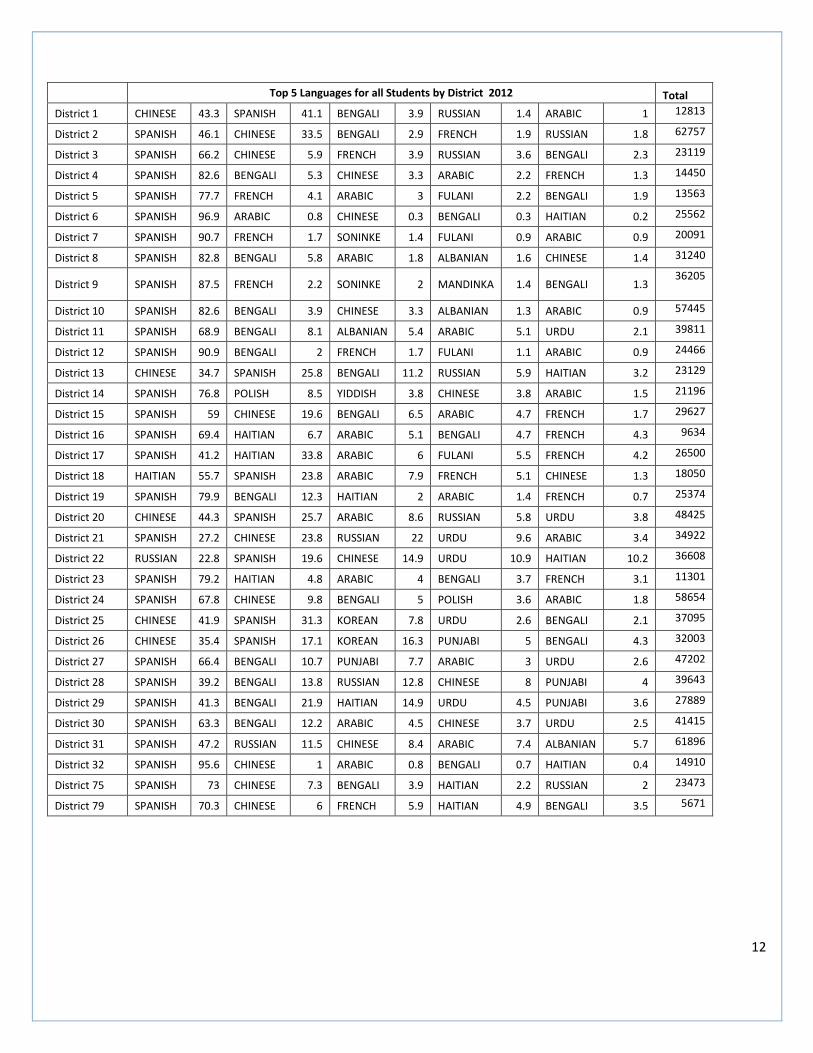
Top 5 Languages for all Students by District 2012 Total
District 1 CHINESE 43.3 SPANISH 41.1 BENGALI 3.9 RUSSIAN 1.4 ARABIC 1 12813
District 2 SPANISH 46.1 CHINESE 33.5 BENGALI 2.9 FRENCH 1.9 RUSSIAN 1.8 62757
District 3 SPANISH 66.2 CHINESE 5.9 FRENCH 3.9 RUSSIAN 3.6 BENGALI 2.3 23119
District 4 SPANISH 82.6 BENGALI 5.3 CHINESE 3.3 ARABIC 2.2 FRENCH 1.3 14450
District 5 SPANISH 77.7 FRENCH 4.1 ARABIC 3 FULANI 2.2 BENGALI 1.9 13563
District 6 SPANISH 96.9 ARABIC 0.8 CHINESE 0.3 BENGALI 0.3 HAITIAN 0.2 25562
District 7 SPANISH 90.7 FRENCH 1.7 SONINKE 1.4 FULANI 0.9 ARABIC 0.9 20091
District 8 SPANISH 82.8 BENGALI 5.8 ARABIC 1.8 ALBANIAN 1.6 CHINESE 1.4 31240
District 9 SPANISH 87.5 FRENCH 2.2 SONINKE 2 MANDINKA 1.4 BENGALI 1.3 36205
District 10 SPANISH 82.6 BENGALI 3.9 CHINESE 3.3 ALBANIAN 1.3 ARABIC 0.9 57445
District 11 SPANISH 68.9 BENGALI 8.1 ALBANIAN 5.4 ARABIC 5.1 URDU 2.1 39811
District 12 SPANISH 90.9 BENGALI 2 FRENCH 1.7 FULANI 1.1 ARABIC 0.9 24466
District 13 CHINESE 34.7 SPANISH 25.8 BENGALI 11.2 RUSSIAN 5.9 HAITIAN 3.2 23129
District 14 SPANISH 76.8 POLISH 8.5 YIDDISH 3.8 CHINESE 3.8 ARABIC 1.5 21196
District 15 SPANISH 59 CHINESE 19.6 BENGALI 6.5 ARABIC 4.7 FRENCH 1.7 29627
District 16 SPANISH 69.4 HAITIAN 6.7 ARABIC 5.1 BENGALI 4.7 FRENCH 4.3 9634
District 17 SPANISH 41.2 HAITIAN 33.8 ARABIC 6 FULANI 5.5 FRENCH 4.2 26500
District 18 HAITIAN 55.7 SPANISH 23.8 ARABIC 7.9 FRENCH 5.1 CHINESE 1.3 18050
District 19 SPANISH 79.9 BENGALI 12.3 HAITIAN 2 ARABIC 1.4 FRENCH 0.7 25374
District 20 CHINESE 44.3 SPANISH 25.7 ARABIC 8.6 RUSSIAN 5.8 URDU 3.8 48425
District 21 SPANISH 27.2 CHINESE 23.8 RUSSIAN 22 URDU 9.6 ARABIC 3.4 34922
District 22 RUSSIAN 22.8 SPANISH 19.6 CHINESE 14.9 URDU 10.9 HAITIAN 10.2 36608
District 23 SPANISH 79.2 HAITIAN 4.8 ARABIC 4 BENGALI 3.7 FRENCH 3.1 11301
District 24 SPANISH 67.8 CHINESE 9.8 BENGALI 5 POLISH 3.6 ARABIC 1.8 58654
District 25 CHINESE 41.9 SPANISH 31.3 KOREAN 7.8 URDU 2.6 BENGALI 2.1 37095
District 26 CHINESE 35.4 SPANISH 17.1 KOREAN 16.3 PUNJABI 5 BENGALI 4.3 32003
District 27 SPANISH 66.4 BENGALI 10.7 PUNJABI 7.7 ARABIC 3 URDU 2.6 47202
District 28 SPANISH 39.2 BENGALI 13.8 RUSSIAN 12.8 CHINESE 8 PUNJABI 4 39643
District 29 SPANISH 41.3 BENGALI 21.9 HAITIAN 14.9 URDU 4.5 PUNJABI 3.6 27889
District 30 SPANISH 63.3 BENGALI 12.2 ARABIC 4.5 CHINESE 3.7 URDU 2.5 41415
District 31 SPANISH 47.2 RUSSIAN 11.5 CHINESE 8.4 ARABIC 7.4 ALBANIAN 5.7 61896
District 32 SPANISH 95.6 CHINESE 1 ARABIC 0.8 BENGALI 0.7 HAITIAN 0.4 14910
District 75 SPANISH 73 CHINESE 7.3 BENGALI 3.9 HAITIAN 2.2 RUSSIAN 2 23473
District 79 SPANISH 70.3 CHINESE 6 FRENCH 5.9 HAITIAN 4.9 BENGALI 3.5 5671
13
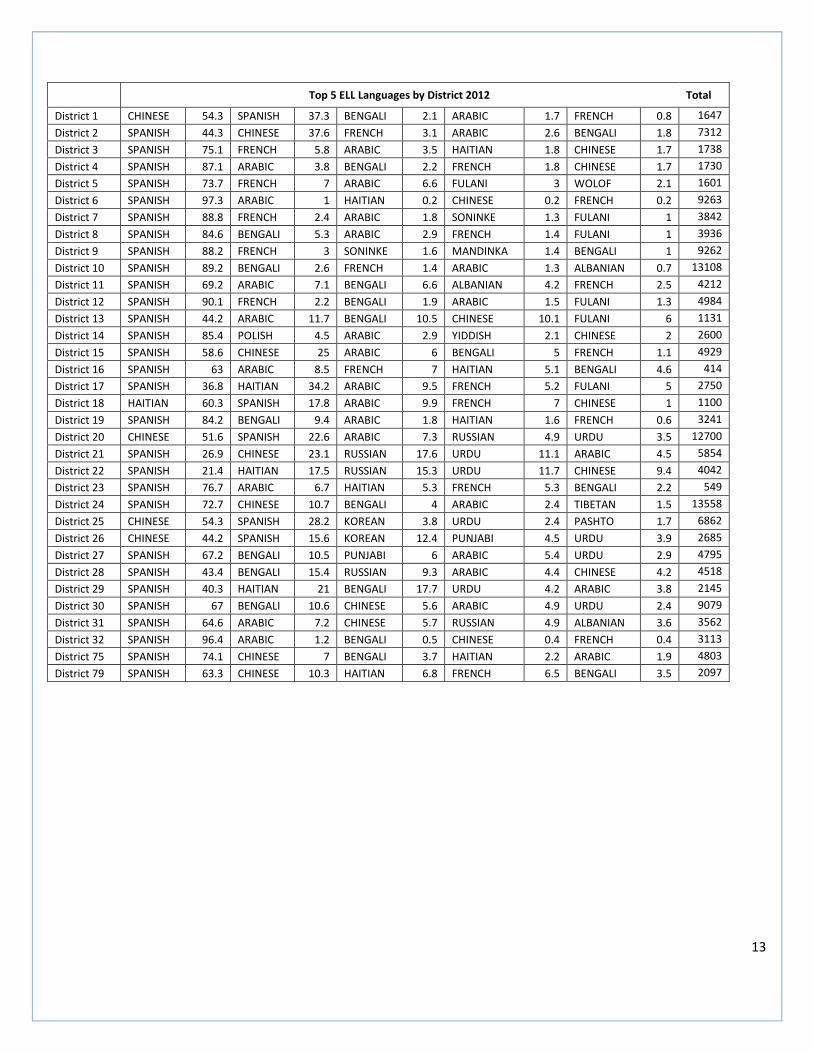
Top 5 ELL Languages by District 2012 Total
District 1 CHINESE 54.3 SPANISH 37.3 BENGALI 2.1 ARABIC 1.7 FRENCH 0.8 1647
District 2 SPANISH 44.3 CHINESE 37.6 FRENCH 3.1 ARABIC 2.6 BENGALI 1.8 7312
District 3 SPANISH 75.1 FRENCH 5.8 ARABIC 3.5 HAITIAN 1.8 CHINESE 1.7 1738
District 4 SPANISH 87.1 ARABIC 3.8 BENGALI 2.2 FRENCH 1.8 CHINESE 1.7 1730
District 5 SPANISH 73.7 FRENCH 7 ARABIC 6.6 FULANI 3 WOLOF 2.1 1601
District 6 SPANISH 97.3 ARABIC 1 HAITIAN 0.2 CHINESE 0.2 FRENCH 0.2 9263
District 7 SPANISH 88.8 FRENCH 2.4 ARABIC 1.8 SONINKE 1.3 FULANI 1 3842
District 8 SPANISH 84.6 BENGALI 5.3 ARABIC 2.9 FRENCH 1.4 FULANI 1 3936
District 9 SPANISH 88.2 FRENCH 3 SONINKE 1.6 MANDINKA 1.4 BENGALI 1 9262
District 10 SPANISH 89.2 BENGALI 2.6 FRENCH 1.4 ARABIC 1.3 ALBANIAN 0.7 13108
District 11 SPANISH 69.2 ARABIC 7.1 BENGALI 6.6 ALBANIAN 4.2 FRENCH 2.5 4212
District 12 SPANISH 90.1 FRENCH 2.2 BENGALI 1.9 ARABIC 1.5 FULANI 1.3 4984
District 13 SPANISH 44.2 ARABIC 11.7 BENGALI 10.5 CHINESE 10.1 FULANI 6 1131
District 14 SPANISH 85.4 POLISH 4.5 ARABIC 2.9 YIDDISH 2.1 CHINESE 2 2600
District 15 SPANISH 58.6 CHINESE 25 ARABIC 6 BENGALI 5 FRENCH 1.1 4929
District 16 SPANISH 63 ARABIC 8.5 FRENCH 7 HAITIAN 5.1 BENGALI 4.6 414
District 17 SPANISH 36.8 HAITIAN 34.2 ARABIC 9.5 FRENCH 5.2 FULANI 5 2750
District 18 HAITIAN 60.3 SPANISH 17.8 ARABIC 9.9 FRENCH 7 CHINESE 1 1100
District 19 SPANISH 84.2 BENGALI 9.4 ARABIC 1.8 HAITIAN 1.6 FRENCH 0.6 3241
District 20 CHINESE 51.6 SPANISH 22.6 ARABIC 7.3 RUSSIAN 4.9 URDU 3.5 12700
District 21 SPANISH 26.9 CHINESE 23.1 RUSSIAN 17.6 URDU 11.1 ARABIC 4.5 5854
District 22 SPANISH 21.4 HAITIAN 17.5 RUSSIAN 15.3 URDU 11.7 CHINESE 9.4 4042
District 23 SPANISH 76.7 ARABIC 6.7 HAITIAN 5.3 FRENCH 5.3 BENGALI 2.2 549
District 24 SPANISH 72.7 CHINESE 10.7 BENGALI 4 ARABIC 2.4 TIBETAN 1.5 13558
District 25 CHINESE 54.3 SPANISH 28.2 KOREAN 3.8 URDU 2.4 PASHTO 1.7 6862
District 26 CHINESE 44.2 SPANISH 15.6 KOREAN 12.4 PUNJABI 4.5 URDU 3.9 2685
District 27 SPANISH 67.2 BENGALI 10.5 PUNJABI 6 ARABIC 5.4 URDU 2.9 4795
District 28 SPANISH 43.4 BENGALI 15.4 RUSSIAN 9.3 ARABIC 4.4 CHINESE 4.2 4518
District 29 SPANISH 40.3 HAITIAN 21 BENGALI 17.7 URDU 4.2 ARABIC 3.8 2145
District 30 SPANISH 67 BENGALI 10.6 CHINESE 5.6 ARABIC 4.9 URDU 2.4 9079
District 31 SPANISH 64.6 ARABIC 7.2 CHINESE 5.7 RUSSIAN 4.9 ALBANIAN 3.6 3562
District 32 SPANISH 96.4 ARABIC 1.2 BENGALI 0.5 CHINESE 0.4 FRENCH 0.4 3113
District 75 SPANISH 74.1 CHINESE 7 BENGALI 3.7 HAITIAN 2.2 ARABIC 1.9 4803
District 79 SPANISH 63.3 CHINESE 10.3 HAITIAN 6.8 FRENCH 6.5 BENGALI 3.5 2097