melbourne cbd and remainder small area demographic profile ... · melbourne central business...
TRANSCRIPT

Melbourne Central Business District & Remainder Small Area Demographic Profile
2013
www.melbourne.vic.gov.au

Melbourne Central Business District Small Area Demographic Profile
2 / 20
Contents
1. Key findings ............................................................................................... 4
2. Profile ......................................................................................................... 5
2.1. History and environment of Melbourne Central Business District ........... 5
2.2. Geography of Melbourne CBD & remainder small area ......................... 6
2.3. Demographic profile................................................................................ 7
2.4. Social profile ........................................................................................... 8
2.4.1. Education ............................................................................................ 8
2.4.2. Household and family structure ........................................................... 9
2.4.3. Culture and language profile ............................................................... 9
2.4.4. Internet connection at home ................................................................ 9
2.5. Income profile ....................................................................................... 10
2.6. Socio-economic Index for Areas (SEIFA) ............................................. 11
2.7. Housing ................................................................................................ 13
2.8. Land use and business activity ............................................................. 14
2.9. Workforce ............................................................................................. 15
2.10. Future outlook ....................................................................................... 18
2.10.1. Development activity ......................................................................... 18
2.10.2. Population projections ....................................................................... 19

3 / 20
Melbourne Central Business District Small Area Demographic Profile
Disclaimer
While all due care has been taken to ensure that the content of this report is accurate and current, there may be errors or omissions in it and no legal responsibility is accepted for the information and opinions contained within.
In addition, as the report is based on historic information that is subject to revision and assumptions in preparing forecast figures that are both difficult to predict and liable to change, we do not guarantee the reports currency.
Data sources
Unless otherwise stated, all data in this report are based on the Australian Bureau of Statistics 2011 Census of Population and Housing.
City of Melbourne’s own Census of Land Use and Employment (CLUE) 2010 database also utilised for various economic, land use and employment related analysis.
Forecast population estimates provided via 2011-2036 Population and Household forecasts, id Consultants, last updated October 2013.
Further information
For further information about this small area, another small area with the City of Melbourne or the municipality overall, see the City Research webpage found via the City of Melbourne homepage:
http://www.melbourne.vic.gov.au/AboutMelbourne/Statistics/Pages/Statistics.aspx
This link also contains other demographic reports related to various elements of the City of Melbourne and the small areas contained within it, such as: Workers Profile, Students Profile, High rise Dwellers profile, Younger Persons Profile, Older Persons Profile and Key Changes between 2006 & 2011 Censuses.

Melbourne Central Business District Small Area Demographic Profile
4 / 20
1. Key findings
Melbourne Central Business District (CBD) housed the highest number of residents of all the City of Melbourne’s (the ‘municipality’) small areas. The 20,038 residents in Melbourne CBD represented 21 per cent of the municipality’s overall population.
There were 16,320 dwellings in Melbourne CBD representing around 28 per cent of the municipality, with residential apartments comprising 69% of all housing types in the small area.
Half of households in Melbourne CBD were rented (50%); a relatively high proportion compared to the other small areas in the municipality. The proportion of households with a mortgage or owning their dwelling outright (24%) was slightly lower than the municipality average (27%).
The median age of 26 was slightly younger than the municipality average of 28, mainly due to the relatively large population of students in the area.
Melbourne CBD had the highest proportions of residents born overseas and those who speak a language other than English at home compared to all other small areas in the municipality. Two thirds (66%) of Melbourne CBD residents were born overseas with 55% speaking a language other than English at home. China was the most common country of birth (14%) and Mandarin was the most common language spoken at home (18%).
The median personal income of $560 was relatively low among the municipality’s small areas, with only two small areas in the municipality recording a lower median income. One in five (20%) Melbourne CBD residents stated a nil income and can generally be attributed to the large international student cohort residing in Melbourne CBD, a significant proportion of which tend to be financially subsidised by means other than earning a personal income.
The most common household type in Melbourne CBD was a lone person household (36%), followed by family households (35%) and group households (17%). Compared to the overall municipality, Melbourne CBD housed a slightly higher proportion of lone person households and slightly lower proportion of family households.
Melbourne CBD scored slightly higher than the overall municipality for three out of four SEIFA (Socio-Economic Index for Areas) metrics. These results indicate minimal social disadvantage in the area.
More than 188,500 people worked in Melbourne CBD with the most common occupation a ‘professional’ (39%). 89% of the workforce lived outside the City of Melbourne but within Greater Melbourne.
Around two thirds of workers (65%) used some form of public transport to get to work, with train usage accounting for 50%. A further 21% drove a car, while 3% rode a bicycle to work.
Melbourne CBD’s population is forecast to reach around 52,000 by 2036; an increase of more than twice today’s population, living in around 27,500 households.

5 / 20
Melbourne Central Business District Small Area Demographic Profile
2. Profile
2.1. History and environment of Melbourne Central Business District
Melbourne Central Business District (CBD) & remainder is the largest business, as well as residential area, in the municipality.
The CBD is Melbourne’s business and financial centre. It encompasses the central city grid, plus the area between Victoria and Latrobe streets. The CBD is home to retail, financial, legal, administrative, recreational, tourist and entertainment facilities and operates 24 hours a day, serving a wide variety of residents, workers and visitors.
The over-supply of office space in Melbourne CBD during the 1990s coupled with the City of Melbourne’s Postcode 3000 initiative has led to a resurgence in inner-city living.
The Melbourne CBD & remainder small area includes many major parks and gardens including the Royal Botanic Gardens, Kings Domain (which contains Government House), Queen Victoria Gardens, Alexandra Gardens and the Shrine of Remembrance Reserve.

Melbourne Central Business District Small Area Demographic Profile
6 / 20
2.2. Geography of Melbourne CBD & remainder small area
Figure 1: Melbourne CBD & remainder small area geography within City of Melbourne
The small area of Melbourne CBD & remainder includes the Hoddle grid (CBD) with the small triangle at the top connecting to Victoria Parade encompassing Queen Victoria Markets. The small area also the Melbourne remainder section of various parklands south of the Yarra River housing no residents nor dwellings.

7 / 20
Melbourne Central Business District Small Area Demographic Profile
2.3. Demographic profile
Figure 2: Key metrics of Melbourne CBD & remainder residents
Key metrics Melbourne CBD &
remainder City of Melbourne
Residential population 20,038
(21% of City of Melbourne) 93,627
Younger residents (12-25 years) 44% 33%
Older residents (60 years and over) 5% 10%
Median age 26 28
Residents born overseas 66% 48%
Most common language spoken at home (other than English)
Mandarin (18%)
Mandarin (10%)
Weekly personal income <$300 32% 26%
Weekly personal income >$1250 19% 23%
Median personal weekly income $560 $711
Higher education (university) students 27% 21%
Bachelor degree or higher 40% 40%
Melbourne CBD & remainder’s residential population of 20,038 represents 21% of the City of Melbourne’s (the ‘municipality’) overall population and positions this small area as the most populous in the City of Melbourne.
With a median age of 26 years, Melbourne CBD was slightly younger than the overall municipality’s median age (28). Only two small areas in the municipality had younger median ages, Carlton (25) and Parkville (24).
Slightly less than half (44%) of residents were aged 12 to 25 years, with only Carlton (46%) and Parkville (48%) housing a higher proportion of residents this age. Conversely, only one in twenty (5%) Melbourne CBD residents were aged 60 years or older, the smallest proportion across all small areas in the municipality. The most common age range was 20 to 34 years (66%).
Around one third (32%) Melbourne CBD residents earned an income of less than $300 per week, while one in five (19%) earned in excess of $1250. The average personal weekly income of $560 for Melbourne CBD residents means there were only two small areas where residents earned a lower median income: Carlton ($366) and Parkville ($327).
Just over one quarter (27%) of Melbourne CBD residents were higher education students compared to the municipality average of 21%. Only two small areas, Carlton (35%) and Parkville (42%), contained higher proportions of higher education students. Four in 10 (40%) residents held a bachelor degree qualification or higher, a proportion equal to the overall municipality average.

Melbourne Central Business District Small Area Demographic Profile
8 / 20
Mandarin was spoken at home by more residents in Melbourne CBD (18%) than any other City of Melbourne small area.
Figure 3: Melbourne CBD & remainder age profile
As Figure 3 depicts, around two thirds (66%) of Melbourne CBD & remainder’s residents were aged 20 to 34 years.
2.4. Social profile
2.4.1. Education
More than one third (36%) of Melbourne CBD residents attended an educational institution, a higher proportion than the overall municipality (30%) and only surpassed by residents in the small areas of Carlton (45%) and Parkville (49%). Among Melbourne CBD’s students, three quarters (75%) were undertaking higher education (i.e. university or similar).
Four in 10 (40%) of Melbourne CBD’s residents held a bachelor degree qualification or higher, which was equal to the overall municipality average. The three small areas South Yarra (West) (44%), Southbank (46%) and East Melbourne (50%) had a higher proportion of holders of bachelor degree qualifications or higher.
0
1000
2000
3000
4000
5000
6000
7000
Resid
ents
Years of Age
Melbourne CBD
Median age: 26

9 / 20
Melbourne Central Business District Small Area Demographic Profile
2.4.2. Household and family structure
Lone person households accounted for just over one third (36%) of household types in Melbourne CBD, making this the most common household type in the small area. Family households* comprised 35%, with group households accounting for 17%.
*Note: a family is defined by the ABS as two or more persons, one of whom is at least 15 years of age, who are related by blood, marriage (registered or de facto), adoption, step or fostering, and who are usually resident in the same household.
2.4.3. Culture and language profile
Two thirds (66%) of Melbourne CBD’s residents were born overseas, the highest proportion across all the municipality’s small areas and well above the municipality average of 48%. The most common countries of birth other than Australia included: China (14%), Malaysia (9%), India (6%), Indonesia (6%) and Korea (3%).
More than half (55%) of Melbourne CBD’s residents spoke a language other than English at home, with the most common languages spoken including: Mandarin (18%), Cantonese (7%), Indonesian (5%), Korean (3%) and Hindi (2%).
2.4.4. Internet connection at home
Just under three quarters (72%) of households in Melbourne CBD had a broadband Internet connection at home, a similar proportion to the overall municipality (71%). A small 6% had no Internet connection, while 2% had a dial up connection and 6% accessed the Internet via an other* connection type. 14% of households did not provide an answer to this Census question.
* Note on Internet connection types:
• Broadband connection includes: ADSL, Cable, Wireless, Satellite, Fibre and Mobile connections
• Dial up connection includes: analogue modem and ISDN connections • Other connection type includes: Internet access through mobile phones, etc.

Melbourne Central Business District Small Area Demographic Profile
10 / 20
2.5. Income profile
Figure 4: Melbourne CBD & remainder income comparisons
Income (weekly) Melbourne CBD &
remainder City of Melbourne
Median total personal income $560 $711
Median total family income $1455 $1962
Median total household income $1039 $1352
The median total personal income for Melbourne CBD ($560) was the third lowest among all the municipality’s small areas, with the small areas Carlton ($366) and Parkville ($327) lower.
Melbourne CBD’s median incomes, as listed above in Figure 4, were all lower than overall municipality medians. There was, however, one in five (20%) residents stating a nil income, despite the relatively mid-range incomes. This relatively high proportion can generally be attributed to the large international student cohort residing in Melbourne CBD, a significant proportion of which tend to be financially subsidised by means other than earning a personal income.
Figure 5: Melbourne CBD & remainder personal weekly income profile
0500
10001500200025003000350040004500
Resid
ents
Personal weekly income
Melbourne CBD
Median personal income: $560

11 / 20
Melbourne Central Business District Small Area Demographic Profile
2.6. Socio-economic Index for Areas (SEIFA)
SEIFA is a suite of four indexes compiled from data collected in the ABS 2011 Census which rank areas in terms of the socio-economic characteristics of persons and households in that area. SEIFA allows for comparisons of areas whereby the lower the score, the greater the disadvantage relative to other comparable areas.
The Index of Relative Socio-economic Advantage and Disadvantage (IRSAD) summarises information about the economic and social conditions of people and households within an area, including both relative advantage and disadvantage measures.
The Index of Relative Socio-economic Disadvantage (IRSD) is a general socio-economic index that summarises a range of information about the economic and social conditions of people and households within an area. Unlike the other indexes, this index includes only measures of relative disadvantage.
The Index of Economic Resources (IER) focuses on the financial aspects of relative socio-economic advantage and disadvantage, by summarising variables related to income and wealth. This index excludes education and occupation variables because they are not direct measures of economic resources. It also misses some assets such as savings or equities which, although relevant, could not be included because this information was not collected in the 2011 Census.
The Index of Education and Occupation (IEO) is designed to reflect the educational and occupational level of communities. The education variables in this index show either the level of qualification achieved or whether further education is being undertaken. The occupation variables classify the workforce into the major groups and skill levels of the Australian and New Zealand Standard Classification of Occupations (ANZSCO) and the unemployed. This index does not include any income variables.
The following diagram represents the continuum that should be considered when interpreting SEIFA scores.
* Note that for the IRSD, a high index score represents “Least Disadvantaged”.
*
Melbourne Central Business District Small Area Demographic Profile
12 / 20
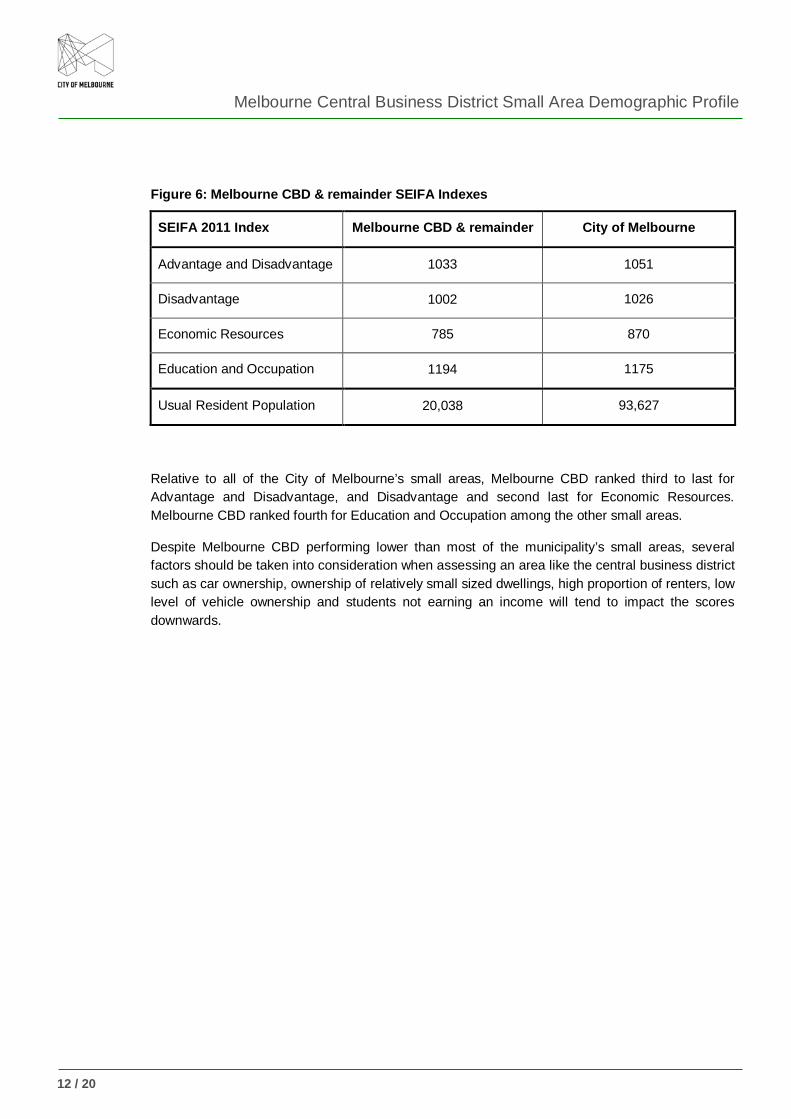
Figure 6: Melbourne CBD & remainder SEIFA Indexes
SEIFA 2011 Index Melbourne CBD & remainder City of Melbourne
Advantage and Disadvantage 1033 1051
Disadvantage 1002 1026
Economic Resources 785 870
Education and Occupation 1194 1175
Usual Resident Population 20,038 93,627
Relative to all of the City of Melbourne’s small areas, Melbourne CBD ranked third to last for Advantage and Disadvantage, and Disadvantage and second last for Economic Resources. Melbourne CBD ranked fourth for Education and Occupation among the other small areas.
Despite Melbourne CBD performing lower than most of the municipality’s small areas, several factors should be taken into consideration when assessing an area like the central business district such as car ownership, ownership of relatively small sized dwellings, high proportion of renters, low level of vehicle ownership and students not earning an income will tend to impact the scores downwards.

13 / 20
Melbourne Central Business District Small Area Demographic Profile
2.7. Housing
Figure 7: Melbourne CBD & remainder Housing Statistics
Housing metrics Melbourne CBD &
remainder City of Melbourne
Number of dwellings* 16,320 58,733
Most prominent housing type* Residential apartments
(69%) Residential apartments
(67%)
Occupied private dwellings fully owned or being purchased
24% 27%
Occupied private dwellings rented 50% 49%
Unoccupied private dwellings 12% 12%
Median rent per week $416 $400
Median mortgage per month $2000 $2167
*Note: data sourced from CLUE 2010. All other data sourced from ABS 2011 Census
There were 16,320 dwellings in Melbourne CBD, representing around 28% of the municipality’s overall dwellings. The most common dwelling type in Melbourne CBD was residential apartments, comprising 69% of all housing types.
Half (50%) of households in Melbourne CBD were rented, with only two small areas containing a higher proportion (Carlton, 62% and North Melbourne, 52%). Around one quarter (24%) of dwellings were either fully owned or being purchased, a slightly lower proportion compared to the municipality overall (27%).
The median weekly rental repayment of $416 was about mid-range relative to all the municipality’s small areas, and slightly more than the municipality average ($400). The median monthly mortgage payment of $2000 was relatively low, when compared with all small areas in the municipality. Melbourne CBD was equal with North Melbourne ($2000) and only higher than Carlton ($1900).

Melbourne Central Business District Small Area Demographic Profile
14 / 20
2.8. Land use and business activity
Figure 8: Land use and business activity profile
Land use and business metrics
Melbourne CBD & remainder City of Melbourne % Share
Business locations with employment
8893 15,959 56%
Most prominent built space Office Office –
Most prominent industry by floor Other Services Arts and Recreation
Services –
Most prominent industry by employment
Business Services Business Services –
Retail locations with employment
1597 2575 62%
Commercial car parks 94 181 52%
Commercial car park spaces 29,881 64,887 46%
Café/restaurant/bistro 1179 1951 60%
Food court 23 32 72%
Bar/tavern/pub/nightclub 168 252 67%
Office space (m2) 3,147,433 5,204,070 60%
Vacant floor space (m2) 719,072 3,092,962 23%
*Note: data in Figure 8 sourced from CLUE 2010
Melbourne CBD contained over half (56%) of the municipality’s business locations, with Business Services the most prominent industry type in terms of employment.
The most prominent built space was Offices, which accounted for around 30% of all built space in Melbourne CBD.
With the mixed land usage in a concentrated space like the central business district of the state of Victoria, it is not surprising that most proportional shares of the various business activities listed in Figure 8 tend to be higher than 50%. Notably, the municipality’s food courts (almost three quarters, or 72%) and bars/taverns/pubs/nightclubs (two thirds, or 67%) tend to be highly concentrated in Melbourne CBD, compared to the other small areas.
Melbourne CBD accounted for 60% of all of the municipality’s office space and 23% of the vacant floor space.

15 / 20
Melbourne Central Business District Small Area Demographic Profile
2.9. Workforce
Figure 9: Where Melbourne CBD residents work
Workplace location Melbourne CBD resident
Work in Melbourne CBD 4405
Work in City of Melbourne (outside Melbourne CBD) 1781
Work outside City of Melbourne 3281
Not stated 274
Total employed Melbourne CBD residents 9741
The most common workplace location for employed Melbourne CBD residents was within the Melbourne CBD small area (45%). One third (34%) worked outside the City of Melbourne, while the remaining 18% worked in the City of Melbourne, but outside Melbourne CBD.
Figure 10: Residential location of Melbourne CBD workers
Melbourne CBD workforce = 188,537
The vast majority of Melbourne CBD’s workers, some 89%, reside outside of Melbourne CBD, but within Greater Melbourne. A small proportion of 3% commute from outside Greater Melbourne to work in Melbourne CBD.
7% of Melbourne CBD’s workers lived within the City of Melbourne, made up of 2% who resided within Melbourne CBD and a further 5% who resided outside of Melbourne CBD but within the municipality.
2%
5%
89%
3%
Where Melbourne CBD workers reside
Melbourne CBD
City of Melbourne(outside Melbourne CBD)
Metro Melbourne(outside City of Melbourne)
Outside Greater Melbourne

Melbourne Central Business District Small Area Demographic Profile
16 / 20
Figure 11: Method of transport of workers to Melbourne CBD*
Method of transport Melbourne CBD City of Melbourne
Train 50% 39%
Car, as driver 21% 34%
Tram 12% 10%
Walked only 6% 5%
Bicycle 3% 4%
Car, as passenger 4% 4%
Bus 2% 2%
Motorbike/scooter 1% 1% #Other transport method combinations 1% 1%
Total 100% (169,829) 100% (320,473)
Public transport total (train, tram, bus) 65% 51%
Workers who travelled to work on Census day = 169,829 (City of Melbourne = 320,473) Workers who did not go to work, worked at home, not stated = 18,706 (City of Melbourne = 39,857)
# Other transport method combinations include: taxi, truck, ferry and other combinations, not accounted for in assumptions listed below.
Proportions include single methods of transport and combined methods of transport used by workers.
* When combinations of transport methods are used, the following assumptions have been applied: • Train plus another method or methods are counted as train journeys • Tram plus another method or methods not including train are counted as tram journeys • Bus plus another method or methods not including train nor tram are counted as bus journeys • Ferry plus another method or methods not including train, tram nor bus are counted as ferry journeys • Bicycle plus another method or methods not including any public transport options are counted as bicycle journeys • Car as driver plus another method or methods not including any public transport options nor a bicycle are counted as car as driver • Car as passenger plus another method or methods not including any public transport options, a bicycle nor a car as a driver are counted as car as passenger • Other plus another method or methods not including any public transport options, a bicycle nor car (either driver or passenger), are counted as other
Catching a train was the most common form of transport for Melbourne CBD workers (50%), with one in five catching a train (21%). A higher proportion caught a tram or walked compared to the municipality overall (12% vs. 10% and 6% vs. 5% respectively), while slightly fewer rode a bike (3% compared to 4%). Overall, around two thirds (65%) used some form of public transport to get to work in Melbourne CBD.

17 / 20
Melbourne Central Business District Small Area Demographic Profile
Figure 12: Key characteristics of workers in Melbourne CBD & remainder
Key metrics Melbourne CBD &
remainder City of Melbourne
Number of job positions* (CLUE 2010)
222,063 428,721
Number of workers 188,537 360,330
Professionals 39% 22%
Managers 16% 8%
Labourers 2% 2%
Full-time 77% 75%
Part-time 18% 20%
*Note: Number of job positions sourced from CLUE 2010
Workers located in Melbourne CBD contributed 52% of the municipality’s total workforce, with 188,500 people employed in the area covering around 222,000 job roles.
Three occupations combined accounted for more than three quarters (79%) of all occupations in Melbourne CBD: Professionals (39%), Clerical and Administrative Workers (25%) and Managers (16%). Three quarters (77%) of workers were employed in a full-time capacity.

Melbourne Central Business District Small Area Demographic Profile
18 / 20
2.10. Future outlook
2.10.1. Development activity
Figure 13: Development activity
Development activity
Under construction
Construction 0-2 years
Construction 3-5 years Mooted Total
Residential dwellings
Melbourne CBD & remainder
7303 5231 6486 30 19,050
City of Melbourne 13,451 11,726 13,031 16,329 54,537
Student apartments
Melbourne CBD & remainder
435 69 – – 504
City of Melbourne 435 555 20 – 1010
Office (m2)
Melbourne CBD & remainder
119,740 65,612 185,109 68,163 438,624
City of Melbourne 385,856 362,525 371,722 495,577 1,615,679
Retail (m2)
Melbourne CBD & remainder
19,579 4922 16,850 1880 43,230
City of Melbourne 38,476 30,786 33,489 55,041 157,792
Under Construction (the project was under construction at 27 May 2013). These projects will generally be occupied within the next year. Some larger projects may take longer before they are fully occupied.
Construction 0-2 years (the project is proposed to commence construction in the period 28 May 2013 – 27 May 2015). Projects reported as commencing construction in 0-2 years have usually received building approval and it is assumed that works will commence within two years.
Construction 3-5 years (the project is proposed to commence construction in the period 28 May 2015 – 27 May 2018). Projects reported as commencing construction in 3-5 years are usually in the process of obtaining planning approval, or approval has been granted subject to conditions that mean construction is unlikely to commence within two years.
Mooted. Projects reported as mooted are more speculative in nature. These sites are generally identified by developers as suitable for development, but planning proposals have not yet been lodged.

19 / 20
Melbourne Central Business District Small Area Demographic Profile
2.10.2. Population projections
Figure 14: Melbourne CBD & remainder population and household forecast
Melbourne CBD & remainder 2016 2021 2026 2031 2036
Residential population 35,159 39,756 43,996 47,903 52,324
Change in population (5 yrs) - 4597 4240 3907 4421
% change in population (5 yrs) - 13% 11% 9% 9%
Households 17,853 20,442 22,809 25,021 27,532
Change in households (5 yrs) - 2589 2367 2212 2511
Melbourne CBD & remainder’s share of municipality’s population
26% 26% 25% 25% 25%
Melbourne CBD & remainder’s share of municipality’s households
28% 28% 27% 27% 27%
City of Melbourne 2016 2021 2026 2031 2036
Residential population 133,388 151,826 172,617 192,040 211,962
Change in population (5 yrs) - 18,438 20,791 19,423 19,922
% change in population (5 yrs) - 14% 14% 11% 10%
Households 63,100 72,693 83,187 93,269 103,614
Change in households (5 yrs) - 9593 10,494 10,082 10,345
Note: data for Figure 14 sourced from id Small Area Population Forecasts 2011 to 2036, City of Melbourne
Melbourne CBD’s share of the overall municipality’s residential population is estimated to represent around one quarter (25%) in 2016 and into 2036, with the proportion of households slightly higher with 28% to 27%. By 2036 more than 52,000 residents living in more than 27,500 households are forecast to reside in Melbourne CBD.

Melbourne Central Business District Small Area Demographic Profile
20 / 20
Figure 15: Melbourne CBD & remainder population forecast, by age group
Note: data for Figure 15 sourced from id Small Area Population Forecasts 2011 to 2036, City of Melbourne
Melbourne CBD residents aged 20 to 34 years currently comprise around two thirds (65%) of the population. Figure 15 above suggests that this age group will remain the most populous in 2036, when it is forecast to account for just over half (53%) of the population.
0
2000
4000
6000
8000
10000
12000
14000
Resi
dent
s
Years of age
2011
2016
2026
2036