2012 davis-ramoth school report card · 2012-10-06 · davis-ramoth school school report card for...
TRANSCRIPT
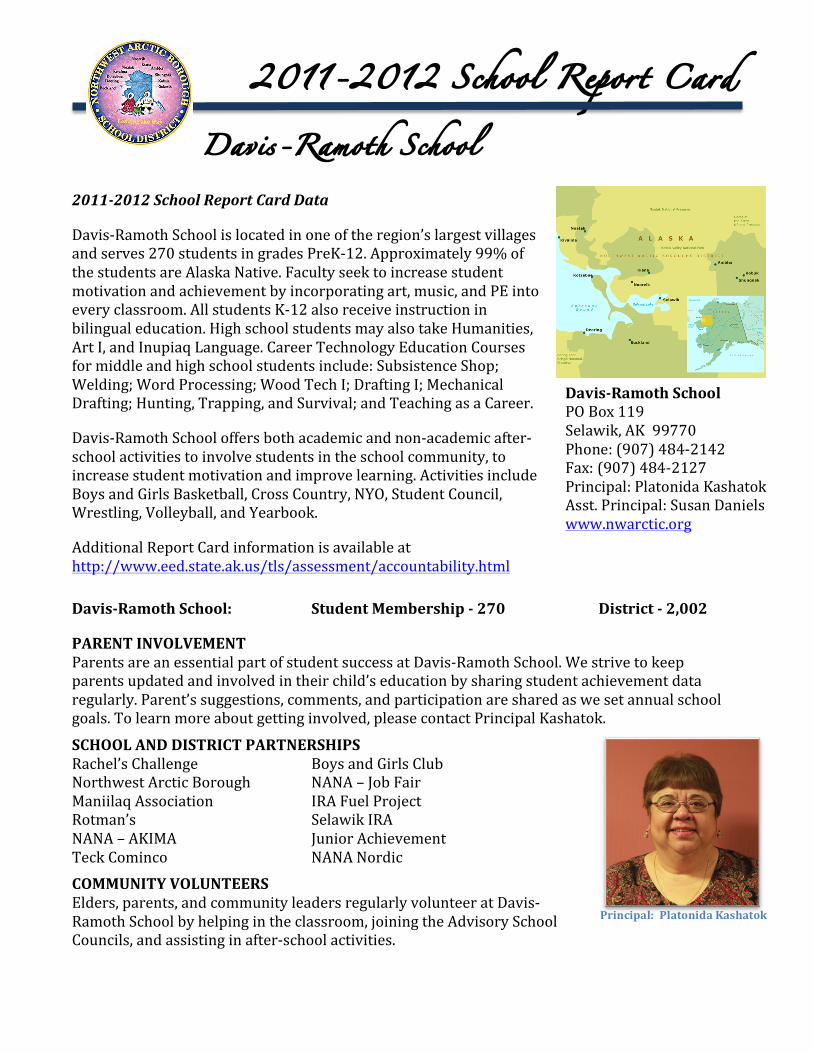
2011-2012 School Report Card
Davis-Ramoth School
2011$2012%School%Report%Card%Data
Davis&Ramoth,School,is,located,in,one,of,the,region’s,largest,villages,and,serves,270,students,in,grades,PreK&12.,Approximately,99%,of,the,students,are,Alaska,Native.,Faculty,seek,to,increase,student,motivation,and,achievement,by,incorporating,art,,music,,and,PE,into,every,classroom.,All,students,K&12,also,receive,instruction,in,bilingual,education.,High,school,students,may,also,take,Humanities,,Art,I,,and,Inupiaq,Language.,Career,Technology,Education,Courses,for,middle,and,high,school,students,include:,Subsistence,Shop;,Welding;,Word,Processing;,Wood,Tech,I;,Drafting,I;,Mechanical,Drafting;,Hunting,,Trapping,,and,Survival;,and,Teaching,as,a,Career.!Davis&Ramoth,School,offers,both,academic,and,non&academic,after&school,activities,to,involve,students,in,the,school,community,,to,increase,student,motivation,and,improve,learning.,Activities,include,Boys,and,Girls,Basketball,,Cross,Country,,NYO,,Student,Council,,Wrestling,,Volleyball,,and,Yearbook.,
Additional,Report,Card,information,is,available,at,http://www.eed.state.ak.us/tls/assessment/accountability.html,
Davis'Ramoth!School:! ! Student!Membership!'!270! ! District!'!2,002!
PARENT!INVOLVEMENT!Parents,are,an,essential,part,of,student,success,at,Davis&Ramoth,School.,We,strive,to,keep,parents,updated,and,involved,in,their,child’s,education,by,sharing,student,achievement,data,regularly.,Parent’s,suggestions,,comments,,and,participation,are,shared,as,we,set,annual,school,goals.,To,learn,more,about,getting,involved,,please,contact,Principal,Kashatok.,SCHOOL!AND!DISTRICT!PARTNERSHIPS!Rachel’s,Challenge, , , Boys,and,Girls,Club,Northwest,Arctic,Borough, , NANA,–,Job,Fair,Maniilaq,Association,, , IRA,Fuel,Project,Rotman’s, , , , Selawik,IRA,NANA,–,AKIMA, , , Junior,Achievement,Teck,Cominco,, , , NANA,Nordic,COMMUNITY!VOLUNTEERS!Elders,,parents,,and,community,leaders,regularly,volunteer,at,Davis&Ramoth,School,by,helping,in,the,classroom,,joining,the,Advisory,School,Councils,,and,assisting,in,after&school,activities.,,
Davis'Ramoth!School,PO,Box,119,Selawik,,AK,,99770,Phone:,(907),484&2142,Fax:,(907),484&2127,Principal:,Platonida,Kashatok,Asst.,Principal:,Susan,Daniels,www.nwarctic.org,,
Principal:!!Platonida!Kashatok!
Davis-Ramoth School School Report Card for 2011-2012 School Year
Form #05-12-029 School Report Card Template 2011-2012 Alaska Department of Education & Early Development Page 1
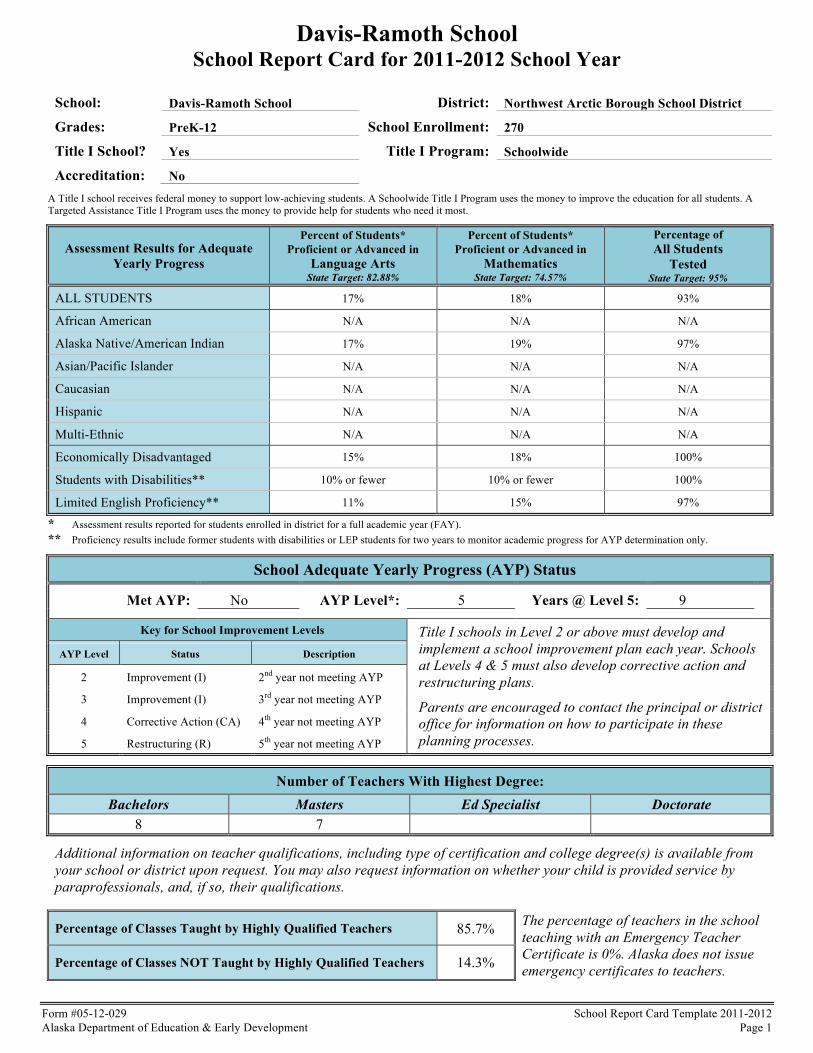
School: Davis-Ramoth School District: Northwest Arctic Borough School District
Grades: PreK-12 School Enrollment: 270
Title I School? Yes Title I Program: Schoolwide
Accreditation: No A Title I school receives federal money to support low-achieving students. A Schoolwide Title I Program uses the money to improve the education for all students. A Targeted Assistance Title I Program uses the money to provide help for students who need it most.
Assessment Results for Adequate Yearly Progress
Percent of Students* Proficient or Advanced in
Language Arts State Target: 82.88%
Percent of Students* Proficient or Advanced in
Mathematics State Target: 74.57%
Percentage of All Students
Tested State Target: 95%
ALL STUDENTS 17% 18% 93%
African American N/A N/A N/A
Alaska Native/American Indian 17% 19% 97%
Asian/Pacific Islander N/A N/A N/A
Caucasian N/A N/A N/A
Hispanic N/A N/A N/A
Multi-Ethnic N/A N/A N/A
Economically Disadvantaged 15% 18% 100%
Students with Disabilities** 10% or fewer 10% or fewer 100%
Limited English Proficiency** 11% 15% 97%
* Assessment results reported for students enrolled in district for a full academic year (FAY). ** Proficiency results include former students with disabilities or LEP students for two years to monitor academic progress for AYP determination only.
School Adequate Yearly Progress (AYP) Status
Met AYP: No AYP Level*: 5 Years @ Level 5: 9
Key for School Improvement Levels Title I schools in Level 2 or above must develop and implement a school improvement plan each year. Schools at Levels 4 & 5 must also develop corrective action and restructuring plans.
Parents are encouraged to contact the principal or district office for information on how to participate in these planning processes.
AYP Level Status Description
2 Improvement (I) 2nd year not meeting AYP
3 Improvement (I) 3rd year not meeting AYP
4 Corrective Action (CA) 4th year not meeting AYP
5 Restructuring (R) 5th year not meeting AYP
Number of Teachers With Highest Degree: Bachelors Masters Ed Specialist Doctorate
8 7
Additional information on teacher qualifications, including type of certification and college degree(s) is available from your school or district upon request. You may also request information on whether your child is provided service by paraprofessionals, and, if so, their qualifications.
Percentage of Classes Taught by Highly Qualified Teachers 85.7% The percentage of teachers in the school teaching with an Emergency Teacher Certificate is 0%. Alaska does not issue emergency certificates to teachers. Percentage of Classes NOT Taught by Highly Qualified Teachers 14.3%
Davis-Ramoth School School Report Card for 2011-2012 School Year
Form #05-12-029 School Report Card Template 2011-2012 Alaska Department of Education & Early Development Page 2
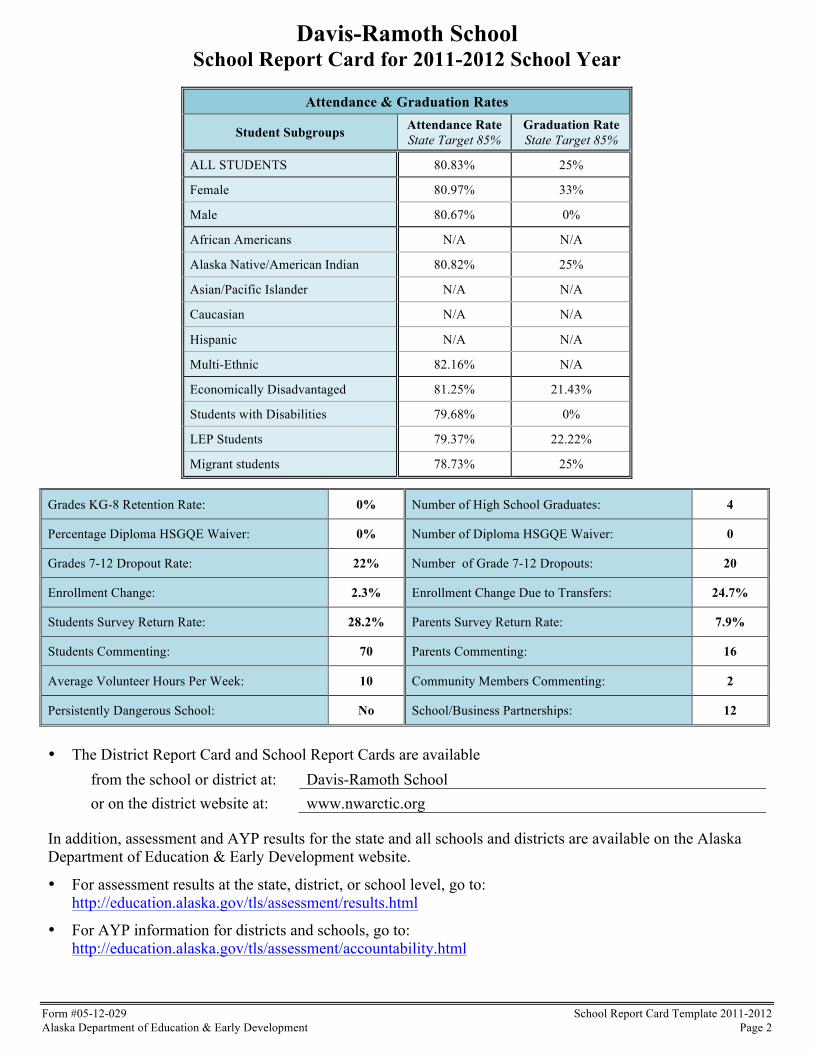
Attendance & Graduation Rates
Student Subgroups Attendance Rate State Target 85%
Graduation Rate State Target 85%
ALL STUDENTS 80.83% 25%
Female 80.97% 33%
Male 80.67% 0%
African Americans N/A N/A
Alaska Native/American Indian 80.82% 25%
Asian/Pacific Islander N/A N/A
Caucasian N/A N/A
Hispanic N/A N/A
Multi-Ethnic 82.16% N/A
Economically Disadvantaged 81.25% 21.43%
Students with Disabilities 79.68% 0%
LEP Students 79.37% 22.22%
Migrant students 78.73% 25%
Grades KG-8 Retention Rate: 0% Number of High School Graduates: 4
Percentage Diploma HSGQE Waiver: 0% Number of Diploma HSGQE Waiver: 0
Grades 7-12 Dropout Rate: 22% Number of Grade 7-12 Dropouts: 20
Enrollment Change: 2.3% Enrollment Change Due to Transfers: 24.7%
Students Survey Return Rate: 28.2% Parents Survey Return Rate: 7.9%
Students Commenting: 70 Parents Commenting: 16
Average Volunteer Hours Per Week: 10 Community Members Commenting: 2
Persistently Dangerous School: No School/Business Partnerships: 12
• The District Report Card and School Report Cards are available from the school or district at: Davis-Ramoth School or on the district website at: www.nwarctic.org
In addition, assessment and AYP results for the state and all schools and districts are available on the Alaska Department of Education & Early Development website.
• For assessment results at the state, district, or school level, go to: http://education.alaska.gov/tls/assessment/results.html
• For AYP information for districts and schools, go to: http://education.alaska.gov/tls/assessment/accountability.html
Davis-Ramoth School School Report Card for 2011-2012 School Year
Form #05-12-029 School Report Card Template 2011-2012 Alaska Department of Education & Early Development Page 3
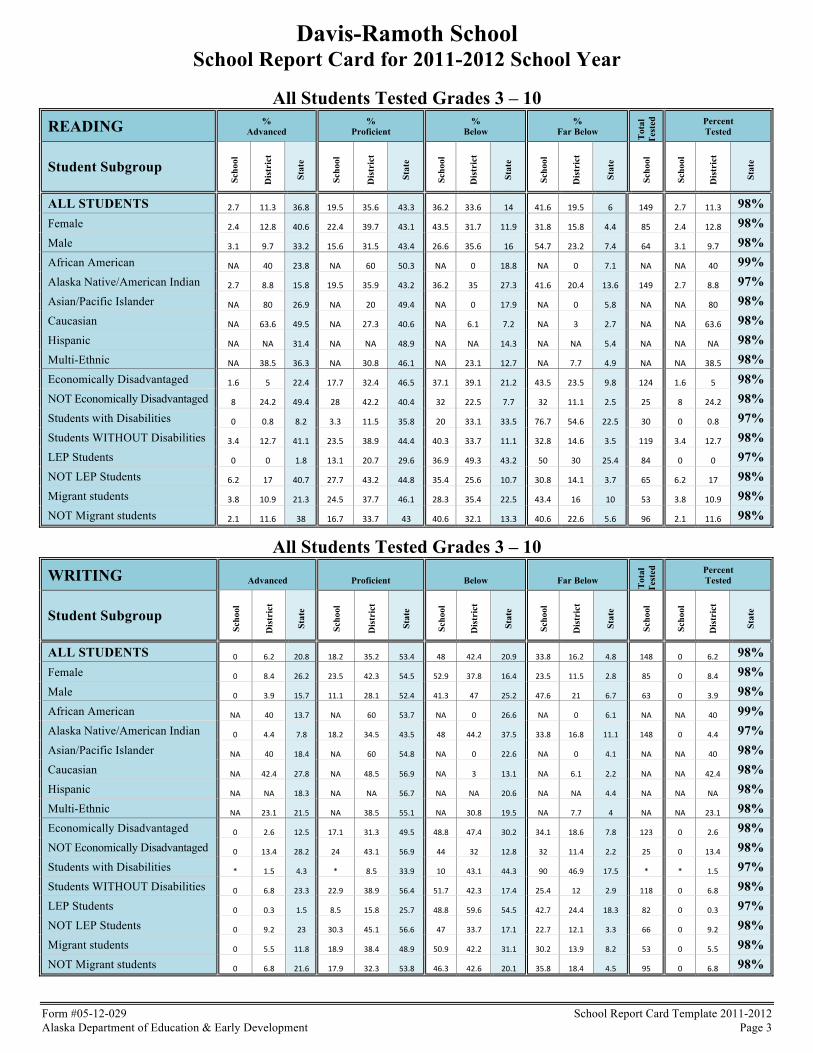
All Students Tested Grades 3 – 10 READING %
Advanced %
Proficient %
Below %
Far Below Tot
al
Tes
ted Percent
Tested
Student Subgroup
Scho
ol
Dis
tric
t
Stat
e
Scho
ol
Dis
tric
t
Stat
e
Scho
ol
Dis
tric
t
Stat
e
Scho
ol
Dis
tric
t
Stat
e
Scho
ol
Scho
ol
Dis
tric
t
Stat
e
ALL STUDENTS 2.7$ 11.3$ 36.8$ 19.5$ 35.6$ 43.3$ 36.2$ 33.6$ 14$ 41.6$ 19.5$ 6$ 149$ 2.7$ 11.3$ 98% Female 2.4$ 12.8$ 40.6$ 22.4$ 39.7$ 43.1$ 43.5$ 31.7$ 11.9$ 31.8$ 15.8$ 4.4$ 85$ 2.4$ 12.8$ 98% Male 3.1$ 9.7$ 33.2$ 15.6$ 31.5$ 43.4$ 26.6$ 35.6$ 16$ 54.7$ 23.2$ 7.4$ 64$ 3.1$ 9.7$ 98% African American NA$ 40$ 23.8$ NA$ 60$ 50.3$ NA$ 0$ 18.8$ NA$ 0$ 7.1$ NA$ NA$ 40$ 99% Alaska Native/American Indian 2.7$ 8.8$ 15.8$ 19.5$ 35.9$ 43.2$ 36.2$ 35$ 27.3$ 41.6$ 20.4$ 13.6$ 149$ 2.7$ 8.8$ 97% Asian/Pacific Islander NA$ 80$ 26.9$ NA$ 20$ 49.4$ NA$ 0$ 17.9$ NA$ 0$ 5.8$ NA$ NA$ 80$ 98% Caucasian NA$ 63.6$ 49.5$ NA$ 27.3$ 40.6$ NA$ 6.1$ 7.2$ NA$ 3$ 2.7$ NA$ NA$ 63.6$ 98% Hispanic NA$ NA$ 31.4$ NA$ NA$ 48.9$ NA$ NA$ 14.3$ NA$ NA$ 5.4$ NA$ NA$ NA$ 98% Multi-Ethnic NA$ 38.5$ 36.3$ NA$ 30.8$ 46.1$ NA$ 23.1$ 12.7$ NA$ 7.7$ 4.9$ NA$ NA$ 38.5$ 98% Economically Disadvantaged 1.6$ 5$ 22.4$ 17.7$ 32.4$ 46.5$ 37.1$ 39.1$ 21.2$ 43.5$ 23.5$ 9.8$ 124$ 1.6$ 5$ 98% NOT Economically Disadvantaged 8$ 24.2$ 49.4$ 28$ 42.2$ 40.4$ 32$ 22.5$ 7.7$ 32$ 11.1$ 2.5$ 25$ 8$ 24.2$ 98% Students with Disabilities 0$ 0.8$ 8.2$ 3.3$ 11.5$ 35.8$ 20$ 33.1$ 33.5$ 76.7$ 54.6$ 22.5$ 30$ 0$ 0.8$ 97% Students WITHOUT Disabilities 3.4$ 12.7$ 41.1$ 23.5$ 38.9$ 44.4$ 40.3$ 33.7$ 11.1$ 32.8$ 14.6$ 3.5$ 119$ 3.4$ 12.7$ 98% LEP Students 0$ 0$ 1.8$ 13.1$ 20.7$ 29.6$ 36.9$ 49.3$ 43.2$ 50$ 30$ 25.4$ 84$ 0$ 0$ 97% NOT LEP Students 6.2$ 17$ 40.7$ 27.7$ 43.2$ 44.8$ 35.4$ 25.6$ 10.7$ 30.8$ 14.1$ 3.7$ 65$ 6.2$ 17$ 98% Migrant students 3.8$ 10.9$ 21.3$ 24.5$ 37.7$ 46.1$ 28.3$ 35.4$ 22.5$ 43.4$ 16$ 10$ 53$ 3.8$ 10.9$ 98% NOT Migrant students 2.1$ 11.6$ 38$ 16.7$ 33.7$ 43$ 40.6$ 32.1$ 13.3$ 40.6$ 22.6$ 5.6$ 96$ 2.1$ 11.6$ 98%
All Students Tested Grades 3 – 10 WRITING
Advanced
Proficient
Below
Far Below Tot
al
Tes
ted Percent
Tested
Student Subgroup
Scho
ol
Dis
tric
t
Stat
e
Scho
ol
Dis
tric
t
Stat
e
Scho
ol
Dis
tric
t
Stat
e
Scho
ol
Dis
tric
t
Stat
e
Scho
ol
Scho
ol
Dis
tric
t
Stat
e
ALL STUDENTS 0$ 6.2$ 20.8$ 18.2$ 35.2$ 53.4$ 48$ 42.4$ 20.9$ 33.8$ 16.2$ 4.8$ 148$ 0$ 6.2$ 98% Female 0$ 8.4$ 26.2$ 23.5$ 42.3$ 54.5$ 52.9$ 37.8$ 16.4$ 23.5$ 11.5$ 2.8$ 85$ 0$ 8.4$ 98% Male 0$ 3.9$ 15.7$ 11.1$ 28.1$ 52.4$ 41.3$ 47$ 25.2$ 47.6$ 21$ 6.7$ 63$ 0$ 3.9$ 98% African American NA$ 40$ 13.7$ NA$ 60$ 53.7$ NA$ 0$ 26.6$ NA$ 0$ 6.1$ NA$ NA$ 40$ 99% Alaska Native/American Indian 0$ 4.4$ 7.8$ 18.2$ 34.5$ 43.5$ 48$ 44.2$ 37.5$ 33.8$ 16.8$ 11.1$ 148$ 0$ 4.4$ 97% Asian/Pacific Islander NA$ 40$ 18.4$ NA$ 60$ 54.8$ NA$ 0$ 22.6$ NA$ 0$ 4.1$ NA$ NA$ 40$ 98% Caucasian NA$ 42.4$ 27.8$ NA$ 48.5$ 56.9$ NA$ 3$ 13.1$ NA$ 6.1$ 2.2$ NA$ NA$ 42.4$ 98% Hispanic NA$ NA$ 18.3$ NA$ NA$ 56.7$ NA$ NA$ 20.6$ NA$ NA$ 4.4$ NA$ NA$ NA$ 98% Multi-Ethnic NA$ 23.1$ 21.5$ NA$ 38.5$ 55.1$ NA$ 30.8$ 19.5$ NA$ 7.7$ 4$ NA$ NA$ 23.1$ 98% Economically Disadvantaged 0$ 2.6$ 12.5$ 17.1$ 31.3$ 49.5$ 48.8$ 47.4$ 30.2$ 34.1$ 18.6$ 7.8$ 123$ 0$ 2.6$ 98% NOT Economically Disadvantaged 0$ 13.4$ 28.2$ 24$ 43.1$ 56.9$ 44$ 32$ 12.8$ 32$ 11.4$ 2.2$ 25$ 0$ 13.4$ 98% Students with Disabilities *$ 1.5$ 4.3$ *$ 8.5$ 33.9$ 10$ 43.1$ 44.3$ 90$ 46.9$ 17.5$ *$ *$ 1.5$ 97% Students WITHOUT Disabilities 0$ 6.8$ 23.3$ 22.9$ 38.9$ 56.4$ 51.7$ 42.3$ 17.4$ 25.4$ 12$ 2.9$ 118$ 0$ 6.8$ 98% LEP Students 0$ 0.3$ 1.5$ 8.5$ 15.8$ 25.7$ 48.8$ 59.6$ 54.5$ 42.7$ 24.4$ 18.3$ 82$ 0$ 0.3$ 97% NOT LEP Students 0$ 9.2$ 23$ 30.3$ 45.1$ 56.6$ 47$ 33.7$ 17.1$ 22.7$ 12.1$ 3.3$ 66$ 0$ 9.2$ 98% Migrant students 0$ 5.5$ 11.8$ 18.9$ 38.4$ 48.9$ 50.9$ 42.2$ 31.1$ 30.2$ 13.9$ 8.2$ 53$ 0$ 5.5$ 98% NOT Migrant students 0$ 6.8$ 21.6$ 17.9$ 32.3$ 53.8$ 46.3$ 42.6$ 20.1$ 35.8$ 18.4$ 4.5$ 95$ 0$ 6.8$ 98%

Davis-Ramoth School School Report Card for 2011-2012 School Year
Form #05-12-029 School Report Card Template 2011-2012 Alaska Department of Education & Early Development Page 4
All Students Tested Grades 3 – 10 MATHEMATICS
Advanced
Proficient
Below
Far Below Tot
al
Tes
ted Percent
Tested
Student Subgroup
Scho
ol
Dis
tric
t
Stat
e
Scho
ol
Dis
tric
t
Stat
e
Scho
ol
Dis
tric
t
Stat
e
Scho
ol
Dis
tric
t
Stat
e
Scho
ol
Scho
ol
Dis
tric
t
Stat
e
ALL STUDENTS 2$ 13.1$ 32.8$ 16.2$ 29.2$ 35.8$ 18.9$ 21.3$ 16.2$ 62.8$ 36.4$ 15.2$ 148$ 2$ 13.1$ 98% Female 1.2$ 14.4$ 33$ 16.7$ 32.6$ 36.8$ 27.4$ 21.6$ 16.2$ 54.8$ 31.3$ 14.1$ 84$ 1.2$ 14.4$ 98% Male 3.1$ 11.8$ 32.5$ 15.6$ 25.8$ 34.9$ 7.8$ 21$ 16.3$ 73.4$ 41.4$ 16.3$ 64$ 3.1$ 11.8$ 98% African American NA$ 40$ 19.1$ NA$ 60$ 35.3$ NA$ 0$ 22.4$ NA$ 0$ 23.3$ NA$ NA$ 40$ 99% Alaska Native/American Indian 2$ 10.9$ 15.9$ 16.2$ 29.1$ 32.7$ 18.9$ 22$ 22.2$ 62.8$ 38.1$ 29.2$ 148$ 2$ 10.9$ 97% Asian/Pacific Islander NA$ 60$ 31.3$ NA$ 40$ 36.6$ NA$ 0$ 17.2$ NA$ 0$ 14.9$ NA$ NA$ 60$ 99% Caucasian NA$ 63.6$ 42.2$ NA$ 18.2$ 36.5$ NA$ 9.1$ 12.8$ NA$ 9.1$ 8.5$ NA$ NA$ 63.6$ 98% Hispanic NA$ NA$ 26.8$ NA$ NA$ 39.5$ NA$ NA$ 17.2$ NA$ NA$ 16.5$ NA$ NA$ NA$ 98% Multi-Ethnic NA$ 30.8$ 33.3$ NA$ 53.8$ 36.9$ NA$ 15.4$ 16.3$ NA$ 0$ 13.4$ NA$ NA$ 30.8$ 98% Economically Disadvantaged 0.8$ 6.5$ 21.1$ 16.3$ 28$ 35.3$ 19.5$ 23.8$ 20.5$ 63.4$ 41.6$ 23.1$ 123$ 0.8$ 6.5$ 98% NOT Economically Disadvantaged 8$ 26.6$ 43.1$ 16$ 31.8$ 36.3$ 16$ 16$ 12.5$ 60$ 25.5$ 8.2$ 25$ 8$ 26.6$ 98% Students with Disabilities *$ 3.1$ 8.2$ *$ 10.1$ 24$ 10$ 19.4$ 24.1$ 90$ 67.4$ 43.6$ *$ *$ 3.1$ 97% Students WITHOUT Disabilities 2.5$ 14.5$ 36.5$ 20.3$ 31.9$ 37.6$ 22.9$ 21.5$ 15$ 54.2$ 32.1$ 10.9$ 118$ 2.5$ 14.5$ 98% LEP Students 0$ 0.8$ 4.2$ 9.6$ 15.9$ 22.5$ 18.1$ 27.3$ 25.8$ 72.3$ 56$ 47.5$ 83$ 0$ 0.8$ 97% NOT LEP Students 4.6$ 19.4$ 36$ 24.6$ 36$ 37.3$ 20$ 18.2$ 15.1$ 50.8$ 26.4$ 11.5$ 65$ 4.6$ 19.4$ 98% Migrant students 5.6$ 14.1$ 22.2$ 14.8$ 30.6$ 35$ 13$ 21.6$ 20.1$ 66.7$ 33.7$ 22.7$ 54$ 5.6$ 14.1$ 98% NOT Migrant students 0$ 12.2$ 33.6$ 17$ 28$ 35.9$ 22.3$ 21$ 15.9$ 60.6$ 38.8$ 14.6$ 94$ 0$ 12.2$ 98%
All Students Tested Grades 4, 8, & 10 SCIENCE
Advanced
Proficient
Below
Far Below Tot
al
Tes
ted Percent
Tested
Student Subgroup
Scho
ol
Dis
tric
t
Stat
e
Scho
ol
Dis
tric
t
Stat
e
Scho
ol
Dis
tric
t
Stat
e
Scho
ol
Dis
tric
t
Stat
e
Scho
ol
Scho
ol
Dis
tric
t
Stat
e
ALL STUDENTS 0$ 4$ 22.5$ 5.9$ 16.5$ 33.7$ 3.9$ 25.3$ 25.3$ 90.2$ 54.1$ 18.5$ 51$ 0$ 4$ 95% Female *$ 2.6$ 19.8$ *$ 13$ 35.1$ 10$ 25.5$ 26.9$ 90$ 58.9$ 18.2$ *$ *$ 2.6$ 95% Male 0$ 5.5$ 25.1$ 13$ 20.2$ 32.4$ 4.3$ 25.1$ 23.7$ 82.6$ 49.2$ 18.8$ 23$ 0$ 5.5$ 95% African American NA$ 0$ 8.5$ NA$ 100$ 29.3$ NA$ 0$ 34.8$ NA$ 0$ 27.5$ NA$ NA$ 0$ 96% Alaska Native/American Indian 0$ 2.2$ 8.1$ 5.9$ 15.4$ 24$ 3.9$ 25.8$ 30.7$ 90.2$ 56.6$ 37.2$ 51$ 0$ 2.2$ 94% Asian/Pacific Islander NA$ 66.7$ 14.8$ NA$ 0$ 29.1$ NA$ 33.3$ 31.7$ NA$ 0$ 24.3$ NA$ NA$ 66.7$ 97% Caucasian NA$ 50$ 32.2$ NA$ 37.5$ 38.6$ NA$ 12.5$ 20.3$ NA$ 0$ 8.8$ NA$ NA$ 50$ 95% Hispanic NA$ NA$ 16.6$ NA$ NA$ 33.7$ NA$ NA$ 29.3$ NA$ NA$ 20.4$ NA$ NA$ NA$ 95% Multi-Ethnic NA$ 20$ 21.2$ NA$ 40$ 36.8$ NA$ 20$ 27$ NA$ 20$ 15$ NA$ NA$ 20$ 96% Economically Disadvantaged 0$ 2.1$ 11.5$ 4.7$ 9.9$ 28.1$ 4.7$ 21.9$ 31$ 90.7$ 66.1$ 29.4$ 43$ 0$ 2.1$ 95% NOT Economically Disadvantaged *$ 7.5$ 31.8$ 25$ 28.6$ 38.4$ *$ 31.6$ 20.5$ 75$ 32.3$ 9.3$ *$ *$ 7.5$ 95% Students with Disabilities *$ 0$ 5.4$ *$ 2.5$ 17.2$ 25$ 10$ 29.6$ 75$ 87.5$ 47.9$ *$ *$ 0$ 94% Students WITHOUT Disabilities 0$ 4.5$ 25$ 7.7$ 18.2$ 36.1$ 5.1$ 27.2$ 24.7$ 87.2$ 50.1$ 14.2$ 39$ 0$ 4.5$ 95% LEP Students 0$ 0$ 0.7$ 5.1$ 3.1$ 6.2$ 2.6$ 16.3$ 29.1$ 92.3$ 80.6$ 64.1$ 39$ 0$ 0$ 95% NOT LEP Students 0$ 6.1$ 25$ 8.3$ 23.6$ 36.8$ 8.3$ 30.1$ 24.9$ 83.3$ 40.2$ 13.4$ 12$ 0$ 6.1$ 95% Migrant students 0$ 2.7$ 11.4$ 10$ 17.6$ 27.8$ 0$ 26.1$ 30.3$ 90$ 53.7$ 30.5$ 20$ 0$ 2.7$ 96% NOT Migrant students 0$ 5.3$ 23.4$ 3.2$ 15.5$ 34.2$ 6.5$ 24.6$ 24.9$ 90.3$ 54.5$ 17.5$ 31$ 0$ 5.3$ 95%
Davis-Ramoth School School Report Card for 2011-2012 School Year
Form #05-12-029 School Report Card Template 2011-2012 Alaska Department of Education & Early Development Page 5
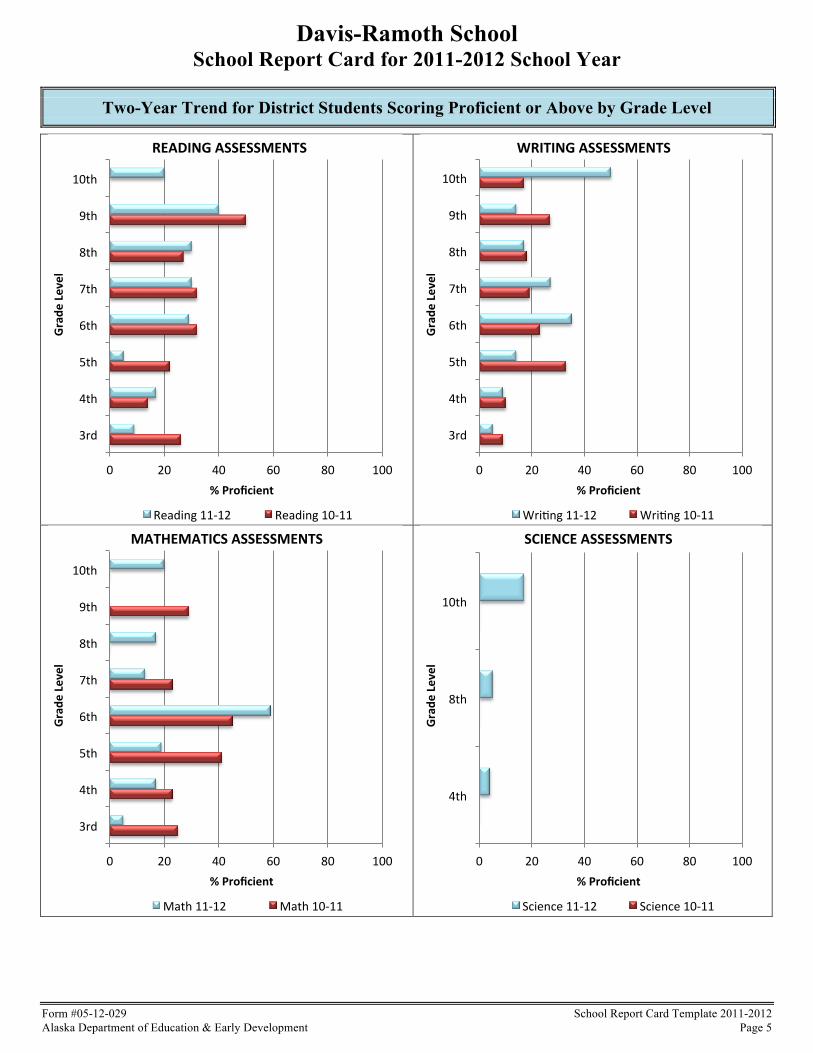
Two-Year Trend for District Students Scoring Proficient or Above by Grade Level
0$ 20$ 40$ 60$ 80$ 100$
3rd$
4th$
5th$
6th$
7th$
8th$
9th$
10th$
%"Proficient"
Grad
e"Level"
READING"ASSESSMENTS"
Reading$11:12$ Reading$10:11$
0$ 20$ 40$ 60$ 80$ 100$
3rd$
4th$
5th$
6th$
7th$
8th$
9th$
10th$
%"Proficient"
Grad
e"Level"
WRITING"ASSESSMENTS"
Wri<ng$11:12$ Wri<ng$10:11$
0$ 20$ 40$ 60$ 80$ 100$
3rd$
4th$
5th$
6th$
7th$
8th$
9th$
10th$
%"Proficient"
Grad
e"Level"
MATHEMATICS"ASSESSMENTS"
Math$11:12$ Math$10:11$
0$ 20$ 40$ 60$ 80$ 100$
4th$
8th$
10th$
%"Proficient"
Grad
e"Level"
SCIENCE"ASSESSMENTS"
Science$11:12$ Science$10:11$
Davis-Ramoth School School Report Card for 2011-2012 School Year
Form #05-12-029 School Report Card Template 2011-2012 Alaska Department of Education & Early Development Page 6
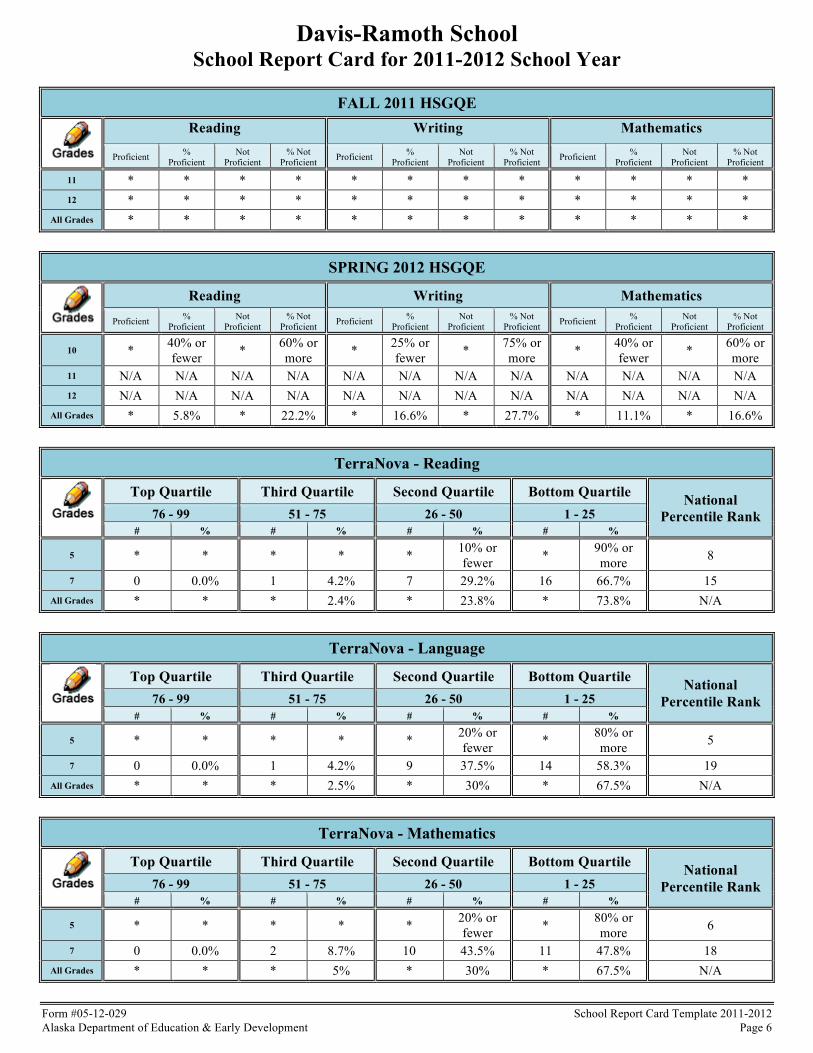
FALL 2011 HSGQE
Reading Writing Mathematics
Proficient % Proficient
Not Proficient
% Not Proficient Proficient %
Proficient Not
Proficient % Not
Proficient Proficient % Proficient
Not Proficient
% Not Proficient
11 * * * * * * * * * * * * 12 * * * * * * * * * * * *
All Grades * * * * * * * * * * * *
SPRING 2012 HSGQE
Reading Writing Mathematics
Proficient % Proficient
Not Proficient
% Not Proficient Proficient %
Proficient Not
Proficient % Not
Proficient Proficient % Proficient
Not Proficient
% Not Proficient
10 * 40% or fewer * 60% or
more * 25% or fewer * 75% or
more * 40% or fewer * 60% or
more 11 N/A N/A N/A N/A N/A N/A N/A N/A N/A N/A N/A N/A 12 N/A N/A N/A N/A N/A N/A N/A N/A N/A N/A N/A N/A
All Grades * 5.8% * 22.2% * 16.6% * 27.7% * 11.1% * 16.6%
TerraNova - Reading
Top Quartile Third Quartile Second Quartile Bottom Quartile National
Percentile Rank 76 - 99 51 - 75 26 - 50 1 - 25 # % # % # % # %
5 * * * * * 10% or fewer * 90% or
more 8
7 0 0.0% 1 4.2% 7 29.2% 16 66.7% 15 All Grades * * * 2.4% * 23.8% * 73.8% N/A
TerraNova - Language
Top Quartile Third Quartile Second Quartile Bottom Quartile National
Percentile Rank 76 - 99 51 - 75 26 - 50 1 - 25 # % # % # % # %
5 * * * * * 20% or fewer * 80% or
more 5
7 0 0.0% 1 4.2% 9 37.5% 14 58.3% 19 All Grades * * * 2.5% * 30% * 67.5% N/A
TerraNova - Mathematics
Top Quartile Third Quartile Second Quartile Bottom Quartile National
Percentile Rank 76 - 99 51 - 75 26 - 50 1 - 25 # % # % # % # %
5 * * * * * 20% or fewer * 80% or
more 6
7 0 0.0% 2 8.7% 10 43.5% 11 47.8% 18 All Grades * * * 5% * 30% * 67.5% N/A