©2010 ram management group, inc. sales & operations planning principals & practices rich...
TRANSCRIPT
©2010 RAM Management Group, Inc.
Sales & Operations Planning Principals & Practices
Rich Mihelich, C.P.M., CFPIM, CIRMRich Mihelich, C.P.M., CFPIM, CIRM
©2010 RAM Management Group, Inc.
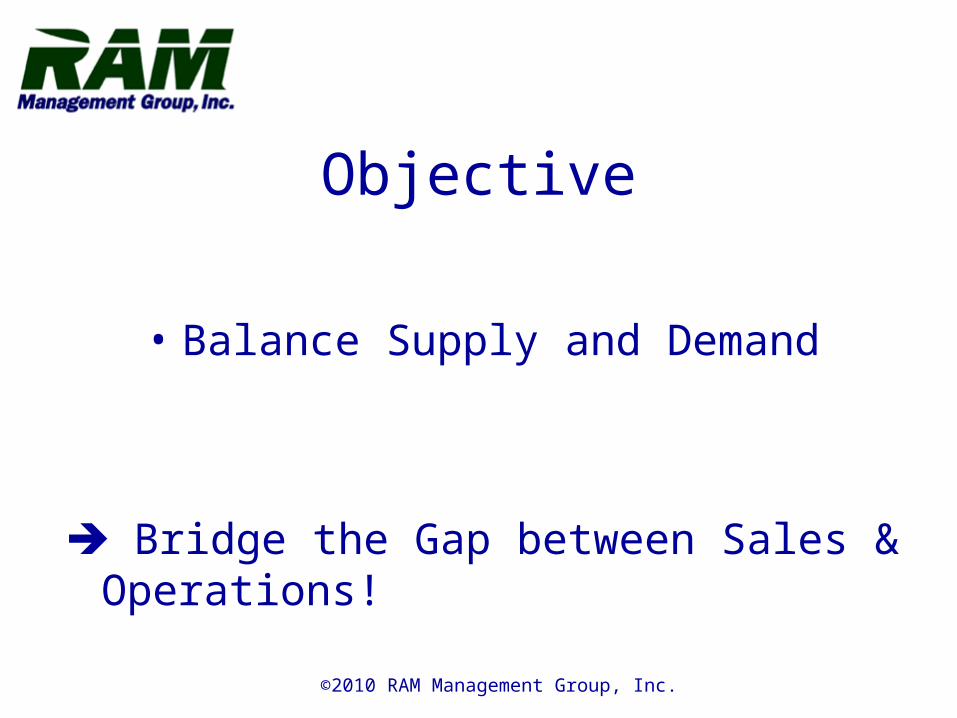
Objective
• Balance Supply and Demand
Bridge the Gap between Sales & Operations!
©2010 RAM Management Group, Inc.
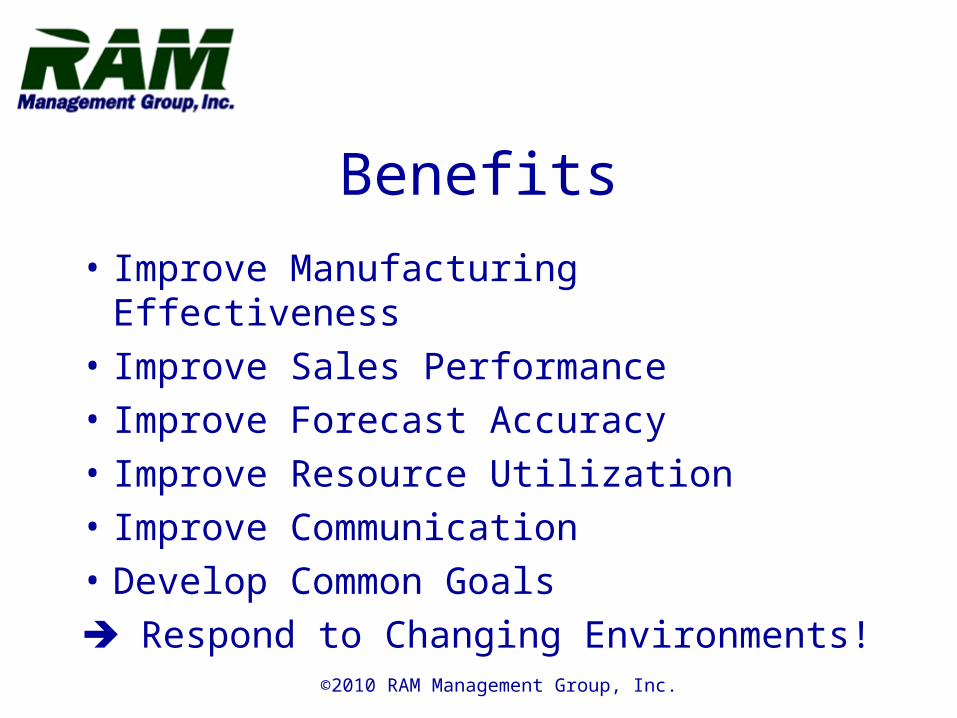
Benefits
• Improve Manufacturing Effectiveness
• Improve Sales Performance
• Improve Forecast Accuracy
• Improve Resource Utilization
• Improve Communication
• Develop Common Goals
Respond to Changing Environments!
©2010 RAM Management Group, Inc.
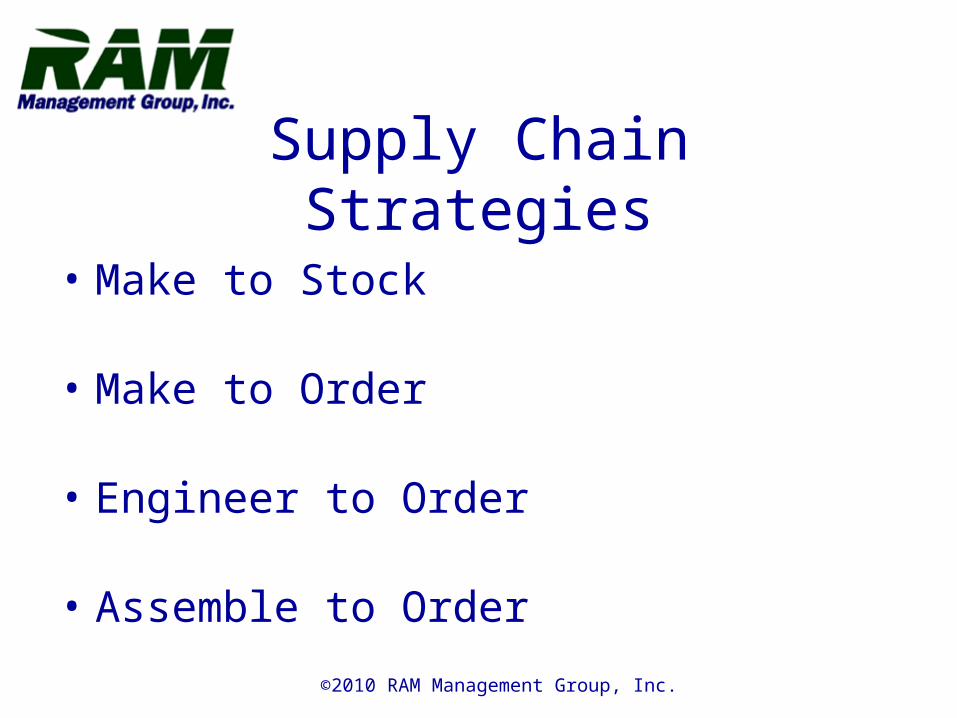
• Make to Stock
• Make to Order
• Engineer to Order
• Assemble to Order
Supply Chain Strategies

©2010 RAM Management Group, Inc.
BUSINESS PLANNING
SALES PLANNING
PRODUCTION PLANNING
MASTER PLANNING
MATERIALS PLANNING
CAPACITY PLANNING
PROD. ACTIVITY CONTROL
PURCHASING
PERFORMANCE MEASURES
TopManagementPlanning
OperationManagementPlanning
OperationsManagementExecution
Bills ofMaterial
Inventory
Routings
ResourcesOK?
PlanningOK?
no
yes
no
yes
Objectives
Demands
Resources
Hours
Parts
Accountability
©2010 RAM Management Group, Inc.
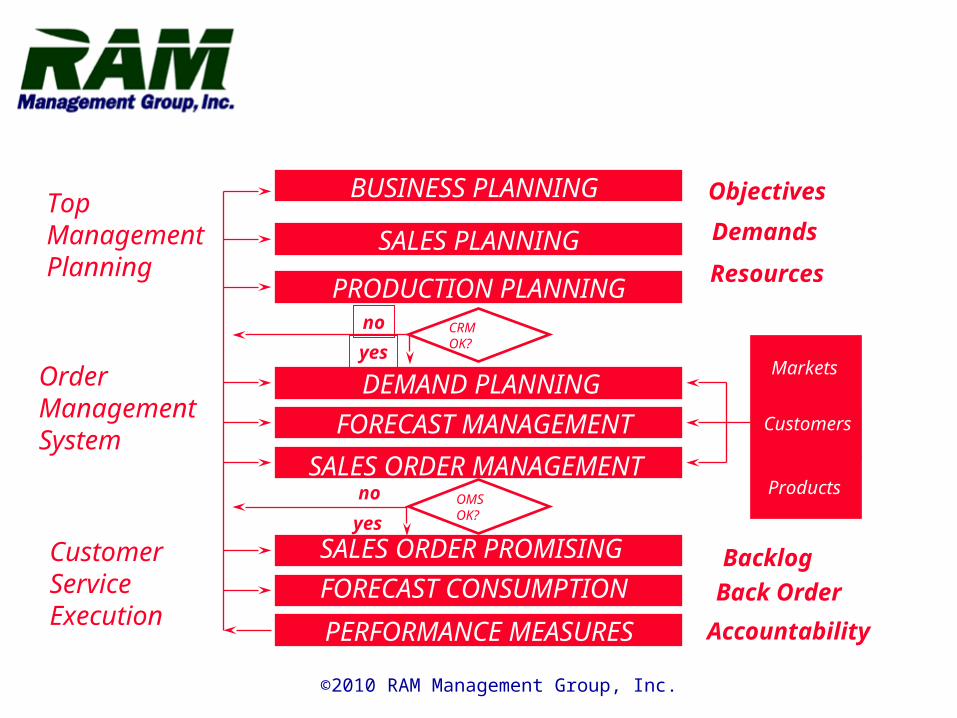
BUSINESS PLANNING
SALES PLANNING
PRODUCTION PLANNING
DEMAND PLANNING
FORECAST MANAGEMENT
SALES ORDER MANAGEMENT
SALES ORDER PROMISING
FORECAST CONSUMPTION
PERFORMANCE MEASURES
TopManagementPlanning
OrderManagementSystem
CustomerServiceExecution
Markets
Customers
Products
CRMOK?
OMSOK?
no
yes
no
yes
Objectives
Demands
Resources
Backlog
Back Order
Accountability
©2010 RAM Management Group, Inc.
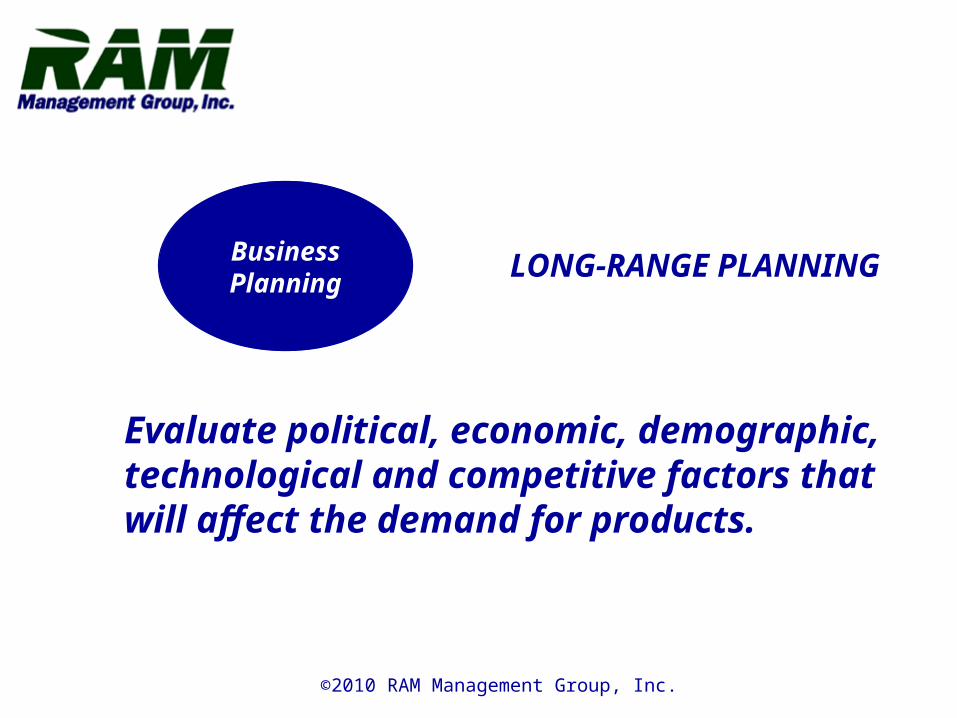
BusinessPlanning
Evaluate political, economic, demographic,technological and competitive factors that will affect the demand for products.
LONG-RANGE PLANNING
©2010 RAM Management Group, Inc.
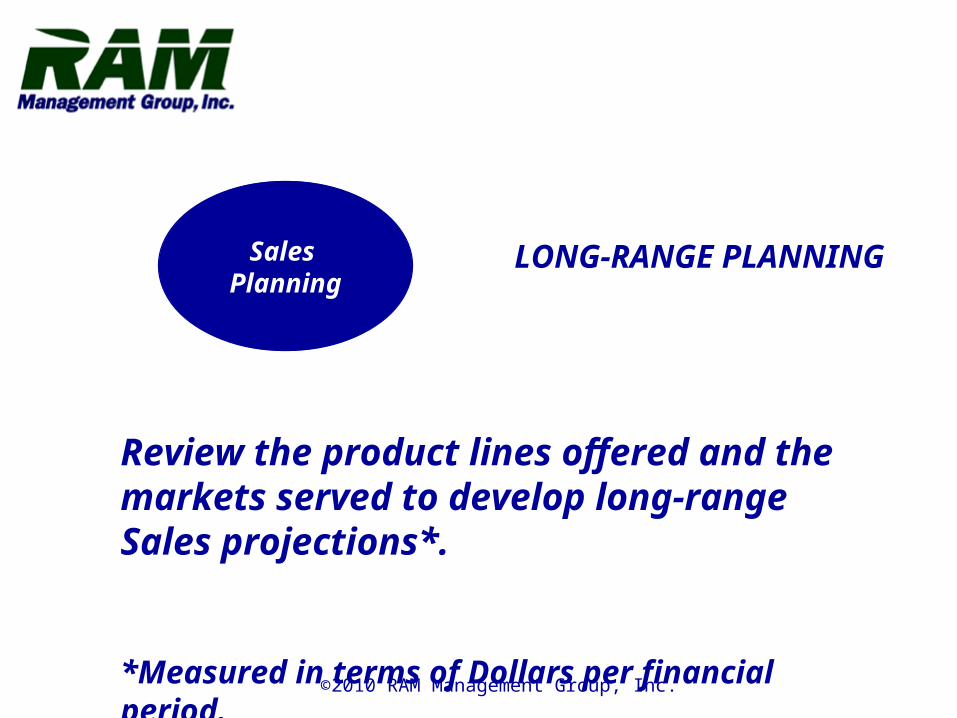
Sales Planning
Review the product lines offered and the markets served to develop long-range Sales projections*.
*Measured in terms of Dollars per financial period.
LONG-RANGE PLANNING

©2010 RAM Management Group, Inc.
Sales Plan
$-
$200,000
$400,000
$600,000
$800,000
$1,000,000
$1,200,000
$1,400,000
$1,600,000
$1,800,000
Jan-99
Mar-99
May-99
Jul-99
Sep-99
Nov-99
©2010 RAM Management Group, Inc.
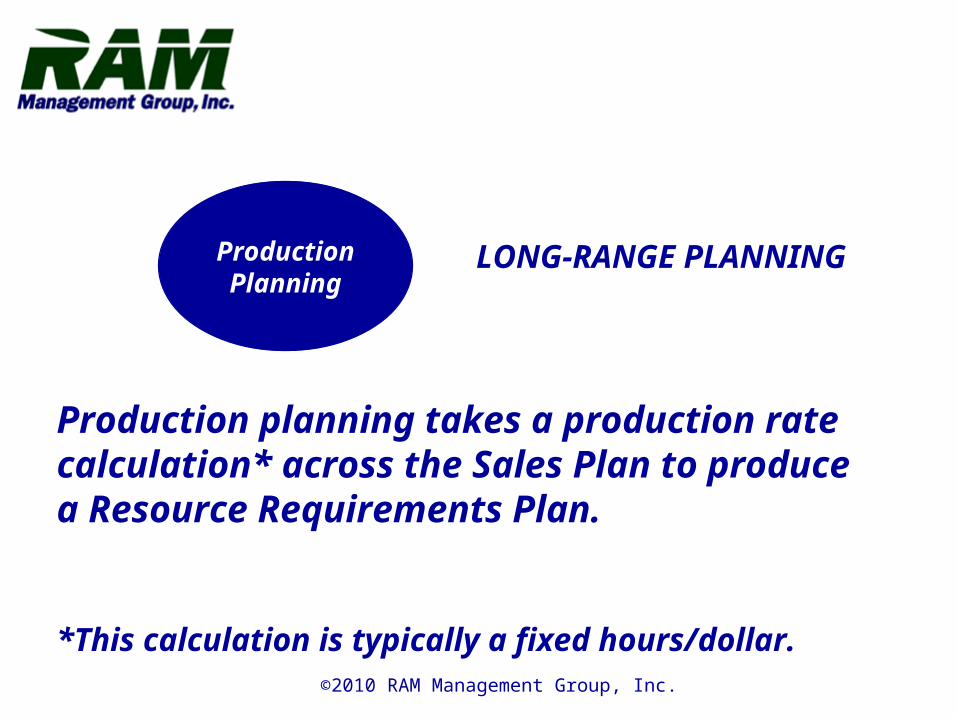
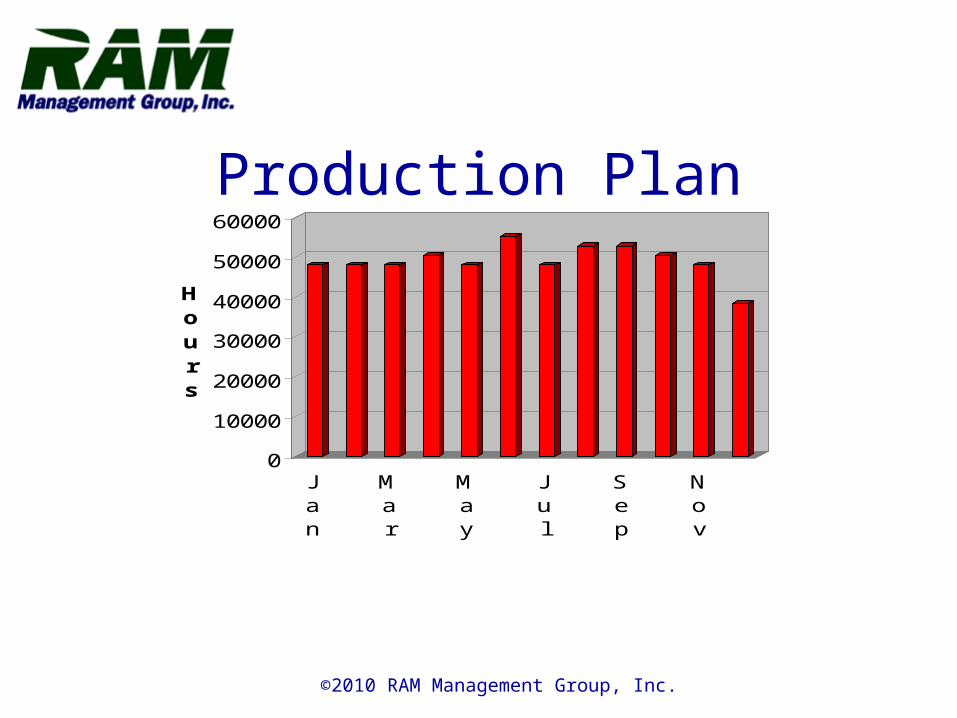
ProductionPlanning
Production planning takes a production rate calculation* across the Sales Plan to produce a Resource Requirements Plan.
*This calculation is typically a fixed hours/dollar.
LONG-RANGE PLANNING
©2010 RAM Management Group, Inc.
Production Plan
0
10000
20000
30000
40000
50000
60000
Hours
Jan-99
Mar-99
May-99
Jul-99
Sep-99
Nov-99
©2010 RAM Management Group, Inc.
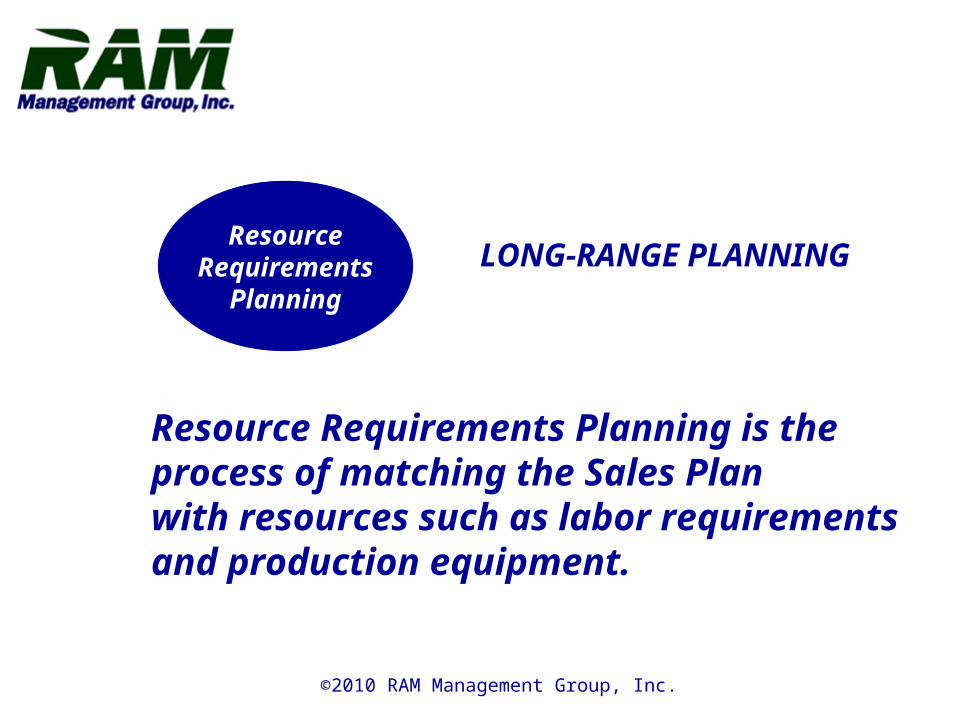
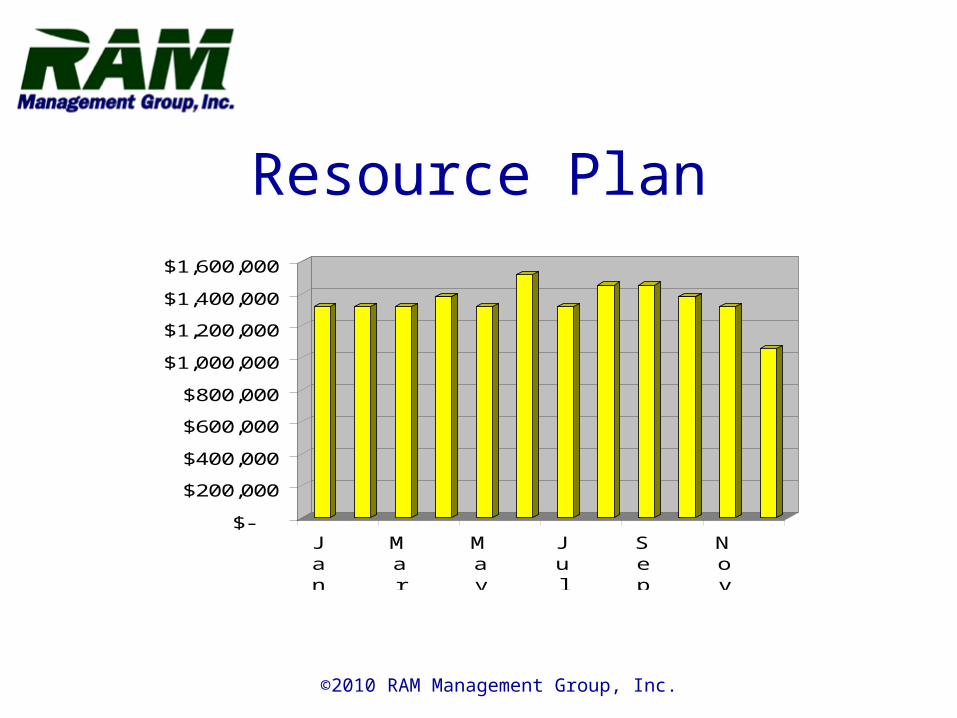
ResourceRequirements
Planning
Resource Requirements Planning is the process of matching the Sales Planwith resources such as labor requirements and production equipment.
LONG-RANGE PLANNING
©2010 RAM Management Group, Inc.
Resource Plan
$-
$200,000
$400,000
$600,000
$800,000
$1,000,000
$1,200,000
$1,400,000
$1,600,000
Jan-99
Mar-99
May-99
Jul-99
Sep-99
Nov-99
©2010 RAM Management Group, Inc.
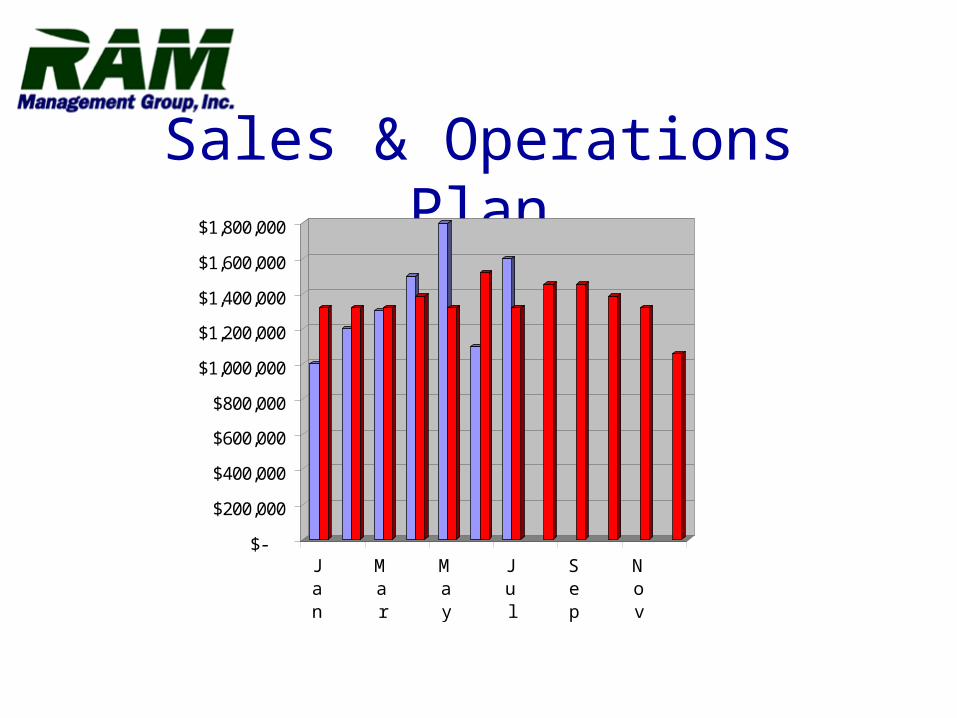
Sales & Operations Plan
$-
$200,000
$400,000
$600,000
$800,000
$1,000,000
$1,200,000
$1,400,000
$1,600,000
$1,800,000
Jan-99
Mar-99
May-99
Jul-99
Sep-99
Nov-99
©2010 RAM Management Group, Inc.
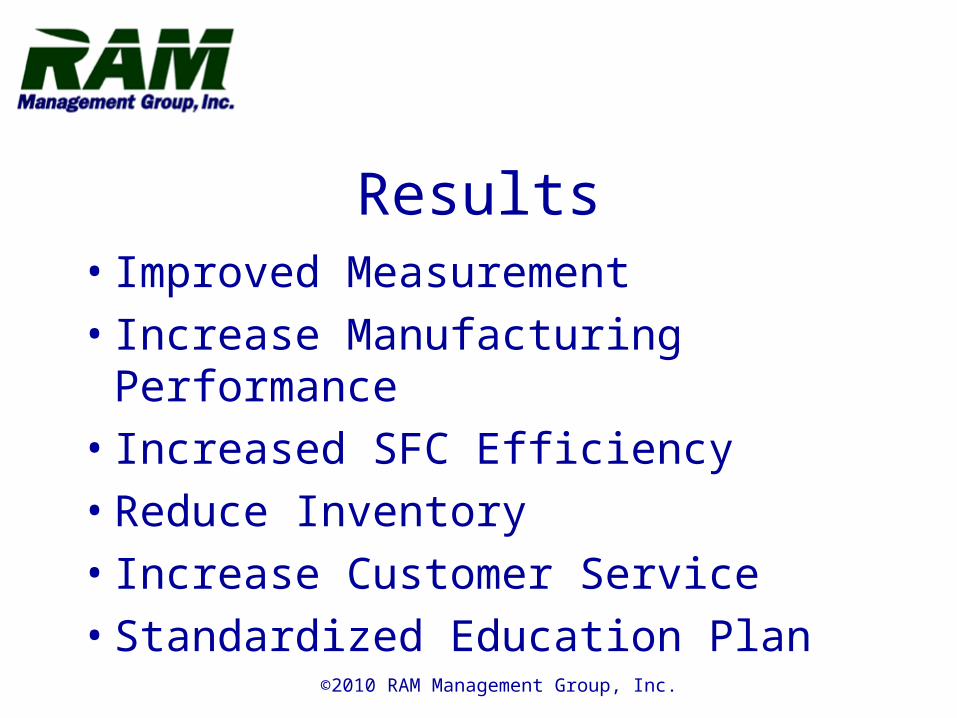
Results• Improved Measurement
• Increase Manufacturing Performance
• Increased SFC Efficiency
• Reduce Inventory
• Increase Customer Service
• Standardized Education Plan
©2010 RAM Management Group, Inc.
Case Study 1
• Werner – Ladder Assembly Plant – Louisville, KY

S&OPWeekly UpdateMarch 2, 2010
(Week #9)
Prepared by: Rich Mihelich
©2010 RAM Management Group, Inc.
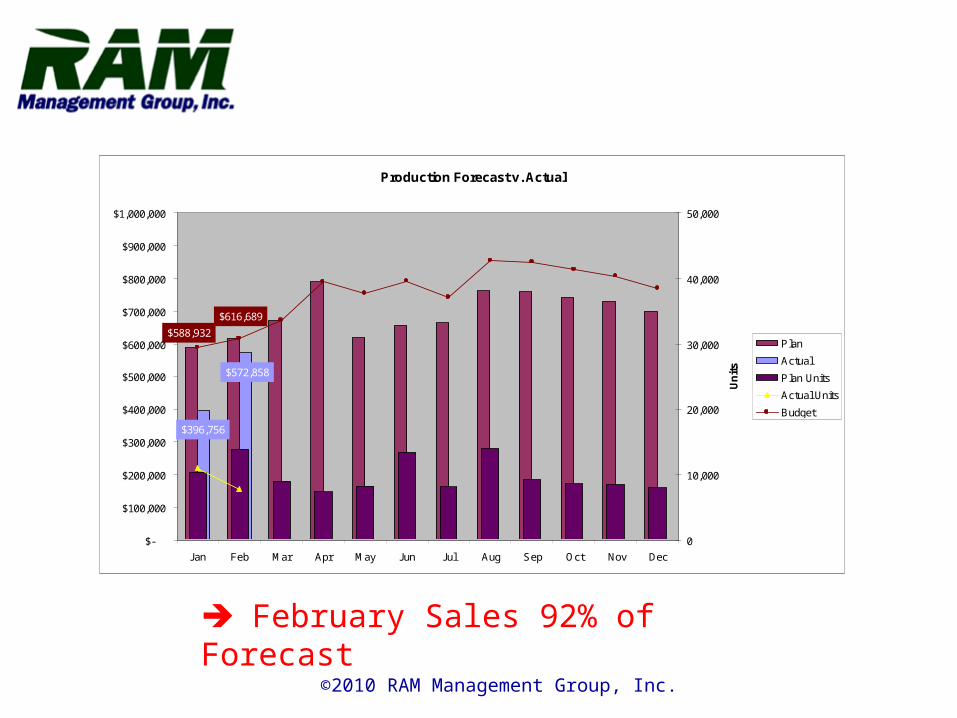
February Sales 92% of Forecast
Production Forecast v. Actual
$616,689
$588,932
$572,858
$396,756
$-
$100,000
$200,000
$300,000
$400,000
$500,000
$600,000
$700,000
$800,000
$900,000
$1,000,000
Jan Feb Mar Apr May Jun Jul Aug Sep Oct Nov Dec
0
10,000
20,000
30,000
40,000
50,000
Un
its
Plan
Actual
Plan Units
Actual Units
Budget
©2010 RAM Management Group, Inc.
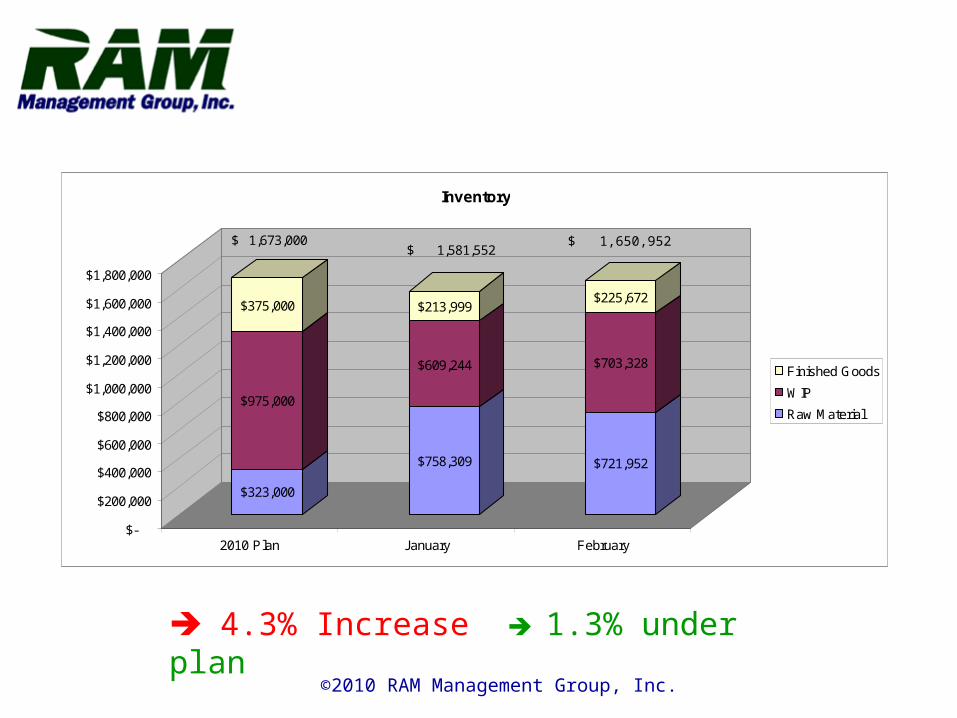
$323,000
$975,000
$375,000
$758,309
$609,244
$213,999
$721,952
$703,328
$225,672
$-
$200,000
$400,000
$600,000
$800,000
$1,000,000
$1,200,000
$1,400,000
$1,600,000
$1,800,000
2010 Plan January February
Inventory
Finished Goods
WIP
Raw Material
4.3% Increase 1.3% under plan
1,673,000$ 1,581,552$ 1,650,952$
©2010 RAM Management Group, Inc.
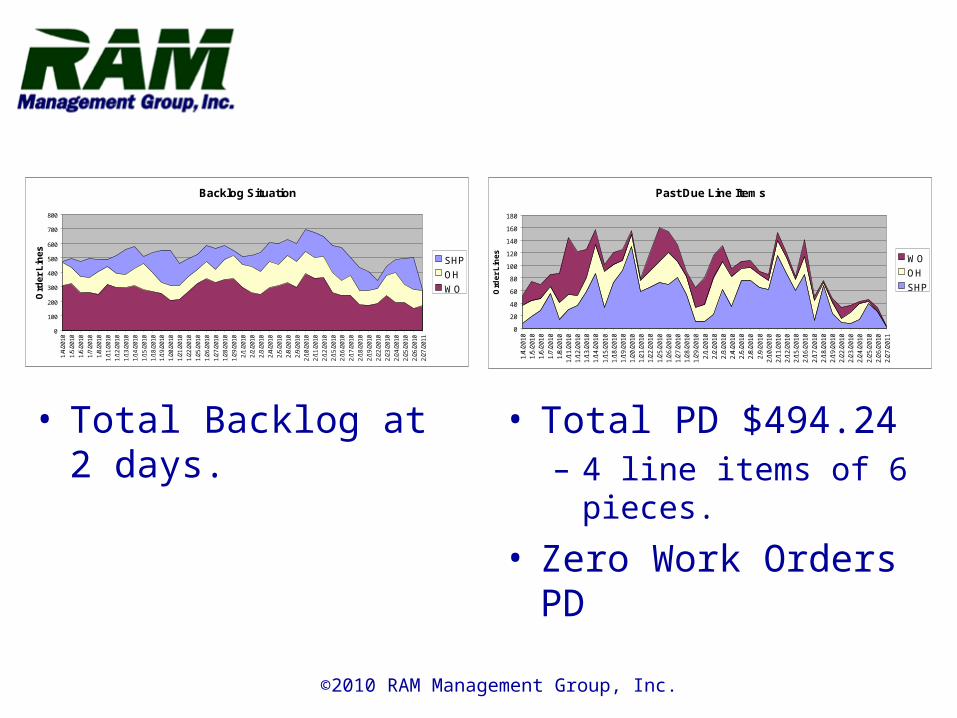
• Total Backlog at 2 days. • Total PD $494.24– 4 line items of 6 pieces.
• Zero Work Orders PD
Past Due Line Items
0
20
40
60
80
100
120
140
160
180
1/4
/20
10
1/5
/20
10
1/6
/20
10
1/7
/20
10
1/8
/20
10
1/1
1/2
01
01
/12
/20
10
1/1
3/2
01
01
/14
/20
10
1/1
5/2
01
01
/18
/20
10
1/1
9/2
01
01
/20
/20
10
1/2
1/2
01
01
/22
/20
10
1/2
5/2
01
01
/26
/20
10
1/2
7/2
01
01
/28
/20
10
1/2
9/2
01
0
2/1
/20
10
2/2
/20
10
2/3
/20
10
2/4
/20
10
2/5
/20
10
2/8
/20
10
2/9
/20
10
2/1
0/2
01
02
/11
/20
10
2/1
2/2
01
02
/15
/20
10
2/1
6/2
01
0
2/1
7/2
01
02
/18
/20
10
2/1
9/2
01
02
/22
/20
10
2/2
3/2
01
02
/24
/20
10
2/2
5/2
01
02
/26
/20
10
2/2
7/2
01
1
Ord
er
Lin
es
WO
OH
SHP
Backlog Situation
0
100
200
300
400
500
600
700
800
1/4/
2010
1/5/
2010
1/6/
2010
1/7/
2010
1/8/
2010
1/11
/201
0
1/12
/201
0
1/13
/201
0
1/14
/201
0
1/15
/201
0
1/18
/201
0
1/19
/201
0
1/20
/201
0
1/21
/201
0
1/22
/201
0
1/25
/201
0
1/26
/201
0
1/27
/201
0
1/28
/201
0
1/29
/201
0
2/1/
2010
2/2/
2010
2/3/
2010
2/4/
2010
2/5/
2010
2/8/
2010
2/9/
2010
2/10
/201
0
2/11
/201
0
2/12
/201
0
2/15
/201
0
2/16
/201
0
2/17
/201
0
2/18
/201
0
2/19
/201
0
2/22
/201
0
2/23
/201
0
2/24
/201
0
2/25
/201
0
2/26
/201
0
2/27
/201
1
Ord
er
Lin
es
SHP
OH
WO
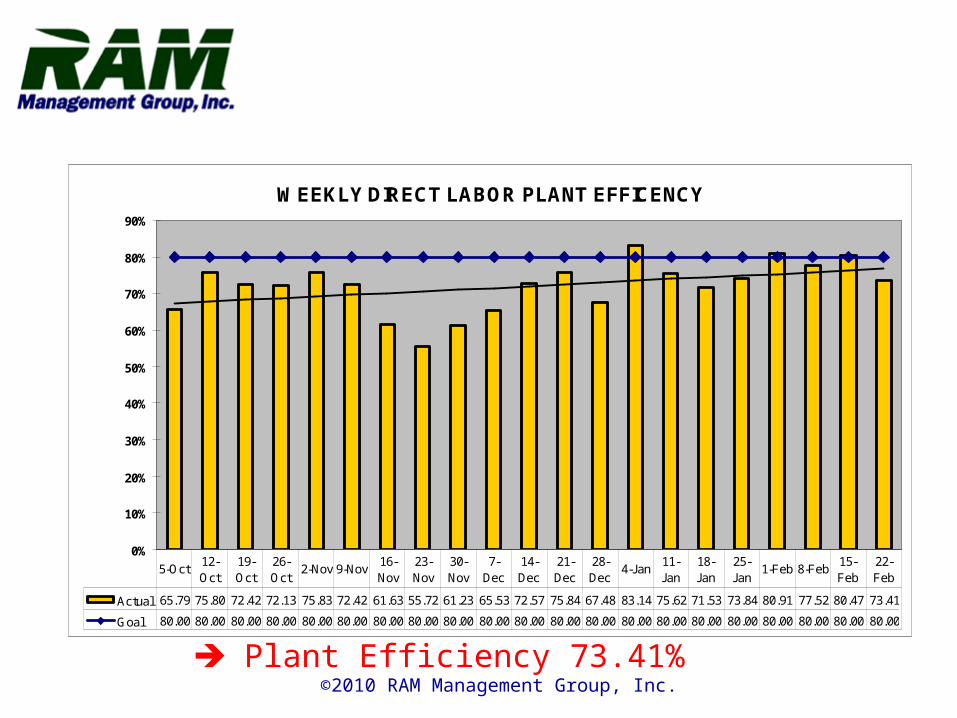
©2010 RAM Management Group, Inc. Plant Efficiency 73.41%
WEEKLY DIRECT LABOR PLANT EFFICENCY
0%
10%
20%
30%
40%
50%
60%
70%
80%
90%
Actual 65.79 75.80 72.42 72.13 75.83 72.42 61.63 55.72 61.23 65.53 72.57 75.84 67.48 83.14 75.62 71.53 73.84 80.91 77.52 80.47 73.41
Goal 80.00 80.00 80.00 80.00 80.00 80.00 80.00 80.00 80.00 80.00 80.00 80.00 80.00 80.00 80.00 80.00 80.00 80.00 80.00 80.00 80.00
5-Oct12-Oct
19-Oct
26-Oct
2-Nov 9-Nov16-Nov
23-Nov
30-Nov
7-Dec
14-Dec
21-Dec
28-Dec
4-Jan11-Jan
18-Jan
25-Jan
1-Feb 8-Feb15-Feb
22-Feb
©2010 RAM Management Group, Inc.
3 Less People – Same Hours
Weekly Earned Hours
30 16 8 5 0.00 1
877
474
225168
0.000 9
73% 72% 72%
80%
0%
61%
0
100
200
300
400
500
600
700
800
900
1000
TOTAL STEPS EXTENSION STAGES PUMP JACK SCAFFOLD
Ho
urs
0%
10%
20%
30%
40%
50%
60%
70%
80%
90%
Eff
icie
ncy Employees
Earned HRs
Efficiency
©2010 RAM Management Group, Inc.
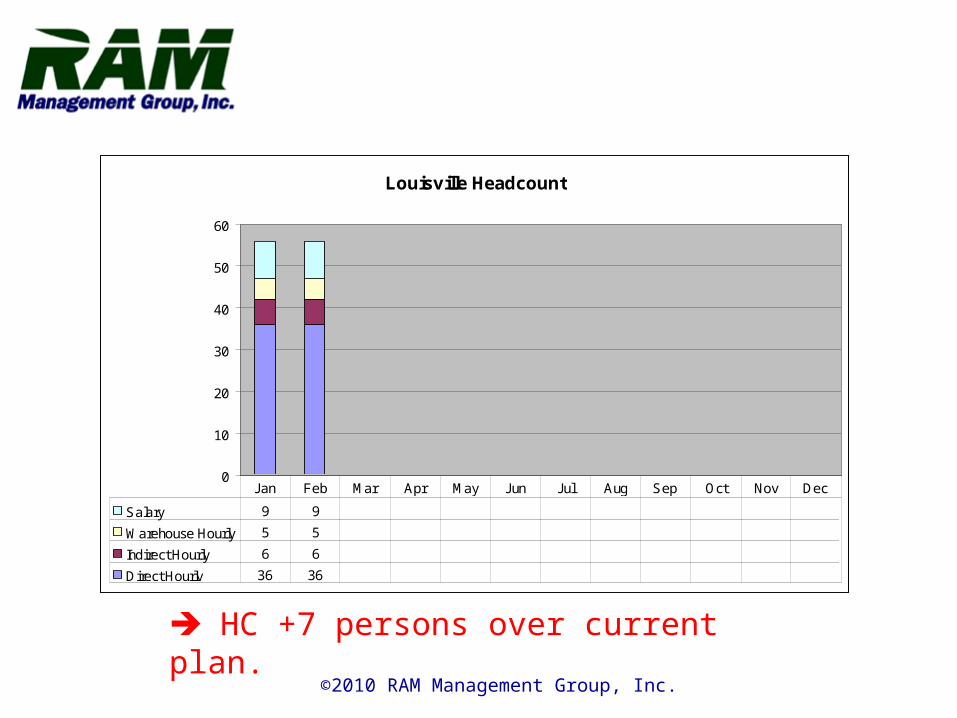
Louisville Headcount
0
10
20
30
40
50
60
Salary 9 9
Warehouse Hourly 5 5
Indirect Hourly 6 6
Direct Hourly 36 36
Jan Feb Mar Apr May Jun Jul Aug Sep Oct Nov Dec
HC +7 persons over current plan.

©2010 RAM Management Group, Inc.
©2010 RAM Management Group, Inc.
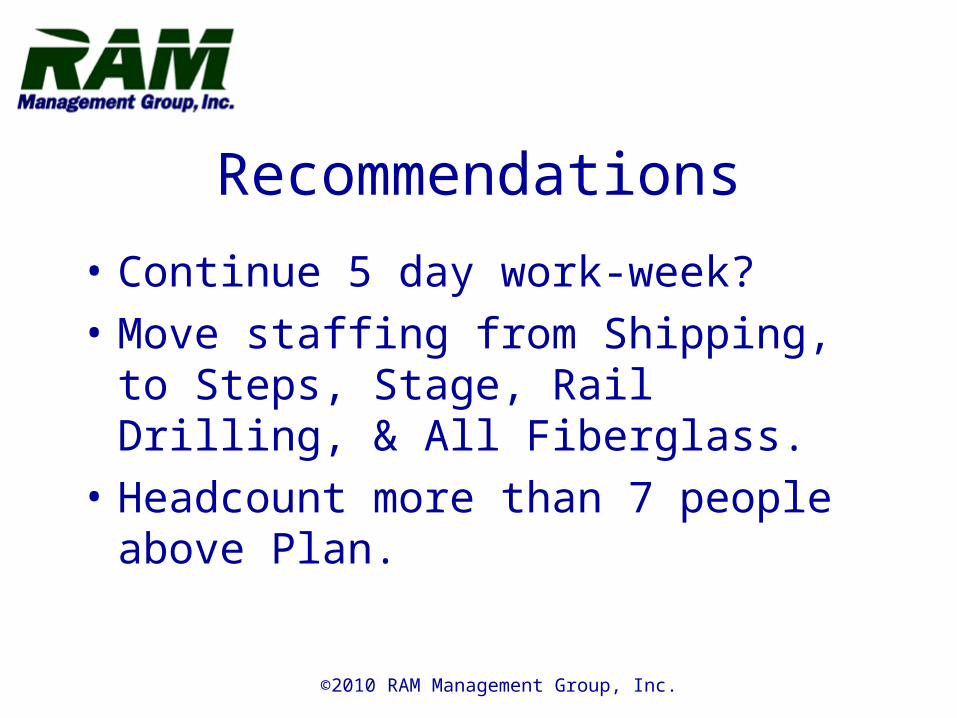
Recommendations
• Continue 5 day work-week?
• Move staffing from Shipping, to Steps, Stage, Rail Drilling, & All Fiberglass.
• Headcount more than 7 people above Plan.
©2010 RAM Management Group, Inc.
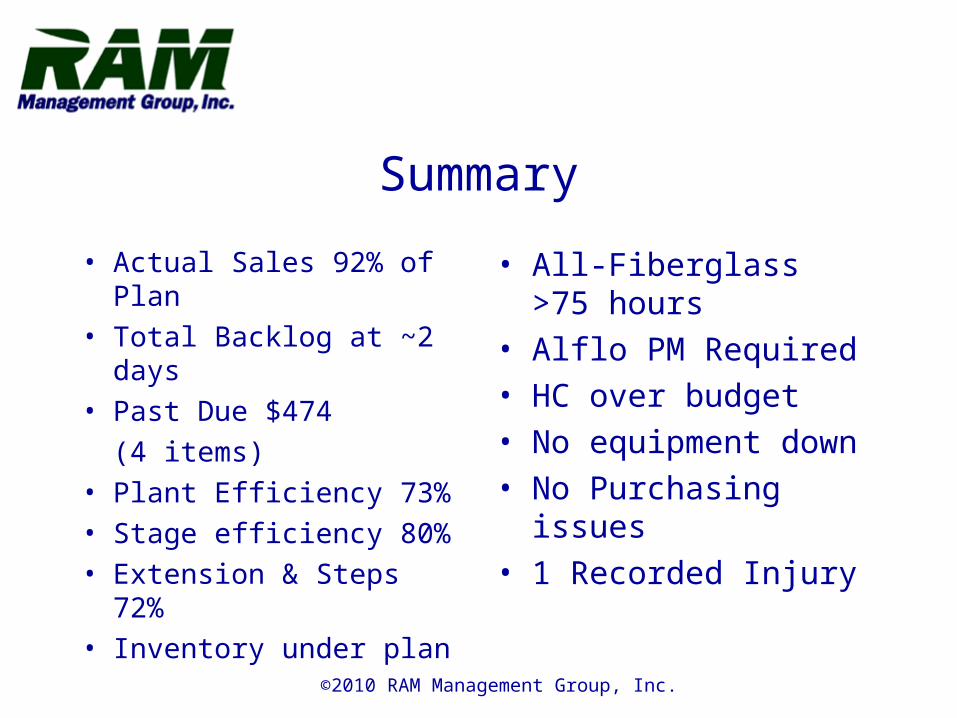
Summary
• Actual Sales 92% of Plan
• Total Backlog at ~2 days
• Past Due $474
(4 items)
• Plant Efficiency 73%
• Stage efficiency 80%
• Extension & Steps 72%
• Inventory under plan
• All-Fiberglass >75 hours
• Alflo PM Required
• HC over budget
• No equipment down
• No Purchasing issues
• 1 Recorded Injury

©2010 RAM Management Group, Inc.
Case Study 2
Johnson & Johnson
• Cordis – Cypher Stent Mfg. Facility– San German, Puerto Rico– Miami Lakes, FL– Juarez, Mexico– Roden, Netherlands
Cypher OPS Update
July 7th, 2004
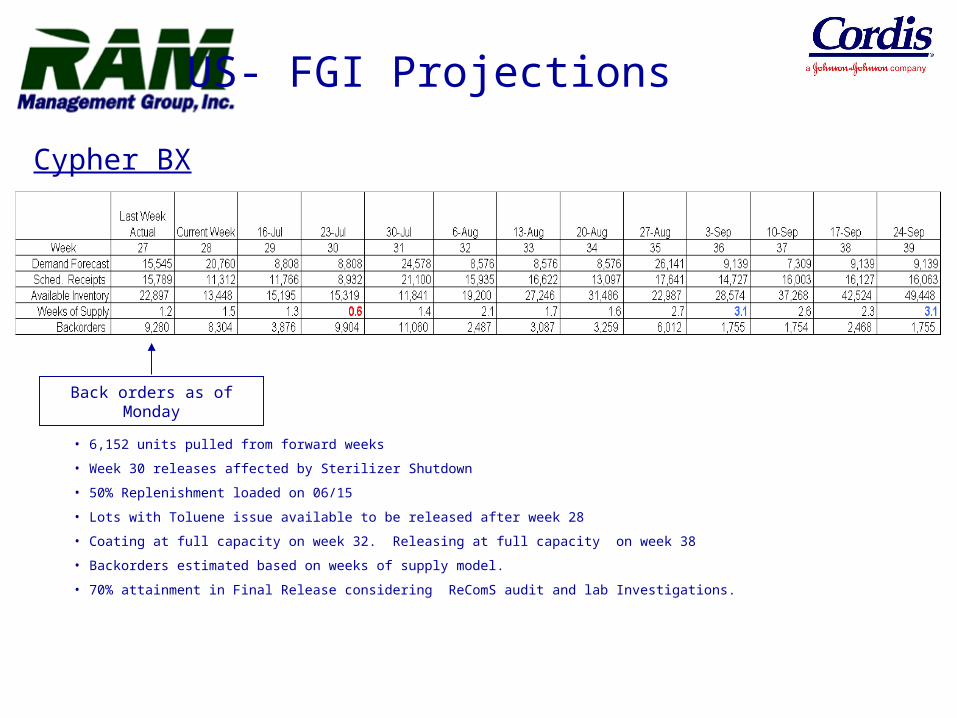
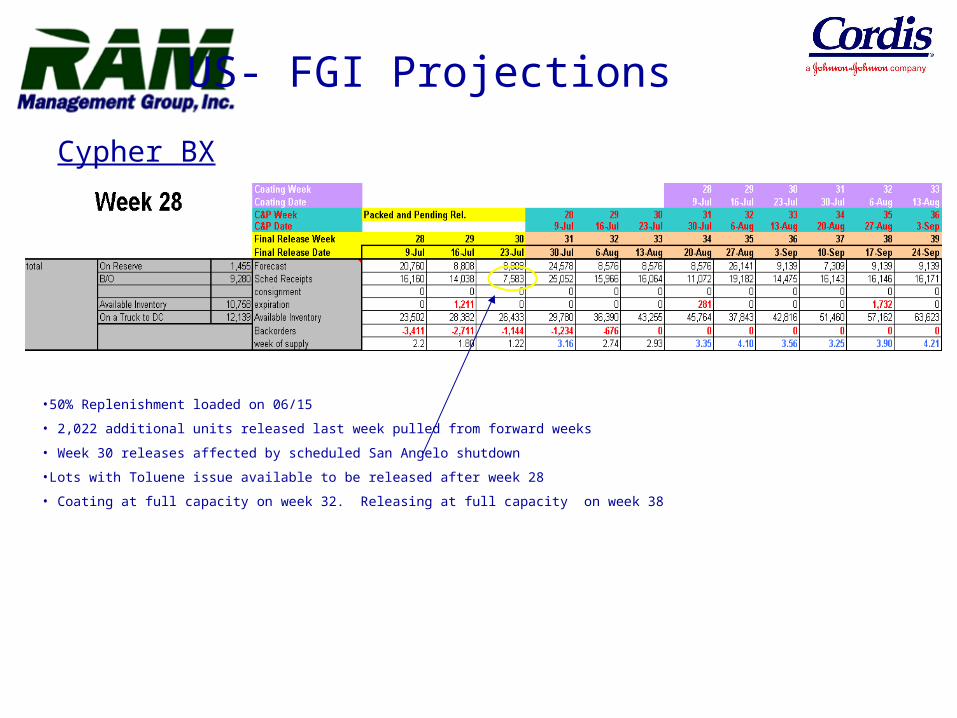
US- FGI Projections
Cypher BX
• 6,152 units pulled from forward weeks
• Week 30 releases affected by Sterilizer Shutdown
• 50% Replenishment loaded on 06/15
• Lots with Toluene issue available to be released after week 28
• Coating at full capacity on week 32. Releasing at full capacity on week 38
• Backorders estimated based on weeks of supply model.
• 70% attainment in Final Release considering ReComS audit and lab Investigations.
Back orders as of Monday
US- FGI Projections
Cypher BX
•50% Replenishment loaded on 06/15
• 2,022 additional units released last week pulled from forward weeks
• Week 30 releases affected by scheduled San Angelo shutdown
•Lots with Toluene issue available to be released after week 28
• Coating at full capacity on week 32. Releasing at full capacity on week 38
©2010 RAM Management Group, Inc.
US Back Orders
130
6,235
1,899
96 1,755
3,259
9,904
345
222
2,578
6,566
0
2,000
4,000
6,000
8,000
10,000
12,000
14,000
16,000
Apr
-04
May
-04
Jun-
04
WE
Jul
3
July
O
utlo
ok
Aug
Out
look
Sep
O
utlo
ok
Non Focus Customers Focus Customers
US Production/Sales/Customer Service
Replenishment Rate changed to 50% on 6/15
Replenishment Rate changed to 50% on 6/15
Q3
Revenue Plan: 110,400
Act. QTD: 4,475Avg/wk: 4,475Avg/wk to go: 8,827
Line Item Fill Rate
90.0%
75.0%
60.0%
91.2%95.4%
81.3%
37.2%
0.0%
20.0%
40.0%
60.0%
80.0%
100.0%
Apr
-04
May
-04
Jun-
04
WE
Jul
3
July
O
utlo
ok
Aug
Out
look
Sep
Out
look
Net Revenue vs Non-Revenue
4,475
33,600
44,000
35,48825,820
25,339
32,800
18,602
28,01832,120
9,859
0
20,000
40,000
60,000
80,000
100,000
Apr-
04
May-0
4
Jun-0
4
WE
Jul 3
July
Outlo
ok
August
Outlo
ok
Sep O
utlo
ok
Revenue Non-Revenue
US Release into FGI
80,561
66,754
42,712
15,789
85,342
47,79951,696
-
15,000
30,000
45,000
60,000
75,000
90,000
105,000
120,000
135,000
150,000
Apr
-04
May
-04
Jun-
04
WE
Jul
3
July
O
utlo
ok
Aug
Out
look
Sep
Out
look
©2010 RAM Management Group, Inc.
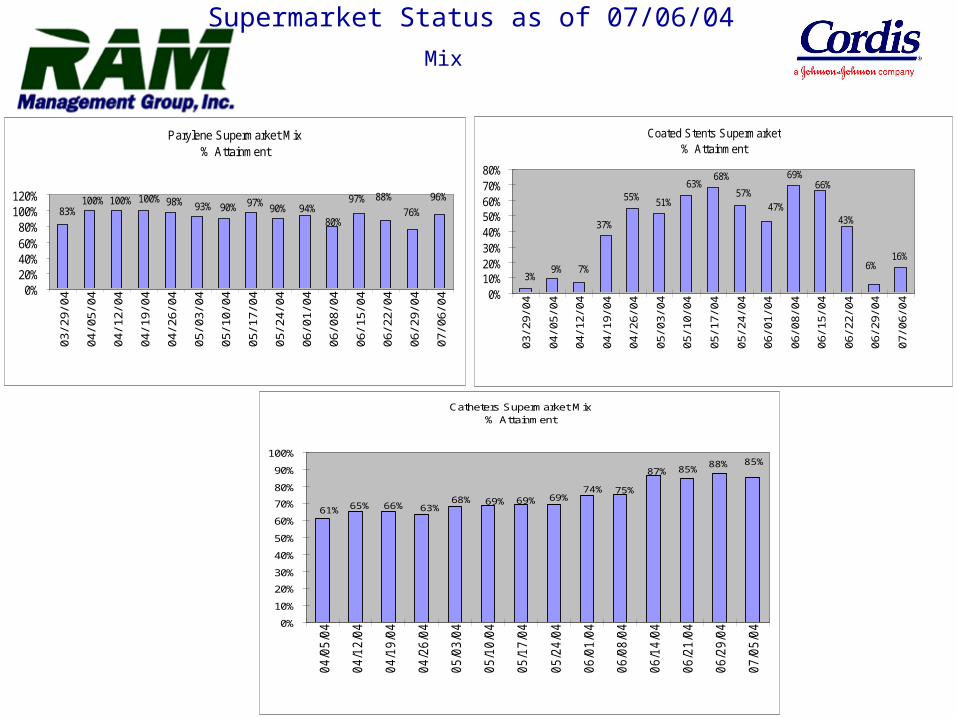
Supermarket Status as of 07/06/04
Mix
Catheters Supermarket Mix% Attainment
88%
61% 65% 66% 63%68% 69% 69% 69%
74% 75%
87% 85%85%
0%
10%
20%
30%
40%
50%
60%
70%
80%
90%
100%
04/0
5/0
4
04/1
2/0
4
04/1
9/0
4
04/2
6/0
4
05/0
3/0
4
05/1
0/0
4
05/1
7/0
4
05/2
4/0
4
06/0
1/0
4
06/0
8/0
4
06/1
4/0
4
06/2
1/0
4
06/2
9/0
4
07/0
5/0
4
Parylene Supermarket Mix% Attainment
83%100% 100% 100% 98% 93% 90% 97% 90% 94%
80%
97% 88%
76%
96%
0%20%40%60%80%
100%120%
03/2
9/04
04/0
5/04
04/1
2/04
04/1
9/04
04/2
6/04
05/0
3/04
05/1
0/04
05/1
7/04
05/2
4/04
06/0
1/04
06/0
8/04
06/1
5/04
06/2
2/04
06/2
9/04
07/0
6/04
Coated Stents Supermarket % Attainment
37%
55%
16%
51%
63%68%
57%47%
9% 7%3%
66%69%
6%
43%
0%10%20%30%40%50%60%70%80%
03/2
9/04
04/0
5/04
04/1
2/04
04/1
9/04
04/2
6/04
05/0
3/04
05/1
0/04
05/1
7/04
05/2
4/04
06/0
1/04
06/0
8/04
06/1
5/04
06/2
2/04
06/2
9/04
07/0
6/04
©2010 RAM Management Group, Inc.
SnOP
LinkedIn/Groups/Sales & Operations
The SnOP Group on LinkedIn is a global strategic networking organization developed to lead the evolving profession of Sales & Operations Planning by creating and disseminating S&OP knowledge and research in the virtual environment.
©2010 RAM Management Group, Inc.
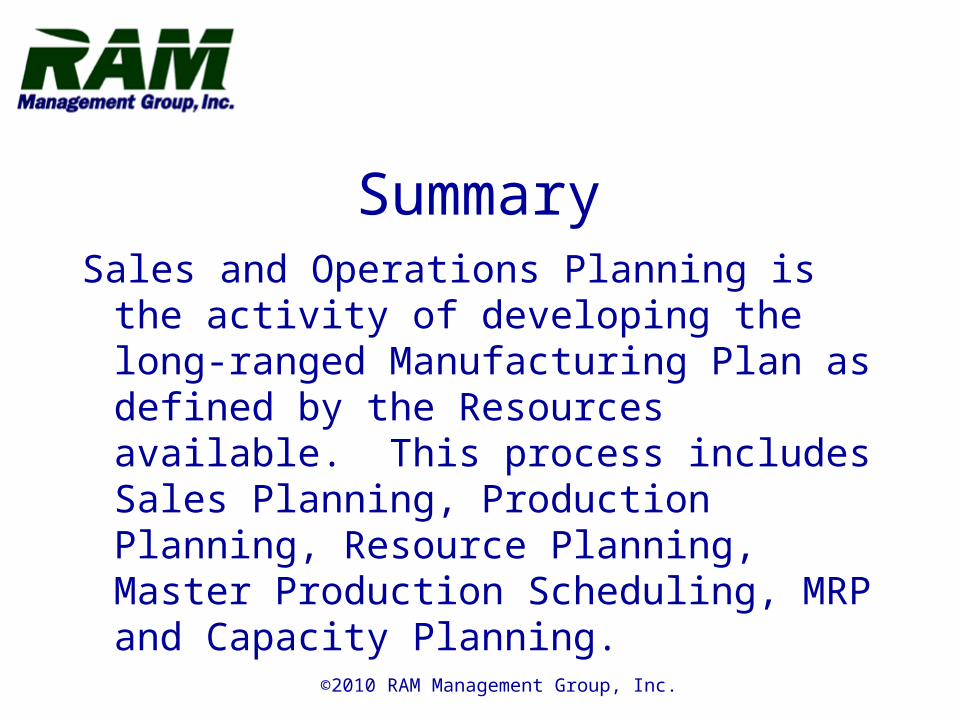
SummarySales and Operations Planning is the activity
of developing the long-ranged Manufacturing Plan as defined by the Resources available. This process includes Sales Planning, Production Planning, Resource Planning, Master Production Scheduling, MRP and Capacity Planning.

©2010 RAM Management Group, Inc.
Visit us Online@
www.ramscm.com