corporate travel strategic sourcing kathy briski, c.p.m., gtp july 16, 2014
TRANSCRIPT
Corporate Travel Strategic Sourcing
Kathy Briski, C.P.M., GTP
July 16, 2014

Page: 2
Global Procurement Processes
DefineSupplier
EvaluationCriteria
Collect Data
Conduct Performance
Evaluation
Develop Improvement
Strategy
Supplier Relationship Management Process
GenerateRequisition
Approve/Submit
Requisition
Process/SubmitOrder
Receive Goods &Services
ApproveInvoice
ProcessInvoice &GeneratePayment
Strategic Sourcing Process
Access Opportunity
&Establish
Team
ProfileCategoryInternally
& Externally
Develop Sourcing Strategy
CreateSelectionFactors &EvaluateSuppliers
ConductCompetitive
Exercise w/ Approved
Suppliers
Negotiate & Develop Sourcing
Recommend-action
ImplementAgreements
Continuous Improvement
SupplierScorecard
SavingsManagement
SpendAnalysis
KnowledgeManagement
ContractManagement
CatalogManagement
Core Supporting Capabilities
Day-to-Day Purchasing Process
Page: 3
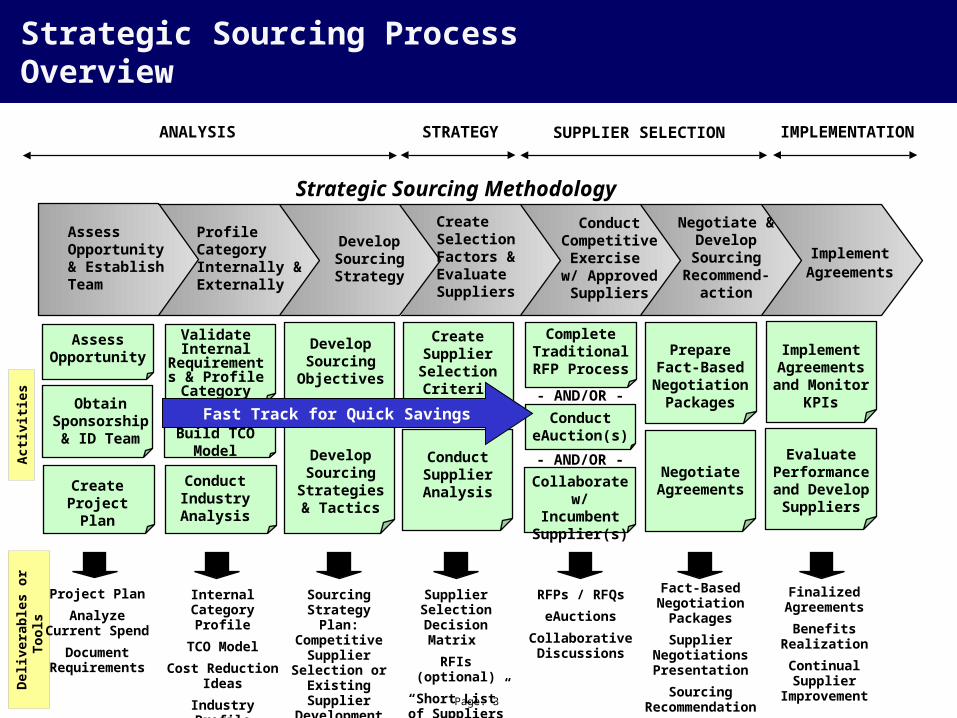
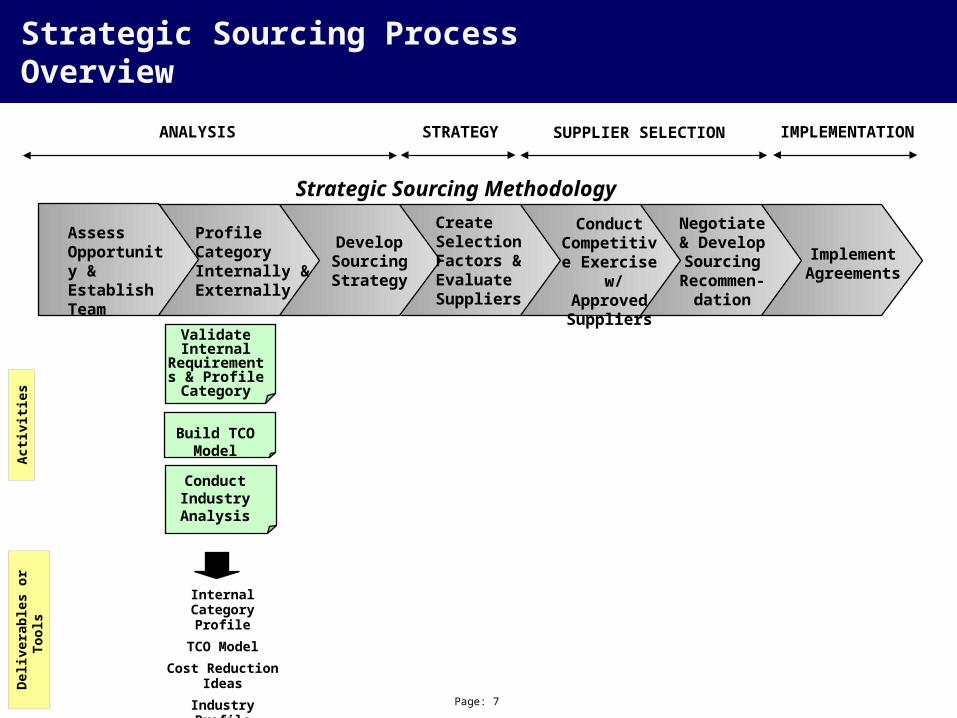
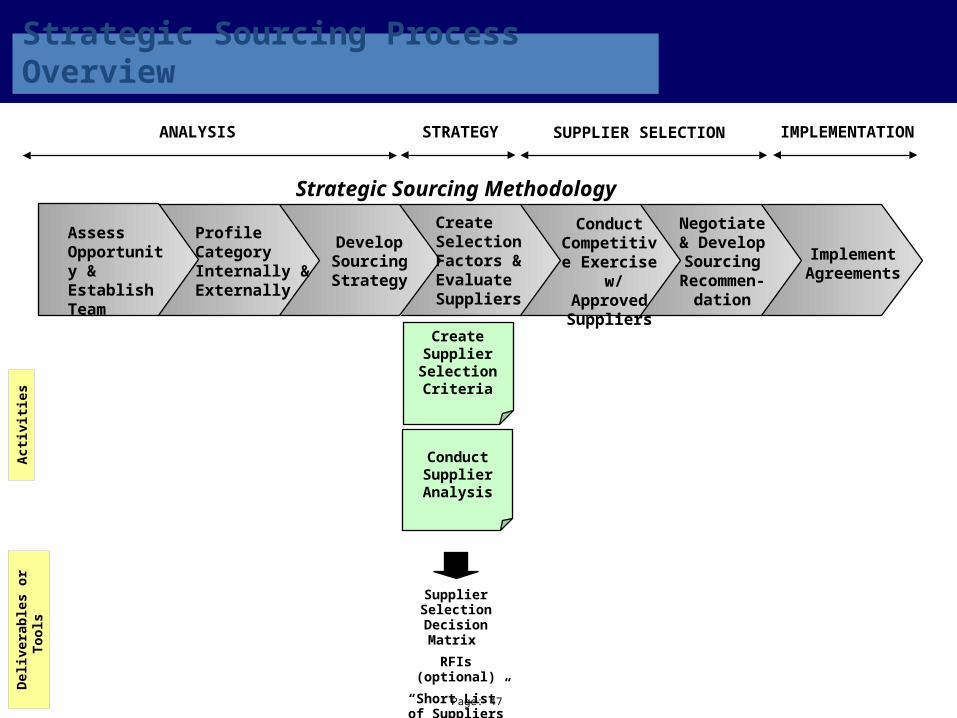
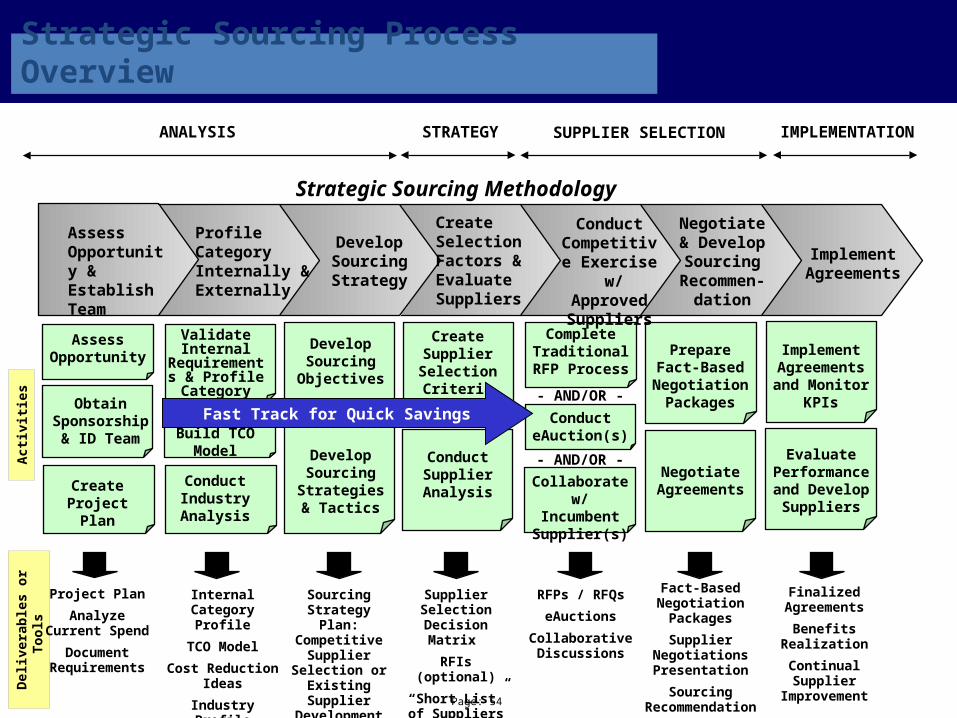
Strategic Sourcing Process Overview
ProfileCategoryInternally &Externally
CreateSelectionFactors &EvaluateSuppliers
Negotiate & Develop Sourcing
Recommend-action
ImplementAgreements
Strategic Sourcing Methodology
Act
ivit
ies
Del
iver
able
s o
r To
ols
Validate Internal
Requirements & Profile Category
ConductIndustry Analysis
Internal Category Profile
TCO Model
Cost Reduction Ideas
Industry Profile
Build TCO Model
Develop Sourcing
Objectives
Sourcing Strategy Plan: Competitive
Supplier Selection or
Existing Supplier
Development
Conduct Supplier Analysis
Create Supplier Selection Criteria
Supplier Selection
Decision Matrix
RFIs (optional)
“Short List” of Suppliers
Complete Traditional
RFP Process
RFPs / RFQs
eAuctions
Collaborative Discussions
Conduct eAuction(s)
Collaborate w/ Incumbent Supplier(s)
- AND/OR -
- AND/OR -
Prepare Fact-Based
Negotiation Packages
Negotiate Agreements
Fact-Based Negotiation Packages
Supplier Negotiations Presentation
Sourcing Recommendation
Finalized Agreements
Benefits Realization
Continual Supplier
Improvement
Implement Agreements and Monitor
KPIs
Evaluate Performance and Develop
Suppliers
Develop SourcingStrategy
Conduct Competitive Exercise w/ ApprovedSuppliers
Fast Track for Quick Savings
Develop Sourcing
Strategies & Tactics
ANALYSIS STRATEGY SUPPLIER SELECTION IMPLEMENTATION
AssessOpportunity & Establish Team
AssessOpportunity
Obtain Sponsorship
& ID Team
CreateProject
Plan
Project Plan
Analyze Current Spend
Document Requirements
Page: 4
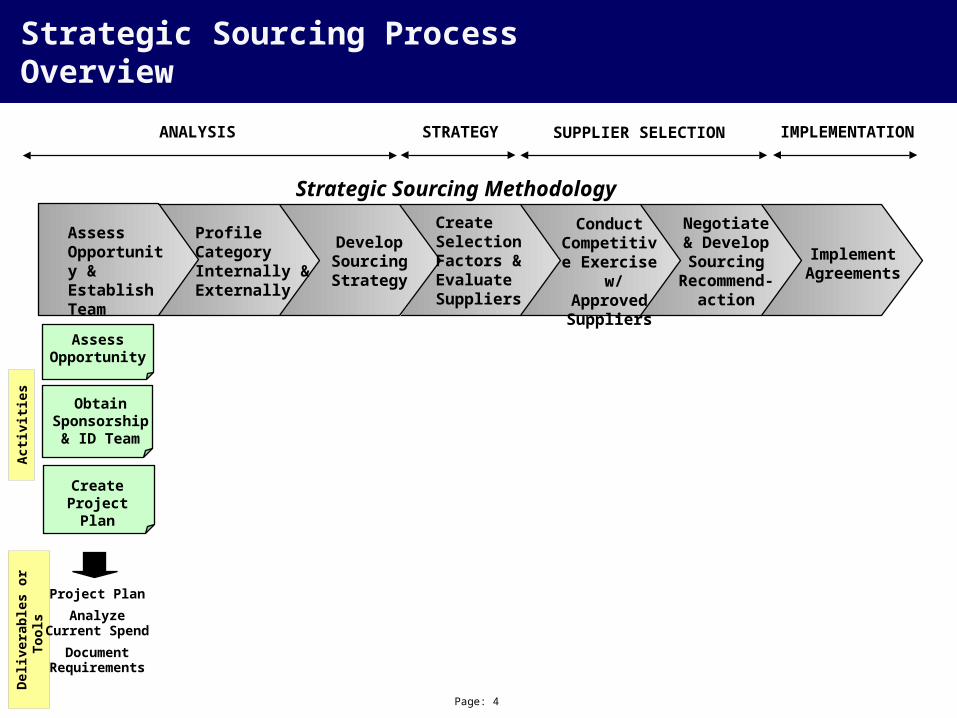
Strategic Sourcing Process Overview
ProfileCategoryInternally &Externally
CreateSelectionFactors &EvaluateSuppliers
Negotiate & Develop Sourcing
Recommend-action
ImplementAgreements
Strategic Sourcing Methodology
Act
ivit
ies
Del
iver
able
s o
r To
ols
Develop SourcingStrategy
Conduct Competitive Exercise w/ ApprovedSuppliers
ANALYSIS STRATEGY SUPPLIER SELECTION IMPLEMENTATION
AssessOpportunity & Establish Team
AssessOpportunity
Obtain Sponsorship
& ID Team
CreateProject
Plan
Project Plan
Analyze Current Spend
Document Requirements

5
High Level Travel Project Plan
Travel Workplan Review
Mobilization & Kick-Off Category
Profile Internally & Externally
Develop Strategy
Screen Suppliers & Selection Factors
Conduct Competitive Exercise
Negotiate & Develop Sourcing Recommendation
Implement Agreement
April May June July August September
SAMPLE
Page: 6
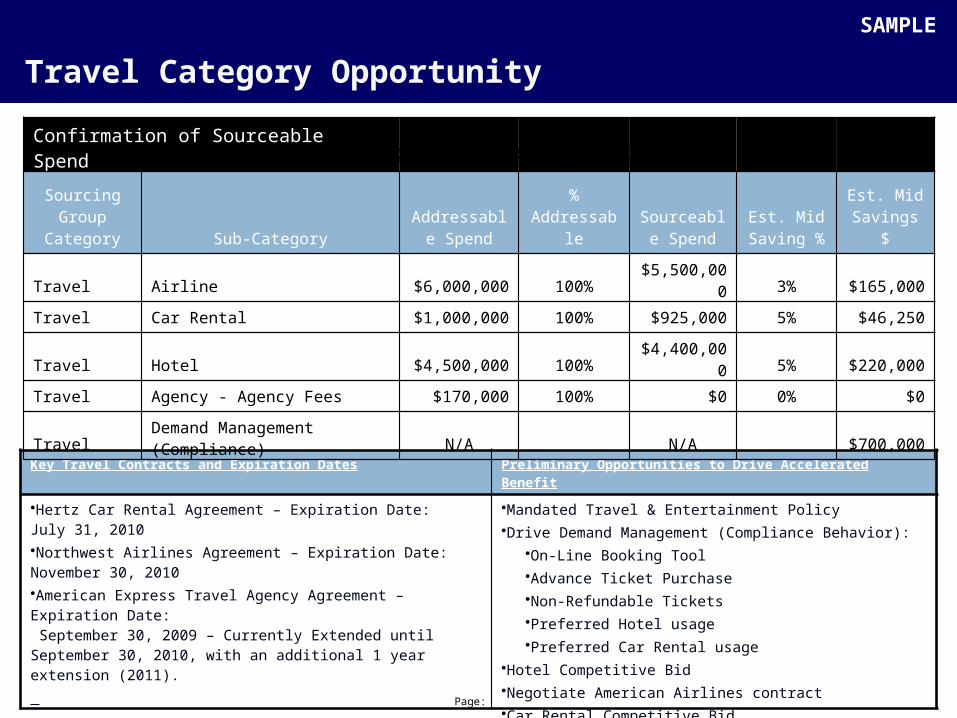
Travel Category Opportunity
SAMPLE
Category Opportunity Baseline – Travel
Key Travel Contracts and Expiration Dates Preliminary Opportunities to Drive Accelerated Benefit
•Hertz Car Rental Agreement – Expiration Date: July 31, 2010•Northwest Airlines Agreement – Expiration Date: November 30, 2010•American Express Travel Agency Agreement – Expiration Date: September 30, 2009 – Currently Extended until September 30, 2010, with an additional 1 year extension (2011).
•Mandated Travel & Entertainment Policy•Drive Demand Management (Compliance Behavior):
•On-Line Booking Tool•Advance Ticket Purchase•Non-Refundable Tickets•Preferred Hotel usage•Preferred Car Rental usage
•Hotel Competitive Bid•Negotiate American Airlines contract•Car Rental Competitive Bid
Confirmation of Sourceable Spend
Sourcing Group
Category Sub-CategoryAddressable
Spend%
AddressableSourceable
SpendEst. Mid
Saving %Est. Mid
Savings $
Travel Airline $6,000,000 100% $5,500,000 3% $165,000
Travel Car Rental $1,000,000 100% $925,000 5% $46,250
Travel Hotel $4,500,000 100% $4,400,000 5% $220,000
Travel Agency - Agency Fees $170,000 100% $0 0% $0
TravelDemand Management (Compliance) N/A N/A $700,000
SAMPLE
Page: 7
Strategic Sourcing Process Overview
ProfileCategoryInternally &Externally
CreateSelectionFactors &EvaluateSuppliers
Negotiate & Develop Sourcing
Recommen-dation
ImplementAgreements
Strategic Sourcing Methodology
Act
ivit
ies
Del
iver
able
s o
r To
ols
Validate Internal
Requirements & Profile Category
ConductIndustry Analysis
Internal Category Profile
TCO Model
Cost Reduction Ideas
Industry Profile
Build TCO Model
Develop SourcingStrategy
Conduct Competitive Exercise w/ ApprovedSuppliers
ANALYSIS STRATEGY SUPPLIER SELECTION IMPLEMENTATION
AssessOpportunity & Establish Team
Copyright © 2007 Accenture All Rights Reserved. 8
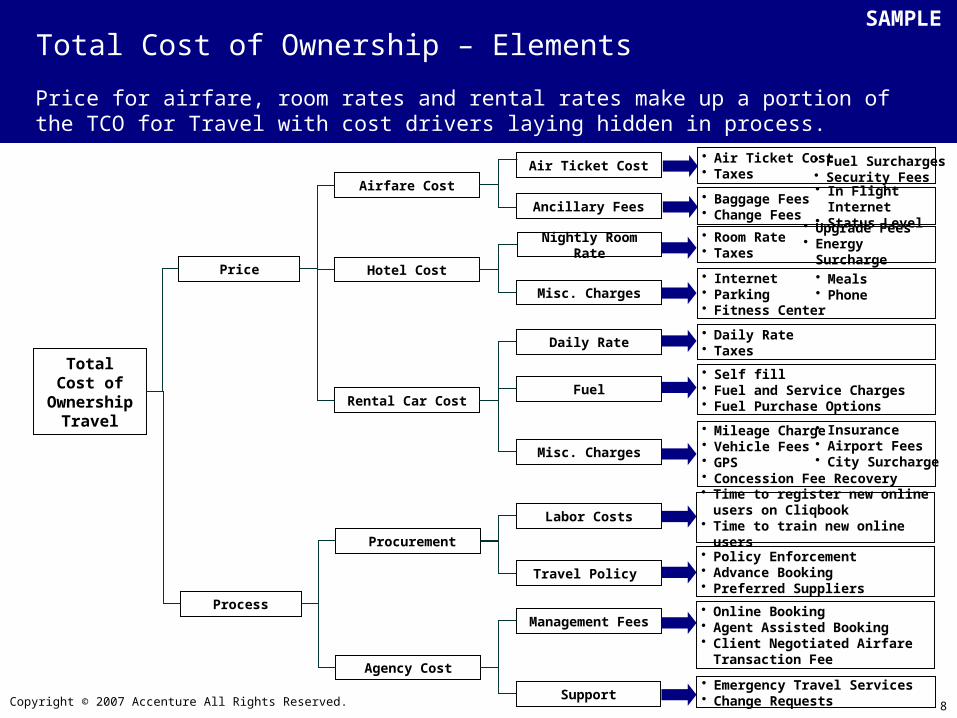
Total Cost of
Ownership Travel
Hotel Cost
Agency Cost
Total Cost of Ownership – Elements
Air Ticket Cost
• Emergency Travel Services• Change RequestsSupport
Management Fees• Online Booking• Agent Assisted Booking• Client Negotiated Airfare
Transaction Fee
Price for airfare, room rates and rental rates make up a portion of the TCO for Travel with cost drivers laying hidden in process.
Rental Car Cost
Airfare Cost
Nightly Room Rate
Misc. Charges• Internet• Parking• Fitness Center
Misc. Charges
Fuel
Daily Rate
• Mileage Charge• Vehicle Fees• GPS• Concession Fee Recovery
• Self fill• Fuel and Service Charges• Fuel Purchase Options
Price
Procurement
Process
Labor Costs• Time to register new online users
on Cliqbook• Time to train new online users
• Air Ticket Cost• Taxes
• Room Rate• Taxes
• Daily Rate• Taxes
Travel Policy
• Policy Enforcement• Advance Booking• Preferred Suppliers
• Meals• Phone
• Fuel Surcharges• Security Fees
• Insurance• Airport Fees• City Surcharge
• Upgrade Fees• Energy Surcharge
SAMPLE
Ancillary Fees• Baggage Fees• Change Fees
• In Flight Internet• Status Level

Page: 9
Industry Profile - Objective & Key Questions
Objective
Provide a detailed understanding of the current corporate travel industry as well as the forces shaping future travel services. The results of this profile will shape Comerica’s travel Sourcing Strategy.
Key Questions
How big is the industry?
Who are the major players?
How competitive is the market?
What are the key cost drivers?
Is the industry in a state of growth or decline?
What are the current pricing trends?
SAMPLE

Page: 10
Travel Scope
NAICS 481 – Transportation by Air
4811 – Scheduled Air Transportation
481111 – Scheduled Passenger Air Transportation
NAICS 721 – Accommodation
7211 – Traveler Accommodation
721110 – Hotels and Motels 721110.1 Guestroom Rental
NAICS 5321 – Automotive Equipment Rental
53211 – Passenger Car Rental and Leasing
532111 – Passenger Car Rental (for business travel)
NAICS 561 – Administrative and Support Services
5615 – Travel Arrangement and Reservation Services
561510 – Travel Agencies (including Meetings & Events)
In Scope
• Scheduled passenger air transportation, hotel, passenger car rentals and meeting/event planning services are in scope for travel sourcing.
• Because of the existing relationship with current travel agency and the subsequent process standardization, it does not make sense to fully source the travel agency component of travel at this time. However, there may be components of the contract to reevaluate.
• Meeting/Event Planning Services are categorized under the same NAICS code as Travel Agencies.
Key Points
The travel industry encompasses a variety of different categories each grouped with an NAICS (North American Industry Classification System) code.
Source: http://www.bls.gov
SAMPLE

• In 2000, 10 airlines accounted for slightly more than 90% of available seat-mile capacity in the United States. By early 2012, those 10 airlines, through mergers, were reduced to 5 airlines controlling about 85% of the domestic passenger market. Moreover, American and US Airways is currently merging —which would further reduce the number of airlines controlling the vast majority of passenger ridership to only four.
BOEING PROPRIETARY
Source: Office of Inspector General, AVIATION INDUSTRY PERFORMANCE, A Review of the Aviation Industry, 2008–2011, Number: CC-2012-029 , Date Issued: September 24, 2012
RITA, Bureau of Transportation Statistics
AIRLINE INDUSTRY – US Airline Mergers

Page: 12
Airline Industry: Overview
• 2013 Airline Industry revenue reached $711 Billion. • For 2014, Airline Industry revenue forecasts to reach
$746 Billion.• Over the five years to 2018, industry revenue is
expected to increase at an annualized rate of 3.6% to $848.2 billion
• US Airline Industry revenue is expected to continue flying upward over the five years to 2019, increasing at an annualized rate of 1.5% to $153.6 billion.
• Major operators such as American Airlines, Delta and United Continental will reap synergies from their recent mergers, leading to higher profit margins. However, profit margins will still depend on volatile fuel prices and the airlines’ ability to successfully hedge against any adverse movements. New fuel-efficient aircraft will aid this cause and increase operator competitiveness in the global market.
• U.S. scheduled passenger airlines reported a net profit of $12.7 billion in 2013, up from a profit of $98 million in 2012
• Business travel represents 35% of airline’s revenue• Federal taxes constitute $61 – or 20% – of the price
of a typical $300 domestic one-stop round-trip ticket• In 2012, U.S. airlines carried 16% more passengers
and cargo than in 2000, while using two billion fewer gallons of fuel
• From 2000-2013, U.S. airlines reduced the flight cancellation rate sharply from 3.30% to 1.51%
Key Points
Source: Airlines for America: airlines.org, Airline Financials.com, IATA, Wikipedia, CWT 2014 Travel Price Forecast
2013 Global Airline Industry Revenue reached $711 Billion. North America is the industry's revenue leader, generating about 44% of industry revenue.
SAMPLE
Amer
ican
United
Delta
South
west
Jet B
lue
Alaska
$0
$5
$10
$15
$20
$25
$30
$35
$40
$45
20
13
R
ev
en
ue
s (
in B
illi
on
s)
2008 2009 2010 2011 2012 2013 2014F
$582
$493$561 $590
$638$711
$746Annual Airline Industry Revenue
Re
ve
nu
e i
n B
illi
on
s
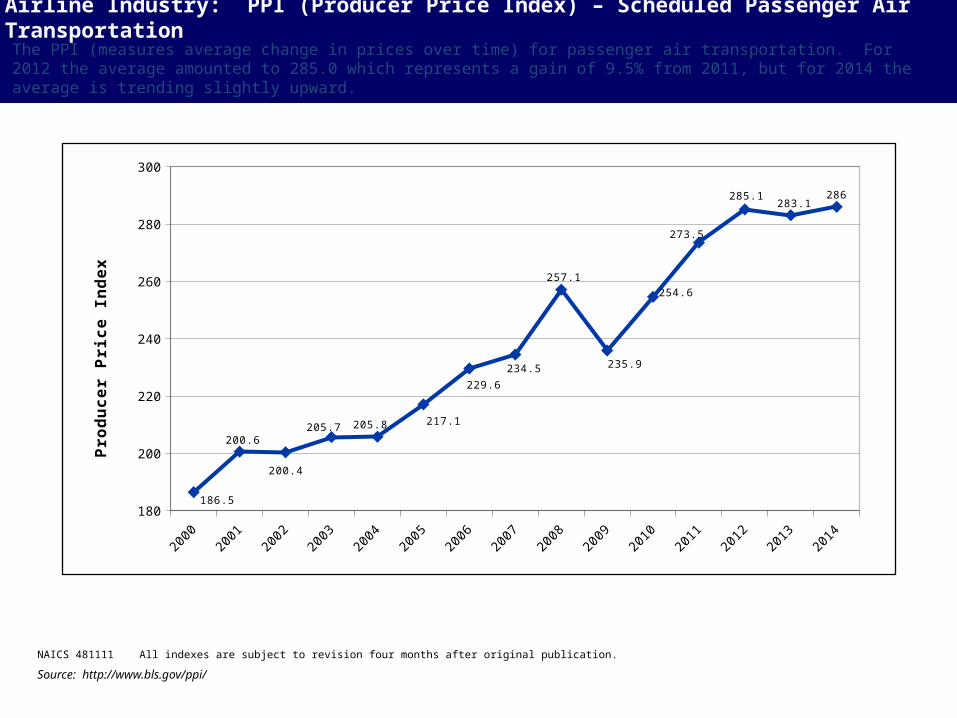
The PPI (measures average change in prices over time) for passenger air transportation. For 2012 the average amounted to 285.0 which represents a gain of 9.5% from 2011, but for 2014 the average is trending slightly upward.
Airline Industry: PPI (Producer Price Index) – Scheduled Passenger Air Transportation
NAICS 481111 All indexes are subject to revision four months after original publication.
Source: http://www.bls.gov/ppi/
2000
2001
2002
2003
2004
2005
2006
2007
2008
2009
2010
2011
2012
2013
2014
180
200
220
240
260
280
300
186.5
200.6
200.4
205.7 205.8 217.1
229.6
234.5
257.1
235.9
254.6
273.5
285.1283.1
286
Pro
du
ce
r P
ric
e In
de
x

Page: 14
Airline Industry: Cost Drivers
Source: www.rajcoaviation.com
2013 Cost Drivers Key Points
• The top three cost drivers for ninety five percent of the world’s airlines, are: fuel, personnel and the cost of aircraft, which together account for an average of 64.3% of an airline’s total cost structure.
• Dependence on oil production, labor agreements and a duopoly in aircraft manufacturing prevent airlines from having any substantive impact on these cost drivers.
• With revenues fixed by competitive ticket pricing and the majority of their costs out of their control, airlines are challenged to maintain earnings and gain competitive advantage by controlling less than 35% of their cost structure.
Top 3 Drivers Account For 64.3% of Total Airline Costs.
SAMPLE
Page: 15
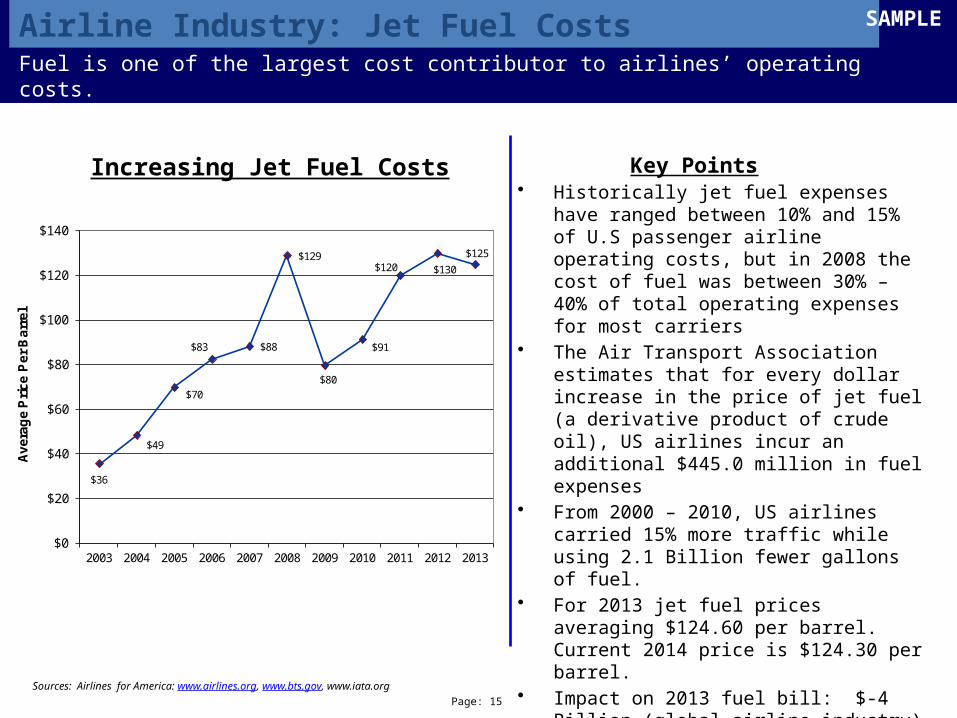
Airline Industry: Jet Fuel Costs
• Historically jet fuel expenses have ranged between 10% and 15% of U.S passenger airline operating costs, but in 2008 the cost of fuel was between 30% – 40% of total operating expenses for most carriers
• The Air Transport Association estimates that for every dollar increase in the price of jet fuel (a derivative product of crude oil), US airlines incur an additional $445.0 million in fuel expenses
• From 2000 – 2010, US airlines carried 15% more traffic while using 2.1 Billion fewer gallons of fuel.
• For 2013 jet fuel prices averaging $124.60 per barrel. Current 2014 price is $124.30 per barrel.
• Impact on 2013 fuel bill: $-4 Billion (global airline industry)
• From 1978-2012, U.S. airlines improved fuel efficiency approximately 120%
Increasing Jet Fuel Costs Key Points
Sources: Airlines for America: www.airlines.org, www.bts.gov, www.iata.org
Fuel is one of the largest cost contributor to airlines’ operating costs.
SAMPLE
$36
$49
$70
$83 $88
$129
$80
$91
$120 $130
$125
$0
$20
$40
$60
$80
$100
$120
$140
2003 2004 2005 2006 2007 2008 2009 2010 2011 2012 2013
Av
era
ge
Pri
ce
Pe
r B
arr
el

Page: 16
Airline Industry: Air Travel Price Index
Sources: Bureau of Transportation Statistics, AMEX 2013 Forecast, CWT 2014 Travel Price Forecast, Airlines for America: www.airlines.org
Air Travel Price Index for Phoenix, AZ and Tucson, AZ Key Points
1 The air travel price index measures the percents change over time in prices paid by travelers.
• The cost of airfare flying out of Phoenix, AZ has been lower than the U.S. average. But flying out of Tucson, AZ is trending at the national average and starting to be above the national average.
• Airfares will be nearly flat in Canada andthe United States next year, driven by ahighly consolidated and fiercely competitive landscape, stable projected oil prices, and potential reduction in demand from the U.S. government, driven by its sequestration efforts.
• Airlines found several ways to grow revenue without raising fares – a la carte pricing: from charging for select coach seat assignments, boarding after elite status members, baggage fees and fuel surcharges and possibly using restrooms!
• In 2011, US airlines posted the lowest annual rate of mishandled baggage ever recorded.
• 2013 ancillary revenue reached over $42 billion this year, up from $36.1 billion in 2013.
• Ancillaries will account for 6% of total airline revenue in 2013, up from 5.4% last year.
The cost of air travel have been very volatile over the past several years. The cost of airfare flying out of Phoenix, AZ has been lower than the U.S. average.
SAMPLE
$180
$230
$280
$330
$380
$430
2001 Q1
2002 Q1
2003 Q1
2004 Q1
2005 Q1
2006 Q1
2007 Q1
2008 Q1
2009 Q1
2010 Q1
2011 Q1
2012 Q1
2013 Q1
Ave
rag
e A
ir F
ares
U.S.-Origin ATPI Phoenix, AZ Tucson, AZ
Page: 17
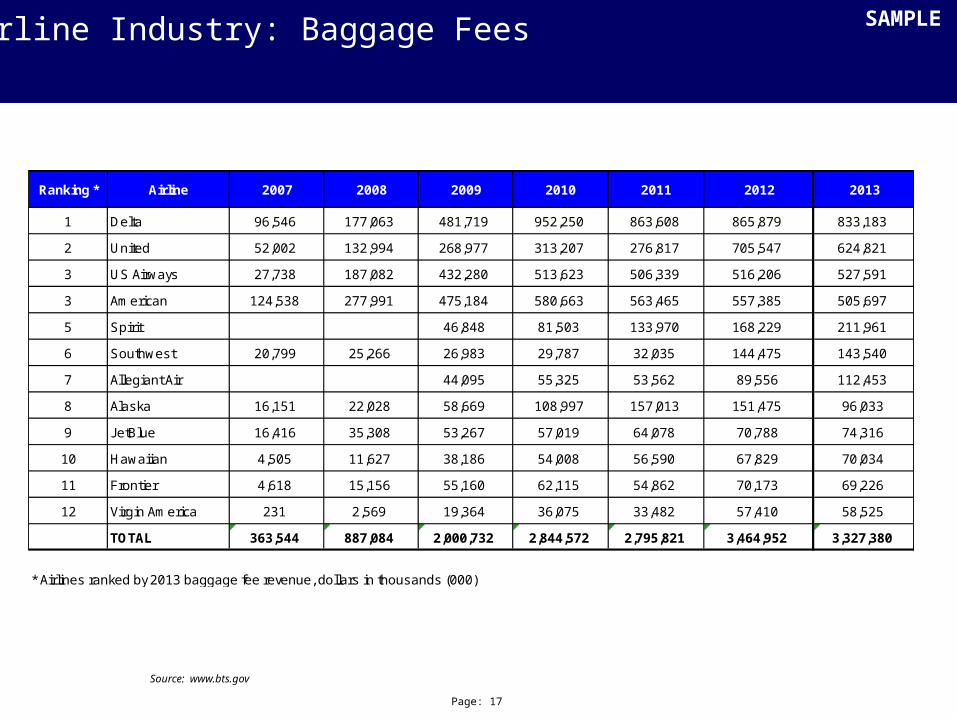
Airline Industry: Baggage Fees SAMPLE
Source: www.bts.gov
Ranking * Airline 2007 2008 2009 2010 2011 2012 2013
1 Delta 96,546 177,063 481,719 952,250 863,608 865,879 833,183
2 United 52,002 132,994 268,977 313,207 276,817 705,547 624,821
3 US Airways 27,738 187,082 432,280 513,623 506,339 516,206 527,591
3 American 124,538 277,991 475,184 580,663 563,465 557,385 505,697
5 Spirit 46,848 81,503 133,970 168,229 211,961
6 Southwest 20,799 25,266 26,983 29,787 32,035 144,475 143,540
7 Allegiant Air 44,095 55,325 53,562 89,556 112,453
8 Alaska 16,151 22,028 58,669 108,997 157,013 151,475 96,033
9 JetBlue 16,416 35,308 53,267 57,019 64,078 70,788 74,316
10 Hawaiian 4,505 11,627 38,186 54,008 56,590 67,829 70,034
11 Frontier 4,618 15,156 55,160 62,115 54,862 70,173 69,226
12 Virgin America 231 2,569 19,364 36,075 33,482 57,410 58,525
TOTAL 363,544 887,084 2,000,732 2,844,572 2,795,821 3,464,952 3,327,380
* Airlines ranked by 2013 baggage fee revenue, dollars in thousands (000)

Page: 18
Airline Industry: Cancellation/Change Fees SAMPLE
Source: www.bts.gov
Ranking * Airline 2007 2008 2009 2010 2011 2012 2013
1 Delta 16,331 18,927 406,039 698,611 766,795 778,398 840,070
2 United 331,193 354,471 309,866 321,539 324,129 660,943 756,513
3 American 469,883 449,899 471,369 495,158 517,708 521,032
4 US Airways 68,304 248,840 253,077 275,643 297,693 327,329
5 JetBlue 74,472 123,468 121,273 113,997 124,536 133,771 146,434
6 Alaska 54,700 67,077 60,590 50,357 10,598 23,210 89,978
7 Spirit 21,514 23,561 23,120 25,927 27,763 32,545
8 Virgin America 943 9,761 12,866 18,151 15,851 30,644 32,223
9 Southwest 32,470 25,356
10 Hawaiian 21,801 25,159 23,546 18,192 17,356 18,285 17,931
11 Frontier 33,081 34,279 21,494 16,685 16,562 14,217 13,194
TOTAL 532,521 1,192,843 1,677,974 1,985,098 2,072,555 2,535,102 2,814,069
* Airlines ranked by 2013 reservation cancellation/change fee revenue, dollars in thousands (000)
Page: 19
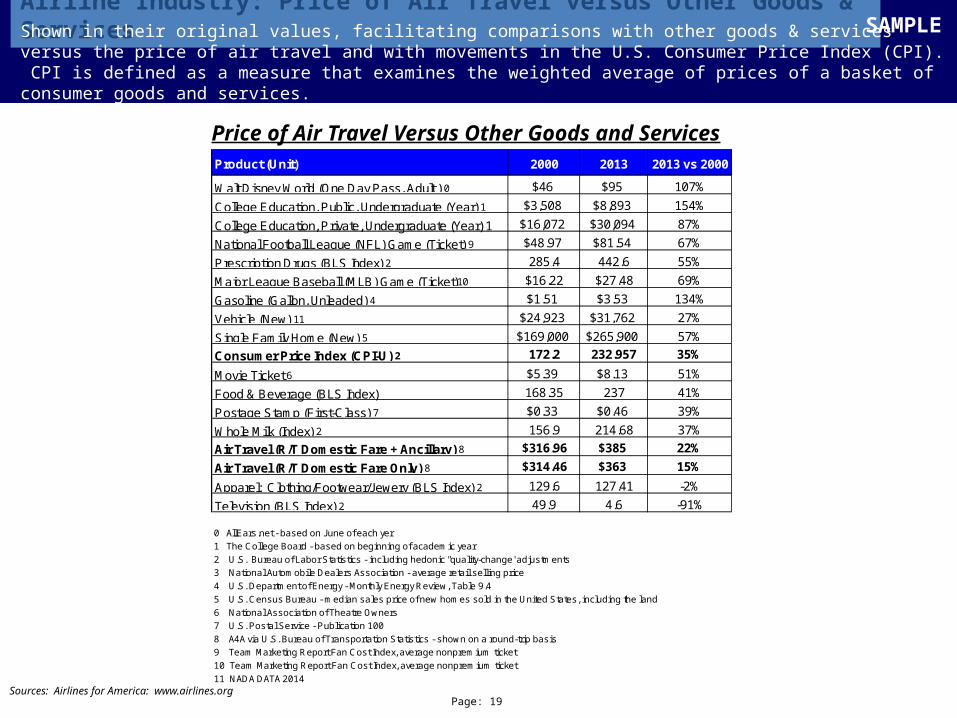
Airline Industry: Price of Air Travel versus Other Goods & Services
Sources: Airlines for America: www.airlines.org
Price of Air Travel Versus Other Goods and Services
Shown in their original values, facilitating comparisons with other goods & services versus the price of air travel and with movements in the U.S. Consumer Price Index (CPI). CPI is defined as a measure that examines the weighted average of prices of a basket of consumer goods and services.
SAMPLE
Product (Unit) 2000 2013 2013 vs 2000
Walt Disney World (One Day Pass, Adult ) 0 $46 $95 107%
College Education, Public, Undergraduate (Year) 1 $3,508 $8,893 154%
College Education, Private, Undergraduate (Year) 1 $16,072 $30,094 87%
National Football League (NFL) Game (Ticket) 9 $48.97 $81.54 67%
Prescription Drugs (BLS Index) 2 285.4 442.6 55%
Major League Baseball (MLB) Game (Ticket)10 $16.22 $27.48 69%
Gasoline (Gallon, Unleaded) 4 $1.51 $3.53 134%
Vehicle (New) 11 $24,923 $31,762 27%
Single Family Home (New) 5 $169,000 $265,900 57%
Consumer Price Index (CPI-U) 2 172.2 232.957 35%
Movie Ticket 6 $5.39 $8.13 51%
Food & Beverage (BLS Index) 168.35 237 41%
Postage Stamp (First-Class) 7 $0.33 $0.46 39%
Whole Milk (Index) 2 156.9 214.68 37%
Air Travel (R/T Domestic Fare + Ancillary) 8 $316.96 $385 22%
Air Travel (R/T Domestic Fare Only) 8 $314.46 $363 15%
Apparel: Clothing/Footwear/Jewery (BLS Index) 2 129.6 127.41 -2%
Television (BLS Index) 2 49.9 4.6 -91%
0 AllEars.net - based on June of each yer
1 The College Board - based on beginning of academic year
2 U.S. Bureau of Labor Statistics - including hedonic "quality-change' adjustments
3 National Automobile Dealers Association - average retail selling price
4 U.S. Department of Energy - Monthly Energy Review, Table 9.4
5 U.S. Census Bureau - median sales price of new homes sold in the United States, including the land
6 National Association of Theatre Owners
7 U.S. Postal Service - Publication 100
8 A4A via U.S. Bureau of Transportation Statistics - shown on a round-trip basis
9 Team Marketing Report Fan Cost Index, average nonpremium ticket
10 Team Marketing Report Fan Cost Index, average nonpremium ticket
11 NADA DATA 2014

Page: 20
Airline Industry: Market Segment & Competitive Landscape
Source: www.ibisworld.com
Key Points
• Level Concentration in this industry is Medium
• The Domestic Airlines industry has a moderate level of concentration. The top four industry players are estimated to hold a combined market share of more than 66.4% in 2014.
• Level & Trend Competition in this industry is High and the trend is Increasing
• The Domestic Airlines industry is highly competitive. Airlines compete for customers on price, frequency and capacity, route offerings, loyalty programs, promotions, rewards and service quality.
• Barriers to Entry in this industry are High and Steady
• Costs to purchase aircraft and specialist machinery, hangar and other airfield space, as well as costs to attract skilled labor and to comply with stringent safety requirements are high and a significant barrier to industry entry.
• Level & Trend Globalization in this industry is Low and the trend is Increasing
• The Domestic Airlines industry has a low level of globalization, with access to domestic routes strictly controlled for US-based airlines; foreign ownership is discouraged. Foreign operators may provide services to the domestic market, but are generally restricted to limited routes and destinations.
SAMPLE

Page: 21
Hotel Industry: Overview
• 2013 Global Hotel Industry Revenue reached $592 Billion. The US Hotel Industry Revenue reached $144.4 billion in 2013
• In 2014 global hotel revenues are estimated to grow 2 % to $604.5 billion. Over the five years to 2018, IBISWorld forecasts industry revenue will increase at an average annual rate of 2.2% to $661.5 billion.. This will result from growth in business and pleasure travel, and rising room rates.
• Over the five years to 2014, IBISWorld expects industry revenue to grow at an average annual rate of 2.5%. In 2014, industry revenue is expected to jump 2.3%, as consumer confidence and spending spike, raising revenue to $144.4 billion.
• US revenue is projected to increase at an average annual rate of 3.0% to $167.0 billion over the five years to 2019.
• Smith Travel Research is projecting increases in all three key performance metrics during 2014: Occupancy is expected to rise 1.3% to 62.7%, Average Daily Rate (ADR) will increase 4.6% to $116.43 and Revenue Per Available Room (RevPAR) is expected to grow 6.0% to $72.97.
Key Points
Source: www.IBISWorld.com, Smith Travel Research
2013 Global Hotel Industry Revenue reached $592 Billion. The US Hotel Industry Revenue reached $144.4 Billion in 2013.
SAMPLE
Mar
riott
Hilton
Carlso
n
Accor
Starw
ood
Wyn
dham IH
G
$0.00
$2.00
$4.00
$6.00
$8.00
$10.00
$12.00
$14.00
20
13
Glo
ba
l R
ev
en
ue
(in
bil
lio
ns
)
Page: 22
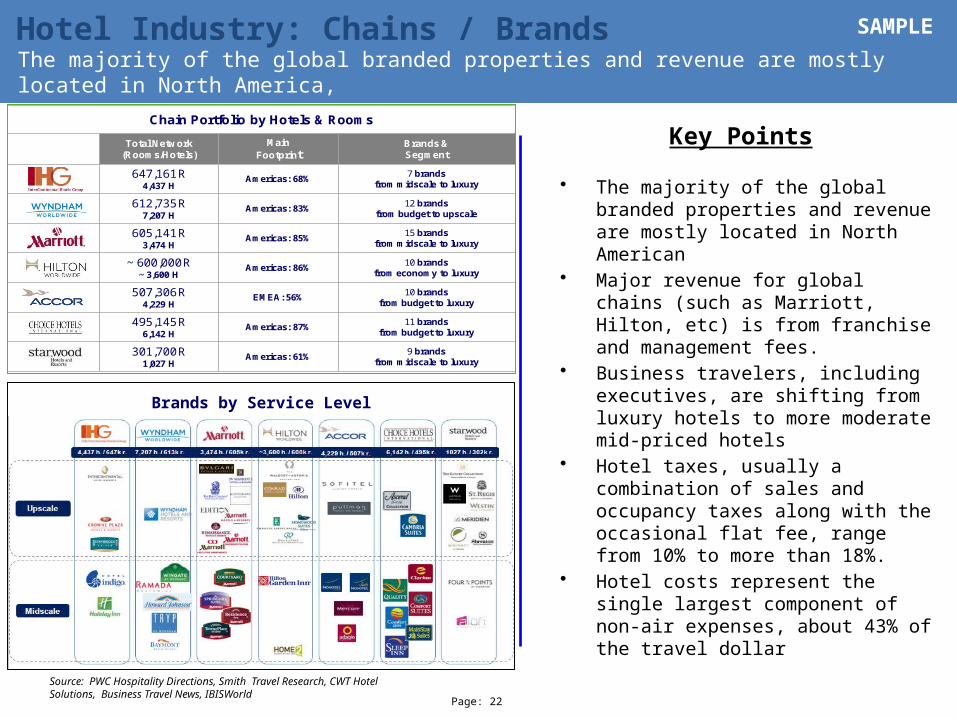
Hotel Industry: Chains / Brands
• The majority of the global branded properties and revenue are mostly located in North American
• Major revenue for global chains (such as Marriott, Hilton, etc) is from franchise and management fees.
• Business travelers, including executives, are shifting from luxury hotels to more moderate mid-priced hotels
• Hotel taxes, usually a combination of sales and occupancy taxes along with the occasional flat fee, range from 10% to more than 18%.
• Hotel costs represent the single largest component of non-air expenses, about 43% of the travel dollar
Key Points
Source: PWC Hospitality Directions, Smith Travel Research, CWT Hotel Solutions, Business Travel News, IBISWorld
The majority of the global branded properties and revenue are mostly located in North America,
SAMPLE
Chain Portfolio by Hotels & Rooms
Total Network(Rooms/Hotels)
MainFootprint
Brands & Segment
647,161 R4,437 H
Americas: 68%7 brands
from midscale to luxury
612,735 R7,207 H
Americas: 83%12 brands
from budget to upscale
605,141 R3,474 H
Americas: 85%15 brands
from midscale to luxury
~ 600,000 R~ 3,600 H
Americas: 86%10 brands
from economy to luxury
507,306 R4,229 H
EMEA: 56%10 brands
from budget to luxury
495,145 R6,142 H
Americas: 87%11 brands
from budget to luxury
301,700 R 1,027 H
Americas: 61%9 brands
from midscale to luxury
Brands by Service Level

Hotel Chain Scales
Chain Scale Brand Name
Luxury
Upper Upscale
Upscale
Midscale
Economy
Ex-Upscale
Ex-Midscale
Ex-Economy
For Domestic Hotel Bookings (2012) :
Total Tracked Spend: $XXM
46% of spend in Upper Upscale. Average Nightly Rate: $XXX
21% of spend in Upscale. Average Nightly Rate: $XXX
Business Travel News: 2014 Corporate Travel Index: $158
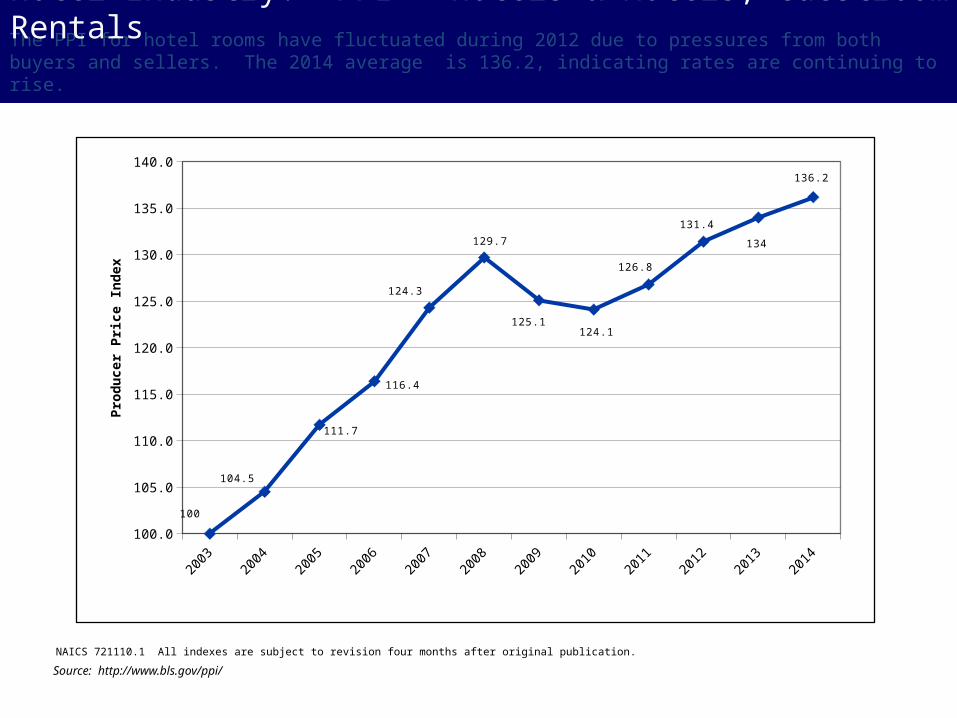
The PPI for hotel rooms have fluctuated during 2012 due to pressures from both buyers and sellers. The 2014 average is 136.2, indicating rates are continuing to rise.
Hotel Industry: PPI – Hotels & Motels, Guestroom Rentals
Source: http://www.bls.gov/ppi/
NAICS 721110.1 All indexes are subject to revision four months after original publication.
2003
2004
2005
2006
2007
2008
2009
2010
2011
2012
2013
2014
100.0
105.0
110.0
115.0
120.0
125.0
130.0
135.0
140.0
100
104.5
111.7
116.4
124.3
129.7
125.1124.1
126.8
131.4
134
136.2
Pro
du
cer
Pri
ce I
nd
ex
Page: 25
Hotel Industry: Cost Drivers
Source: www.IBISWorld.com
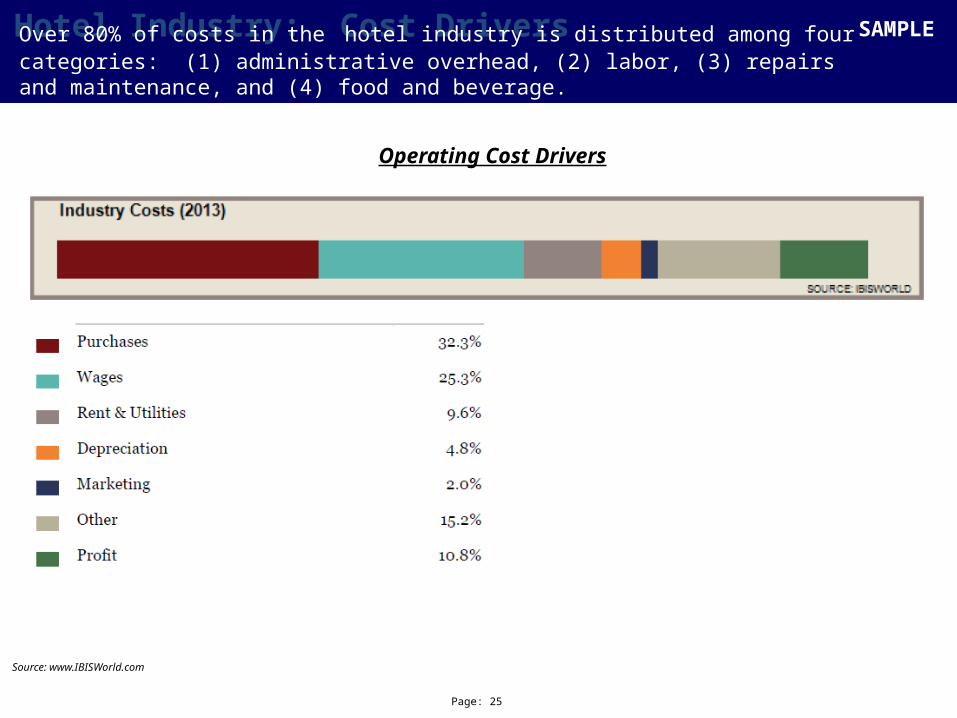
Operating Cost Drivers
Over 80% of costs in the hotel industry is distributed among four categories: (1) administrative overhead, (2) labor, (3) repairs and maintenance, and (4) food and beverage.
SAMPLE
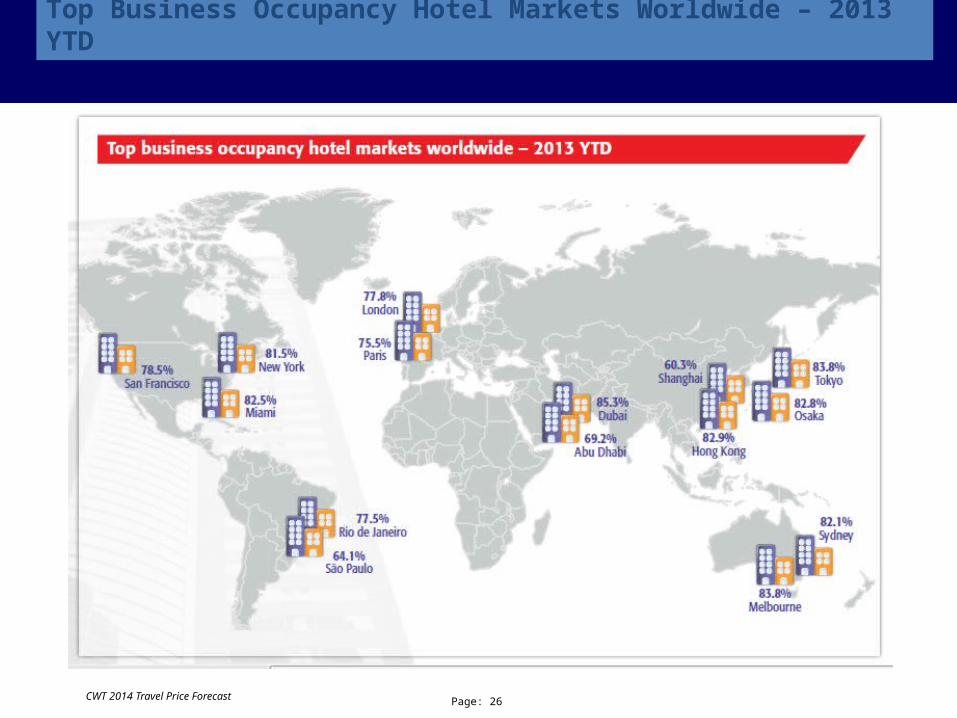
Top Business Occupancy Hotel Markets Worldwide – 2013 YTD
CWT 2014 Travel Price Forecast Page: 26

CWT 2014 Forecast: Airline, Hotel, and Car Rental Pricing
Page: 27
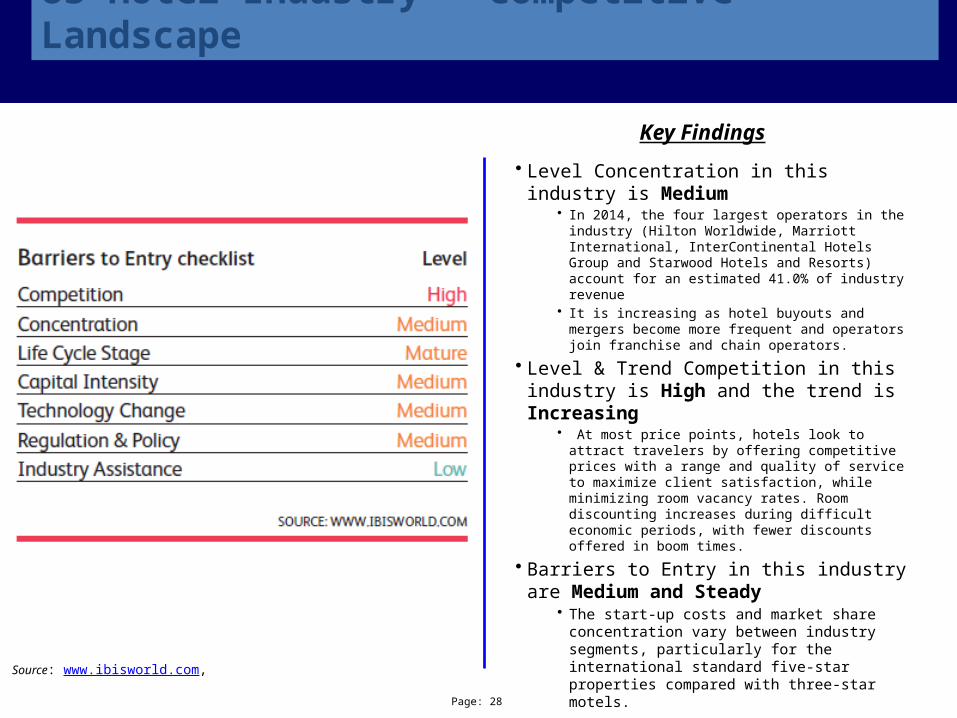
US Hotel Industry – Competitive Landscape
• Level Concentration in this industry is Medium• In 2014, the four largest operators in the industry (Hilton
Worldwide, Marriott International, InterContinental Hotels Group and Starwood Hotels and Resorts) account for an estimated 41.0% of industry revenue
• It is increasing as hotel buyouts and mergers become more frequent and operators join franchise and chain operators.
• Level & Trend Competition in this industry is High and the trend is Increasing
• At most price points, hotels look to attract travelers by offering competitive prices with a range and quality of service to maximize client satisfaction, while minimizing room vacancy rates. Room discounting increases during difficult economic periods, with fewer discounts offered in boom times.
• Barriers to Entry in this industry are Medium and Steady
• The start-up costs and market share concentration vary between industry segments, particularly for the international standard five-star properties compared with three-star motels.
• Globalization in this industry is Medium and the trend is Increasing
• Most operators in this industry are US-owned and earn most of their sales from domestic activity.
Page: 28
Key Findings
Source: www.ibisworld.com,
Page: 29
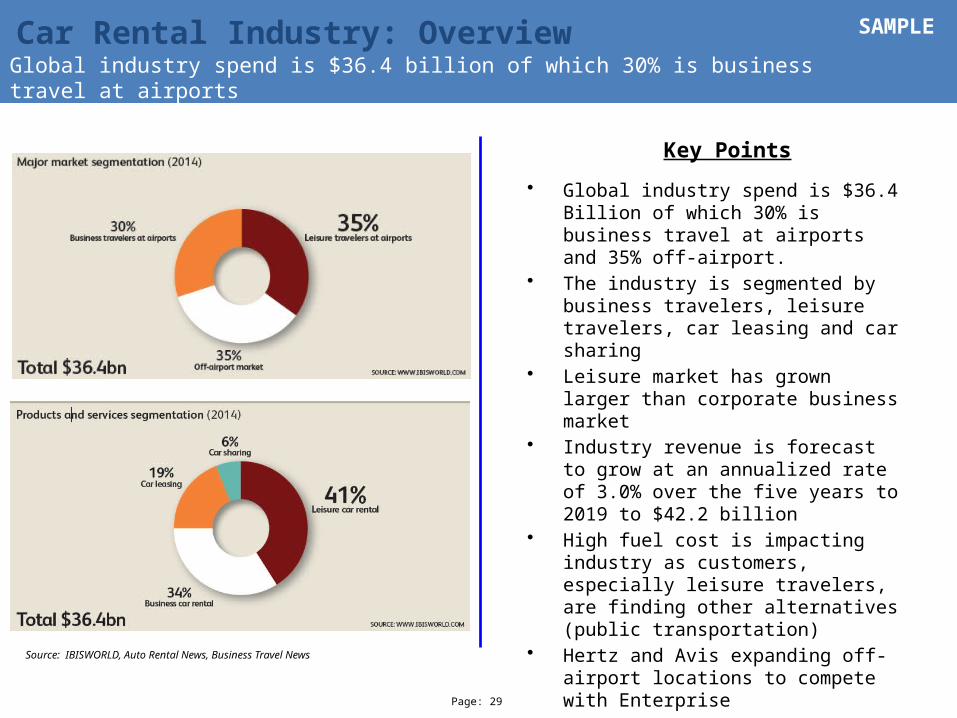
Car Rental Industry: Overview
• Global industry spend is $36.4 Billion of which 30% is business travel at airports and 35% off-airport.
• The industry is segmented by business travelers, leisure travelers, car leasing and car sharing
• Leisure market has grown larger than corporate business market
• Industry revenue is forecast to grow at an annualized rate of 3.0% over the five years to 2019 to $42.2 billion
• High fuel cost is impacting industry as customers, especially leisure travelers, are finding other alternatives (public transportation)
• Hertz and Avis expanding off-airport locations to compete with Enterprise
• Car rental industry adjusted to global recession better than other travel industry categories. They can “right” size fleet to meet demand by disposing vehicles quickly and reduce costs.
Key Points
Source: IBISWORLD, Auto Rental News, Business Travel News
Global industry spend is $36.4 billion of which 30% is business travel at airports
SAMPLE
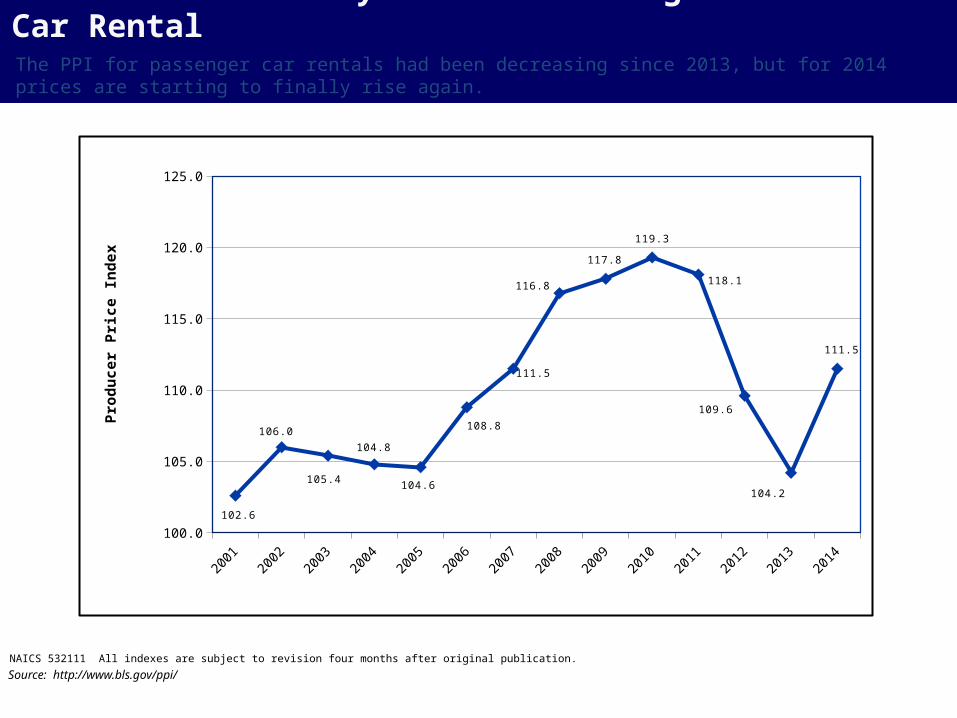
Rental Car Industry: PPI – Passenger Car Rental
NAICS 532111 All indexes are subject to revision four months after original publication.
Source: http://www.bls.gov/ppi/
The PPI for passenger car rentals had been decreasing since 2013, but for 2014 prices are starting to finally rise again.
2001
2002
2003
2004
2005
2006
2007
2008
2009
2010
2011
2012
2013
2014
100.0
105.0
110.0
115.0
120.0
125.0
102.6
106.0
105.4
104.8
104.6
108.8
111.5
116.8
117.8
119.3
118.1
109.6
104.2
111.5
Pro
du
cer
Pri
ce In
dex

Page: 31
Car Rental Industry: Market Share
• After Hertz’s purchase of Dollar Thrifty, the top three rental car companies will make up 95% of the total on-airport US car rental industry revenues
• Suppliers offer different brands that focus on specialized markets:
• Corporate Traveler – On-airport convenience – Hertz, Avis and National
• Leisure Market – On/Off-airport Budget, Dollar Thrifty, and Enterprise
• Additional Non-US regional players include:• Europcar (Europe and Asia Pacific) • Sixt (Germany and EMEA) • In high risk countries such as India, China, Thailand, Latin
America, etc. the business model is to rent a car with driver. Cost is less than a chauffer / limo as a typical rental vehicle is used
• Car rental companies have implemented a variety of new ancillary fees to help preserve some of the lost revenue in recent times, such as tacking on fees to extend a reservation, eliminating 60 minute grace period, or increasing the cost of a two-day rental
• “Virtual rental technology” – enables customers to reserve, rent, access and return cars just about anywhere. ZipCar, WeCar, Connect.
• It is forecasted that that base rates will increase on average between 0% to 2% for business travel rental cars in the U.S. for 2014. This is big news since US suppliers haven’t been able to increase rates, even slightly. This is due to increasing fleet costs for car rental providers, as their used vehicles sell for less than in recent years as consumers shift toward buying more new and fewer used vehicles. Even so, the highly consolidated market will retain strong competition among suppliers in 2014.
• Business Travel News 2014 Corporate Travel Index: $47
Key Points
Source: www.autorentalnews.com; www.ibisworld.com, Business Travel News, 2014 Corporate Travel Index
The U.S. car rental market is highly consolidated among a small number of major players and is getting smaller.
SAMPLE
Top 3 Car Rental Companies By Revenue
Enterprise Hertz Avis Budget
$1.00
$3.00
$5.00
$7.00
$9.00
$11.00
$13.00
$11.90
$6.30
$5.20
20
13
Re
ven
ue
(in
Bill
ion
s)
Global Market Share
Page: 32
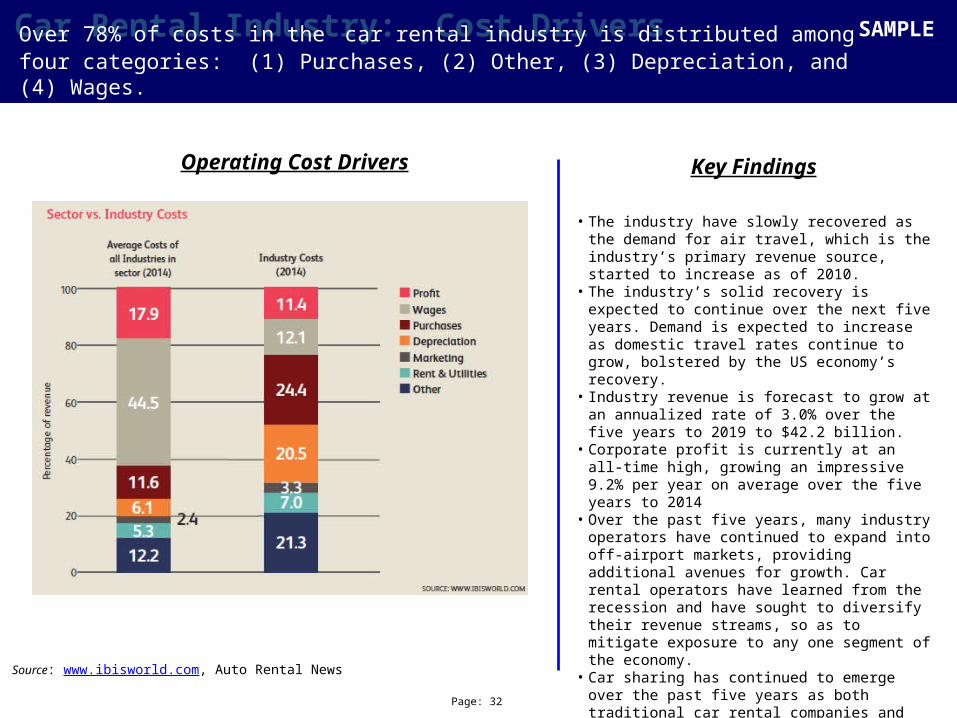
Car Rental Industry: Cost Drivers
Source: www.ibisworld.com, Auto Rental News
Operating Cost Drivers Key Findings
• The industry have slowly recovered as the demand for air travel, which is the industry’s primary revenue source, started to increase as of 2010.
• The industry’s solid recovery is expected to continue over the next five years. Demand is expected to increase as domestic travel rates continue to grow, bolstered by the US economy’s recovery.
• Industry revenue is forecast to grow at an annualized rate of 3.0% over the five years to 2019 to $42.2 billion.
• Corporate profit is currently at an all-time high, growing an impressive 9.2% per year on average over the five years to 2014
• Over the past five years, many industry operators have continued to expand into off-airport markets, providing additional avenues for growth. Car rental operators have learned from the recession and have sought to diversify their revenue streams, so as to mitigate exposure to any one segment of the economy.
• Car sharing has continued to emerge over the past five years as both traditional car rental companies and new players seek to gain market share in this new segment of the industry. Each of the major car rental companies now has a car sharing division.
Over 78% of costs in the car rental industry is distributed among four categories: (1) Purchases, (2) Other, (3) Depreciation, and (4) Wages.
SAMPLE
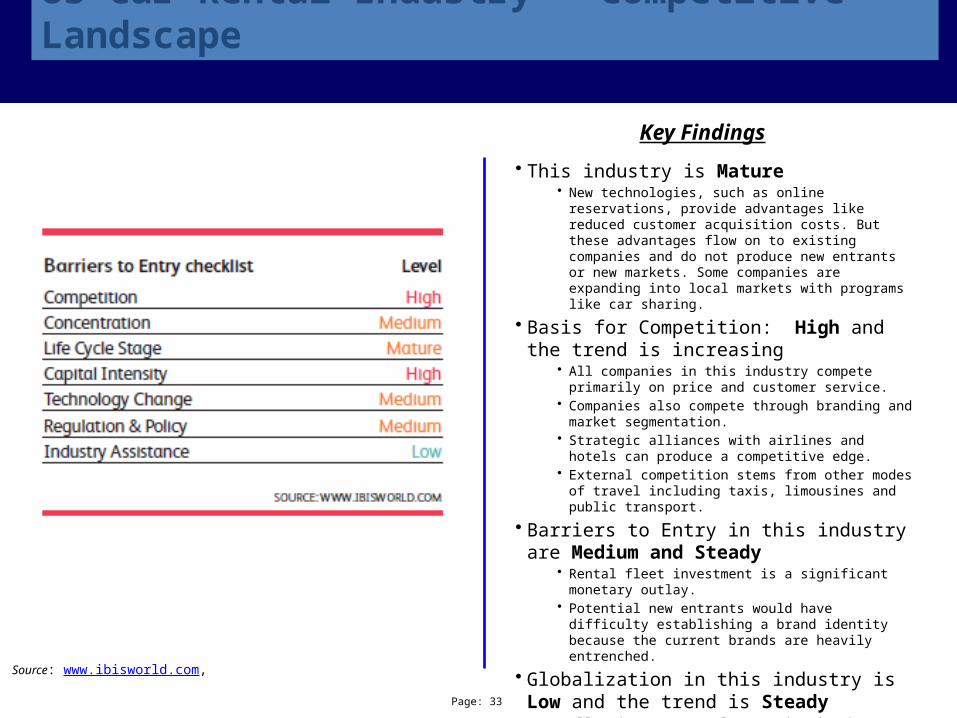
US Car Rental Industry – Competitive Landscape
• This industry is Mature• New technologies, such as online reservations, provide
advantages like reduced customer acquisition costs. But these advantages flow on to existing companies and do not produce new entrants or new markets. Some companies are expanding into local markets with programs like car sharing.
• Basis for Competition: High and the trend is increasing
• All companies in this industry compete primarily on price and customer service.
• Companies also compete through branding and market segmentation.
• Strategic alliances with airlines and hotels can produce a competitive edge.
• External competition stems from other modes of travel including taxis, limousines and public transport.
• Barriers to Entry in this industry are Medium and Steady
• Rental fleet investment is a significant monetary outlay.• Potential new entrants would have difficulty establishing a
brand identity because the current brands are heavily entrenched.
• Globalization in this industry is Low and the trend is Steady
• All major car rental companies in the United States are domestically owned; however, US car rental companies operate globally either through direct ownership or through license and franchise agreements.
Page: 33
Key Findings
Source: www.ibisworld.com,
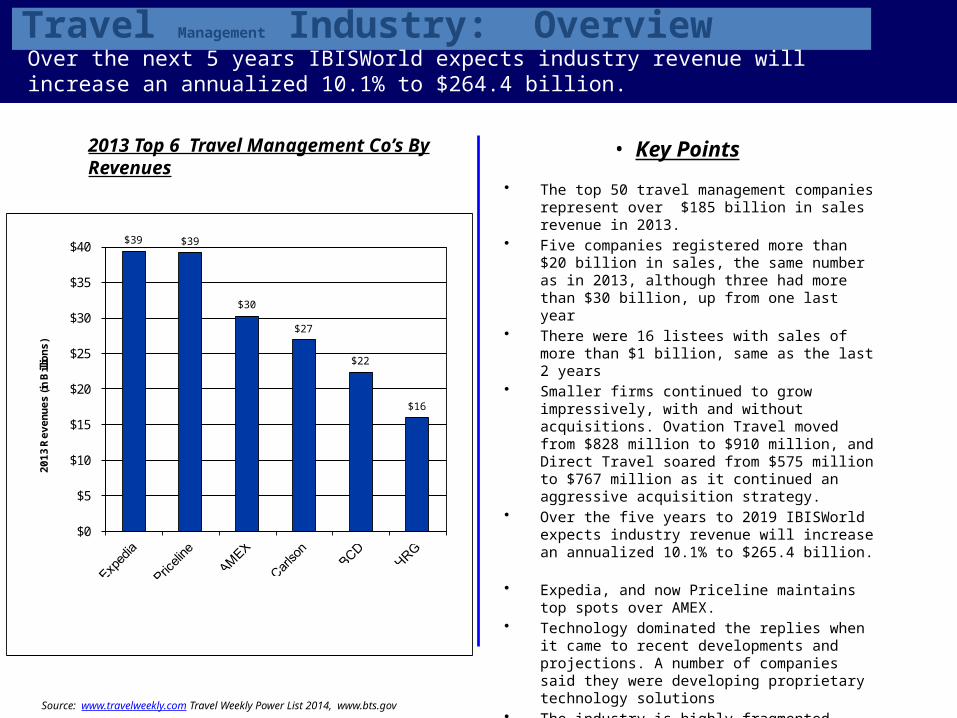
Travel Management Industry: Overview
• The top 50 travel management companies represent over $185 billion in sales revenue in 2013.
• Five companies registered more than $20 billion in sales, the same number as in 2013, although three had more than $30 billion, up from one last year
• There were 16 listees with sales of more than $1 billion, same as the last 2 years
• Smaller firms continued to grow impressively, with and without acquisitions. Ovation Travel moved from $828 million to $910 million, and Direct Travel soared from $575 million to $767 million as it continued an aggressive acquisition strategy.
• Over the five years to 2019 IBISWorld expects industry revenue will increase an annualized 10.1% to $265.4 billion.
• Expedia, and now Priceline maintains top spots over AMEX.
• Technology dominated the replies when it came to recent developments and projections. A number of companies said they were developing proprietary technology solutions
• The industry is highly fragmented, with the top four industry players accounting for less than 30.0% of the industry's market share.
• Travel Agency profit margins are low, reflecting a high level of competition in the industry.
2013 Top 6 Travel Management Co’s By Revenues
• Key Points
Source: www.travelweekly.com Travel Weekly Power List 2014, www.bts.gov
Over the next 5 years IBISWorld expects industry revenue will increase an annualized 10.1% to $264.4 billion.
$39 $39
$30
$27
$22
$16
$0
$5
$10
$15
$20
$25
$30
$35
$40
20
13
Re
ve
nu
es
(in
Bill
ion
s)

Page: 35
Global TMC Industry: Overview
• Leisure travel is the largest market for the industry. This market is made up of travelers taking both domestic and international trips. The total number of international tourism departures is expected to have exceeded 1 billion in 2014. The top three countries for departures are Germany, the United States and China. Many travelers going overseas still use travel agency services for part or all of their trip components, such as accommodations and airline bookings. However, in mature markets such as the United States travelers are increasingly likely to use online services to book their domestic trip, or make arrangements directly with hotels and airlines.
Key Points
Source: IBISWORLD,
Global industry spend is $36.4 billion of which 30% is business travel at airports
SAMPLE
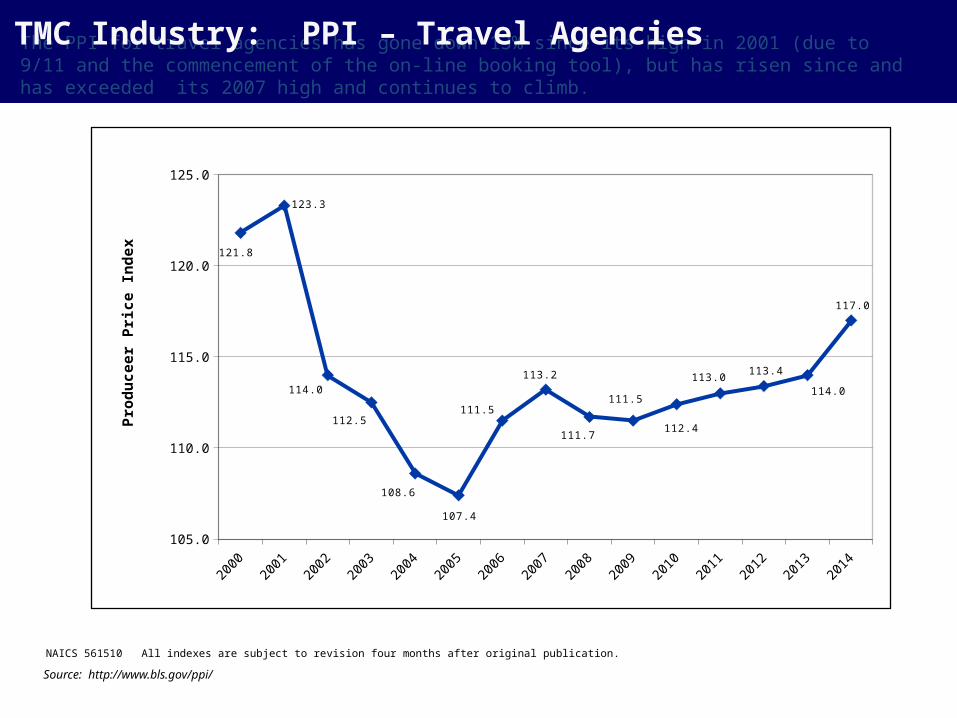
The PPI for travel agencies has gone down 13% since its high in 2001 (due to 9/11 and the commencement of the on-line booking tool), but has risen since and has exceeded its 2007 high and continues to climb.
TMC Industry: PPI – Travel Agencies
NAICS 561510 All indexes are subject to revision four months after original publication.
Source: http://www.bls.gov/ppi/
2000
2001
2002
2003
2004
2005
2006
2007
2008
2009
2010
2011
2012
2013
2014
105.0
110.0
115.0
120.0
125.0
121.8
123.3
114.0
112.5
108.6
107.4
111.5
113.2
111.7
111.5
112.4
113.0113.4
114.0
117.0
Pro
du
ceer
Pri
ce In
dex

Page: 37
Global Travel Agency: Cost Drivers
Source: www.ibisworld.com
Operating Cost Drivers
Over 90% of costs in the car rental industry is distributed among four categories: (1) Purchases, (2) Other, (3) Depreciation, and (4) Wages.
SAMPLE
fix

CWT Additional 2014 Perspective
Page: 38
Business Travel News – 2014 Corporate Travel Index: Food $88 per day
Page: 39
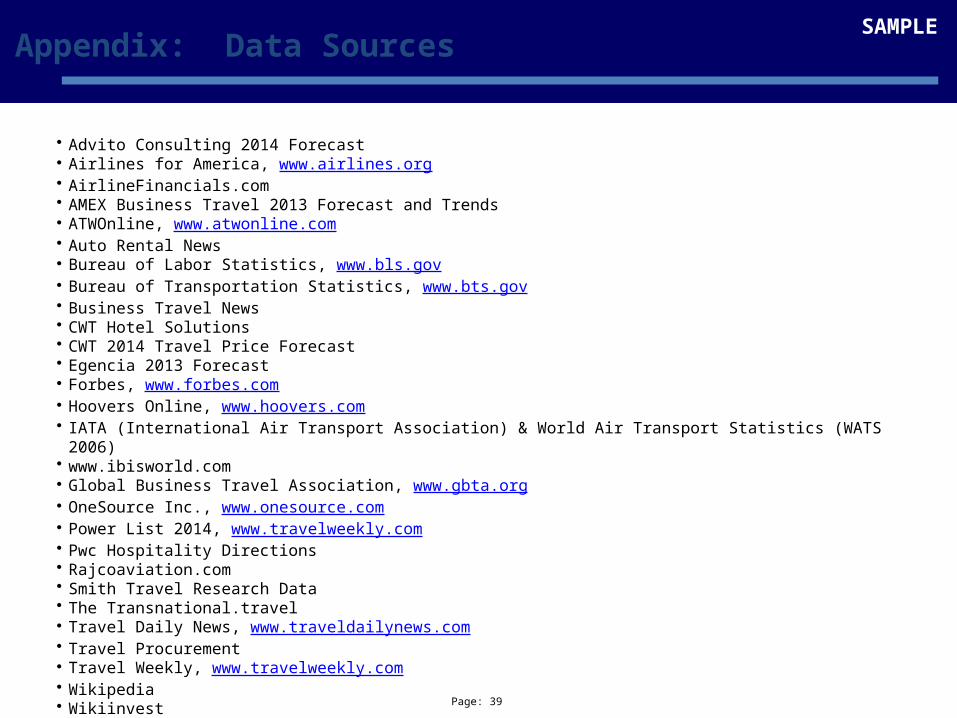
• Advito Consulting 2014 Forecast• Airlines for America, www.airlines.org• AirlineFinancials.com• AMEX Business Travel 2013 Forecast and Trends• ATWOnline, www.atwonline.com• Auto Rental News• Bureau of Labor Statistics, www.bls.gov• Bureau of Transportation Statistics, www.bts.gov• Business Travel News• CWT Hotel Solutions• CWT 2014 Travel Price Forecast• Egencia 2013 Forecast• Forbes, www.forbes.com• Hoovers Online, www.hoovers.com• IATA (International Air Transport Association) & World Air Transport Statistics (WATS 2006)• www.ibisworld.com• Global Business Travel Association, www.gbta.org• OneSource Inc., www.onesource.com• Power List 2014, www.travelweekly.com• Pwc Hospitality Directions• Rajcoaviation.com• Smith Travel Research Data• The Transnational.travel• Travel Daily News, www.traveldailynews.com• Travel Procurement• Travel Weekly, www.travelweekly.com• Wikipedia• Wikiinvest
Appendix: Data SourcesSAMPLE

Page: 40
Strategic Sourcing Process Overview
ProfileCategoryInternally &Externally
CreateSelectionFactors &EvaluateSuppliers
Negotiate & Develop Sourcing
Recommen-dation
ImplementAgreements
Strategic Sourcing Methodology
Act
ivit
ies
Del
iver
able
s o
r To
ols
Develop Sourcing
Objectives
Sourcing Strategy Plan: Competitive
Supplier Selection or
Existing Supplier
Development
Develop SourcingStrategy
Conduct Competitive Exercise w/ ApprovedSuppliers
Develop Sourcing
Strategies & Tactics
ANALYSIS STRATEGY SUPPLIER SELECTION IMPLEMENTATION
AssessOpportunity & Establish Team
Page: 41
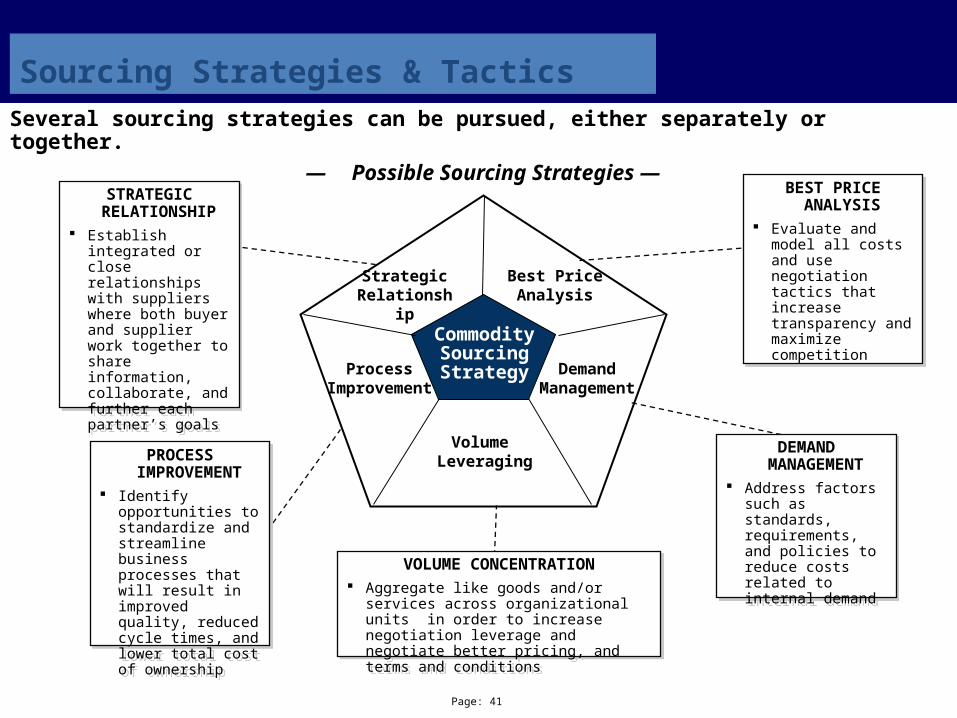
Sourcing Strategies & TacticsSeveral sourcing strategies can be pursued, either separately or together.
— Possible Sourcing Strategies —
Best PriceAnalysis
Volume Leveraging
Strategic Relationship
ProcessImprovement
DemandManagement
CommoditySourcingStrategy
STRATEGIC RELATIONSHIP
Establish integrated or close relationships with suppliers where both buyer and supplier work together to share information, collaborate, and further each partner’s goals
STRATEGIC RELATIONSHIP
Establish integrated or close relationships with suppliers where both buyer and supplier work together to share information, collaborate, and further each partner’s goals
PROCESS IMPROVEMENT
Identify opportunities to standardize and streamline business processes that will result in improved quality, reduced cycle times, and lower total cost of ownership
PROCESS IMPROVEMENT
Identify opportunities to standardize and streamline business processes that will result in improved quality, reduced cycle times, and lower total cost of ownership
BEST PRICE ANALYSIS
Evaluate and model all costs and use negotiation tactics that increase transparency and maximize competition
BEST PRICE ANALYSIS
Evaluate and model all costs and use negotiation tactics that increase transparency and maximize competition
DEMAND MANAGEMENT
Address factors such as standards, requirements, and policies to reduce costs related to internal demand
DEMAND MANAGEMENT
Address factors such as standards, requirements, and policies to reduce costs related to internal demandVOLUME CONCENTRATION
Aggregate like goods and/or services across organizational units in order to increase negotiation leverage and negotiate better pricing, and terms and conditions
VOLUME CONCENTRATION Aggregate like goods and/or services
across organizational units in order to increase negotiation leverage and negotiate better pricing, and terms and conditions
Page: 42
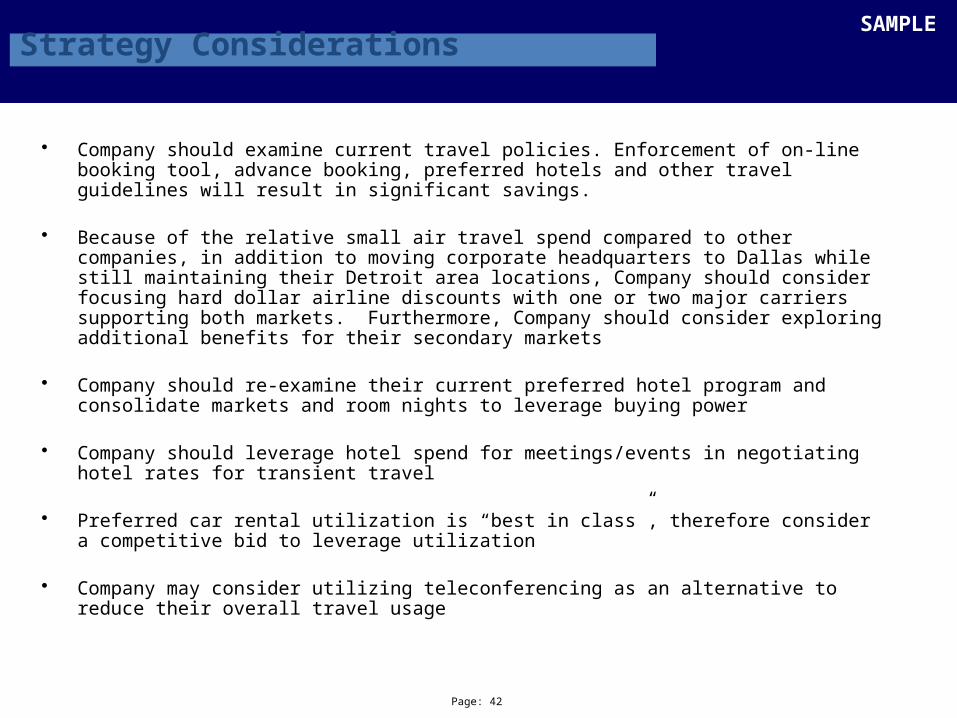
Strategy Considerations
• Company should examine current travel policies. Enforcement of on-line booking tool, advance booking, preferred hotels and other travel guidelines will result in significant savings.
• Because of the relative small air travel spend compared to other companies, in addition to moving corporate headquarters to Dallas while still maintaining their Detroit area locations, Company should consider focusing hard dollar airline discounts with one or two major carriers supporting both markets. Furthermore, Company should consider exploring additional benefits for their secondary markets
• Company should re-examine their current preferred hotel program and consolidate markets and room nights to leverage buying power
• Company should leverage hotel spend for meetings/events in negotiating hotel rates for transient travel
• Preferred car rental utilization is “best in class”, therefore consider a competitive bid to leverage utilization
• Company may consider utilizing teleconferencing as an alternative to reduce their overall travel usage
SAMPLE
Page: 43
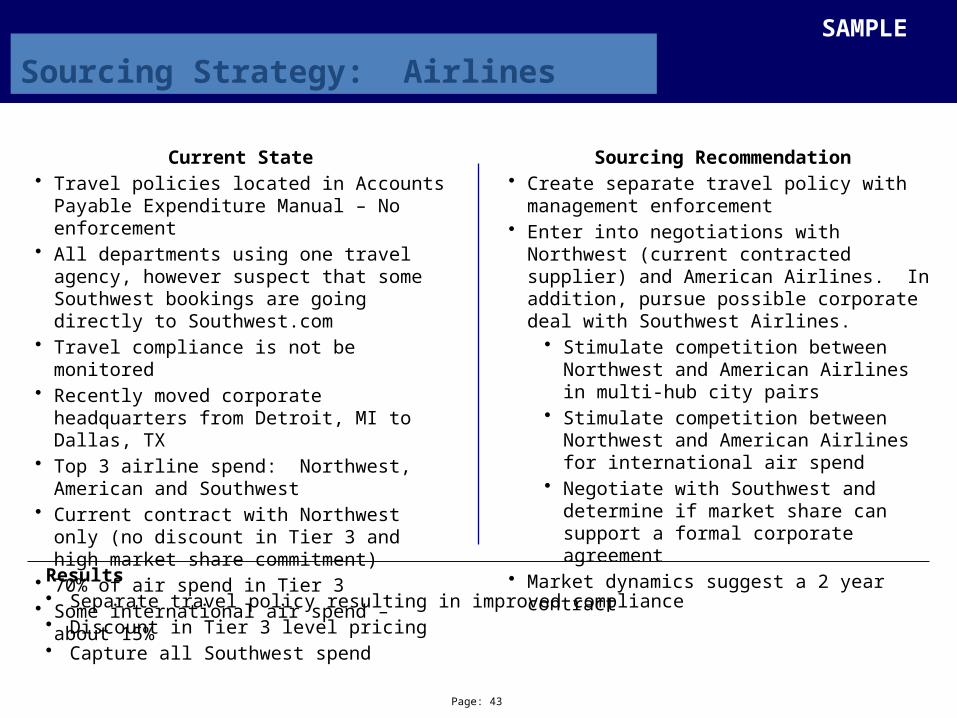
Sourcing Strategy: Airlines
Current State• Travel policies located in Accounts Payable
Expenditure Manual – No enforcement• All departments using one travel agency,
however suspect that some Southwest bookings are going directly to Southwest.com
• Travel compliance is not be monitored• Recently moved corporate headquarters from
Detroit, MI to Dallas, TX• Top 3 airline spend: Northwest, American and
Southwest• Current contract with Northwest only (no
discount in Tier 3 and high market share commitment)
• 70% of air spend in Tier 3• Some international air spend – about 15%
Sourcing Recommendation• Create separate travel policy with management
enforcement• Enter into negotiations with Northwest (current
contracted supplier) and American Airlines. In addition, pursue possible corporate deal with Southwest Airlines.
• Stimulate competition between Northwest and American Airlines in multi-hub city pairs
• Stimulate competition between Northwest and American Airlines for international air spend
• Negotiate with Southwest and determine if market share can support a formal corporate agreement
• Market dynamics suggest a 2 year contract
Results• Separate travel policy resulting in improved compliance• Discount in Tier 3 level pricing• Capture all Southwest spend
SAMPLE
Page: 44
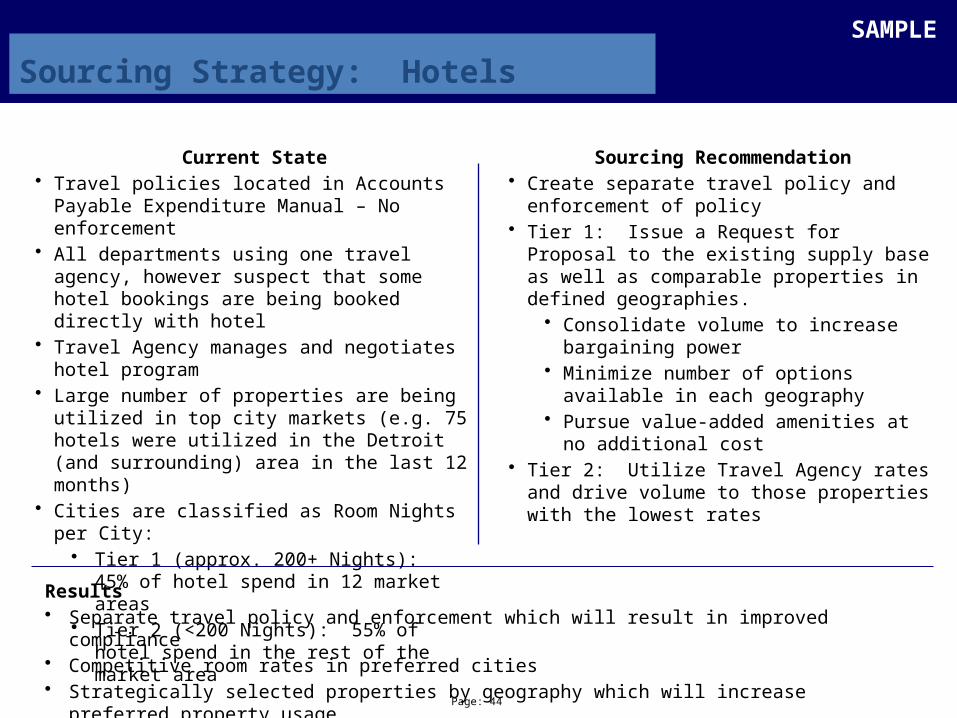
Sourcing Strategy: Hotels
Current State• Travel policies located in Accounts Payable
Expenditure Manual – No enforcement• All departments using one travel agency, however
suspect that some hotel bookings are being booked directly with hotel
• Travel Agency manages and negotiates hotel program
• Large number of properties are being utilized in top city markets (e.g. 75 hotels were utilized in the Detroit (and surrounding) area in the last 12 months)
• Cities are classified as Room Nights per City:• Tier 1 (approx. 200+ Nights): 45% of hotel
spend in 12 market areas• Tier 2 (<200 Nights): 55% of hotel spend in
the rest of the market area
Sourcing Recommendation• Create separate travel policy and enforcement of
policy • Tier 1: Issue a Request for Proposal to the
existing supply base as well as comparable properties in defined geographies.
• Consolidate volume to increase bargaining power
• Minimize number of options available in each geography
• Pursue value-added amenities at no additional cost
• Tier 2: Utilize Travel Agency rates and drive volume to those properties with the lowest rates
Results• Separate travel policy and enforcement which will result in improved compliance• Competitive room rates in preferred cities• Strategically selected properties by geography which will increase preferred property usage
SAMPLE
Page: 45
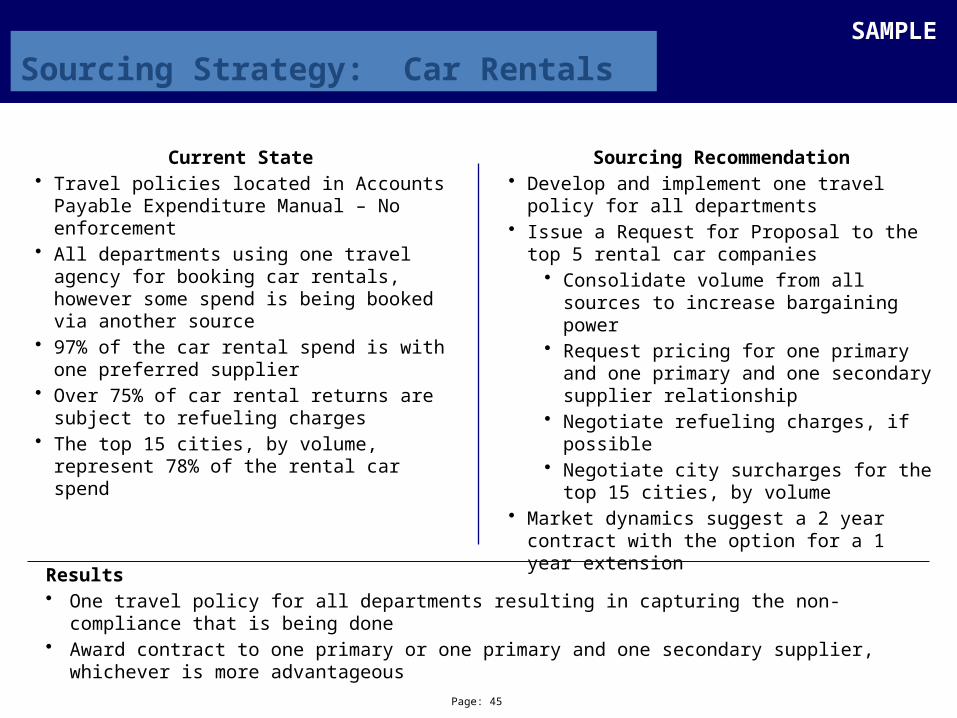
Sourcing Strategy: Car Rentals
Current State• Travel policies located in Accounts Payable
Expenditure Manual – No enforcement• All departments using one travel agency for
booking car rentals, however some spend is being booked via another source
• 97% of the car rental spend is with one preferred supplier
• Over 75% of car rental returns are subject to refueling charges
• The top 15 cities, by volume, represent 78% of the rental car spend
Sourcing Recommendation• Develop and implement one travel policy for all
departments• Issue a Request for Proposal to the top 5 rental
car companies• Consolidate volume from all sources to
increase bargaining power• Request pricing for one primary and one
primary and one secondary supplier relationship
• Negotiate refueling charges, if possible• Negotiate city surcharges for the top 15
cities, by volume• Market dynamics suggest a 2 year contract with
the option for a 1 year extension
Results• One travel policy for all departments resulting in capturing the non-compliance that is being done• Award contract to one primary or one primary and one secondary supplier, whichever is more
advantageous
SAMPLE
Page: 46
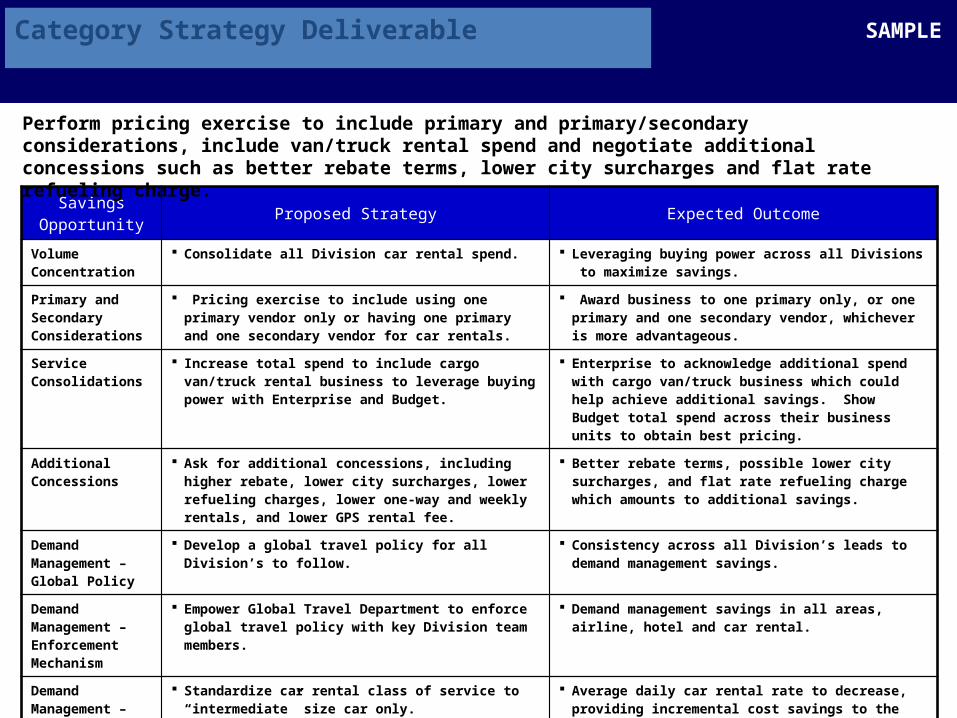
Savings Opportunity
Proposed Strategy Expected Outcome
Volume Concentration
Consolidate all Division car rental spend. Leveraging buying power across all Divisions to maximize savings.
Primary and Secondary Considerations
Pricing exercise to include using one primary vendor only or having one primary and one secondary vendor for car rentals.
Award business to one primary only, or one primary and one secondary vendor, whichever is more advantageous.
Service Consolidations
Increase total spend to include cargo van/truck rental business to leverage buying power with Enterprise and Budget.
Enterprise to acknowledge additional spend with cargo van/truck business which could help achieve additional savings. Show Budget total spend across their business units to obtain best pricing.
Additional Concessions
Ask for additional concessions, including higher rebate, lower city surcharges, lower refueling charges, lower one-way and weekly rentals, and lower GPS rental fee.
Better rebate terms, possible lower city surcharges, and flat rate refueling charge which amounts to additional savings.
Demand Management – Global Policy
Develop a global travel policy for all Division’s to follow. Consistency across all Division’s leads to demand management savings.
Demand Management – Enforcement Mechanism
Empower Global Travel Department to enforce global travel policy with key Division team members.
Demand management savings in all areas, airline, hotel and car rental.
Demand Management – Class of Service Standardization
Standardize car rental class of service to “intermediate” size car only.
Average daily car rental rate to decrease, providing incremental cost savings to the program.
Category Strategy Deliverable
Perform pricing exercise to include primary and primary/secondary considerations, include van/truck rental spend and negotiate additional concessions such as better rebate terms, lower city surcharges and flat rate refueling charge.
SAMPLE
Page: 47
Strategic Sourcing Process Overview
ProfileCategoryInternally &Externally
CreateSelectionFactors &EvaluateSuppliers
Negotiate & Develop Sourcing
Recommen-dation
ImplementAgreements
Strategic Sourcing Methodology
Act
ivit
ies
Del
iver
able
s o
r To
ols
Conduct Supplier Analysis
Create Supplier Selection Criteria
Supplier Selection
Decision Matrix
RFIs (optional)
“Short List” of Suppliers
Develop SourcingStrategy
Conduct Competitive Exercise w/ ApprovedSuppliers
ANALYSIS STRATEGY SUPPLIER SELECTION IMPLEMENTATION
AssessOpportunity & Establish Team
Page: 48
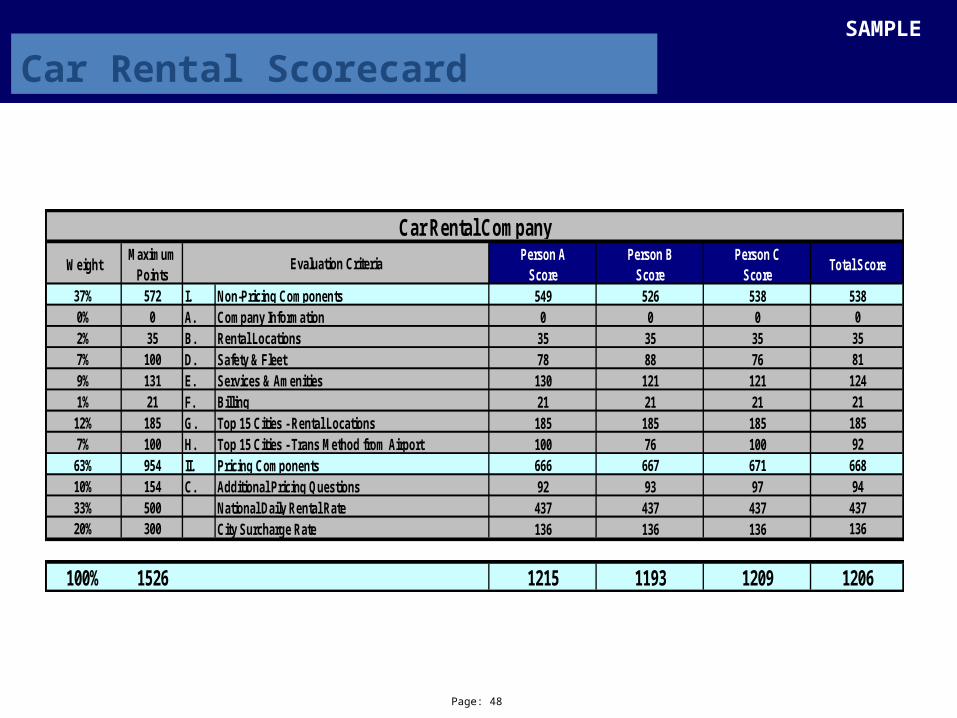
Car Rental Scorecard
WeightMaximum
PointsPerson A
ScorePerson B
ScorePerson C
ScoreTotal Score
37% 572 I. Non-Pricing Components 549 526 538 5380% 0 A. Company Information 0 0 0 02% 35 B. Rental Locations 35 35 35 357% 100 D. Safety & Fleet 78 88 76 819% 131 E. Services & Amenities 130 121 121 1241% 21 F. Billing 21 21 21 21
12% 185 G. Top 15 Cities - Rental Locations 185 185 185 1857% 100 H. Top 15 Cities - Trans Method from Airport 100 76 100 92
63% 954 II. Pricing Components 666 667 671 66810% 154 C. Additional Pricing Questions 92 93 97 9433% 500 National Daily Rental Rate 437 437 437 43720% 300 City Surcharge Rate 136 136 136 136
100% 1526 1215 1193 1209 1206
Car Rental Company
Evaluation Criteria
SAMPLE
Page: 49
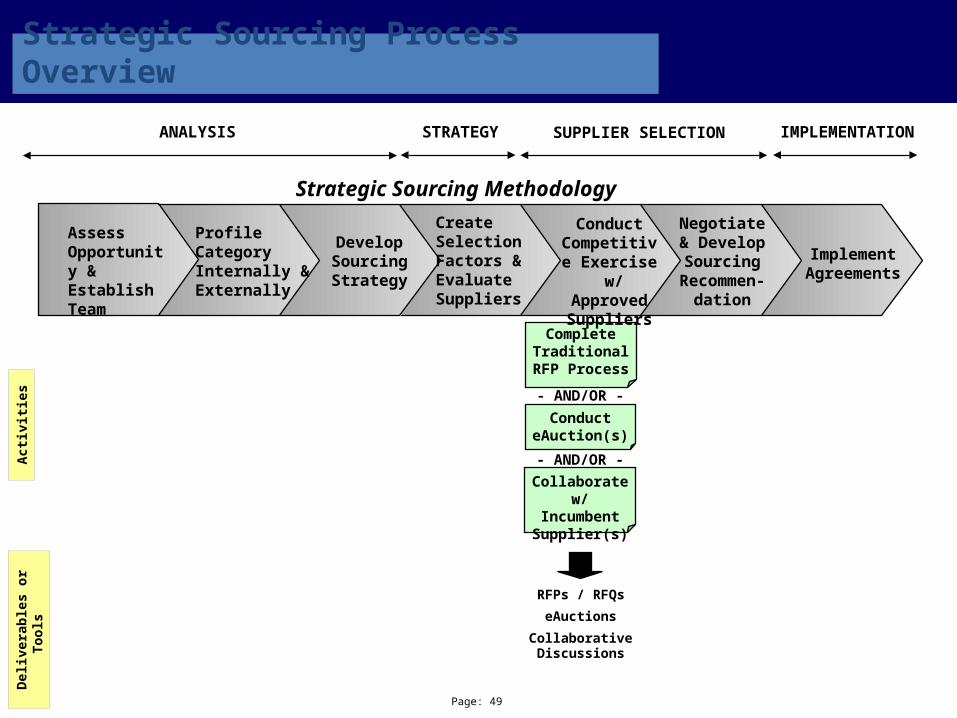
Strategic Sourcing Process Overview
ProfileCategoryInternally &Externally
CreateSelectionFactors &EvaluateSuppliers
Negotiate & Develop Sourcing
Recommen-dation
ImplementAgreements
Strategic Sourcing Methodology
Act
ivit
ies
Del
iver
able
s o
r To
ols
Complete Traditional
RFP Process
RFPs / RFQs
eAuctions
Collaborative Discussions
Conduct eAuction(s)
Collaborate w/ Incumbent Supplier(s)
- AND/OR -
- AND/OR -
Develop SourcingStrategy
Conduct Competitive Exercise w/ ApprovedSuppliers
ANALYSIS STRATEGY SUPPLIER SELECTION IMPLEMENTATION
AssessOpportunity & Establish Team
Page: 50
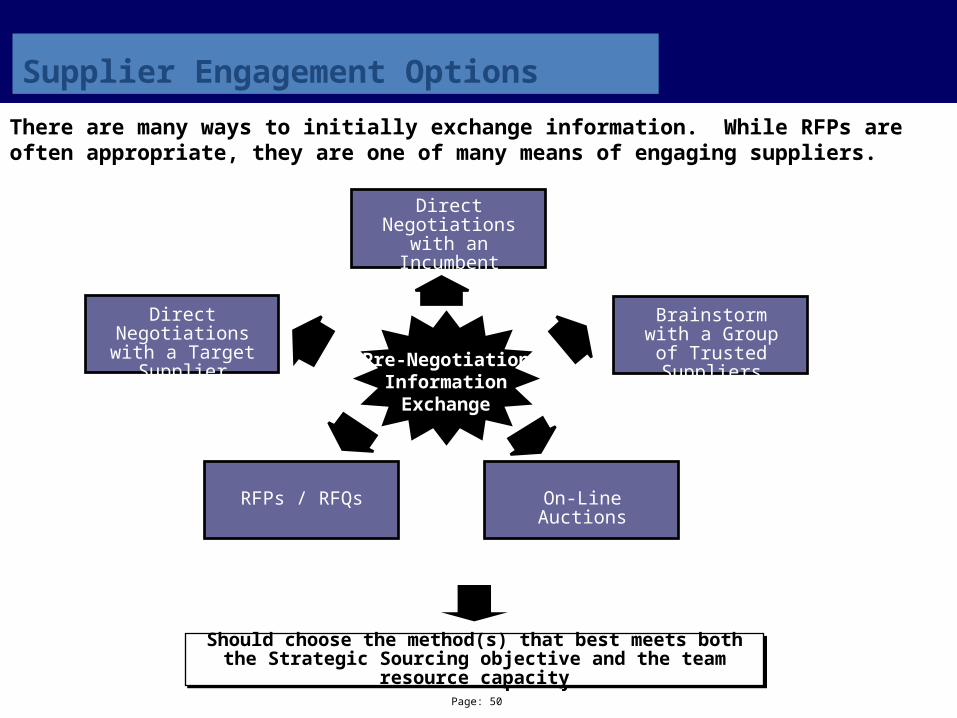
Supplier Engagement Options
There are many ways to initially exchange information. While RFPs are often appropriate, they are one of many means of engaging suppliers.
Pre-NegotiationInformationExchange
Direct Negotiations with
an Incumbent Supplier
Direct Negotiations with a Target Supplier
Brainstorm with a Group of Trusted
Suppliers
On-Line AuctionsRFPs / RFQs
Should choose the method(s) that best meets both the Strategic Sourcing objective and the team
resource capacity
Should choose the method(s) that best meets both the Strategic Sourcing objective and the team
resource capacity

Page: 51
Strategic Sourcing Process Overview
ProfileCategoryInternally &Externally
CreateSelectionFactors &EvaluateSuppliers
Negotiate & Develop Sourcing
Recommen-dation
ImplementAgreements
Strategic Sourcing Methodology
Act
ivit
ies
Del
iver
able
s o
r To
ols
Prepare Fact-Based
Negotiation Packages
Negotiate Agreements
Fact-Based Negotiation Packages
Supplier Negotiations Presentation
Sourcing Recommendation
Develop SourcingStrategy
Conduct Competitive Exercise w/ ApprovedSuppliers
ANALYSIS STRATEGY SUPPLIER SELECTION IMPLEMENTATION
AssessOpportunity & Establish Team
Page: 52
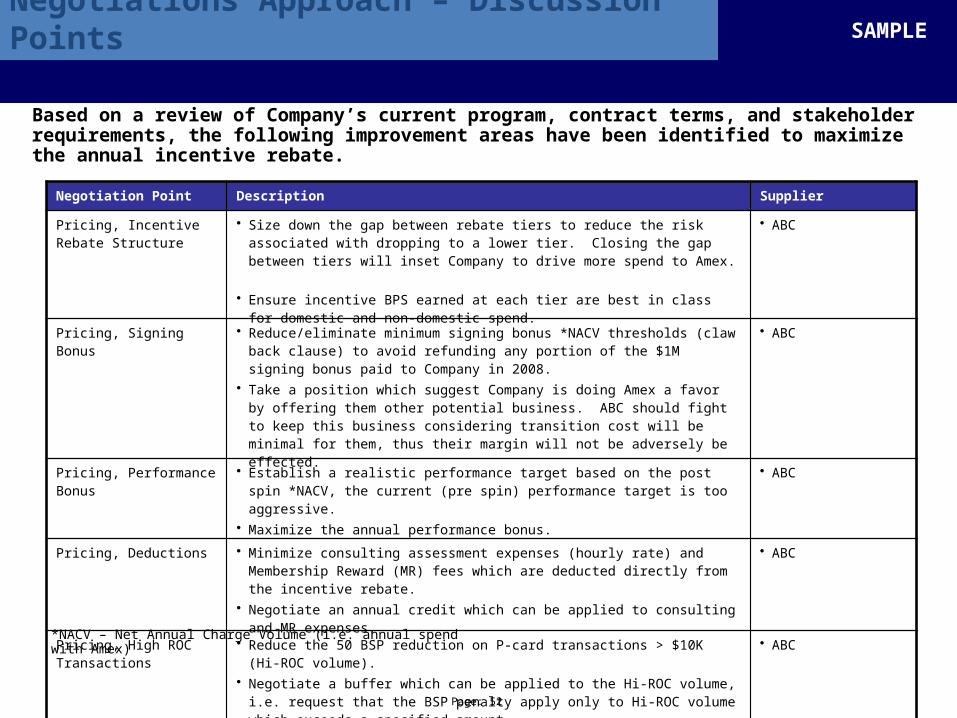
Negotiations Approach – Discussion Points
Based on a review of Company’s current program, contract terms, and stakeholder requirements, the following improvement areas have been identified to maximize the annual incentive rebate.
Negotiation Point Description Supplier
Pricing, Incentive Rebate Structure
• Size down the gap between rebate tiers to reduce the risk associated with dropping to a lower tier. Closing the gap between tiers will inset Company to drive more spend to Amex.
• Ensure incentive BPS earned at each tier are best in class for domestic and non-domestic spend.
• ABC
Pricing, Signing Bonus • Reduce/eliminate minimum signing bonus *NACV thresholds (claw back clause) to avoid refunding any portion of the $1M signing bonus paid to Company in 2008.
• Take a position which suggest Company is doing Amex a favor by offering them other potential business. ABC should fight to keep this business considering transition cost will be minimal for them, thus their margin will not be adversely be effected.
• ABC
Pricing, Performance Bonus
• Establish a realistic performance target based on the post spin *NACV, the current (pre spin) performance target is too aggressive.
• Maximize the annual performance bonus.
• ABC
Pricing, Deductions • Minimize consulting assessment expenses (hourly rate) and Membership Reward (MR) fees which are deducted directly from the incentive rebate.
• Negotiate an annual credit which can be applied to consulting and MR expenses.
• ABC
Pricing, High ROC Transactions
• Reduce the 50 BSP reduction on P-card transactions > $10K (Hi-ROC volume).• Negotiate a buffer which can be applied to the Hi-ROC volume, i.e. request that the
BSP penalty apply only to Hi-ROC volume which exceeds a specified amount.
• ABC
*NACV – Net Annual Charge Volume (i.e. annual spend with Amex)
SAMPLE
Page: 53
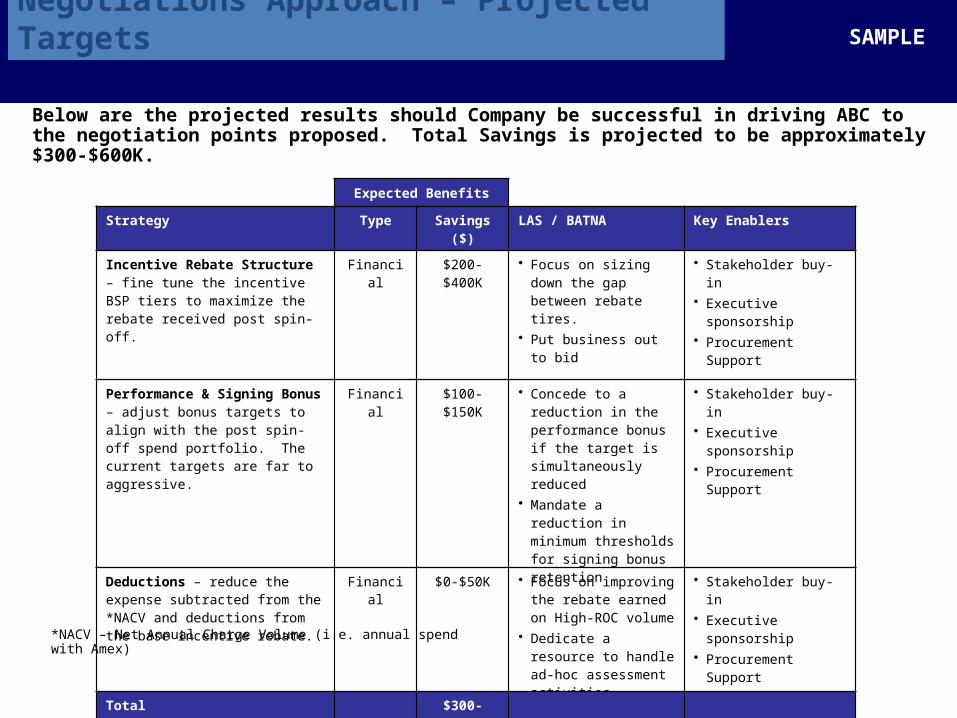
Negotiations Approach – Projected Targets
Below are the projected results should Company be successful in driving ABC to the negotiation points proposed. Total Savings is projected to be approximately $300-$600K.
SAMPLE Expected Benefits
Strategy Type Savings ($) LAS / BATNA Key Enablers
Incentive Rebate Structure – fine tune the incentive BSP tiers to maximize the rebate received post spin-off.
Financial $200-$400K • Focus on sizing down the gap between rebate tires.
• Put business out to bid
• Stakeholder buy-in• Executive sponsorship• Procurement Support
Performance & Signing Bonus – adjust bonus targets to align with the post spin-off spend portfolio. The current targets are far to aggressive.
Financial $100-$150K • Concede to a reduction in the performance bonus if the target is simultaneously reduced
• Mandate a reduction in minimum thresholds for signing bonus retention
• Stakeholder buy-in• Executive sponsorship• Procurement Support
Deductions – reduce the expense subtracted from the *NACV and deductions from the base incentive rebate.
Financial $0-$50K • Focus on improving the rebate earned on High-ROC volume
• Dedicate a resource to handle ad-hoc assessment activities
• Stakeholder buy-in• Executive sponsorship• Procurement Support
Total $300-$600K
*NACV – Net Annual Charge Volume (i.e. annual spend with Amex)
SAMPLE
Page: 54
Strategic Sourcing Process Overview
ProfileCategoryInternally &Externally
CreateSelectionFactors &EvaluateSuppliers
Negotiate & Develop Sourcing
Recommen-dation
ImplementAgreements
Strategic Sourcing Methodology
Act
ivit
ies
Del
iver
able
s o
r To
ols
Validate Internal
Requirements & Profile Category
ConductIndustry Analysis
Internal Category Profile
TCO Model
Cost Reduction Ideas
Industry Profile
Build TCO Model
Develop Sourcing
Objectives
Sourcing Strategy Plan: Competitive
Supplier Selection or
Existing Supplier
Development
Conduct Supplier Analysis
Create Supplier Selection Criteria
Supplier Selection
Decision Matrix
RFIs (optional)
“Short List” of Suppliers
Complete Traditional
RFP Process
RFPs / RFQs
eAuctions
Collaborative Discussions
Conduct eAuction(s)
Collaborate w/ Incumbent Supplier(s)
- AND/OR -
- AND/OR -
Prepare Fact-Based
Negotiation Packages
Negotiate Agreements
Fact-Based Negotiation Packages
Supplier Negotiations Presentation
Sourcing Recommendation
Finalized Agreements
Benefits Realization
Continual Supplier
Improvement
Implement Agreements and Monitor
KPIs
Evaluate Performance and Develop
Suppliers
Develop SourcingStrategy
Conduct Competitive Exercise w/ ApprovedSuppliers
Fast Track for Quick Savings
Develop Sourcing
Strategies & Tactics
ANALYSIS STRATEGY SUPPLIER SELECTION IMPLEMENTATION
AssessOpportunity & Establish Team
AssessOpportunity
Obtain Sponsorship
& ID Team
CreateProject
Plan
Project Plan
Analyze Current Spend
Document Requirements
Page: 55
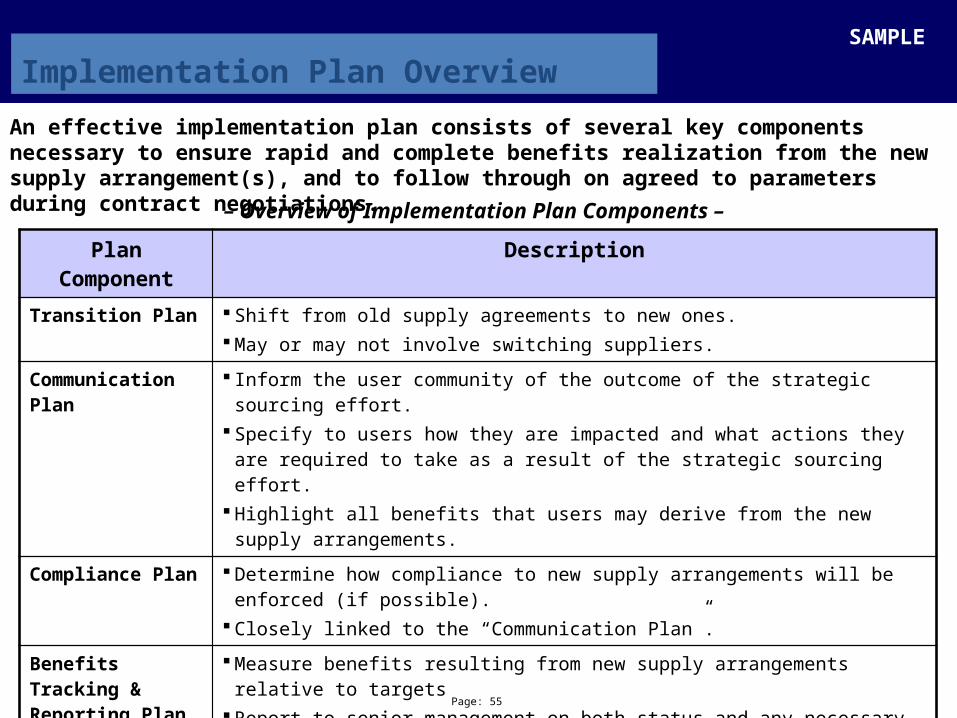
Implementation Plan Overview
An effective implementation plan consists of several key components necessary to ensure rapid and complete benefits realization from the new supply arrangement(s), and to follow through on agreed to parameters during contract negotiations.
Plan Component Description
Transition Plan Shift from old supply agreements to new ones. May or may not involve switching suppliers.
Communication Plan
Inform the user community of the outcome of the strategic sourcing effort. Specify to users how they are impacted and what actions they are required to take
as a result of the strategic sourcing effort. Highlight all benefits that users may derive from the new supply arrangements.
Compliance Plan Determine how compliance to new supply arrangements will be enforced (if possible).
Closely linked to the “Communication Plan”.
Benefits Tracking & Reporting Plan
Measure benefits resulting from new supply arrangements relative to targets Report to senior management on both status and any necessary actions required to
improve benefits realization.
Performance Management Plan
Ensure that suppliers are performing along key metrics as required by the contract. Put in place a regular communication vehicle with suppliers to drive improvements
in supplier performance.
– Overview of Implementation Plan Components –
SAMPLE