2017 federal employee v ewpoint survey - opm.gov€¦ · a message from the director the federal...
TRANSCRIPT
2017 Federal Employee V ewpoint SurveyEmpowering Employees. Inspiring Change.
Governmentwide Management Report
United States Office of Personnel Management OPM.GOV/FEVS #FEVS
A Message from the Director
The Federal Employee Viewpoint Survey (FEVS) continues to be a valuable tool for assessing the state of Federal workplaces. The workforce is the backbone of the government and employee opinions shared through the survey provide an essential catalyst to achieving effective government.
This year more than 485,000 employees participated in the FEVS, showing their commitment to improving the Federal government. Employee feedback builds upon and supports agency improvement efforts while providing an important baseline for new initiatives.
I am pleased to report that overall 2017 Governmentwide FEVS results show that Federal employees have a positive perspective of their workplaces. Overall Employee Engagement is at 67, the highest level since 2011. The New IQ (the Diversity and Inclusion index) is at 60, the highest level since the index was first reported.
Across the core FEVS items, nearly 100% remained the same or increased from last year, with the largest increases found in supervisory relationships, management communication among work units, and organizational satisfaction. The highest positively rated items continue to highlight employees’ perceptions from last year, including willingness to exert extra effort to get the job done, looking for ways to do a job better, and a belief that their work is important.
While 2017 FEVS results are very positive, survey responses also show several key aspects of Federal workplaces could be improved. Based on employee perspectives, agencies would be more effective to the extent that leaders are able to address insufficient resources, recruit for the right skills, recognize employee performance, and generate commitment and motivation in the workforce.
The results of the survey tell an important story. While multiple aspects of Federal workplaces support effective government, there are always opportunities for improvement. FEVS results point the way to stronger workplaces. The ongoing actions of Federal leadership and employees are key to ensuring that we build on the positive gains we have made over the last few years, while addressing areas in need of improvement.
In close, I offer my thanks to the men and women of the Federal workforce. Your dedication to your mission and commitment to providing high quality services continue to enrich the lives of the American people.
Kathleen M. McGettiganActing DirectorU.S. Office of Personnel Management
Table of Contents
About This Report ..................................................................................................................................................................................1
Survey Findings ......................................................................................................................................................................................3
Participant Overview .........................................................................................................................................................................3
Response Rates .................................................................................................................................................................................4
Item Scores .......................................................................................................................................................................................6
Employee Engagement Index ............................................................................................................................................................7
Employee Engagement Agency Findings .....................................................................................................................................8
New Inclusion Quotient (The New IQ) ............................................................................................................................................ 10
New IQ Agency Findings .......................................................................................................................................................... 11
Conclusions and Next Steps ................................................................................................................................................................ 13
Appendix A: Participating Agency Response Rates by Employee Population Size Categories ............................................................. 15
Appendix B: Trend Analysis ............................................................................................................................................................... 19
Appendix C: Work/Life Programs: Participation and Satisfaction ....................................................................................................... 23
Appendix D: Governmentwide Respondent Characteristics .............................................................................................................. 26
Appendix E: Governmentwide Demographic Response Rates ............................................................................................................ 29
Appendix F: FEVS Indices ................................................................................................................................................................... 31
1
About This Report
The Federal Employee Viewpoint Survey (FEVS) allows government employees to share their opinions about what matters most to them, and gives them the opportunity to let their leadership know how they feel about their jobs, their supervisors, and their agencies. This report presents the results the 2017 governmentwide FEVS, highlights agency improvements, and provides an overview of what employees had to say. The main focus of this report is Employee Engagement and the New Inclusion Quotient (New IQ), with highlights of notable agency achievements.
This report displays results using a breakout comparison of agencies by size. These size categories allow for better comparisons to be made recognizing that agencies may encounter different challenges and opportunities based on their size. The agency size is based on the agency employee population as of March 2017, for more information and for a full listing of the agencies included in each category, see Appendix A.
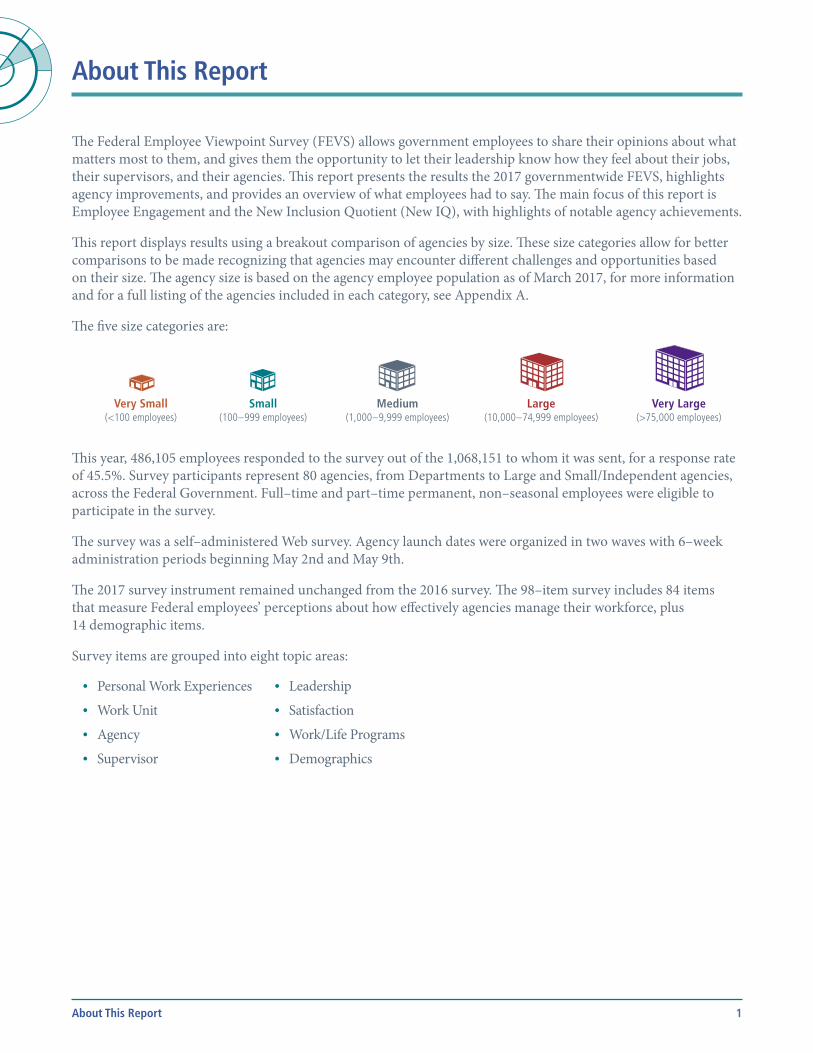
The five size categories are:
Very Small(<100 employees)
Small(100 – 999 employees)
Medium(1,000 – 9,999 employees)
Large(10,000 – 74,999 employees)
Very Large(>75,000 employees)
This year, 486,105 employees responded to the survey out of the 1,068,151 to whom it was sent, for a response rate of 45.5%. Survey participants represent 80 agencies, from Departments to Large and Small/Independent agencies, across the Federal Government. Full–time and part–time permanent, non–seasonal employees were eligible to participate in the survey.
The survey was a self–administered Web survey. Agency launch dates were organized in two waves with 6–week administration periods beginning May 2nd and May 9th.
The 2017 survey instrument remained unchanged from the 2016 survey. The 98–item survey includes 84 items that measure Federal employees’ perceptions about how effectively agencies manage their workforce, plus 14 demographic items.
Survey items are grouped into eight topic areas:
• Personal Work Experiences• Work Unit• Agency• Supervisor
• Leadership• Satisfaction• Work/Life Programs• Demographics
About This Report
2
About This Report (continued)
Analytical MethodsThe data collected from 2017 survey respondents were weighted to ensure survey estimates accurately represent the survey population. Use of unweighted data could produce biased estimates of population statistics. The final data set reflects the agency composition and demographic makeup of the Federal workforce within plus or minus 1 percentage point. Demographic results are not weighted. OPM employed a number of grouping procedures to simplify presentation of data analysis results in this report. Most of the items had six response categories: Strongly Agree, Agree, Neither Agree nor Disagree, Disagree, Strongly Disagree, and No Basis to Judge/Do Not Know. In some instances, these responses are collapsed into one positive category (Strongly Agree and Agree), one negative category (Strongly Disagree and Disagree), and a neutral category (Neither Agree nor Disagree). For more information on FEVS methods, including data weighting and analysis, see the FEVS Technical Report at https://www.fedview.opm.gov/2016FILES/2016_FEVS_Technical_Report.pdf.
Additional FEVS ResourcesIn addition to this report there are multiple governmentwide resources and tools available, each is described below.Websites
FEVS website Agencies and the general public can access governmentwide data reports, as well as special topic reports and
infographics produced from the FEVS. This website includes results from the 2004 administration of the survey to the present. Access the FEVS website at www.opm.gov/FEVS. Questions and feedback for the site can be sent to [email protected].
UnlockTalent A tool for both the general public and agencies to view comprehensive data visualizations with broad displays
of FEVS data, as well as HR data from OPM’s Enterprise Human Resources Integration (EHRI). These displays allow agencies to identify subcomponents for action to improve engagement and overall satisfaction as well as highlight indicators that can contribute to a high performing organization. Agency specific case studies, best practices, and other helpful resources can be found on the Community of Practice page. This site can be accessed at www.unlocktalent.gov. Questions and feedback can be sent to [email protected].
Public Release Data File (PRDF) A public release data file will be available for the FEVS. To request a public use data file, complete the form
available at: www.fedview.opm.gov/2017/EVSDATA. Note: The 2017 PRDF will be available in the fall.
Other FEVS Reports
Governmentwide Data Reports In addition to the Governmentwide Management Report, there are three additional governmentwide data
reports available on the FEVS website under reports (access the FEVS website at www.opm.gov/FEVS):
Report by AgencyDisplays question-by-question counts and percentages for each response option for the 2017, 2016, and 2015 FEVS by participating agency and also governmentwide.
Report by DemographicsDisplays question-by-question counts and percentages for each response option for the 2017, 2016, and 2015 FEVS by demographic groups and also governmentwide.
Report on Demographic Questions by Agency (unweighted)Displays counts and percentages by participating agencies’ demographic and workforce profile (e.g., work location, supervisory status, sex, age, pay category, intention to retire) for 2017, 2016, and 2015. Both respondent counts and percentage estimates are unweighted.
About This Report
3
Survey Findings
Each year Federal employees at all levels of an organization, at different locations, and who do their work in a variety of different ways respond to the request to voice their opinions through the FEVS. This section will provide an overview of who Federal employees are, how many responded, and their views by highlighting specific item scores.
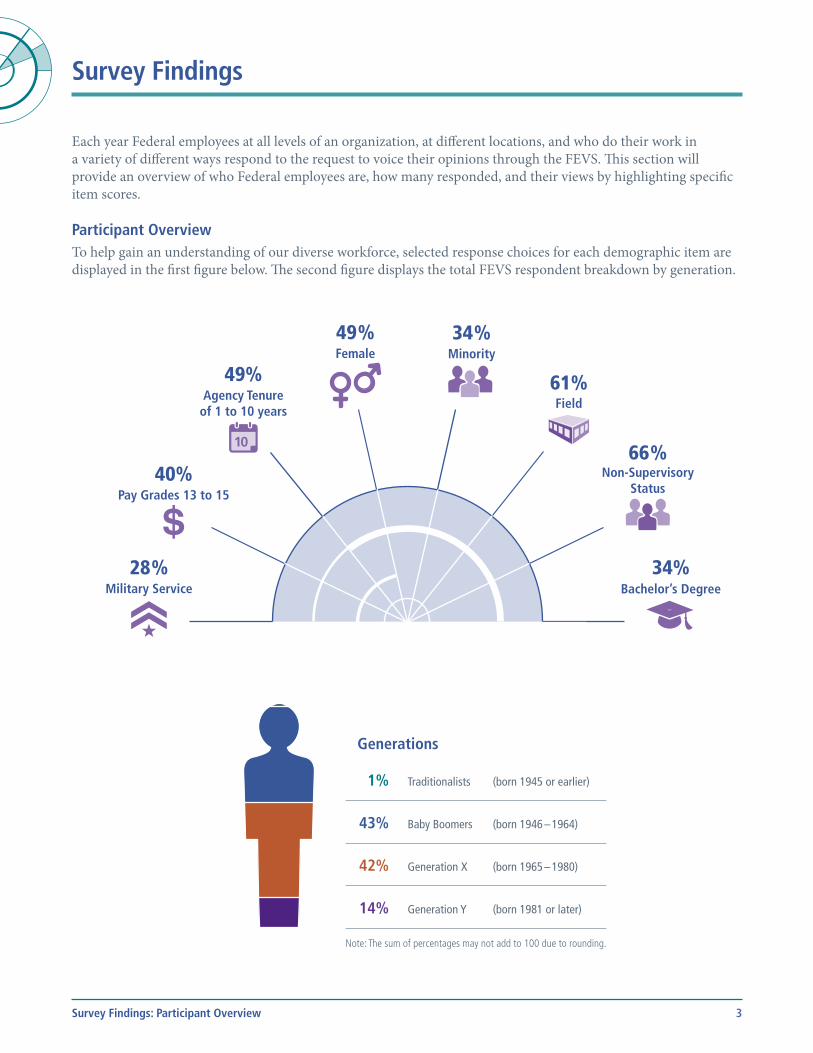
Participant OverviewTo help gain an understanding of our diverse workforce, selected response choices for each demographic item are displayed in the first figure below. The second figure displays the total FEVS respondent breakdown by generation.
Military Service28 %
Pay Grades 13 to 15 40%
Agency Tenure of 1 to 10 years
49%
10
Female49 %
Minority34 %
Field61%
Non-Supervisory Status
66 %
Bachelor’s Degree34%
Generations
1% Traditionalists (born 1945 or earlier)
43% Baby Boomers (born 1946 – 1964)
42% Generation X (born 1965 – 1980)
14% Generation Y (born 1981 or later)
Note: The sum of percentages may not add to 100 due to rounding.
Survey Findings: Participant Overview
4
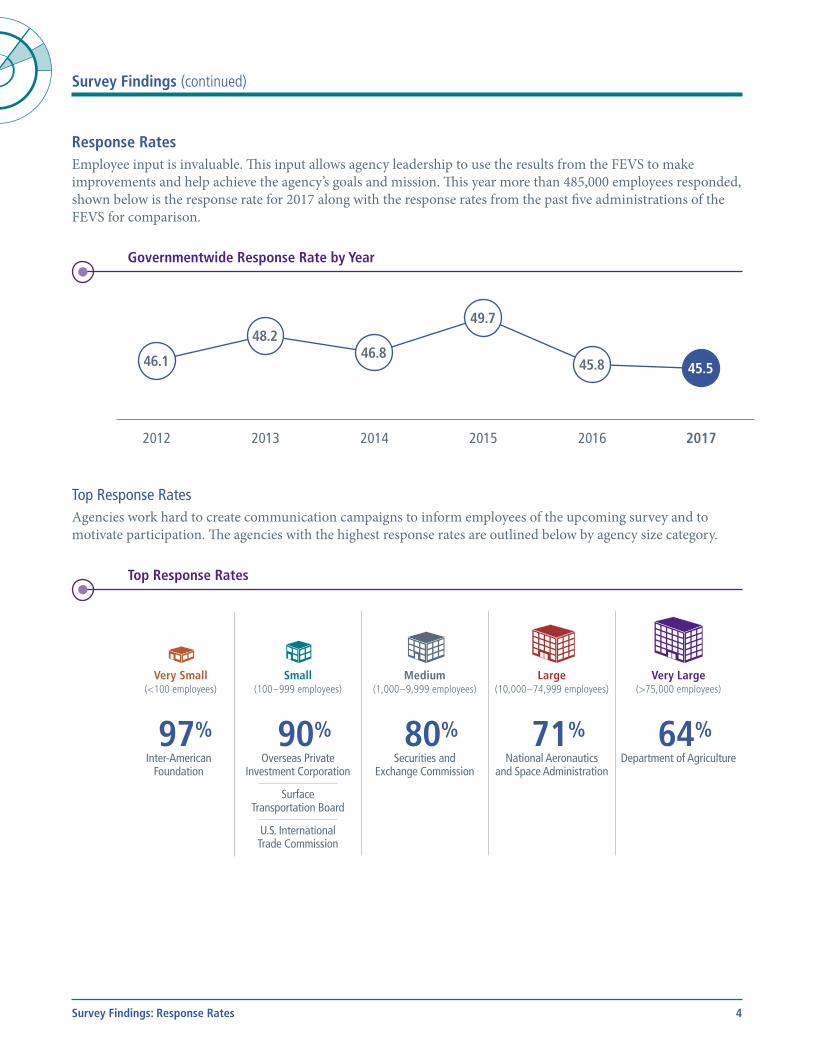
Response RatesEmployee input is invaluable. This input allows agency leadership to use the results from the FEVS to make improvements and help achieve the agency’s goals and mission. This year more than 485,000 employees responded, shown below is the response rate for 2017 along with the response rates from the past five administrations of the FEVS for comparison.
Survey Findings (continued)
Survey Findings: Response Rates
Governmentwide Response Rate by Year
46.1 in 2012
48.2 in 2013
46.8 in 2014
49.7 in 2015
45.8 in 2016 45.5 in
201746.1
48.246.8
49.7
45.8 45.5
2012 2013 2014 2015 2016 2017
Top Response RatesAgencies work hard to create communication campaigns to inform employees of the upcoming survey and to motivate participation. The agencies with the highest response rates are outlined below by agency size category.
Top Response Rates
Very Small(<100 employees)
97%Inter-American
Foundation
Small(100 – 999 employees)
90%Overseas Private
Investment Corporation
Surface Transportation Board
U.S. International Trade Commission
Medium(1,000 – 9,999 employees)
80%Securities and
Exchange Commission
Large(10,000 – 74,999 employees)
71%National Aeronautics
and Space Administration
Very Large(>75,000 employees)
64%Department of Agriculture
5
Survey Findings (continued)
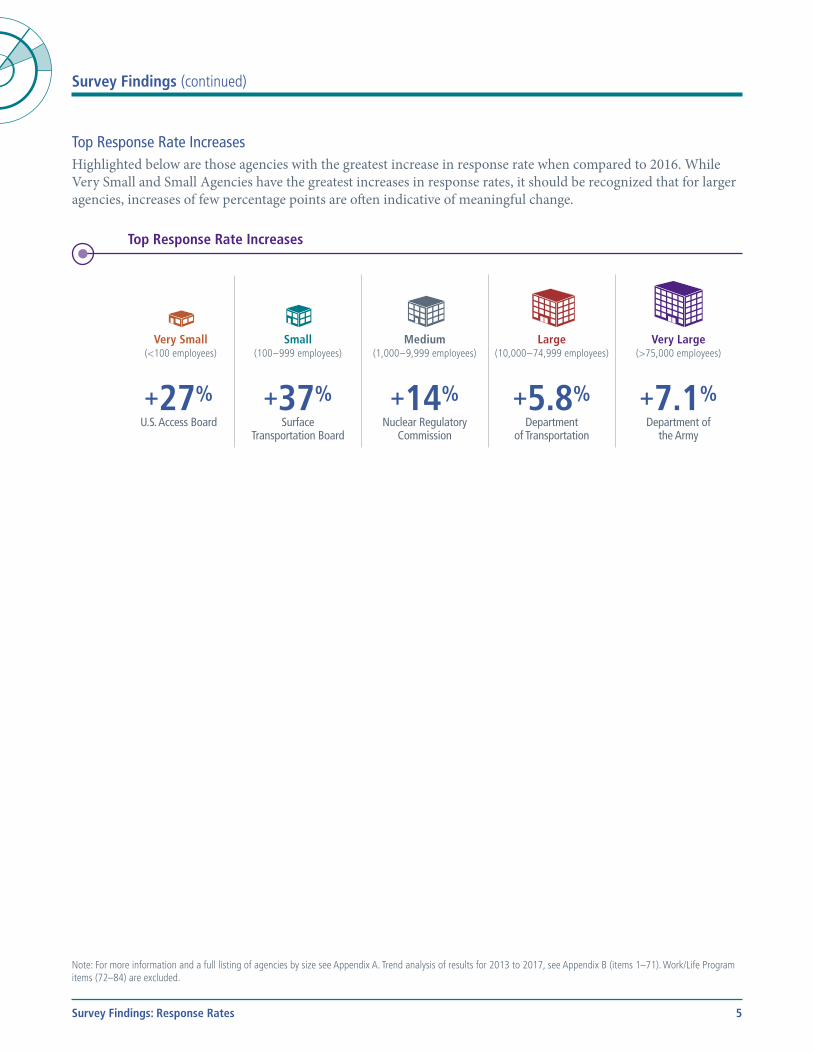
Top Response Rate IncreasesHighlighted below are those agencies with the greatest increase in response rate when compared to 2016. While Very Small and Small Agencies have the greatest increases in response rates, it should be recognized that for larger agencies, increases of few percentage points are often indicative of meaningful change.
Top Response Rate Increases
Very Small(<100 employees)
+27%U.S. Access Board
Small(100 – 999 employees)
+37%Surface
Transportation Board
Medium(1,000 – 9,999 employees)
+14%Nuclear Regulatory
Commission
Large(10,000 – 74,999 employees)
+5.8%Department
of Transportation
Very Large(>75,000 employees)
+7.1%Department of
the Army
Note: For more information and a full listing of agencies by size see Appendix A. Trend analysis of results for 2013 to 2017, see Appendix B (items 1–71). Work/Life Program items (72–84) are excluded.
Survey Findings: Response Rates
6
Survey Findings (continued)
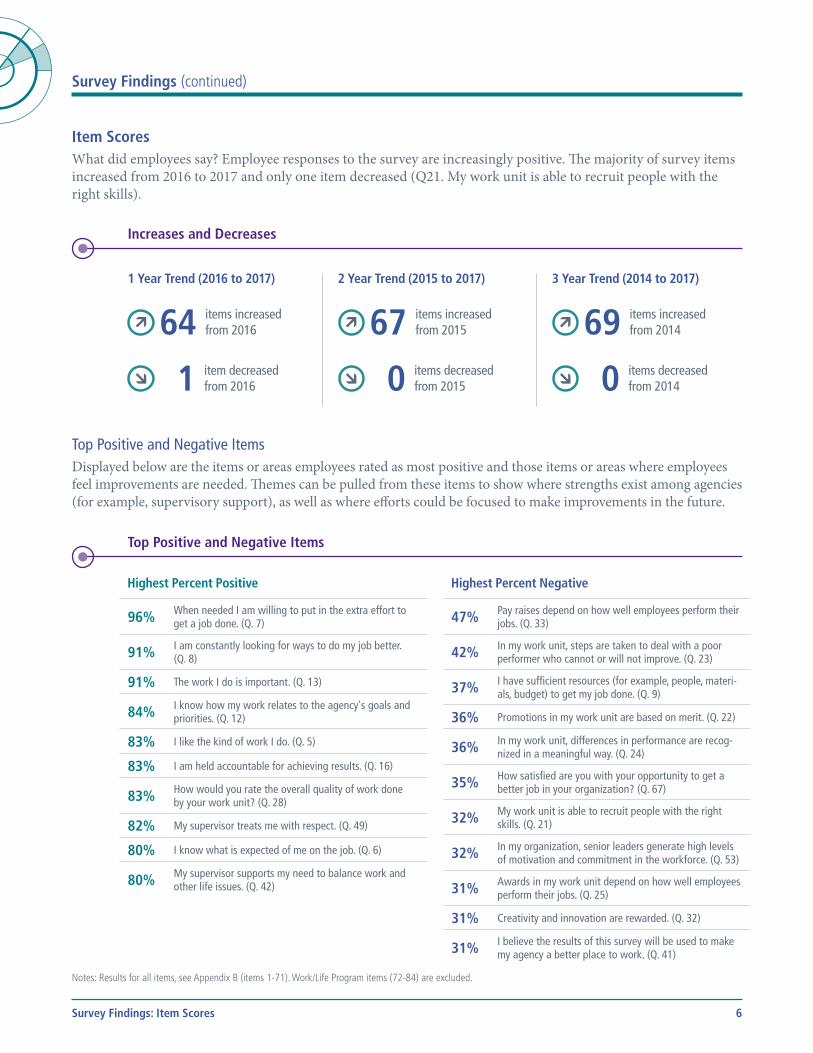
Item ScoresWhat did employees say? Employee responses to the survey are increasingly positive. The majority of survey items increased from 2016 to 2017 and only one item decreased (Q21. My work unit is able to recruit people with the right skills).
Increases and Decreases
1 Year Trend (2016 to 2017)
64 items increased from 2016
1 item decreased from 2016
2 Year Trend (2015 to 2017)
67 items increased from 2015
0 items decreased from 2015
3 Year Trend (2014 to 2017)
69 items increased from 2014
0 items decreased from 2014
Top Positive and Negative ItemsDisplayed below are the items or areas employees rated as most positive and those items or areas where employees feel improvements are needed. Themes can be pulled from these items to show where strengths exist among agencies (for example, supervisory support), as well as where efforts could be focused to make improvements in the future.
Top Positive and Negative Items
Highest Percent Positive
96% When needed I am willing to put in the extra effort to get a job done. (Q. 7)
91% I am constantly looking for ways to do my job better. (Q. 8)
91% The work I do is important. (Q. 13)
84% I know how my work relates to the agency's goals and priorities. (Q. 12)
83% I like the kind of work I do. (Q. 5)
83% I am held accountable for achieving results. (Q. 16)
83% How would you rate the overall quality of work done by your work unit? (Q. 28)
82% My supervisor treats me with respect. (Q. 49)
80% I know what is expected of me on the job. (Q. 6)
80% My supervisor supports my need to balance work and other life issues. (Q. 42)
Highest Percent Negative
47% Pay raises depend on how well employees perform their jobs. (Q. 33)
42% In my work unit, steps are taken to deal with a poor performer who cannot or will not improve. (Q. 23)
37% I have sufficient resources (for example, people, materi-als, budget) to get my job done. (Q. 9)
36% Promotions in my work unit are based on merit. (Q. 22)
36% In my work unit, differences in performance are recog-nized in a meaningful way. (Q. 24)
35% How satisfied are you with your opportunity to get a better job in your organization? (Q. 67)
32% My work unit is able to recruit people with the right skills. (Q. 21)
32% In my organization, senior leaders generate high levels of motivation and commitment in the workforce. (Q. 53)
31% Awards in my work unit depend on how well employees perform their jobs. (Q. 25)
31% Creativity and innovation are rewarded. (Q. 32)
31% I believe the results of this survey will be used to make my agency a better place to work. (Q. 41)
Notes: Results for all items, see Appendix B (items 1-71). Work/Life Program items (72-84) are excluded.
Survey Findings: Item Scores
7
Survey Findings (continued)
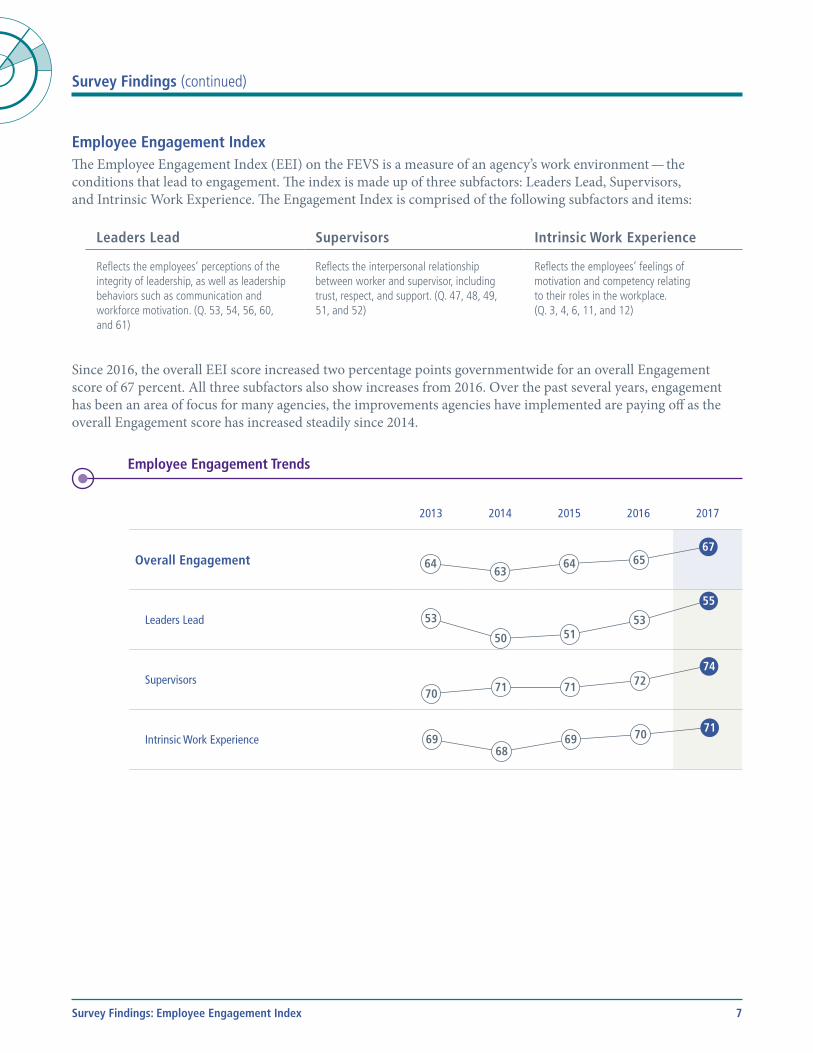
Employee Engagement IndexThe Employee Engagement Index (EEI) on the FEVS is a measure of an agency’s work environment — the conditions that lead to engagement. The index is made up of three subfactors: Leaders Lead, Supervisors, and Intrinsic Work Experience. The Engagement Index is comprised of the following subfactors and items:
Leaders Lead Supervisors Intrinsic Work Experience
Reflects the employees’ perceptions of the integrity of leadership, as well as leadership behaviors such as communication and workforce motivation. (Q. 53, 54, 56, 60, and 61)
Reflects the interpersonal relationship between worker and supervisor, including trust, respect, and support. (Q. 47, 48, 49, 51, and 52)
Reflects the employees’ feelings of motivation and competency relating to their roles in the workplace. (Q. 3, 4, 6, 11, and 12)
Since 2016, the overall EEI score increased two percentage points governmentwide for an overall Engagement score of 67 percent. All three subfactors also show increases from 2016. Over the past several years, engagement has been an area of focus for many agencies, the improvements agencies have implemented are paying off as the overall Engagement score has increased steadily since 2014.
Employee Engagement Trends
2013 2014 2015 2016 2017
Overall Engagement
64. 63. Decreased from 2013. 64. Increased from 2014. 65. Increased from 2015. 67. Increased from 2016.
Leaders Lead
53. 50. Decreased from 2013. 51. Increased from 2014. 53. Increased from 2015. 55. Increased from 2016.
Supervisors
70. 71. Increased from 2013. 71. No change from 2014. 72. Increased from 2015. 74. Increased from 2016.
Intrinsic Work Experience
69. 68. Decreased from 2013. 69. Increased from 2014. 70. Increased from 2015. 71. Increased from 2016.
64 64 65 63
67
69 69 70 68
71
70 71 72 71
74
53 51
53
50
55
Survey Findings: Employee Engagement Index
8
Survey Findings (continued)
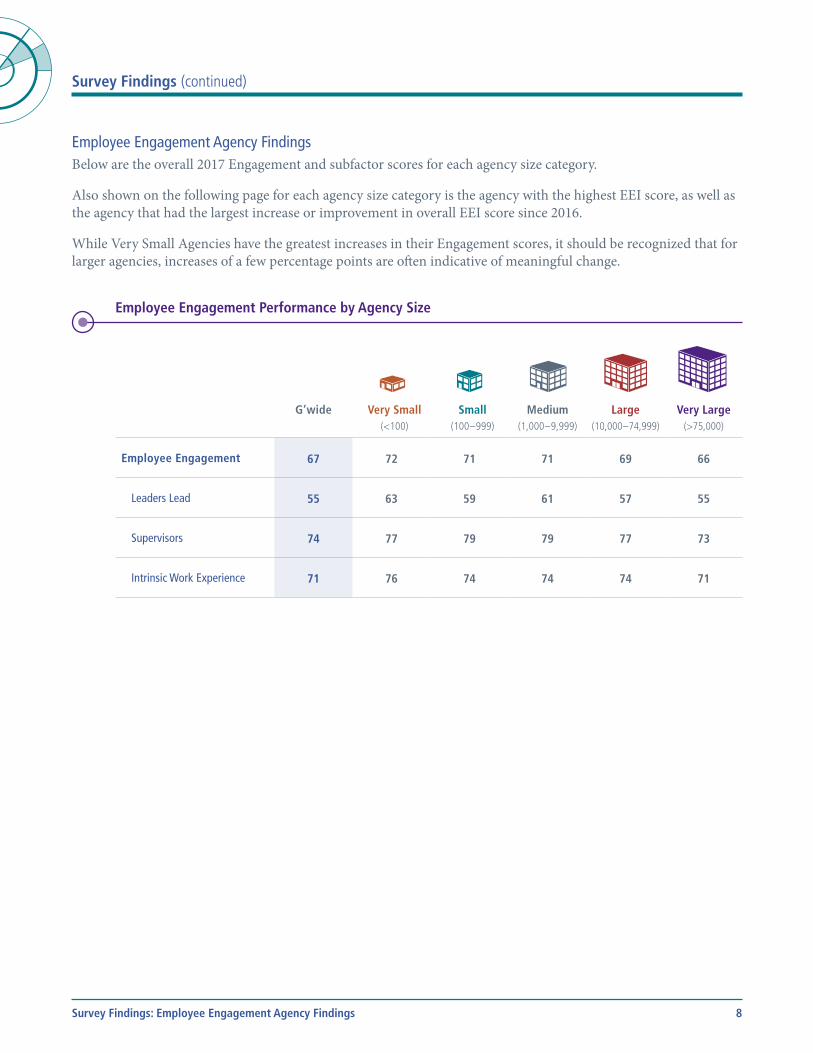
Employee Engagement Agency FindingsBelow are the overall 2017 Engagement and subfactor scores for each agency size category.
Also shown on the following page for each agency size category is the agency with the highest EEI score, as well as the agency that had the largest increase or improvement in overall EEI score since 2016.
While Very Small Agencies have the greatest increases in their Engagement scores, it should be recognized that for larger agencies, increases of a few percentage points are often indicative of meaningful change.
Employee Engagement Performance by Agency Size
G’wide Very Small
(<100)
Small(100 – 999)
Medium(1,000 – 9,999)
Large(10,000 – 74,999)
Very Large(>75,000)
Employee Engagement 67 72 71 71 69 66
Leaders Lead 55 63 59 61 57 55
Supervisors 74 77 79 79 77 73
Intrinsic Work Experience 71 76 74 74 74 71
Survey Findings: Employee Engagement Agency Findings
9
Survey Findings (continued)
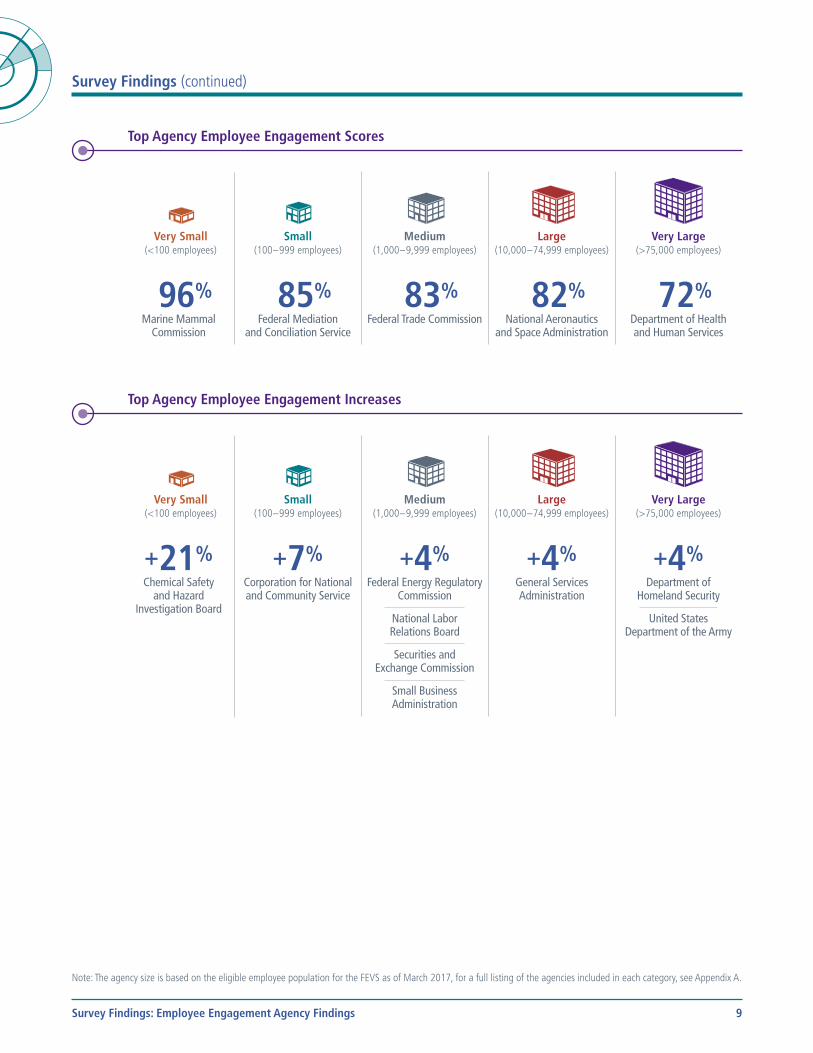
Top Agency Employee Engagement Scores
Very Small(<100 employees)
96%Marine Mammal
Commission
Small(100 – 999 employees)
85%Federal Mediation
and Conciliation Service
Medium(1,000 – 9,999 employees)
83%Federal Trade Commission
Large(10,000 – 74,999 employees)
82%National Aeronautics
and Space Administration
Very Large(>75,000 employees)
72%Department of Health and Human Services
Top Agency Employee Engagement Increases
Very Small(<100 employees)
+21%Chemical Safety
and Hazard Investigation Board
Small(100 – 999 employees)
+7%Corporation for National and Community Service
Medium(1,000 – 9,999 employees)
+4%Federal Energy Regulatory
Commission
National Labor Relations Board
Securities and Exchange Commission
Small Business Administration
Large(10,000 – 74,999 employees)
+4%General Services Administration
Very Large(>75,000 employees)
+4%Department of
Homeland Security
United States Department of the Army
Note: The agency size is based on the eligible employee population for the FEVS as of March 2017, for a full listing of the agencies included in each category, see Appendix A.
Survey Findings: Employee Engagement Agency Findings
10
Survey Findings (continued)
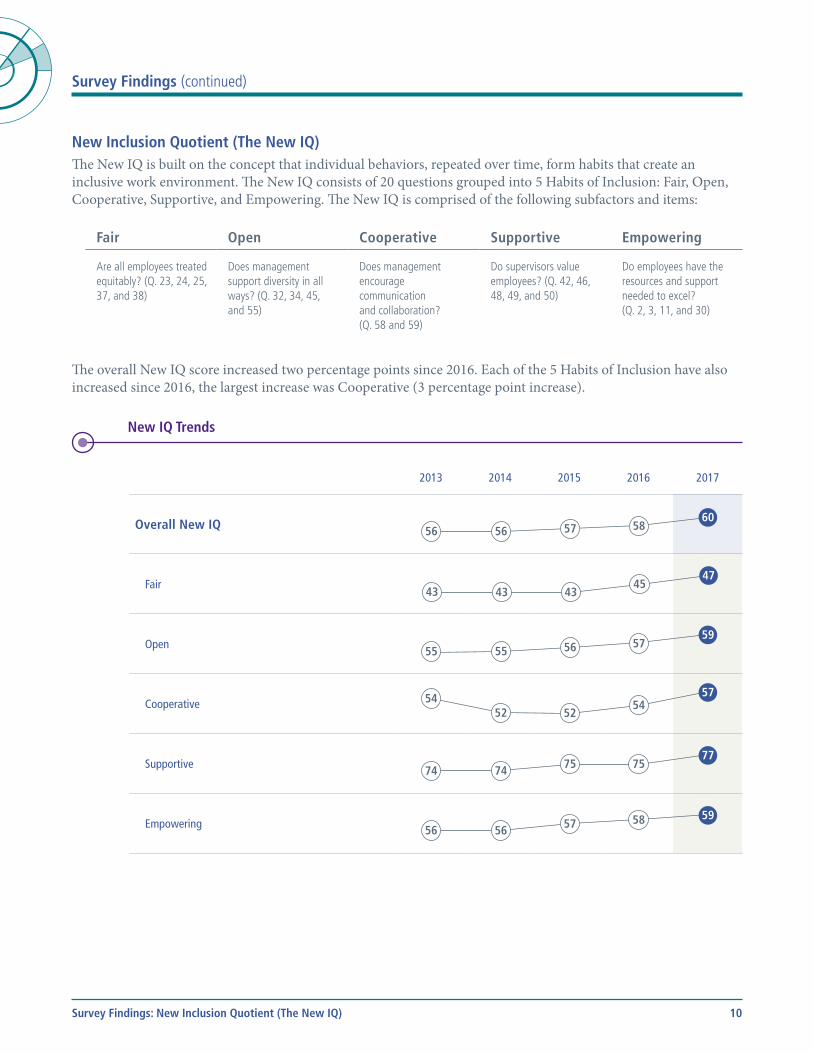
New Inclusion Quotient (The New IQ)The New IQ is built on the concept that individual behaviors, repeated over time, form habits that create an inclusive work environment. The New IQ consists of 20 questions grouped into 5 Habits of Inclusion: Fair, Open, Cooperative, Supportive, and Empowering. The New IQ is comprised of the following subfactors and items:
Fair Open Cooperative Supportive Empowering
Are all employees treated equitably? (Q. 23, 24, 25, 37, and 38)
Does management support diversity in all ways? (Q. 32, 34, 45, and 55)
Does management encourage communication and collaboration? (Q. 58 and 59)
Do supervisors value employees? (Q. 42, 46, 48, 49, and 50)
Do employees have the resources and support needed to excel? (Q. 2, 3, 11, and 30)
The overall New IQ score increased two percentage points since 2016. Each of the 5 Habits of Inclusion have also increased since 2016, the largest increase was Cooperative (3 percentage point increase).
New IQ Trends
2013 2014 2015 2016 2017
Overall New IQ
56. 56. No change from 2013. 57. Increased from 2014. 58. Increased from 2015. 60. Increased from 2016.
Fair
43. 43. No change from 2013. 43. No change from 2014. 45. Increased from 2015. 47. Increased from 2016.
Open
55. 55. No change from 2013. 56. Increased from 2014. 57. Increased from 2015. 59. Increased from 2016.
Cooperative
54. 52. Decreased from 2013. 52. No change from 2014. 54. Increased from 2015. 57. Increased from 2016.
Supportive
74. 74. No change from 2013. 75. Increased from 2014. 75. No change from 2015. 77. No change from 2016.
Empowering
56. 56. No change from 2013. 57. Increased from 2014. 58. Increased from 2015. 59. Increased from 2016.
56 57 58 56 60
43 43 45
43 47
55 56 57 55
59
54 54 52 52
57
74 75 75 74 77
56 57 58 56
59
Survey Findings: New Inclusion Quotient (The New IQ)
11
Survey Findings (continued)
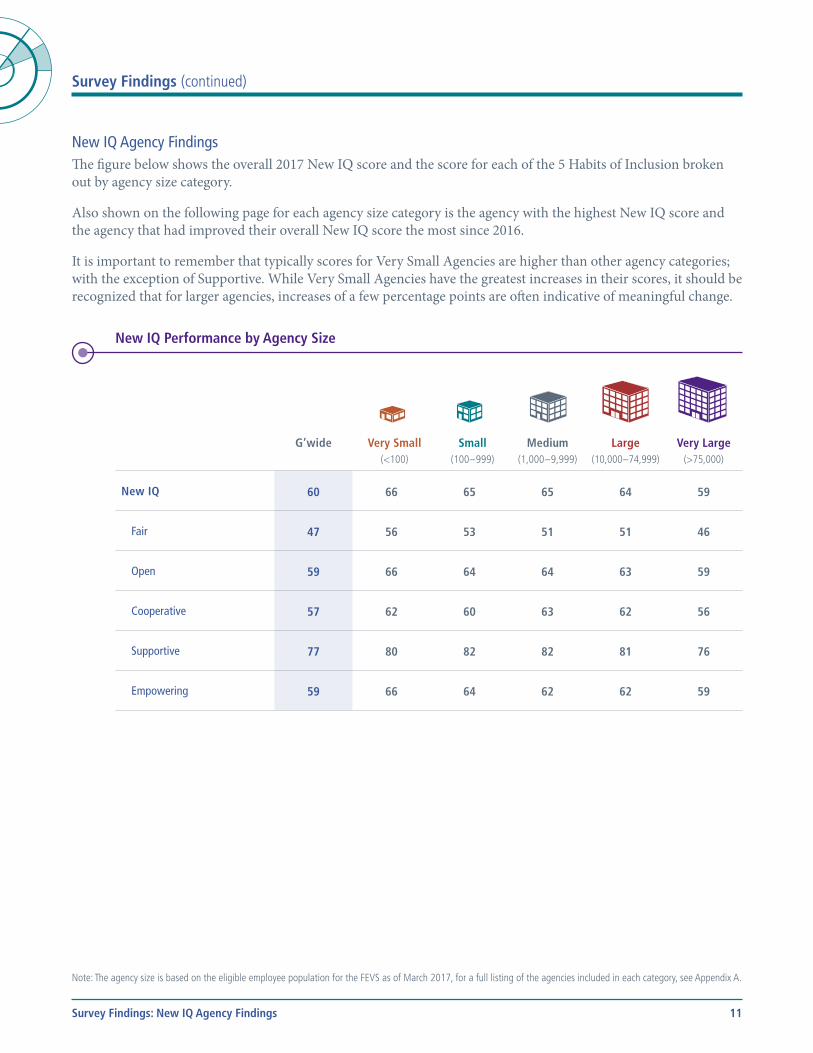
New IQ Agency FindingsThe figure below shows the overall 2017 New IQ score and the score for each of the 5 Habits of Inclusion broken out by agency size category.
Also shown on the following page for each agency size category is the agency with the highest New IQ score and the agency that had improved their overall New IQ score the most since 2016.
It is important to remember that typically scores for Very Small Agencies are higher than other agency categories; with the exception of Supportive. While Very Small Agencies have the greatest increases in their scores, it should be recognized that for larger agencies, increases of a few percentage points are often indicative of meaningful change.
New IQ Performance by Agency Size
G’wide Very Small
(<100)
Small(100 – 999)
Medium(1,000 – 9,999)
Large(10,000 – 74,999)
Very Large(>75,000)
New IQ 60 66 65 65 64 59
Fair 47 56 53 51 51 46
Open 59 66 64 64 63 59
Cooperative 57 62 60 63 62 56
Supportive 77 80 82 82 81 76
Empowering 59 66 64 62 62 59
Note: The agency size is based on the eligible employee population for the FEVS as of March 2017, for a full listing of the agencies included in each category, see Appendix A.
Survey Findings: New IQ Agency Findings
12
Survey Findings (continued)
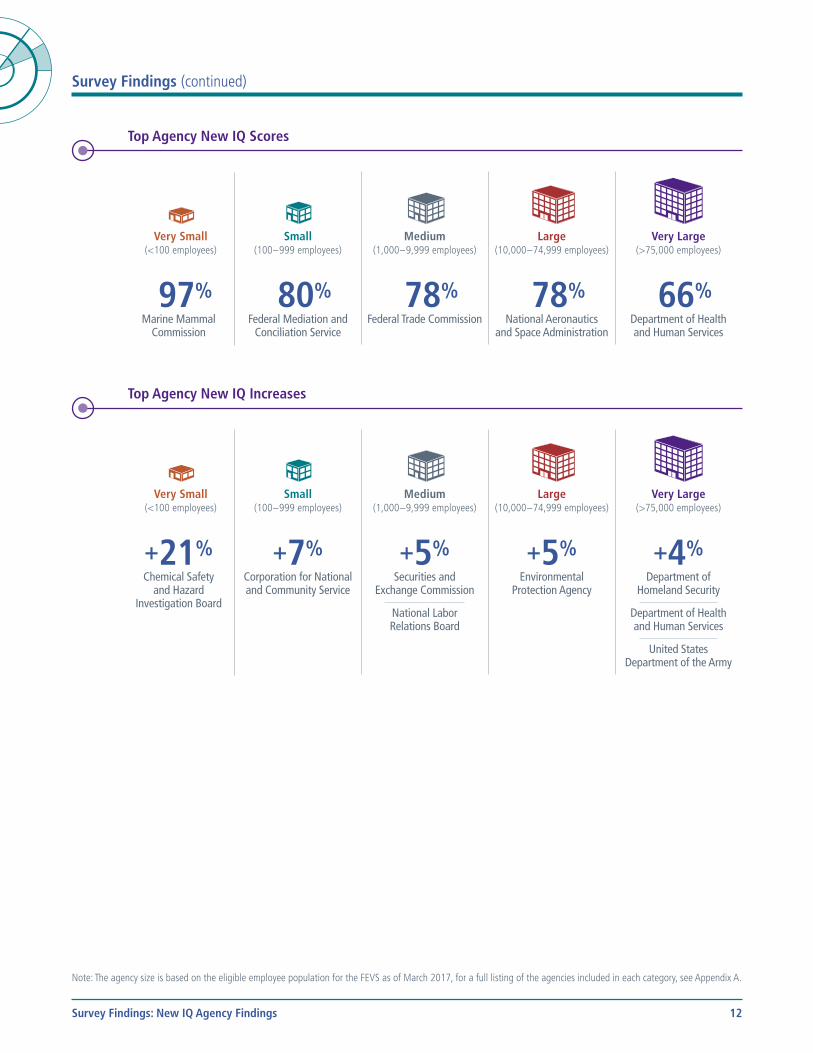
Top Agency New IQ Scores
Very Small(<100 employees)
97%Marine Mammal
Commission
Small(100 – 999 employees)
80%Federal Mediation and
Conciliation Service
Medium(1,000 – 9,999 employees)
78%Federal Trade Commission
Large(10,000 – 74,999 employees)
78%National Aeronautics
and Space Administration
Very Large(>75,000 employees)
66%Department of Health and Human Services
Top Agency New IQ Increases
Very Small(<100 employees)
+21%Chemical Safety
and Hazard Investigation Board
Small(100 – 999 employees)
+7%Corporation for National and Community Service
Medium(1,000 – 9,999 employees)
+5%Securities and
Exchange Commission
National Labor Relations Board
Large(10,000 – 74,999 employees)
+5%Environmental
Protection Agency
Very Large(>75,000 employees)
+4%Department of
Homeland Security
Department of Health and Human Services
United States Department of the Army
Note: The agency size is based on the eligible employee population for the FEVS as of March 2017, for a full listing of the agencies included in each category, see Appendix A.
Survey Findings: New IQ Agency Findings
13
Conclusions and Next Steps
Conclusions from the 2017 FEVSProviding Federal employees with the opportunity to share their experiences about all aspects of their workplaces affords agency leaders the impetus for identifying, driving and sustaining performance in the Federal government. Employee participation in the Federal Employee Viewpoint Survey (FEVS) facilitates change by identifying aspects of agency workplaces that positively influence agency performance as well as policies and practices which may be in need of strengthening.
More than 485,000 employees in over 80 Federal agencies participated in the 2017 FEVS. Results were up in nearly every survey item and index. Of the FEVS indices, Global Satisfaction showed the greatest increase with a score of 64, up 3 percentage points from last year. Both Employee Engagement and the New IQ indices increased 2 percentage points. Employee Engagement attained a score of 67 and the New IQ index reached its highest score, 60, since the measure was introduced. All FEVS index results can be found in Appendix F. Nearly every survey item improved by at least 1 percentage point from the 2016 survey and over 50% of the items increased by 2 percentage points or more. These findings are an indication that the sustained efforts agencies have made to improve engagement, and employee satisfaction and inclusion are being recognized by the Federal workforce.
New Directions – Innovating the FEVSOPM has a long history of assessing the opinions of Federal employees. Most employees are familiar with the current FEVS, which is a successor to the prior instrument, the Federal Human Capital Survey (FHCS), administered from 2002 to 2010. (OPM previously had administered employee surveys in the late 1970s/early 1980s and again in the early 1990s and late 1990s.)
The goal of each survey has been consistent – to give employees the opportunity to express their opinions about their jobs, their agency, and their leadership, thus enabling Federal leaders to identify and address aspects of their organizations that might impede productive and effective workplaces.
As important as it is to gain an understanding of employees’ perceptions to inform Federal policies and procedures, it is equally important to continually assess the instrument used to collect this information. New developments in survey research require updating questionnaire topics and survey item wording as well as sampling and analytical methods. Dating back to 1979, when OPM administered the first Federal Employee Attitude Survey, every survey instrument has gone through rigorous development and testing to ensure the results collected and reported are reliable, comparable, and actionable.
Conclusions and Next Steps
14
Conclusions and Next Steps (continued)
This process of survey improvement continues today. OPM has long sought to be more responsive to agencies on topical areas of interest, such as cybersecurity, and innovations related to human capital management. The most recent change in OPM regulations (5 CFR Part 250, subpart C] will allow flexibility and responsiveness to be built into the FEVS process. The existing FEVS is comprised of 84 items plus demographics. Before the regulation change, 45 of these items were required to be on the survey. By reducing the number of required survey items from 45 to 16, OPM now has the flexibility to update the FEVS through collaboration with agencies. This change strengthens the employee survey process by enabling OPM to administer a survey that is responsive to the current policies and programs of agencies, while maintaining trends for key survey items related to human capital management.
A plan is underway to build on the strengths of the current survey program. What does this mean for the current FEVS? Any changes to the current FEVS will:
• Have input from agencies and relevant stakeholder groups,
• Maintain professional standards for high quality data,
• Address timely and actionable performance topics,
• Support continuous governmentwide performance improvements, and
• Provide for comparable findings across agencies.
A rigorous assessment of the current research of best survey practices, as well as input from our agency stakeholders, is underway. OPM is committed to vetting any survey changes with our stakeholders and pilot testing survey revisions. We do not wish to change the survey for the sake of change, but to ensure data resulting from survey changes are actionable, reliable, and responsive to the needs voiced to us by agencies.
Conclusions and Next Steps
15
Appendix A: Participating Agency Response Rates by Employee Population Size Categories
NumberSurveyed
NumberResponded
ResponseRate
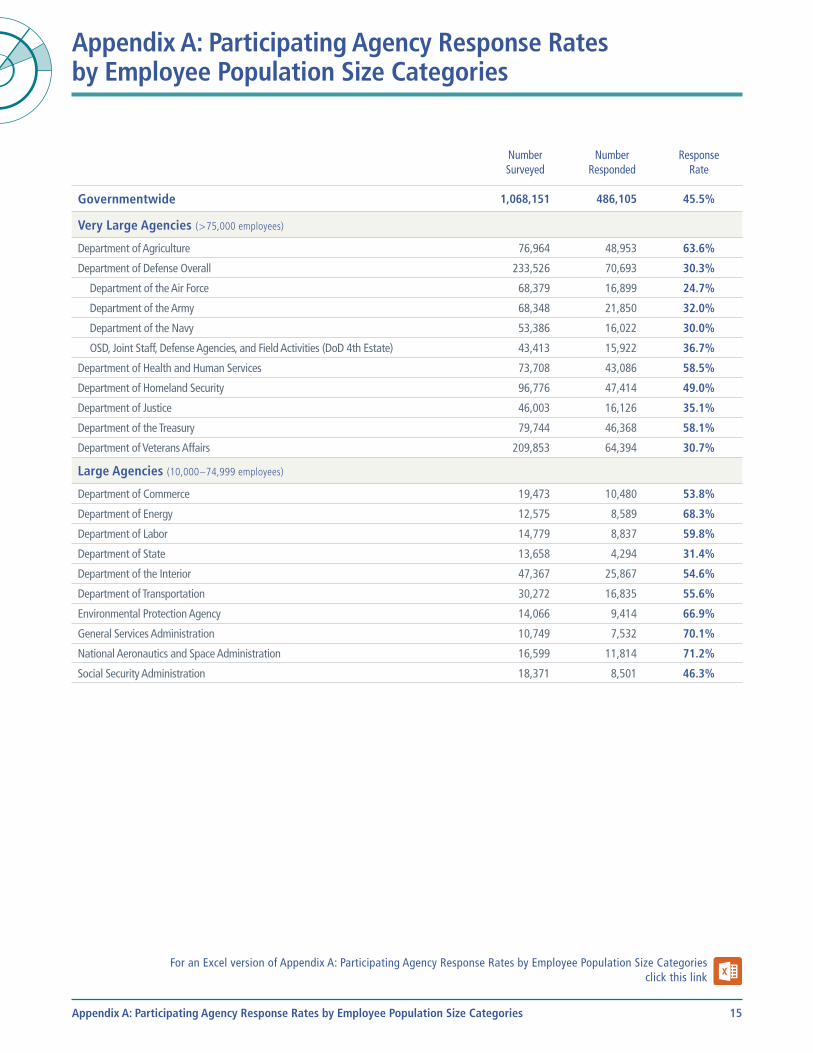
Governmentwide 1,068,151 486,105 45.5%
Very Large Agencies ( > 75,000 employees)
Department of Agriculture 76,964 48,953 63.6%
Department of Defense Overall 233,526 70,693 30.3%
Department of the Air Force 68,379 16,899 24.7%
Department of the Army 68,348 21,850 32.0%
Department of the Navy 53,386 16,022 30.0%
OSD, Joint Staff, Defense Agencies, and Field Activities (DoD 4th Estate) 43,413 15,922 36.7%
Department of Health and Human Services 73,708 43,086 58.5%
Department of Homeland Security 96,776 47,414 49.0%
Department of Justice 46,003 16,126 35.1%
Department of the Treasury 79,744 46,368 58.1%
Department of Veterans Affairs 209,853 64,394 30.7%
Large Agencies (10,000 – 74,999 employees)
Department of Commerce 19,473 10,480 53.8%
Department of Energy 12,575 8,589 68.3%
Department of Labor 14,779 8,837 59.8%
Department of State 13,658 4,294 31.4%
Department of the Interior 47,367 25,867 54.6%
Department of Transportation 30,272 16,835 55.6%
Environmental Protection Agency 14,066 9,414 66.9%
General Services Administration 10,749 7,532 70.1%
National Aeronautics and Space Administration 16,599 11,814 71.2%
Social Security Administration 18,371 8,501 46.3%
For an Excel version of Appendix A: Participating Agency Response Rates by Employee Population Size Categories click this link
Appendix A: Participating Agency Response Rates by Employee Population Size Categories
16
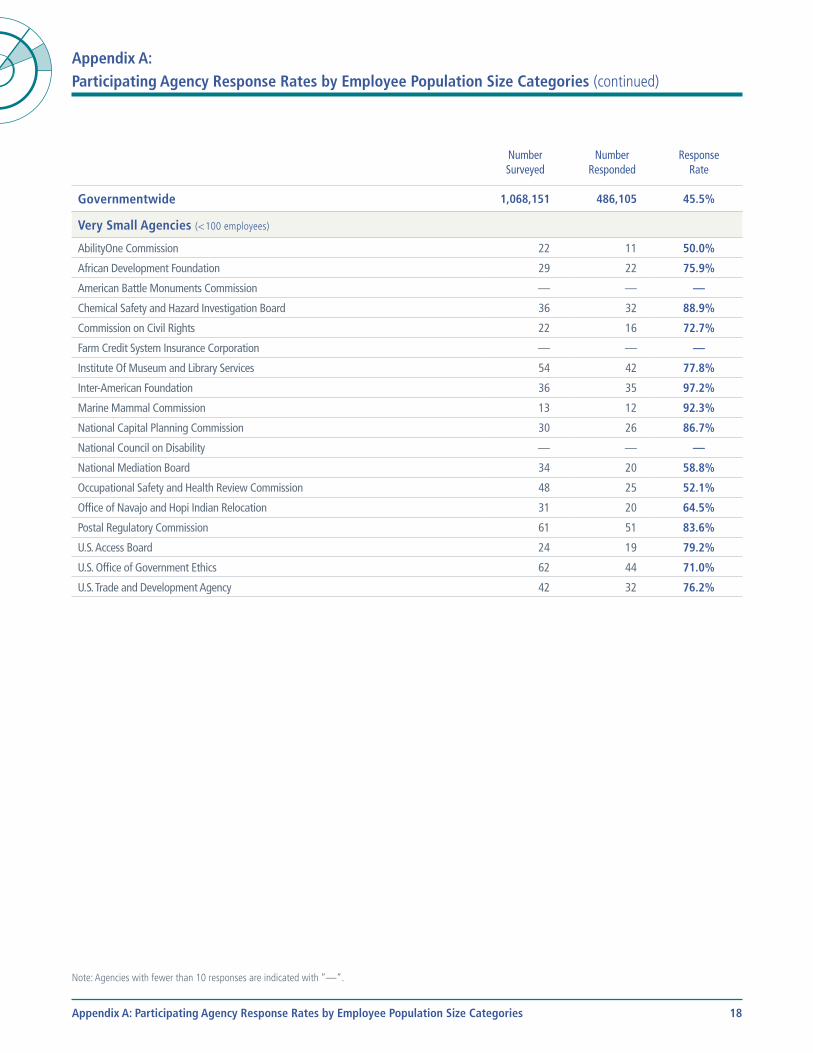
Appendix A: Participating Agency Response Rates by Employee Population Size Categories (continued)
NumberSurveyed
NumberResponded
ResponseRate
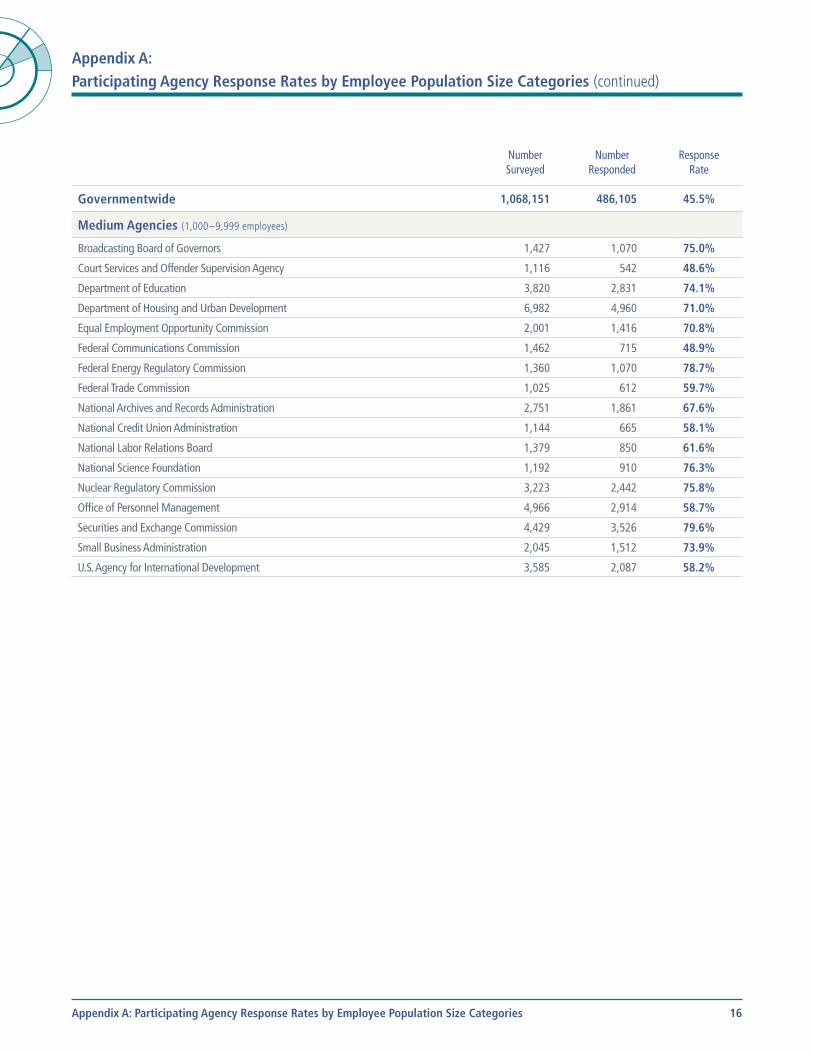
Governmentwide 1,068,151 486,105 45.5%
Medium Agencies (1,000 – 9,999 employees)
Broadcasting Board of Governors 1,427 1,070 75.0%
Court Services and Offender Supervision Agency 1,116 542 48.6%
Department of Education 3,820 2,831 74.1%
Department of Housing and Urban Development 6,982 4,960 71.0%
Equal Employment Opportunity Commission 2,001 1,416 70.8%
Federal Communications Commission 1,462 715 48.9%
Federal Energy Regulatory Commission 1,360 1,070 78.7%
Federal Trade Commission 1,025 612 59.7%
National Archives and Records Administration 2,751 1,861 67.6%
National Credit Union Administration 1,144 665 58.1%
National Labor Relations Board 1,379 850 61.6%
National Science Foundation 1,192 910 76.3%
Nuclear Regulatory Commission 3,223 2,442 75.8%
Office of Personnel Management 4,966 2,914 58.7%
Securities and Exchange Commission 4,429 3,526 79.6%
Small Business Administration 2,045 1,512 73.9%
U.S. Agency for International Development 3,585 2,087 58.2%
Appendix A: Participating Agency Response Rates by Employee Population Size Categories
17
Appendix A: Participating Agency Response Rates by Employee Population Size Categories (continued)
NumberSurveyed
NumberResponded
ResponseRate
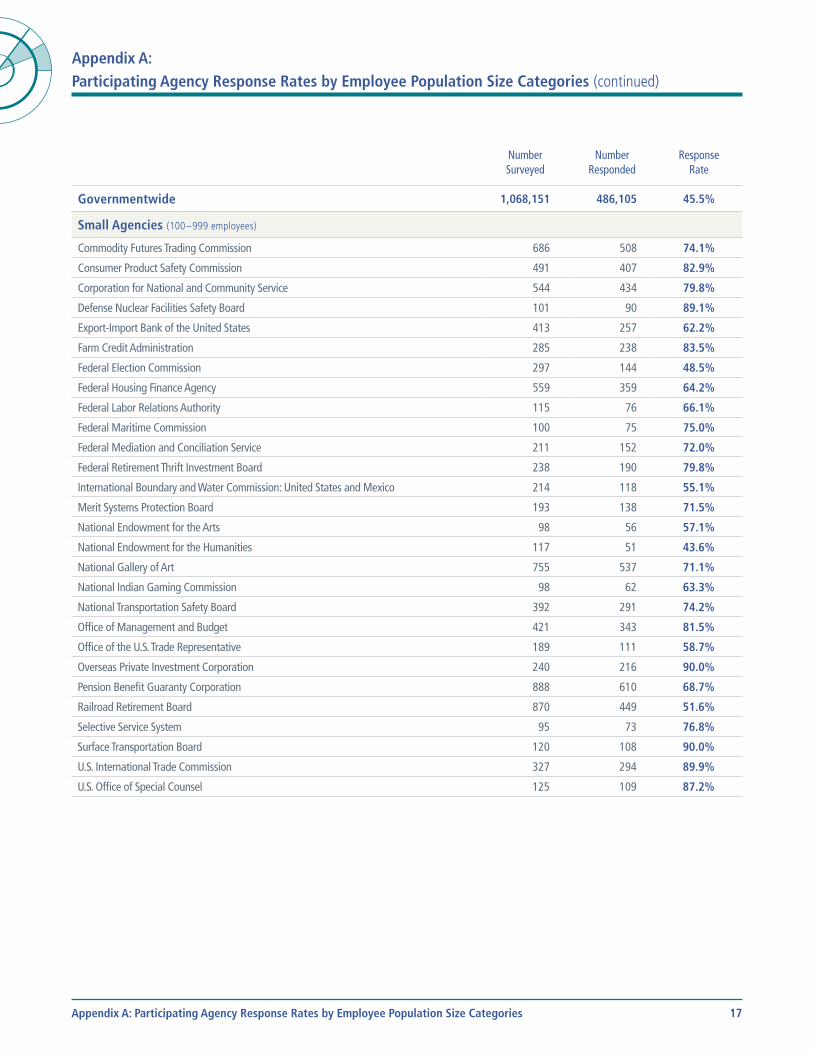
Governmentwide 1,068,151 486,105 45.5%
Small Agencies (100 – 999 employees)
Commodity Futures Trading Commission 686 508 74.1%
Consumer Product Safety Commission 491 407 82.9%
Corporation for National and Community Service 544 434 79.8%
Defense Nuclear Facilities Safety Board 101 90 89.1%
Export-Import Bank of the United States 413 257 62.2%
Farm Credit Administration 285 238 83.5%
Federal Election Commission 297 144 48.5%
Federal Housing Finance Agency 559 359 64.2%
Federal Labor Relations Authority 115 76 66.1%
Federal Maritime Commission 100 75 75.0%
Federal Mediation and Conciliation Service 211 152 72.0%
Federal Retirement Thrift Investment Board 238 190 79.8%
International Boundary and Water Commission: United States and Mexico 214 118 55.1%
Merit Systems Protection Board 193 138 71.5%
National Endowment for the Arts 98 56 57.1%
National Endowment for the Humanities 117 51 43.6%
National Gallery of Art 755 537 71.1%
National Indian Gaming Commission 98 62 63.3%
National Transportation Safety Board 392 291 74.2%
Office of Management and Budget 421 343 81.5%
Office of the U.S. Trade Representative 189 111 58.7%
Overseas Private Investment Corporation 240 216 90.0%
Pension Benefit Guaranty Corporation 888 610 68.7%
Railroad Retirement Board 870 449 51.6%
Selective Service System 95 73 76.8%
Surface Transportation Board 120 108 90.0%
U.S. International Trade Commission 327 294 89.9%
U.S. Office of Special Counsel 125 109 87.2%
Appendix A: Participating Agency Response Rates by Employee Population Size Categories
18
Appendix A: Participating Agency Response Rates by Employee Population Size Categories (continued)
NumberSurveyed
NumberResponded
ResponseRate
Governmentwide 1,068,151 486,105 45.5%
Very Small Agencies (< 100 employees)
AbilityOne Commission 22 11 50.0%
African Development Foundation 29 22 75.9%
American Battle Monuments Commission — — —
Chemical Safety and Hazard Investigation Board 36 32 88.9%
Commission on Civil Rights 22 16 72.7%
Farm Credit System Insurance Corporation — — —
Institute Of Museum and Library Services 54 42 77.8%
Inter-American Foundation 36 35 97.2%
Marine Mammal Commission 13 12 92.3%
National Capital Planning Commission 30 26 86.7%
National Council on Disability — — —
National Mediation Board 34 20 58.8%
Occupational Safety and Health Review Commission 48 25 52.1%
Office of Navajo and Hopi Indian Relocation 31 20 64.5%
Postal Regulatory Commission 61 51 83.6%
U.S. Access Board 24 19 79.2%
U.S. Office of Government Ethics 62 44 71.0%
U.S. Trade and Development Agency 42 32 76.2%
Note: Agencies with fewer than 10 responses are indicated with “—”.
Appendix A: Participating Agency Response Rates by Employee Population Size Categories
19
Appendix B: Trend Analysis
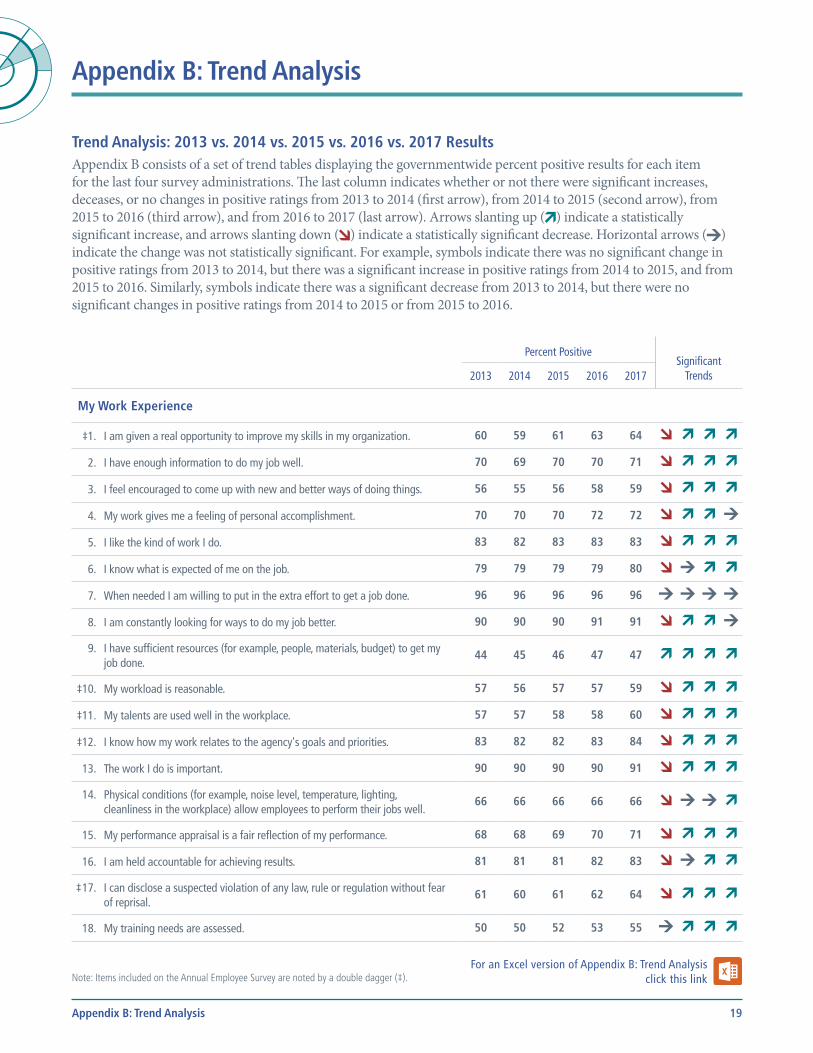
Trend Analysis: 2013 vs. 2014 vs. 2015 vs. 2016 vs. 2017 ResultsAppendix B consists of a set of trend tables displaying the governmentwide percent positive results for each item for the last four survey administrations. The last column indicates whether or not there were significant increases, deceases, or no changes in positive ratings from 2013 to 2014 (first arrow), from 2014 to 2015 (second arrow), from 2015 to 2016 (third arrow), and from 2016 to 2017 (last arrow). Arrows slanting up ( ) indicate a statistically significant increase, and arrows slanting down ( ) indicate a statistically significant decrease. Horizontal arrows ( ) indicate the change was not statistically significant. For example, symbols indicate there was no significant change in positive ratings from 2013 to 2014, but there was a significant increase in positive ratings from 2014 to 2015, and from 2015 to 2016. Similarly, symbols indicate there was a significant decrease from 2013 to 2014, but there were no significant changes in positive ratings from 2014 to 2015 or from 2015 to 2016.
Percent Positive
Significant Trends2013 2014 2015 2016 2017
My Work Experience
‡1. I am given a real opportunity to improve my skills in my organization. 60 59 61 63 64Significant decrease in positive ratings
from 2013 to 2014.Significant increase in positive ratings
from 2014 to 2015.Significant increase in positive ratings
from 2015 to 2016.Significant increase in positive ratings
from 2016 to 2017.
2. I have enough information to do my job well. 70 69 70 70 71Significant decrease in positive ratings
from 2013 to 2014.Significant increase in positive ratings
from 2014 to 2015.Significant increase in positive ratings
from 2015 to 2016.Significant increase in positive ratings
from 2016 to 2017.
3. I feel encouraged to come up with new and better ways of doing things. 56 55 56 58 59Significant decrease in positive ratings
from 2013 to 2014.Significant increase in positive ratings
from 2014 to 2015.Significant increase in positive ratings
from 2015 to 2016.Significant increase in positive ratings
from 2016 to 2017.
4. My work gives me a feeling of personal accomplishment. 70 70 70 72 72Significant decrease in positive ratings
from 2013 to 2014.Significant increase in positive ratings
from 2014 to 2015.Significant increase in positive ratings
from 2015 to 2016.No significant change in positive ratings
from 2016 to 2017.
5. I like the kind of work I do. 83 82 83 83 83Significant decrease in positive ratings
from 2013 to 2014.Significant increase in positive ratings
from 2014 to 2015.Significant increase in positive ratings
from 2015 to 2016.Significant increase in positive ratings
from 2016 to 2017.
6. I know what is expected of me on the job. 79 79 79 79 80Significant decrease in positive ratings
from 2013 to 2014.No significant change in positive ratings
from 2014 to 2015.
Significant increase in positive ratings from 2015 to 2016.
Significant increase in positive ratings from 2016 to 2017.
7. When needed I am willing to put in the extra effort to get a job done. 96 96 96 96 96No significant change in positive ratings
from 2013 to 2014.No significant change in positive ratings
from 2014 to 2015.No significant change in positive ratings
from 2015 to 2016.No significant change in positive ratings
from 2016 to 2017.
8. I am constantly looking for ways to do my job better. 90 90 90 91 91Significant decrease in positive ratings
from 2013 to 2014.Significant increase in positive ratings
from 2014 to 2015.Significant increase in positive ratings
from 2015 to 2016.No significant change in positive ratings
from 2016 to 2017.
9. I have sufficient resources (for example, people, materials, budget) to get my job done.
44 45 46 47 47Significant increase in positive ratings
from 2013 to 2014.Significant increase in positive ratings
from 2014 to 2015.Significant increase in positive ratings
from 2015 to 2016.Significant increase in positive ratings
from 2016 to 2017.
‡10. My workload is reasonable. 57 56 57 57 59Significant decrease in positive ratings
from 2013 to 2014.Significant increase in positive ratings
from 2014 to 2015.Significant increase in positive ratings
from 2015 to 2016.Significant increase in positive ratings
from 2016 to 2017.
‡11. My talents are used well in the workplace. 57 57 58 58 60Significant decrease in positive ratings
from 2013 to 2014.Significant increase in positive ratings
from 2014 to 2015.Significant increase in positive ratings
from 2015 to 2016.Significant increase in positive ratings
from 2016 to 2017.
‡12. I know how my work relates to the agency's goals and priorities. 83 82 82 83 84Significant decrease in positive ratings
from 2013 to 2014.Significant increase in positive ratings
from 2014 to 2015.Significant increase in positive ratings
from 2015 to 2016.Significant increase in positive ratings
from 2016 to 2017.
13. The work I do is important. 90 90 90 90 91Significant decrease in positive ratings
from 2013 to 2014.Significant increase in positive ratings
from 2014 to 2015.Significant increase in positive ratings
from 2015 to 2016.Significant increase in positive ratings
from 2016 to 2017.
14. Physical conditions (for example, noise level, temperature, lighting, cleanliness in the workplace) allow employees to perform their jobs well.
66 66 66 66 66Significant decrease in positive ratings
from 2013 to 2014.No significant change in positive ratings
from 2014 to 2015.No significant change in positive ratings
from 2015 to 2016.
Significant increase in positive ratings from 2016 to 2017.
15. My performance appraisal is a fair reflection of my performance. 68 68 69 70 71Significant decrease in positive ratings
from 2013 to 2014.Significant increase in positive ratings
from 2014 to 2015.Significant increase in positive ratings
from 2015 to 2016.Significant increase in positive ratings
from 2016 to 2017.
16. I am held accountable for achieving results. 81 81 81 82 83Significant decrease in positive ratings
from 2013 to 2014.No significant change in positive ratings
from 2014 to 2015.
Significant increase in positive ratings from 2015 to 2016.
Significant increase in positive ratings from 2016 to 2017.
‡ 17. I can disclose a suspected violation of any law, rule or regulation without fear of reprisal.
61 60 61 62 64Significant decrease in positive ratings
from 2013 to 2014.Significant increase in positive ratings
from 2014 to 2015.Significant increase in positive ratings
from 2015 to 2016.Significant increase in positive ratings
from 2016 to 2017.
18. My training needs are assessed. 50 50 52 53 55No significant change in positive ratings
from 2013 to 2014.
Significant increase in positive ratings from 2014 to 2015.
Significant increase in positive ratings from 2015 to 2016.
Significant increase in positive ratings from 2016 to 2017.
Note: Items included on the Annual Employee Survey are noted by a double dagger (‡).For an Excel version of Appendix B: Trend Analysis
click this link
Appendix B: Trend Analysis
20
Appendix B: Trend Analysis (continued)
Percent Positive
Significant Trends2013 2014 2015 2016 2017
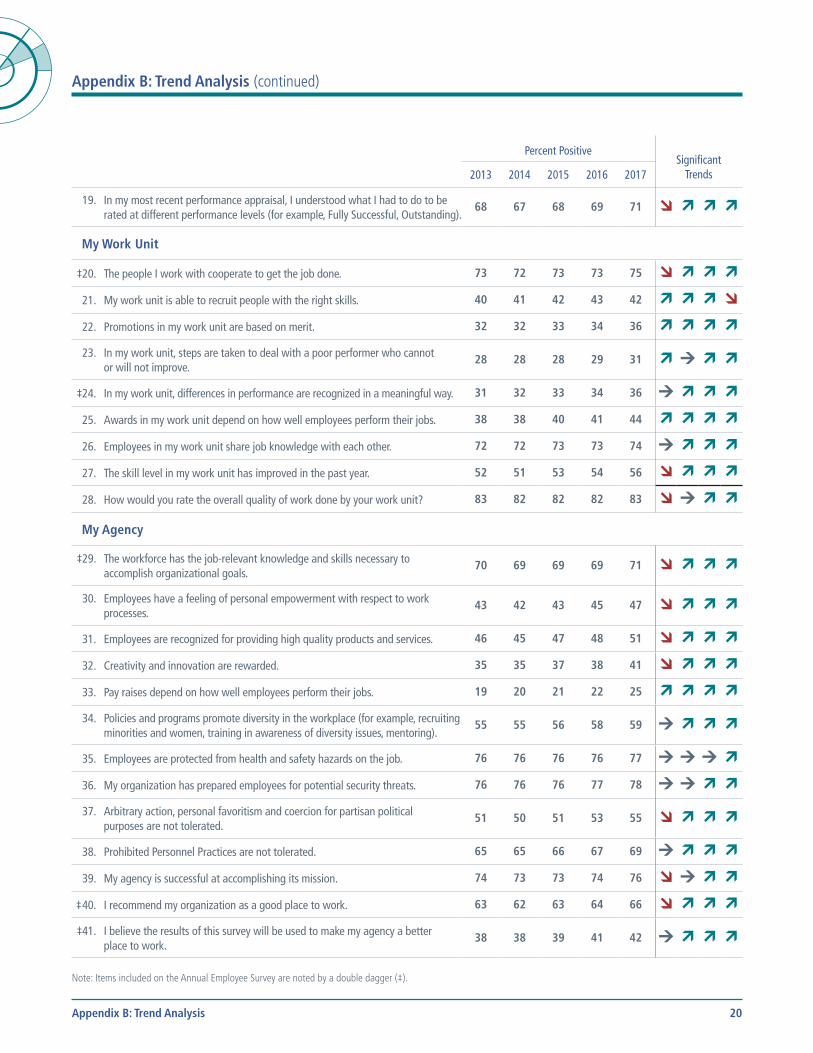
19. In my most recent performance appraisal, I understood what I had to do to be rated at different performance levels (for example, Fully Successful, Outstanding).
68 67 68 69 71Significant decrease in positive ratings
from 2013 to 2014.Significant increase in positive ratings
from 2014 to 2015.Significant increase in positive ratings
from 2014 to 2015.Significant increase in positive ratings
from 2016 to 2017.
My Work Unit
‡20. The people I work with cooperate to get the job done. 73 72 73 73 75Significant decrease in positive ratings
from 2013 to 2014.Significant increase in positive ratings
from 2014 to 2015.Significant increase in positive ratings
from 2014 to 2015.Significant increase in positive ratings
from 2016 to 2017.
21. My work unit is able to recruit people with the right skills. 40 41 42 43 42Significant increase in positive ratings
from 2013 to 2014.Significant increase in positive ratings
from 2014 to 2015.Significant increase in positive ratings
from 2014 to 2015.Significant decrease in positive ratings
from 2016 to 2017.
22. Promotions in my work unit are based on merit. 32 32 33 34 36Significant increase in positive ratings
from 2013 to 2014.Significant increase in positive ratings
from 2014 to 2015.Significant increase in positive ratings
from 2014 to 2015.Significant increase in positive ratings
from 2016 to 2017.
23. In my work unit, steps are taken to deal with a poor performer who cannot or will not improve.
28 28 28 29 31Significant increase in positive ratings
from 2013 to 2014.No significant change in positive ratings
from 2014 to 2015.
Significant increase in positive ratings from 2014 to 2015.
Significant increase in positive ratings from 2016 to 2017.
‡24. In my work unit, differences in performance are recognized in a meaningful way. 31 32 33 34 36No significant change in positive ratings
from 2013 to 2014.
Significant increase in positive ratings from 2014 to 2015.
Significant increase in positive ratings from 2014 to 2015.
Significant increase in positive ratings from 2016 to 2017.
25. Awards in my work unit depend on how well employees perform their jobs. 38 38 40 41 44Significant increase in positive ratings
from 2013 to 2014.Significant increase in positive ratings
from 2014 to 2015.Significant increase in positive ratings
from 2014 to 2015.Significant increase in positive ratings
from 2016 to 2017.
26. Employees in my work unit share job knowledge with each other. 72 72 73 73 74No significant change in positive ratings
from 2013 to 2014.
Significant increase in positive ratings from 2014 to 2015.
Significant increase in positive ratings from 2014 to 2015.
Significant increase in positive ratings from 2016 to 2017.
27. The skill level in my work unit has improved in the past year. 52 51 53 54 56Significant decrease in positive ratings
from 2013 to 2014.Significant increase in positive ratings
from 2014 to 2015.Significant increase in positive ratings
from 2014 to 2015.Significant increase in positive ratings
from 2016 to 2017.
28. How would you rate the overall quality of work done by your work unit? 83 82 82 82 83Significant decrease in positive ratings
from 2013 to 2014.No significant change in positive ratings
from 2014 to 2015.
Significant increase in positive ratings from 2014 to 2015.
Significant increase in positive ratings from 2016 to 2017.
My Agency
‡29. The workforce has the job-relevant knowledge and skills necessary to accomplish organizational goals.
70 69 69 69 71Significant decrease in positive ratings
from 2013 to 2014.Significant increase in positive ratings
from 2014 to 2015.Significant increase in positive ratings
from 2014 to 2015.Significant increase in positive ratings
from 2016 to 2017.
30. Employees have a feeling of personal empowerment with respect to work processes.
43 42 43 45 47Significant decrease in positive ratings
from 2013 to 2014.Significant increase in positive ratings
from 2014 to 2015.Significant increase in positive ratings
from 2014 to 2015.Significant increase in positive ratings
from 2016 to 2017.
31. Employees are recognized for providing high quality products and services. 46 45 47 48 51Significant decrease in positive ratings
from 2013 to 2014.Significant increase in positive ratings
from 2014 to 2015.Significant increase in positive ratings
from 2014 to 2015.Significant increase in positive ratings
from 2016 to 2017.
32. Creativity and innovation are rewarded. 35 35 37 38 41Significant decrease in positive ratings
from 2013 to 2014.Significant increase in positive ratings
from 2014 to 2015.Significant increase in positive ratings
from 2014 to 2015.Significant increase in positive ratings
from 2016 to 2017.
33. Pay raises depend on how well employees perform their jobs. 19 20 21 22 25Significant increase in positive ratings
from 2013 to 2014.Significant increase in positive ratings
from 2014 to 2015.Significant increase in positive ratings
from 2014 to 2015.Significant increase in positive ratings
from 2016 to 2017.
34. Policies and programs promote diversity in the workplace (for example, recruiting minorities and women, training in awareness of diversity issues, mentoring).
55 55 56 58 59No significant change in positive ratings
from 2013 to 2014.
Significant increase in positive ratings from 2014 to 2015.
Significant increase in positive ratings from 2014 to 2015.
Significant increase in positive ratings from 2016 to 2017.
35. Employees are protected from health and safety hazards on the job. 76 76 76 76 77No significant change in positive ratings
from 2013 to 2014.No significant change in positive ratings
from 2014 to 2015.No significant change in positive ratings
from 2014 to 2015.
Significant increase in positive ratings from 2016 to 2017.
36. My organization has prepared employees for potential security threats. 76 76 76 77 78No significant change in positive ratings
from 2013 to 2014.No significant change in positive ratings
from 2014 to 2015.
Significant increase in positive ratings from 2014 to 2015.
Significant increase in positive ratings from 2016 to 2017.
37. Arbitrary action, personal favoritism and coercion for partisan political purposes are not tolerated.
51 50 51 53 55Significant decrease in positive ratings
from 2013 to 2014.Significant increase in positive ratings
from 2014 to 2015.Significant increase in positive ratings
from 2014 to 2015.Significant increase in positive ratings
from 2016 to 2017.
38. Prohibited Personnel Practices are not tolerated. 65 65 66 67 69No significant change in positive ratings
from 2013 to 2014.
Significant increase in positive ratings from 2014 to 2015.
Significant increase in positive ratings from 2014 to 2015.
Significant increase in positive ratings from 2016 to 2017.
39. My agency is successful at accomplishing its mission. 74 73 73 74 76Significant decrease in positive ratings
from 2013 to 2014.No significant change in positive ratings
from 2014 to 2015.
Significant increase in positive ratings from 2014 to 2015.
Significant increase in positive ratings from 2016 to 2017.
‡ 40. I recommend my organization as a good place to work. 63 62 63 64 66Significant decrease in positive ratings
from 2013 to 2014.Significant increase in positive ratings
from 2014 to 2015.Significant increase in positive ratings
from 2014 to 2015.Significant increase in positive ratings
from 2016 to 2017.
‡41. I believe the results of this survey will be used to make my agency a better place to work.
38 38 39 41 42No significant change in positive ratings
from 2013 to 2014.
Significant increase in positive ratings from 2014 to 2015.
Significant increase in positive ratings from 2014 to 2015.
Significant increase in positive ratings from 2016 to 2017.
Note: Items included on the Annual Employee Survey are noted by a double dagger (‡).
Appendix B: Trend Analysis
21
Appendix B: Trend Analysis (continued)
Percent Positive
Significant Trends2013 2014 2015 2016 2017
My Supervisor
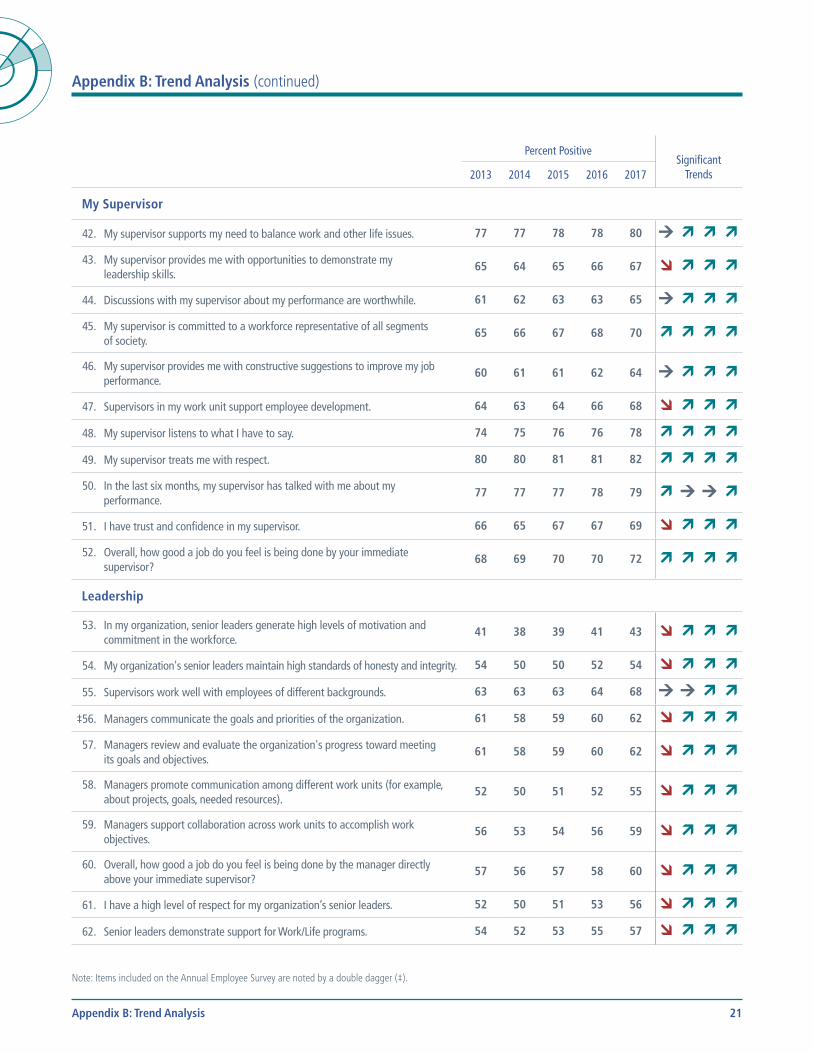
42. My supervisor supports my need to balance work and other life issues. 77 77 78 78 80No significant change in positive ratings
from 2013 to 2014.
Significant increase in positive ratings from 2014 to 2015.
Significant increase in positive ratings from 2014 to 2015.
Significant increase in positive ratings from 2016 to 2017.
43. My supervisor provides me with opportunities to demonstrate my leadership skills.
65 64 65 66 67Significant decrease in positive ratings
from 2013 to 2014.Significant increase in positive ratings
from 2014 to 2015.Significant increase in positive ratings
from 2014 to 2015.Significant increase in positive ratings
from 2016 to 2017.
44. Discussions with my supervisor about my performance are worthwhile. 61 62 63 63 65No significant change in positive ratings
from 2013 to 2014.
Significant increase in positive ratings from 2014 to 2015.
Significant increase in positive ratings from 2014 to 2015.
Significant increase in positive ratings from 2016 to 2017.
45. My supervisor is committed to a workforce representative of all segments of society.
65 66 67 68 70Significant increase in positive ratings
from 2013 to 2014.Significant increase in positive ratings
from 2014 to 2015.Significant increase in positive ratings
from 2014 to 2015.Significant increase in positive ratings
from 2016 to 2017.
46. My supervisor provides me with constructive suggestions to improve my job performance.
60 61 61 62 64No significant change in positive ratings
from 2013 to 2014.
Significant increase in positive ratings from 2014 to 2015.
Significant increase in positive ratings from 2014 to 2015.
Significant increase in positive ratings from 2016 to 2017.
47. Supervisors in my work unit support employee development. 64 63 64 66 68Significant decrease in positive ratings
from 2013 to 2014.Significant increase in positive ratings
from 2014 to 2015.Significant increase in positive ratings
from 2014 to 2015.Significant increase in positive ratings
from 2016 to 2017.
48. My supervisor listens to what I have to say. 74 75 76 76 78Significant increase in positive ratings
from 2013 to 2014.Significant increase in positive ratings
from 2014 to 2015.Significant increase in positive ratings
from 2014 to 2015.Significant increase in positive ratings
from 2016 to 2017.
49. My supervisor treats me with respect. 80 80 81 81 82Significant increase in positive ratings
from 2013 to 2014.Significant increase in positive ratings
from 2014 to 2015.Significant increase in positive ratings
from 2014 to 2015.Significant increase in positive ratings
from 2016 to 2017.
50. In the last six months, my supervisor has talked with me about my performance.
77 77 77 78 79Significant increase in positive ratings
from 2013 to 2014.No significant change in positive ratings
from 2014 to 2015.No significant change in positive ratings
from 2014 to 2015.
Significant increase in positive ratings from 2016 to 2017.
51. I have trust and confidence in my supervisor. 66 65 67 67 69Significant decrease in positive ratings
from 2013 to 2014.Significant increase in positive ratings
from 2014 to 2015.Significant increase in positive ratings
from 2014 to 2015.Significant increase in positive ratings
from 2016 to 2017.
52. Overall, how good a job do you feel is being done by your immediate supervisor?
68 69 70 70 72Significant increase in positive ratings
from 2013 to 2014.Significant increase in positive ratings
from 2014 to 2015.Significant increase in positive ratings
from 2014 to 2015.Significant increase in positive ratings
from 2016 to 2017.
Leadership
53. In my organization, senior leaders generate high levels of motivation and commitment in the workforce.
41 38 39 41 43Significant decrease in positive ratings
from 2013 to 2014.Significant increase in positive ratings
from 2014 to 2015.Significant increase in positive ratings
from 2014 to 2015.Significant increase in positive ratings
from 2016 to 2017.
54. My organization's senior leaders maintain high standards of honesty and integrity. 54 50 50 52 54Significant decrease in positive ratings
from 2013 to 2014.Significant increase in positive ratings
from 2014 to 2015.Significant increase in positive ratings
from 2014 to 2015.Significant increase in positive ratings
from 2016 to 2017.
55. Supervisors work well with employees of different backgrounds. 63 63 63 64 68No significant change in positive ratings
from 2013 to 2014.No significant change in positive ratings
from 2014 to 2015.
Significant increase in positive ratings from 2014 to 2015.
Significant increase in positive ratings from 2016 to 2017.
‡56. Managers communicate the goals and priorities of the organization. 61 58 59 60 62Significant decrease in positive ratings
from 2013 to 2014.Significant increase in positive ratings
from 2014 to 2015.Significant increase in positive ratings
from 2014 to 2015.Significant increase in positive ratings
from 2016 to 2017.
57. Managers review and evaluate the organization's progress toward meeting its goals and objectives.
61 58 59 60 62Significant decrease in positive ratings
from 2013 to 2014.Significant increase in positive ratings
from 2014 to 2015.Significant increase in positive ratings
from 2014 to 2015.Significant increase in positive ratings
from 2016 to 2017.
58. Managers promote communication among different work units (for example, about projects, goals, needed resources).
52 50 51 52 55Significant decrease in positive ratings
from 2013 to 2014.Significant increase in positive ratings
from 2014 to 2015.Significant increase in positive ratings
from 2014 to 2015.Significant increase in positive ratings
from 2016 to 2017.
59. Managers support collaboration across work units to accomplish work objectives.
56 53 54 56 59Significant decrease in positive ratings
from 2013 to 2014.Significant increase in positive ratings
from 2014 to 2015.Significant increase in positive ratings
from 2014 to 2015.Significant increase in positive ratings
from 2016 to 2017.
60. Overall, how good a job do you feel is being done by the manager directly above your immediate supervisor?
57 56 57 58 60Significant decrease in positive ratings
from 2013 to 2014.Significant increase in positive ratings
from 2014 to 2015.Significant increase in positive ratings
from 2014 to 2015.Significant increase in positive ratings
from 2016 to 2017.
61. I have a high level of respect for my organization’s senior leaders. 52 50 51 53 56Significant decrease in positive ratings
from 2013 to 2014.Significant increase in positive ratings
from 2014 to 2015.Significant increase in positive ratings
from 2014 to 2015.Significant increase in positive ratings
from 2016 to 2017.
62. Senior leaders demonstrate support for Work/Life programs. 54 52 53 55 57Significant decrease in positive ratings
from 2013 to 2014.Significant increase in positive ratings
from 2014 to 2015.Significant increase in positive ratings
from 2014 to 2015.Significant increase in positive ratings
from 2016 to 2017.
Note: Items included on the Annual Employee Survey are noted by a double dagger (‡).
Appendix B: Trend Analysis
22
Appendix B: Trend Analysis (continued)
Percent Positive
Significant Trends2013 2014 2015 2016 2017
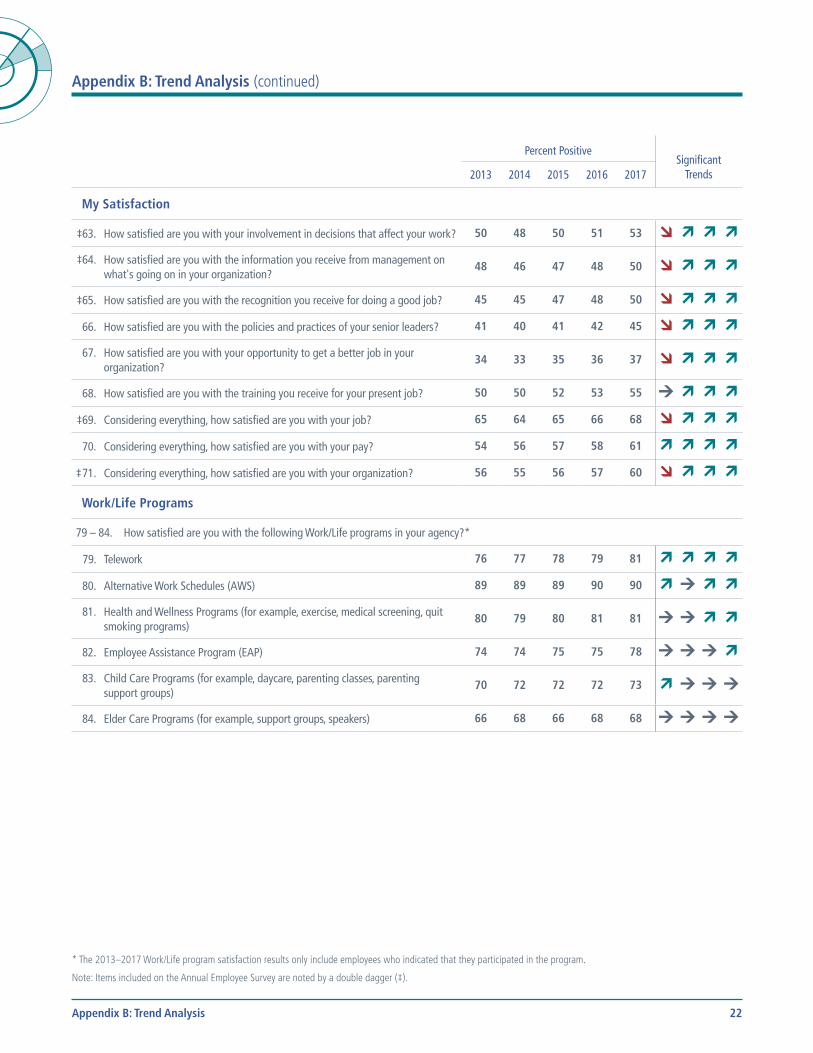
My Satisfaction
‡63. How satisfied are you with your involvement in decisions that affect your work? 50 48 50 51 53Significant decrease in positive ratings
from 2013 to 2014.Significant increase in positive ratings
from 2014 to 2015.Significant increase in positive ratings
from 2014 to 2015.Significant increase in positive ratings
from 2016 to 2017.
‡64. How satisfied are you with the information you receive from management on what's going on in your organization?
48 46 47 48 50Significant decrease in positive ratings
from 2013 to 2014.Significant increase in positive ratings
from 2014 to 2015.Significant increase in positive ratings
from 2014 to 2015.Significant increase in positive ratings
from 2016 to 2017.
‡65. How satisfied are you with the recognition you receive for doing a good job? 45 45 47 48 50Significant decrease in positive ratings
from 2013 to 2014.Significant increase in positive ratings
from 2014 to 2015.Significant increase in positive ratings
from 2014 to 2015.Significant increase in positive ratings
from 2016 to 2017.
66. How satisfied are you with the policies and practices of your senior leaders? 41 40 41 42 45Significant decrease in positive ratings
from 2013 to 2014.Significant increase in positive ratings
from 2014 to 2015.Significant increase in positive ratings
from 2014 to 2015.Significant increase in positive ratings
from 2016 to 2017.
67. How satisfied are you with your opportunity to get a better job in your organization?
34 33 35 36 37Significant decrease in positive ratings
from 2013 to 2014.Significant increase in positive ratings
from 2014 to 2015.Significant increase in positive ratings
from 2014 to 2015.Significant increase in positive ratings
from 2016 to 2017.
68. How satisfied are you with the training you receive for your present job? 50 50 52 53 55No significant change in positive ratings
from 2013 to 2014.
Significant increase in positive ratings from 2014 to 2015.
Significant increase in positive ratings from 2014 to 2015.
Significant increase in positive ratings from 2016 to 2017.
‡69. Considering everything, how satisfied are you with your job? 65 64 65 66 68Significant decrease in positive ratings
from 2013 to 2014.Significant increase in positive ratings
from 2014 to 2015.Significant increase in positive ratings
from 2014 to 2015.Significant increase in positive ratings
from 2016 to 2017.
70. Considering everything, how satisfied are you with your pay? 54 56 57 58 61Significant increase in positive ratings
from 2013 to 2014.Significant increase in positive ratings
from 2014 to 2015.Significant increase in positive ratings
from 2014 to 2015.Significant increase in positive ratings
from 2016 to 2017.
‡ 71. Considering everything, how satisfied are you with your organization? 56 55 56 57 60Significant decrease in positive ratings
from 2013 to 2014.Significant increase in positive ratings
from 2014 to 2015.Significant increase in positive ratings
from 2014 to 2015.Significant increase in positive ratings
from 2016 to 2017.
Work/Life Programs
79 – 84. How satisfied are you with the following Work/Life programs in your agency?*
79. Telework 76 77 78 79 81Significant increase in positive ratings
from 2013 to 2014.Significant increase in positive ratings
from 2014 to 2015.Significant increase in positive ratings
from 2014 to 2015.Significant increase in positive ratings
from 2016 to 2017.
80. Alternative Work Schedules (AWS) 89 89 89 90 90Significant increase in positive ratings
from 2013 to 2014.No significant change in positive ratings
from 2014 to 2015.
Significant increase in positive ratings from 2014 to 2015.
Significant increase in positive ratings from 2016 to 2017.
81. Health and Wellness Programs (for example, exercise, medical screening, quit smoking programs)
80 79 80 81 81No significant change in positive ratings
from 2013 to 2014.No significant change in positive ratings
from 2014 to 2015.
Significant increase in positive ratings from 2014 to 2015.
Significant increase in positive ratings from 2016 to 2017.
82. Employee Assistance Program (EAP) 74 74 75 75 78No significant change in positive ratings
from 2013 to 2014.No significant change in positive ratings
from 2014 to 2015.No significant change in positive ratings
from 2014 to 2015
Significant increase in positive ratings from 2016 to 2017.
83. Child Care Programs (for example, daycare, parenting classes, parenting support groups)
70 72 72 72 73Significant increase in positive ratings
from 2013 to 2014.No significant change in positive ratings
from 2014 to 2015.No significant change in positive ratings
from 2014 to 2015No significant change in positive ratings
from 2016 to 2017.
84. Elder Care Programs (for example, support groups, speakers) 66 68 66 68 68No significant change in positive ratings
from 2013 to 2014.No significant change in positive ratings
from 2014 to 2015.No significant change in positive ratings
from 2014 to 2015No significant change in positive ratings
from 2016 to 2017.
* The 2013–2017 Work/Life program satisfaction results only include employees who indicated that they participated in the program.
Note: Items included on the Annual Employee Survey are noted by a double dagger (‡).
Appendix B: Trend Analysis
23
Appendix C: Work/Life Programs: Participation & Satisfaction
2017
Percentages
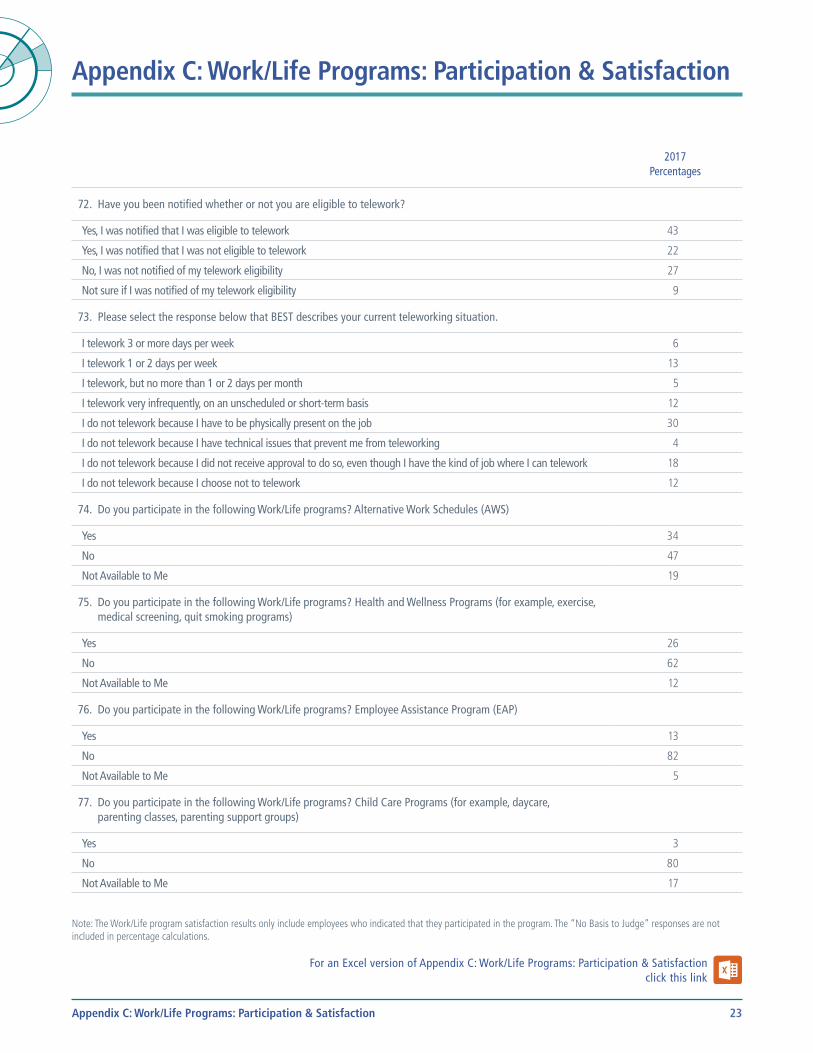
72. Have you been notified whether or not you are eligible to telework?
Yes, I was notified that I was eligible to telework 43
Yes, I was notified that I was not eligible to telework 22
No, I was not notified of my telework eligibility 27
Not sure if I was notified of my telework eligibility 9
73. Please select the response below that BEST describes your current teleworking situation.
I telework 3 or more days per week 6
I telework 1 or 2 days per week 13
I telework, but no more than 1 or 2 days per month 5
I telework very infrequently, on an unscheduled or short-term basis 12
I do not telework because I have to be physically present on the job 30
I do not telework because I have technical issues that prevent me from teleworking 4
I do not telework because I did not receive approval to do so, even though I have the kind of job where I can telework 18
I do not telework because I choose not to telework 12
74. Do you participate in the following Work/Life programs? Alternative Work Schedules (AWS)
Yes 34
No 47
Not Available to Me 19
75. Do you participate in the following Work/Life programs? Health and Wellness Programs (for example, exercise, medical screening, quit smoking programs)
Yes 26
No 62
Not Available to Me 12
76. Do you participate in the following Work/Life programs? Employee Assistance Program (EAP)
Yes 13
No 82
Not Available to Me 5
77. Do you participate in the following Work/Life programs? Child Care Programs (for example, daycare, parenting classes, parenting support groups)
Yes 3
No 80
Not Available to Me 17
Note: The Work/Life program satisfaction results only include employees who indicated that they participated in the program. The “No Basis to Judge” responses are not included in percentage calculations.
For an Excel version of Appendix C: Work/Life Programs: Participation & Satisfactionclick this link
Appendix C: Work/Life Programs: Participation & Satisfaction
24
Appendix C: Work/Life Programs: Participation & Satisfaction (continued)
2017
Percentages
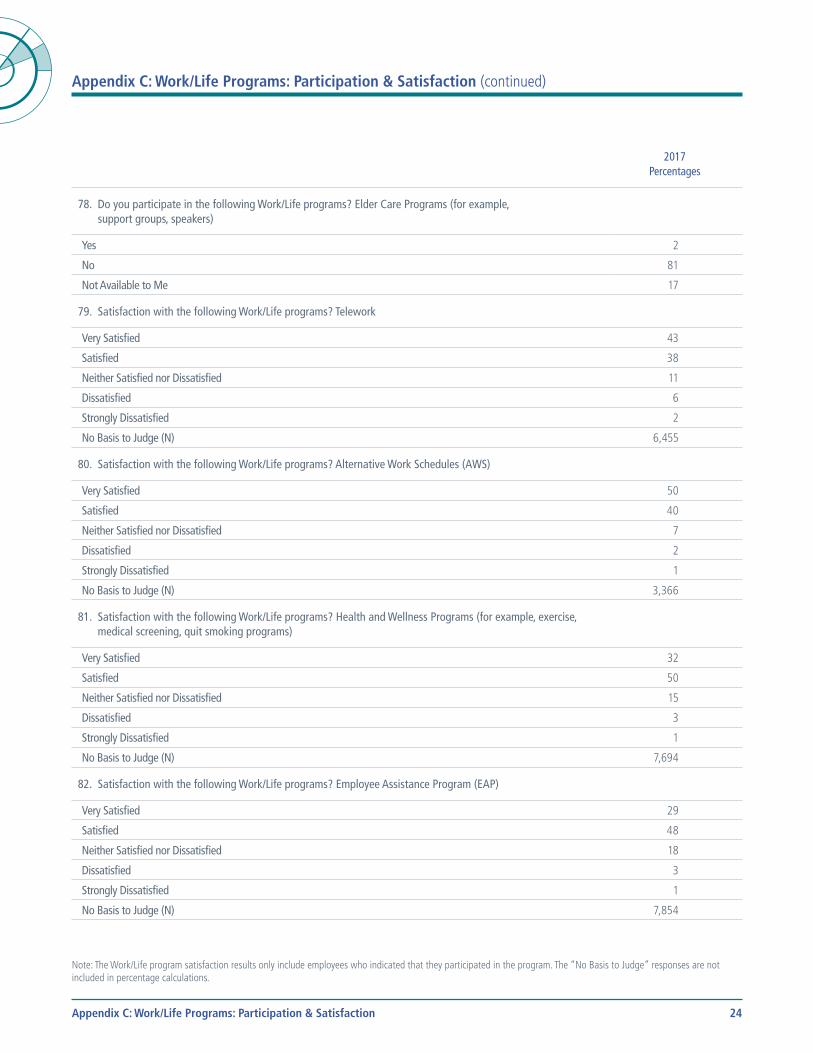
78. Do you participate in the following Work/Life programs? Elder Care Programs (for example, support groups, speakers)
Yes 2
No 81
Not Available to Me 17
79. Satisfaction with the following Work/Life programs? Telework
Very Satisfied 43
Satisfied 38
Neither Satisfied nor Dissatisfied 11
Dissatisfied 6
Strongly Dissatisfied 2
No Basis to Judge (N) 6,455
80. Satisfaction with the following Work/Life programs? Alternative Work Schedules (AWS)
Very Satisfied 50
Satisfied 40
Neither Satisfied nor Dissatisfied 7
Dissatisfied 2
Strongly Dissatisfied 1
No Basis to Judge (N) 3,366
81. Satisfaction with the following Work/Life programs? Health and Wellness Programs (for example, exercise, medical screening, quit smoking programs)
Very Satisfied 32
Satisfied 50
Neither Satisfied nor Dissatisfied 15
Dissatisfied 3
Strongly Dissatisfied 1
No Basis to Judge (N) 7,694
82. Satisfaction with the following Work/Life programs? Employee Assistance Program (EAP)
Very Satisfied 29
Satisfied 48
Neither Satisfied nor Dissatisfied 18
Dissatisfied 3
Strongly Dissatisfied 1
No Basis to Judge (N) 7,854
Note: The Work/Life program satisfaction results only include employees who indicated that they participated in the program. The “No Basis to Judge” responses are not included in percentage calculations.
Appendix C: Work/Life Programs: Participation & Satisfaction
25
Appendix C: Work/Life Programs: Participation & Satisfaction (continued)
2017
Percentages
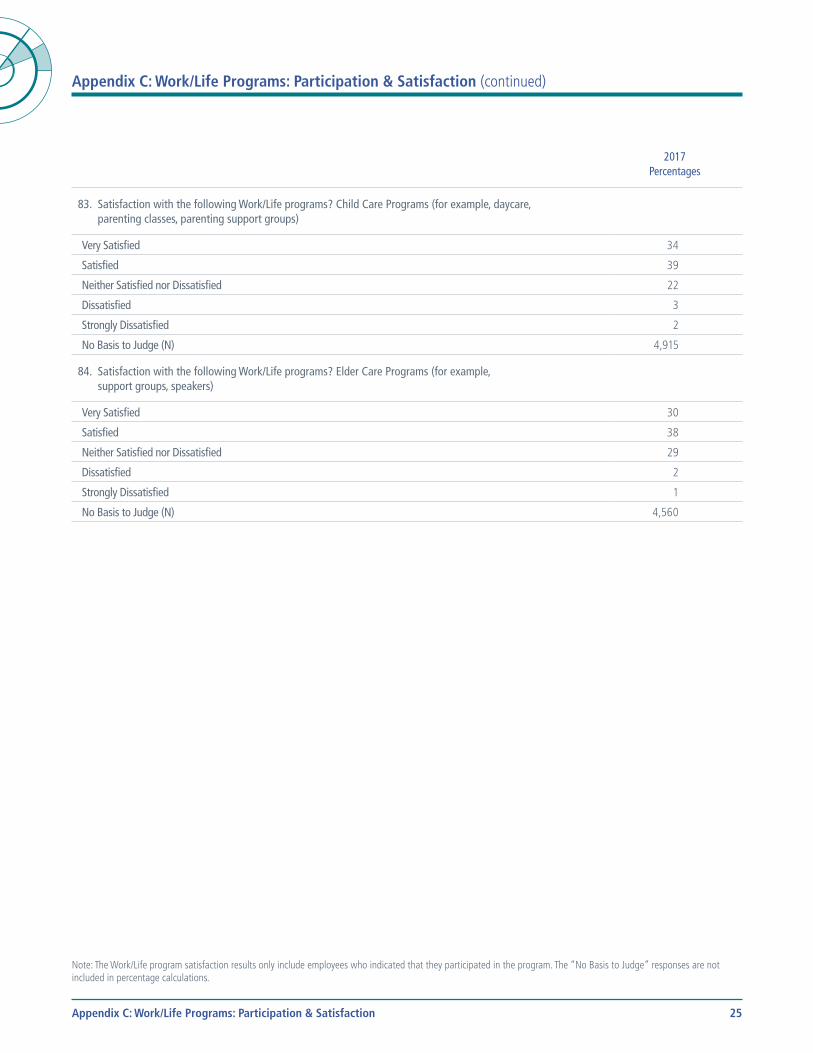
83. Satisfaction with the following Work/Life programs? Child Care Programs (for example, daycare, parenting classes, parenting support groups)
Very Satisfied 34
Satisfied 39
Neither Satisfied nor Dissatisfied 22
Dissatisfied 3
Strongly Dissatisfied 2
No Basis to Judge (N) 4,915
84. Satisfaction with the following Work/Life programs? Elder Care Programs (for example, support groups, speakers)
Very Satisfied 30
Satisfied 38
Neither Satisfied nor Dissatisfied 29
Dissatisfied 2
Strongly Dissatisfied 1
No Basis to Judge (N) 4,560
Note: The Work/Life program satisfaction results only include employees who indicated that they participated in the program. The “No Basis to Judge” responses are not included in percentage calculations.
Appendix C: Work/Life Programs: Participation & Satisfaction
26
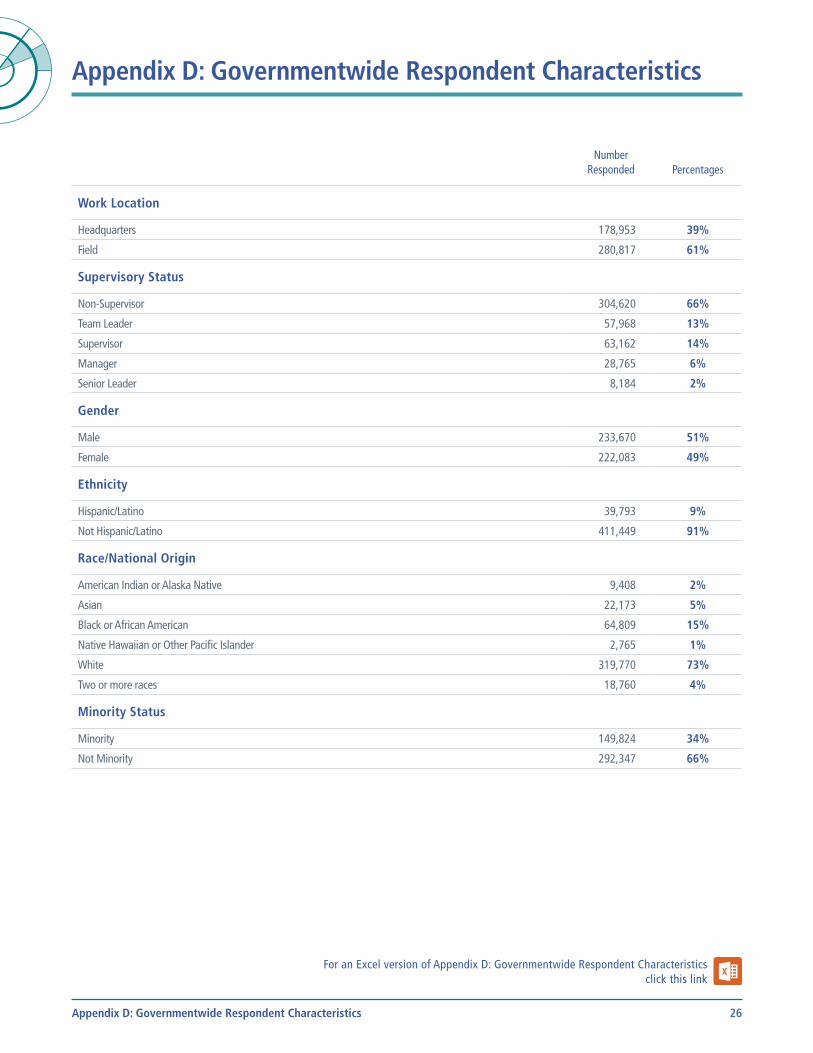
Appendix D: Governmentwide Respondent Characteristics
NumberResponded Percentages
Work Location
Headquarters 178,953 39%
Field 280,817 61%
Supervisory Status
Non-Supervisor 304,620 66%
Team Leader 57,968 13%
Supervisor 63,162 14%
Manager 28,765 6%
Senior Leader 8,184 2%
Gender
Male 233,670 51%
Female 222,083 49%
Ethnicity
Hispanic/Latino 39,793 9%
Not Hispanic/Latino 411,449 91%
Race/National Origin
American Indian or Alaska Native 9,408 2%
Asian 22,173 5%
Black or African American 64,809 15%
Native Hawaiian or Other Pacific Islander 2,765 1%
White 319,770 73%
Two or more races 18,760 4%
Minority Status
Minority 149,824 34%
Not Minority 292,347 66%
For an Excel version of Appendix D: Governmentwide Respondent Characteristicsclick this link
Appendix D: Governmentwide Respondent Characteristics
27
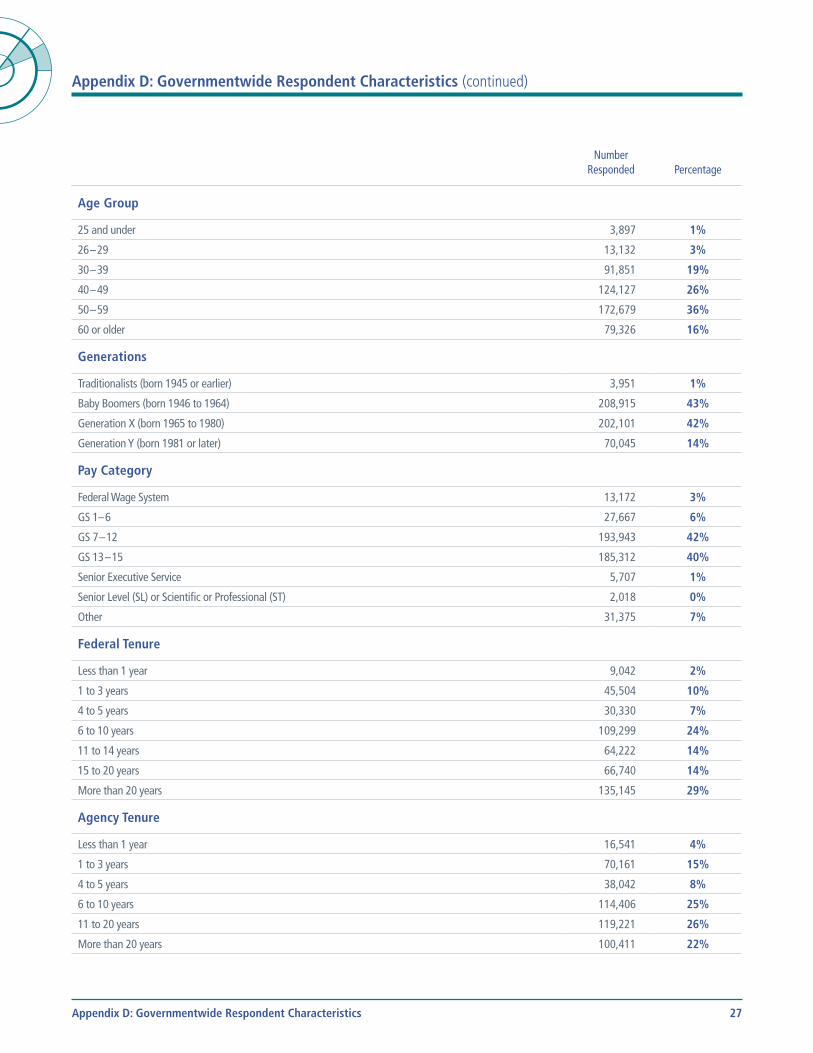
Appendix D: Governmentwide Respondent Characteristics (continued)
NumberResponded Percentage
Age Group
25 and under 3,897 1%
26 – 29 13,132 3%
30 – 39 91,851 19%
40 – 49 124,127 26%
50 – 59 172,679 36%
60 or older 79,326 16%
Generations
Traditionalists (born 1945 or earlier) 3,951 1%
Baby Boomers (born 1946 to 1964) 208,915 43%
Generation X (born 1965 to 1980) 202,101 42%
Generation Y (born 1981 or later) 70,045 14%
Pay Category
Federal Wage System 13,172 3%
GS 1– 6 27,667 6%
GS 7 – 12 193,943 42%
GS 13 – 15 185,312 40%
Senior Executive Service 5,707 1%
Senior Level (SL) or Scientific or Professional (ST) 2,018 0%
Other 31,375 7%
Federal Tenure
Less than 1 year 9,042 2%
1 to 3 years 45,504 10%
4 to 5 years 30,330 7%
6 to 10 years 109,299 24%
11 to 14 years 64,222 14%
15 to 20 years 66,740 14%
More than 20 years 135,145 29%
Agency Tenure
Less than 1 year 16,541 4%
1 to 3 years 70,161 15%
4 to 5 years 38,042 8%
6 to 10 years 114,406 25%
11 to 20 years 119,221 26%
More than 20 years 100,411 22%
Appendix D: Governmentwide Respondent Characteristics
28
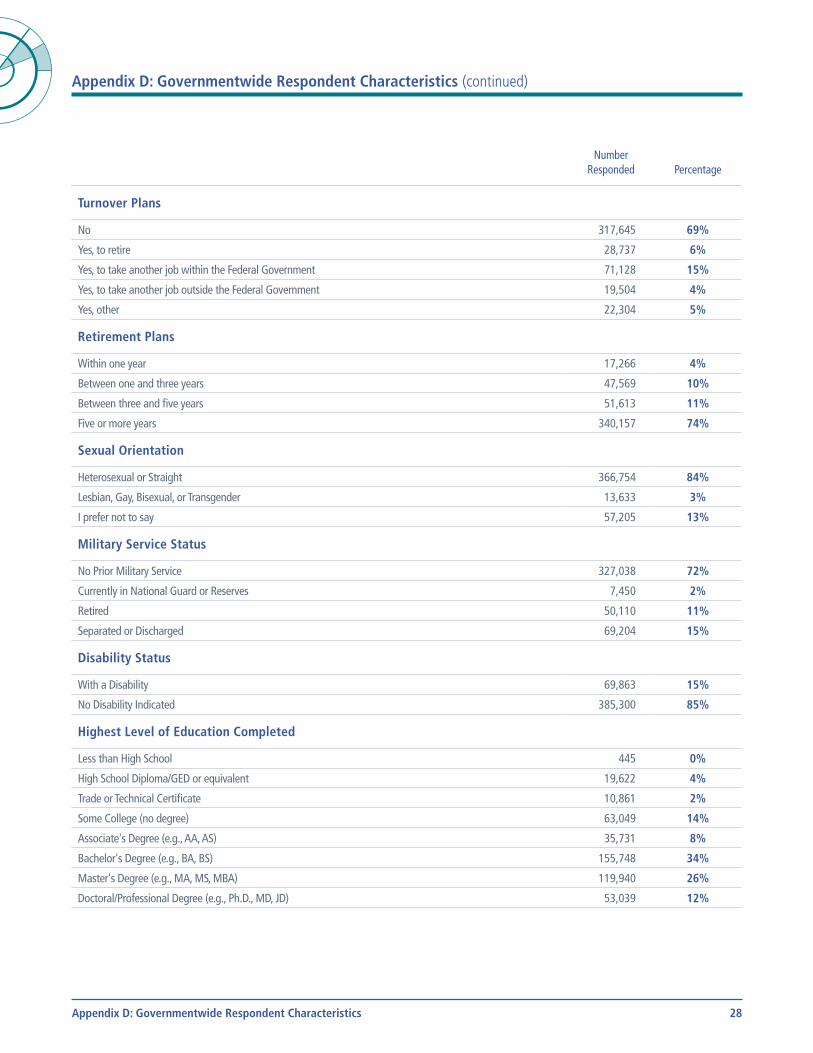
Appendix D: Governmentwide Respondent Characteristics (continued)
NumberResponded Percentage
Turnover Plans
No 317,645 69%
Yes, to retire 28,737 6%
Yes, to take another job within the Federal Government 71,128 15%
Yes, to take another job outside the Federal Government 19,504 4%
Yes, other 22,304 5%
Retirement Plans
Within one year 17,266 4%
Between one and three years 47,569 10%
Between three and five years 51,613 11%
Five or more years 340,157 74%
Sexual Orientation
Heterosexual or Straight 366,754 84%
Lesbian, Gay, Bisexual, or Transgender 13,633 3%
I prefer not to say 57,205 13%
Military Service Status
No Prior Military Service 327,038 72%
Currently in National Guard or Reserves 7,450 2%
Retired 50,110 11%
Separated or Discharged 69,204 15%
Disability Status
With a Disability 69,863 15%
No Disability Indicated 385,300 85%
Highest Level of Education Completed
Less than High School 445 0%
High School Diploma/GED or equivalent 19,622 4%
Trade or Technical Certificate 10,861 2%
Some College (no degree) 63,049 14%
Associate's Degree (e.g., AA, AS) 35,731 8%
Bachelor's Degree (e.g., BA, BS) 155,748 34%
Master's Degree (e.g., MA, MS, MBA) 119,940 26%
Doctoral/Professional Degree (e.g., Ph.D., MD, JD) 53,039 12%
Appendix D: Governmentwide Respondent Characteristics
29
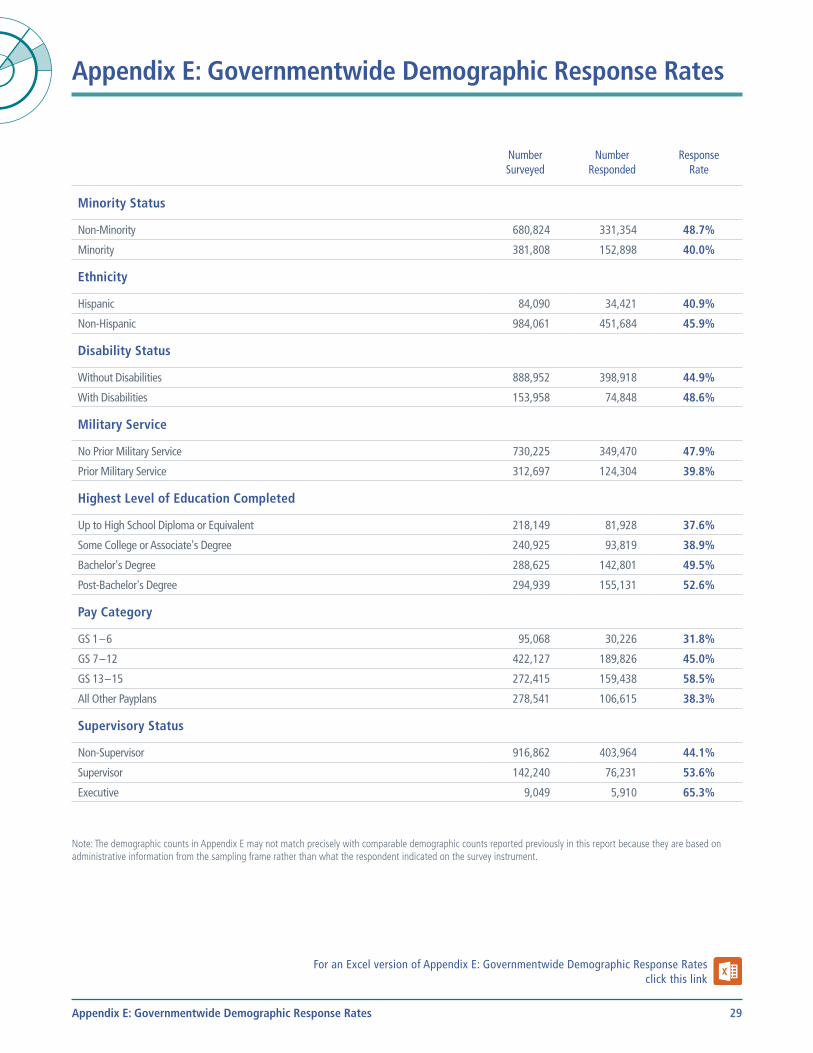
Appendix E: Governmentwide Demographic Response Rates
NumberSurveyed
NumberResponded
ResponseRate
Minority Status
Non-Minority 680,824 331,354 48.7%
Minority 381,808 152,898 40.0%
Ethnicity
Hispanic 84,090 34,421 40.9%
Non-Hispanic 984,061 451,684 45.9%
Disability Status
Without Disabilities 888,952 398,918 44.9%
With Disabilities 153,958 74,848 48.6%
Military Service
No Prior Military Service 730,225 349,470 47.9%
Prior Military Service 312,697 124,304 39.8%
Highest Level of Education Completed
Up to High School Diploma or Equivalent 218,149 81,928 37.6%
Some College or Associate's Degree 240,925 93,819 38.9%
Bachelor's Degree 288,625 142,801 49.5%
Post-Bachelor's Degree 294,939 155,131 52.6%
Pay Category
GS 1 – 6 95,068 30,226 31.8%
GS 7 – 12 422,127 189,826 45.0%
GS 13 – 15 272,415 159,438 58.5%
All Other Payplans 278,541 106,615 38.3%
Supervisory Status
Non-Supervisor 916,862 403,964 44.1%
Supervisor 142,240 76,231 53.6%
Executive 9,049 5,910 65.3%
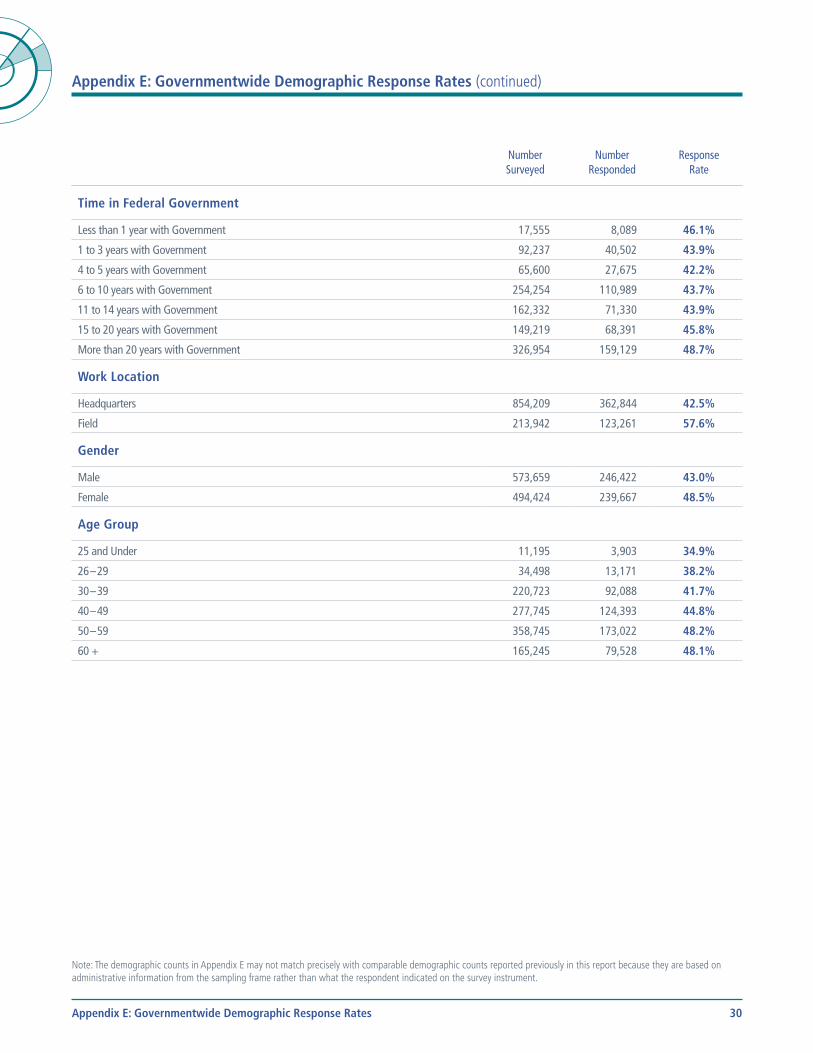
Note: The demographic counts in Appendix E may not match precisely with comparable demographic counts reported previously in this report because they are based on administrative information from the sampling frame rather than what the respondent indicated on the survey instrument.
For an Excel version of Appendix E: Governmentwide Demographic Response Ratesclick this link
Appendix E: Governmentwide Demographic Response Rates
30
Appendix E: Governmentwide Demographic Response Rates (continued)
NumberSurveyed
NumberResponded
ResponseRate
Time in Federal Government
Less than 1 year with Government 17,555 8,089 46.1%
1 to 3 years with Government 92,237 40,502 43.9%
4 to 5 years with Government 65,600 27,675 42.2%
6 to 10 years with Government 254,254 110,989 43.7%
11 to 14 years with Government 162,332 71,330 43.9%
15 to 20 years with Government 149,219 68,391 45.8%
More than 20 years with Government 326,954 159,129 48.7%
Work Location
Headquarters 854,209 362,844 42.5%
Field 213,942 123,261 57.6%
Gender
Male 573,659 246,422 43.0%
Female 494,424 239,667 48.5%
Age Group
25 and Under 11,195 3,903 34.9%
26 – 29 34,498 13,171 38.2%
30 – 39 220,723 92,088 41.7%
40 – 49 277,745 124,393 44.8%
50 – 59 358,745 173,022 48.2%
60 + 165,245 79,528 48.1%
Note: The demographic counts in Appendix E may not match precisely with comparable demographic counts reported previously in this report because they are based on administrative information from the sampling frame rather than what the respondent indicated on the survey instrument.
Appendix E: Governmentwide Demographic Response Rates
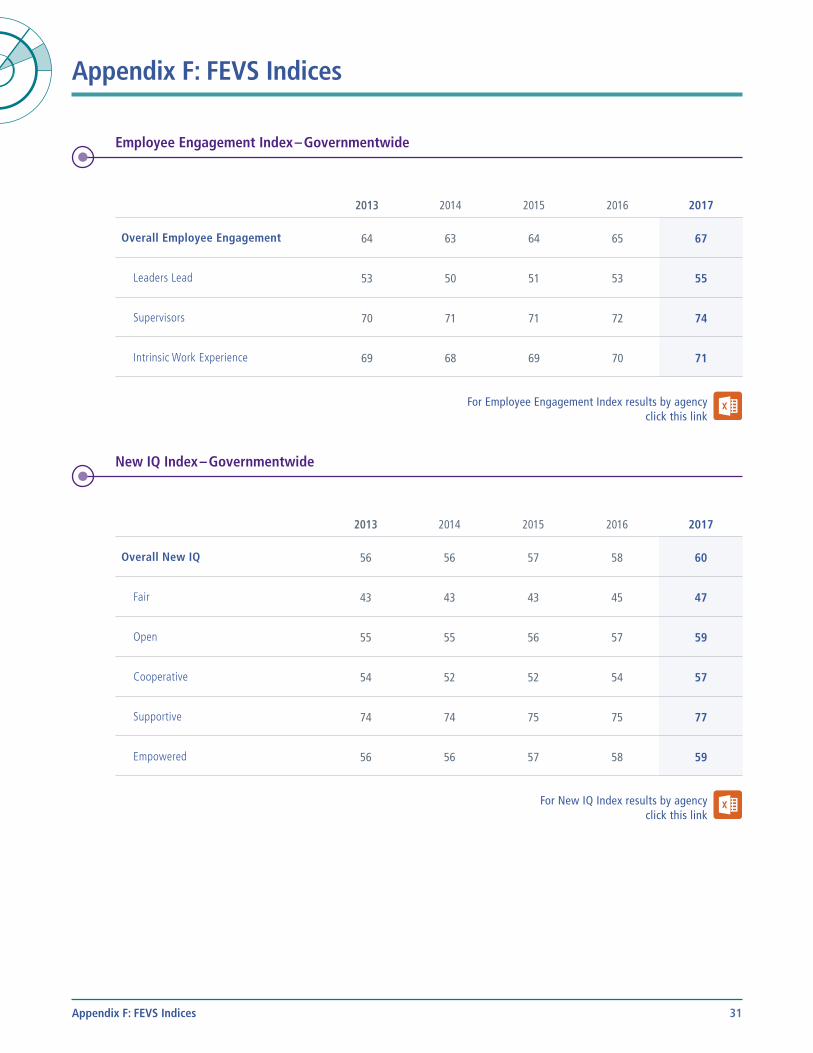
31
Appendix F: FEVS Indices
Employee Engagement Index – Governmentwide
2013 2014 2015 2016 2017
Overall Employee Engagement 64 63 64 65 67
Leaders Lead 53 50 51 53 55
Supervisors 70 71 71 72 74
Intrinsic Work Experience 69 68 69 70 71
For Employee Engagement Index results by agency click this link
New IQ Index – Governmentwide
2013 2014 2015 2016 2017
Overall New IQ 56 56 57 58 60
Fair 43 43 43 45 47
Open 55 55 56 57 59
Cooperative 54 52 52 54 57
Supportive 74 74 75 75 77
Empowered 56 56 57 58 59
For New IQ Index results by agency click this link
Appendix F: FEVS Indices
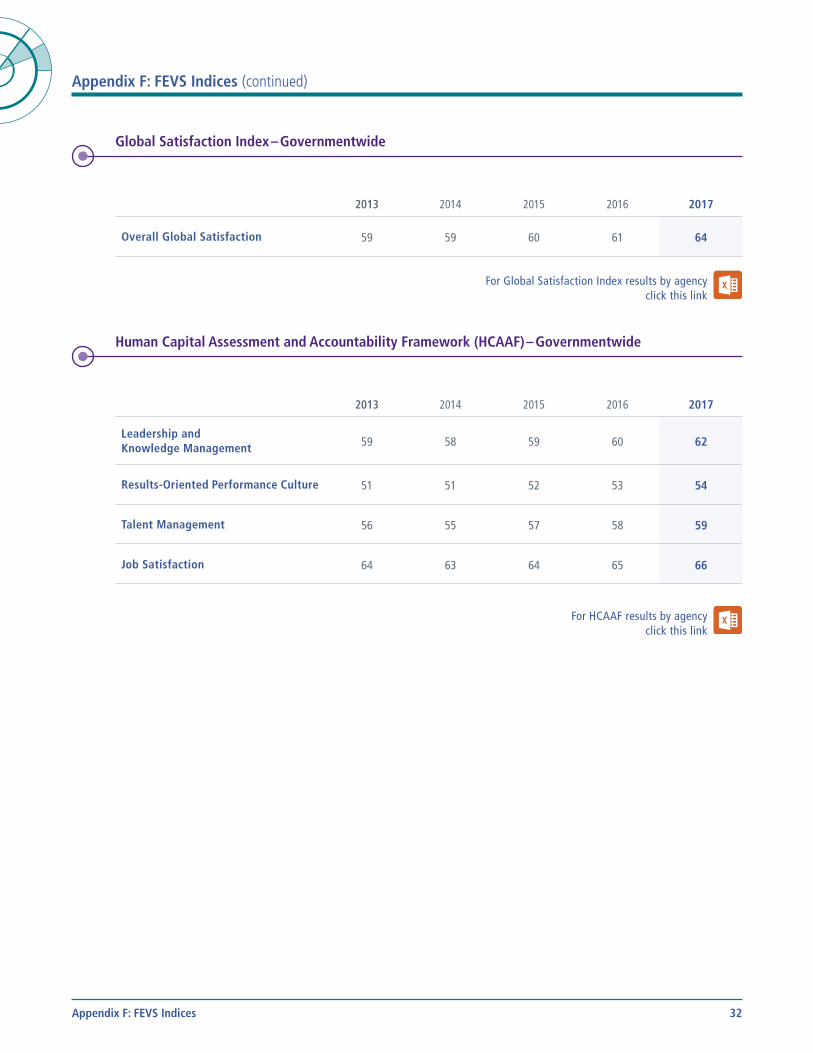
32
Appendix F: FEVS Indices (continued)
Global Satisfaction Index – Governmentwide
2013 2014 2015 2016 2017
Overall Global Satisfaction 59 59 60 61 64
For Global Satisfaction Index results by agency click this link
Human Capital Assessment and Accountability Framework (HCAAF) – Governmentwide
2013 2014 2015 2016 2017
Leadership and Knowledge Management 59 58 59 60 62
Results-Oriented Performance Culture 51 51 52 53 54
Talent Management 56 55 57 58 59
Job Satisfaction 64 63 64 65 66
For HCAAF results by agency click this link
Appendix F: FEVS Indices

United States Office of Personnel Management Planning and Policy Analysis
1900 E Street, NW Washington, DC 20415
www.opm.gov/FEVS