2009 octa commuter bikeways strategic plan final bikeways09 strategic plan-1.pdf · 2009 octa...
TRANSCRIPT
2009 OCTA Commuter Bikeways Strategic Plan
FINALFor the:Orange County Transportation Authority
Prepared by:Alta Planning + DesignKOA Corporation
May 2009

OCTA Commuter Bikeways Strategic Plan
i
TABLE OF CONTENTS
CHAPTER 1. INTRODUCTION.................................................................1 1.1. Purpose & Need ..............................................................................................................................................1 1.2. Setting................................................................................................................................................................1 1.3. Bikeway Fundamentals....................................................................................................................................2
1.3.1. Classes of Bikeways ........................................................................................................................................ 2 1.3.2. Bicyclist Skill Levels........................................................................................................................................ 2
1.4. Orange County Bikeways ...............................................................................................................................3
CHAPTER 2. REGIONAL STRATEGY .........................................................7 2.1. Regional Needs ................................................................................................................................................7
2.1.1. Citizens Advisory Committee – Bicycle Ad Hoc Committee................................................................... 7 2.1.2. CBSP Advisory Groups................................................................................................................................. 7 2.1.3. General Public................................................................................................................................................. 7 2.1.4. OCTA Committees ........................................................................................................................................ 8 2.1.5. Outreach Results............................................................................................................................................. 8
2.2. Modeling Analysis and Regional Improvement Opportunity Prioritization ...........................................9 2.3. Performance Criteria .................................................................................................................................... 14 2.4. OCTA Action Plan....................................................................................................................................... 15 2.5. Funding Opportunities ................................................................................................................................ 16
2.5.1. Federal Funding Sources ............................................................................................................................. 16 2.5.2. Statewide Funding Sources.......................................................................................................................... 18 2.5.3. Local and Regional Funding Sources......................................................................................................... 19 2.5.4. Non-Traditional Funding Sources.............................................................................................................. 19
2.6. Design Guidelines......................................................................................................................................... 20 2.6.1. Caltrans Guidelines....................................................................................................................................... 20 2.6.2. CAMUTCD Guidelines............................................................................................................................... 22 2.6.3. Guidelines for Innovative Treatments....................................................................................................... 23
CHAPTER 3. BIKEWAY INFORMATION BY JURISDICTION.............................. 35 3.1. Aliso Viejo ..................................................................................................................................................... 36 3.2. Anaheim......................................................................................................................................................... 39 3.3. Brea................................................................................................................................................................. 45 3.4. Buena Park..................................................................................................................................................... 50 3.5. Costa Mesa..................................................................................................................................................... 53 3.6. Cypress ........................................................................................................................................................... 58 3.7. Dana Point..................................................................................................................................................... 62 3.8. Fountain Valley ............................................................................................................................................. 67 3.9. Fullerton......................................................................................................................................................... 71 3.10. Garden Grove ............................................................................................................................................... 79 3.11. Huntington Beach ........................................................................................................................................ 84 3.12. Irvine .............................................................................................................................................................. 88 3.13. La Habra ........................................................................................................................................................ 95 3.14. La Palma ...................................................................................................................................................... 100 3.15. Laguna Beach .............................................................................................................................................. 104 3.16. Laguna Hills................................................................................................................................................. 108 3.17. Laguna Niguel ............................................................................................................................................. 113 3.18. Laguna Woods ............................................................................................................................................ 117 3.19. Lake Forest .................................................................................................................................................. 121 3.20. Los Alamitos ............................................................................................................................................... 126 3.21. Mission Viejo............................................................................................................................................... 130 3.22. Newport Beach ........................................................................................................................................... 135
OCTA Commuter Bikeways Strategic Plan
ii
3.23. Orange.......................................................................................................................................................... 142 3.24. Placentia ....................................................................................................................................................... 149 3.25. Rancho Santa Margarita ............................................................................................................................. 153 3.26. San Clemente............................................................................................................................................... 157 3.27. San Juan Capistrano ................................................................................................................................... 162 3.28. Santa Ana..................................................................................................................................................... 167 3.29. Seal Beach .................................................................................................................................................... 172 3.30. Stanton ......................................................................................................................................................... 176 3.31. Tustin ........................................................................................................................................................... 180 3.32. Villa Park...................................................................................................................................................... 185 3.33. Westminster................................................................................................................................................. 189 3.34. Yorba Linda................................................................................................................................................. 193 3.35. Unincorporated County............................................................................................................................. 198 3.36. Caltrans ........................................................................................................................................................ 203
APPENDICES.......................................................................................204 A-1: Survey .............................................................................................................................................................. 205 A-2: Survey Results................................................................................................................................................. 208 A-3: User Estimation Method............................................................................................................................... 213 A-4: Orange County Existing & Proposed Bikeway Maps d Pr....................................................................... 215 A-5: Destination Demand Maps........................................................................................................................... 224 A-6: Caltrans Deputy Directive 64 ....................................................................................................................... 234 A-7: USDOT - Accommodating Bicycle and Pedestrian Travel..................................................................... 240 A-8: OCTA Congestion Management Program................................................................................................. 243 A-9: Local Fair Share Program for Street Maintenance and Improvements .................................................. 245
List of Figures Figure 2.1: Bicycle Facility Types................................................................................................................................... 21 Figure 2.2: Examples of Regulatory and Warning Signs ............................................................................................ 22 Figure 2.3: Bike Crossing of Freeway Ramps .............................................................................................................. 23 Figure 2.4: Signage and pavement markings encouraging bicyclists to cross ramp ................................................ 24 Figure 2.5: Dashed bike lane through conflict zone (optional painted lane) ........................................................... 24 Figure 2.6: Lemon St. at Truslow Ave, Fullerton ......................................................................................................... 25 Figure 2.7: Push-button for Bicyclists........................................................................................................................... 25 Figure 2.8: In-pavement Loop Detector....................................................................................................................... 25 Figure 2.9: Bicycle Boulevard Signage in Berkeley, CA.............................................................................................. 26 Figure 2.10: Bicycle Boulevard Lane Configuration ................................................................................................... 27 Figure 2.11: Shared Lane Marking Placement and Shared Roadway Bicycle Marking........................................... 28 Figure 2.12: Multi-Use Path Signs ................................................................................................................................. 29 Figure 2.13: Denver’s parallel path warning signage ................................................................................................... 29 Figure 2.14: Recommended bicycle parking spacing dimensions ............................................................................. 30 Figure 2.15: Recommended Short-Term Bicycle Parking Facilities.......................................................................... 31 Figure 2.16: Bicycle Lockers at a Transit Station......................................................................................................... 32 Figure 2.17: Bike Corral .................................................................................................................................................. 33 Figure 2.18: Bike Oasis.................................................................................................................................................... 33 Figure 2.19: Bike Station................................................................................................................................................. 33 Figure 2.20: Bike Sharing Programs .............................................................................................................................. 34
OCTA Commuter Bikeways Strategic Plan iii
List of Tables Table 2-1: Priority Regional Projects............................................................................................................................. 12Table A-2: Survey Question 1 ....................................................................................................................................... 209Table A-3: Survey Question 2 ....................................................................................................................................... 209Table A-4: Survey Question 4 ....................................................................................................................................... 210Table A-5: Survey Question 6 ....................................................................................................................................... 210Table A-6: Survey Question 8 ....................................................................................................................................... 211Table A-7: Survey Question 9 ....................................................................................................................................... 212
List of Maps Map 1.1 Existing Bikeways and Proposed Bikeways ..................................................................................................... 4Map 1.2 Existing Bikeways ................................................................................................................................................ 5Map 2.1 Regional Commuter Bikeway Priority Zones ................................................................................................ 11Map 3.1 Aliso Viejo Land Use ....................................................................................................................................... 37Map 3.2 Anaheim Land Use............................................................................................................................................ 40Map 3.3 Brea Land Use.................................................................................................................................................... 46Map 3.4 Buena Park Land Use........................................................................................................................................ 51Map 3.5 Costa Mesa Land Use........................................................................................................................................ 54Map 3.6 Cypress Land Use .............................................................................................................................................. 59Map 3.7 Dana Point Land Use........................................................................................................................................ 63Map 3.8 Fountain Valley Land Use ................................................................................................................................ 68Map 3.9 Fullerton Land Use............................................................................................................................................ 72Map 3.10 Garden Grove Land Use ................................................................................................................................ 80Map 3.11 Huntington Beach Land Use ......................................................................................................................... 85Map 3.12 Irvine Land Use ............................................................................................................................................... 89Map 3.13 La Habra Land Use ......................................................................................................................................... 96Map 3.14 La Palma Land Use ....................................................................................................................................... 101Map 3.15 Laguna Beach Land Use ............................................................................................................................... 105Map 3.16 Laguna Hills Land Use.................................................................................................................................. 109Map 3.17 Laguna Niguel Land Use .............................................................................................................................. 114Map 3.18 Laguna Woods Land Use ............................................................................................................................. 118Map 3.19 Lake Forest Land Use................................................................................................................................... 122Map 3.20 Los Alamitos Land Use ................................................................................................................................ 127Map 3.21 City of Mission Viejo Land Use Policy Map.............................................................................................. 131Map 3.22 Newport Beach Land Use ............................................................................................................................ 136Map 3.23 Orange Land Use........................................................................................................................................... 143Map 3.24 Placentia Land Use ........................................................................................................................................ 150Map 3.25 Rancho Santa Margarita Land Use.............................................................................................................. 154Map 3.26 San Clemente Land Use................................................................................................................................ 158Map 3.27 San Juan Capistrano Land Use .................................................................................................................... 163Map 3.28 Santa Ana Land Use...................................................................................................................................... 168Map 3.29 Seal Beach Land Use..................................................................................................................................... 173Map 3.30 Stanton Land Use .......................................................................................................................................... 177Map 3.31 Tustin Land Use ............................................................................................................................................ 181Map 3.32 Villa Park Land Use....................................................................................................................................... 186Map 3.33 Westminster Land Use.................................................................................................................................. 190Map 3.34 Yorba Linda Land Use.................................................................................................................................. 194Map 3.35 Unincorporated County Land Use.............................................................................................................. 202

OCTA Commuter Bikeways Strategic Plan iv
This page intentionally left blank
OCTA Commuter Bikeways Strategic Plan 1
CHAPTER 1. Introduction
1.1.Purpose & Need This Commuter Bikeways Strategic Plan (CBSP) has been developed by the Orange County Transportation Authority (OCTA) to encourage the enhancement of Orange County’s regional bikeways network, in order to make bicycle commuting a more viable and attractive travel option.
There are a number of challenges that must be overcome for Orange County to excel as a bicycling region, including improving safety, access to key destinations, coordination of plans, and support facilities. Furthermore, there are also opportunities, such as increasing congestion, climate change, and oil dependency that bicycling can play a large role in mitigating. The goal of the CBSP is to help address these many challenges by providing:
� A strategy for improving the regional bikeway network; � Eligibility for state Bicycle Transportation Account (BTA) funds; � Identification of roles and responsibilities for OCTA regarding bikeways; and � Documentation of existing and planned Orange County bikeways.
The projects described in this plan are a compilation of projects planned by Orange County Cities and the County of Orange. The CBSP is a long range, financially unconstrained planning document. Funding for these projects will not be limited to the OCTA Call for Projects. It will be the responsibility of each implementing agency to identify funding sources for the projects within their purview.
1.2. SettingAccording to the 2005 American Community Survey (U.S. Census Bureau), less than 1 percent of Orange County’s population commutes by bicycle. The vast majority of commuters (77.3%) commute to work by driving alone. This shows how automobile dependent Orange County currently is, and why many of the streets and freeways are at, or close to, maximum capacity. The Orange County Projections, produced by the Center for Demographic Research (out of California State University, Fullerton), estimates Orange County’s 2005 population of 3,059,950 to grow by nearly 600,000, more than 19 percent, by 2035, which will only put more demand on transportation infrastructure.
Much of the early suburban development took place in Northern Orange County, and infrastructure facilities were geared towards commutes into Los Angeles. The Pacific Electric rail cars served much of this area, until their service was stopped in the early 1960s. It was at that time that Orange County residents began to be more dependent on automobiles for their commutes.
North Orange County was designed with grid-pattern road networks, much like Los Angeles. The grid-pattern, along with the relatively level topography, is beneficial to bicycle commuters, as it allows them to maneuver through short blocks, for more direct routes. Unfortunately, many of these streets were not designed to support the demand that we see today. They are often narrow, and not designed to safely accommodate automobiles together with bicycles. However, these roadways, along with some of the watersheds and abandoned rail rights-of-way, retain opportunities to make bicycling more viable.
Much of South Orange County was developed as planned communities over the last 30 years. The roadway networks are generally wider and more circuitous than in North County. The advantage to these roads is that many of them were designed with bike lanes along the shoulders. However, South
OCTA Commuter Bikeways Strategic Plan 2
County has more elevation changes, and the planned communities tend to be relatively low density with housing separated from work and shopping centers. This layout often results in longer trips, and the lower densities consequently result in fewer job opportunities near the residential communities. Nonetheless, many opportunities still exist, such as providing improved access and facilities at transit stations.
Applying the strategies discussed in this plan, and implementing the local jurisdictions’ projects, will help to create a regional bikeway network that will benefit Orange County communities, from the bicycle dependent, to casual cyclists, and people of all income levels. Furthermore, the build-out of the bikeway network, along with the favorable climate in the region, could make Orange County an even more enjoyable place to live and work.
1.3.Bikeway Fundamentals Bicycles share equal rights and responsibilities with other vehicles on the road, according to the California Department of Transportation (Caltrans). However, while bicyclists share all the same rights and responsibilities of motorists, bicycle-specific facilities are often provided in an effort to enhance safety for both bicyclists and motorists. Bicyclists also need to be conscious of their skill and comfort levels when choosing their travel routes. The following sections provide a brief overview of the various classes of bikeways, and some general characteristics of the different skill levels of bicyclists.
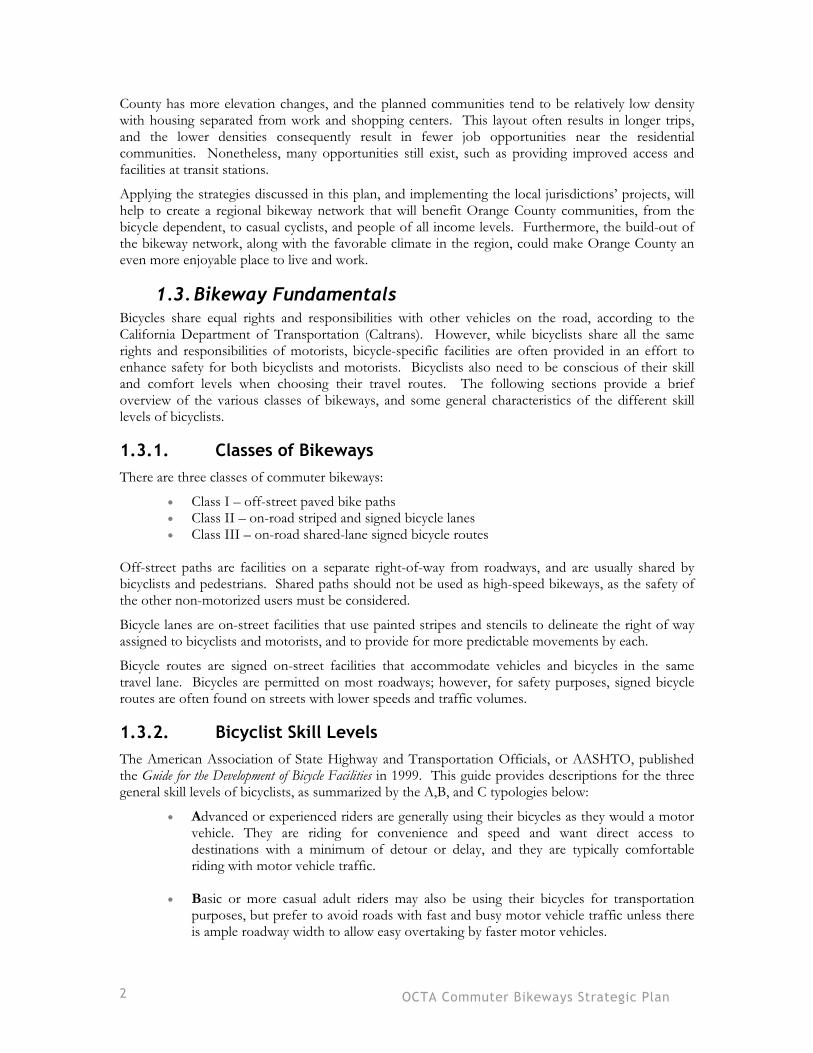
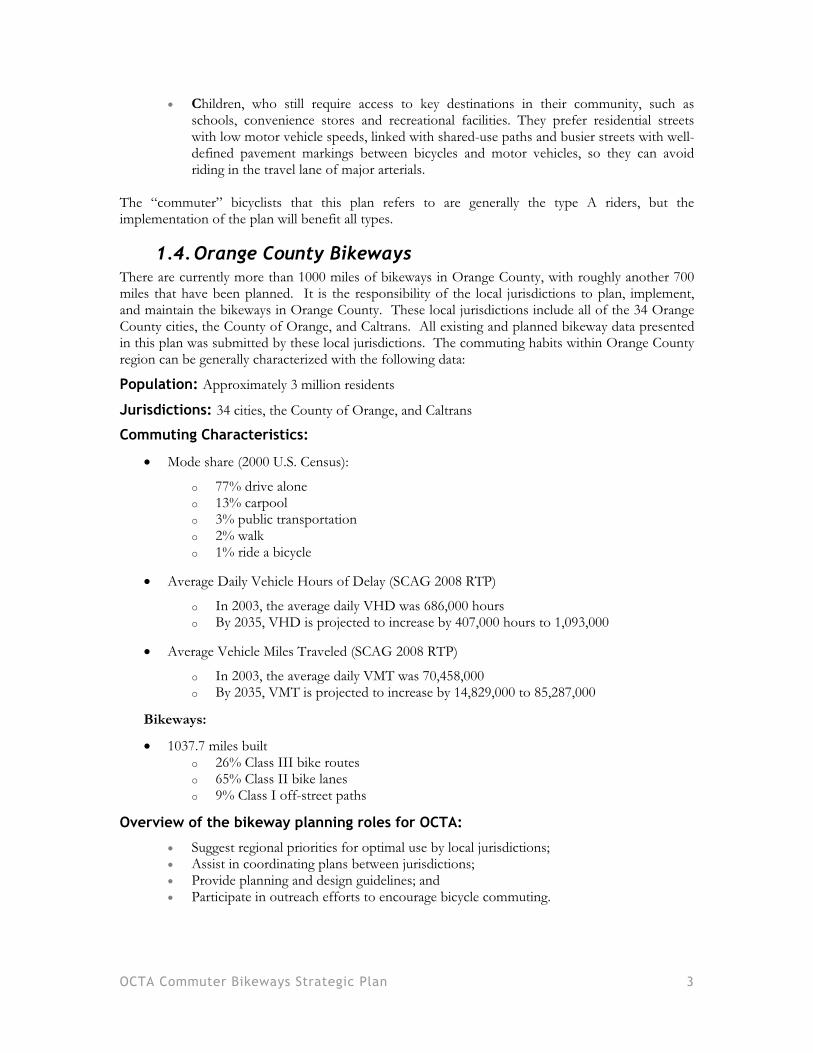
1.3.1. Classes of Bikeways There are three classes of commuter bikeways:
� Class I – off-street paved bike paths � Class II – on-road striped and signed bicycle lanes � Class III – on-road shared-lane signed bicycle routes
Off-street paths are facilities on a separate right-of-way from roadways, and are usually shared by bicyclists and pedestrians. Shared paths should not be used as high-speed bikeways, as the safety of the other non-motorized users must be considered.
Bicycle lanes are on-street facilities that use painted stripes and stencils to delineate the right of way assigned to bicyclists and motorists, and to provide for more predictable movements by each.
Bicycle routes are signed on-street facilities that accommodate vehicles and bicycles in the same travel lane. Bicycles are permitted on most roadways; however, for safety purposes, signed bicycle routes are often found on streets with lower speeds and traffic volumes.
1.3.2. Bicyclist Skill Levels The American Association of State Highway and Transportation Officials, or AASHTO, published the Guide for the Development of Bicycle Facilities in 1999. This guide provides descriptions for the three general skill levels of bicyclists, as summarized by the A,B, and C typologies below:
� Advanced or experienced riders are generally using their bicycles as they would a motor vehicle. They are riding for convenience and speed and want direct access to destinations with a minimum of detour or delay, and they are typically comfortable riding with motor vehicle traffic.
� Basic or more casual adult riders may also be using their bicycles for transportation
purposes, but prefer to avoid roads with fast and busy motor vehicle traffic unless there is ample roadway width to allow easy overtaking by faster motor vehicles.
OCTA Commuter Bikeways Strategic Plan 3
� Children, who still require access to key destinations in their community, such as schools, convenience stores and recreational facilities. They prefer residential streets with low motor vehicle speeds, linked with shared-use paths and busier streets with well-defined pavement markings between bicycles and motor vehicles, so they can avoid riding in the travel lane of major arterials.
The “commuter” bicyclists that this plan refers to are generally the type A riders, but the implementation of the plan will benefit all types.
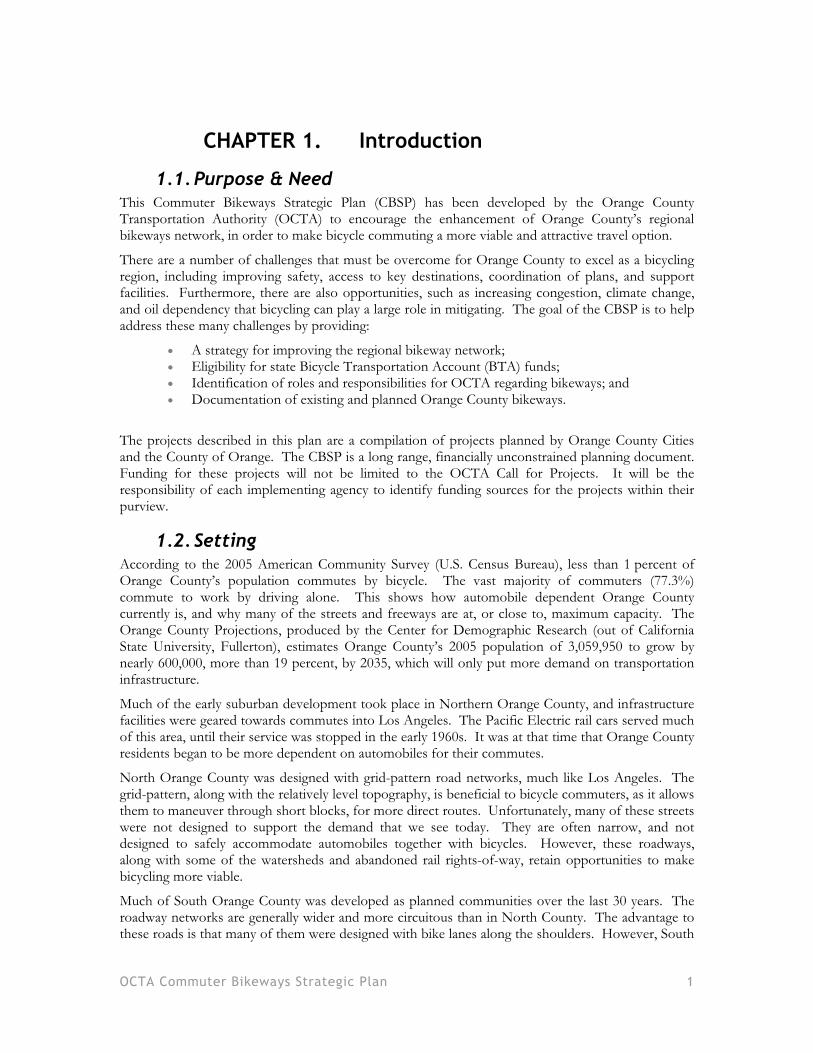
1.4.Orange County Bikeways There are currently more than 1000 miles of bikeways in Orange County, with roughly another 700 miles that have been planned. It is the responsibility of the local jurisdictions to plan, implement, and maintain the bikeways in Orange County. These local jurisdictions include all of the 34 Orange County cities, the County of Orange, and Caltrans. All existing and planned bikeway data presented in this plan was submitted by these local jurisdictions. The commuting habits within Orange County region can be generally characterized with the following data:
Population: Approximately 3 million residents
Jurisdictions: 34 cities, the County of Orange, and Caltrans
Commuting Characteristics:
� Mode share (2000 U.S. Census):
o 77% drive alone o 13% carpool o 3% public transportation o 2% walk o 1% ride a bicycle
� Average Daily Vehicle Hours of Delay (SCAG 2008 RTP)
o In 2003, the average daily VHD was 686,000 hours o By 2035, VHD is projected to increase by 407,000 hours to 1,093,000
� Average Vehicle Miles Traveled (SCAG 2008 RTP)
o In 2003, the average daily VMT was 70,458,000 o By 2035, VMT is projected to increase by 14,829,000 to 85,287,000
Bikeways:
� 1037.7 miles built o 26% Class III bike routes o 65% Class II bike lanes o 9% Class I off-street paths
Overview of the bikeway planning roles for OCTA:
� Suggest regional priorities for optimal use by local jurisdictions; � Assist in coordinating plans between jurisdictions; � Provide planning and design guidelines; and � Participate in outreach efforts to encourage bicycle commuting.

A»
?l
%&l(
A¥
A¾
?ê
?k
A»
!"̂$
%&o(
%&l(
A¾
AÊ
!"̂$
!"̂$Aß
Map 1.1: Existing and Proposed Bikeways
Source: OCTA
April 23, 2009 Portions of this map copyrighted by Thomas Bros Maps and reproduced with permission.
W:\R
eque
sts\
PD
CS
\SP
\PA
\Bik
eway
s\B
ikew
ays2
008\
mxd
\Exi
stin
gPro
pose
dBik
eway
s_20
09-0
423.
mxd
Class I : Off Road Paved
Class II : On Road Striped
Class III : On Road Not Striped
Bikeways
0 42
MilesI
L O S A N G E L E S
S A NB E R N A R D I N O
R I V E R S I D E
Class I ExistingClass I Proposed
Class II Proposed
Class II Existing
Class III ExistingClass III Proposed
A»
?l
%&l(
A¥
A¾
?ê
?k
A»
!"̂$
%&o(
%&l(
A¾
AÊ
!"̂$
!"̂$Aß
IRVINE
ANAHEIM
ORANGE
SANTA ANA
BREA
FULLERTON
TUSTIN
YORBA LINDA
NEWPORT BEACH
HUNTINGTONBEACH
COSTA MESALAKE
FOREST
MISSIONVIEJO
SANCLEMENTE
GARDEN GROVE
SEALBEACH
LAGUNANIGUEL
BUENAPARK
LA HABRA
WESTMINSTER
CYPRESS
PLACENTIA
DANA POINT
SAN JUANCAPISTRANO
LAGUNABEACH
ALISOVIEJO
FOUNTAINVALLEY
LAGUNAHILLS
RANCHOSANTA
MARGARITA
STANTONLOSALAMITOS
LAGUNAWOODS
LAPALMA
VILLAPARK
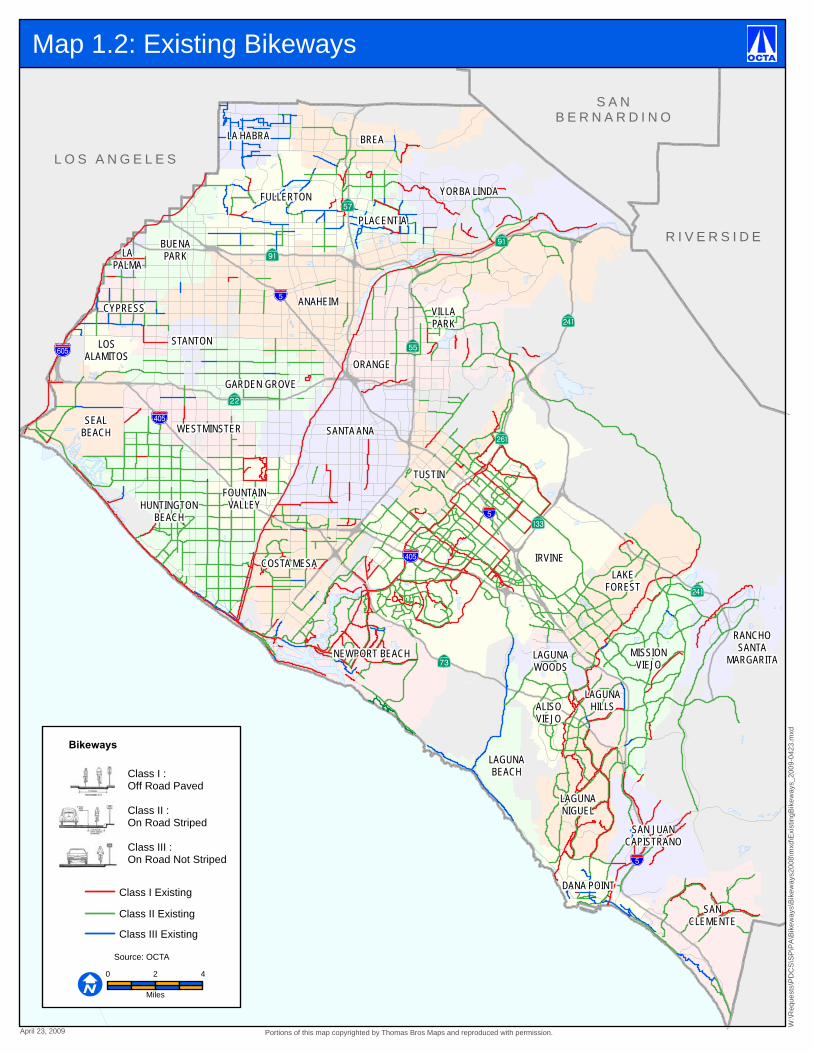
Map 1.2: Existing Bikeways
Source: OCTA
April 23, 2009 Portions of this map copyrighted by Thomas Bros Maps and reproduced with permission.
W:\R
eque
sts\
PD
CS
\SP
\PA
\Bik
eway
s\B
ikew
ays2
008\
mxd
\Exi
stin
gBik
eway
s_20
09-0
423.
mxd
Class I : Off Road Paved
Class II : On Road Striped
Class III : On Road Not Striped
Bikeways
0 42
MilesI
Class I Existing
Class II Existing
Class III Existing
L O S A N G E L E S
S A NB E R N A R D I N O
R I V E R S I D E

OCTA Commuter Bikeways Strategic Plan 6
This page intentionally left blank.
OCTA Commuter Bikeways Strategic Plan 7
CHAPTER 2. Regional Strategy In the development of this Commuter Bikeways Strategic Plan (CBSP), the Orange County Transportation Authority (OCTA) collected input from committees, stakeholders, and the public, in order to identify improvements that will provide the greatest benefit to commuters utilizing the regional bikeways network. This includes identifying bikeway needs, performance criteria, and general funding and design guidelines. Additionally, the CBSP examined OCTA’s role regarding bikeways, and provides an action plan that outlines the responsibilities OCTA will assume in implementing this plan.
2.1.Regional Needs To identify the critical needs of the regional bikeway network, OCTA undertook a number of outreach efforts. The input received was valuable, as it provided insights into the concerns of the public, local jurisdictions, and the committees within OCTA. Below is a description of the various outreach efforts, followed by more detailed discussions of critical issues that were identified.
2.1.1. Citizens Advisory Committee – Bicycle Ad Hoc Committee The first committee approached by OCTA staff regarding the development of this plan was the Citizens Advisory Committee (CAC). This committee took a large role in guiding the development of the plan by creating a Bicycle Ad Hoc Committee. The ad hoc committee met about a dozen times, and provided input and oversight that focused the goals of the plan.
2.1.2. CBSP Advisory Groups Two advisory groups were formed to provide input on specific items that were produced during the development of the CBSP. One group was referred to as the Technical Advisory Group (TAG), made up of planning and public works staff from local jurisdictions. The other group was referred to as the Public Stakeholders Group (PSG), which included members of the CAC, local bicycle advocates, and representatives from local riding groups. OCTA staff met with these groups three to four times each to discuss and receive input on data and strategies used in this plan.
2.1.3. General Public
SurveyA website was developed to help with the public outreach effort, which included the previous CBSP, as well as an online survey, which received nearly 1,100 responses. The survey collected information regarding the public’s bicycling habits and needs.
The following summarizes some of the survey results (the full results are located in the appendix):
� The most popular reason people bicycle is for exercise and health reasons (92%). Other popular reasons include bicycling for pleasure (84%) and commuting to work (54%).
� The majority of survey respondents (53%) bicycle four or more times per week.
� The City of Irvine had the most survey respondents (12%) out of Orange County’s local
jurisdictions. The next most responsive jurisdiction was the city of Orange (7%), followed by Huntington Beach (6%).
OCTA Commuter Bikeways Strategic Plan 8
� The most common roundtrip distance traveled by respondents was 11-24 miles (34%).
� The Santa Ana River Trail and Pacific Coast Highway are among the respondent’s favorite places to bike.
� The absence of bike paths, lanes or bike routes was the most reported reason why the
survey respondents are prevented from biking more often (58%).
� Off-street paved bike paths were ranked as the most preferred bicycle facility (69%); while unpaved trails or dirt paths were ranked as the least preferred facility.
� More paved off-street bike paths and more bike lanes are the improvements most likely
to influence people to bike more often. The CBSP website also provided information on the public workshop that was held at the OCTA offices. The workshop time and location was posted; and all the information that was presented, as well as the input received at the event, was posted on the website after the workshop was held. The public was also notified of the workshop with an OCTA press release to major newspapers, flyers that were mailed to over 500 Orange County residents, and through the OCTA website. Members of the PSG also helped to notify the bicycling community; and thanks in large part to them, the workshop was successful, drawing over 50 participants.
Public Workshop The workshop was held on July 12, 2008, with the purpose of informing the public of the development of the CBSP, clarifying the roles and responsibilities of the various entities involved in bikeways, and gathering input from the attendees. The workshop had an open house format, with various stations where the participants could gather information and provide input. Hardcopies of the surveys were also available, as well as comment cards that allowed participants to address any remaining concerns or issues.
2.1.4. OCTA Committees Additional input and oversight was provided by several OCTA committees. OCTA and Alta Planning staff presented data to the OCTA Board of Directors, Highways Committee, Transit Committee, Technical Steering Committee, and Citizens Advisory Committee, throughout the development of the CBSP. The guidance received from these committees was critical for addressing many of the policy and technical issues regarding OCTA and its role in regional bikeway planning.
2.1.5. Outreach Results The following subsections discuss some of the issues that were of the most concern throughout the outreach effort. There may be other issues of equal importance; however, based on the input received, the issues below were viewed as priorities for this plan. These issues, along with the other input received, were used in the identification of priority improvement areas and project priorities, which are discussed later in this chapter.
Safety & Education The safety and education of both bicyclists and drivers is the most commonly raised issue. It is important for everyone on the roadway to be familiar with the California Vehicle Code, as well as the California Department of Motor Vehicles’ California Driver Handbook.
Bicyclists have all the rights, and are subject to all the provisions, applicable to drivers of vehicles. It is important to respect the right-of-way of others, especially pedestrians and bicycle riders; and if an
OCTA Commuter Bikeways Strategic Plan 9
automobile must pass a bicyclist, they should be patient when passing, only pass when it is safe, and pass at a reduced speed. However, it should be noted that a 1996 FHWA study of bicycle and pedestrian crashes found that about half of bicycle crashes with vehicles are the fault of the bicyclist, which demonstrates the need to educate both bicyclists and drivers about safety.
Equally important is the quality and maintenance of the bicycle facilities. Bikeway facilities must be planned, implemented, and maintained at a level that does not put the users at risk. In order to grow the population of bicycle commuters, the facilities must be safe and inviting.
Ease of Implementation Identification of projects that can be implemented relatively quickly and/or at a lower cost than most projects should be given some priority. The difficulty in identifying large amounts of funding, and obtaining necessary rights-of-way, often slows the development of the regional bikeways network. By picking the “low-hanging fruit” improvements will be implemented at a more rapid pace, which will contribute to a more complete and convenient bikeway system.
Multimodal Connections In order for bicycle commuting to be an option for some Orange County residents, they would need to utilize transit services for portions of their commutes. According to a study reported in the 2007 Transportation Research Board Journal1 - people are willing to bicycle about five miles each way of their commute. Based on this assumption, the use of transit can greatly expand the distance a bicycle commuter is willing to travel, making bicycle access to transit facilities a priority issue.
Transit facilities are designed to accommodate the flow of automobiles, but they do not always meet the needs of bicyclists. Measures need to be taken to ensure that Orange County transit stations can be easily accessed and utilized by bicycle commuters.
Parking & Amenities Another issue for the regional bikeways network is the need for bicycle parking and amenities. This is particularly important at regional destinations to encouraging bicycle commuting. Access to showers and lockers at employment centers allows bicycle commuters to clean up and change for work. Not having access to these kinds of facilities creates a difficult challenge for commuters who would like to bicycle to work.
Bicycle parking at transit stations is necessary due to the limited capacity for bicycles on transit vehicles. These parking facilities should be safe for long-term (all day) parking, and consist of bicycle lockers and/or monitored parking areas, both of which are described in more detail later in this chapter. Additionally, adequate bicycle parking is necessary at employment centers, and at colleges and universities.
2.2.Modeling Analysis and Regional Improvement Opportunity Prioritization
OCTA coordinated a modeling effort to identify regional commuter bikeway priorities. The analysis identified the following key regional employment centers: Irvine Spectrum, The Irvine Business Complex, Newport Center, South Coast Metro Area, Downtown Santa Ana, Main Street Area (Santa Ana/Orange), The Anaheim Resort, Anaheim Canyon Business Center, and the Brea Mall.
These regional employment centers were analyzed for their trip generation characteristics. The trip generation analysis was based on OCTA’s 2035 growth forecast model, OCTAM 3.3. Maps were produced that show the areas with the highest concentration of demand for trips to each of the 1 Hagelin, Christopher. Integrating Bicycles and Transit Through Bike-to-Bus Strategy. Transportation Research Board Annual Meeting Paper, 2007.

OCTA Commuter Bikeways Strategic Plan 10
employment centers (see Appendix B). In general, this data showed the highest concentrations of trip origins to be within a few miles of the employment centers.
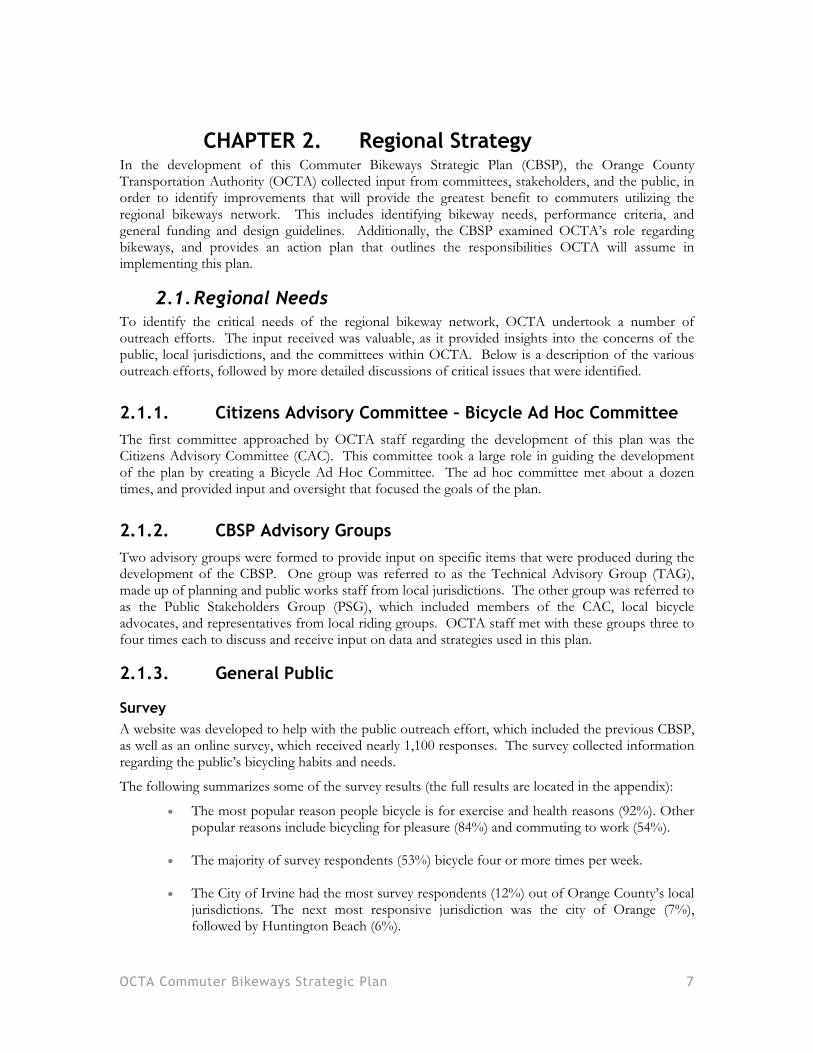
The intent of identifying the regional employment centers, as well as Orange County’s transit stations, colleges and universities, which are also regional commuter destinations, is to improve bicycle facilities at these locations in order to make bicycle commuting a more viable option. Therefore, bicycle access and support facility projects within, or connecting to, the regional destinations identified in Map 2-1 are viewed by OCTA as regional priorities.
Map 2-1 displays the regional commuter destinations. The radii around the employment centers were determined based on the trip origin analysis, discussed above, as well as by National Personal Transportation Survey data that shows the average bicycle trip is three miles or less. A study conducted in 2007 by the Transportation Research Board estimates that the average commuter is willing to bicycle about five miles to work, which is why projects that connect to the identified priority zone will be considered priorities as well. The transit stations, colleges and universities do not have radii since bicycle facilities should be at, or connect directly to, the specified location.
Note that the above prioritization methods are intended as guidelines, and that jurisdictions can use them to help justify the regional significance of their projects.
h
h
hh
h
h")
")
")
")
")
")
")
")
")
")
")
")
¹º¹º
¹º
¹º¹º
¹º¹º
¹º
¹º¹º
¹º¹º¹º¹º
¹º¹º
¹º
¹º¹º¹º ¹º¹º¹º ¹º¹º¹º
¹º¹º¹º
¹º
¹º
¹º
¹º
Brea Mall
Anaheim CanyonBusiness Center
TheAnaheim
Resort
MainStreet
Area
DowntownSanta Ana
SouthCoastMetro
Irvine BusinessComplex
IrvineSpectrum
Newport Center
A¾
A»
?l
%&l(
A¥
A¾
?ê
?k
A»
!"̂$
%&l(
A¾
AÊ
!"̂$
!"̂$ Aß
Map 2.1: Regional Commuter Bikeway Priorities
April 23, 2009 Portions of this map copyrighted by Thomas Bros Maps and reproduced with permission.
W:\R
eque
sts\
PD
CS
\SP
\PA
\Bik
eway
s\B
ikew
ays2
008\
mxd
\dai
lyW
orkT
ripO
rigin
s_20
09-0
423.
mxd
Source: OCTA
Class I Existing
Class II Proposed
Class II Existing
Class III Proposed
Class III Existing
Class I ProposedBikeways
Bikeway Priority Zones
Metrolink Rail
") Metrolink Station
¹º College / University
Regional Employment Centers
0 42
MilesI
h Bus Station
Bikeway Priority Locations
OCTA Commuter Bikeways Strategic Plan 12
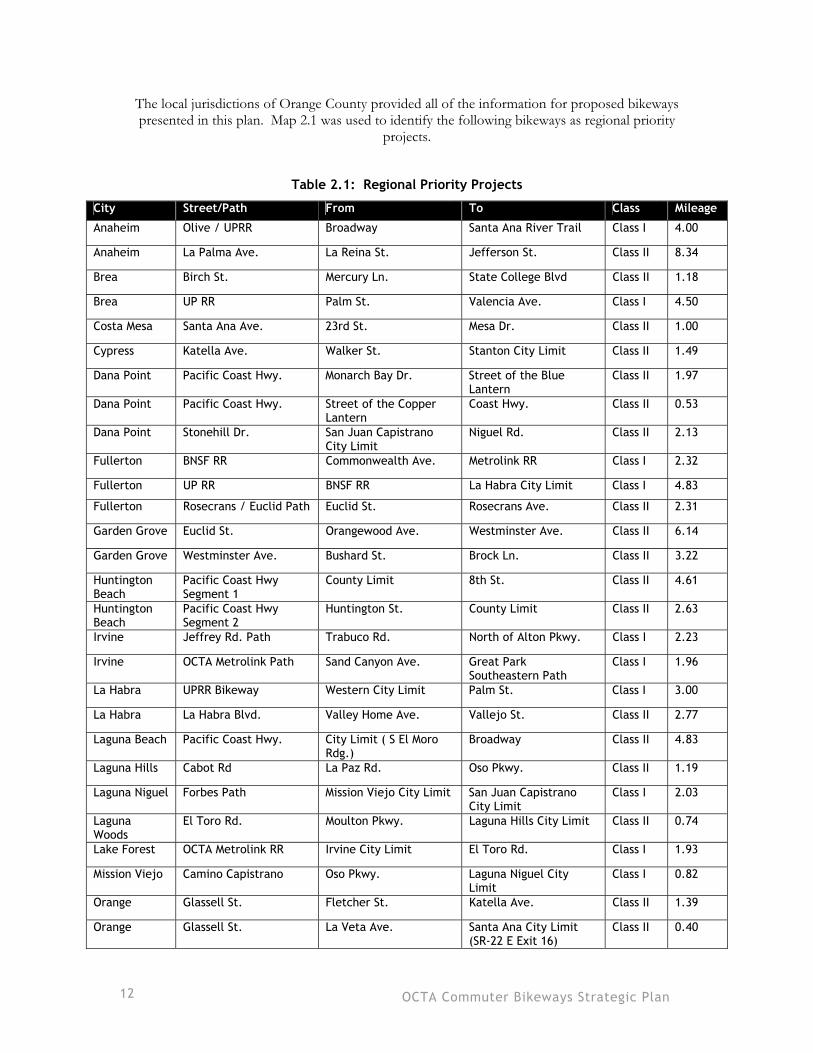
The local jurisdictions of Orange County provided all of the information for proposed bikeways presented in this plan. Map 2.1 was used to identify the following bikeways as regional priority
projects.
Table 2.1: Regional Priority Projects
City Street/Path From To Class Mileage
Anaheim Olive / UPRR Broadway Santa Ana River Trail Class I 4.00
Anaheim La Palma Ave. La Reina St. Jefferson St. Class II 8.34
Brea Birch St. Mercury Ln. State College Blvd Class II 1.18
Brea UP RR Palm St. Valencia Ave. Class I 4.50
Costa Mesa Santa Ana Ave. 23rd St. Mesa Dr. Class II 1.00
Cypress Katella Ave. Walker St. Stanton City Limit Class II 1.49
Dana Point Pacific Coast Hwy. Monarch Bay Dr. Street of the Blue Lantern
Class II 1.97
Dana Point Pacific Coast Hwy. Street of the Copper Lantern
Coast Hwy. Class II 0.53
Dana Point Stonehill Dr. San Juan Capistrano City Limit
Niguel Rd. Class II 2.13
Fullerton BNSF RR Commonwealth Ave. Metrolink RR Class I 2.32
Fullerton UP RR BNSF RR La Habra City Limit Class I 4.83
Fullerton Rosecrans / Euclid Path Euclid St. Rosecrans Ave. Class II 2.31
Garden Grove Euclid St. Orangewood Ave. Westminster Ave. Class II 6.14
Garden Grove Westminster Ave. Bushard St. Brock Ln. Class II 3.22
Huntington Beach
Pacific Coast Hwy Segment 1
County Limit 8th St. Class II 4.61
Huntington Beach
Pacific Coast Hwy Segment 2
Huntington St. County Limit Class II 2.63
Irvine Jeffrey Rd. Path Trabuco Rd. North of Alton Pkwy. Class I 2.23
Irvine OCTA Metrolink Path Sand Canyon Ave. Great Park Southeastern Path
Class I 1.96
La Habra UPRR Bikeway Western City Limit Palm St. Class I 3.00
La Habra La Habra Blvd. Valley Home Ave. Vallejo St. Class II 2.77
Laguna Beach Pacific Coast Hwy. City Limit ( S El Moro Rdg.)
Broadway Class II 4.83
Laguna Hills Cabot Rd La Paz Rd. Oso Pkwy. Class II 1.19
Laguna Niguel Forbes Path Mission Viejo City Limit San Juan Capistrano City Limit
Class I 2.03
LagunaWoods
El Toro Rd. Moulton Pkwy. Laguna Hills City Limit Class II 0.74
Lake Forest OCTA Metrolink RR Irvine City Limit El Toro Rd. Class I 1.93
Mission Viejo Camino Capistrano Oso Pkwy. Laguna Niguel City Limit
Class I 0.82
Orange Glassell St. Fletcher St. Katella Ave. Class II 1.39
Orange Glassell St. La Veta Ave. Santa Ana City Limit (SR-22 E Exit 16)
Class II 0.40
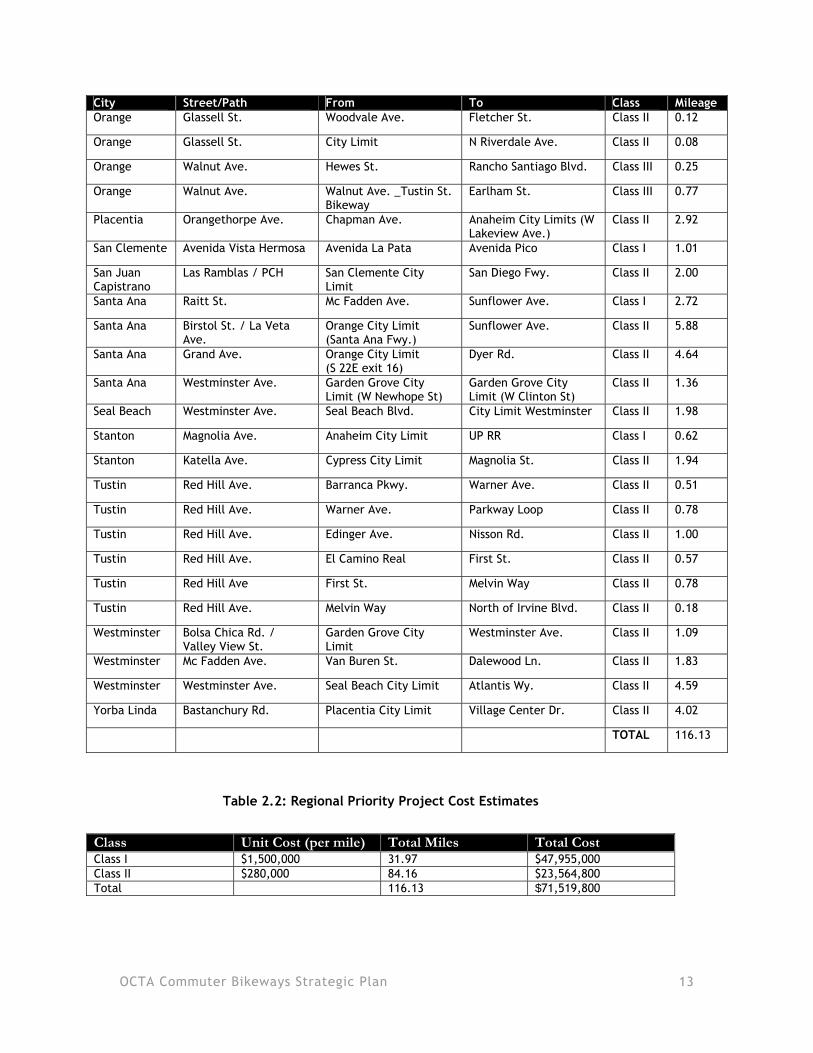
OCTA Commuter Bikeways Strategic Plan 13
City Street/Path From To Class MileageOrange Glassell St. Woodvale Ave. Fletcher St. Class II 0.12
Orange Glassell St. City Limit N Riverdale Ave. Class II 0.08
Orange Walnut Ave. Hewes St. Rancho Santiago Blvd. Class III 0.25
Orange Walnut Ave. Walnut Ave. _Tustin St. Bikeway
Earlham St. Class III 0.77
Placentia Orangethorpe Ave. Chapman Ave. Anaheim City Limits (W Lakeview Ave.)
Class II 2.92
San Clemente Avenida Vista Hermosa Avenida La Pata Avenida Pico Class I 1.01
San Juan Capistrano
Las Ramblas / PCH San Clemente City Limit
San Diego Fwy. Class II 2.00
Santa Ana Raitt St. Mc Fadden Ave. Sunflower Ave. Class I 2.72
Santa Ana Birstol St. / La Veta Ave.
Orange City Limit (Santa Ana Fwy.)
Sunflower Ave. Class II 5.88
Santa Ana Grand Ave. Orange City Limit (S 22E exit 16)
Dyer Rd. Class II 4.64
Santa Ana Westminster Ave. Garden Grove City Limit (W Newhope St)
Garden Grove City Limit (W Clinton St)
Class II 1.36
Seal Beach Westminster Ave. Seal Beach Blvd. City Limit Westminster Class II 1.98
Stanton Magnolia Ave. Anaheim City Limit UP RR Class I 0.62
Stanton Katella Ave. Cypress City Limit Magnolia St. Class II 1.94
Tustin Red Hill Ave. Barranca Pkwy. Warner Ave. Class II 0.51
Tustin Red Hill Ave. Warner Ave. Parkway Loop Class II 0.78
Tustin Red Hill Ave. Edinger Ave. Nisson Rd. Class II 1.00
Tustin Red Hill Ave. El Camino Real First St. Class II 0.57
Tustin Red Hill Ave First St. Melvin Way Class II 0.78
Tustin Red Hill Ave. Melvin Way North of Irvine Blvd. Class II 0.18
Westminster Bolsa Chica Rd. / Valley View St.
Garden Grove City Limit
Westminster Ave. Class II 1.09
Westminster Mc Fadden Ave. Van Buren St. Dalewood Ln. Class II 1.83
Westminster Westminster Ave. Seal Beach City Limit Atlantis Wy. Class II 4.59
Yorba Linda Bastanchury Rd. Placentia City Limit Village Center Dr. Class II 4.02
TOTAL 116.13
Table 2.2: Regional Priority Project Cost Estimates
Class Unit Cost (per mile) Total Miles Total Cost Class I $1,500,000 31.97 $47,955,000 Class II $280,000 84.16 $23,564,800 Total 116.13 $71,519,800

OCTA Commuter Bikeways Strategic Plan 14
2.3.Performance Criteria The input received through the outreach process also served to identify project performance criteria that can be used by local jurisdictions to prioritize their projects listed in this plan, as well as future projects. The following criteria should be considered in the order of the Tiers in which they are listed:
Tier 1:
Safety – Projects that reduce conflicts between motorists and cyclists, and address other safety concerns.
Ease of implementation – Projects with an anticipated low difficulty for implementation, based on available rights-of-way, existing traffic operations, and other similar factors.
Continuity – Projects that improve continuity within the route, or between routes.
Tier 2:
Regional significance – Projects that will benefit the overall region by addressing regional priorities identified within this plan.
Accessibility – Projects that provide one or more points of access to regional destinations.
Support facilities and programs – Projects that include any of the following support facilities or programs:
� bicycle parking (including lockers) � signage/street markings � signal detection (buttons and/or in-ground) � lighting � bicycle sharing programs � restrooms/drinking fountains � other similar facilities
Tier 3:
Directness – Projects that provide the most direct route between origins and destinations.
Route aesthetics – Projects that provide for visual aesthetics, increased comfort, a sense of personal safety, and/or other similar factors along the facility.
Public Support – Projects that appear to be supported by the public input received in the development of this plan, through letters of support, or other means of public input.
OCTA Commuter Bikeways Strategic Plan 15
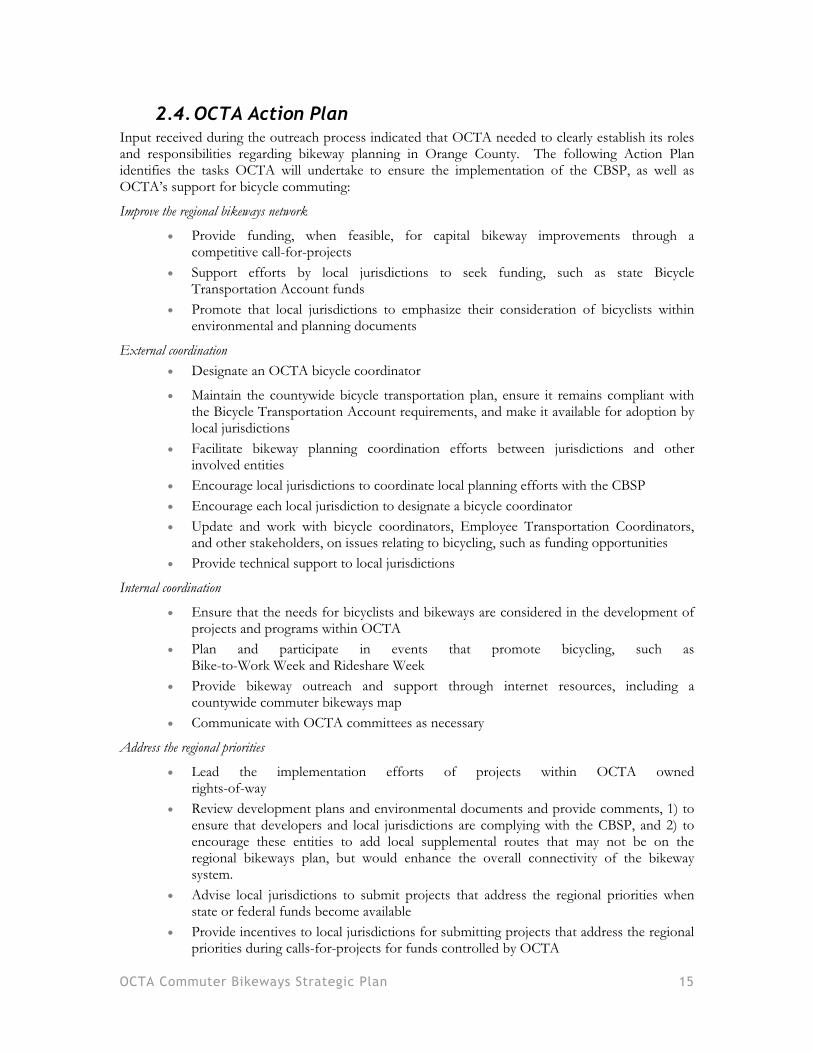
2.4.OCTA Action Plan Input received during the outreach process indicated that OCTA needed to clearly establish its roles and responsibilities regarding bikeway planning in Orange County. The following Action Plan identifies the tasks OCTA will undertake to ensure the implementation of the CBSP, as well as OCTA’s support for bicycle commuting:
Improve the regional bikeways network
� Provide funding, when feasible, for capital bikeway improvements through a competitive call-for-projects
� Support efforts by local jurisdictions to seek funding, such as state Bicycle Transportation Account funds
� Promote that local jurisdictions to emphasize their consideration of bicyclists within environmental and planning documents
External coordination � Designate an OCTA bicycle coordinator
� Maintain the countywide bicycle transportation plan, ensure it remains compliant with the Bicycle Transportation Account requirements, and make it available for adoption by local jurisdictions
� Facilitate bikeway planning coordination efforts between jurisdictions and other involved entities
� Encourage local jurisdictions to coordinate local planning efforts with the CBSP � Encourage each local jurisdiction to designate a bicycle coordinator � Update and work with bicycle coordinators, Employee Transportation Coordinators,
and other stakeholders, on issues relating to bicycling, such as funding opportunities � Provide technical support to local jurisdictions
Internal coordination
� Ensure that the needs for bicyclists and bikeways are considered in the development of projects and programs within OCTA
� Plan and participate in events that promote bicycling, such as Bike-to-Work Week and Rideshare Week
� Provide bikeway outreach and support through internet resources, including a countywide commuter bikeways map
� Communicate with OCTA committees as necessary
Address the regional priorities
� Lead the implementation efforts of projects within OCTA owned rights-of-way
� Review development plans and environmental documents and provide comments, 1) to ensure that developers and local jurisdictions are complying with the CBSP, and 2) to encourage these entities to add local supplemental routes that may not be on the regional bikeways plan, but would enhance the overall connectivity of the bikeway system.
� Advise local jurisdictions to submit projects that address the regional priorities when state or federal funds become available
� Provide incentives to local jurisdictions for submitting projects that address the regional priorities during calls-for-projects for funds controlled by OCTA
OCTA Commuter Bikeways Strategic Plan 16
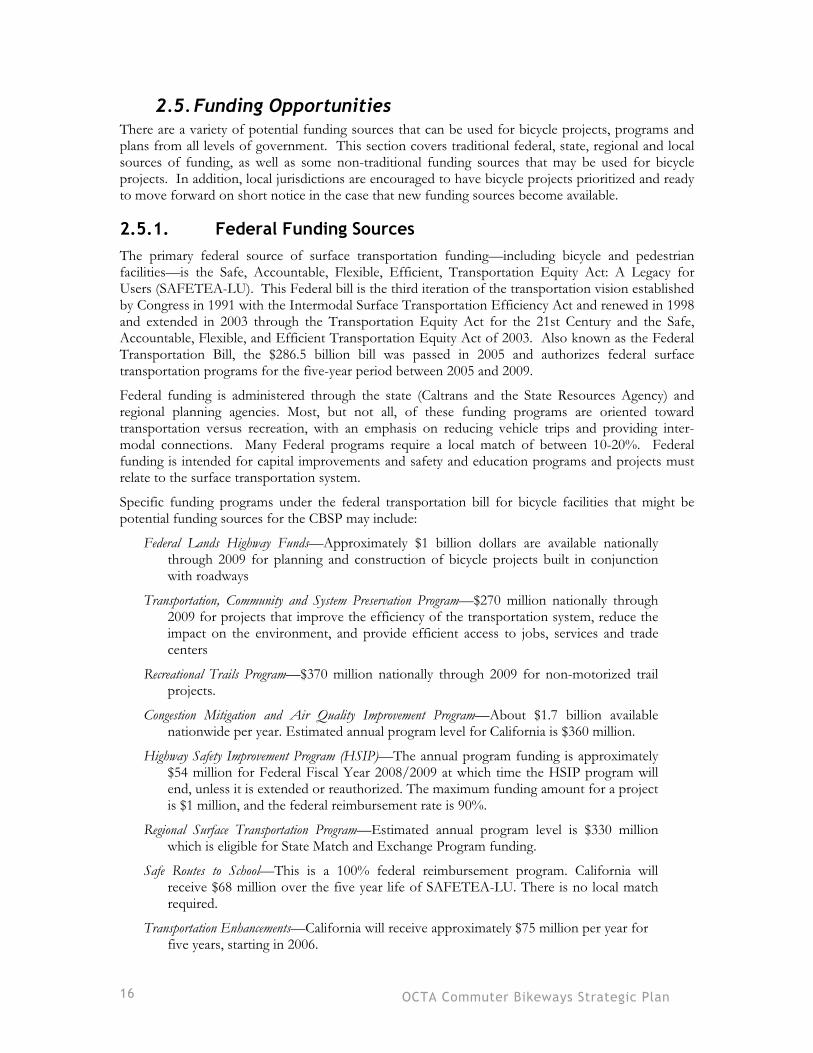
2.5.Funding Opportunities There are a variety of potential funding sources that can be used for bicycle projects, programs and plans from all levels of government. This section covers traditional federal, state, regional and local sources of funding, as well as some non-traditional funding sources that may be used for bicycle projects. In addition, local jurisdictions are encouraged to have bicycle projects prioritized and ready to move forward on short notice in the case that new funding sources become available.
2.5.1. Federal Funding Sources The primary federal source of surface transportation funding—including bicycle and pedestrian facilities—is the Safe, Accountable, Flexible, Efficient, Transportation Equity Act: A Legacy for Users (SAFETEA-LU). This Federal bill is the third iteration of the transportation vision established by Congress in 1991 with the Intermodal Surface Transportation Efficiency Act and renewed in 1998 and extended in 2003 through the Transportation Equity Act for the 21st Century and the Safe, Accountable, Flexible, and Efficient Transportation Equity Act of 2003. Also known as the Federal Transportation Bill, the $286.5 billion bill was passed in 2005 and authorizes federal surface transportation programs for the five-year period between 2005 and 2009.
Federal funding is administered through the state (Caltrans and the State Resources Agency) and regional planning agencies. Most, but not all, of these funding programs are oriented toward transportation versus recreation, with an emphasis on reducing vehicle trips and providing inter-modal connections. Many Federal programs require a local match of between 10-20%. Federal funding is intended for capital improvements and safety and education programs and projects must relate to the surface transportation system.
Specific funding programs under the federal transportation bill for bicycle facilities that might be potential funding sources for the CBSP may include:
Federal Lands Highway Funds—Approximately $1 billion dollars are available nationally through 2009 for planning and construction of bicycle projects built in conjunction with roadways
Transportation, Community and System Preservation Program—$270 million nationally through 2009 for projects that improve the efficiency of the transportation system, reduce the impact on the environment, and provide efficient access to jobs, services and trade centers
Recreational Trails Program—$370 million nationally through 2009 for non-motorized trail projects.
Congestion Mitigation and Air Quality Improvement Program—About $1.7 billion available nationwide per year. Estimated annual program level for California is $360 million.
Highway Safety Improvement Program (HSIP)—The annual program funding is approximately $54 million for Federal Fiscal Year 2008/2009 at which time the HSIP program will end, unless it is extended or reauthorized. The maximum funding amount for a project is $1 million, and the federal reimbursement rate is 90%.
Regional Surface Transportation Program—Estimated annual program level is $330 million which is eligible for State Match and Exchange Program funding.
Safe Routes to School—This is a 100% federal reimbursement program. California will receive $68 million over the five year life of SAFETEA-LU. There is no local match required.
Transportation Enhancements—California will receive approximately $75 million per year for five years, starting in 2006.
OCTA Commuter Bikeways Strategic Plan 17
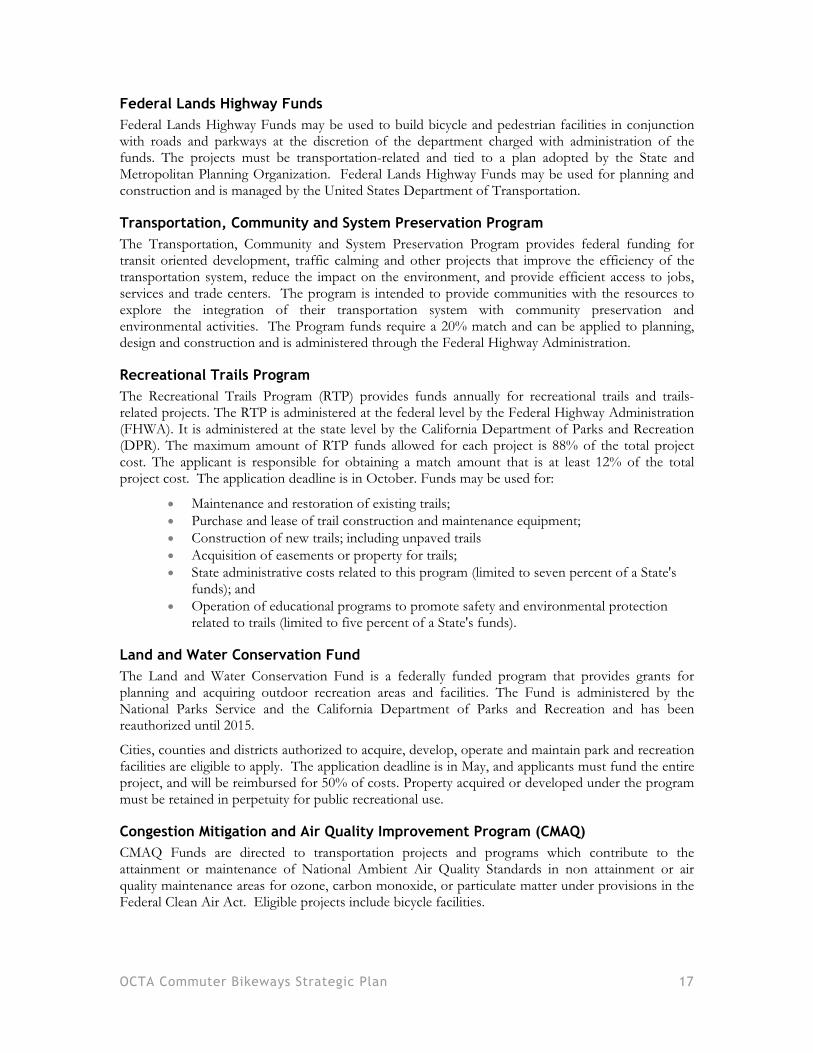
Federal Lands Highway Funds Federal Lands Highway Funds may be used to build bicycle and pedestrian facilities in conjunction with roads and parkways at the discretion of the department charged with administration of the funds. The projects must be transportation-related and tied to a plan adopted by the State and Metropolitan Planning Organization. Federal Lands Highway Funds may be used for planning and construction and is managed by the United States Department of Transportation.
Transportation, Community and System Preservation Program The Transportation, Community and System Preservation Program provides federal funding for transit oriented development, traffic calming and other projects that improve the efficiency of the transportation system, reduce the impact on the environment, and provide efficient access to jobs, services and trade centers. The program is intended to provide communities with the resources to explore the integration of their transportation system with community preservation and environmental activities. The Program funds require a 20% match and can be applied to planning, design and construction and is administered through the Federal Highway Administration.
Recreational Trails Program The Recreational Trails Program (RTP) provides funds annually for recreational trails and trails-related projects. The RTP is administered at the federal level by the Federal Highway Administration (FHWA). It is administered at the state level by the California Department of Parks and Recreation (DPR). The maximum amount of RTP funds allowed for each project is 88% of the total project cost. The applicant is responsible for obtaining a match amount that is at least 12% of the total project cost. The application deadline is in October. Funds may be used for:
� Maintenance and restoration of existing trails; � Purchase and lease of trail construction and maintenance equipment; � Construction of new trails; including unpaved trails � Acquisition of easements or property for trails; � State administrative costs related to this program (limited to seven percent of a State's
funds); and � Operation of educational programs to promote safety and environmental protection
related to trails (limited to five percent of a State's funds).
Land and Water Conservation Fund The Land and Water Conservation Fund is a federally funded program that provides grants for planning and acquiring outdoor recreation areas and facilities. The Fund is administered by the National Parks Service and the California Department of Parks and Recreation and has been reauthorized until 2015.
Cities, counties and districts authorized to acquire, develop, operate and maintain park and recreation facilities are eligible to apply. The application deadline is in May, and applicants must fund the entire project, and will be reimbursed for 50% of costs. Property acquired or developed under the program must be retained in perpetuity for public recreational use.
Congestion Mitigation and Air Quality Improvement Program (CMAQ) CMAQ Funds are directed to transportation projects and programs which contribute to the attainment or maintenance of National Ambient Air Quality Standards in non attainment or air quality maintenance areas for ozone, carbon monoxide, or particulate matter under provisions in the Federal Clean Air Act. Eligible projects include bicycle facilities.
OCTA Commuter Bikeways Strategic Plan 18
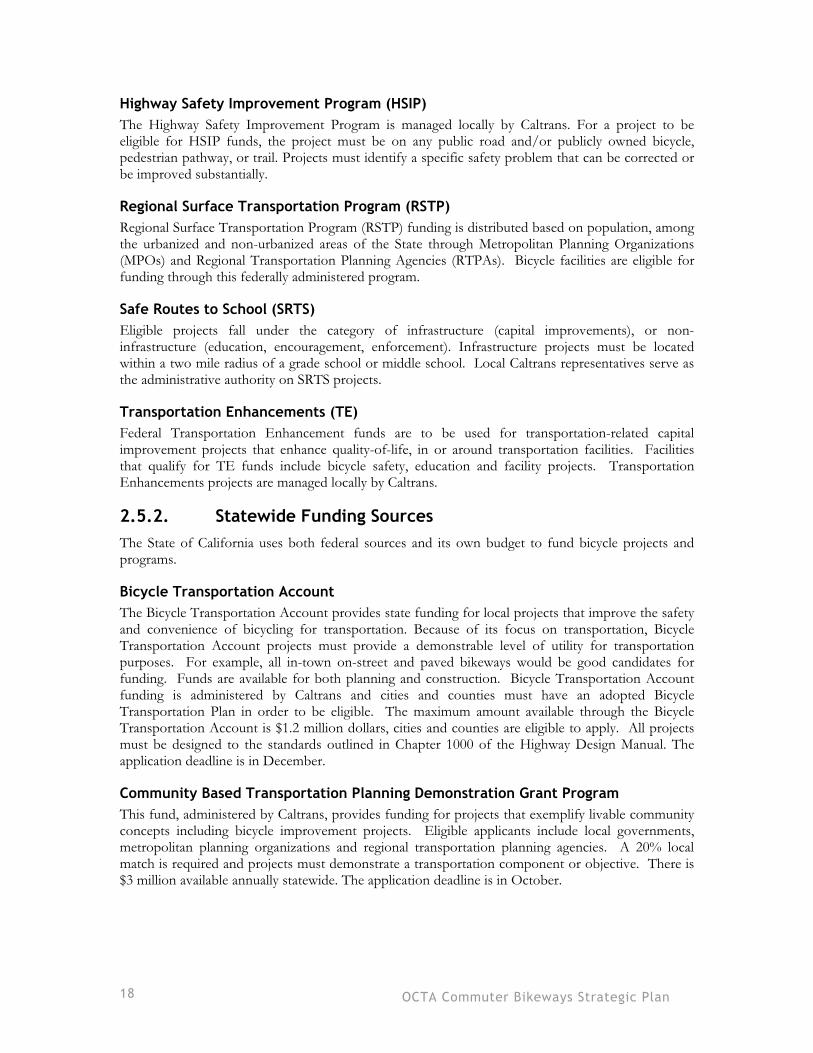
Highway Safety Improvement Program (HSIP) The Highway Safety Improvement Program is managed locally by Caltrans. For a project to be eligible for HSIP funds, the project must be on any public road and/or publicly owned bicycle, pedestrian pathway, or trail. Projects must identify a specific safety problem that can be corrected or be improved substantially.
Regional Surface Transportation Program (RSTP) Regional Surface Transportation Program (RSTP) funding is distributed based on population, among the urbanized and non-urbanized areas of the State through Metropolitan Planning Organizations (MPOs) and Regional Transportation Planning Agencies (RTPAs). Bicycle facilities are eligible for funding through this federally administered program.
Safe Routes to School (SRTS) Eligible projects fall under the category of infrastructure (capital improvements), or non-infrastructure (education, encouragement, enforcement). Infrastructure projects must be located within a two mile radius of a grade school or middle school. Local Caltrans representatives serve as the administrative authority on SRTS projects.
Transportation Enhancements (TE) Federal Transportation Enhancement funds are to be used for transportation-related capital improvement projects that enhance quality-of-life, in or around transportation facilities. Facilities that qualify for TE funds include bicycle safety, education and facility projects. Transportation Enhancements projects are managed locally by Caltrans.
2.5.2. Statewide Funding Sources The State of California uses both federal sources and its own budget to fund bicycle projects and programs.
Bicycle Transportation Account The Bicycle Transportation Account provides state funding for local projects that improve the safety and convenience of bicycling for transportation. Because of its focus on transportation, Bicycle Transportation Account projects must provide a demonstrable level of utility for transportation purposes. For example, all in-town on-street and paved bikeways would be good candidates for funding. Funds are available for both planning and construction. Bicycle Transportation Account funding is administered by Caltrans and cities and counties must have an adopted Bicycle Transportation Plan in order to be eligible. The maximum amount available through the Bicycle Transportation Account is $1.2 million dollars, cities and counties are eligible to apply. All projects must be designed to the standards outlined in Chapter 1000 of the Highway Design Manual. The application deadline is in December.
Community Based Transportation Planning Demonstration Grant Program This fund, administered by Caltrans, provides funding for projects that exemplify livable community concepts including bicycle improvement projects. Eligible applicants include local governments, metropolitan planning organizations and regional transportation planning agencies. A 20% local match is required and projects must demonstrate a transportation component or objective. There is $3 million available annually statewide. The application deadline is in October.
OCTA Commuter Bikeways Strategic Plan 19
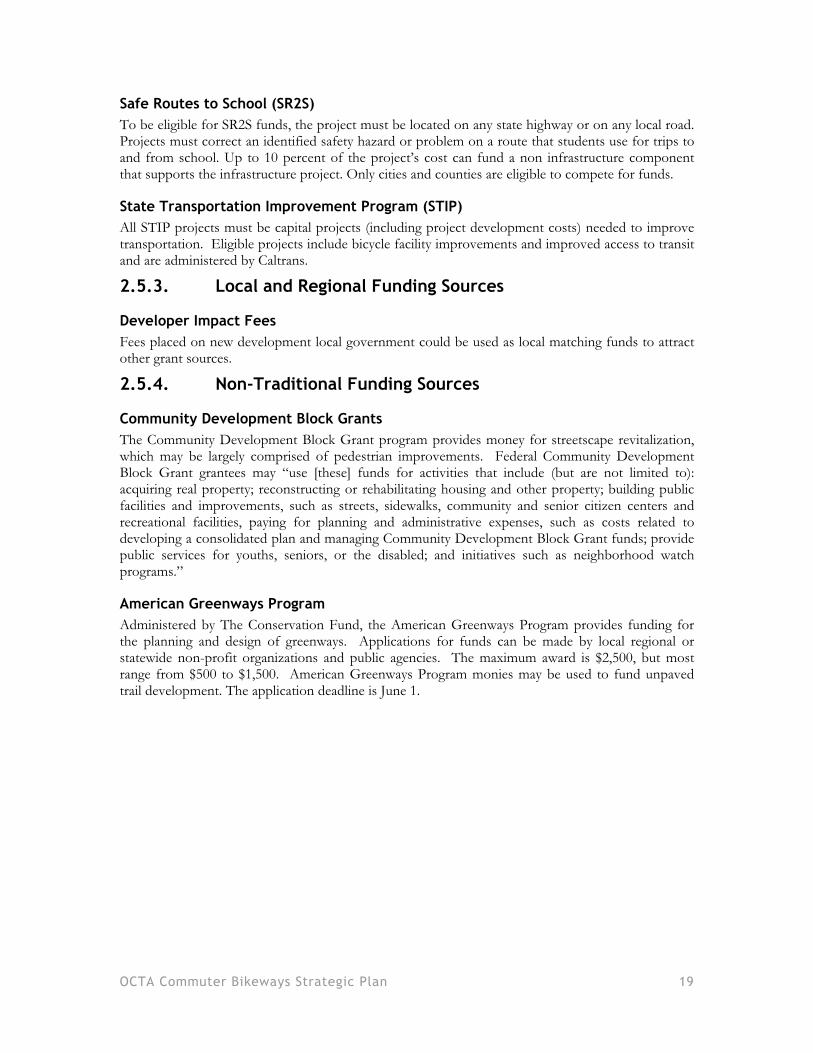
Safe Routes to School (SR2S) To be eligible for SR2S funds, the project must be located on any state highway or on any local road. Projects must correct an identified safety hazard or problem on a route that students use for trips to and from school. Up to 10 percent of the project’s cost can fund a non infrastructure component that supports the infrastructure project. Only cities and counties are eligible to compete for funds.
State Transportation Improvement Program (STIP) All STIP projects must be capital projects (including project development costs) needed to improve transportation. Eligible projects include bicycle facility improvements and improved access to transit and are administered by Caltrans.
2.5.3. Local and Regional Funding Sources
Developer Impact Fees Fees placed on new development local government could be used as local matching funds to attract other grant sources.
2.5.4. Non-Traditional Funding Sources
Community Development Block Grants The Community Development Block Grant program provides money for streetscape revitalization, which may be largely comprised of pedestrian improvements. Federal Community Development Block Grant grantees may “use [these] funds for activities that include (but are not limited to): acquiring real property; reconstructing or rehabilitating housing and other property; building public facilities and improvements, such as streets, sidewalks, community and senior citizen centers and recreational facilities, paying for planning and administrative expenses, such as costs related to developing a consolidated plan and managing Community Development Block Grant funds; provide public services for youths, seniors, or the disabled; and initiatives such as neighborhood watch programs.”
American Greenways Program Administered by The Conservation Fund, the American Greenways Program provides funding for the planning and design of greenways. Applications for funds can be made by local regional or statewide non-profit organizations and public agencies. The maximum award is $2,500, but most range from $500 to $1,500. American Greenways Program monies may be used to fund unpaved trail development. The application deadline is June 1.
OCTA Commuter Bikeways Strategic Plan 20
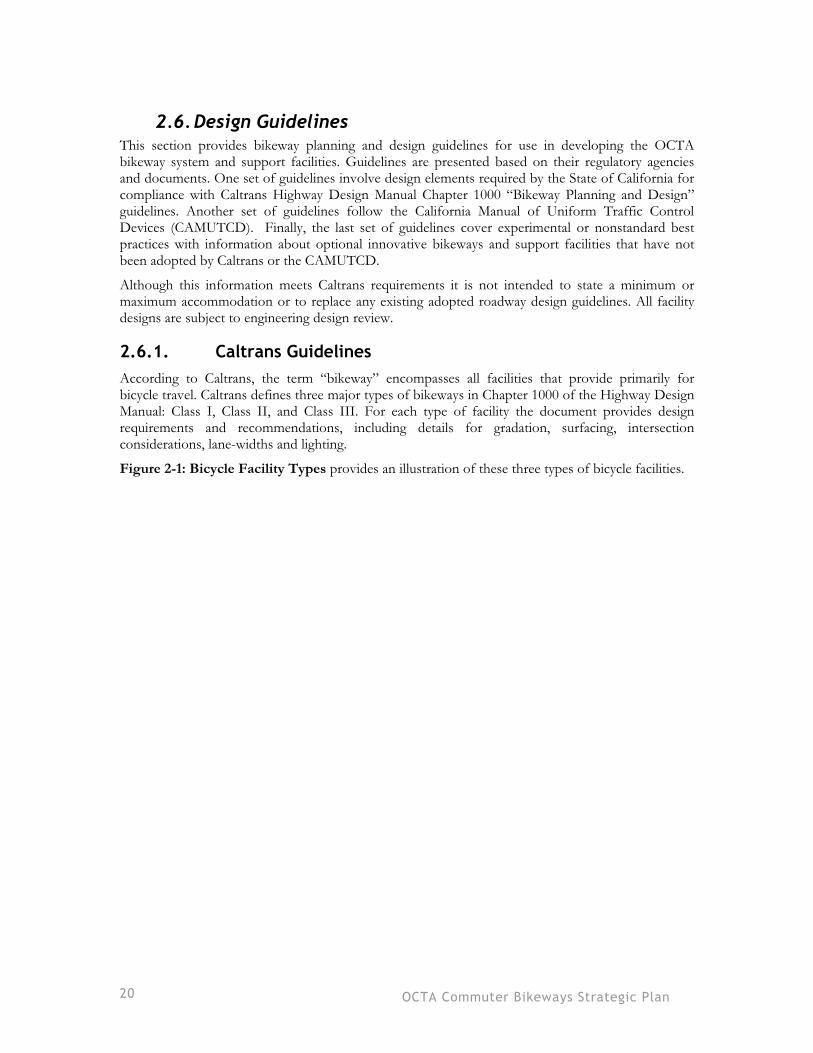
2.6.Design Guidelines This section provides bikeway planning and design guidelines for use in developing the OCTA bikeway system and support facilities. Guidelines are presented based on their regulatory agencies and documents. One set of guidelines involve design elements required by the State of California for compliance with Caltrans Highway Design Manual Chapter 1000 “Bikeway Planning and Design” guidelines. Another set of guidelines follow the California Manual of Uniform Traffic Control Devices (CAMUTCD). Finally, the last set of guidelines cover experimental or nonstandard best practices with information about optional innovative bikeways and support facilities that have not been adopted by Caltrans or the CAMUTCD.
Although this information meets Caltrans requirements it is not intended to state a minimum or maximum accommodation or to replace any existing adopted roadway design guidelines. All facility designs are subject to engineering design review.
2.6.1. Caltrans Guidelines According to Caltrans, the term “bikeway” encompasses all facilities that provide primarily for bicycle travel. Caltrans defines three major types of bikeways in Chapter 1000 of the Highway Design Manual: Class I, Class II, and Class III. For each type of facility the document provides design requirements and recommendations, including details for gradation, surfacing, intersection considerations, lane-widths and lighting.
Figure 2-1: Bicycle Facility Types provides an illustration of these three types of bicycle facilities.

OCTA Commuter Bikeways Strategic Plan 21
Figure 2.1: Bicycle Facility Types
OCTA Commuter Bikeways Strategic Plan 22
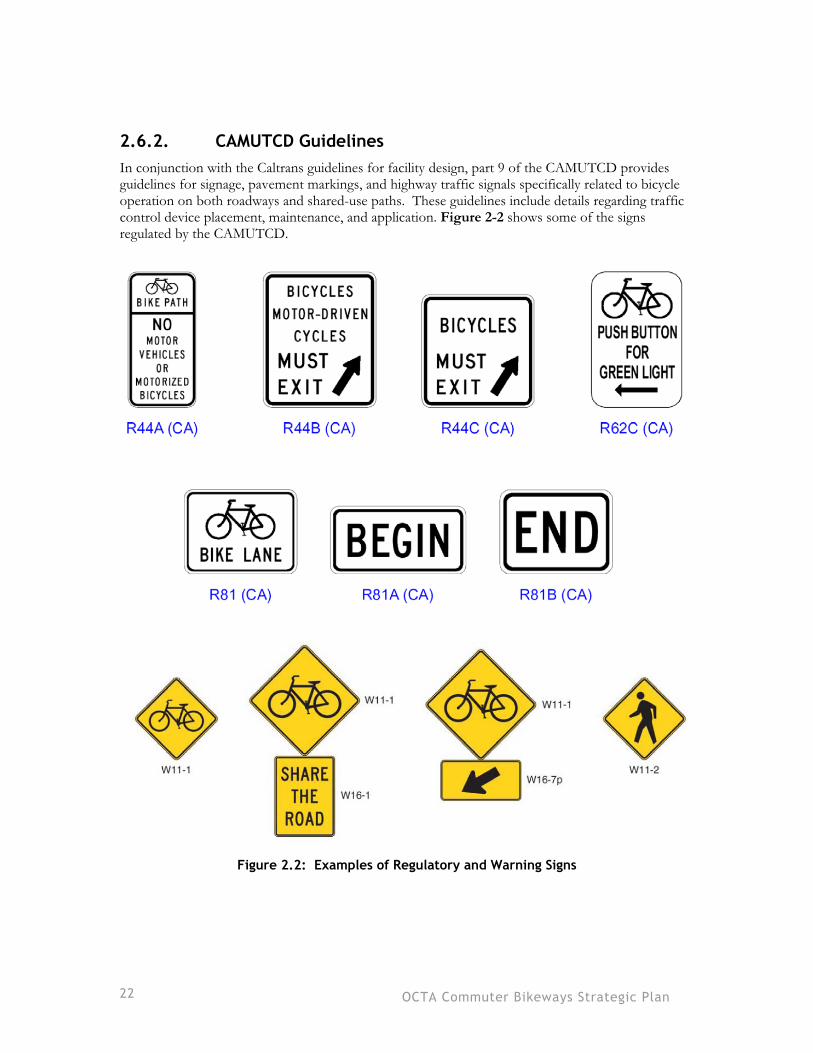
2.6.2. CAMUTCD Guidelines In conjunction with the Caltrans guidelines for facility design, part 9 of the CAMUTCD provides guidelines for signage, pavement markings, and highway traffic signals specifically related to bicycle operation on both roadways and shared-use paths. These guidelines include details regarding traffic control device placement, maintenance, and application. Figure 2-2 shows some of the signs regulated by the CAMUTCD.
Figure 2.2: Examples of Regulatory and Warning Signs

OCTA Commuter Bikeways Strategic Plan 23
2.6.3. Guidelines for Innovative Treatments The following set of guidelines present treatments that go beyond the Caltrans and CAMUTCD standards. These primarily consist of facilities that help bicyclists negotiate particularly challenging roadways and improve the convenience of bicycle travel. Almost every city in Orange County features locations where these innovative treatments can make conditions easier, more convenient, and safer for bicycle commuters. These treatments may be key in determining a Level of Service (LOS) standard for the region’s bikeways. If developed, this LOS can give bicyclists an at-a-glance idea of the level of convenience that will be provided when choosing a route.
Freeway Ramps
Freeway on- and off-ramp crossings present a potential conflict zone for bicyclists and motorists, as bicycle lanes are typically dropped and bicyclists must merge across travel lanes where vehicles are accelerating or decelerating from freeway speeds. The appropriate bicyclist behavior is to merge left away so as to be positioned in the through lane well before the mouth of the on-ramp, and to remain out away from the curb until past the off-ramp. Implementation of interchange improvements requires coordination with Caltrans District 12 regarding placement of signage and striping because these areas are in Caltrans’ right-of-way. Two guidelines for these improvements are:
� The bicycle merge should begin 250 feet in advance of the freeway on-ramp. � Appropriate signage and striping should be used to warn bicyclists and motorists of
the merge. Bicycle improvements to freeway ramps are shown in .
Figure 2.3: Bike Crossing of Freeway Ramps
The City of Portland has addressed this issue with striping or physical elements that encourage bicyclists to cross ramps at or close to a right angle. The treatment shortens the vehicle/bicycle conflict zone while also improving sight distance for bicyclists. Some bicyclists may choose to ignore this treatment however, as this creates a less-direct route through the interchange area and forces them to relinquish right-of-way to exiting motorists.
OCTA Commuter Bikeways Strategic Plan 24
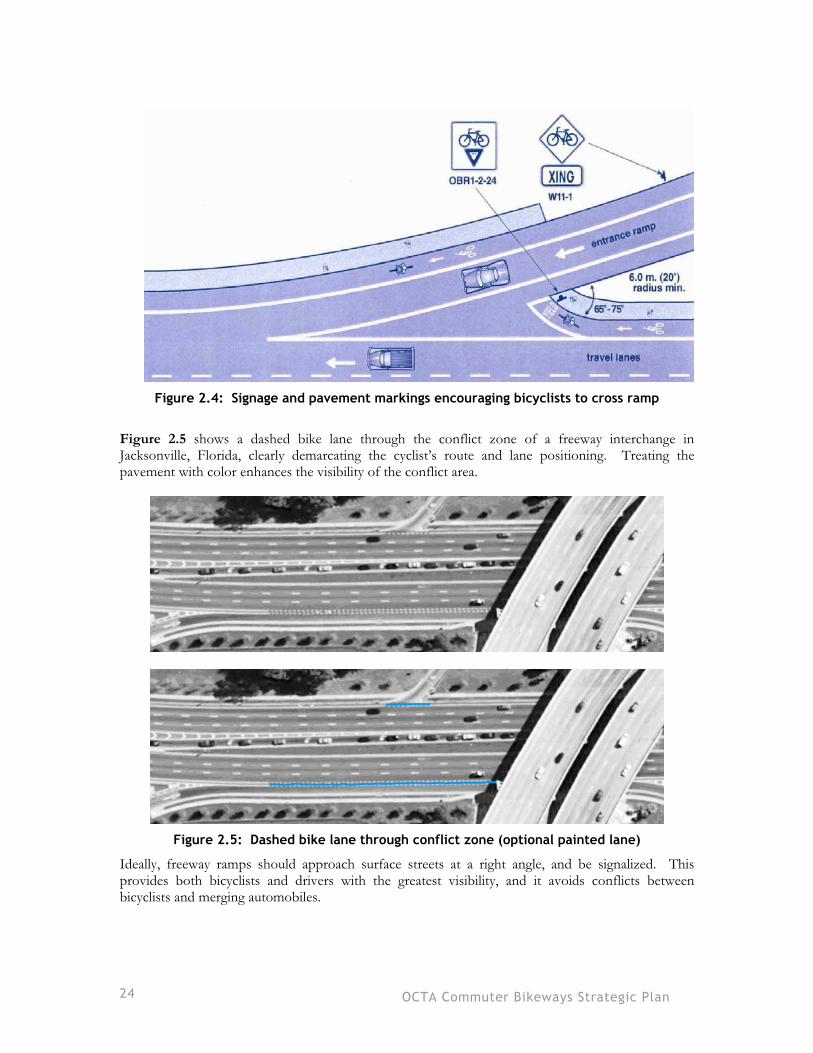
Figure 2.4: Signage and pavement markings encouraging bicyclists to cross ramp
Figure 2.5 shows a dashed bike lane through the conflict zone of a freeway interchange in Jacksonville, Florida, clearly demarcating the cyclist’s route and lane positioning. Treating the pavement with color enhances the visibility of the conflict area.
Figure 2.5: Dashed bike lane through conflict zone (optional painted lane)
Ideally, freeway ramps should approach surface streets at a right angle, and be signalized. This provides both bicyclists and drivers with the greatest visibility, and it avoids conflicts between bicyclists and merging automobiles.

OCTA Commuter Bikeways Strategic Plan 25
At-grade Undercrossings At-grade undercrossing facilities for pedestrians and bicyclists can be beneficial to a region’s bikeway network. Because they require less excavation than roads, they provide time and financial savings. At-grade undercrossings do not require the same amount of elevation change as adjacent roadways because they do not have the same height clearance requirements. As Figure 2.6 demonstrates, the shorter the elevation change (and closer to perfectly flat) the more convenient the path will be.
Bicycle Signals & Detectors at Intersections Many traffic signals are not programmed or sensitive enough to detect a bicyclist waiting at an intersection. When this happens, bicyclists can become frustrated and attempt to cross an intersection before the light changes. Two innovative methods for addressing this problem are bicyclist-oriented push buttons or loop detectors. Push buttons work in the same way a pedestrian actuated cross signal does, but it is placed conveniently next to the curb where bicyclists can activate it (without having to dismount their bike) and contains signage that promotes its use (Figure 2.7). Another facility designed to help bicyclists at intersections are conductor loops. As Figure 2.8 demonstrates, pavement markings can be used in conjunction with the detector loop to instruct bicyclists where to wait while at an intersection. These innovative treatments are effectively address the concerns of bicyclists waiting at traffic signals, while also promoting safe and courteous bicycle riding.
Figure 2.6: Lemon St. at Truslow Ave, Fullerton
Figure 2.7: Push-button for Bicyclists
Figure 2.8: In-pavement Loop Detector

OCTA Commuter Bikeways Strategic Plan 26
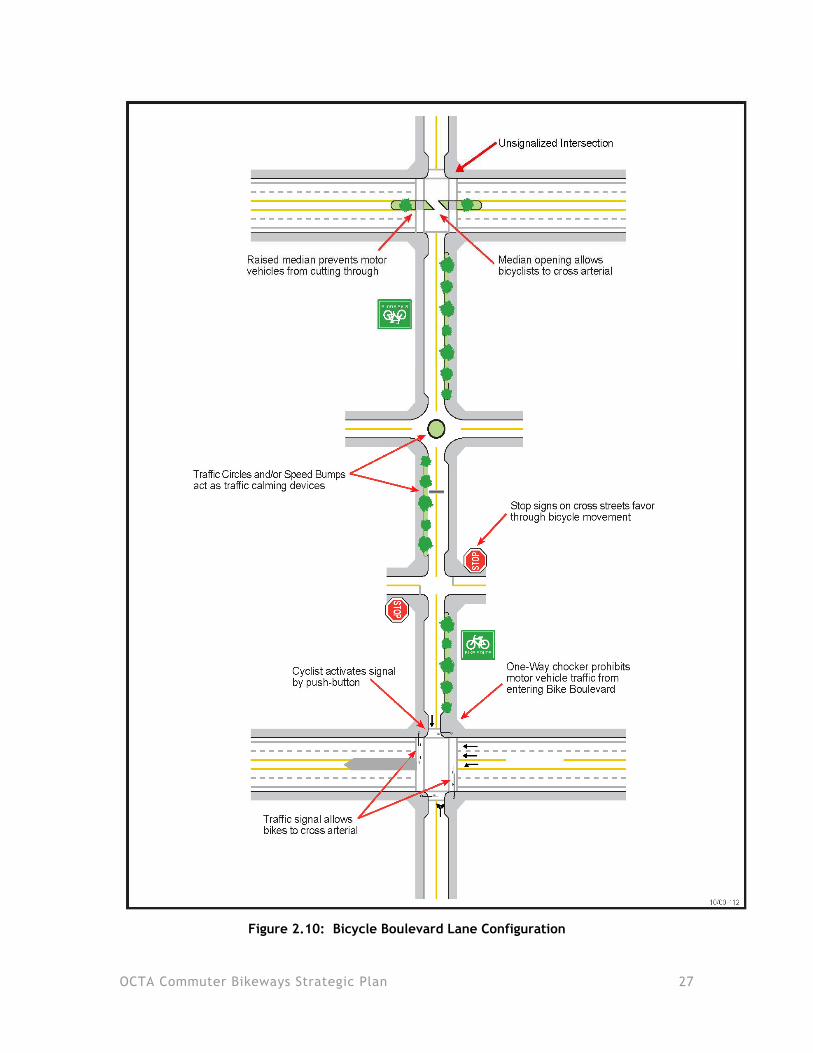
Bicycle Boulevards Bicycle Boulevards have been implemented in numerous California locations including Berkeley, Davis, and Pasadena. A Bicycle Boulevard, also known as bicycle priority road, is a roadway that allows all types of vehicles, but which has been modified to enhance bicycle safety and security. Roadways are designed to be places where cars and bicycles can equally share right-of-way. Bicycle Boulevards tend to be residential streets with lower traffic volumes, typically between 3000 to 5000 average daily vehicles, but can include secondary commercial streets.
Figure 2.9 shows the typical design features of bicycle boulevards, these include:
� Traffic calming devices such as traffic circles and curb bulb outs
� Bicycle destination signage � Pavement stencils indicating status as a
Bicycle Boulevard � Crossing improvements at major arterials
such as traffic signals with bicycle-detection, four-way stops and high-visibility crosswalks
� Bicycle-friendly signal preemption at high-volume signalized intersections.
� Stop signs on streets crossing the Bicycle Boulevard
Bicycle Boulevards can be designed to accommodate the particular needs of the residents and businesses along the routes, and may be as simple as pavement markings with wayfinding signs or as complex as streets with traffic diverters and bicycle signals. Many good candidates for Bicycle Boulevards may benefit most from signage and public education. Substantial capital improvements may not be necessary.
To further identify a street as a preferred bicycle route, lower volume roadways may be modified to function as a through street for bicycles, while maintaining only local access for automobiles. Traffic calming devices can lower traffic speeds and through trips, limiting conflicts between motorists and bicyclists and providing priority to through bicycle movement.
Figure 2.9: Bicycle Boulevard Signage
in Berkeley, CA
OCTA Commuter Bikeways Strategic Plan 27
Figure 2.10: Bicycle Boulevard Lane Configuration
OCTA Commuter Bikeways Strategic Plan 28
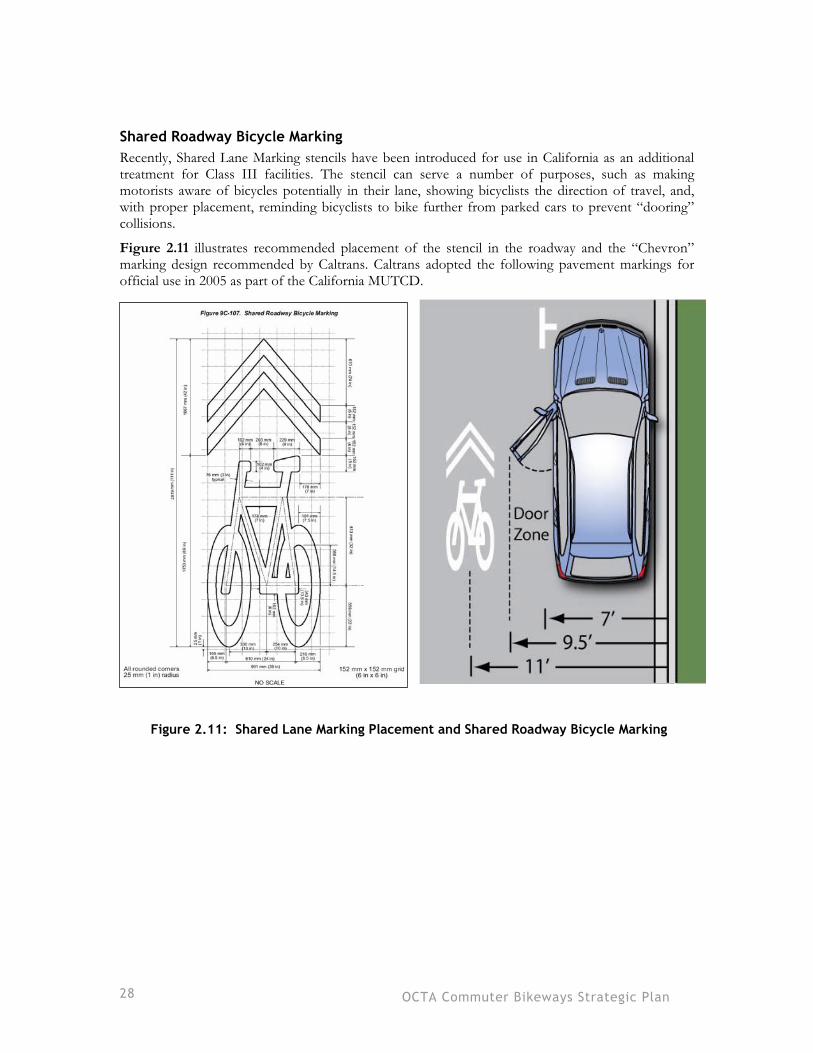
Shared Roadway Bicycle Marking Recently, Shared Lane Marking stencils have been introduced for use in California as an additional treatment for Class III facilities. The stencil can serve a number of purposes, such as making motorists aware of bicycles potentially in their lane, showing bicyclists the direction of travel, and, with proper placement, reminding bicyclists to bike further from parked cars to prevent “dooring” collisions.
Figure 2.11 illustrates recommended placement of the stencil in the roadway and the “Chevron” marking design recommended by Caltrans. Caltrans adopted the following pavement markings for official use in 2005 as part of the California MUTCD.
Figure 2.11: Shared Lane Marking Placement and Shared Roadway Bicycle Marking
OCTA Commuter Bikeways Strategic Plan 29
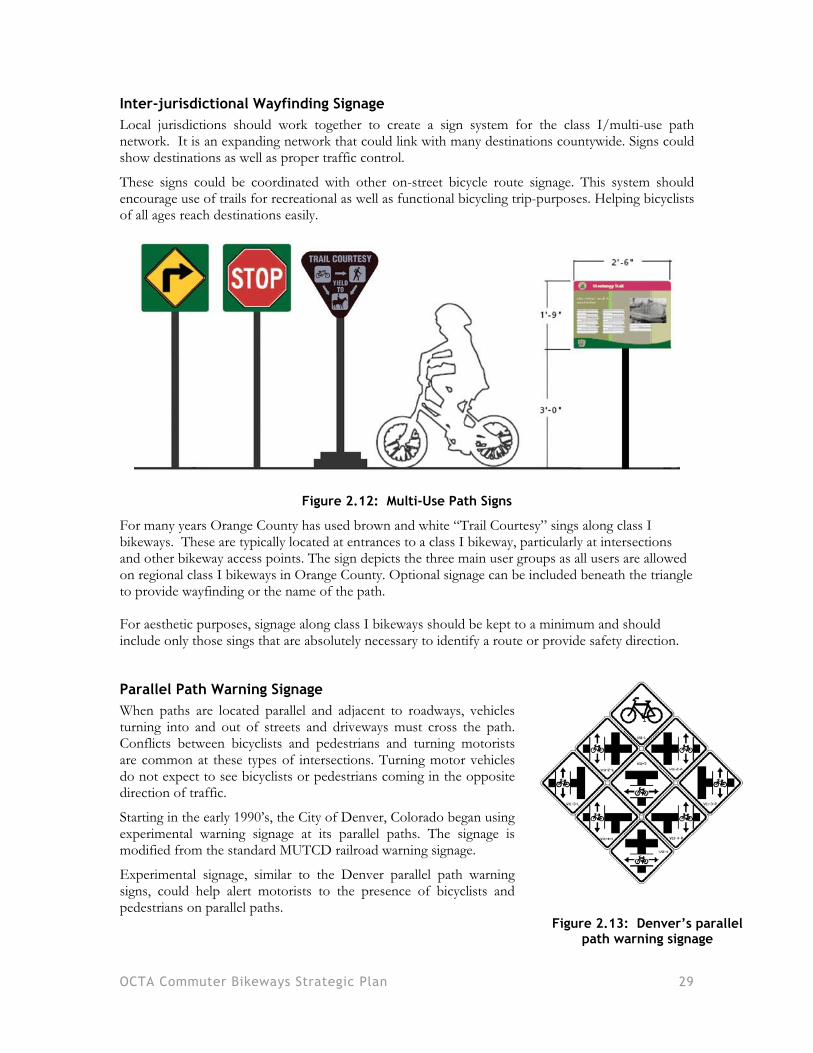
Inter-jurisdictional Wayfinding Signage Local jurisdictions should work together to create a sign system for the class I/multi-use path network. It is an expanding network that could link with many destinations countywide. Signs could show destinations as well as proper traffic control.
These signs could be coordinated with other on-street bicycle route signage. This system should encourage use of trails for recreational as well as functional bicycling trip-purposes. Helping bicyclists of all ages reach destinations easily.
Figure 2.12: Multi-Use Path Signs
For many years Orange County has used brown and white “Trail Courtesy” sings along class I bikeways. These are typically located at entrances to a class I bikeway, particularly at intersections and other bikeway access points. The sign depicts the three main user groups as all users are allowed on regional class I bikeways in Orange County. Optional signage can be included beneath the triangle to provide wayfinding or the name of the path. For aesthetic purposes, signage along class I bikeways should be kept to a minimum and should include only those sings that are absolutely necessary to identify a route or provide safety direction.
Parallel Path Warning Signage When paths are located parallel and adjacent to roadways, vehicles turning into and out of streets and driveways must cross the path. Conflicts between bicyclists and pedestrians and turning motorists are common at these types of intersections. Turning motor vehicles do not expect to see bicyclists or pedestrians coming in the opposite direction of traffic.
Starting in the early 1990’s, the City of Denver, Colorado began using experimental warning signage at its parallel paths. The signage is modified from the standard MUTCD railroad warning signage.
Experimental signage, similar to the Denver parallel path warning signs, could help alert motorists to the presence of bicyclists and pedestrians on parallel paths.
Figure 2.13: Denver’s parallel path warning signage
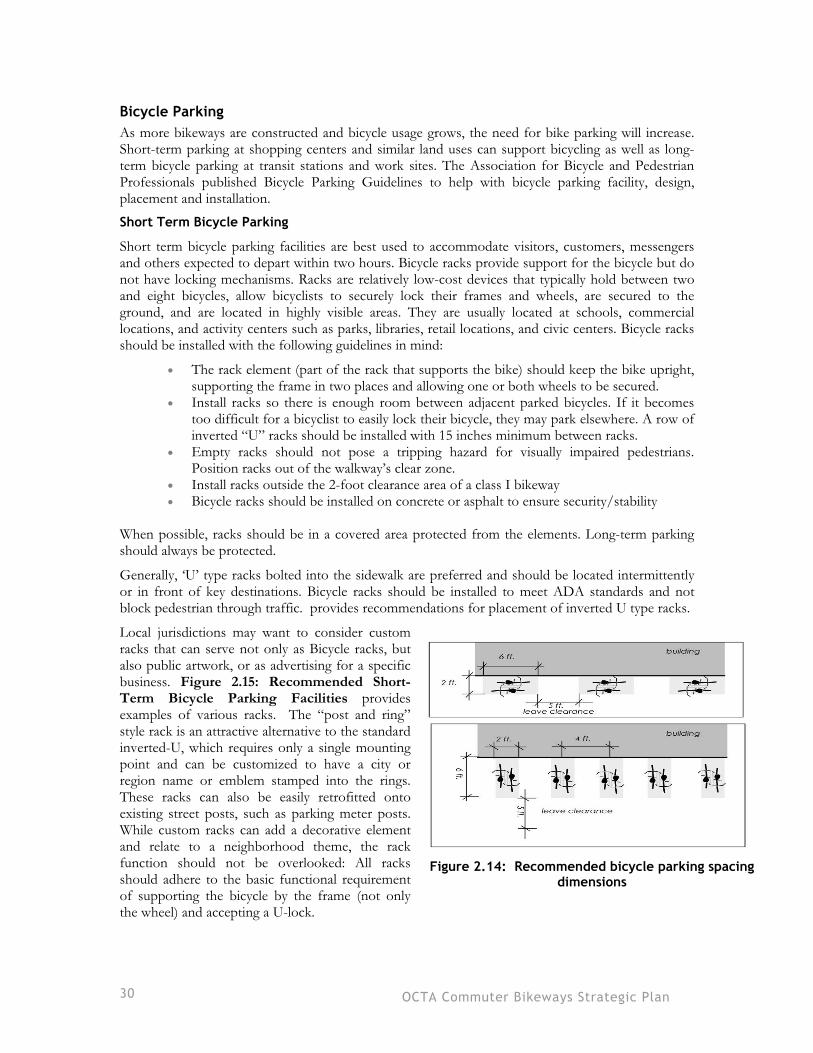
OCTA Commuter Bikeways Strategic Plan 30
Bicycle ParkingAs more bikeways are constructed and bicycle usage grows, the need for bike parking will increase. Short-term parking at shopping centers and similar land uses can support bicycling as well as long-term bicycle parking at transit stations and work sites. The Association for Bicycle and Pedestrian Professionals published Bicycle Parking Guidelines to help with bicycle parking facility, design, placement and installation.
Short Term Bicycle Parking
Short term bicycle parking facilities are best used to accommodate visitors, customers, messengers and others expected to depart within two hours. Bicycle racks provide support for the bicycle but do not have locking mechanisms. Racks are relatively low-cost devices that typically hold between two and eight bicycles, allow bicyclists to securely lock their frames and wheels, are secured to the ground, and are located in highly visible areas. They are usually located at schools, commercial locations, and activity centers such as parks, libraries, retail locations, and civic centers. Bicycle racks should be installed with the following guidelines in mind:
� The rack element (part of the rack that supports the bike) should keep the bike upright, supporting the frame in two places and allowing one or both wheels to be secured.
� Install racks so there is enough room between adjacent parked bicycles. If it becomes too difficult for a bicyclist to easily lock their bicycle, they may park elsewhere. A row of inverted “U” racks should be installed with 15 inches minimum between racks.
� Empty racks should not pose a tripping hazard for visually impaired pedestrians. Position racks out of the walkway’s clear zone.
� Install racks outside the 2-foot clearance area of a class I bikeway � Bicycle racks should be installed on concrete or asphalt to ensure security/stability
When possible, racks should be in a covered area protected from the elements. Long-term parking should always be protected.
Generally, ‘U’ type racks bolted into the sidewalk are preferred and should be located intermittently or in front of key destinations. Bicycle racks should be installed to meet ADA standards and not block pedestrian through traffic. provides recommendations for placement of inverted U type racks.
Local jurisdictions may want to consider custom racks that can serve not only as Bicycle racks, but also public artwork, or as advertising for a specific business. Figure 2.15: Recommended Short-Term Bicycle Parking Facilities provides examples of various racks. The “post and ring” style rack is an attractive alternative to the standard inverted-U, which requires only a single mounting point and can be customized to have a city or region name or emblem stamped into the rings. These racks can also be easily retrofitted onto existing street posts, such as parking meter posts. While custom racks can add a decorative element and relate to a neighborhood theme, the rack function should not be overlooked: All racks should adhere to the basic functional requirement of supporting the bicycle by the frame (not only the wheel) and accepting a U-lock.
Figure 2.14: Recommended bicycle parking spacing
dimensions
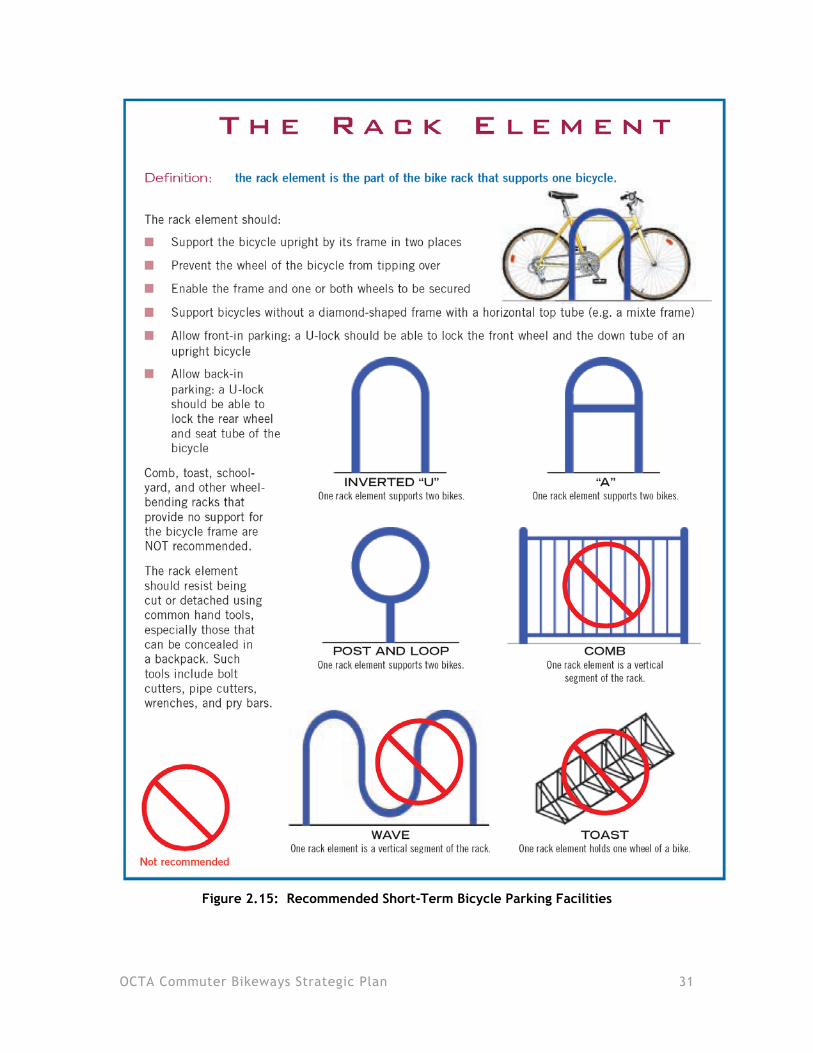
OCTA Commuter Bikeways Strategic Plan 31
Figure 2.15: Recommended Short-Term Bicycle Parking Facilities
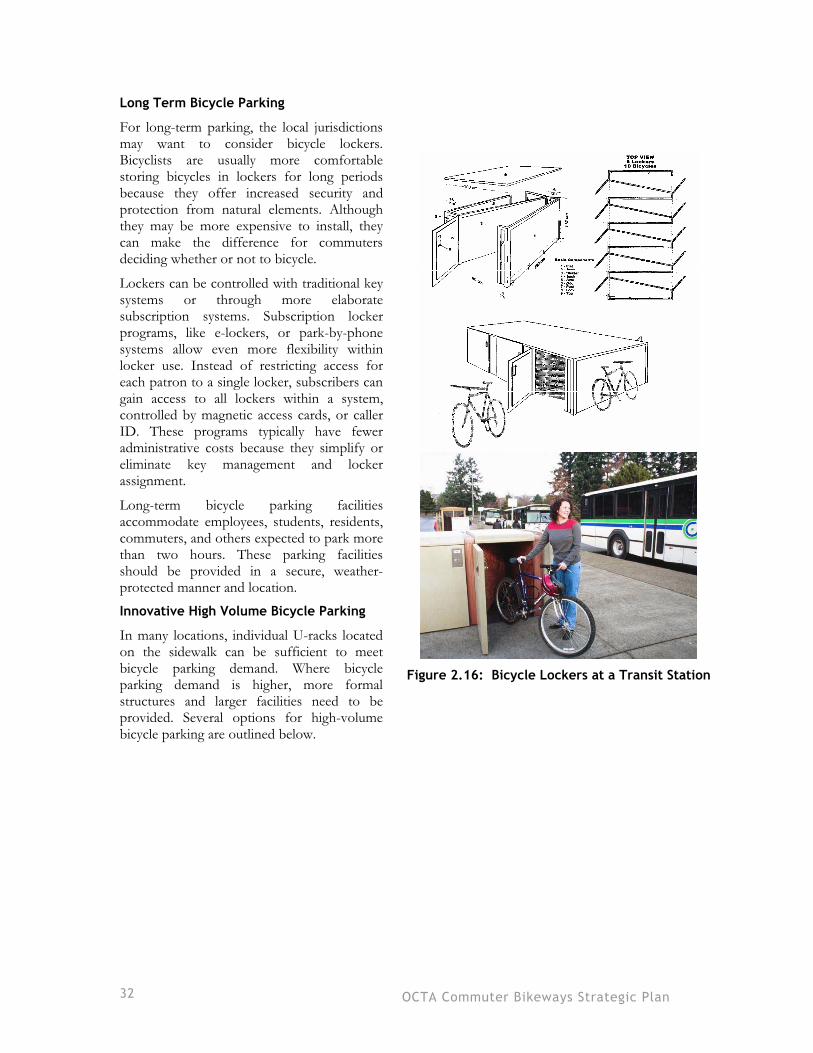
OCTA Commuter Bikeways Strategic Plan 32
Long Term Bicycle Parking
For long-term parking, the local jurisdictions may want to consider bicycle lockers. Bicyclists are usually more comfortable storing bicycles in lockers for long periods because they offer increased security and protection from natural elements. Although they may be more expensive to install, they can make the difference for commuters deciding whether or not to bicycle.
Lockers can be controlled with traditional key systems or through more elaborate subscription systems. Subscription locker programs, like e-lockers, or park-by-phone systems allow even more flexibility within locker use. Instead of restricting access for each patron to a single locker, subscribers can gain access to all lockers within a system, controlled by magnetic access cards, or caller ID. These programs typically have fewer administrative costs because they simplify or eliminate key management and locker assignment.
Long-term bicycle parking facilities accommodate employees, students, residents, commuters, and others expected to park more than two hours. These parking facilities should be provided in a secure, weather-protected manner and location.
Innovative High Volume Bicycle Parking
In many locations, individual U-racks located on the sidewalk can be sufficient to meet bicycle parking demand. Where bicycle parking demand is higher, more formal structures and larger facilities need to be provided. Several options for high-volume bicycle parking are outlined below.
Figure 2.16: Bicycle Lockers at a Transit Station
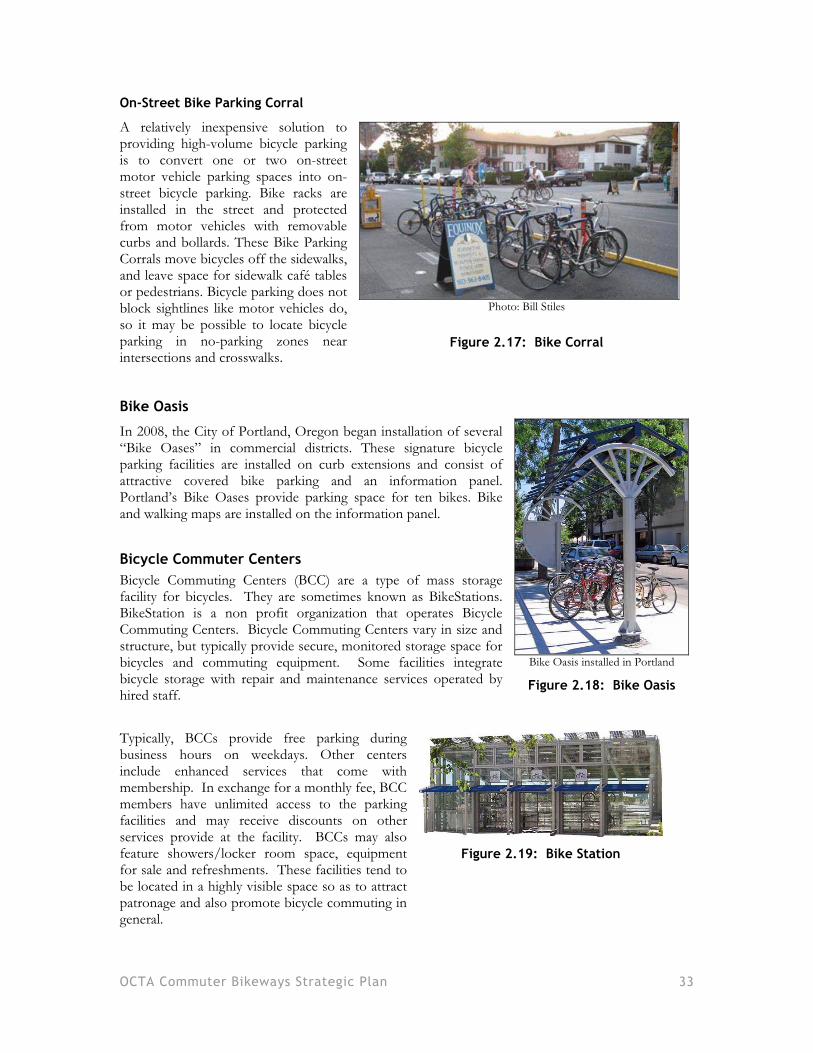
OCTA Commuter Bikeways Strategic Plan 33
On-Street Bike Parking Corral
A relatively inexpensive solution to providing high-volume bicycle parking is to convert one or two on-street motor vehicle parking spaces into on-street bicycle parking. Bike racks are installed in the street and protected from motor vehicles with removable curbs and bollards. These Bike Parking Corrals move bicycles off the sidewalks, and leave space for sidewalk café tables or pedestrians. Bicycle parking does not block sightlines like motor vehicles do, so it may be possible to locate bicycle parking in no-parking zones near intersections and crosswalks.
Bike Oasis
In 2008, the City of Portland, Oregon began installation of several “Bike Oases” in commercial districts. These signature bicycle parking facilities are installed on curb extensions and consist of attractive covered bike parking and an information panel. Portland’s Bike Oases provide parking space for ten bikes. Bike and walking maps are installed on the information panel.
Bicycle Commuter Centers Bicycle Commuting Centers (BCC) are a type of mass storage facility for bicycles. They are sometimes known as BikeStations. BikeStation is a non profit organization that operates Bicycle Commuting Centers. Bicycle Commuting Centers vary in size and structure, but typically provide secure, monitored storage space for bicycles and commuting equipment. Some facilities integrate bicycle storage with repair and maintenance services operated by hired staff.
Typically, BCCs provide free parking during business hours on weekdays. Other centers include enhanced services that come with membership. In exchange for a monthly fee, BCC members have unlimited access to the parking facilities and may receive discounts on other services provide at the facility. BCCs may also feature showers/locker room space, equipment for sale and refreshments. These facilities tend to be located in a highly visible space so as to attract patronage and also promote bicycle commuting in general.
Photo: Bill Stiles
Figure 2.17: Bike Corral
Bike Oasis installed in Portland
Figure 2.18: Bike Oasis
Figure 2.19: Bike Station
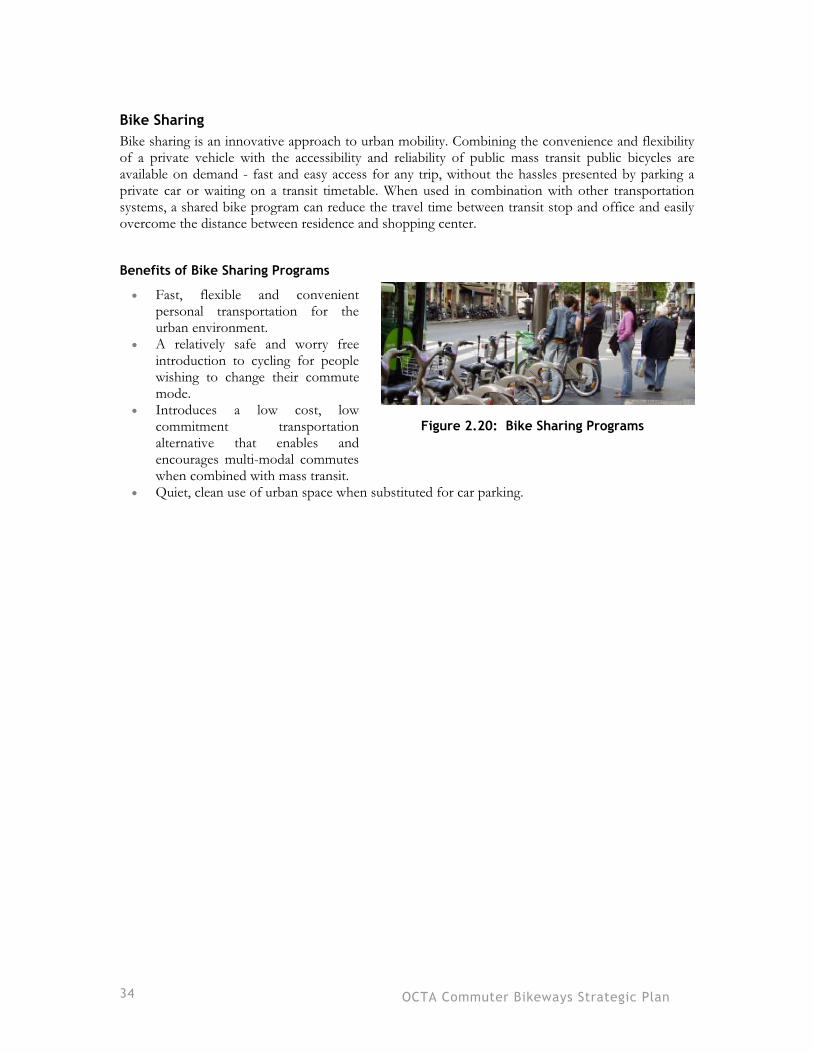
OCTA Commuter Bikeways Strategic Plan 34
Bike SharingBike sharing is an innovative approach to urban mobility. Combining the convenience and flexibility of a private vehicle with the accessibility and reliability of public mass transit public bicycles are available on demand - fast and easy access for any trip, without the hassles presented by parking a private car or waiting on a transit timetable. When used in combination with other transportation systems, a shared bike program can reduce the travel time between transit stop and office and easily overcome the distance between residence and shopping center.
Benefits of Bike Sharing Programs
� Fast, flexible and convenient personal transportation for the urban environment.
� A relatively safe and worry free introduction to cycling for people wishing to change their commute mode.
� Introduces a low cost, low commitment transportation alternative that enables and encourages multi-modal commutes when combined with mass transit.
� Quiet, clean use of urban space when substituted for car parking.
Velib- Bike Sharing Program in France
Figure 2.20: Bike Sharing Programs