2009 ibm x-force trend & risk report executive briefing
TRANSCRIPT
© 2009 IBM Corporation
2009 IBM X-Force® Trend & Risk Report Executive Briefing
Loïc GUEZO, IBM Security Services - [email protected]® - LA ISO/IEC 27001:2005

© 2010 IBM Corporation
Report Summary -- Attacks Continue Across all Secur ity Domains
�PDF-related vulnerabilities have far surpassed those affecting Office documents.�Vast majority of Web-based exploitation centered around Web exploit toolkits in contrast to purpose-built lone sources. �US continues as the top hoster of malicious Web links.
■6,601 new vulnerabilities were discovered in 2009, an 11% decrease over 2008, largely due to declines in SQL injection and Active X vulnerability disclosures.
■49% of all vulnerabilities are Web application vulnerabilities.
■52% of all vulnerabilities disclosed had no vendor-supplied patches available at the end of 2009.
■Majority of spam (80%) is still classified as URL spam—spam messages that include URLs that a person clicks to view the spam contents.
■ Amount of URL spam using well-known and trusted domain names continue to increase.
■60.9% of phishing is targeted at the finance industry, 20.4% targeted at government organizations.
■7.5 percent of the Internet is considered “socially” unacceptable, unwanted, or flat out malicious.
■New malicious Web links increased by 345% compared to 2008.

© 2010 IBM Corporation
Disappearance of Low Hanging Fruit:Vulnerability Disclosures & Exploitation Declines
■Declines in some of the largest categories of vulnerabilities.•Web applications continue to be the largest category of disclosure.•SQL Injection and File Include, have declined.•ActiveX controls which mostly impact client applications has also declined.
■Tuesdays continue to be the busiest day of the week for vulnerability disclosures.
■2009 vulnerability disclosures by severity had no significant changes from 2008 percentages.
Image vide5
© 2010 IBM Corporation
The Economics of Attacker Exploitation
■Economics continue to play heavily into the exploitation probability of a vulnerability
■Web Browser and Document Reader vulnerabilities are very profitable and easily executable
■Economics continue to play heavily into the exploitation probability of a vulnerability.
■Web Browser and Document Reader vulnerabilities are very profitable and easily executable.
Image vide6

© 2010 IBM Corporation
Image vide7
Apple, Sun and Microsoft Top Vendor List for Disclo sures■Top ten vendors account for nearly a quarter (23%) of all disclosed vulnerabilities, up from 19% in 2008.
■Significant changes to the Top Ten List including:•Microsoft dropped from #1 to #3 after holding top spot since 2006.•Adobe makes it's debut on the top ten list at number nine.
In 2009, web application vendors are not on the top ten list because we now only count vulnerabilities in the base platform. We are not including plug ins associated with Web application platform vulnerabilities because they are often not produced by the vendor themselves.

© 2010 IBM Corporation
Patches Still Unavailable for Over Half of Vulnerab ilities
■Over half (52%) of all vulnerabilities disclosed in 2009 had no vendor-supplied patches to remedy the vulnerability.
•45% of vulnerabilities from 2006, 43% from 2007 and 50% from 2008 still have no patches available at the end of 2009.
Image vide10
© 2010 IBM Corporation
Remotely Exploitable Vulnerabilities On The Rise
■In the past four years, remotely exploitable vulnerabilities have grown from 85% to 92% of all vulnerability disclosures.•These vulnerabilities are significant because they can be executed without physical access to a vulnerable system.
Image vide11

© 2010 IBM Corporation
Most Vulnerable Operating Systems
■In the second half of 2009, the number of new vulnerabilities for Linux and Microsoft took a sharp turn upwards while Sun Solaris drastically declined.
■BSD is in the number five slot, replacing IBM AIX who was fifth in 2008.
■For critical and high vulnerabilities, Microsoft takes first place. Apple is in second place.
Image vide12
Image vide13
© 2010 IBM Corporation
Image vide14
2009 Attacker Motivation is to Gain Access and Manipulate Data
■“Gain access” remains the primary consequence of vulnerability exploitation.•Approaching the 50% mark that was previously seen throughout 2006 and 2007.
■“Data Manipulation” took a plunge but still higher in comparison to 2006 and 2007.
■“Bypass Security” and “Denial of Service” is increasing.
© 2010 IBM Corporation
Image vide15
Web App Vulnerabilities Continue to Dominate
■49% of all vulnerabilities are Web application vulnerabilities. ■Cross-Site Scripting disclosures surpassed SQL injection to take the top spot.
■67% of web application vulnerabilities had no patch available at the end of 2009.
Image vide16
© 2010 IBM Corporation
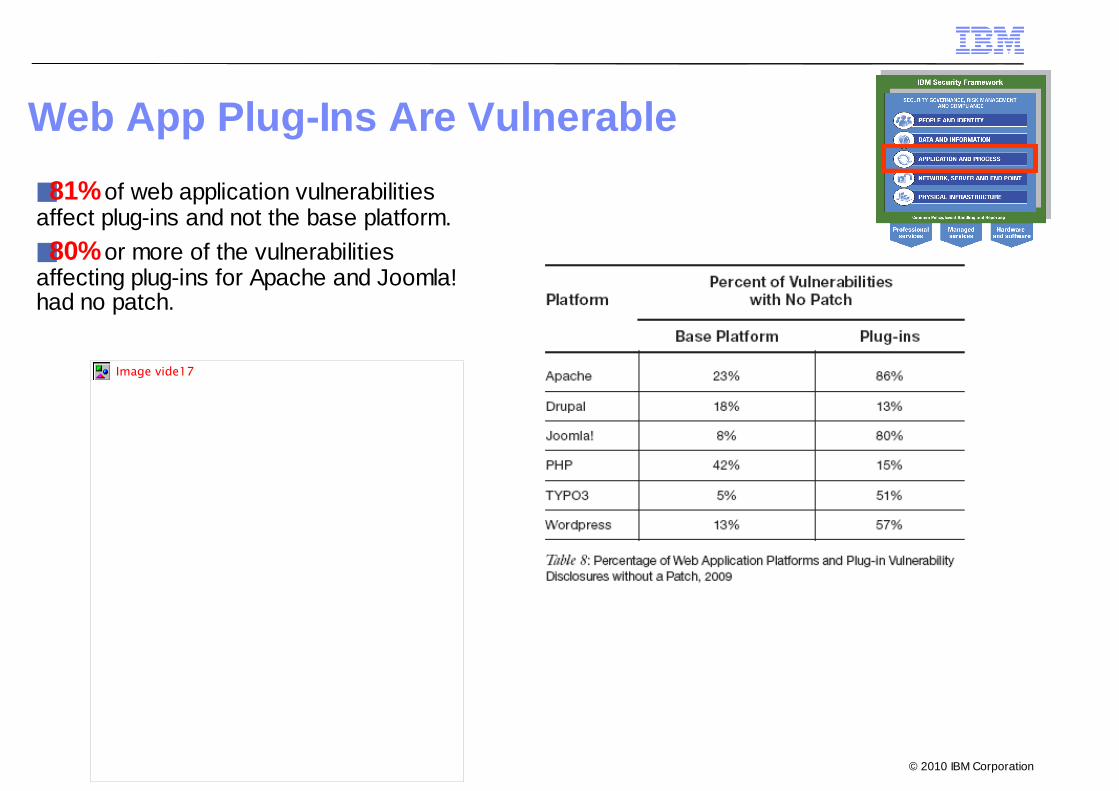
Web App Plug-Ins Are Vulnerable
■81% of web application vulnerabilities affect plug-ins and not the base platform.
■80% or more of the vulnerabilities affecting plug-ins for Apache and Joomla! had no patch.
Image vide17

© 2010 IBM Corporation
Image vide19
Real World Conclusions from Web App Assessments■Cross-Site Request Forgery (CRSF) vulnerabilities increased from 22% in 2007 to 59% in 2009.
■SQL Injection vulnerabilities dropped from 33% in 2007 to 18% in 2009.
■Cross-Site Scripting (XSS) vulnerabilities dropped from 83% in 2007 to 64% in 2009. ■Inadequate Input control is the most prevalent developer-related issue, and the likelihood of finding it in 2009 is almost 70%.
Image vide20
© 2010 IBM Corporation
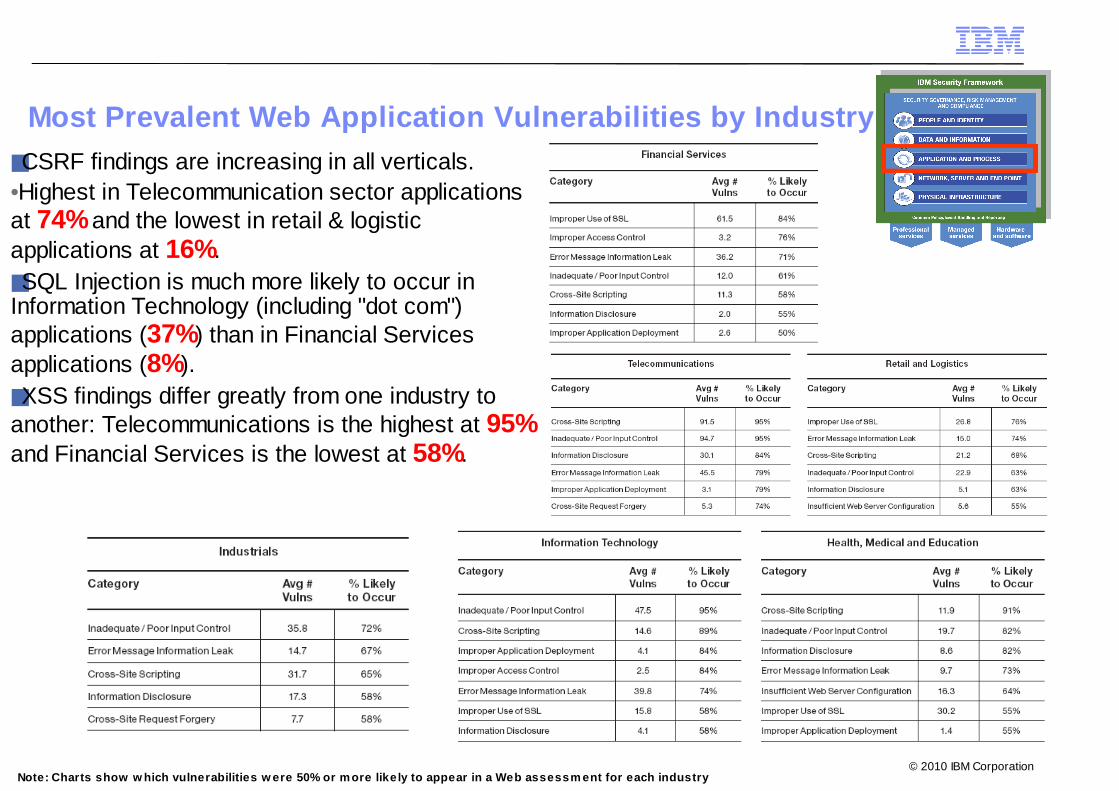
Most Prevalent Web Application Vulnerabilities by I ndustry
■CSRF findings are increasing in all verticals. •Highest in Telecommunication sector applications at 74% and the lowest in retail & logistic applications at 16%.■SQL Injection is much more likely to occur in Information Technology (including "dot com") applications (37%) than in Financial Services applications (8%).
■XSS findings differ greatly from one industry to another: Telecommunications is the highest at 95% and Financial Services is the lowest at 58%.
Note: Charts show w hich vulnerabilities w ere 50% or more like ly to appear in a Web assessm ent for each industry

© 2010 IBM Corporation
Client-Side Vulnerabilities: Document and Multimedia Vulnerabilities are on the Rise
■Largest number of client-side vulnerabilities in 2009 affects Web browsers and their plug-ins.
■Document Reader and Multimedia vulnerabilities surpass OS vulnerabilities in 2009.
Image vide25
Image vide26

© 2010 IBM Corporation
Vulnerabilities in Document Readers Skyrocket
■Portable Document Format (PDF) vulnerabilities dominate in 2009.
■Microsoft Office document disclosures are on the decline while Adobe disclosures continue to rise.
Image vide27Image vide28

© 2010 IBM Corporation
Attackers Turn to Adobe Products to Launch Exploits
■Four of the top five web based exploits are related to Adobe products.
■Core browser vulnerabiities have taken a back seat to malicious PDFs and ActiveX vulnerabilities.
Image vide30

© 2010 IBM Corporation
“Bad” Web Content Tries to Evade Filters
■7.5% of the Internet contains unwanted content such as pornographic or criminal Web sites.
■Anonymous proxies, which hide a target URL from a Web filter, have steadily increased to more than triple in number since 2007.
Image vide31
Image vide32

© 2010 IBM Corporation
Image vide33
Suspicious Web Pages and Files are on the Rise
■The level of obfuscation found in Web exploits continues to rise.
■Exploit toolkit packages have started to include both malicious Adobe Flash and PDF files.
■Adobe PDF files saw increases in obfuscation complexity throughout 2009.
Image vide34

© 2010 IBM Corporation
Malicious Web Links Increase by 345%
■United States and China continue to reign as the top hosting countries for malicious links.
■Many more second tier countries are jumping into this game.
•Countries hosting at least one malicious link nearly doubled from 2008 to 2009
Image vide35
Image vide36

© 2010 IBM Corporation
Websites Hosting Bad Links
■Since the 1st half of 2009, Professional “bad” Web sites like pornography, gambling, or illegal drugs Web sites have increased their links to malware.
■Blogs and bulletin boards have also seen increases in malware links.
Image vide37 Image vide38

© 2010 IBM Corporation
Socially Engineered Malware on the Rise
■Social networks represent a vehicle for malware authors to distribute their programs in ways that are not easily blocked. Examples include:•Antivirus 2009, which lures users into downloading a fake AV product.•The Koobface Worm which infiltrated Facebook, Myspace, and other social networking sites.•The Jahlav Trojan which used Twitter to infect Mac users.
■These types of attacks are ongoing and increasing in intensity.
■Another upward trend is the use of software toolkits to deliver malware.

© 2010 IBM Corporation
Image vide42
Spam Continues to Change to Avoid Detection■80% of spam is classified as URL spam.
■Spammers continue to use “trusted” domains and “legitimate links” in spam messages to avoid anti-spam technologies.
■Brazil, the U.S., and India account for about 30 percent of worldwide spam in 2009.•In the second half of 2009, Vietnam appears in second place of spam-sending countries.

© 2010 IBM Corporation
HTML Spam Recovers
■Spam volume increased through 2009.
■Image-based spam declined in the second half of 2009 and HTML-based spam recovered.
Image vide46
Image vide47

© 2010 IBM Corporation
Phishing Attacks Increase Dramatically■Contrary to the 1st half of 2009, phishers came back with a vengance in the 2nd half of 2009.
■Country of Origin also changed dramatically:•Spain and Italy took top slots in 2008, but both have completely dropped from the top ten for 2009.•The top sender is Brazil, runner-up is the USA and third place goes to Russia, who was not even in the top ten last year.
■Top subject lines are back•Top 10 subject lines represent more than 38% of all phishing e-mails.•In 2008 the top subject lines made up only 6.23%.
Image vide49

© 2010 IBM Corporation
Image vide51
Phishing Targets Financial & Government Organizations
■60.9% of phishing is targeted at the financial industry vs. 90% in 2008.
■Over 95% of all financial phishing targets in 2009 are located in North America.
•During the 4th quarter of 2009, 0.3% of all financial phishing emails were targeted to Australia or New Zealand, making them bigger targets than all of Europe (0.2%).
■20.4% of phishing emails were targeted at government organizations.Image vide52 Image vide53

© 2010 IBM Corporation
X-Force Trend ReportsThe IBM X-Force Trend & Risk Reports provide statistical information about all
aspects of threats that affect Internet security. Find out more at http://www-935.ibm.com/services/us/iss/xforce/trendreports/
X-Force Security Alerts and AdvisoriesOnly IBM X-Force can deliver preemptive security due to our unwavering
commitment to research and development and 24/7 global attack monitoring. Find out more at http://xforce.iss.net/
X-Force Blogs and FeedsFor a real-time update of Alerts, Advisories, and other security issues,
subscribe to the X-Force RSS feeds. You can subscribe to the X-Force alerts and advisories feed at http://iss.net/rss.php or the Frequency X
Blog at http://blogs.iss.net/rss.php
For More IBM X-Force Security Leadership