2006 ncaa substance use report - eric · 2 the national collegiate athletic association p.o. box...
TRANSCRIPT

NCAA Study ofSubstance Use of College Student-Athletes
SU
BS
TAN
CE
US
E
NCAA 54814-3/06 SU 06

2
THE NATIONAL COLLEGIATE ATHLETIC ASSOCIATIONP.O. Box 6222
Indianapolis, Indiana 46206-6222317/917-6222www.ncaa.org
Prepared By: Denise M. DeHass, Associate Director of Research.
NCAA, NCAA seal, NCAA logo and NATIONAL COLLEGIATE ATHLETIC
ASSOCIATION are registered marks of the Association, and use in anymanner is prohibited unless prior approval is obtained from the Association.
©2006 by the National Collegiate Athletic Association

3
Table of ContentsPage
Executive Summary ..................................................................................................................5
Introduction ..............................................................................................................................8
Methods ....................................................................................................................................9
Sampling ..............................................................................................................................9
Survey Administration ........................................................................................................9
Questionnaire ......................................................................................................................9
Subjects ............................................................................................................................11
Analysis ..............................................................................................................................11
Results ....................................................................................................................................12
Conclusions ............................................................................................................................13
Tables and FiguresTables
1. Demographic Characteristics of the Sample ..........................................................18
2. Ergogenic Drug Use by NCAA Division ....................................................................22
3. Social Drug Use by NCAA Division............................................................................22
4. Ergogenic Drug Use by Ethnic Group ......................................................................23
5. Social Drug Use by Ethnic Group ..............................................................................23
6. Ergogenic Drug Use in Men's Sports ........................................................................24
7. Ergogenic Drug Use in Women's Sports ..................................................................24
8. Social Drug Use in Men's Sports ..............................................................................25
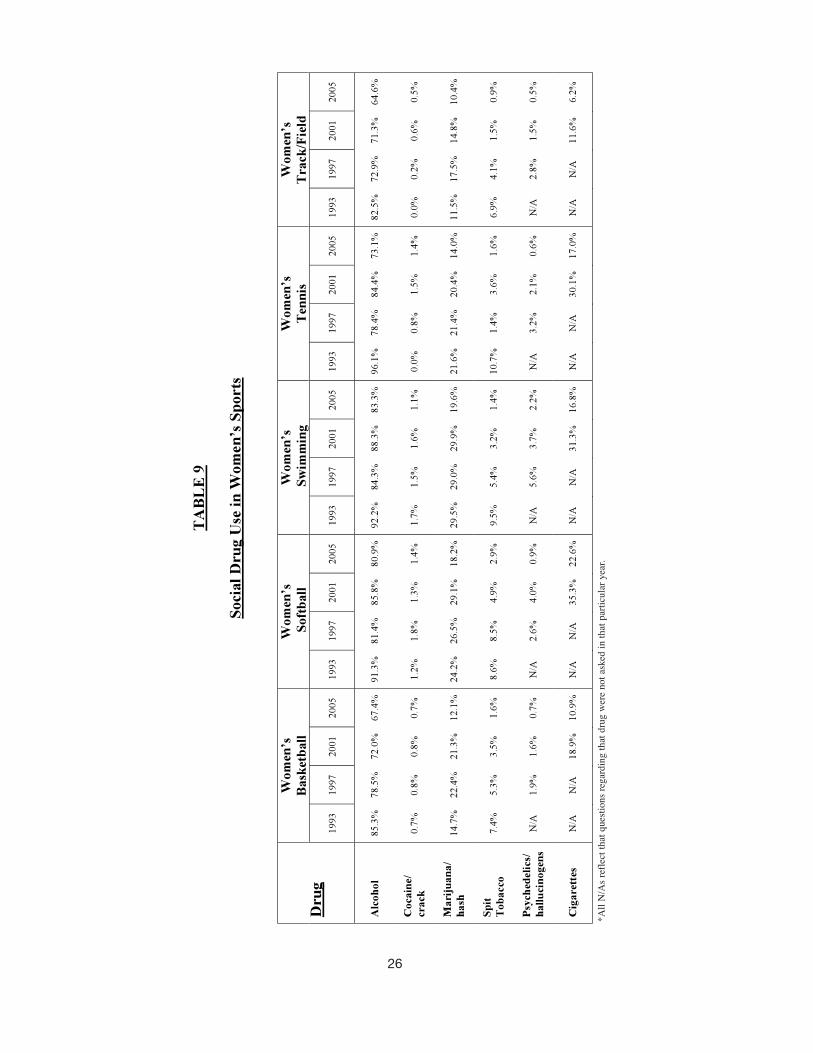
9. Social Drug Use in Women's Sports..........................................................................26
10a. Ergogenic Drug Use in Other Men's Sports ............................................................27
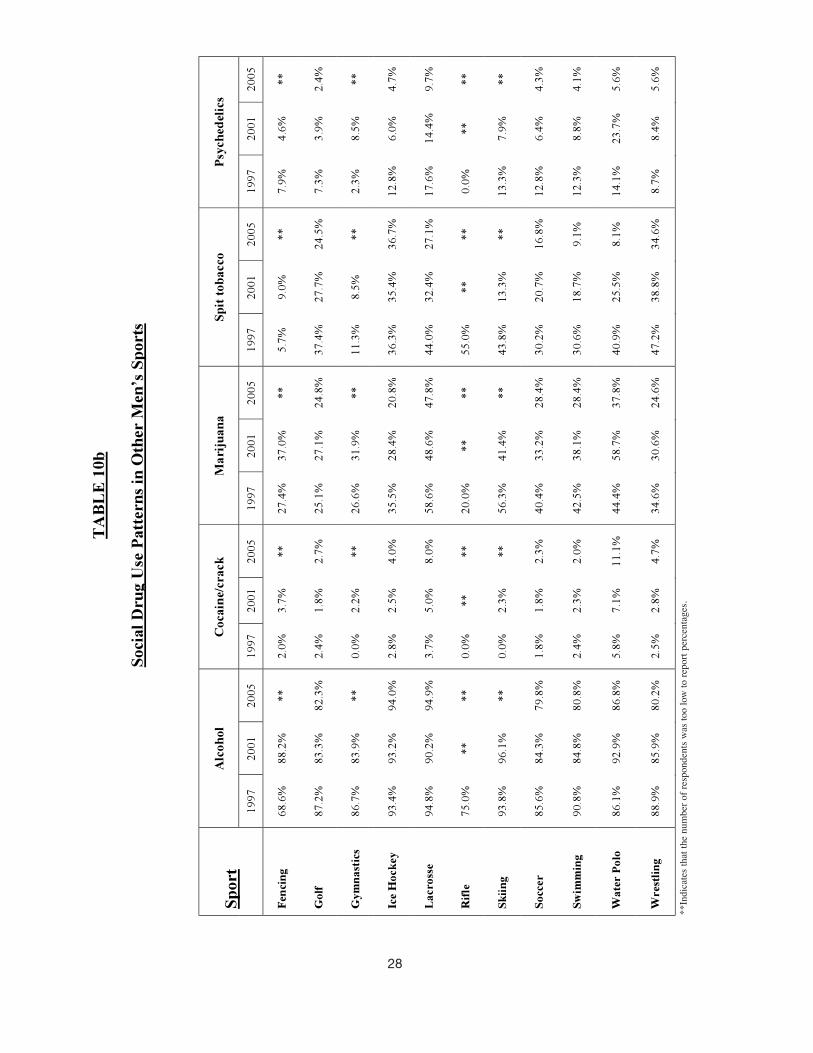
10b. Social Drug Use in Other Men's Sports ....................................................................28
11a. Ergogenic Drug Use in Other Women's Sports ........................................................29
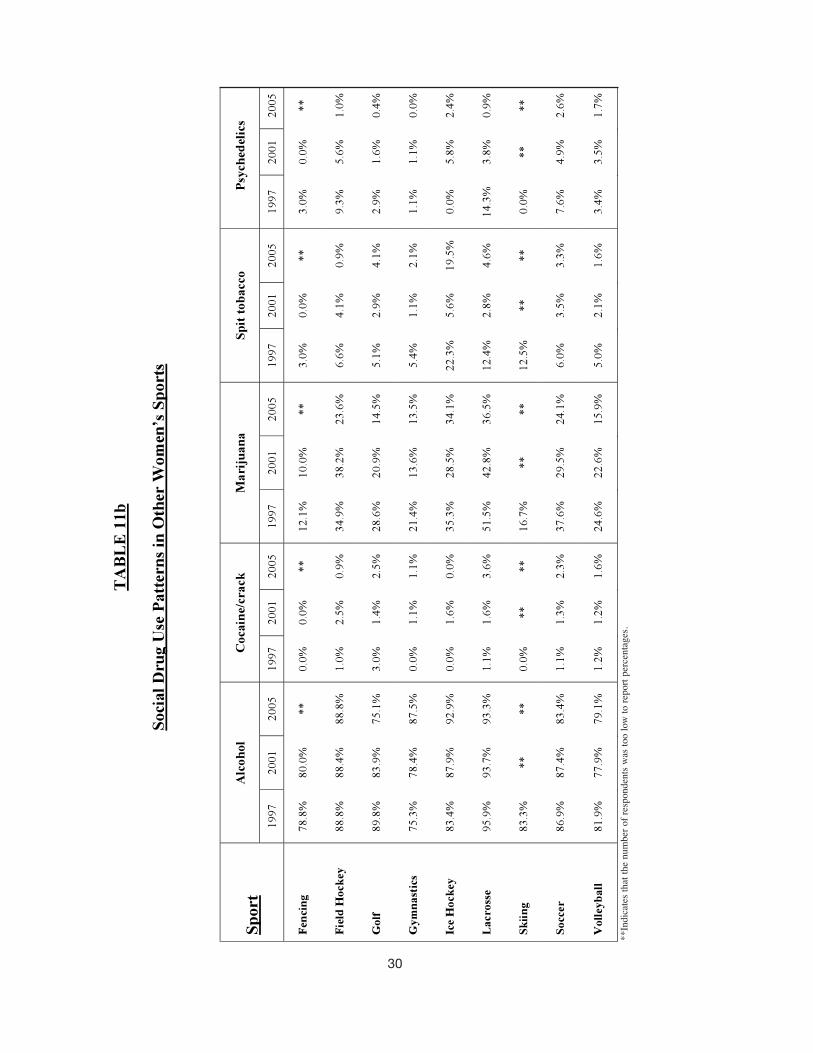
11b. Social Drug Use in Other Women's Sports ..............................................................30
12. Frequency of Spit Tobacco Use ................................................................................31
13a. Frequency of Cigarette Use ......................................................................................31
13b. Amount of Cigarette Use ............................................................................................32
14. Initial Use of Ergogenic Drugs ....................................................................................32
15. Initial Use of Social Drugs ..........................................................................................33
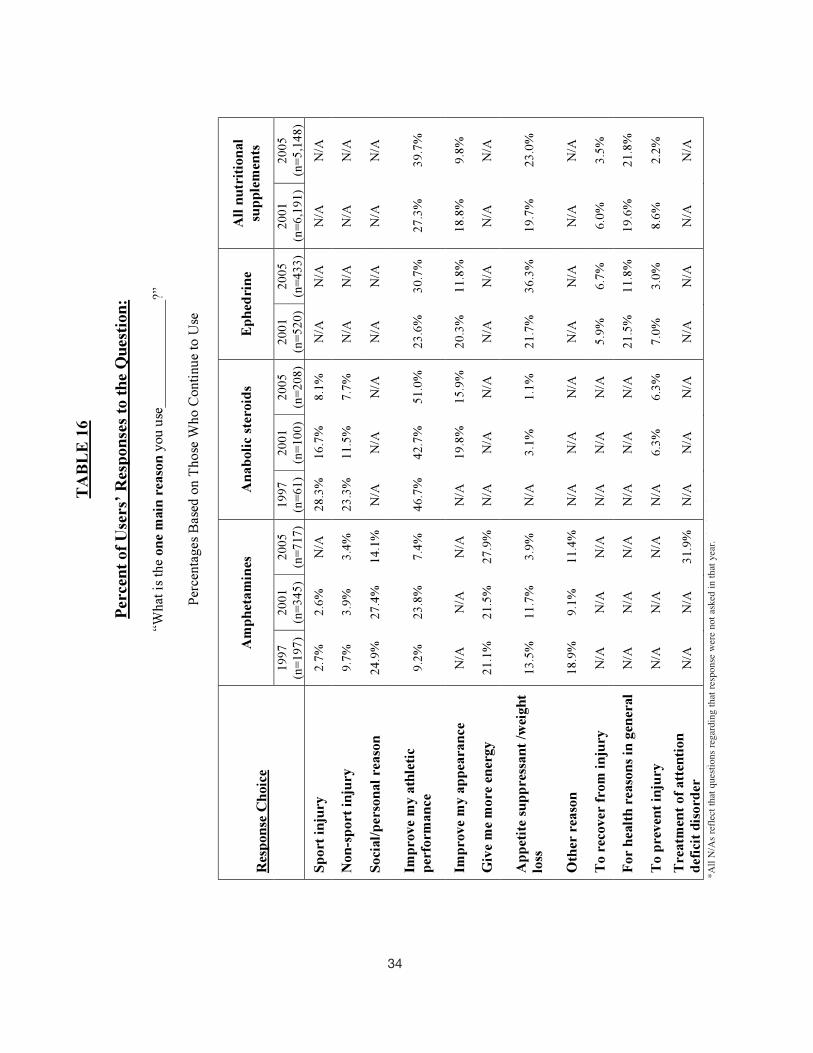
16. Main Reason to Use Ergogenic Drugs ......................................................................34

4
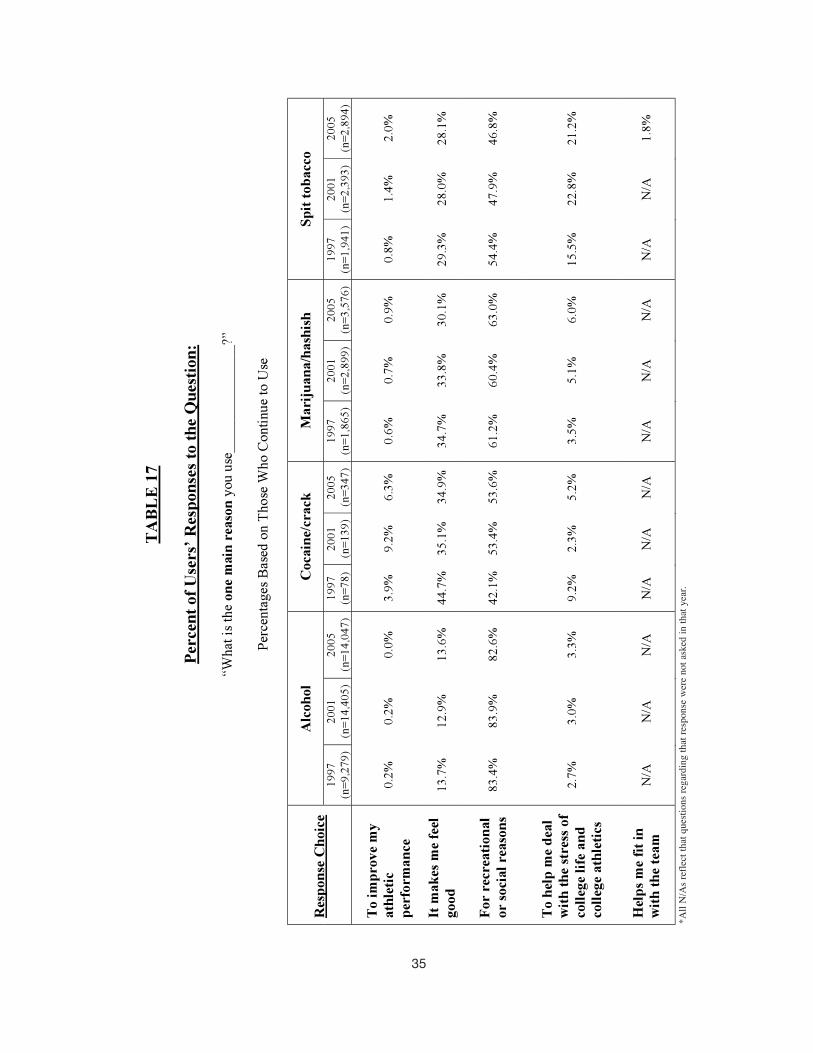
17. Main Reason to Use Social Drugs ............................................................................35
18. Reasons to Not Use Ergogenic Drugs ......................................................................36
19. Reasons to Not Use Social Drugs ............................................................................37
20. Sources of Ergogenic Drugs ......................................................................................38
21. Sources of Social Drugs ............................................................................................38
Figures
1a. Patterns of Ergogenic Drug Use ................................................................................19
1b. Patterns of Alcohol Use ..............................................................................................20
1c. Patterns of Marijuana Use ..........................................................................................20
1d. Patterns of Spit Tobacco Use ....................................................................................21
1e. Patterns of Cocaine Use ............................................................................................21
Questionnaire with Overall Results ......................................................................................39

5
This study is the sixth in a series conducted for or bythe NCAA to measure the substance-use patterns ofNCAA college student-athletes. The initial NationalStudy of the Substance Use and Abuse Habits ofCollege Student-Athletes was presented in 1985.Subsequent studies, now known as the Study ofSubstance Use of College Student-Athletes, havebeen conducted at four-year intervals.
For the 1997 replication, several changes were madein the survey methodology. However, this study ismeant to build on analyses conducted in the previouswork. Specifically, the sampling base was broadenedso that student-athletes in all NCAA sports would besurveyed, and all NCAA institutions were included inthe sample. These were significant changes from theprevious studies, when all student-athletes in 10sports at only 11 selected NCAA member institutionswere surveyed. Nevertheless, since both samplingplans were designed to represent the entirety of thestudent-athlete population and the survey questionswere similar, if not exactly the same, comparisonsacross studies are appropriate.
The other major difference between the current repli-cations (1997, 2001 and 2005) and the previous stud-ies was the way in which the surveys were adminis-tered. In the past, the researchers traveled to the 11institutions in the sample and administered the sur-veys in person. In more recent studies, the surveyswere sent to the faculty athletics representative (FAR)on campus. The FAR was given explicit instructionsregarding administration of the survey instrument. Itis important to keep these differences in mind whencomparing the data to those from studies done before1997.
The sampling plan was designed to require surveyresponses from 12 percent of the student-athletes in allNCAA championship sports at all NCAA divisions.All NCAA member institutions were asked to give thesurvey instrument to at least one of their athleticsteams. These teams were identified by the NCAA in
accordance with the sampling plan. The surveys weresent to the institutional FAR who administered thesurvey at the institution. Provisions were made so thatthe student-athletes would be assured of confidential-ity in the process. A total of 19,676 usable responseswere received by the NCAA. Once received, the sur-vey data were cleaned and analyzed by the NCAAresearch staff. The results from the descriptive analy-sis include data back to the 1989 study and led to thefollowing findings from the study:
FINDINGS ABOUT ERGOGENIC DRUG USEFinding 1: Among the entire group of student-ath-
letes, the use of amphetamines has con-tinually increased since 1997. The use ofephedrine, first calculated in 1997, hasremained stable. Anabolic steroid use hasdecreased slightly from 2001.
Finding 2: Analysis by division indicates thatamphetamine use has increased across alldivisions with use highest in Division III.Conversely, anabolic steroid use hasdecreased in all three divisions.Ephedrine use decreased in Division II,but was relatively stable in the other twodivisions.
FINDINGS ABOUT SOCIAL DRUG USEFinding 3: Among the entire group of student-ath-
letes, the use of alcohol has decreaseddramatically, while spit tobacco and mar-ijuana use are also at the lowest levelssince the study began. Reported use ofcocaine is up just slightly from 2001.
Finding 4: Analysis by division indicates that theusage of alcohol, psychedelics, marijua-na and cigarettes seem to be down in alldivisions. Spit tobacco is down in alldivisions, but more so in Divisions II andIII. Cocaine usage is up slightly in alldivisions since 2001. Further, Division
Executive Summary

6
III continues to report the highest rates ofsocial drug use of all three divisions, withthe exception of spit tobacco usage,which is slightly higher in Division II for2005.
FINDINGS ABOUT USAGE WITHIN ETHNIC AND SPORT GROUPSFinding 5: Amphetamine use continued an upward
trend for both Whites and African-Americans. However, African-Amer-icans still report the lowest rates of drugusage for amphetamines and all socialdrugs. Anabolic steroid use was reportedat an all-time lowest level for Whites andwas used by African-Americans and oth-ers at a slightly higher rate. Ephedrineuse has decreased within all ethnicgroups reported.
Finding 6: Amphetamine use has increased in allmen's sports except basketball, footballand swimming. Tennis, gymnastics, soc-cer and volleyball were the only sportsfor women that did not report increasedamphetamine use. Anabolic steroid use isdown for men and women with theexception of men's swimming and waterpolo and women's ice hockey. Socialdrug use generally decreased for bothmen and women, but more consistentlyso across women's sports.
FINDINGS ABOUT FREQUENCY AND INITIAL USE OF DRUGSFinding 7: The vast majority of student-athletes who
reported using marijuana during the pre-vious 12 months used it only one or twotimes or “occasionally,” a decrease fromthe previous report. The number ofrespondents who reported smoking morethan two marijuana cigarettes alsodecreased significantly from 2001.
Finding 8: More than 85 percent of student-athleteswho reported using alcohol in the lastyear say they did so an average of two orfewer times per week, an increase from2001. While the number of student-ath-
letes using alcohol decreased from 2001,the number of student-athletes drinkingmore than five drinks in a sitting in-creased significantly.
Finding 9: A similar trend to the alcohol use wasreported in cigarette use. The number ofdaily users decreased dramatically withmany more student-athletes reportingthat they only smoke at social occasions.However, there was an increase amongsmokers in those who smoke a pack ormore a day.
Finding 10:The percent of student-athletes usingergogenic drugs during high school orbefore increased significantly. More thantwo-thirds of amphetamine, ephedrineand nutritional supplement use nowappears to start before college. More thanhalf of anabolic steroid use begins in highschool as well.
Finding 11: Reversing a previous trend, more thanhalf of the cocaine users indicated havingfirst tried cocaine in high school orbefore. The percent of student-athletestrying alcohol, marijuana or cigarettes injunior high or before also increased.
FINDINGS ABOUT WHY STUDENT-ATHLETES USE DRUGSFinding 12:More than half of the users of anabolic
steroids say they use them to improveathletic performance. Continuing a trendfrom 2001, the number of student-ath-letes using anabolic steroids for the treat-ment of an injury continued to decrease.The number of users now stating they useanabolic steroids to improve appearancedecreased from 2001.
Finding 13:Use of amphetamines to improve athleticperformance appears to be down signifi-cantly from the 2001 study. The mainreason stated for using amphetamines isfor the treatment of attention deficit dis-order followed by using to get more ener-gy. The top two reasons stated for using

7
ephedrine reversed order in 2005 toweight loss, followed by to improve ath-letic performance.
Finding 14:Alcohol, cocaine, marijuana and spittobacco users are most likely to use forrecreational or social reasons. Marijuana,cocaine and spit tobacco users also statedthat they use to make them feel good.Spit tobacco users also cite use to helpdeal with the stress of college life andcollege athletics. Very few state they usesocial drugs to improve athletic perform-ance.
FINDINGS ABOUT WHY STUDENT-ATHLETES DO NOT USE DRUGSFinding 15:The majority of student-athletes who
choose not to use ergogenic or socialdrugs are reporting concerns abouthealth, they do not desire to experiencethe effects and that the idea of usingdrugs is against their beliefs.
Finding 16:A main reason given by student-athletesto not use nutritional supplements andspit tobacco is that they do not like it andanother top reason given for not usingalcohol was that it hurt athletic perform-ance.
FINDINGS ABOUT SOURCES OF DRUGSFOR STUDENT-ATHLETESFinding 17:The main source for student-athletes who
continue to use amphetamines or anabol-ic steroids is a friend or relative followedby another physician for amphetamineusers and Web site or mail order for ana-bolic steroid users. Nutritional supple-ments are mainly purchased in a retailstore.
Finding 18:The primary source for student-athleteswho continue to use either cocaine, mar-ijuana or psychedelics continues to be afriend or relative.
FINDINGS ABOUT STUDENT-ATHLETES'OVERALL PERCEPTION OF DRUG USE Finding 19:Almost 60 percent of student-athletes
continue to believe that their use of alco-holic beverages has no effect on athleticperformance or on their general health.
Finding 20:Almost 30 percent of student-athletesstated that one or more times they per-formed poorly in practice or a game dueto drinking or drug use.
FINDINGS ABOUT ATTITUDES TOWARDDRUG TESTINGFinding 21:The number of respondents who believe
that the NCAA and their institutionsshould drug test student-athletes in-creased from 2001, with nearly two-thirds believing that the NCAA shoulddrug test student-athletes. The number ofrespondents believing that drug testingby the NCAA and the institutions hasdeterred college athletes from usingdrugs also increased.
Finding 22:There continues to be a split among stu-dent-athletes surveyed who believe thatimposing team penalties for individualpositive tests would be fair and appropri-ate.
FINDINGS ABOUT HAZING AND ALCOHOL USEFinding 23:Less than 10 percent of the respondents
reported any involvement in hazing with-in college sports. Men were more likelythan women to be the victim of hazing intheir college sports program and to hazeothers in the program.
Finding 24:For those student-athletes who had beeninvolved in a hazing incident, approxi-mately 50 percent said that alcohol hadbeen involved. Women were more than10 percent more likely to say that alcoholhad been involved in the hazing.

8
IntroductionThis study is the sixth in a series conducted for orby the NCAA to measure the substance-use pat-terns of NCAA college student-athletes. The ini-tial National Study of the Substance Use andAbuse Habits of College Student-Athletes waspresented in 1985. That study and the two subse-quent replications, now known as the Study ofSubstance Use of College Student-Athletes, wereconducted for the NCAA by researchers atMichigan State University. The 1997 and 2001studies were conducted by the NCAA researchstaff with the assistance of Dr. Percy Bates fromthe University of Michigan. The current study wasconducted solely by the NCAA research staff.
This study, while not a direct replication of theprevious work, is meant to build on the analysis oftrends in the five previous studies. Thus, data arepresented that compare results from this study toresults from the past work. Such comparisons arepossible due to the fact that many questions fromthe previous surveys were retained in thisresearch. The sampling procedures that were usedbeginning in 1997, however, were much differentthan they had been in the previous studies.Specifically, the previous studies sampled athleteson 10 specific sports teams at 11 NCAA memberinstitutions. Each institution involved requestedsurvey responses from all members of all 10requested teams. The same 10 sports teams weresampled at each institution. The more recent stud-ies, on the other hand, requested data on one ormore sport teams from every NCAA memberinstitution. The sampling was designed so that atleast 12 percent of institutions sponsoring a given
sport in a given NCAA division would be asked toprovide data for that particular team. Thus, teamsin all NCAA championship sports were sampledin the three most recent replications. The othermajor difference between the current replications(1997, 2001, and 2005) and the previous studieswas the way in which the surveys were adminis-tered. In the past, the researchers traveled to the 11institutions in the sample and administered thesurvey in person. In the last three studies, the sur-veys were sent to the faculty athletics representa-tive (FAR) on campus and they were given explic-it instructions regarding administration of theinstrument. It is important to keep these differ-ences in mind when comparing the 2005 data tothose from previous studies.
Even with the sampling and survey administrationdifferences described above, the data from 1997forward should be able to be compared with priordata as both sampling structures were designed toprovide a random sample from the overall student-athlete population at NCAA member institutions. The results of this study will provide NCAA poli-cy makers with data related to current levels ofdrug and alcohol use by student-athletes, and howthose levels have changed over time. These datawill also provide information regarding why stu-dent-athletes do or do not use specific substances,where they obtain illegal drugs, when they startedto use drugs and attitudes regarding differentdrugs. In addition, the data provide insight aboutstudent-athletes' attitudes regarding drug testing.New to the 2005 survey are questions regardingstudent-athletes' participation in hazing and theinvolvement of alcohol in that hazing.
Introduction
9
SamplingAs stated above, a sampling plan was designed sothat at least 12 percent of the NCAA memberinstitutions that sponsor a given sport would beasked to survey their athletes in that sport. Thesampling plan was also designed so that no singleinstitution would be asked to give the survey tomore than three of its athletics teams. This sam-pling plan was devised to achieve a better repre-sentation of all NCAA student-athletes. It also hadthe benefit of surveying student-athletes in allNCAA championship sports, as opposed to aselection of 10.
After the sampling plan was devised, Dr. StevenM. Boker, University of Notre Dame, created acomputer program that sampled the institutions atrandom and assigned one to three sports to eachNCAA member institution. In the end, 1,032member institutions and 1,985 teams wererequested to participate in the study. From thatgroup 19,676 usable survey forms were returnedto the NCAA. In contrast to previous years, spe-cific institutions returning surveys were not iden-tified to better assure respondent anonymity.Therefore, institutional response rates cannot becalculated. However, based on the total number ofsurveys returned, we estimate approximately a 70percent institutional response rate.
Survey AdministrationOnce institutions were identified and sports wereassigned, a letter was sent to the FAR at eachmember institution. The letter asked for the FAR'scooperation in conducting the survey and identi-fied the athletics teams that the institution wasbeing asked to survey. Detailed instructions forconduct of the survey administration were provid-ed to the FAR. These instructions, and the instruc-tions that were printed on the survey form, madeit clear to the student-athletes that cooperation in
this study was completely voluntary and that allresponses would be completely anonymous. TheFAR was instructed to give the survey to all mem-bers of a particular team on the same occasion.The FAR was provided with a pre-addressed, pre-paid envelope in which student-athletes were todeposit surveys upon completion. Then, the laststudent-athlete to complete the survey was askedto seal the envelope and see that it was ready tosend to the NCAA. No reference to any particularindividual or institution was to be printed eitherinside or outside the return envelope. It was hopedthat these procedures would reassure student-ath-letes that the process would be secure and that allresponses would remain anonymous. Even withthese measures to ensure anonymity, self-reportdata of this kind can be problematic due to thesensitive nature of the issues. Therefore, absolutelevels of use might be underestimated in a studysuch as this. However, broad trends in use patternsacross years and among types of drugs can beattended to with more confidence as to their valid-ity.
QuestionnaireThe questionnaire itself was modeled on the onethat had been used in the five previous studies,most specifically the 2001 study. The list of 11 spe-cific drugs that were included in the survey wassomewhat different from that used in prior workand sections were included for the first time onephedrine and ecstasy. In all, there were 13 sectionsto this survey. First, an overview of demographicquestions was asked as well as some questionsrelated to drug testing. The 13 sections asked forresponses related to the following issues:
1. Demographic information and attitudes aboutdrug use among student-athletes.
2. Specific questions related to anabolic steroiduse.
Methods

10
3. Specific questions related to ephedrine use.
4. Specific questions related to nutritional sup-plement use.
5. Specific questions related to spit tobacco use.
6. Specific questions related to cigarette use.
7. Specific questions related to alcohol use.
8. Specific questions related to amphetamine use.
9. Specific questions related to marijuana use.
10. Specific questions related to ecstasy use.
11. Specific questions related to psychedelics/hal-lucinogen use.
12. Specific questions related to cocaine use.
13. The effects of drug use among teammates andself and participation in hazing
In the 2001 survey, there was one question regard-ing ecstasy use in the last 12 months that was
asked under the section for psychedelics/hallu-cinogen use. In 2005, an entire section of ques-tions regarding ecstasy use was added separatefrom the questions on other psychedelics.
In the 2001 survey, there was one question regard-ing ephedrine use in the last 12 months that wasasked under the section for nutritional supplementuse. In 2005, an entire section of questions regard-ing ephedrine use was added separate from thequestions on other nutritional supplements.
In all, data were collected on more than 300 vari-ables on the student-athlete questionnaire.
The specific drugs that have been included in thequestionnaire have changed over the years. Thefollowing table indicates which specific drugclasses were included in each study:
DRUGS SURVEYED IN EACH STUDYPerceived Ergogenic Drugs
1985 1989 1993 1997 2001 2005
Amphetamines Amphetamines Amphetamines Amphetamines Amphetamines Amphetamines
Anabolic steroids Anabolic steroids Anabolic steroids Anabolic steroids Anabolic steroids Anabolic steroids
Barbiturates and Barbiturates and Barbiturates Ephedrine Ephedrine Ephedrinetranquilizers tranquilizers tranquilizers
Major pain Major pain Major pain Nutritional Nutritionalmedications medications medications supplements* supplements*
Anti-inflammatory Weight-loss medications products
Minor pain medications
Vitamins/minerals
* Not all nutritional supplements are ergogenic.
Socially Used Drugs1985 1989 1993 1997 2001 2005
Alcohol Alcohol Alcohol Alcohol Alcohol Alcohol
Cocaine Cocaine and crack Cocaine and crack Cocaine and crack Cocaine and crack Cocaine and crack
Marijuana and Marijuana and Marijuana and Marijuana and Marijuana and Marijuana and hashish hashish hashish hashish hashish hashish
Spit tobacco Spit tobacco Spit tobacco Spit tobacco Spit tobacco Spit tobacco
Psychedelics Psychedelics Psychedelics Psychedelics Psychedelics
Caffeine Caffeine Cigarettes Cigarettes
Cigarettes Ecstasy
11
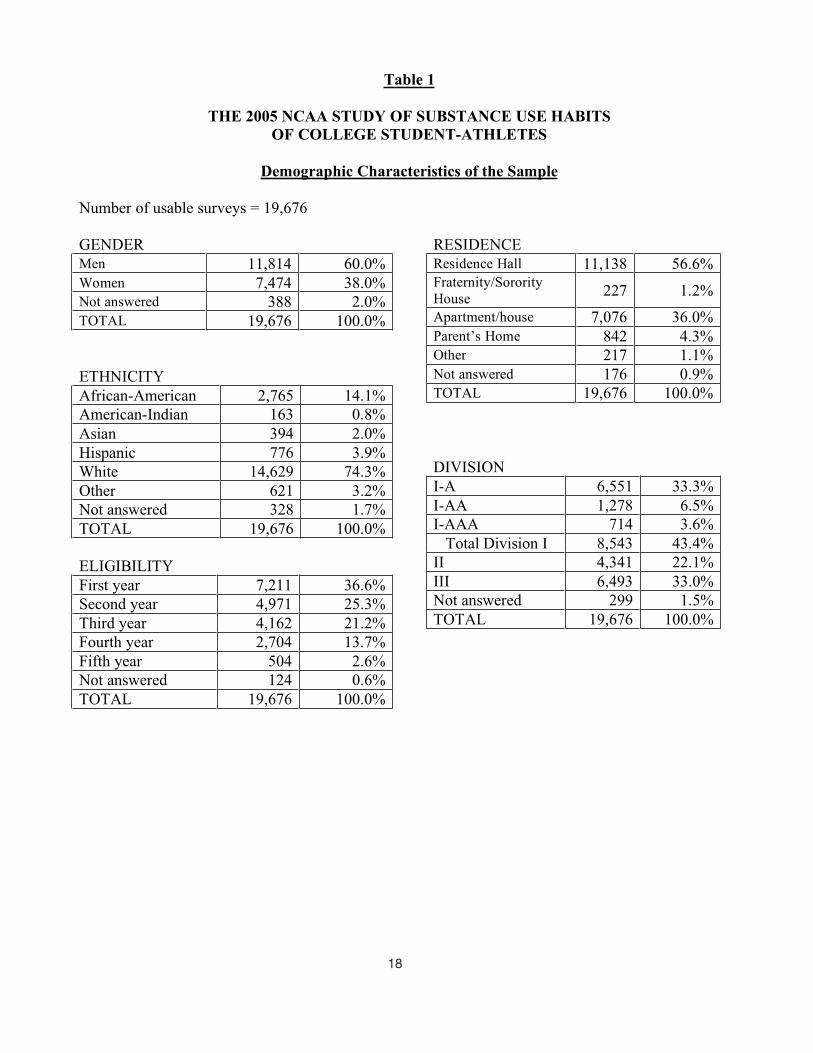
SubjectsA total of 19,676 usable individual surveys werereceived from the institutions that responded.Sixty-one percent of the responses were frommales and 39 percent were from females.Regarding ethnicity, 76 percent were white, 14percent were African-American, four percent wereHispanic and the remainder was other races.Forty-four percent of the respondents were fromNCAA Division I institutions, 22 percent werefrom Division II schools, and 34 percent of therespondents were Division III student-athletes.These representation rates are somewhat similarto the proportions of student-athletes in the threedivisions: 41 percent of all student-athletes are inDivision I, 21 percent in Division II and 39 per-cent in Division III. Overall, there is a slight bias
toward Division I respondents; however this dif-ference should not make a serious impact on theinterpretation of the overall results.
AnalysisComplete packets of surveys were mailed backdirectly to Pearson NCS Data Management, whichwas responsible for scanning the surveys into adatabase. The data were then checked by theNCAA research staff for inconsistencies, and anyquestionable data were removed from the data-base. The SPSS library of statistical packages wasused to compile the descriptive statistics reportedin this study. The usage rates reported are basedonly on those individuals who actually respondedto questions regarding use of specific drugs.

12
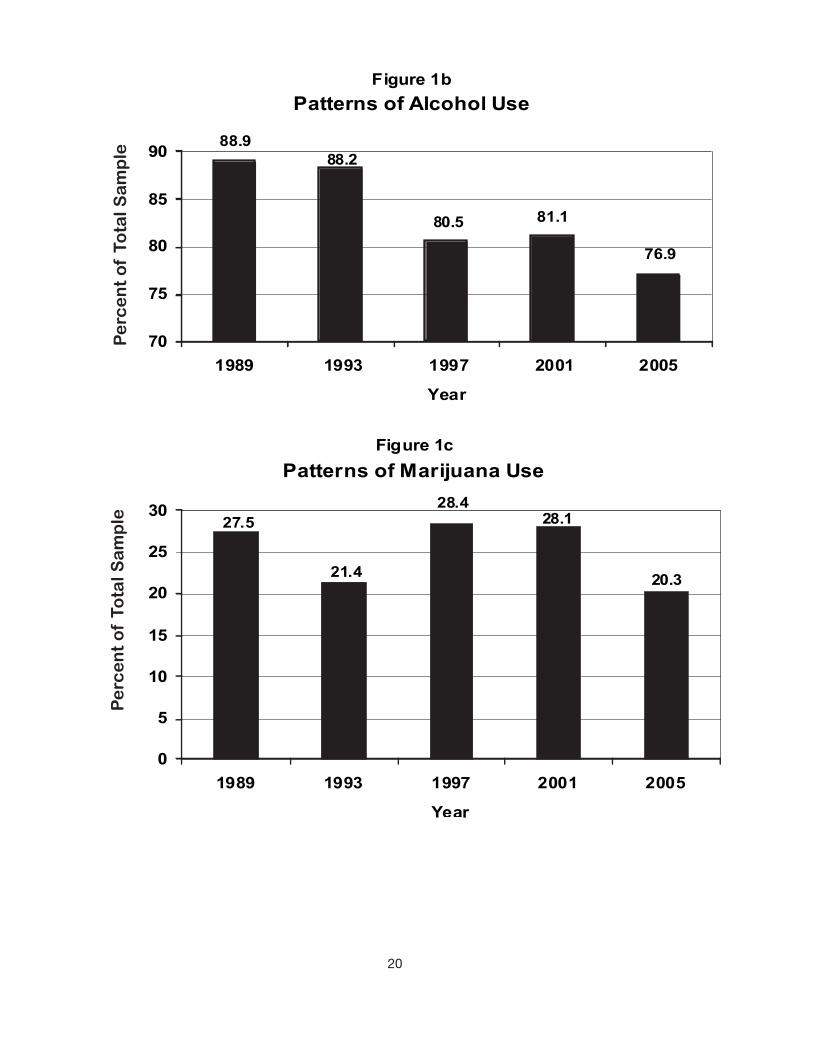
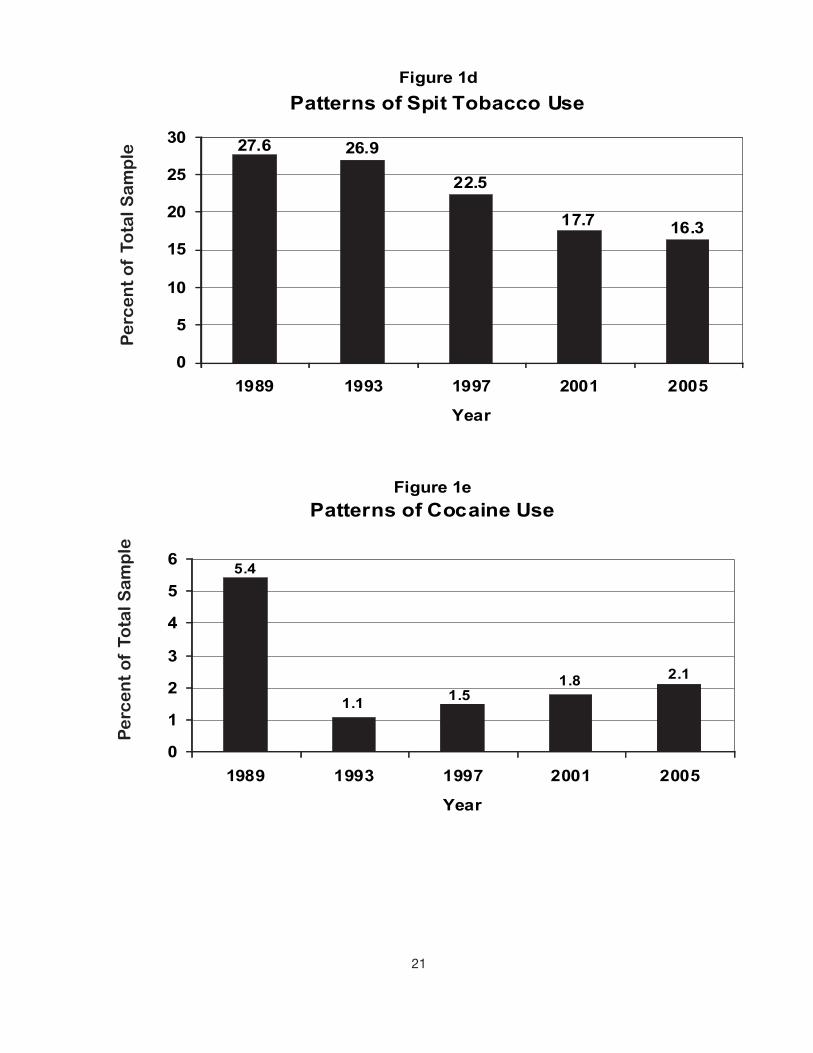
The figures and tables included in this report aresimilar to those created for the earlier studies con-ducted on drug use patterns of student-athletes.This was done to maximize our ability to comparedata across time. This year's study compares databack to the year 1989 for a more accurate look atfour of the drug studies. It is important to note thatthe usage rates reported in the tables include allindividuals who reported using a drug within thepast 12 months, regardless of whether they werecurrently using the drug at the time of the survey.
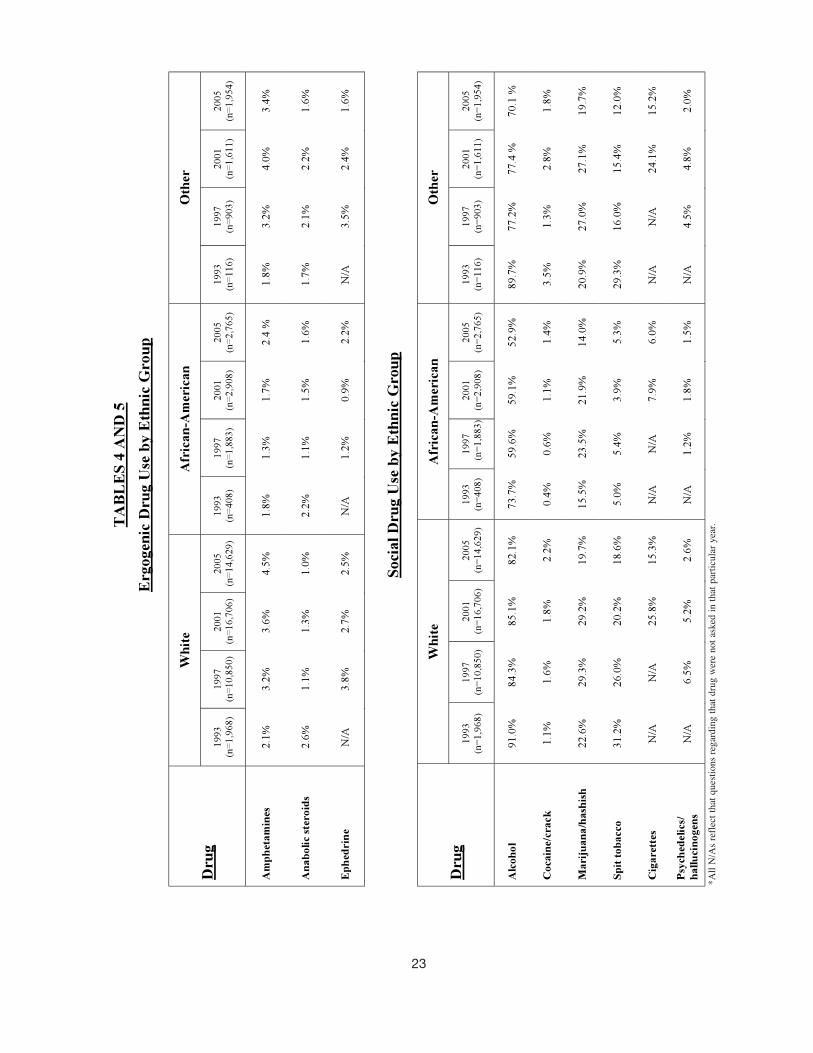
Table 1 presents demographic characteristics ofthe sample. Figures 1A and 1B present overallusage data for all of the drug categories includedin the survey compared across years. Tables 2 and3 report drug use by NCAA division and Tables 4and 5 report the rates by racial/ethnic classifica-tion. Tables 6 - 9 provide usage rates by sport, butonly those sports that were included in prior stud-
ies are reported in these tables. Tables 10a and breport usage rates for all men's sports that werenot included in prior studies, and Tables 11a and breport usage rates for all women's sports that werenot included in prior studies. Table 12 providesdata related to the frequency of spit tobacco usage,and Tables 13a and b show the frequency andamount of cigarette usage. Tables 14 and 15 giveinformation related to the reported age of "firstuse" for people who are still using drugs in thevarious categories. Tables 16 and 17 provideinformation related to the reasons that people whouse drugs do so, and Tables 18 and 19 provide thesame sort of data for those who do not use drugs.Tables 20 and 21 have data regarding where userswho continue to use get their drugs. Finally, theappendix reports response rates for all questionsincluded in the survey on a copy of the surveyform. Data that have not been reported in tabularform are available in the appendix.
Results

13
A review of the data presented in the tables and fig-ures leads to the following sets of findings:
FINDINGS ABOUT ERGOGENIC DRUG USEFinding 1: Among the entire group of student-ath-
letes, the use of amphetamines has con-tinually increased since 1997. The use ofephedrine, first calculated in 1997, hasremained stable. Anabolic steroid use hasdecreased slightly from 2001.
Finding 2: Analysis by division indicates thatamphetamine use has increased across alldivisions with use highest in Division III.Conversely, anabolic steroid use hasdecreased in all three divisions. Ephed-rine use decreased in Division II, but wasrelatively stable in the other two divi-sions.
FINDINGS ABOUT SOCIAL DRUG USEFinding 3: Among the entire group of student-ath-
letes, the use of alcohol has decreaseddramatically, while spit tobacco and mar-ijuana use are also at the lowest levelssince the study began. Reported use ofcocaine is up just slightly from 2001.
Finding 4: Analysis by division indicates that theusage of alcohol, psychedelics, marijuanaand cigarettes seem to be down in all divi-sions. Spit tobacco is down in all divisions,but more so in Divisions II and III. Cocaineusage is up slightly in all divisions since2001. Further, Division III continues toreport the highest rates of social drug useof all three divisions, with the exception ofspit tobacco usage, which is slightly high-er in Division II for 2005.
FINDINGS ABOUT USAGE WITHIN ETHNICAND SPORT GROUPSFinding 5: Amphetamine use continued an upward
trend for both Whites and African-Americans. However, African-Amer-icans still report the lowest rates of drugusage for amphetamines and all socialdrugs. Anabolic steroid use was reportedat an all-time lowest level for Whites andwas used by African-Americans and oth-ers at a slightly higher rate. Ephedrineuse has decreased within all ethnicgroups reported.
Finding 6: Amphetamine use has increased in allmen's sports except basketball, footballand swimming. Tennis, gymnastics, soc-cer and volleyball were the only sportsfor women that did not report increasedamphetamine use. Anabolic steroid use isdown for men and women with theexception of men's swimming and waterpolo and women's ice hockey. Socialdrug use generally decreased for bothmen and women, but more consistentlyso across women's sports.
FINDINGS ABOUT FREQUENCY ANDINITIAL USE OF DRUGSFinding 7: The vast majority of student-athletes who
reported using marijuana during the pre-vious 12 months used it only one or twotimes or “occasionally,” a decrease fromthe previous report. The number ofrespondents who reported smoking morethan two marijuana cigarettes alsodecreased significantly from 2001.
Finding 8: More than 85 percent of student-athleteswho reported using alcohol in the lastyear say they did so an average of two orfewer times per week, an increase from2001. While the number of student-ath-letes using alcohol decreased from 2001,the number of student-athletes drinking
Conclusions

14
more than five drinks in a sitting increa-sed significantly.
Finding 9: A similar trend to the alcohol use wasreported in cigarette use. The number ofdaily users decreased dramatically withmany more student-athletes reportingthat they only smoke at social occasions.However, there was an increase amongsmokers in those who smoke a pack ormore a day.
Finding 10:The percent of student-athletes usingergogenic drugs during high school orbefore increased significantly. More thantwo-thirds of amphetamine, ephedrineand nutritional supplement use nowappears to start before college. More thanhalf of anabolic steroid use begins in highschool as well.
Finding 11: Reversing a previous trend, more thanhalf of the cocaine users indicated havingfirst tried cocaine in high school orbefore. The percent of student-athletestrying alcohol, marijuana or cigarettes injunior high or before also increased.
FINDINGS ABOUT WHY STUDENT-ATH-LETES USE DRUGSFinding 12:More than half of the users of anabolic
steroids say they use them to improveathletic performance. Continuing a trendfrom 2001, the number of student-ath-letes using anabolic steroids for the treat-ment of an injury continued to decrease.The number of users now stating they useanabolic steroids to improve appearancedecreased from 2001.
Finding 13: Use of amphetamines to improve athleticperformance appears to be down signifi-cantly from the 2001 study. The main rea-son stated for using amphetamines is forthe treatment of attention deficit disorderfollowed by using to get more energy. Thetop two reasons stated for using ephedrinereversed order in 2005 to weight loss, fol-lowed by to improve athletic performance.
Finding 14:Alcohol, cocaine, marijuana and spittobacco users are most likely to use forrecreational or social reasons. Marijuana,cocaine and spit tobacco users also statedthat they use to make them feel good.Spit tobacco users also cite use to helpdeal with the stress of college life andcollege athletics. Very few state they usesocial drugs to improve athletic perform-ance.
FINDINGS ABOUT WHY STUDENT-ATH-LETES DO NOT USE DRUGSFinding 15:The majority of student-athletes who
choose not to use ergogenic or socialdrugs are reporting concerns abouthealth, they do not desire to experiencethe effects and that the idea of usingdrugs is against their beliefs.
Finding 16:A main reason given by student-athletesto not use nutritional supplements andspit tobacco is that they do not like it andanother top reason given for not usingalcohol was that it hurt athletic perform-ance.
FINDINGS ABOUT SOURCES OF DRUGSFOR STUDENT-ATHLETESFinding 17:The main source for student-athletes who
continue to use amphetamines or anabol-ic steroids is a friend or relative followedby another physician for amphetamineusers and Web site or mail order for ana-bolic steroid users. Nutritional supple-ments are mainly purchased in a retailstore.
Finding 18:The primary source for student-athleteswho continue to use either cocaine, mar-ijuana or psychedelics continues to be afriend or relative.
FINDINGS ABOUT STUDENT-ATHLETES'OVERALL PERCEPTION OF DRUG USE Finding 19:Almost 60 percent of student-athletes
continue to believe that their use ofalcoholic beverages has no effect onathletic performance or on their generalhealth.
15
Finding 20:Almost 30 percent of student-athletesstated that one or more times they per-formed poorly in practice or a game dueto drinking or drug use.
FINDINGS ABOUT ATTITUDES TOWARDDRUG TESTINGFinding 21: The number of respondents who believe
that the NCAA and their institutionsshould drug test student-athletes increasedfrom 2001, with nearly two-thirds believ-ing that the NCAA should drug test stu-dent-athletes. The number of respondentsbelieving that drug testing by the NCAAand the institutions has deterred collegeathletes from using drugs also increased.
Finding 22:There continues to a split among student-athletes surveyed who believe that
imposing team penalties for individualpositive tests would be fair and appropri-ate.
FINDINGS ABOUT HAZING AND ALCOHOLUSEFinding 23: Less than 10 percent of the respondents
reported any involvement in hazing withincollege sports. Men were more likely thanwomen to be the victim of hazing in theircollege sports program and to haze othersin the program.
Finding 24: For those student-athletes who had beeninvolved in a hazing incident, approxi-mately 50 percent said that alcohol hadbeen involved. Women were more than 10percent more likely to say that alcohol hadbeen involved in the hazing.

16

17
TABLES AND FIGURES
18
Number of usable surveys = 19,676
GENDERMen 11,814 60.0%Women 7,474 38.0%Not answered 388 2.0%TOTAL 19,676 100.0%
ETHNICITYAfrican-American 2,765 14.1%American-Indian 163 0.8%Asian 394 2.0%Hispanic 776 3.9%White 14,629 74.3%Other 621 3.2%Not answered 328 1.7%TOTAL 19,676 100.0%
ELIGIBILITYFirst year 7,211 36.6%Second year 4,971 25.3%Third year 4,162 21.2%Fourth year 2,704 13.7%Fifth year 504 2.6%Not answered 124 0.6%TOTAL 19,676 100.0%
RESIDENCEResidence Hall 11,138 56.6%Fraternity/SororityHouse 227 1.2%
Apartment/house 7,076 36.0%Parent’s Home 842 4.3%Other 217 1.1%Not answered 176 0.9%TOTAL 19,676 100.0%
DIVISIONI-A 6,551 33.3%I-AA 1,278 6.5%I-AAA 714 3.6%Total Division I 8,543 43.4%II 4,341 22.1%III 6,493 33.0%Not answered 299 1.5%TOTAL 19,676 100.0%

19
Fig
ure
1a
Pa
tte
rns
of
Erg
og
en
ic D
rug
Us
ein
Pa
st
12
Mo
nth
s
4.1
3.4
3.1
2.1
2.8
1.2
1.5
1.1
2.5
4.9
2.5
2.4
3.5
0123456
19
89
19
93
19
97
20
01
20
05
Year
Am
phe
tam
ine
s
Ana
bo
lic S
tero
ids
Ep
he
drin
e
Percent ofTotal Sample
20
Figure 1c
Patterns of Marijuana Use
21.4 20.3
28.128.4
27.5
0
5
10
15
20
25
30
1989 1993 1997 2001 2005
Year
Figure 1b
Patterns of Alcohol Use
76.9
81.180.5
88.288.9
70
75
80
85
90
1989 1993 1997 2001 2005
Year
Pe
rce
nt
of
Tota
l Sa
mp
leP
erc
en
t o
fTo
tal S
am
ple
21
Figure 1d
Patterns of Spit Tobacco Use
16.317.7
22.5
26.927.6
0
5
10
15
20
25
30
1989 1993 1997 2001 2005
Year
Figure 1e
Patterns of Cocaine Use
1.1
1.8 2.1
5.4
1.5
0
1
2
3
4
5
6
1989 1993 1997 2001 2005
Year
Pe
rce
nt
of
Tota
l Sa
mp
leP
erc
en
t o
fTo
tal S
am
ple

22
TA
BL
ES
2 A
ND
3
Erg
og
enic
Dru
g U
seb
y N
CA
AD
ivis
ion
Div
isio
nI
Div
isio
nII
Div
isio
nII
I
Dru
g1993
(n=1,422)
1997
(n=6,123)
2001
(n=8,776)
2005
(n=8,543)
1993
(n=681)
1997
(n=3,254)
2001
(n=4,867)
2005
(n=4,341)
1993
(n=409)
1997
(n=4,537)
2001
(n=7,520)
2005
(n=6,493)
Am
ph
eta
min
es2.1%
2.5%
3.2%
4.0%
2.0%
3.3%
3.3%
3.8%
1.9%
3.7%
3.7%
4.6%
An
ab
oli
cst
ero
ids
1.9%
1.2%
1.6%
1.2%
4.3%
1.1%
2.5%
1.2%
1.9%
1.3%
1.4%
1.0%
Ep
hed
rin
eN/A
3.0%
2.4%
2.4%
N/A
4.2%
4.1%
2.6%
N/A
3.8%
2.5%
2.6%
Nu
trit
ion
al
Su
pp
lem
ents
N/A
N/A
46.0%
33.4%
N/A
N/A
41.5%
27.9%
N/A
N/A
39.8%
28.1%
So
cia
lD
rug
Use
by
NC
AA
Div
isio
n
Div
isio
nI
Div
isio
nII
Div
isio
nII
I
Dru
g1993
(n=1,422)
1997
(n=6,123)
2001
(n=8,776)
2005
(n=8,543)
1993
(n=681)
1997
(n=3,254)
2001
(n=4,867)
2005
(n=4,341)
1993
(n=409)
1997
(n=4,537)
2001
(n=7,520)
2005
(n=6,493)
Alc
oh
ol
86.3%
79.2%
80.5%
74.7%
89.1%
79.7%
78.8%
74.5%
93.2%
82.6%
83.3%
81.5%
Co
cain
e/c
rack
0.6%
1.2%
1.8%
2.0%
1.9%
2.0%
1.6%
1.9%
1.2%
1.5%
1.8%
2.3%
Ma
riju
an
a/h
ash
ish
17.6%
26.4%
26.3%
17.3%
22.5%
29.2%
24.7%
17.8%
33.1%
30.3%
32.5%
25.8%
Sp
itto
ba
cco
24.3%
21.7%
16.4%
16.2%
30.6%
23.8%
18.3%
16.6%
29.4%
22.6%
19.0%
16.4%
Cig
are
ttes
N/A
N/A
21.3%
12.3%
N/A
N/A
23.8%
14.0%
N/A
N/A
25.5%
16.6%
Psy
ched
eli
cs/
ha
llu
cin
og
ens
N/A
4.6%
4.5%
2.3%
N/A
6.1%
3.8%
2.0%
N/A
6.6%
5.7%
2.9%
*AllN/A’sreflectthatquestionsregardingthatdrugwere
notasked
inthatparticularyear.
*All
N/A
s re
flec
t tha
t que
stio
ns r
egar
ding
that
dru
g w
ere
not a
sked
in th
at p
artic
ular
yea
r.
23
TA
BL
ES
4 A
ND
5
Ergogen
icD
rug U
seb
y E
thn
icG
rou
p
Wh
ite
Afr
ica
n-A
mer
ican
Oth
er
Dru
g1993
(n=1,968)
1997
(n=10,850)
2001
(n=16,706)
2005
(n=14,629)
1993
(n=408)
1997
(n=1,883)
2001
(n=2,908)
2005
(n=2,765)
1993
(n=116)
1997
(n=903)
2001
(n=1,611)
2005
(n=1,954)
Am
ph
eta
min
es2.1%
3.2%
3.6%
4.5%
1.8%
1.3%
1.7%
2.4
%1.8%
3.2%
4.0%
3.4%
An
ab
oli
cst
ero
ids
2.6%
1.1%
1.3%
1.0%
2.2%
1.1%
1.5%
1.6%
1.7%
2.1%
2.2%
1.6%
Ep
hed
rin
eN/A
3.8%
2.7%
2.5%
N/A
1.2%
0.9%
2.2%
N/A
3.5%
2.4%
1.6%
Soci
al
Dru
g U
seb
y E
thn
icG
rou
p
Wh
ite
Afr
ica
n-A
mer
ican
Oth
er
Dru
g1993
(n=1,968)
1997
(n=10,850)
2001
(n=16,706)
2005
(n=14,629)
1993
(n=408)
1997
(n=1,883)
2001
(n=2,908)
2005
(n=2,765)
1993
(n=116)
1997
(n=903)
2001
(n=1,611)
2005
(n=1,954)
Alc
oh
ol
91.0%
84.3%
85.1%
82.1%
73.7%
59.6%
59.1%
52.9%
89.7%
77.2%
77.4
%70.1
%
Co
cain
e/c
rack
1.1%
1.6%
1.8%
2.2%
0.4%
0.6%
1.1%
1.4%
3.5%
1.3%
2.8%
1.8%
Ma
riju
an
a/h
ash
ish
22.6%
29.3%
29.2%
19.7%
15.5%
23.5%
21.9%
14.0%
20.9%
27.0%
27.1%
19.7%
Sp
itto
ba
cco
31.2%
26.0%
20.2%
18.6%
5.0%
5.4%
3.9%
5.3%
29.3%
16.0%
15.4%
12.0%
Cig
are
ttes
N/A
N/A
25.8%
15.3%
N/A
N/A
7.9%
6.0%
N/A
N/A
24.1%
15.2%
Psy
ched
eli
cs/
ha
llu
cin
og
ens
N/A
6.5%
5.2%
2.6%
N/A
1.2%
1.8%
1.5%
N/A
4.5%
4.8%
2.0%
*AllN/A’sreflectthatquestionsregardingthatdrugwere
notasked
inthatparticularyear.
*All
N/A
s re
flec
t tha
t que
stio
ns r
egar
ding
that
dru
g w
ere
not a
sked
in th
at p
artic
ular
yea
r.

24
TA
BL
ES
6 A
ND
7
Erg
og
enic
Dru
g U
sein
Men
’sS
po
rts
Men
’s
Ba
seb
all
Men
’s
Ba
sket
ba
ll
Men
’s
Fo
otb
all
Men
’s
Ten
nis
Men
’s
Tra
ck/F
ield
Dru
g1993
1997
2001
2005
1993
1997
2001
2005
1993
1997
2001
2005
1993
1997
2001
2005
1993
1997
2001
2005
Am
ph
eta
min
es1.7%
1.9%
2.7%
3.9%
0.7%
1.3%
1.5%
1.2%
2.9%
2.1%
4.3%
3.9%
0.0%
3.0%
2.2%
3.9%
1.1%
1.6%
1.4%
3.1%
An
ab
oli
c
ster
oid
s0.7%
1.9%
2.3%
2.3%
2.6%
0.6%
1.4%
1.5%
5.0%
2.2%
3.0%
2.3%
0.0%
0.5%
0.6%
0.3%
0.0%
1.3%
1.3%
0.8%
Ep
hed
rin
eN/A
3.3%
3.2%
3.3%
N/A
1.4%
1.9%
1.0%
N/A
5.3%
3.8%
4.2%
N/A
2.9%
1.6%
1.1%
N/A
2.4%
1.8%
1.8%
Erg
og
enic
Dru
g U
sein
Wo
men
’sS
po
rts
Wo
men
’s
Ba
sket
ba
ll
Wo
men
’s
Soft
ball
Wo
men
’s
Sw
imm
ing
Wo
men
’s
Ten
nis
Wo
men
’s
Tra
ck/F
ield
Dru
g1993
1997
2001
2005
1993
1997
2001
2005
1993
1997
2001
2005
1993
1997
2001
2005
1993
1997
2001
2005
Am
ph
eta
min
es
1.5%
1.0%
2.0%
2.9%
4.0%
4.7%
3.9%
5.2%
2.2%
4.7%
3.3%
4.4%
0.0%
2.5%
2.7%
2.6%
1.4%
2.1%
1.7%
1.9%
An
ab
oli
c
ster
oid
s1.5%
0.4%
0.7%
0.3%
1.7%
0.9%
0.8%
0.4%
0.6%
0.8%
1.3%
0.1%
2.7%
0.3%
0.0%
0.2%
2.7%
0.6%
0.6%
0.1%
Ep
hed
rin
eN/A
1.8%
1.3%
1.5%
N/A
1.1%
2.3%
2.9%
N/A
0.5%
2.2%
1.7%
N/A
1.9%
1.2%
1.2%
N/A
0.9%
1.3%
1.1%
*All
N/A
s re
flec
t tha
t que
stio
ns r
egar
ding
that
dru
g w
ere
not a
sked
in th
at p
artic
ular
yea
r.

25
TA
BL
E8
Socia
lD
ru
g U
sein
Men
’sS
ports
Men
’s
Ba
seb
all
Men
’s
Ba
sket
ba
ll
Men
’s
Fo
otb
all
Men
’s
Ten
nis
Men
’s
Tra
ck/F
ield
Dru
g1993
1997
2001
2005
1993
1997
2001
2005
1993
1997
2001
2005
1993
1997
2001
2005
1993
1997
2001
2005
Alc
oh
ol
93.1%
80.7%
84.5%
82.1%
86.1%
74.4%
74.1%
63.4%
87.5%
75.2%
77.9%
75.2%
92.4%
76.8%
79.1%
72.5%
83.8%
69.4%
71.5%
68.2%
Co
cain
e/
cra
ck1.0%
1.6%
1.3%
2.3%
2.5%
0.6%
1.3%
1.7%
1.4%
1.6%
1.8%
2.4%
0.0%
2.1%
1.6%
1.8%
0.4%
0.8%
0.8%
1.7%
Ma
riju
an
a/
ha
sh22.7%
25.8%
27.2%
20.6%
21.0%
25.2%
23.6%
18.5%
23.2%
25.8%
28.2%
21.0%
26.4%
24.4%
27.8%
18.9%
13.3%
16.6%
17.6%
16.1%
Sp
it
To
ba
cco
54.9%
45.6%
41.2%
42.0%
19.7%
19.2%
12.2%
10.4%
35.6%
30.3%
29.3%
29.8%
35.9%
19.6%
12.8%
10.5%
22.0%
14.4%
12.6%
12.5%
Psy
ched
eli
cs/
ha
llu
cin
og
ens
N/A
3.5%
4.0%
2.2%
N/A
3.1%
2.6%
2.3%
N/A
3.9%
5.0%
2.9%
N/A
5.5%
3.1%
2.3%
N/A
3.2%
2.4%
2.0%
Cig
are
ttes
N/A
N/A
23.5%
13.7%
N/A
N/A
14.5%
8.6%
N/A
N/A
18.1%
12.4%
N/A
N/A
26.5%
15.6%
N/A
N/A
25.5%
9.5%
*All
N/A
s re
flec
t tha
t que
stio
ns r
egar
ding
that
dru
g w
ere
not a
sked
in th
at p
artic
ular
yea
r.
26
TA
BL
E9
Socia
lD
ru
g U
sein
Wom
en
’sS
ports
Wo
men
’s
Ba
sket
ba
ll
Wo
men
’s
So
ftb
all
Wo
men
’s
Sw
imm
ing
Wo
men
’s
Ten
nis
Wo
men
’s
Tra
ck/F
ield
Dru
g1993
1997
2001
2005
1993
1997
2001
2005
1993
1997
2001
2005
1993
1997
2001
2005
1993
1997
2001
2005
Alc
oh
ol
85.3%
78.5%
72.0%
67.4%
91.3%
81.4%
85.8%
80.9%
92.2%
84.3%
88.3%
83.3%
96.1%
78.4%
84.4%
73.1%
82.5%
72.9%
71.3%
64.6%
Co
cain
e/
cra
ck0.7%
0.8%
0.8%
0.7%
1.2%
1.8%
1.3%
1.4%
1.7%
1.5%
1.6%
1.1%
0.0%
0.8%
1.5%
1.4%
0.0%
0.2%
0.6%
0.5%
Ma
riju
an
a/
ha
sh14.7%
22.4%
21.3%
12.1%
24.2%
26.5%
29.1%
18.2%
29.5%
29.0%
29.9%
19.6%
21.6%
21.4%
20.4%
14.0%
11.5%
17.5%
14.8%
10.4%
Sp
it
To
ba
cco
7.4%
5.3%
3.5%
1.6%
8.6%
8.5%
4.9%
2.9%
9.5%
5.4%
3.2%
1.4%
10.7%
1.4%
3.6%
1.6%
6.9%
4.1%
1.5%
0.9%
Psy
ched
eli
cs/
ha
llu
cin
og
ens
N/A
1.9%
1.6%
0.7%
N/A
2.6%
4.0%
0.9%
N/A
5.6%
3.7%
2.2%
N/A
3.2%
2.1%
0.6%
N/A
2.8%
1.5%
0.5%
Cig
are
ttes
N/A
N/A
18.9%
10.9%
N/A
N/A
35.3%
22.6%
N/A
N/A
31.3%
16.8%
N/A
N/A
30.1%
17.0%
N/A
N/A
11.6%
6.2%
*All
N/A
s re
flec
t tha
t que
stio
ns r
egar
ding
that
dru
g w
ere
not a
sked
in th
at p
artic
ular
yea
r.

27
TA
BL
E1
0a
Erg
og
enic
Dru
g U
seP
att
ern
sin
Oth
erM
en’s
Sp
ort
s
Am
ph
eta
min
esA
na
bo
lic
ster
oid
sE
ph
edri
ne
Sp
ort
1997
2001
2005
1997
2001
2005
1997
2001
2005
Fen
cin
g4.0%
5.4%
**
0.0%
1.8%
**
4.0%
0.9%
**
Go
lf4.4%
1.6%
3.5%
0.9%
1.4%
1.3%
2.5%
1.6%
1.1%
Gy
mn
ast
ics
0.0%
3.2%
**
0.0%
1.1%
**
0.0%
0.0%
**
Ice
Ho
ck
ey5.6%
4.6%
5.2%
1.2%
1.6%
1.2%
9.1%
3.6%
5.5%
La
cro
sse
8.8%
7.2%
13.4%
1.3%
2.2%
1.8%
6.9%
3.9%
4.1%
Rif
le5.0%
**
**
5.0%
**
**
0.0%
**
**
Sk
iin
g0.0%
3.4%
**
0.0%
0.6%
**
18.8%
0.6%
**
So
ccer
4.3%
3.0%
5.4%
0.6%
0.9%
0.9%
4.7%
1.6%
1.5%
Sw
imm
ing
5.9%
4.4%
3.3%
1.3%
0.2%
0.8%
4.7%
3.1%
1.8%
Wa
ter
Po
lo7.1%
5.1%
5.6%
2.8%
5.2%
10.5%
5.8%
3.0%
7.9%
Wres
tlin
g4.0%
6.1%
7.3%
1.9%
1.6%
2.2%
10.4%
4.9%
5.6%
**In
dica
tes
that
the
num
ber
of r
espo
nden
ts w
as to
o lo
w to
rep
ort p
erce
ntag
es.
28
TA
BL
E1
0b
Socia
lD
ru
g U
seP
att
ern
sin
Oth
er
Men
’sS
ports
Alc
oh
ol
Co
cain
e/cr
ack
Ma
riju
an
aS
pit
tob
acco
Psy
ch
edel
ics
Sp
ort
1997
2001
2005
1997
2001
2005
1997
2001
2005
1997
2001
2005
1997
2001
2005
Fen
cin
g68.6%
88.2%
**
2.0%
3.7%
**
27.4%
37.0%
**
5.7%
9.0%
**
7.9%
4.6%
**
Go
lf87.2%
83.3%
82.3%
2.4%
1.8%
2.7%
25.1%
27.1%
24.8%
37.4%
27.7%
24.5%
7.3%
3.9%
2.4%
Gy
mn
ast
ics
86.7%
83.9%
**
0.0%
2.2%
**
26.6%
31.9%
**
11.3%
8.5%
**
2.3%
8.5%
**
Ice
Ho
ck
ey93.4%
93.2%
94.0%
2.8%
2.5%
4.0%
35.5%
28.4%
20.8%
36.3%
35.4%
36.7%
12.8%
6.0%
4.7%
La
cro
sse
94.8%
90.2%
94.9%
3.7%
5.0%
8.0%
58.6%
48.6%
47.8%
44.0%
32.4%
27.1%
17.6%
14.4%
9.7%
Rif
le75.0%
**
**
0.0%
**
**
20.0%
**
**
55.0%
**
**
0.0%
**
**
Sk
iin
g93.8%
96.1%
**
0.0%
2.3%
**
56.3%
41.4%
**
43.8%
13.3%
**
13.3%
7.9%
**
So
ccer
85.6%
84.3%
79.8%
1.8%
1.8%
2.3%
40.4%
33.2%
28.4%
30.2%
20.7%
16.8%
12.8%
6.4%
4.3%
Sw
imm
ing
90.8%
84.8%
80.8%
2.4%
2.3%
2.0%
42.5%
38.1%
28.4%
30.6%
18.7%
9.1%
12.3%
8.8%
4.1%
Wa
ter
Po
lo86.1%
92.9%
86.8%
5.8%
7.1%
11.1%
44.4%
58.7%
37.8%
40.9%
25.5%
8.1%
14.1%
23.7%
5.6%
Wres
tlin
g88.9%
85.9%
80.2%
2.5%
2.8%
4.7%
34.6%
30.6%
24.6%
47.2%
38.8%
34.6%
8.7%
8.4%
5.6%
**In
dica
tes
that
the
num
ber
of r
espo
nden
ts w
as to
o lo
w to
rep
ort p
erce
ntag
es.

29
TA
BL
E11
a
Erg
og
enic
Dru
g U
seP
att
ern
sin
Oth
erW
om
en’s
Sp
ort
s
Am
ph
eta
min
esA
na
bo
lic
ster
oid
sE
ph
edri
ne
Sp
ort
1997
2001
2005
1997
2001
2005
1997
2001
2005
Fen
cin
g0.0%
0.0%
**
0.0%
0.0%
**
3.0%
2.5%
**
Fie
ld
Ho
ckey
4.6%
4.1%
4.4%
1.5%
0.0%
0.0%
0.5%
1.9%
3.1%
Go
lf5.1%
3.0%
4.6%
0.0%
0.5%
0.4%
1.5%
1.9%
3.0%
Gy
mn
ast
ics
3.3%
3.4%
2.1%
0.0%
0.0%
1.0%
1.1%
3.4%
1.1%
Ice
Ho
ck
ey0.0%
2.4%
4.9%
0.0%
0.8%
2.4%
0.0%
3.2%
11.9%
La
cro
sse
3.2%
2.9%
8.6%
0.0%
0.0%
0.0%
1.1%
0.3%
2.7%
Sk
iin
g4.3%
**
**
0.0%
**
**
0.0%
**
**
So
ccer
5.3%
4.6%
4.3%
0.5%
0.5%
0.1%
3.3%
1.6%
1.0%
Vo
lley
ba
ll3.0%
4.1%
2.9%
0.8%
0.1%
0.6%
2.1%
1.7%
1.7%
**In
dica
tes
that
the
num
ber
of r
espo
nden
ts w
as to
o lo
w to
rep
ort p
erce
ntag
es.
30
TA
BL
E1
1b
So
cia
lD
rug
Use
Pa
ttern
sin
Oth
erW
om
en’s
Sp
ort
s
Alc
oh
ol
Co
cain
e/cr
ack
Ma
riju
an
aS
pit
tob
acco
Psy
ch
edel
ics
Sp
ort
1997
2001
2005
1997
2001
2005
1997
2001
2005
1997
2001
2005
1997
2001
2005
Fen
cin
g78.8%
80.0%
**
0.0%
0.0%
**
12.1%
10.0%
**
3.0%
0.0%
**
3.0%
0.0%
**
Fie
ldH
ock
ey88.8%
88.4%
88.8%
1.0%
2.5%
0.9%
34.9%
38.2%
23.6%
6.6%
4.1%
0.9%
9.3%
5.6%
1.0%
Go
lf89.8%
83.9%
75.1%
3.0%
1.4%
2.5%
28.6%
20.9%
14.5%
5.1%
2.9%
4.1%
2.9%
1.6%
0.4%
Gy
mn
ast
ics
75.3%
78.4%
87.5%
0.0%
1.1%
1.1%
21.4%
13.6%
13.5%
5.4%
1.1%
2.1%
1.1%
1.1%
0.0%
Ice
Ho
ck
ey83.4%
87.9%
92.9%
0.0%
1.6%
0.0%
35.3%
28.5%
34.1%
22.3%
5.6%
19.5%
0.0%
5.8%
2.4%
La
cro
sse
95.9%
93.7%
93.3%
1.1%
1.6%
3.6%
51.5%
42.8%
36.5%
12.4%
2.8%
4.6%
14.3%
3.8%
0.9%
Sk
iin
g83.3%
**
**
0.0%
**
**
16.7%
**
**
12.5%
**
**
0.0%
**
**
So
ccer
86.9%
87.4%
83.4%
1.1%
1.3%
2.3%
37.6%
29.5%
24.1%
6.0%
3.5%
3.3%
7.6%
4.9%
2.6%
Vo
lley
ba
ll81.9%
77.9%
79.1%
1.2%
1.2%
1.6%
24.6%
22.6%
15.9%
5.0%
2.1%
1.6%
3.4%
3.5%
1.7%
**In
dica
tes
that
the
num
ber
of r
espo
nden
ts w
as to
o lo
w to
rep
ort p
erce
ntag
es.

31
TA
BL
ES
12
AN
D1
3a
an
db
Freq
uen
cy
of
Sp
itT
ob
acco
Use
Per
centa
ges
Bas
ed o
n T
hose
Who C
onti
nue
to U
se
Tim
esP
erD
ay
1989
(n=
399)
1993
(n=
465)
1997
(n=
1,9
41)
2001
(n=
2,3
93
)
20
05
(n=
3,1
63
)
Les
sth
an
on
ce45.9
%47.7
%36.7
%37.1
%5
2.1
%
On
eto
fiv
e41.1
%40.2
%50.0
%53.4
%3
9.6
%
Six
to
ten
10.5
%10.1
%10.6
%7.3
%6
.3%
Ele
ven
to f
ifte
en1.8
%0.9
%1.8
%
More
than
fift
een
0.8
%1.1
%0.9
%*2.3
%*
2.0
%
*Q
ues
tio
nw
as
wo
rded
on
20
01
surv
eyas
“mo
reth
an1
0ti
mes
per
day
”.
Freq
uen
cy o
fC
iga
rett
eU
se
Per
centa
ges
Bas
ed o
n T
hose
Who C
onti
nue
to U
se
Tim
esP
erD
ay
2001
(n=
2,3
77)
20
05
(n=
2,5
71
)
Da
ily
26.1
%1
1.7
%
Cou
ple
tim
esa w
eek
15.8
%1
1.9
%
Wee
ken
ds
on
ly10.4
%9
.6%
At
soci
al
occ
asi
on
sw
ith
frie
nd
son
ly45.9
%6
6.7
%

32
Am
ou
nt
of
Cig
are
tte
Use
Per
centa
ges
Bas
ed o
n T
hose
Who S
moke
Dai
ly
TA
BL
E1
4
Init
ial
Use
of
Ergogen
icD
rugs
Per
centa
ges
Bas
ed o
n T
hose
Who C
onti
nue
to U
se
*N
utr
itio
nal
Supple
men
tre
late
d q
ues
tion w
asnot
incl
uded
pre
vio
us
to t
he
2001 s
urv
ey.
Am
ou
nt
smo
ked
da
ily
2001
(n=
619)
20
05
(n=
37
2)
pa
cko
rle
ss82.1
%7
9.6
%
1 p
ack
14.4
%1
5.6
%
More
than
1p
ack
3.6
%4
.8%
Am
ph
eta
min
esA
na
bo
lic
ster
oid
sE
ph
edri
ne
All
nu
trit
ion
al
sup
ple
men
ts*
Res
po
nse
Ch
oic
e1
99
7
(n=
19
7)
20
01
(n=
34
5)
20
05
(n=
12
23
)
19
97
(n=
61
)
20
01
(n=
10
0)
20
05
(n=
39
7)
19
97
(n=
25
4)
20
01
(n=
52
0)
20
05
(n=
17
29
)
20
01
(n=
61
91
)
20
05
(n=
82
71
)
Ju
nio
rh
igh
or
befo
re
10
.1%
5.7
%1
4.3
%2
6.9
%1
5.4
%1
7.4
%3
.4%
3.5
%6
.4%
5.7
%9
.2%
Hig
hsc
ho
ol
53
.7%
46
.2%
51
.4%
25
.0%
41
.8%
39
.3%
37
.4%
58
.0%
66
.4%
57
.3%
66
.1%
Du
rin
gfr
esh
ma
ny
ear
of
coll
ege
15
.4%
26
.0%
19
.1%
19
.2%
16
.5%
16
.4%
18
.9%
17
.3%
16
.0%
20
.0%
14
.7%
Aft
erfr
esh
ma
ny
ear
of
coll
ege
20
.7%
22
.1%
15
.1%
28
.8%
26
.4%
27
.0%
40
.3%
21
.2%
11
.2%
15
.9%
9.9
%

33
TABLE15
InitialUse
ofSocialDru
gs
Per
centa
ges
Bas
ed o
n T
hose
Who C
onti
nue
to U
se
*C
igar
ette
rela
ted q
ues
tion w
asnot
incl
uded
pre
vio
us
to t
he
2001
surv
ey.
Alcohol
Cocaine/crack
Marijuana/hashish
Spittobacco
Cigarettes*
Response
Choice
19
97
(n=
92
79
)
20
01
(n=
14
40
5)
20
05
(n=
15
84
9)
19
97
(n=
78
)
20
01
(n=
13
9)
20
05
(n=
64
7)
19
97
(n=
18
65
)
20
01
(n=
28
99
)
20
05
(n=
68
65
)
19
97
(n=
19
41
)
20
01
(n=
23
93
)
20
05
(n=
39
82
)
20
01
(n=
46
06
)
20
05
(n=
40
19
)
Juniorhighorbefore
14
.2%
13
.1%
17
.0%
10
.7%
10
.2%
9.9
%8
.6%
14
.8%
16
.3%
17
.8%
17
.0%
15
.5%
16
.6%
25
.9%
Highschool
63
.2%
64
.9%
60
.7%
34
.7%
32
.8%
45
.4%
62
.7%
63
.7%
65
.7%
58
.7%
57
.0%
57
.9%
59
.0%
53
.9%
Duringfreshmanyearofcollege
18
.2%
17
.1%
16
.9%
10
.7%
21
.9%
21
.2%
17
.4%
12
.9%
11
.8%
15
.0%
16
.4%
17
.3%
14
.6%
12
.1%
After
freshmanyearofcollege
4.3
%4
.9%
5.4
%4
4.0
%3
5.2
%2
3.5
%1
1.4
%8
.6%
6.1
%8
.4%
9.7
%9
.3%
9.8
%8
.1%
34
TA
BL
E1
6
Percen
to
fU
sers’
Resp
on
ses
to t
he
Qu
est
ion
:
“What
isth
eon
em
ain
reaso
nyou
use
_______________?”
Per
centa
ges
Bas
ed o
n T
hose
Who C
onti
nue
to U
se
Am
ph
eta
min
esA
na
bo
lic
ster
oid
sE
ph
edri
ne
All
nu
trit
ion
al
sup
ple
men
tsR
esp
on
seC
ho
ice
19
97
(n=
19
7)
20
01
(n=
34
5)
20
05
(n=
71
7)
19
97
(n=
61
)
20
01
(n=
10
0)
20
05
(n=
20
8)
20
01
(n=
52
0)
20
05
(n=
43
3)
20
01
(n=
6,1
91
)
20
05
(n=
5,1
48
)
Sp
ort
inju
ry2
.7%
2.6
%N
/A2
8.3
%1
6.7
%8
.1%
N/A
N/A
N/A
N/A
No
n-s
po
rtin
jury
9.7
%3
.9%
3.4
%2
3.3
%1
1.5
%7
.7%
N/A
N/A
N/A
N/A
Soci
al/
per
son
al
reaso
n2
4.9
%2
7.4
%1
4.1
%N
/AN
/AN
/AN
/AN
/AN
/AN
/A
Imp
rov
em
y a
thle
tic
per
form
an
ce9
.2%
23
.8%
7.4
%4
6.7
%4
2.7
%5
1.0
%2
3.6
%3
0.7
%2
7.3
%3
9.7
%
Imp
rove
my a
pp
eara
nce
N/A
N/A
N/A
N/A
19
.8%
15
.9%
20
.3%
11
.8%
18
.8%
9.8
%
Giv
em
em
ore
ener
gy
21
.1%
21
.5%
27
.9%
N/A
N/A
N/A
N/A
N/A
N/A
N/A
Ap
pet
ite
sup
pre
ssan
t/w
eig
ht
loss
13
.5%
11
.7%
3.9
%N
/A3
.1%
1.1
%2
1.7
%3
6.3
%1
9.7
%2
3.0
%
Oth
erre
aso
n1
8.9
%9
.1%
11
.4%
N/A
N/A
N/A
N/A
N/A
N/A
N/A
To r
ecover
from
inju
ryN
/AN
/AN
/AN
/AN
/AN
/A5
.9%
6.7
%6
.0%
3.5
%
For
hea
lth
reaso
ns
ingen
eral
N/A
N/A
N/A
N/A
N/A
N/A
21
.5%
11
.8%
19
.6%
21
.8%
To p
reven
tin
jury
N/A
N/A
N/A
N/A
6.3
%6
.3%
7.0
%3
.0%
8.6
%2
.2%
Tre
atm
ent
of
att
enti
on
def
icit
dis
ord
erN
/AN
/A3
1.9
%N
/AN
/AN
/AN
/AN
/AN
/AN
/A
*A
llN
/A’s
refl
ect
that
qu
esti
on
sre
gard
ing
that
resp
on
sew
ere
no
task
edin
that
yea
r.*A
ll N
/As
refl
ect t
hat q
uest
ions
reg
ardi
ng th
at r
espo
nse
wer
e no
t ask
ed in
that
yea
r.
35
TA
BL
E1
7
Percen
to
fU
sers’
Resp
on
ses
to t
he
Qu
est
ion
:
“What
isth
eon
em
ain
reaso
nyou
use
_______________?”
Per
centa
ges
Bas
ed o
n T
hose
Who C
onti
nue
to U
se
Alc
oh
ol
Coca
ine/
crack
Mari
juan
a/h
ash
ish
Sp
itto
ba
cco
Res
po
nse
Ch
oic
e1
99
7
(n=
9,2
79
)
20
01
(n=
14
,40
5)
20
05
(n=
14
,04
7)
19
97
(n=
78
)
20
01
(n=
13
9)
20
05
(n=
34
7)
19
97
(n=
1,8
65
)
20
01
(n=
2,8
99
)
20
05
(n=
3,5
76
)
19
97
(n=
1,9
41
)
20
01
(n=
2,3
93
)
20
05
(n=
2,8
94
)
To
im
pro
ve
my
ath
leti
c
per
form
an
ce
0.2
%0
.2%
0.0
%3
.9%
9.2
%6
.3%
0.6
%0
.7%
0.9
%0
.8%
1.4
%2
.0%
Itm
ak
esm
efe
el
go
od
13
.7%
12
.9%
13
.6%
44
.7%
35
.1%
34
.9%
34
.7%
33
.8%
30
.1%
29
.3%
28
.0%
28
.1%
Fo
rre
crea
tion
al
or
soci
al
reaso
ns
83
.4%
83
.9%
82
.6%
42
.1%
53
.4%
53
.6%
61
.2%
60
.4%
63
.0%
54
.4%
47
.9%
46
.8%
To
hel
pm
ed
eal
wit
hth
est
ress
of
coll
ege
life
an
d
coll
ege
ath
leti
cs
2.7
%3
.0%
3.3
%9
.2%
2.3
%5
.2%
3.5
%5
.1%
6.0
%1
5.5
%2
2.8
%2
1.2
%
Hel
ps
me
fit
in
wit
hth
ete
am
N/A
N/A
N/A
N/A
N/A
N/A
N/A
N/A
N/A
N/A
N/A
1.8
%
*A
llN
/A’s
refl
ect
that
qu
esti
on
sre
gard
ing
that
resp
on
sew
ere
no
tas
ked
inth
at
year
.*A
ll N
/As
refl
ect t
hat q
uest
ions
reg
ardi
ng th
at r
espo
nse
wer
e no
t ask
ed in
that
yea
r.
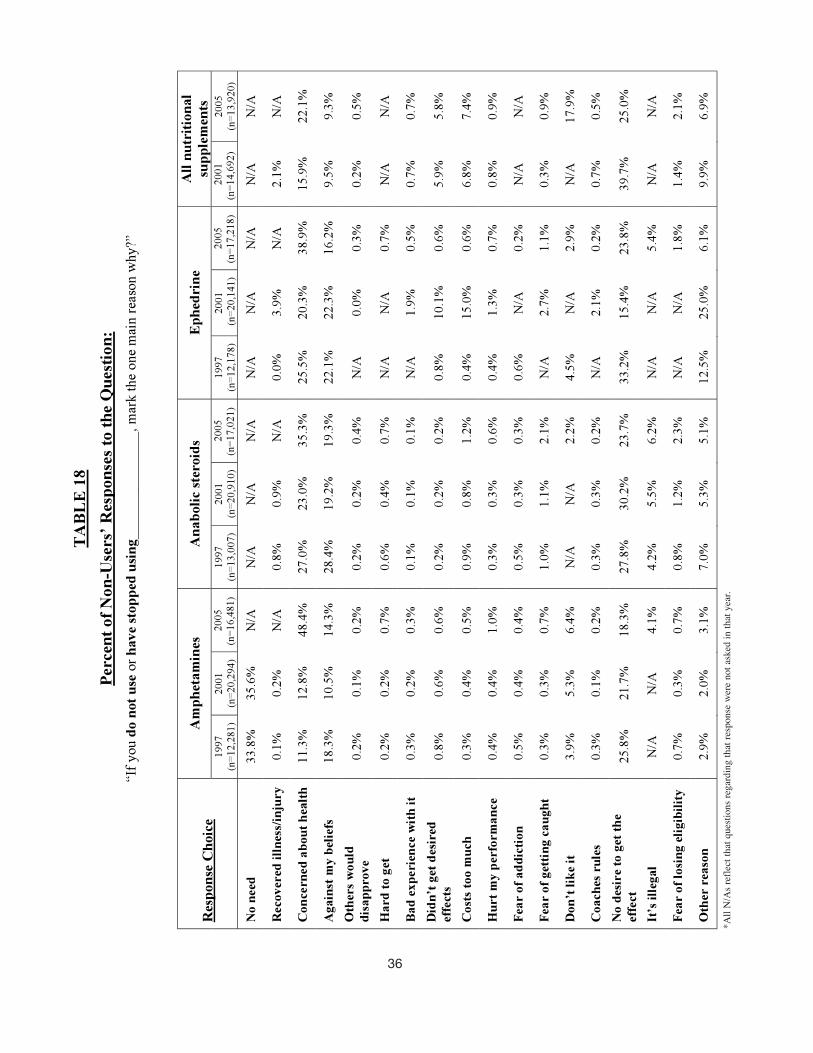
36
TA
BL
E1
8
Perc
ent
of
No
n-U
sers
’R
esp
on
ses
to t
he
Qu
est
ion
:
“If
you d
o n
ot
use
or
ha
ve
sto
pp
edu
sin
g_______________,
mar
kth
eone
mai
n r
easo
n w
hy?”
Am
ph
eta
min
esA
na
bo
lic
ster
oid
sE
ph
edri
ne
All
nu
trit
ion
al
sup
ple
men
tsR
esp
on
seC
ho
ice
19
97
(n=
12
,28
1)
20
01
(n=
20
,29
4)
20
05
(n=
16
,48
1)
19
97
(n=
13
,00
7)
20
01
(n=
20
,91
0)
20
05
(n=
17
,02
1)
19
97
(n=
12
,17
8)
20
01
(n=
20
,14
1)
20
05
(n=
17
,21
8)
20
01
(n=
14
,69
2)
20
05
(n=
13
,92
0)
No
need
33
.8%
35
.6%
N/A
N/A
N/A
N/A
N/A
N/A
N/A
N/A
N/A
Reco
ver
edil
lnes
s/in
jury
0.1
%0
.2%
N/A
0.8
%0
.9%
N/A
0.0
%3
.9%
N/A
2.1
%N
/A
Co
nce
rned
ab
ou
th
ealt
h1
1.3
%1
2.8
%4
8.4
%2
7.0
%2
3.0
%3
5.3
%2
5.5
%2
0.3
%3
8.9
%1
5.9
%2
2.1
%
Ag
ain
stm
yb
elie
fs1
8.3
%1
0.5
%1
4.3
%2
8.4
%1
9.2
%1
9.3
%2
2.1
%2
2.3
%1
6.2
%9
.5%
9.3
%
Oth
ers
wo
uld
dis
ap
pro
ve
0.2
%0
.1%
0.2
%0
.2%
0.2
%0
.4%
N/A
0.0
%0
.3%
0.2
%0
.5%
Ha
rdto
get
0.2
%0
.2%
0.7
%0
.6%
0.4
%0
.7%
N/A
N/A
0.7
%N
/AN
/A
Ba
d e
xp
eri
ence
wit
hit
0.3
%0
.2%
0.3
%0
.1%
0.1
%0
.1%
N/A
1.9
%0
.5%
0.7
%0
.7%
Did
n’t
get
des
ired
effe
cts
0.8
%0
.6%
0.6
%0
.2%
0.2
%0
.2%
0.8
%1
0.1
%0
.6%
5.9
%5
.8%
Co
sts
too
mu
ch0
.3%
0.4
%0
.5%
0.9
%0
.8%
1.2
%0
.4%
15
.0%
0.6
%6
.8%
7.4
%
Hu
rt
my
per
form
an
ce
0.4
%0
.4%
1.0
%0
.3%
0.3
%0
.6%
0.4
%1
.3%
0.7
%0
.8%
0.9
%
Fea
r o
fa
dd
icti
on
0.5
%0
.4%
0.4
%0
.5%
0.3
%0
.3%
0.6
%N
/A0
.2%
N/A
N/A
Fea
r o
fg
etti
ng
cau
gh
t0
.3%
0.3
%0
.7%
1.0
%1
.1%
2.1
%N
/A2
.7%
1.1
%0
.3%
0.9
%
Do
n’t
lik
e it
3.9
%5
.3%
6.4
%N
/AN
/A2
.2%
4.5
%N
/A2
.9%
N/A
17
.9%
Co
ach
esru
les
0.3
%0
.1%
0.2
%0
.3%
0.3
%0
.2%
N/A
2.1
%0
.2%
0.7
%0
.5%
No
des
ire
tog
etth
e
effe
ct2
5.8
%2
1.7
%1
8.3
%2
7.8
%3
0.2
%2
3.7
%3
3.2
%1
5.4
%2
3.8
%3
9.7
%2
5.0
%
It’s
ille
ga
lN
/AN
/A4
.1%
4.2
%5
.5%
6.2
%N
/AN
/A5
.4%
N/A
N/A
Fea
r o
flo
sin
gel
igib
ilit
y0
.7%
0.3
%0
.7%
0.8
%1
.2%
2.3
%N
/AN
/A1
.8%
1.4
%2
.1%
Oth
erre
aso
n2
.9%
2.0
%3
.1%
7.0
%5
.3%
5.1
%1
2.5
%2
5.0
%6
.1%
9.9
%6
.9%
*All
N/A
s re
flec
t tha
t que
stio
ns r
egar
ding
that
res
pons
e w
ere
not a
sked
in th
at y
ear.

37
TA
BL
E1
9
Perc
ent
of
No
n-U
sers
’R
esp
on
ses
to t
he
Qu
est
ion
:
“If
you d
o n
ot
use
or
ha
ve
sto
pp
edu
sin
g_______________,
mar
kth
eone
mai
n r
easo
n w
hy?”
Alc
oh
ol
Coca
ine/
crack
Mari
jua
na
/ha
shis
hS
pit
tob
acc
oP
sych
edel
ics/
ha
llu
cin
og
ens
Res
po
nse
Ch
oic
e2
00
1
(n=
6,2
74
)
20
05
(n=
7,3
52
)
20
01
(n=
20
,44
2)
20
05
(n=
16
,59
3)
20
01
(n=
17
,72
6)
20
05
(n=
14
,83
4)
20
01
(n=
18
,44
7)
20
05
(n=
15
,63
9)
20
01
(n=
19
,97
0)
20
05
(n=
16
,52
1)
Co
nce
rned
ab
ou
th
ealt
h1
8.5
%2
5.9
%3
1.3
%4
7.4
%2
4.1
%3
6.5
%2
2.8
%5
0.2
%2
8.9
%4
6.6
%
Ag
ain
stb
elie
fs1
8.5
%1
4.2
%1
6.5
%1
5.4
%1
3.4
%1
1.5
%7
.6%
9.8
%1
5.0
%1
4.8
%
Oth
ers
wo
uld
dis
ap
pro
ve
1.0
%1
.5%
0.2
%0
.2%
1.0
%1
.4%
0.4
%1
.0%
0.3
%0
.3%
It’s
ha
rd
to
get
0.4
%N
/A0
.3%
0.3
%N
/A0
.5%
N/A
N/A
0.8
%1
.0%
Ha
db
ad
exp
erie
nce
2.9
%5
.0%
0.1
%0
.2%
N/A
1.3
%N
/AN
/A0
.7%
0.5
%
Did
n’t
get
des
ired
effe
cts
0.9
%0
.8%
0.4
%0
.2%
N/A
1.0
%N
/A1
.3%
0.6
%0
.3%
Co
sts
too
mu
ch0
.9%
2.9
%0
.5%
0.7
%0
.7%
0.7
%0
.3%
0.8
%0
.5%
0.4
%
Hu
rt
my
per
form
an
ce
5.0
%1
0.2
%0
.4%
0.7
%2
.5%
2.9
%0
.4%
1.3
%0
.5%
0.7
%
Afr
aid
of
ad
dic
tio
n0
.9%
1.4
%1
.0%
0.9
%1
.2%
1.0
%0
.7%
1.4
%0
.4%
0.3
%
Afr
aid
of
get
tin
gca
ug
ht
1.7
%3
.4%
0.3
%0
.5%
5.2
%5
.5%
N/A
N/A
0.7
%0
.6%
Id
on
’t l
ike
it1
0.1
%9
.5%
4.3
%4
.4%
10
.0%
8.9
%2
0.9
%2
5.4
%5
.3%
5.0
%
Co
ach
es’
rule
s2
.7%
4.2
%0
.1%
0.1
%0
.6%
0.4
%0
.1%
0.3
%0
.2%
0.1
%
No
des
ire
for
eff
ect
16
.7%
7.5
%3
1.4
%1
9.8
%2
7.1
%1
5.2
%3
1.2
%N
/A3
1.9
%2
0.6
%
It’s
ille
ga
l/u
nd
er
21
2.0
%7
.5%
2.4
%6
.5%
N/A
7.5
%N
/AN
/A2
.1%
5.8
%
Fea
r o
flo
sin
gel
igib
ilit
yN
/A1
.8%
0.2
%0
.4%
N/A
2.9
%N
/AN
/A0
.3%
0.5
%
Oth
erre
aso
n4
.5%
4.1
%2
.1%
2.4
%3
.1%
2.8
%3
.6%
8.8
%2
.4%
2.6
%
*All
N/A
s re
flec
t tha
t que
stio
ns r
egar
ding
that
res
pons
e w
ere
not a
sked
in th
at y
ear.

38
TA
BL
ES
20 A
ND
21
So
urc
eso
fE
rgo
gen
icD
rug
s
Per
centa
ges
Bas
ed o
n T
hose
Who C
onti
nue
to U
se
Am
ph
eta
min
esA
na
bo
lic
ster
oid
sN
utr
itio
na
l
sup
ple
men
tsR
esp
on
seC
hoic
e1
99
7
(n=
19
7)
20
01
(n=
34
5)
20
05
(n=
75
1)
19
97
(n=
61
)
20
01
(n=
10
0)
20
05
(n=
20
9)
20
01
(n=
6,1
91
)
20
05
(n=
5,6
32
)
Coach
or
train
er2
.2%
2.4
%5
.4%
3.8
%1
2.0
%1
6.8
%4
.8%
8.7
%
Tea
mp
hy
sici
an
1.1
%0
.3%
3.7
%5
.7%
5.0
%4
.3%
0.3
%0
.6%
Oth
erp
hy
sici
an
29
.0%
10
.1%
25
.4%
32
.1%
15
.0%
9.1
%1
.2%
1.6
%
Tea
mm
ate
or
oth
erath
lete
4.9
%6
.7%
8.5
%2
0.8
%7
.4%
15
.3%
1.5
%2
.8%
Fri
end
or
rela
tiv
e4
0.4
%4
2.3
%4
7.7
%1
7.0
%1
9.0
%2
5.4
%9
.0%
11
.2%
Pro
sco
ut/
ag
ent
2.7
%2
.0%
0.8
%9
.4%
3.0
%5
.3%
0.1
%0
.4%
Oth
erso
urc
e1
9.7
%2
9.6
%1
1.0
%1
1.3
%1
1.0
%8
.6%
1.4
%1
3.7
%
Str
eng
thco
ach
N/A
N/A
1.5
%N
/A2
.0%
1.4
%5
.2%
8.0
%
Web
site
/ma
ilo
rder
N/A
N/A
2.8
%N
/A5
.0%
22
.0%
3.5
%1
3.2
%
Ret
ail
store
N/A
N/A
N/A
N/A
15
.0%
11
.5%
58
.7%
69
.4%
Sou
rces
of
Soci
al
Dru
gs
Per
centa
ges
Bas
ed o
n T
hose
Who C
onti
nue
to U
se
Co
cain
e/cr
ack
Ma
riju
an
a/h
ash
ish
Psy
ched
elic
s/
ha
llu
cin
og
ens
Res
pon
seC
ho
ice
19
97
(n=
78
)
20
01
(n=
13
9)
20
05
(n=
35
6)
19
97
(n=
1,8
65
)
20
01
(n=
2,8
99
)
20
05
(n=
3,6
30
)
19
97
(n=
38
2)
20
01
(n=
51
9)
20
05
(n=
41
2)
Tea
mm
ate
or
oth
erath
lete
5.3
%1
1.5
%1
7.4
%9
.1%
13
.1%
20
.2%
7.4
%9
.4%
11
.9%
Fri
end
or
rela
tiv
e7
0.7
%5
6.8
%7
3.3
%8
1.3
%7
1.0
%7
6.3
%8
0.4
%7
1.5
%7
3.8
%
Pro
sco
ut/
ag
ent
N/A
N/A
7.3
%N
/AN
/A1
.8%
N/A
N/A
5.6
%
Oth
erso
urc
e2
4.0
%1
8.0
%1
1.5
%9
.6%
12
.5%
13
.3%
12
.2%
14
.8%
17
.5%
*All
N/A
s re
flec
t tha
t que
stio
ns r
egar
ding
that
res
pons
e w
ere
not a
sked
in th
at y
ear.
39
STUDENT-ATHLETE QUESTIONNAIRE
40
STUDENT-ATHLETE QUESTIONNAIRE
This questionnaire is part of a nationwide study of college student-athletes. The questions ask about youropinions and experiences with alcohol and other drugs.
If this study is to be helpful, it is important that you answer each question thoughtfully and honestly. If youfind a question that you feel you cannot answer honestly, we would prefer that you leave it blank. All youranswers will be kept strictly confidential and anonymous. Only the researchers will see the completedquestionnaires. Also, only national questionnaire results will be reported -- no individual athlete, team, orschool results. It will be impossible for anyone to identify your answers.
Your participation in this study is voluntary. You can omit answers to any question or discontinue yourparticipation in the study at any time without penalty. Your voluntary completion of this questionnaireconstitutes your informed consent to participate in the study.
Be sure to read the instructions carefully before you begin. If you have any questions, ask the individualadministering the survey. Thank you for your help in this important national study.
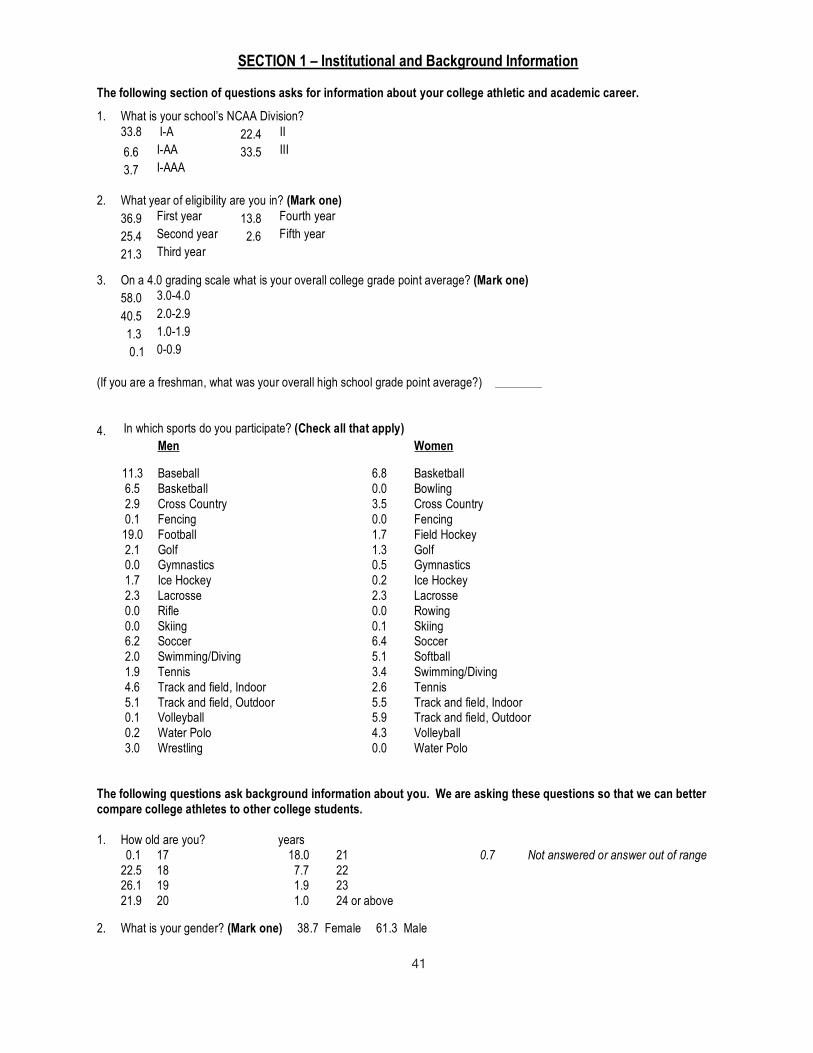
41

42
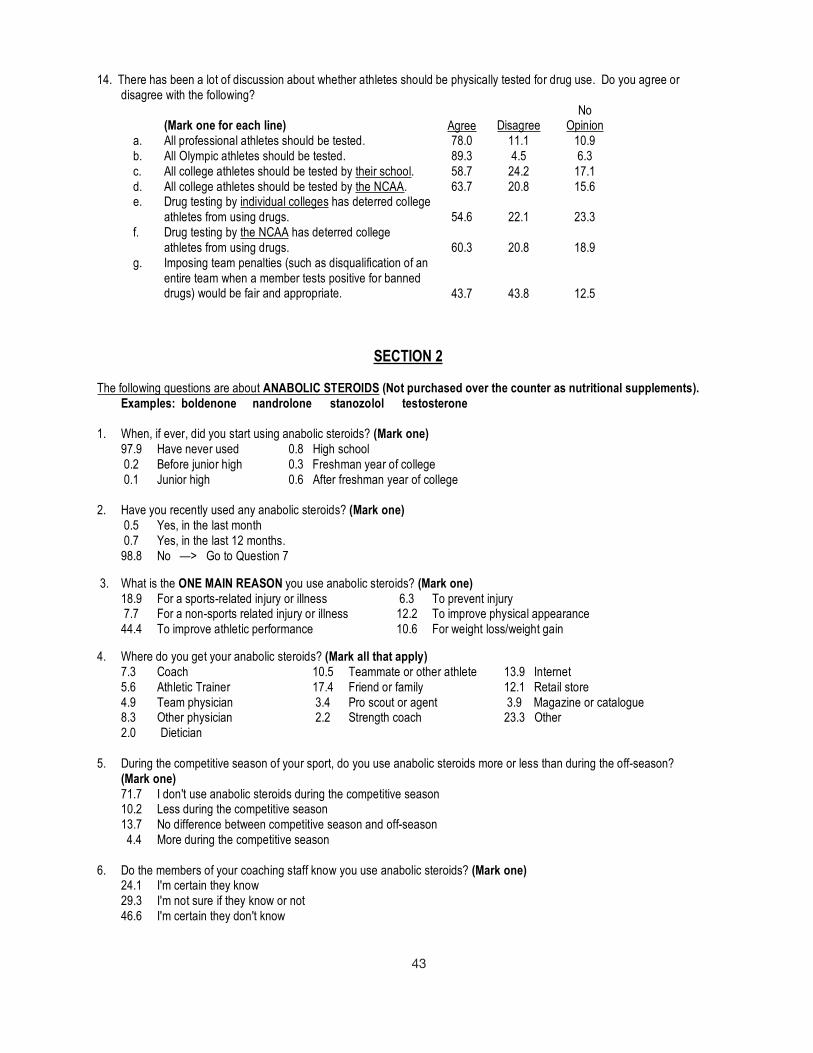
43

44

45

46

47

48
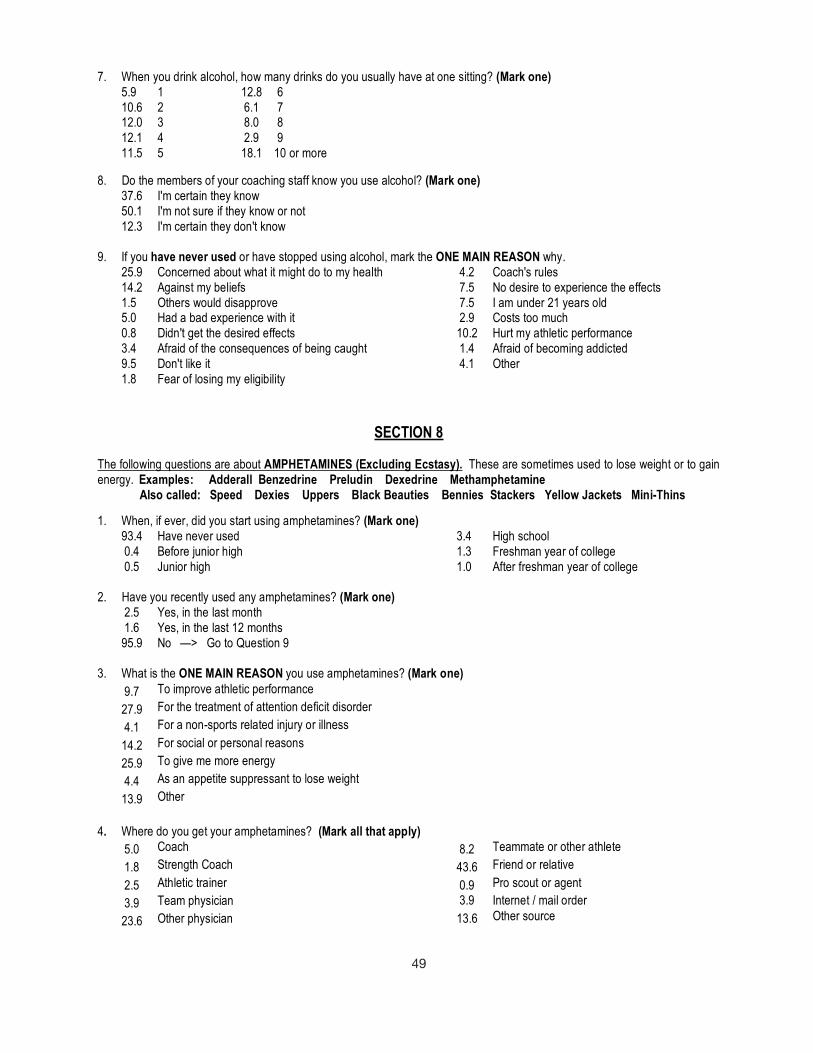
49
50

51
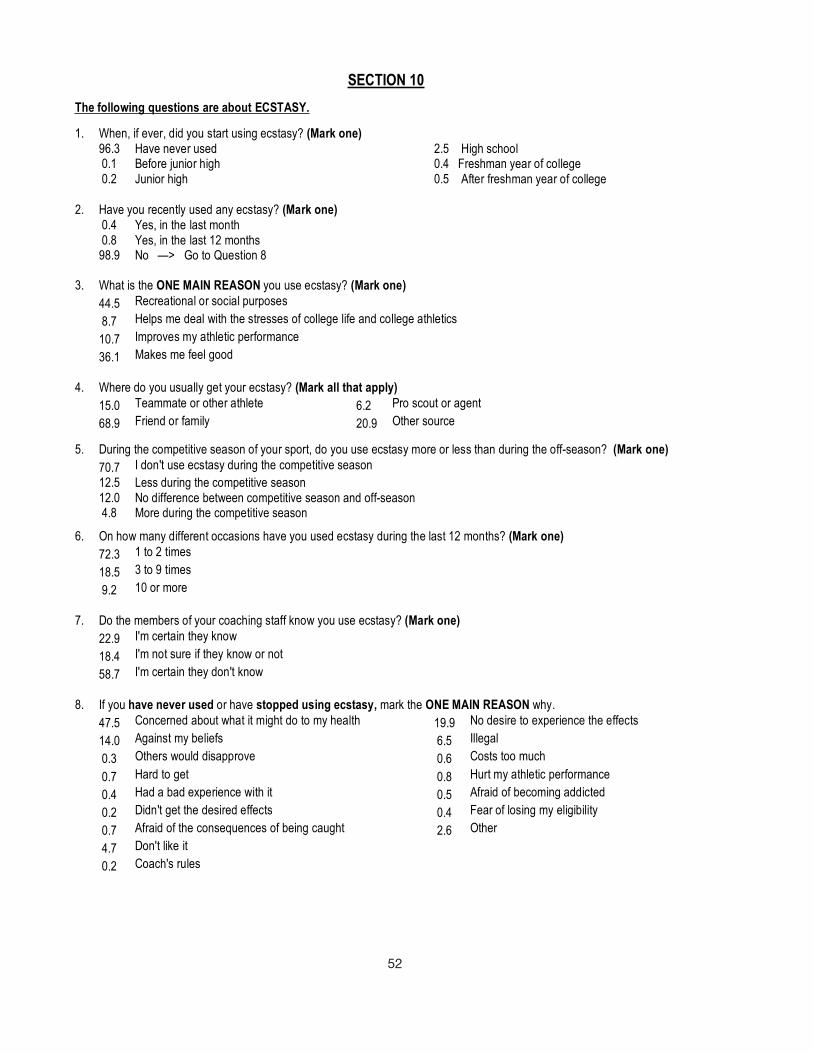
52

53
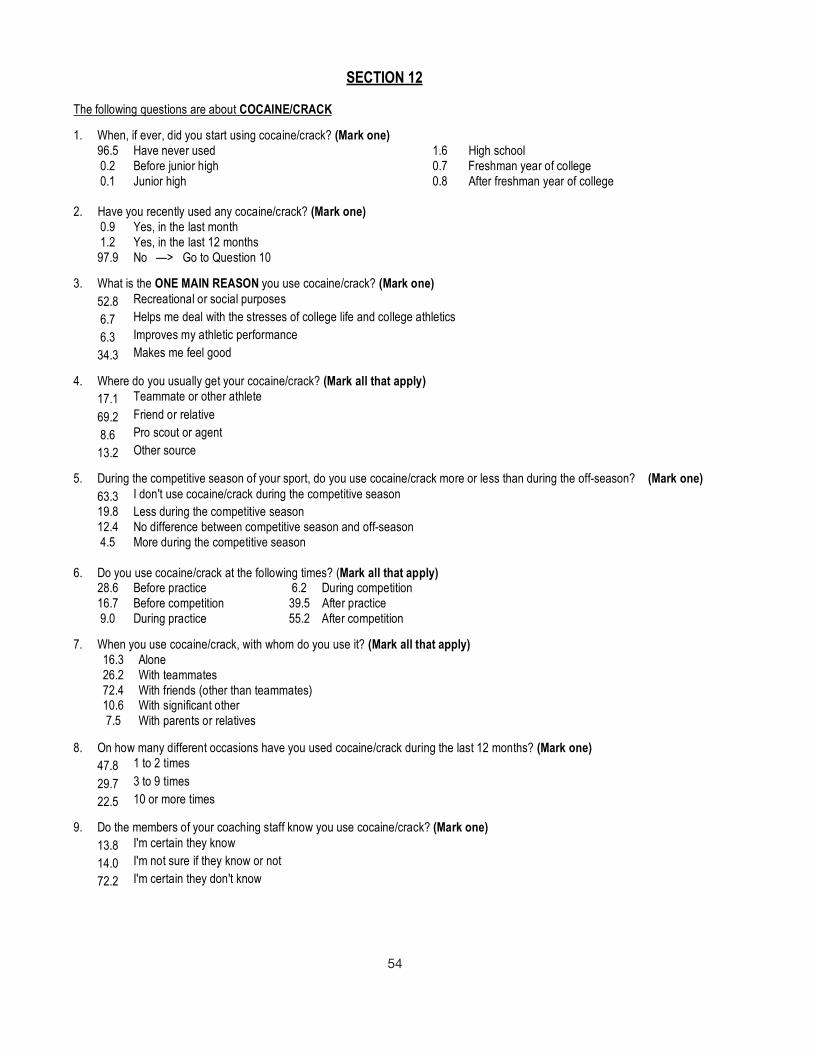
54

55

56

57

58

59

60
NCAA Study ofSubstance Use of College Student-Athletes
SU
BS
TAN
CE
US
E
NCAA 54814-3/06 SU 06