2006 annual report - s1.q4cdn.coms1.q4cdn.com/857957299/files/doc_financials/2006ar.pdfbased on a...
TRANSCRIPT

2006 Annual Report
Pure CopperBased on a proven track record of building andoperating low cost mining, mineral processing andmetal refining operations in Africa, First Quantum is committed to achieving positive returns for itsshareholders while promoting the health, safety and development of its employees and enriching theenvironment and communities in which it operates.
FIR
ST
QU
AN
TUM
MIN
ER
ALS
LTD
.
20
06
AN
NU
AL
RE
PO
RT
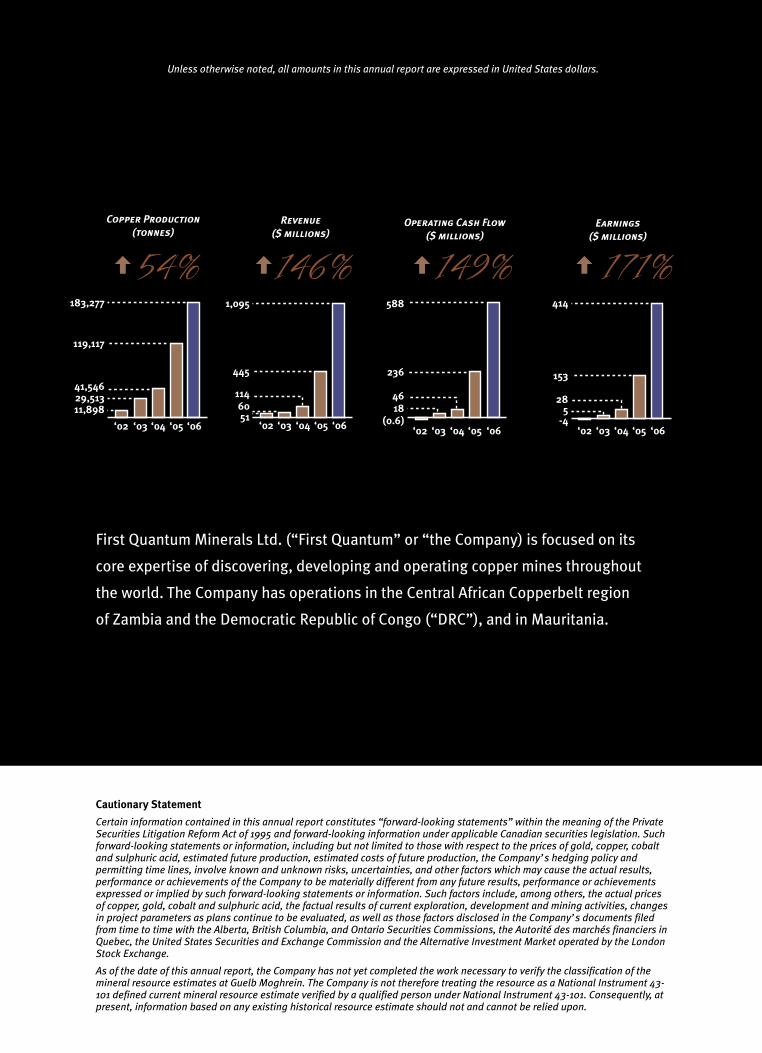
Copper Production(tonnes)
Revenue ($ millions)
Operating Cash Flow($ millions)
Earnings ($ millions)
First Quantum Minerals Ltd. (“First Quantum” or “the Company) is focused on its
core expertise of discovering, developing and operating copper mines throughout
the world. The Company has operations in the Central African Copperbelt region
of Zambia and the Democratic Republic of Congo (“DRC”), and in Mauritania.
Cautionary Statement
Certain information contained in this annual report constitutes “forward-looking statements” within the meaning of the PrivateSecurities Litigation Reform Act of 1995 and forward-looking information under applicable Canadian securities legislation. Suchforward-looking statements or information, including but not limited to those with respect to the prices of gold, copper, cobaltand sulphuric acid, estimated future production, estimated costs of future production, the Company’s hedging policy andpermitting time lines, involve known and unknown risks, uncertainties, and other factors which may cause the actual results,performance or achievements of the Company to be materially different from any future results, performance or achievementsexpressed or implied by such forward-looking statements or information. Such factors include, among others, the actual pricesof copper, gold, cobalt and sulphuric acid, the factual results of current exploration, development and mining activities, changesin project parameters as plans continue to be evaluated, as well as those factors disclosed in the Company’s documents filedfrom time to time with the Alberta, British Columbia, and Ontario Securities Commissions, the Autorité des marchés financiers inQuebec, the United States Securities and Exchange Commission and the Alternative Investment Market operated by the LondonStock Exchange.
As of the date of this annual report, the Company has not yet completed the work necessary to verify the classification of themineral resource estimates at Guelb Moghrein. The Company is not therefore treating the resource as a National Instrument 43-101 defined current mineral resource estimate verified by a qualified person under National Instrument 43-101. Consequently, atpresent, information based on any existing historical resource estimate should not and cannot be relied upon.
Unless otherwise noted, all amounts in this annual report are expressed in United States dollars.
‘02 ‘05 ‘06
41,546
119,117
183,277
‘02 ‘05 ‘06
114
445
1,095
‘04 ‘06
46
236
588
‘02 ‘05 ‘06
28
153
414
29,51311,898
‘04‘03 ‘04‘03
6051
‘05‘03‘02
18(0.6)
‘04‘03
5-4
54% 146% 149% 171%
Officers & Directors
Philip K. R. Pascall 4
Chairman of the Board, Chief Executive Officer, Director
G. Clive Newall 4
President, Director
Martin R. RowleyExecutive Director of Business Development, Director
David E. J. MoroneyChief Financial Officer
Andrew C. HancharykGeneral Counsel and Corporate Secretary
Andrew B. Adams 1, 2, 3
Lead Independent Director
Rupert Pennant-Rea 1, 2, 3, 4
Independent Director
Peter St George 1, 2, 3
Independent Director
1 Member of Audit Committee
2 Member of Compensation Committee
3 Member of Nominating and Governance Committee
4 Member of Environmental, Health and Safety Committee
AuditorsPricewaterhouseCoopers LLP7th Floor – 250 Howe StreetVancouver, BC Canada V6C 3S7
Transfer Agent & RegistrarComputershare Investor Services Inc.3rd Floor – 510 Burrard StreetVancouver, BC Canada V6C 3B9
Shares ListedToronto Stock Exchange – Symbol FMMember of S&P/TSX Composite Index
London Stock Exchange – Symbol FQM
Listed in Standard & Poor’s12g3-2b-82-4461
CUSIP #335934-10-5
Head Office & Investor Relations8th Floor – 543 Granville StreetVancouver, British Columbia, Canada V6C 1X8Tel: +1 604 688 6577Toll Free: +1 888 688 6577Fax: +1 604 688 3818Website: www.first-quantum.comE-mail: [email protected]
Representative OfficesUnited Kingdom 1st Floor, Mill House, Mill Bay LaneHorsham, West Sussex, England RH12 1SSTel: +44 140 327 3484 Fax: +44 140 327 3494
Australia PO Box 1407Level 1, 24 Outram StreetWest Perth, Western Australia 6005 AustraliaTel: +618 9346 0100 Fax: +618 9226 2522
Zambia P.O. Box 230022 Ndola, Zambia Tel: +260 2 651 555 Fax: +260 2 651 553
Democratic Republic of Congo 88, Avenue Kabalo B.P. 400 Lumbashi/Katnga Democratic Republic of Congo Tel: +243 97 031133 Fax: +243 23 42212
Corporate Directory
DE
SIG
N B
Y X
Y3
DE
SIG
N +
CO
MM
UN
ICAT
ION
S I
NC
. P
RIN
TED
IN
CA
NA
DA

FIRST QUANTUM MINERALS LTD. 2006 ANNUAL REPORT 1
2006 Highlights• Net earnings of $414.4 million ($6.37 per share)
• Operating cash flow of $588.2 million ($9.04 per share)
• Copper production for the year of 183,277 tonnes (403.9 million pounds)
• Realized copper price of $2.82 per pound
• Group cash costs of $0.87/lb and total costs of $1.09/lb
• Commercial production began at Guelb Moghrein in Mauritania
• Acquired Adastra Minerals Inc. and its Kolwezi copper-cobalt tailings project
• Frontier project on track for commercial start up in third quarter of 2007
• High pressure leach project at Kansanshi commenced commissioning
• Established new $400 million corporate credit facility
• Dividends of $20.1 million paid to Company shareholders

FIRST QUANTUM MINERALS LTD. 2006 ANNUAL REPORT
CORPORATE PROFILE
2
Corporate ProfileFirst Quantum is a growing mining and metals company whose principle activities include mineralexploration, development and mining. The Company produces LME grade “A” copper cathode, copperin concentrate, gold and sulphuric acid.
The Company’s operations in Zambia include the 100% owned Bwana Mkubwa SX/EW facility andsulphuric acid plants and the 80% owned Kansanshi open pit copper-gold mine. First Quantum alsoholds strategic investments in the Nkana underground copper mine and cobalt refinery (16.9%); andthe Mufulira underground copper mine, smelter and copper refinery (16.9%) in Zambia.
In the Democratic Republic of Congo, First Quantum operates the 100% owned Lonshi open pit coppermine which provides oxide copper ore for processing at Bwana Mkubwa, a 95% interest in the Frontiercopper deposit, and a 65% interest in the Kolwezi copper-cobalt tailings project.
In Mauritania, First Quantum operates the 80% owned Guelb Moghrein copper gold mine.
80% 100% 80% 95% 16.9% 65%
Kansanshi Bwana/Lonshi Guelb Frontier Mopani Kolwezi
FIRST QUANTUM MINERALS LTD. 2006 ANNUAL REPORT 3
SHAREHOLDER INFORMATION
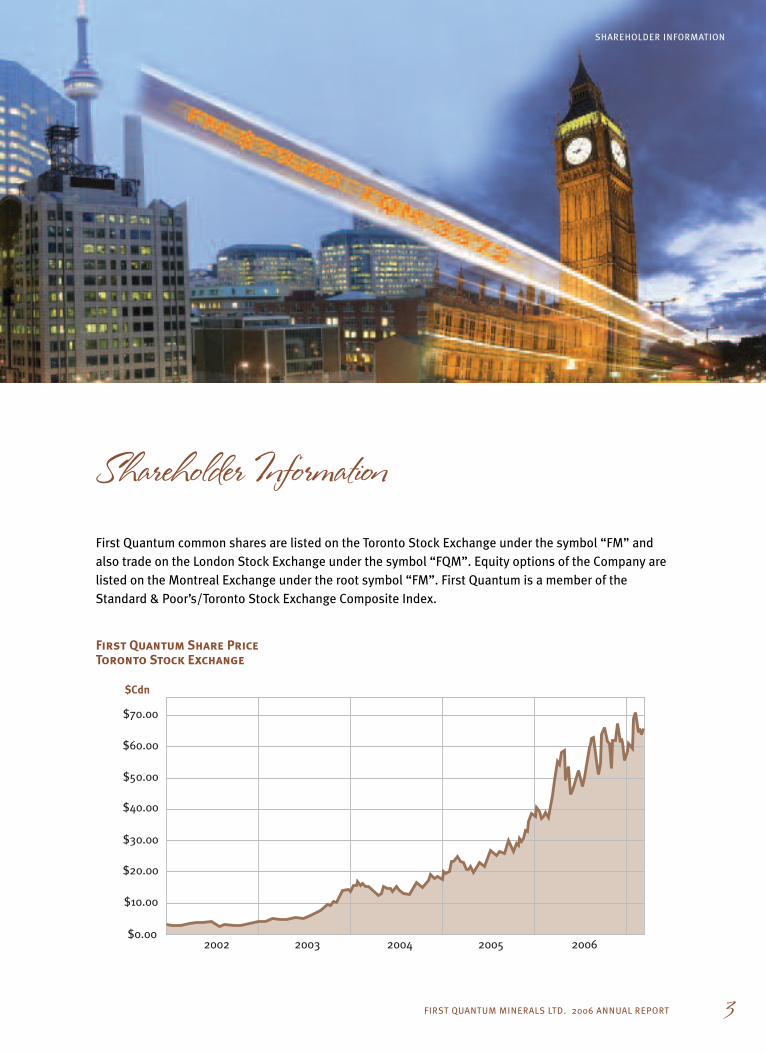
$60.00
$50.00
$40.00
$30.00
$20.00
$10.00
2003 2004 2005 2006$0.00
2002
$70.00
Shareholder InformationFirst Quantum common shares are listed on the Toronto Stock Exchange under the symbol “FM” andalso trade on the London Stock Exchange under the symbol “FQM”. Equity options of the Company arelisted on the Montreal Exchange under the root symbol “FM”. First Quantum is a member of theStandard & Poor’s/Toronto Stock Exchange Composite Index.
First Quantum Share PriceToronto Stock Exchange
$Cdn

FIRST QUANTUM MINERALS LTD. 2006 ANNUAL REPORT
COPPER – THE RED METAL
4
Copper has been used for over 7,000
years. Worldwide copper consumption
continues to increase every year.
Copper is traded around the world with
the principal trading occurring on the
London Metal Exchange.

FIRST QUANTUM MINERALS LTD. 2006 ANNUAL REPORT 5
COPPER – THE RED METAL
Commercial sources of copper are found indeposits formed under the earth’s surface as theresult of early volcanic disturbances. Primaryores, called sulphide ores, formed when moltensolutions flowed into the earth’s crust.Secondary ores, called oxide ores, were formedas weather and other natural forces alteredancient rocks. Both sulphide and oxide ores aremined and processed to extract copper metal.After hundreds of years of exploration andmining, new copper deposits are becoming muchmore difficult to find.
Wiring – Connecting the World
Copper has several important properties: highductility, malleability and electrical conductivity,each of which make it a “natural” for electricalwiring. More than any other non-precious metal,it is the best conductor of electricity, packingmore power into a given diameter of wire thanany substitute material. Electrical uses includepower transmission and generation, wires forresidential and commercial buildings,telecommunications and electrical products.
Plumbing, Heating and Cooling
For the last 100 years, copper tubing has beenthe most reliable and cost effective option fordistributing water to and throughout residentialand commercial buildings. Copper tubing is alsowidely used in air conditioning and refrigerationsystems due to its high thermal conductivitywhich is about eight times more efficient thanthat of aluminum tubing.
Technology – Computer Chips
Manufacturers of computer chips rely on copper tolink transistors. By substituting higher conductivitycopper for aluminum, chip makers can createmore efficient and faster products. In addition toincreasing a chip’s speed, use of copper helpslimit heat generation, a problem which will growas more circuits are packed into a single chip.
Automobiles
There are more than 55 pounds of copper in atypical U.S.-built automobile: about 45 poundsfor electrical and about 10 pounds for non-electrical components. Thanks to continuingimprovements in electronics and the addition ofpower accessories, today's luxury autos, onaverage, contain some 1,500 copper wirestotalling about one mile in length. New hybridcars contain approximately 100 pounds ofcopper. In 1948, the average family carcontained only about 55 wires with an averagetotal length of 150 feet.
Copper – the Red Metal
$1.00
02 03 04 05 06 07
$2.00
$3.00
$4.00
$5.00
Copper Price (US$/pound)London Metal Exchange

FIRST QUANTUM MINERALS LTD. 2006 ANNUAL REPORT
LETTER TO SHAREHOLDERS
6
Letter to Shareholders2006 was an exceptional year for First Quantum. With the Kansanshi mine operating for its first fullyear, copper production increased to 183,277 tonnes, a 54% increase over 2005. Record copperproduction, when matched with an average realized copper price of $2.82 per pound resulted inrevenues of $1.1 billion, operating cash flow of $588 million and earnings of $414 million.
Commensurate with our goal of returning a minimum of 10% of net profits to shareholders, theCompany paid Cdn $0.36 per share in dividends in 2006. In May 2007, a further dividend of Cdn $0.625per share was paid in respect to the Company’s financial performance in 2006. In addition to thedividend, our shareholders were rewarded with a 68% increase in First Quantum’s share price duringthe year.
In 2007, copper production is expected to grow to approximately 240,000 – 250,000 tonnes, a 31% to36% increase over 2006. While copper prices are now lower than the spectacular highs reached in2006, we believe that the price of copper will remain strong by historical measures as the industrystruggles to meet new copper demand.
State of the IndustryEach year in my letter to shareholders, I try to provide some insight into the challenges faced by themining industry.
Demand for commodities remains strong. The mining industry continues to suffer from an acuteshortage of qualified people at all levels. The competition for human resources between miningcompanies is fierce and unremitting. This is symptomatic of an industry that is stretched to its limits.The mining industry is supported by an aging workforce of geologists and engineers and it will requirea generation to reinvigorate itself. Suppliers of equipment to the industry face the same constraints.There is no simple solution to fix this “human capital” problem. It will continue to be the majorconstraint faced by the mining industry in the discovery, development and construction of new projectsto meet demand for the commodities produced.

FIRST QUANTUM MINERALS LTD. 2006 ANNUAL REPORT 7
LETTER TO SHAREHOLDERS
The procurement of mining and processing equipment continues to be difficult with large capital itemsrequiring order lead times in some cases of more than two years. This makes mine developmentdecisions far more complex because of the increased exposure to commodity price fluctuations beforecommercial production begins. Inflation continues to have an impact, with the price of consumablesand services, currently rising at a rate of approximately 10% per annum.
The political environments in the countries in which we operate are also changing. With theimprovement in commodity prices, the aspirations of people change. Political pressure is brought tobear on the government to seek more from the companies operating in their country. This pressure canbe difficult to resist and we have already begun to see proposals to increase royalties and tax rates inZambia. At each of our operations we have signed development agreements providing stability on longterm parameters such as royalty and tax rates. These were established as an incentive to invest at atime of much lower commodity prices resulting in a reluctance by mining companies to invest. Wehowever remain confident in and supportive of the respective governments in the countries in whichwe operate.
As I point out every year, our achievements over the last several years are a credit to the qualities ofour excellent team of technical professionals and management. Without high quality people therichest deposit cannot be developed successfully. Therefore we will continue with our long term policyof seeking out, recruiting, developing and motivating the best people in the industry. Our performanceis a testament to the value of this policy and our success in achieving it.
Kansanshi Copper-Gold MineDuring the year, orders were placed for more mining equipment. It was discovered that more oreblending for both the oxide and sulphide ores was needed to accommodate variations in grade,hardness and acid consumption. The purpose of the additional mining equipment is to improve theflexibility in the pit by providing additional ore exposure. Some of this equipment arrived in mid 2006and has already increased the exposure of additional high grade oxide ore and has offset thecontinuing impact of lower grade sulphide ore on copper production.
Construction of a second sulphide crushing and milling circuit expansion is currently underway. Thiswill increase sulphide throughput to 12 million tonnes per year beginning in 2008 and assist in treatingthe harder ore encountered in areas of the pit resulting in increases in copper production from 2008onwards.
The Company is also investing in a high pressure leach (“HPL”) facility to treat a portion of the increasedcopper concentrate production. The main components of the HPL facility are two autoclaves, an oxygenplant and an additional 35,000 tonne per annum solvent extraction and electrowinning (“SX/EW”)facility. The HPL facility is expected to begin commercial operation during the first half of 2007.

FIRST QUANTUM MINERALS LTD. 2006 ANNUAL REPORT
LETTER TO SHAREHOLDERS
8
Guelb Moghrein Copper-Gold MineAt Guelb Moghrein, the first copper in concentrate was produced in July 2006. Commercial productionwas achieved on October 5, 2006. The mine is expected to reach its design capacity of 30,000 tonnesof copper and 70,000 ounces of gold per year during the first half of 2007.
Bringing the Guelb Moghrein mine into production could not have been achieved without theGovernment of the Islamic Republic of Mauritania's initiative of supporting new investment in themining industry. The successful development of Guelb Moghrein is a credit to our project team andmine management team. Furthermore, this project establishes the Company’s capability to developmineral deposits outside of the Copperbelt region.
Bwana Processing Centre/Lonshi Copper MineBwana/Lonshi had a record year producing 51,068 tonnes of copper cathode. The remaining mine lifeof Lonshi is approximately 1 1/2 years. The challenge in 2007 will be to determine the best use of theBwana process plant upon depletion of the Lonshi reserve.
Frontier Copper DepositConstruction began at Frontier in April 2006. In November, the Company announced the details of theconstruction of a $226 million facility producing an average of 73,000 tonnes of copper in concentrateper year over a mine life of 19 years. Commissioning is expected to begin in the third quarter of 2007.
Kolwezi Copper-Cobalt DepositIn 2006, the Company acquired 100% of Adastra Minerals Inc. (“Adastra”) for $273 million. Adastrawas a public international mining company with its principal asset being 65% of the Kolwezi copper-cobalt tailings project located in the DRC.
The Company has conducted metallurgical test work and a piloting program for revised processengineering. The Company is considering the construction of an initial 35,000 tonne per year copperfacility and 5,800 tonne per year cobalt facility which would be designed to be expanded to 105,000tonnes of copper per year and 17,400 tonnes of cobalt per year. Initial road and earth worksconstruction are expected to begin in 2007.
OutlookThe Company expects to produce approximately 240,000 – 250,000 tonnes of copper in 2007, which isan increase of 31% to 36% over 2006 copper production. This expected production includesapproximately 145,000 tonnes from Kansanshi, approximately 45,000 tonnes from Bwana/Lonshi,approximately 30,000 tonnes from Guelb Moghrein, and approximately 30,000 tonnes from Frontier.

FIRST QUANTUM MINERALS LTD. 2006 ANNUAL REPORT 9
LETTER TO SHAREHOLDERS
Group cash costs are expected to be in the range of $0.90 to $0.95 per pound of copper for 2007before considering the impact of the accounting change for the removal of deferred stripping. TheFrontier project will begin production in 2007 and construction will also begin at the Kolwezi project.We continue to develop a pipeline of development projects which will ensure the Company continuesto grow as it has in the past.
Our exploration efforts will continue in the Copperbelt and we are confident that we can expect furthersuccess in the future. Finally, we will maintain our strategy of seeking acquisition opportunities towhich we believe First Quantum can add value both through our strong financial position and technicalexpertise.
Objectives For 2007The principal objectives for 2007 are:
• Health, Safety and the Environment – continue to promote the health, safety and development of our employees and to enrich the environment and communities in which we operate
• Bwana/Lonshi – secure future ore feed to extend the use of this excellent facility after Lonshi’sdepletion
• Kansanshi – bring HPL to commercial production; construct and commission the sulphide circuitexpansion
• Guelb Moghrein – de-bottleneck and fine tune production• Frontier – complete construction, commission and begin commercial production• Kolwezi – finalize engineering design and begin construction• Kashime – complete oxide resource estimate• Exploration – continue to evaluate prospects in Zambia, the DRC and Mauritania
A Message of ThanksI would like to thank all of those who have contributed to the success of First Quantum during 2006.While our employees, with their management and technical expertise, have been the main engine forour growth, we also acknowledge the important role played by the governments of Zambia, the DRCand Mauritania.
Finally, I would like to thank the members of the Board for their diligence, support and enthusiasm.
Philip K. R. PascallChairman & CEO

FIRST QUANTUM MINERALS LTD. 2006 ANNUAL REPORT
FINANCIAL HIGHLIGHTS
10
Financial Highlights2006 2005 2004 2003 2002 (1)
Financial Results ($000’s)
Revenue $1,094,483 $444,614 $113,523 $60,454 $51,095Operating profit $773,816 $256,165 $48,880 $11,394 ($839)Net earnings (loss) $414,386 $152,818 $28,010 $4,582 ($3,791)
Cash Flow ($000’s)
Operating cash flow(before changes in non-cash working capital) $588,185 $236,127 $46,263 $18,052 ($624)
Net capital expenditures and investments $363,734 $164,796 $206,105 $40,254 $28,221Repayment of principal on long term debt $251,507 $39,819 $17,401 $29,490 $14,721Dividends paid $20,151 – – – –
Financial Position ($000’s)
Total assets 1,744,423 $746,511 $473,061 $162,135 $97,824Total liabilities (incl. minority interest) $809,322 $435,070 $315,221 $80,512 $44,297Shareholders’ equity $935,101 $311,441 $157,840 $81,623 $53,527Weighted average shares outstanding 65,088 61,498 60,123 50,668 43,363
Per Share
Cash flow from operations(before changes in non-cash working capital) $9.04 $3.84 $0.77 $0.36 ($0.01)
Earnings (loss) $6.37 $2.48 $0.47 $0.09 ($0.09)Dividend (Cdn$) $0.36 – – – –
1. In 2002, the Company changed its year end to Dec. 31, 2002, therefore, the figures presented in 2002 represent 13 months.

FIRST QUANTUM MINERALS LTD. 2006 ANNUAL REPORT 11
PRODUCTION HIGHLIGHTS
Production Highlights2006 2005 2004 2003 2002 (1)
Summary
Attributable copper production (tonnes) (2) 183,277 119,117 41,546 29,513 11,878Realized copper price (US$/lb) (3) 2.82 1.66 1.13 0.75 0.65Cash cost copper (US$/lb) 0.87 0.67 0.46 0.44 0.27Total cost copper (US$/lb) 1.09 0.86 0.62 0.62 0.52Sulphuric acid sold (tonnes) 2,363 22,327 66,460 75,228 88,198Gold sold (ounces) 33,497 14,266 – – –
Kansanshi Mine
Copper production (tonnes) 127,179 69,579 – – –Cash cost copper (US$/lb) 0.91 0.63 – – –Total cost copper (US$/lb) 1.09 0.79 – – –Gold sold (ounces) 30,751 14,266 – – –
Bwana/Lonshi Mine
Copper production (tonnes) 51,068 49,538 41,546 29,513 11,878Cash cost copper (US$/lb) 0.76 0.68 0.46 0.44 0.27Total cost copper (US$/lb) 1.04 0.93 0.62 0.62 0.52Sulphuric acid sold (tonnes) 2,363 22,327 66,460 75,228 88,198
Guelb Moghrein Mine
Copper production (tonnes) 5,031 – – – –Cash cost copper (US$/lb) 1.69 – – – –Total cost copper (US$/lb) 2.18 – – – –Gold sold (ounces) 2,746 – – – –
1. In 2002, the Company changed its year end to Dec. 31, 2002; therefore, the figures presented above represent 13 months
2. During 2002, the Company elected to dilute its interest in Carlisa investments, through which the Mopani interest is held,from 49% to 18.8%. Accordingly, the Company no longer consolidates its investment and now accounts for it on a costbasis. As a result, the Company does not attribute any copper or cobalt production from Mopani in its production statisticssince 2001.
3. The realized copper price is calculated by deducting treatment and refining charges and freight parity charges from theselling price achieved before realization charges.
4. First Quantum has adopted the following Brook Hunt definitions for mine cost categories:
Cash costs are operating costs, including mining, processing, realization charges, site administration; net of by productcredits.
Total costs are total production costs, including operating costs (cash costs); depreciation and amortization charges;royalties, related head office and interest costs.

FIRST QUANTUM MINERALS LTD. 2006 ANNUAL REPORT
THE COPPERBELT
12

FIRST QUANTUM MINERALS LTD. 2006 ANNUAL REPORT 13
THE COPPERBELT
The CopperbeltThe Copperbelt is an arcuate zone, 600 kilometres long by 50 kilometres wide, containing one of theworld’s greatest concentrations of copper and cobalt deposits. The arc of the deposits extends fromNdola, Zambia in the east stretching across the border into the DRC, back into the northwest portion ofZambia, and west into Angola.
The Copperbelt deposits are truly exceptional on a world scale with most having original resourcesmeasuring hundreds of millions of tonnes of ore with grades greater than 2% copper. For example,Nchanga in Zambia contained 450 million tonnes at 4% copper, while the cobalt rich Kolwezi district inthe DRC totalled over 600 million tonnes at a grade of 7% copper equivalent.
Copper and cobalt mineralization was first discovered in Zambia at the turn of the century with largescale production commencing in the 1930s. Since then copper has played a dominant role in Zambia’seconomic history, providing at times 85% of its foreign exchange. Copper production reached a peak of700,000 tonnes during the period 1969-1976 before beginning a progressive decline, due to a lack ofinvestment, to a low of 257,000 tonnes in 2000. Zambia produced approximately 500,000 tonnes ofcopper in 2006, up from 465,000 tonnes in 2005.
The Copperbelt remains largely unexplored using modern exploration practices. New ore bodies similarto the Kansanshi and Lonshi deposits await discovery, with Frontier and Kashime being prime examples.
MauritaniaMauritania is located in North West Africa andoccupies the western part of the Sahara Desert. The country has limited agricultural resources butcontains extensive mineral deposits, most notably ironore. Its coastal waters are among the world’s richestfishing grounds, and oil reserves were discovered offshorein 2001 with commercial exploitation beginning in 2005.
In ten years Mauritania has been transformed from a countrywith a predominantly nomadic population (2.8 million in 2002),limited economic base and poor social indicators to one that ishighly urbanized and market-driven.

FIRST QUANTUM MINERALS LTD. 2006 ANNUAL REPORT
KANSANSHI
14
127,179 tonnes of copperwere produced by
Kansanshi in 2006.

FIRST QUANTUM MINERALS LTD. 2006 ANNUAL REPORT 15
KANSANSHI
The Kansanshi copper-gold mine is located inthe North Western Province of Zambia,approximately ten kilometres north of Solweziand 180 kilometres to the northwest of theCopperbelt town of Chingola.
Mining is carried out using conventional openpit methods employing excavators and a fleet ofhaul trucks. Ore treatment is flexible to allow forvariation in ore type. Sulphide ore is treated viacrushing, milling and flotation to producecopper in concentrate which is either treatedonsite via HPL or shipped to Copperbeltsmelters. Oxide ore is treated via crushing,milling, solvent extraction and electrowinning(SX/EW) to produce cathode copper.
In 2001, the Company purchased an 80%interest in Kansanshi from Cyprus Amax, asubsidiary of Phelps Dodge Corporation, fortotal consideration of $27.5 million.
In 2002, it was proposed that Kansanshi bedeveloped in two phases and a definitivefeasibility study (DFS) was completed for thefirst phase of 16 years. A second phase of 14
Kansanshi Copper-Gold Mine, Zambia
years is supported by the existing resource for a total mine life of approximately 30 years.
Disclosure relating to Kansanshi’s resources andreserves and the related qualified person(s) iscontained in the Company’s most recently filedannual information form, which is available onSEDAR and is also posted on the Company’swebsite.
The original DFS envisioned the treatment of 4 million tonnes of oxide ore and 2 million tonnesof sulphide ore (4O+2S) to produce an averageof 85,000 tonnes of finished copper per year.
Capital additions carried out to the sulphidemilling circuit during initial construction doubledtreatment capacity of sulphide ore to 4 milliontonnes per year (4O+4S).
A second expansion program completed in early2006 expanded the sulphide circuit to 8 milliontonnes of treatment capacity (4O+8S).
Copper production127,179 tonnes
Cash Cost$0.91/lb
Total Cost$1.09/lb

FIRST QUANTUM MINERALS LTD. 2006 ANNUAL REPORT
KANSANSHI
16
Kansanshi’s new 35,000tonne/annum cathode tankhouse was built in 2006 as
part of the HPL facility.

Construction on a third expansion to thesulphide circuit began in late 2006 and isexpected to be completed by 2008. This willresult in a treatment capacity of 12 milliontonnes of sulphide ore (4O+12S). Finishedcopper production is forecast to be 145,000tonnes in 2007 and 165,000 tonnes per yearthereafter.
The Company has constructed a HPL facility totreat a portion of the increased copperconcentrate production. The total capital costwas $100 million including upgrading the Zescopower supply and working capital requirements.The main components of the HPL facility are twoautoclaves, an oxygen plant and an additional35,000 tonne per annum SX/EW facility.Construction of the HPL facility was completedin 2006 and commercial production is expectedto begin in 2007.
As of December 31, 2006, the Company hadinvested approximately $411 million atKansanshi. The mine employs approximately1,105 workers on a full or part time basis.
In 2006, 9.5 million tonnes of ore grading 1.4%copper and 21.9 million tonnes of waste weremined. Copper production was 127,179 tonnes,73,683 tonnes as copper in cathode and 53,496as copper in concentrates. The combined cashcosts for both cathode and concentrate for 2006was $0.91 per pound of copper with a total costof $1.09 per pound of copper.
For 2007, Kansanshi is forecast to produce145,000 tonnes of copper and 40,000 ounces ofgold. Cash costs are forecast in the range of$0.90 to $0.95 per pound of copper beforeconsidering the impact of the accountingchange for the removal of deferred stripping.
FIRST QUANTUM MINERALS LTD. 2006 ANNUAL REPORT 17
KANSANSHI

BWANA/LONSHI
18
51,068 tonnes of copper were produced by
Bwana/Lonshi in 2006.

FIRST QUANTUM MINERALS LTD. 2006 ANNUAL REPORT 19
BWANA/LONSHI
The Bwana/Lonshi operation is unique in that itoperates in two countries, Zambia and the DRC.The operation involves open pit mining of highgrade oxide ore at Lonshi in the DRC andtransportation of the ore into Zambia where it isprocessed at the Bwana SX/EW facility. TheCompany currently employs approximately1,799 people at its Bwana/Lonshi operations.
The 100% owned Bwana SX/EW facility islocated near the regional mining centre ofNdola. Since inception, the Bwana operation hasprocessed oxide copper ores to produce metalas copper cathode. In addition, Bwana producessulphuric acid for consumption in First Quantumoperations.
Bwana SX/EW Facility, ZambiaLonshi Copper Mine, DRC
Built in 1998 at a cost of $30 million andexpanded in 2002 for an additional $25 million,Bwana is a showcase operation for FirstQuantum in Zambia. Designed originally to re-process existing tailings from historic operations,Bwana was converted and upgraded to processLonshi oxide copper ore in 2002.
The Lonshi copper mine is owned and operatedby Compagnie Minière de Sakania Sprl. (Comisa),a wholly owned Congolese subsidiary. Thedeposit was first discovered by First Quantum inlate 2000 and mining operations commenced inAugust 2001 after drilling campaigns hadidentified a high grade copper resource.
Copper production51,068 tonnes
Cash Cost$0.76/lb
Total Cost$1.04/lb

Bwana produces LME grade “A”
copper cathode.
FIRST QUANTUM MINERALS LTD. 2006 ANNUAL REPORT
BWANA/LONSHI
20
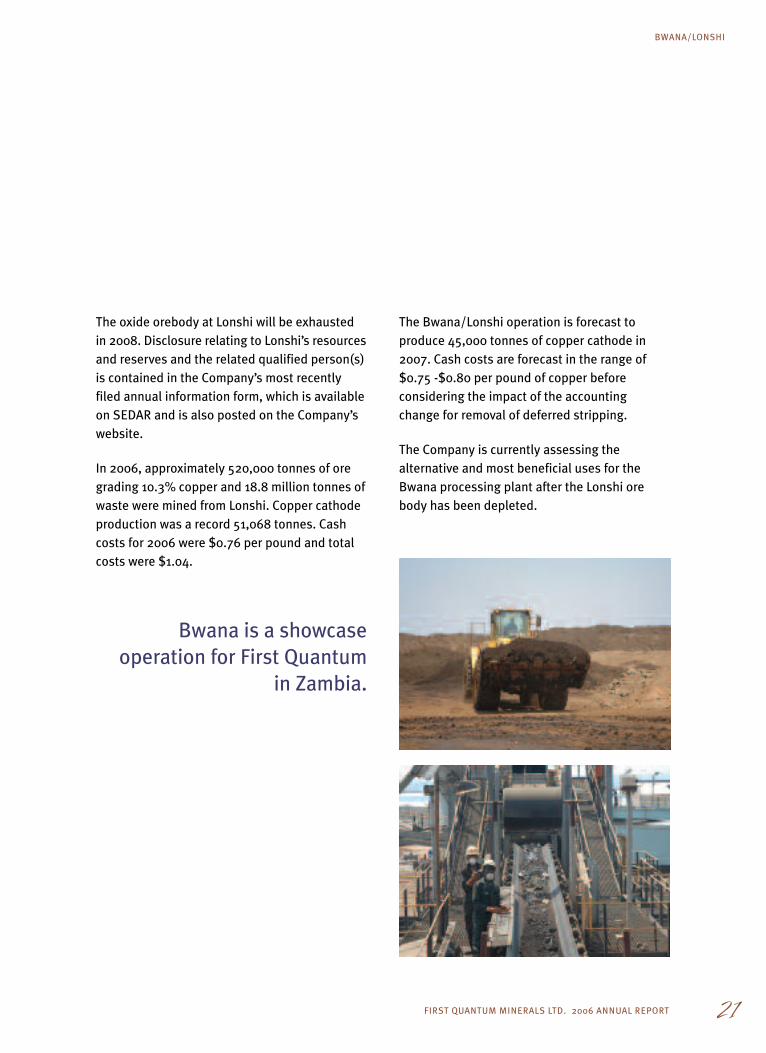
Bwana is a showcaseoperation for First Quantum
in Zambia.
FIRST QUANTUM MINERALS LTD. 2006 ANNUAL REPORT 21
BWANA/LONSHI
The oxide orebody at Lonshi will be exhaustedin 2008. Disclosure relating to Lonshi’s resourcesand reserves and the related qualified person(s)is contained in the Company’s most recentlyfiled annual information form, which is availableon SEDAR and is also posted on the Company’swebsite.
In 2006, approximately 520,000 tonnes of oregrading 10.3% copper and 18.8 million tonnes ofwaste were mined from Lonshi. Copper cathodeproduction was a record 51,068 tonnes. Cashcosts for 2006 were $0.76 per pound and totalcosts were $1.04.
The Bwana/Lonshi operation is forecast toproduce 45,000 tonnes of copper cathode in2007. Cash costs are forecast in the range of$0.75 -$0.80 per pound of copper beforeconsidering the impact of the accountingchange for removal of deferred stripping.
The Company is currently assessing thealternative and most beneficial uses for theBwana processing plant after the Lonshi orebody has been depleted.

FIRST QUANTUM MINERALS LTD. 2006 ANNUAL REPORT
GUELB MOGHREIN
22
Guelb Moghrein produced itsfirst copper in concentrate
in July 2006.

FIRST QUANTUM MINERALS LTD. 2006 ANNUAL REPORT 23
GUELB MOGHREIN
Guelb Moghrein Copper-Gold Project, Mauritania
The Guelb Moghrein deposit is located 250kilometres northeast of the nation’s capital,Nouakchott, near the town of Akjoujt and isaccessible by paved highway. It consists of anopen pit mineable, copper/gold deposit.
Disclosure relating to Guelb Moghrein resourcesand reserves and the related qualified person(s)is contained in the Company’s most recentlyfiled annual information form, which is availableon SEDAR and is also posted on the Company’swebsite.
In January 2005, the detailed design andengineering contract was awarded with siteestablishment commencing in March 2005.
The first copper in concentrate was produced inJuly 2006 and commercial production wasachieved in October 2006.
Ore is crushed and milled followed by flotationto produce a copper concentrate which isshipped to offshore smelters. Approximatelyone-half of the gold recovered reports to theconcentrate and the remainder is produced fromgravity concentrate and the flotation tails whichare fed to a carbon in leach circuit for recoveryusing standard cyanide techniques. Gold doré isproduced on site. Production is estimated to beapproximately 30,000 tonnes of copper inconcentrate and 70,000 ounces of gold in 2007.
Copper production5,031 tonnes
Cash Cost$1.69/lb
Total Cost$2.18/lb

FIRST QUANTUM MINERALS LTD. 2006 ANNUAL REPORT
FRONTIER
24
Construction is welladvanced at Frontier and
commercial production isexpected to begin in the
third quarter of 2007.

FIRST QUANTUM MINERALS LTD. 2006 ANNUAL REPORT 25
FRONTIER
Frontier is located near the town of Sakania inthe DRC, within two kilometres of the Zambianborder, and the paved highway that parallels it,roughly equidistant between the city of Ndola(35 kilometres) to the southeast and the MopaniCopper Mines smelter at Mufulira (30 kilometres)to the northwest. It is also approximately 45kilometres from First Quantum’s Bwana MkubwaSX/EW facility. The main railway from theCopperbelt in Zambia to Lubumbashi in the DRCpasses within five kilometres of the property.
The Frontier site is a greenfield development,with the advantage of being relatively close tosignificant existing mine developments in theZambian Copperbelt. As a result, issues ofaccess and housing are relatively straightforward. All other mine site infrastructure willneed to be developed, including power supply,water supply, offices, workshops and otherbuildings and fuel storage. Power will besupplied from an existing substationapproximately 28 kilometres to the west inZambia. Water will be supplied from minedewatering.
A scoping study (“Study”) was published inNovember 2006. The Study detailed anoperation consisting of open pit mining and the processing of primary sulphide ore.
Frontier Copper Project, DRCDisclosure relating to Frontier’s resources andreserves and the related qualified person(s) iscontained in the Company’s most recently filedannual information form, which is available onSEDAR and is also posted on the Company’swebsite.
Oxide/mixed mineralization has been consideredwaste, although in practice it will be stockpiledseparately for possible processing in the futureor for treatment at First Quantum’s BwanaMkubwa plant.
The Study is based on the treatment of 8 milliontonnes of sulphide ore per year for the productionof copper concentrate which will be shipped fortreatment at the Mufulira smelter of MopaniCopper Mines Plc. The total construction capitalcost for the Frontier project is budgeted at $226million. Average annual copper production fromFrontier is expected to be 73,000 tonnes overthe 19 year mine life.
Construction is well advanced and commercialproduction is expected to begin in the thirdquarter of 2007.

FIRST QUANTUM MINERALS LTD. 2006 ANNUAL REPORT
KOLWEZI
26
The Company is targetingproduction of 105,000 tonnes
of copper and 17,400 tonnes ofcobalt per year from Kolwezi.

FIRST QUANTUM MINERALS LTD. 2006 ANNUAL REPORT 27
KOLWEZI
Kolwezi Copper-Cobalt Project, DRCIn 2006, the Company acquired 100% of Adastrafor $273 million. Adastra was a public internationalmining company with its principal asset beingthe Kolwezi copper-cobalt tailings project in theDRC. The Kolwezi project is owned 65% by FirstQuantum, 12.5% by La Générale des Carrieresdes Mines (Gécamines), 10% by IndustrialDevelopment Corporation of South Africa, 7.5%by International Finance Corporation and 5% bythe DRC Government.
The Kolwezi project is located to the north ofKolwezi, a city located in the south of Katangaprovince. The Kolwezi tailings are from historicoperations at the Kolwezi concentrator.
Disclosure relating to Kolwezi’s resources andreserves and the related qualified person(s) iscontained in the Company’s most recently filedannual information form, which is available onSEDAR and is also posted on the Company’swebsite.
The Company is considering the construction ofan intial 35,000 tonne per year copper facilityand 5,800 tonne per year cobalt facility whichwould be designed to be expanded to 105,000tonnes of copper per year and 17,400 tonnes ofcobalt per year. A detailed engineering studyand capital estimate is expected to becompleted in 2007.

FIRST QUANTUM MINERALS LTD. 2006 ANNUAL REPORT
EXPLORATION
28
ExplorationIn 2006, a wide-ranging exploration program fornew major copper deposits continued on wholly-owned properties in Zambia and the DRC. TheCompany has prospecting licenses coveringlarge areas within the Copperbelt. Drill programsare ongoing on several prospective targets.
In December 2004, the Company announcedpositive results from a reverse circulation drillprogram at the Kashime prospect. Kashime isapproximately 140 kilometres by paved and dirtroad south east from Bwana. Highlights fromthe 13 hole drill program included 56 metresgrading 2.08% copper, 55 metres grading 1.20%copper and 101 metres grading 0.92% copper.
A preliminary inferred oxide resource wascompleted by independent consultants and inFebruary 2006, a program of combined reversecirculation and diamond drilling was initiated toimprove definition. Oxide resource drillingcomprising totals of 9,100 metres of core drillingand 6,500 metres of reverse circulation was
completed in July 2006. A new calculation of theoxide resource will commence as soon as allassay data has been received and validated todetermine the economics of this project.
In March 2006 the Company announced a newdiscovery at the wholly-owned KibambaExploration Permit, located approximately 75kilometres west of the town of Likasi, within theDRC portion of the Central African Copperbelt.
The Company completed airborne magneticsand radiometrics surveys in 2004, and carriedout soil geochemistry in 2004 and 2005 over theentire exploration permit. Four trenches wereexcavated at the Subo Prospect in 2004. 2005drill highlights from Subo included 80 metresgrading 2.20% copper and 0.25% cobalt, 75metres grading 1.12% copper and 0.03% cobaltand 82 metres grading 1.88% copper and 0.12%cobalt. A follow up drill campaign was carried outin 2006 and further drilling is planned in 2007.
FIRST QUANTUM MINERALS LTD. 2006 ANNUAL REPORT 29
INVESTMENTS
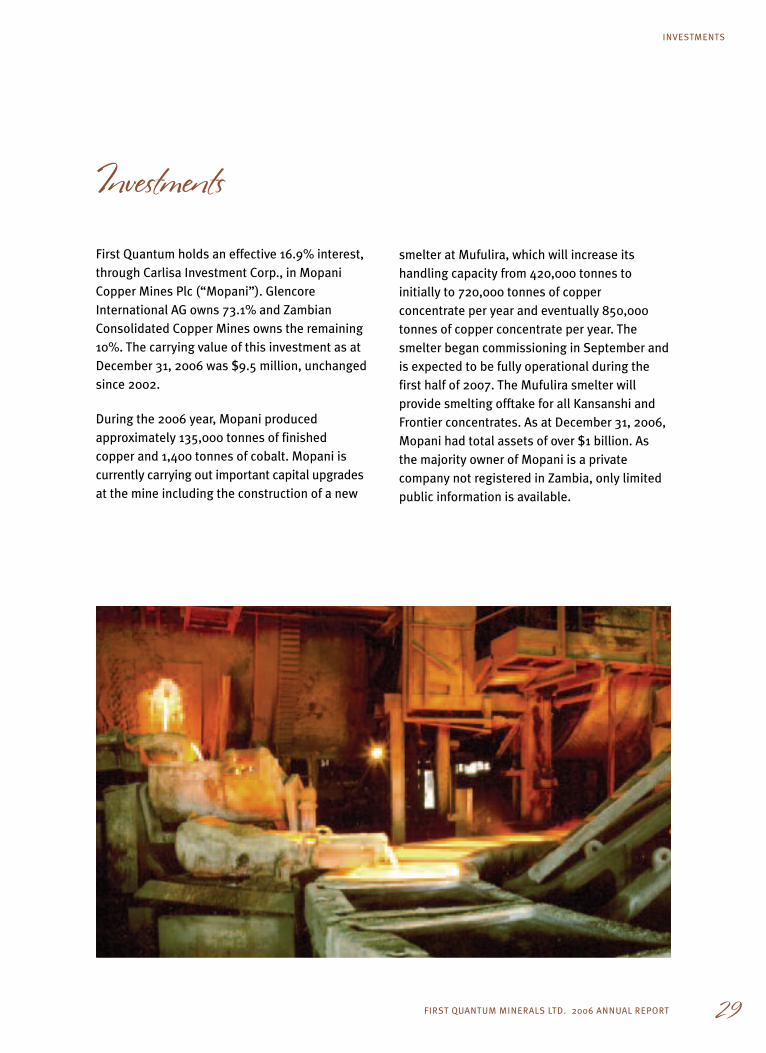
InvestmentsFirst Quantum holds an effective 16.9% interest,through Carlisa Investment Corp., in MopaniCopper Mines Plc (“Mopani”). GlencoreInternational AG owns 73.1% and ZambianConsolidated Copper Mines owns the remaining10%. The carrying value of this investment as atDecember 31, 2006 was $9.5 million, unchangedsince 2002.
During the 2006 year, Mopani producedapproximately 135,000 tonnes of finishedcopper and 1,400 tonnes of cobalt. Mopani iscurrently carrying out important capital upgradesat the mine including the construction of a new
smelter at Mufulira, which will increase itshandling capacity from 420,000 tonnes toinitially to 720,000 tonnes of copperconcentrate per year and eventually 850,000tonnes of copper concentrate per year. Thesmelter began commissioning in September andis expected to be fully operational during thefirst half of 2007. The Mufulira smelter willprovide smelting offtake for all Kansanshi andFrontier concentrates. As at December 31, 2006,Mopani had total assets of over $1 billion. Asthe majority owner of Mopani is a privatecompany not registered in Zambia, only limitedpublic information is available.
FIRST QUANTUM MINERALS LTD. 2006 ANNUAL REPORT30
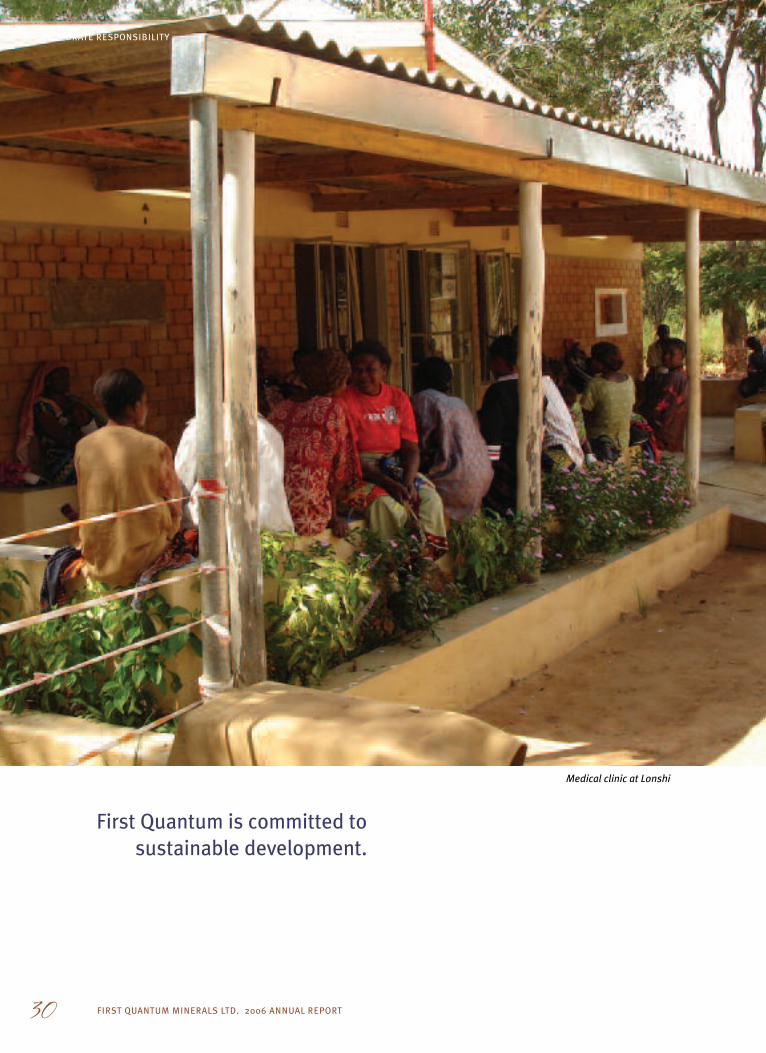
First Quantum is committed tosustainable development.
Medical clinic at Lonshi
CORPORATE RESPONSIBILITY

FIRST QUANTUM MINERALS LTD. 2006 ANNUAL REPORT 31
CORPORATE RESPONSIBILITY
First Quantum is committed to sustainabledevelopment, in that its investments should notonly be financially profitable and technicallyappropriate, but should also be environmentallysound and socially responsible. The Companyhas environmental and social managementplans at each of its current operations. Theseplans have been prepared in accordance withthe environmental regulations of the hostcountries and are based on World Bankguidelines and industry best practice.
The Company has adopted the EquatorPrinciples and has begun development andimplementation of environmental and socialprograms in 2007 to bring operations intocompliance. The Company has adopted andpublished policies for the environment,occupational health and safety as well ashuman rights.
Corporate ResponsibilityEnvironmentThe Company has environmental managementsystems in place at each of its currentoperations. The procedures and protocols thatform the operating framework of the Company’senvironmental management systems are in linewith ISO 14001 requirements. The overall goalsinclude: a commitment of management topollution prevention; compliance with pertinentenvironmental regulations and legislation andcontinual improvement to protect the environment.
In 2006, no significant environmental incidentswere reported. Zero discharge of processeffluent to surface waters is practiced at allsites. Emissions from the Company’s three acidplants at Bwana and Kansanshi during normaloperations were compliant with both Zambianstatutory limits and United Kingdom guidelinesfor sulphur loss from single absorption acid plants.The Company is in possession of all necessaryenvironmental permits and licenses. Noenvironmental penalties were incurred in 2006.
The environmental and social impact assessmentstudy for the Frontier copper project in the DRCwas approved by the Ministry of Mines inJanuary 2006. An ISO 14401 environmentalmanagement system will be in place beforeplant commissioning in mid 2007.

FIRST QUANTUM MINERALS LTD. 2006 ANNUAL REPORT
CORPORATE RESPONSIBILITY
32
Guelb Moghrein in Mauritania is located in adesert environment where water is a preciousresource. Process water for the concentrator andgold plant is presently pumped from theBennichab freshwater aquifer situated 113kilometres from the mine. As part of its watermanagement plan and to preserve this waterresource for future generations, Guelb iscarrying out investigations to identify analternative saline water supply for the processplant. The saline drilling programme and testwork will be complete in 2007. Guelb is alsomaximising the recycling of process water fromthe tailings dam and implementing procedureson site to prevent the wastage of water.
Closure plans with costs have been prepared foreach operation. The closure plans are reviewedannually.
Health and SafetyFirst Quantum implements internationallyaccepted occupational health and safetystandards and procedures throughout itsoperations. The Company complies with allnational laws of health and safety in theworkplace in order to create a safe workplacethereby protecting its employees from accidentand sickness. These laws are in line withInternational Labor Organizationrecommendations.
In 2006, the Company made great efforts toimprove its health and safety performance.Progress has been made on developing healthand safety procedures and guidelines whichsupport the Company’s goal of zero lost timeinjuries. All employees and contractors nowundergo health and safety training as part of thegeneral environmental health and safetyinduction programme.
The Company is pleased to report no fatalities atits operations in 2005 and 2006. BwanaMkubwa had an excellent safety record in 2006with zero reported lost time injuries. The lostday rates improved markedly in 2006 at all threebusiness units. Health and safety monitoring atGuelb Moghrein began in September 2006. Todate, no lost time injuries have been reported.
Employee health and occupational illness is akey focus area. In 2006, much emphasis hasbeen placed on improved monitoring ofoccupational exposure to gas, dust and noise.At the same time, there has been a drive bysafety departments to ensure employees wearthe correct personal protective equipment tomitigate any potential exposure.
First Quantum recognizes the importance of thehealth of local communities in which it operates.In Zambia the Company actively supports the
Health and safety performance indicators for 2005 & 2006
Kansanshi Bwana Lonshi
2005 2006 2005 2006 2005 2006Number of fatalities 0 0 0 0 0 0Injury rate* 0.44 0.45 0.75 0.00 0.12 0.11Lost day rate* 11.69 4.65 14.50 6.19 6.05 1.52
* based on a rate of 200,000 labour hours
1) The per annum injury rates have been calculated by using the number of lost time injuries and dividing that figure by thenumber of hours worked by employees; the result is then multiplied by 200,000 hours. The per annum lost day rates havebeen calculated by using the number of lost days and dividing that figure by the number of hours worked by employees; theresult is then multiplied by 200,000 hours.

FIRST QUANTUM MINERALS LTD. 2006 ANNUAL REPORT 33
CORPORATE RESPONSIBILITY
government malaria ‘roll back’ programmes inNdola and Solwezi towns. In 2006, the Companyprovided logistical support in the form of labour,spray equipment and chemicals. During thecurrent programme it is planned to spray 52,000houses in Ndola and 24,000 houses in Solwezi.The Company makes available treated mosquitonets to its employees at subsidized prices.
HIV/Aids Programme
First Quantum recognises that a sustainable, fithealthy workforce is essential for the companyto achieve its business objectives.Implementation of the Company’s HIV/Aidsprogramme at its three Zambian business unitsbegan in November 2005. The Zambian HIVprevalence rate is approximately 16% of thepopulation. The Company’s HIV/Aids Policyadvocates a non-discriminatory approach toaddressing the epidemic and provides forconsiderable support in terms of counselling,free medical care including treatment ofopportunistic infections, and antiretroviraltreatment for all employees and their families.The programme is run from the Company’sNdola office by a senior coordinator and siteHIV/Aids coordinators who are registerednurses with specialist training in counsellingand testing, ART administration, and otherHIV/Aids related issues.
In addition, First Quantum has entered into aGlobal Development Alliance with other miningcompanies in Zambia and the US Government.In terms of this cooperative agreement FirstQuantum is funded through USAID for variousHIV/Aids initiatives, technical support andtraining programmes. USAID is funding thetuition of 600 peer educators in addition to afinancial grant in support of the generalprogramme. The HIV/Aids introductoryprogramme was initiated in April 2006 andinvolves a two hour training session delivered toall employees. The objective of the programmeis to explain the Company’s policy, educate andencourage all employees, their families and thecommunity at large to undergo voluntarycounselling and testing. In 2007 the Companyintends to extend its HIV/Aids programme to itsDRC operations.

FIRST QUANTUM MINERALS LTD. 2006 ANNUAL REPORT
CORPORATE RESPONSIBILITY
34
The children are Africa’s future.
FIRST QUANTUM MINERALS LTD. 2006 ANNUAL REPORT 35
CORPORATE RESPONSIBILITY
Social ResponsibilityFirst Quantum is always mindful of its responsibilitytowards the community in which it operates.
In 2006, the Kansanshi mine was pleased toannounce the establishment of the KansanshiFoundation. Some of the projects undertaken sofar by the foundation include the drilling andequipping of water bores to supply clean waterto villages and communities surrounding themining license; resurfacing of the Solwezi townmarket; repairs to town infrastructure includingbridges and roads; and the supply andinstallation of a new chilling compressor andrepairs to the mortuary at Solwezi GeneralHospital. In an effort to reduce deforestation inthe Solwezi area, Kansanshi has promotedalternative livelihoods in the area includingbeekeeping.
In 2006, Bwana carried out a variety ofcommunity projects. Activities varied fromrepairs to town infrastructure such as roads and the Kafubu water and sewage works to the sponsorship of sports events, Zambiansportsmen and the donation of sportsequipment to schools and sports clubs;electrical improvements to schools andorphanages, provision of water supplies to local village communities; dredging of localwatercourses to remove weed, improve flow and
prevent the breeding of mosquitoes andassistance to the Forestry Department to mountpatrols to prevent deforestation in the Chondweand Kansansfwe forest reserves through whichthe Bwana/Lonshi haul road passes.
Guelb began implementing its Social Action Planin October 2006. To date work has focused onthe refurbishment of schools in Akjoujt, repairsto medical facilities at the Akjoujt Hospital,construction of shade houses to grow vegetablesfor the local community, assistance to localfarming cooperatives in the form of water pumpsand pipes to enable irrigation and improve theproduction of vegetables from garden plots inthe Akjoujt wadis, the provision of waterbladders in parts of Akjoujt town where there isno reticulated water system, and the supply ofclean water at no cost to low income familiesliving along the 113 kilometre long Bennichabpipeline.

FIRST QUANTUM MINERALS LTD. 2006 ANNUAL REPORT
MANAGEMENT’S DISCUSSION & ANALYSIS
36
Management’s Discussion and Analysis For the Fourth Quarter and Year Ended December 31, 2006
(Expressed in US Dollars) March 13, 2007
1. Highlights for the 2006 Year and Fourth Quarter• Record net sales of $1,094.5 million in 2006, an increase of 146% compared to 2005• Record net earnings of $414.4 million ($6.37 per share) in 2006, an increase of 171% compared to 2005• Net earnings of $70.0 million ($1.04 per share) in the fourth quarter of 2006, an increase of 22% compared to the
fourth quarter of 2005• Record cash flows from operating activities, before working capital movements, of $588.2 million ($9.04 per share)
in 2006, an increase of 149% compared to 2005• Cash flow from operating activities, before working capital movements, of $85.0 million ($1.26 per share) in the
fourth quarter of 2006, a decrease of 16% compared to the fourth quarter of 2005• Copper production for the year of 183,277 tonnes (403.9 million pounds), an increase of 54% compared to 2005 • Copper sales for the year of 172,487 tonnes (380.2 million pounds), an increase of 45% compared to 2005• Contained copper in concentrate inventory at December 31 of approximately 15,000 tonnes (33.1 million pounds)• Guelb Moghrein in Mauritania achieved commercial production on October 5, 2006• Acquired Adastra Minerals Inc. during the year• New $400 million corporate credit facility entered into with a syndicate of international banks in October 2006 • Dividends of $20.1 million paid to Company shareholders during the year• The Company’s Board of Directors approved development of the Frontier Copper Project; construction is well
advanced; commercial production targeted for third quarter of 2007 • Commissioning of high pressure leach project at Kansanshi commenced in November 2006
For further information on the Company, reference should be made to Section 2 or its public filings (including its most recentlyfiled AIF) which are available on SEDAR at www.sedar.com. Information is also available at the Company’s website at www.first-quantum.com. In addition, reference should be made to the risk factors section contained in the Company’s most recently filedAIF. The following interim information is prepared in accordance with Canadian GAAP and denominated in United States dollars,unless otherwise noted.
2. Company Overview First Quantum Minerals Ltd. (the “Company”) is a Canadian listed mining company whose principal activities include mineralexploration, development, mining, and the production of London Metal Exchange (“LME”) grade “A” copper cathode, copperin concentrate, gold and sulphuric acid. The discussion and analysis contained in this MD&A follows the reporting segmentsas described in the Company’s most recently filed annual financial statements.
The 80% owned Kansanshi operation is located near Solwezi, in Zambia and produces grade “A” copper cathode andcopper in concentrate. The copper concentrate produced includes a gold credit. The Kansanshi operation consumessulphuric acid from the Solwezi acid plant located on the same site which is owned and operated by a wholly ownedsubsidiary First Quantum Mining and Operations Limited. Commissioning of the high pressure copper concentrate leachproject at Kansanshi is nearing completion.
The wholly owned Bwana/Lonshi operation includes an open pit mine at Lonshi, located in the Democratic Republic ofCongo (“DRC”), and the Bwana processing plants located in Zambia. The Bwana/Lonshi operation produces grade “A”copper cathode and sulphuric acid from three acid plants. Two of these plants are located at Bwana Mkubwa while theother plant is located at the Kansanshi site as mentioned above.
The 80% owned Guelb Moghrein (“Guelb”) operation is located in Mauritania and produces copper and gold in concentrateand gold doré.
The Company is currently developing its Frontier copper project, located near the town of Sakania in the DRC, within 2kilometers of the Zambian border. This project is expected to achieve commercial production in the third quarter of 2007 andwill produce copper in concentrate.
The Company owns an effective 16.9% interest in Mopani Copper Mines Plc (“Mopani”), located in Zambia. The new Mufulirasmelter owned by Mopani was commissioned late in 2006. This smelter will provide capacity for the treatment of all ofKansanshi’s surplus copper concentrate and 100% of Frontier’s concentrate production.

FIRST QUANTUM MINERALS LTD. 2006 ANNUAL REPORT 37
MANAGEMENT’S DISCUSSION & ANALYSIS
The Company, through its wholly owned subsidiary, Comisa, has the exclusive exploration rights over 37 exploration permitswith a total surface area of 11,000 square kilometers in the DRC.
The Company acquired Adastra Minerals Inc. (“Adastra”) in a two step transaction during the year. Adastra was a listedinternational mining company developing several mineral assets in Central Africa, including the Kolwezi Copper-CobaltTailings Project in the DRC. The Company acquired 75% of Adastra in May 2006 and the remaining 25% in August 2006.Since acquiring control of Adastra, the Company has been conducting a metallurgical testwork and piloting program inorder to determine whether a revised process design for the Kolwezi tailings project is required.
3. Financial ResultsNet earnings for 2006 were $414.4 million or $6.37 per share (weighted average common shares – 65,087,605) as comparedto $152.8 million or $2.48 per share (weighted average common shares – 61,498,338) during the 2005 year. This net incomeincrease of 171% was due to an 83% increase in the average LME cash copper price and a 54% increase in copperproduction. The operating cash inflow for the twelve month period, before working capital movements, was $588.2 millionor $9.04 per share and after working capital movements was $512.0 million or $7.87 per share.
Net earnings for the fourth quarter were $70.0 million or $1.04 per share (weighted average common shares – 67,286,631)as compared to $57.1 million or $0.93 per share (weighted average common shares – 61,638,650) for 2005. This net incomeincrease of 22% was due to a 65% increase in the average LME cash copper price compared to the same period in 2005,which was in part offset by a loss as a result of provisional pricing due to a decrease in the average LME cash copper pricebetween September 30, 2006 to December 31, 2006. The operating cash inflow for the fourth quarter, before workingcapital movements, was $85.0 million or $1.26 per share and after working capital movements was $146.4 million or $2.18per share.
4. Production and Statement of Earnings Discussion
Copper Production
Copper production in 2006 was 183,277 tonnes, of which, 69% was from Kansanshi, 28% was from Bwana, and 3% was fromGuelb. Combined copper production increased by 54% over the 2005 year, which was principally due to Kansanshiproduction increasing 83% compared to the same period of 2005; the 2006 year was Kansanshi’s first full twelve monthperiod with commercial production achieved in the second quarter of 2005.
Fourth quarter copper production was 46,531 tonnes, of which, 62% was from Kansanshi, 27% was from Bwana, and 11%was from Guelb. Combined copper production increased by 2% over the third quarter of 2006, which was principally due toGuelb achieving commercial production on October 5, 2006. Kansanshi and Bwana fourth quarter copper productiondecreased from the third quarter of 2006 by 10% and 6%, respectively, due to the processing of lower grade ore.
Chart 1: Quarterly Copper Production
60,000
50,000
40,000
30,000
20,000
10,000
Q1/05 Q2/05 Q3/05 Q4/05 Q1/06 Q2/06 Q3/06 Q4/06
12,028 11,717 13,131 12,662 11,718 13,569 13,302 12,479
16,956 23,065 29,558 30,368 35,611 32,178 29,021
28,673
36,196
42,220 42,086
49,18045,480
5,031
46,531
12,028
GuelbKansanshiBwana
Tonnes of Contained Copper
$1.40
$1.20
$1.00
$0.80
$0.60
$0.40
Q1/05 Q2/05 Q3/05 Q4/05 Q1/06 Q2/06 Q3/06 Q4/06
Finance OtherDepreciationPrice participation in refining chargesTreatment, refining & freight chargesNet Processing CostsMining Costs
$ per pound
$0.20
$0.75$0.80
$0.87 $0.89
$1.02$1.97
$1.13
$1.24
$0.58 $0.60$0.64
$0.71
$0.82$0.87
$0.90
$1.00
Cash Costs
Dec 04
$1,800
Dec 05 Dec 06
$200
$600
$1,000
$1,400
$473.1
$746.5
$1,744.4Cash & cash equivalentOther current assetsProperty, plant & equipment
$ Millions
Total Assets
$1,600
$1,200
$800
$400
Dec 04
$900
Dec 05 Dec 06
$100
$300
$500
$700
$313.0 $412.6
$720.7
Current & other liabilitiesFuture income tax liabilityLong-term debt
$ Millions
Total Liabilities
$800
$600
$400
$200
Chart 3: Assets Chart 4: Liabilities

FIRST QUANTUM MINERALS LTD. 2006 ANNUAL REPORT
MANAGEMENT’S DISCUSSION & ANALYSIS
38
Revenues
Table 1: Revenue Statistics
Fourth Quarter Twelve Months
2004 2005 2006 2004 2005 2006Revenues (millions)
Copper $29.2 $174.2 $212.0 $103.3 $434.1 $1,073.9Gold – 2.7 4.4 – 6.7 20.1Acid 1.5 – – 10.2 3.8 0.4
Total Revenue $30.7 $176.9 216.4 $113.5 $444.6 $1,094.4
Gross copper selling price (per lb) (1) $1.20 $2.09 $2.54 $1.15 $1.79 $3.12Realized copper price (per lb) $1.17 $1.97 $2.32 $1.12 $1.66 $2.82Average LME cash copper price (per lb) $1.40 $1.95 $3.21 $1.30 $1.67 $3.05Realized gold price (per oz) – $467 $628 – $470 $601Average gold price (per oz) $434 $485 $614 $409 $445 $604
Sales Statistics (2)
Copper (tonnes) 11,307 40,203 41,454 41,980 118,602 172,487Gold (ounces) – 5,766 6,944 – 14,266 33,497Acid (tonnes) 9,664 219 8 66,460 22,327 2,363
(1) Gross copper selling price is defined as realized copper selling price plus tolling and refining charges and freight paritycharges
(2) Copper sales and production volumes refer to contained copper in either concentrate or cathode.
Twelve Months 2006The 2006 year’s sales revenue increased by 146% over the 2005 year. This increase was the result of an increase in theaverage LME cash copper price of 83% and an increase in the tonnes of copper sold by 45% over the 2005 year. In addition,included in sales revenue was a positive adjustment of $30.9 million related to prior year’s copper sales that wereprovisionally priced at December 31, 2005.
Fourth Quarter 2006Fourth quarter revenues increased by 22% over the same period in 2005. This increase was the result of an increase in theaverage LME cash copper price of 65% and an increase in the tonnes of copper sold by 3% over the same period in 2005.However, the Company recognized negative sales adjustments of $31.7 million related to prior period’s copper sales thatwere provisionally priced at September 30, 2006.
Provisional Revenue
Table 2: Copper Revenue
Fourth Quarter Twelve Months
2004 2005 2006 2004 2005 2006Copper Revenue (millions)
Current period sales (1) $29.2 $168.2 $243.7 $103.3 $434.1 $1,043.0Prior period provisional adjustments (2) – $6.0 $(31.7) – – $30.9
Total Copper Revenue $29.2 $174.2 $212.0 $103.3 $434.1 $1,073.9
(1) Recognized at the settlement price or the LME copper forward price at the end of the respective period
(2) The provisional adjustment reflects the settlement or provisional price adjustment of prior period copper sales
The Company received final price determination on its sales of copper based on prices prevailing up to between three andnine months subsequent to the actual month of shipment. Consequently, the final price for sales which have been madeduring the latter months of the period is not known with certainty at the end of the period. At the end of each period, apositive or negative adjustment is recorded to reflect the difference in the price initially recorded at the time of shipmentand the forward LME copper price until final settlement is made.
As at December 31, 2006 there were 43,440 tonnes of contained copper that have been provisionally priced at an averageLME copper price of $2.87 per pound. This revenue will be subject to future adjustments as a result of movements in thecopper price. Of this amount, 11,124 tonnes had the final price determined in January 2007 at $2.57 per pound, 14,089tonnes determined in February 2007 at $2.57 per pound, 9,252 tonnes will be determined in March 2007, and 8,975 tonnesthereafter.

FIRST QUANTUM MINERALS LTD. 2006 ANNUAL REPORT 39
MANAGEMENT’S DISCUSSION & ANALYSIS
As the majority of Kansanshi’s copper in concentrate production from January 1, 2007 onwards will be treated at theMopani’s Mufulira smelter rather than having to be exported, provisional pricing earnings volatility may be reduced asshipment periods will be significantly reduced.
Consolidated Cash and Total CostsTotal costs have increased steadily over the past eight quarters due, principally, to increases in processing costs, tollingcharges (TCs) refining charges (RCs) and freight parity charges. Overall, there has been a 28% increase in total costscompared to 2005.
Chart 2: Quarterly Group Cash Costs and Total Costs
Total mining costs have increased over the past eight quarters due to increased waste stripping and increased fuel and wagecosts, however, due to the Company’s accounting policy for deferred stripping, mining costs per pound remained relativelyconsistent over the past eight quarters. Deferred stripping allows for the deferral of the additional waste removal costs thatthe Company has incurred during the past years to be deferred to future periods, based on management’s estimated stripratio over the life of each mine. Effective January 1, 2007, the Company adopted a new accounting policy that requiresstripping costs to be accounted for as variable production costs to be included in inventory. Refer to ‘Section 10 – Non-GAAPMeasures, Future Changes in Accounting Policies and Other’ for detailed information on the adoption of this new policy.
Processing costs have increased by 30% compared to 2005. Maintenance costs have increased due to the processing ofharder ore at Kansanshi and the increase in the volume of ore processed. In addition, increases in costs associated with oilbased consumables, electricity, sulphur, and wages have all contributed to the increased processing costs.
TCs and RCs and freight parity charges increased over the eight quarters as they were directly related to the increasedcopper concentrate sold and cathode production from tolled concentrates. In addition, the price participation componentof the RCs increased with the rising LME copper price. However, with the decrease in the LME copper price from September30, 2006 to December 31, 2006, there was a recovery of previous quarter’s price participation on provisionally priced salesresulting in zero price participation costs in the fourth quarter of 2006.
Refer to ‘Section 6 – Segmented Information’ for detailed information on the segmented total costs and cash costs.
Other Expenses
Table 3: Other Expenses
Fourth Quarter Twelve Months
2004 2005 2006 2004 2005 2006Other Expenses ($ millions)Depletion and amortization $3.0 $13.2 $16.0 $10.9 $36.5 $56.1Exploration 1.0 3.8 6.7 3.1 7.5 18.9General and administrative 1.7 2.0 2.8 5.0 6.7 12.5Stock based compensation 0.5 0.9 2.0 1.2 3.0 6.7Interest and finance fees 0.7 9.3 13.7 3.0 19.4 32.7Other expenses (income) (0.9) 13.5 (0.7) (0.7) 0.9 55.6
60,000
50,000
40,000
30,000
20,000
10,000
Q1/05 Q2/05 Q3/05 Q4/05 Q1/06 Q2/06 Q3/06 Q4/06
12,028 11,717 13,131 12,662 11,718 13,569 13,302 12,479
16,956 23,065 29,558 30,368 35,611 32,178 29,021
28,673
36,196
42,220 42,086
49,18045,480
5,031
46,531
12,028
GuelbKansanshiBwana
Tonnes of Contained Copper
$1.40
$1.20
$1.00
$0.80
$0.60
$0.40
Q1/05 Q2/05 Q3/05 Q4/05 Q1/06 Q2/06 Q3/06 Q4/06
Finance OtherDepreciationPrice participation in refining chargesTreatment, refining & freight chargesNet Processing CostsMining Costs
$ per pound
$0.20
$0.75$0.80
$0.87 $0.89
$1.02$1.97
$1.13
$1.24
$0.58 $0.60$0.64
$0.71
$0.82$0.87
$0.90
$1.00
Cash Costs
Dec 04
$1,800
Dec 05 Dec 06
$200
$600
$1,000
$1,400
$473.1
$746.5
$1,744.4Cash & cash equivalentOther current assetsProperty, plant & equipment
$ Millions
Total Assets
$1,600
$1,200
$800
$400
Dec 04
$900
Dec 05 Dec 06
$100
$300
$500
$700
$313.0 $412.6
$720.7
Current & other liabilitiesFuture income tax liabilityLong-term debt
$ Millions
Total Liabilities
$800
$600
$400
$200
Chart 3: Assets Chart 4: Liabilities

MANAGEMENT’S DISCUSSION & ANALYSIS
40
Twelve Months 2006Depletion and amortization expense increased 53% over 2005 principally due to the Company’s increase in copperproduction over the same period.
Exploration expense increased 152% over 2005 due to increased costs associated with expanding the Company’s mineralproperty base.
General and administrative expense increased 86% over 2005 due to increased wages, as well as increased administrativecosts as a result of the continued growth of the Company.
Stock based compensation expense increased 124% over 2005 due to the implementation of the new long-term incentiveplan. The Company recognized $2.6 million of compensation expense related to this new plan during the year.
Interest and finance fees expense increased 69% over 2005 due to an increase of $7.1 million of amortized deferred financefees related to the repayment of the Company’s debt facilities during the year and an increase in long-term debt levelssince December 31, 2005.
Other expenses included foreign exchange translation losses of $8.0 million and derivative instrument losses of $58.2million. Included in the foreign exchange loss was $4.4 million related to the translation of the Euro denominated Kansanshisubordinated debt. The derivative instrument losses were a direct result of the increase in the LME cash copper price duringthe year. These losses were offset by a gain on the disposal of investments held for resale of $1.8 million and interestincome of $8.8 million. The increase over the 2005 year was principally due to the increase in the derivative instrumentlosses.
Fourth Quarter 2006Depletion and amortization expense increased 21% over the same period in 2005 principally due to increased productionand an increase in depreciable property.
Exploration expense increased 75% over the same period in 2005 due to increased costs associated with expanding theCompany’s mineral property base.
General and administrative expense increased 40% over the same period in 2005 due to increased salaries and wages, aswell as increased administrative costs, resulting from the continued growth and expansion of the Company’s activities andassets.
Stock based compensation expense increased 109% over the same period of 2005 due to the implementation of the newlong-term incentive plan in July 2006. The Company recognized $0.9 million of compensation expense related to this newplan during the fourth quarter.
Interest and finance fees expense increased 47% over the same period in 2005 due, principally, to the amortization of $8.7million of previously deferred finance fees in the fourth quarter related to the repayment of the Kansanshi senior debtfacility, the Guelb facility, and the corporate bridge facility.
Other expenses included foreign exchange losses of $3.1million, interest income of $2.8 million and derivative instrumentgains of $0.9 million The decrease from the same period in 2005 was principally due to derivative instrument losses of $12.7million in the fourth quarter of 2005. Reference should be made to ‘Section 8 – Other Matters’ for a full description of theCompany’s derivative instruments.
5. Consolidated Cash Flow Discussion
Table 4: Cash Flow Information
Fourth Quarter Twelve Months
2004 2005 2006 2004 2005 2006Cash Flows from ($ millions)Operating activities
Before working capital movements $9.8 $101.0 $85.0 $46.3 $236.1 $588.2After working capital movements 2.9 115.5 146.4 30.7 201.8 512.0
Financing activities 49.0 (1.6) 53.1 199.5 13.6 13.4Investing activities (52.5) (94.4) (139.8) (206.1) (183.0) (358.6)

FIRST QUANTUM MINERALS LTD. 2006 ANNUAL REPORT 41
MANAGEMENT’S DISCUSSION & ANALYSIS
Twelve Months 2006Cash flows from operating activities before working capital movements increased by 149% over the 2005 year due,principally, to the increase in net income. The difference between the before and after non-cash working capital movementswas principally attributable to the increase in accounts receivable, inventory and accounts payable. Accounts receivableincreased primarily due to the increase of provisionally priced sales outstanding at December 31, 2006. Inventory increased142% due to the increase in ore in stockpiles of $10.4 million, the increase in finished product inventory of $33.0 million andthe increase in consumable stores inventory of $42.2 million. Accounts payable increased $115.3 million primarily due toan increase in current income taxes payable. In addition, a payment of $15.6 million was made for the new long termincentive plan.
The cash flows from financing activities included a net draw down of $50.5 million in long term debt facilities used topartially fund the Kansanshi, Guelb and Frontier projects. This was in part offset by dividend payments of $20.1 million, longterm debt finance fee payments of $10.8 million and deferred premium obligation payments of $9.2 million.
The cash outflows from investing activities included $264.3 million in continued capital investment at Kansanshi, Guelb, andFrontier, as well as deferred stripping payments at Kansanshi, Comisa, and Guelb amounting to $37.8 million. In addition,the Company paid a net $27.8 million to acquire Adastra and $35.6 million to acquire marketable securities held for long-term investment purposes.
Fourth Quarter 2006Cash flows from operating activities before working capital movements decreased by 16% compared to the same period in2005. This was primarily due to the Company’s increase in income taxes paid of $21.0 million during the quarter. Thedifference between the before and after non-cash working capital movements was principally attributable to the decreasein accounts receivable, offset by the increase in inventory and the increase in accounts payable. Accounts receivabledecreased primarily due to provisional pricing adjustments related to the declining LME copper price. Inventory increasedby 28% primarily due to the increase in finished product inventory of $19.3 million and an increase in consumable storesinventory of $12.5 million. Accounts payable increased $25.1 million primarily due to an increase in current income taxespayable.
The cash flows from financing activities for the fourth quarter included a $225.0 million drawdown of the new $400.0million corporate revolving and term loan facility, which was offset by the repayment of other existing long-term debtfacilities of $160.9 million and the payment of $8.9 million in long term debt finance fees.
The cash outflows from investing activities included $84.4 million in continued capital investment at Kansanshi, Guelb,and Frontier. Deferred stripping payments at Kansanshi, Comisa, and Guelb amounted to $17.0 million during the quarter.In addition, the Company purchased $35.6 million in marketable securities held for investment purposes.

FIRST QUANTUM MINERALS LTD. 2006 ANNUAL REPORT
MANAGEMENT’S DISCUSSION & ANALYSIS
42
6. Segmented Information
Twelve Months Segmented Information
Table 5: Twelve Month Selected Segmented Cash Costs and Operating Information(3)
Kansanshi Bwana/Lonshi Guelb
2005 2006 2004 2005 2006 2006C CostsCombined Costs Kansanshi (per lb) (1)
Mining $0.08 $0.14Processing $0.36 $0.49Site Administration $0.04 $0.02TC RCs $0.19 $0.33Gold / Acid credit $(0.04) $(0.07)
Combined Cash Costs $0.63 $0.91Combined Total Costs $0.79 $1.09Cathode Costs (per lb) (1)
Mining $0.08 $0.13 $0.21 $0.36 $0.37Processing $0.42 $0.56 $0.25 $0.31 $0.38Site Administration $0.04 $0.02 $0.05 $0.07 $0.09TC RCs – $0.05 – – –Gold / Acid credit – $(0.01) $(0.05) $(0.06) $(0.08)
Cathode Cash Costs $0.54 $0.75 $0.46 $0.68 $0.76Cathode Total Costs $0.70 $0.93 $0.62 $0.93 $1.04Concentrate Costs (per lb) (1)
Mining $0.07 $0.14 0.13Processing $0.28 $0.38 0.77Site Administration $0.05 $0.03 0.08TC RCs $0.50 $0.75 0.86Gold / Acid credit $(0.12) $(0.15) (0.15)
Concentrate Cash Costs $0.78 $1.15 1.69Concentrate Total Costs $0.94 $1.34 2.18
Production StatisticsWaste mined (000’s tonnes) 16,141 21,911 11,029 17,246 18,843 1,719Ore mined (000’s tonnes) 7,288 9,534 669 981 520 400Ore grade (%) 2.1 1.4 5.5 5.1 10.3 1.5Sulphide ore processed (000’s tonnes) (3) 1,521 4,410 334Oxide ore processed (000’s tonnes) 2,689 4,771 980 1,352 1,265Sulphide ore grade processed (%) (3) 1.9 1.3 2.0Oxide ore grade processed (%) 1.8 1.5 4.8 4.2 4.5Copper cathode produced (tonnes) 41,521 73,683 41,546 49,538 51,068Copper in concentrate produced (tonnes) 28,058 53,496 5,031Concentrate grade(2) (%) 28.9 27.1 21.3
(1) For the definition of cash and total costs, reference should be made to Section 10
(2) Refers to contained copper in concentrate.
(3) Excludes pre-commercial production

FIRST QUANTUM MINERALS LTD. 2006 ANNUAL REPORT 43
MANAGEMENT’S DISCUSSION & ANALYSIS
Kansanshi During the 2005 year, the world shortage of mining truck tires had impaired the availability of the Company’s haul trucksat Solwezi. The 34% increase this year compared with 2005 was reflective of the easing of the tire shortages, accompaniedby the improved equipment availability and the larger drilling and haul truck fleet.
Cathode total costs increased 33% per pound over 2005 due, principally, to increased ore costs, processing costs andtolling charges, which were incurred for the first time due to the production of cathode from concentrate. The increase in orecosts was due to the processing of lower grade ore and higher fuel and wage costs. The processing of lower grade ore alsoled to increased leach costs due to increased acid consumption and higher acid prices. Tolling charges resulted from theprocessing of copper in concentrates at the Mufulira smelter returned as cathodes. The balance of the increase is explainedby higher maintenance costs associated with the processing of higher volumes of harder ore.
Included within cathode production were 67,656 tonnes from the SX/EW process and 6,027 tonnes produced from thetolling of copper concentrates at the Mufulira smelter. Production increased by 77% over 2005 as Kansanshi continued toramp up after achieving commercial production during April 2005, as well as cathode production from the toll treatment ofconcentrate production commenced in 2006.
Concentrate production was up by 91% over 2005 as Kansanshi continued to ramp up after achieving commercial productionduring April 2005. Concentrate total costs increased 42% per pound as compared to 2005 due to increased ore costs andprocessing costs, including TC RCs, price participation and higher freight parity charges. The increase in ore costs was dueto the processing of lower grade ore and higher fuel and wage costs. Maintenance costs also increased due to the increasein the volume of lower grade, harder ore processed. In addition, TC RCs increased by $0.13 per pound due to priceparticipation and the increased average copper price compared to 2005. As well, freight charges increased by $0.13 perpound due, principally, to the delay in completion of the Mopani smelter requiring the Company to export concentrates.
Bwana/Lonshi The strip ratio for the year was 36.2:1. The ore grade mined was 10.3% copper. The decrease in ore mined compared to 2005was due to the increased stripping. Total material mined increased 6% from 2005 despite difficult mining conditions and canprincipally be attributed to the larger mining fleet utilized during the course of 2006.
Production achieved was 3% more than 2005 as Bwana processed more ore at a higher grade in 2006. Total costs increasedby 11% per pound over the 2005 year due to increased processing costs which were impacted by increased oil basedconsumables, sulphur, and electricity costs.
Guelb MoghreinGuelb produced 5,031 tonnes of copper in concentrate in the period from achieving commercial production on October 5,2006 to year end. Production costs were higher than planned primarily due to initial start up processing costs and thecontinued ramp up of production.

FIRST QUANTUM MINERALS LTD. 2006 ANNUAL REPORT
MANAGEMENT’S DISCUSSION & ANALYSIS
44
Fourth Quarter Segmented Information
Table 6: Q4 Selected Segmented Cash Costs and Operating Information (3)
Kansanshi Bwana/Lonshi Guelb
2005 2006 2004 2005 2006 2006C CostsCombined Costs Kansanshi (per lb) (1)
Mining $0.06 $0.14Processing $0.38 $0.62Site Administration $0.04 $0.04TC RCs $0.21 $0.27Gold / Acid credit $(0.04) $(0.05)
Combined Cash Costs $0.65 $1.02Combined Total Costs $0.76 $1.21Cathode Costs (per lb) (1)
Mining $0.06 $0.12 $0.21 $0.49 $0.34Processing $0.42 $0.68 $0.26 $0.34 $0.43Site Administration $0.04 $0.04 $0.04 $0.09 $0.07TC RCs - $0.08 - - -Gold / Acid credit - $(0.02) $(0.03) $(0.08) $(0.09)
Cathode Cash Costs $0.52 $0.90 $0.48 $0.84 $0.75Cathode Total Costs $0.63 $1.08 $0.58 $1.16 $1.00Concentrate Costs (per lb) (1)
Mining $0.06 $0.18 0.13Processing $0.30 $0.51 0.77Site Administration $0.05 $0.04 0.08TC RCs $0.57 $0.63 0.86Gold / Acid credit $(0.11) $(0.11) (0.15)
Concentrate Cash Costs $0.87 $1.25 1.69Concentrate Total Costs $0.98 $1.47 2.18
Production StatisticsWaste mined (000’s tonnes) 5,240 7,123 2,926 5,918 4,081 1,719Ore mined (000’s tonnes) 1,499 2,380 261 209 80 400Ore grade (%) 1.9 1.4 6.4 6.1 10.4 1.5Sulphide ore processed (000’s tonnes) 580 1,212 334Oxide ore processed (000’s tonnes) 1039 1,080 256 397 294Sulphide ore grade processed (%) 2.0 0.9 2.0Oxide ore grade processed (%) 1.9 1.6 5.0 3.6 4.3Copper cathode produced (tonnes) 18,324 19,006 10,942 12,662 12,479Copper in concentrate produced (tonnes) 11,234 10,015 5,031Concentrate grade (2) (%) 28.7 26.9 21.3
(1) For the definition of cash and total costs, reference should be made to Section 10
(2) Refers to contained copper in concentrate.
(3) Excludes pre-commercial production
Kansanshi The total material mined increased 41% over the same period in 2005. This increase was attributable to the arrival ofadditional drilling units, medium sized excavators and trucks. As well, major haul roads and pit ramps were upgradedwhich significantly minimized delays by rain. Training was also intensified on operating in slippery conditions, which alsohad a significant effect on production during the wet season.
Cathode total costs increased 71% per pound compared to the same period in 2005 due to increased ore costs, processingcosts and tolling charges. The increase in ore costs was due to the processing of lower grade ore and higher fuel and wagecosts. The processing of lower grade ore also led to increased leach costs as the acid consumption increased 46% due tothe increase and type of ore processed. In addition, acid prices increased due to a shortage of surplus acid from the Bwanaacid plant requiring Kansanshi to purchase acid from other vendors at higher prices. Tolling charges from processing copperin concentrates at the Mufulira smelter returned as cathodes were not incurred in the same period in 2005. The balance ofthe increase is explained by higher maintenance costs associated with the processing of higher volumes of harder ore.

FIRST QUANTUM MINERALS LTD. 2006 ANNUAL REPORT 45
MANAGEMENT’S DISCUSSION & ANALYSIS
Included within the cathode production were 17,201 tonnes from the SX/EW process and 1,805 tonnes produced from thetolling of copper concentrates at the Mufulira smelter. There was no tolled copper cathode production in the same periodof 2005. Production increased 4% over the same period in 2005; however 10% of this production was due to the tolling ofcopper in concentrates resulting in a production decrease of 6% in the SX/EW process. This decrease in production was dueto the processing of lower grade ore as compared to the same period in 2005.
Concentrate production was 11% lower than the same period in 2005 primarily due to the processing of lower grade oreduring the quarter. Concentrate total costs increased 50% per pound as compared to the same period in 2005 due,principally, to increased ore costs and processing costs. The increase in ore costs was due to the processing of lower gradeore and higher fuel and wage costs. Maintenance costs also increased due to the increase in the volume of lower grade,harder ore processed. As well, freight charges increased due, principally, to the delay in completion of the Mopani smelterrequiring the Company to export concentrates.
Bwana/Lonshi The strip ratio for the quarter was 51:1. Total material mined decreased 32% over the same period of 2005, principally dueto the high water levels and difficult mining conditions typically associated with dolomite rock formations. Ore mineddecreased 62%, due to the mining of waste in the North pushback and increased drill and blast in the pit due to dolomiterock. Notwithstanding this, copper production has been maintained as a result of the significant increase in the high gradeore mined from an average of 6.1% to 10.4%. This high grade ore was blended with low grade ore, previously stockpiled atLonshi, to bring the processed ore grade down to approximately 4.3%.
Production remained comparable with the same period in 2005; however total costs decreased by 14% per pound ascompared to the same period in 2005 due to lower ore costs and depreciation charges. Ore costs decreased by 30% due tothe processing of higher grade ore in the fourth quarter of 2006. This was offset by an increase in processing costs of 28%due, principally, to increased oil based consumables, sulphur, and electricity costs. In addition, depreciation chargesdecreased by 32% as the depreciable capital base of Bwana/Lonshi was lower than during the same period in 2005.
Guelb MoghreinCommercial production was achieved on October 5, 2006. Production costs are higher than planned primarily due to initialstart up processing costs and the continued ramp up of production.
7. Balance Sheet Discussion
AssetsThe Company’s assets increased 134% from the previousyear. Current assets of $564.8 million increased 141% due,principally, to increases in cash, accounts receivable andinventory.
Cash and cash equivalents increased by $166.6 millionfrom the previous year due to higher cash flows resultingfrom the higher net income. In addition, the Company had$15.0 million in restricted cash that was being held fordebt servicing requirements related to the corporaterevolving and term loan facility.
Accounts receivable increased $79.9 million from theprevious year due to the provisional pricing of coppersales and increased sales volumes. The tonnes ofprovisionally priced copper at December 31, 2006increased by 52% compared to December 31, 2005 andthe provisional LME copper price increased from $2.08 to$2.85 per pound.
Inventory increased $86.5 million from the previous year due to increases in ore stockpiles of $10.4 million, increases infinished product inventory of $33.0 million and increases in consumable stores inventory of $42.2 million. As at December31, 2006 the Company had approximately 15,000 tonnes of contained copper in concentrate inventoried at Kansanshi andGuelb.
Investments increased by $35.6 million during the year as the Company acquired marketable securities that were being heldfor long-term investment purposes.
60,000
50,000
40,000
30,000
20,000
10,000
Q1/05 Q2/05 Q3/05 Q4/05 Q1/06 Q2/06 Q3/06 Q4/06
12,028 11,717 13,131 12,662 11,718 13,569 13,302 12,479
16,956 23,065 29,558 30,368 35,611 32,178 29,021
28,673
36,196
42,220 42,086
49,18045,480
5,031
46,531
12,028
GuelbKansanshiBwana
Tonnes of Contained Copper
$1.40
$1.20
$1.00
$0.80
$0.60
$0.40
Q1/05 Q2/05 Q3/05 Q4/05 Q1/06 Q2/06 Q3/06 Q4/06
Finance OtherDepreciationPrice participation in refining chargesTreatment, refining & freight chargesNet Processing CostsMining Costs
$ per pound
$0.20
$0.75$0.80
$0.87 $0.89
$1.02$1.97
$1.13
$1.24
$0.58 $0.60$0.64
$0.71
$0.82$0.87
$0.90
$1.00
Cash Costs
Dec 04
$1,800
Dec 05 Dec 06
$200
$600
$1,000
$1,400
$473.1
$746.5
$1,744.4Cash & cash equivalentOther current assetsProperty, plant & equipment
$ Millions
Total Assets
$1,600
$1,200
$800
$400
Dec 04
$900
Dec 05 Dec 06
$100
$300
$500
$700
$313.0 $412.6
$720.7
Current & other liabilitiesFuture income tax liabilityLong-term debt
$ Millions
Total Liabilities
$800
$600
$400
$200
Chart 3: Assets Chart 4: Liabilities

FIRST QUANTUM MINERALS LTD. 2006 ANNUAL REPORT
The net increase in property, plant and equipment of $596.8 million was due to the Company’s acquisition of Adastra (referto ‘Section 8 – Other Matters’ under Adastra Acquisition) and the Company’s continuing investment in Guelb, Frontier andthe upgrades at Kansanshi including the high pressure leach project.
Total other assets and deferred charges were $76.4 million, which comprised deferred stripping assets of $44.6 million,deferred finance fees of $10.0 million, prepaid power and other charges of $16.7 million, future income tax asset of $2.5million, and unrealized fair value of derivative instruments of $2.6 million. The increase in other assets and deferred chargesof $37.6 million was due, principally, to the increased stripping at Kansanshi, Comisa and Guelb.
LiabilitiesThe Company’s liabilities increased 75% from the previousyear. Current liabilities of $271.9 million increased 72%primarily due to increases in current income taxes payableof $93.9 million.
The total long-term debt (including current portion)increased by $59.9 million to fund the continuingdevelopment of Kansanshi, Guelb and Frontier projects.
Other liabilities, including the current portion, was $57.6million, which comprised of unrealized fair value ofderivative liability of $26.6 million, deferred premiumobligations of $8.5 million, asset retirement obligationsof $5.0 million and other deferred payables of $17.4million.
The future income tax liability increased by $130.0 million,of which, $109.5 million was related to the purchase priceallocation on the acquisition of Adastra. The balance ofthe increase was primarily related to timing differences between the recognition of depletion and amortization foraccounting purposes and capital allowances for taxation purposes.
Shareholders’ EquityDuring the year, the Company issued approximately 4.7 million common shares as part of the Adastra acquisition (refer tosection 8 of the MD&A for further details).
Table 7: Financial Position – Equity, Dividends and Working Capital2004 2005 2006
Dec 31 Dec 31 Dec 31Equity accounts ($ millions) $161.8 $166.6 $396.0Retained earnings ($ millions) $(4.0) $144.8 $539.1Shareholders’ equity ($ millions) $157.8 $311.4 $935.1Weighted average # shares (000’s) (1) 60,123 61,498 65,088Diluted weighted average # shares (000’s) 61,235 63,011 66,442Outstanding # shares (000’s) 61,239 61,674 67,291 Interim dividend declared (CA$ per share) – 0.020 0.095Final dividend (CA$ per share) (2) 0.060 0.265 –Working capital ($ millions) 33.9 76.2 292.9
(1) The weighted average number of shares is calculated after reducing the shares outstanding by the number of shares acquiredunder the new long-term incentive plan, as these shares are treated as treasury shares
(2) The 2006 final dividend has yet to be declared
During the third quarter of 2006, the Company implemented a new employee long-term incentive plan, which provides forthe award of performance stock units (“PSUs”) and restricted stock units (“RSUs”) in such amounts as are approved by theCompany’s Compensation Committee. Each PSU entitles participants, which includes directors, officers, and employees, toreceive one common share of the Company at the end of a three year period if certain performance and vesting criteriahave been met. Each RSU entitles the participant to receive one common share of the Company subject to vesting criteria.
The Company established an independent trust to purchase on the open market the common shares necessary to satisfythe PSUs and RSUs issued. The trust purchased 276,021 common shares of the Company with a value of $15.6 million.The Company consolidated the trust as it constituted a variable interest entity. Consequently, the shares purchased by thetrust to satisfy obligations under the plan were recorded as treasury shares in shareholders’ equity.
As at December 31, 2006, the Company had 1,979,000 options outstanding. The weighted average exercise price of theoptions was CA$18.69.
MANAGEMENT’S DISCUSSION & ANALYSIS
46
60,000
50,000
40,000
30,000
20,000
10,000
Q1/05 Q2/05 Q3/05 Q4/05 Q1/06 Q2/06 Q3/06 Q4/06
12,028 11,717 13,131 12,662 11,718 13,569 13,302 12,479
16,956 23,065 29,558 30,368 35,611 32,178 29,021
28,673
36,196
42,220 42,086
49,18045,480
5,031
46,531
12,028
GuelbKansanshiBwana
Tonnes of Contained Copper
$1.40
$1.20
$1.00
$0.80
$0.60
$0.40
Q1/05 Q2/05 Q3/05 Q4/05 Q1/06 Q2/06 Q3/06 Q4/06
Finance OtherDepreciationPrice participation in refining chargesTreatment, refining & freight chargesNet Processing CostsMining Costs
$ per pound
$0.20
$0.75$0.80
$0.87 $0.89
$1.02$1.97
$1.13
$1.24
$0.58 $0.60$0.64
$0.71
$0.82$0.87
$0.90
$1.00
Cash Costs
Dec 04
$1,800
Dec 05 Dec 06
$200
$600
$1,000
$1,400
$473.1
$746.5
$1,744.4Cash & cash equivalentOther current assetsProperty, plant & equipment
$ Millions
Total Assets
$1,600
$1,200
$800
$400
Dec 04
$900
Dec 05 Dec 06
$100
$300
$500
$700
$313.0 $412.6
$720.7
Current & other liabilitiesFuture income tax liabilityLong-term debt
$ Millions
Total Liabilities
$800
$600
$400
$200
Chart 3: Assets Chart 4: Liabilities

DividendsIn December 2005, the Company announced a dividend policy whereby dividends would be declared based on thecompany’s earnings performance and cash flow position. For the 2005 year the Board determined that the annual dividendwould be 10% of after tax profits. Consistent with this policy, the Company declared a final dividend for 2005 of CA$0.265per share (26.5 Canadian cents) payable to shareholders of record as of April 19, 2006. This payment was made on May 10,2006. An interim dividend for the 2006 financial year, equivalent to one third of the prior year’s total dividend, of CA$0.095(9.5 Canadian cents) was declared in August 2006 and paid in September 2006 to shareholders of record on August 22,2006.
Working capitalAs at December 31, 2006, the working capital of the Company was $292.9 million. The increase in the Company’s workingcapital is primarily the result of the positive cash flow from operations.
Contractual Obligations
Table 8: Payments Due by Period
Less than 1– 2 2 – 3 3 – 4 4 – 5 ($ millions) Total 1 year years years years years ThereafterTerm debt 294.9 57.7 55.0 54.9 54.9 52.5 19.9Deferred payments 14.2 11.7 0.4 0.4 0.4 0.4 0.9Commitments 96.1 96.1 - - - - -Asset retirement obligations 5.0 0.5 2.0 - - - 2.5
Included in commitments is $49.5 million related to the Frontier project and $42.9 million related to the high pressureleach project at Kansanshi.
In October 2006, the Company executed final documentation for a $400.0 million corporate revolving term credit facility thatwas used to restructure the Company’s existing project based debt, provide financing for the Frontier project and providea revolving facility to be used for general purposes. The Company drew down the first $225.0 million of the new corporatefacility and repaid all of the Company’s credit facilities, except for the subordinated Kansanshi EIB and GlencoreInternational AG facilities.
8. Other Matters
Adastra AcquisitionThe Company acquired 100% of Adastra in a two step transaction. Adastra was a listed international mining company withits principal asset being the Kolwezi Copper-Cobalt Tailings Project in the DRC. On May 1, 2006, the Company acquired75% of the outstanding shares of Adastra and has therefore consolidated Adastra’s operating results since May 1, 2006. OnAugust 11, 2006, the Company was deemed to have acquired the remaining 25% of the outstanding shares of Adastra.
The acquisition of Adastra has been accounted for as an asset purchase with the total consideration paid being comprisedof:
$000’sIssuance of common shares 234,868Cash 34,972Transaction costs 3,441
273,281
Frontier Copper Deposit, DRCIn May 2004, the Company announced the results of an independent copper-cobalt resource estimate completed at theFrontier project located in Haut Katanga Province, DRC. In January 2006, the Frontier Environmental Impact Assessment andEnvironmental Management Plan were formally approved by the Congolese Ministry of Mines and the Exploitation Permitwas granted in February 2006.
In November 2006, the Company announced details of the construction of a $226 million facility producing an average of73,000 tonnes of copper in concentrate per year over a mine life of 19 years and an updated resource estimate. Average life-of-mine cash costs including TC RCs and freight parity charges are expected to be $1.04 per pound of finished copper,based on the most recent engineering study. Construction activities began in April of 2006 and commercial production isforecast to begin in the third quarter of 2007.
As at December 31, 2006, the Company had capitalized $116.4 million (2005: $9.9m) in development costs, civil constructionand plant construction and design for Frontier.
FIRST QUANTUM MINERALS LTD. 2006 ANNUAL REPORT 47
MANAGEMENT’S DISCUSSION & ANALYSIS

FIRST QUANTUM MINERALS LTD. 2006 ANNUAL REPORT
MANAGEMENT’S DISCUSSION & ANALYSIS
48
Kashime Copper Prospect, ZambiaA preliminary inferred oxide resource has been completed by independent consultants and in February 2006, a program ofcombined reverse circulation and diamond drilling was initiated to improve definition. Oxide resource drilling comprisingtotals of 9,100 metres of core drilling and 6,500 metres of reverse circulation was completed in July and assay results for acidsoluble copper are still being received. A re-run of the oxide resource estimation will commence as soon as all assay datahas been received and validated to determine the economics of this project.
Kibamba Copper Prospect, DRCOn March 27, 2006, the Company announced a new discovery at its Kibamba copper prospect in the DRC. Drilling is ongoingand the results will be released in due course.
Investments – CarlisaThe Company holds an 18.8% interest in Carlisa Investment Corp. (“Carlisa”), which holds a 90% interest in Mopani. Thecarrying value of this investment as at December 31, 2006 was $9.5 million, unchanged since 2002. During the 2006 year,Mopani produced approximately 135,000 tonnes of finished copper and 1,400 tonnes of cobalt. Mopani is currently carryingout important capital upgrades at the mine including the construction of a new smelter at Mufulira, which will increase itshandling capacity from 420,000 tonnes to initially 720,000 tonnes of copper concentrate per year and eventually 850,000tonnes of copper concentrate per year. The smelter began commissioning in September and is expected be fully operationalduring the first quarter of 2007. The Mufulira smelter will provide smelting offtake for all Kansanshi and Frontierconcentrates. As at December 31, 2006, Mopani had total assets of over $1 billion. As the majority owner of Mopani is aprivate company not registered in Zambia, only limited public information is available.
Financial InstrumentsFrom time to time, to satisfy the requirements of its lending institutions and to manage copper price risk exposure, theCompany enters into derivative instruments to reduce the risk exposure to copper and gold prices, foreign currency, andinterest rate movements. These instruments consist of forward and option contracts, interest rate protection contracts,and foreign currency protection contracts.
As at December 31, 2006, the following derivative positions were outstanding:
Table 9: Derivative Positions
2007 2008 2009 Total Fair Value
Copper Put options (tonnes) 86,016 – – 86,016 $0Price ($/tonne) $1,800 – –GoldPut options (oz) 37,380 24,060 38,028 99,468 $3Price ($/oz) $350 $350 $350Forward Contracts (oz) 37,380 24,060 38,028 99,468 $(26,635)Price ($/oz) $400 $400 $400OtherInterest rate swaps $169Cross currency swaps $2,416
The Company recorded $58.2 million in derivative instrument losses during the year. Included in these losses were cashsettlements on 24,000 tonnes of collar option contracts of $49.3 million. The Company also made cash settlement andpremium payments on copper put and gold put and forward option contracts of $11.1 million. These losses were the directresult of the appreciation of the copper and gold price during the year.
SeasonalityThe Company’s results as discussed in this MD&A are subject to seasonal aspects, in particular the wet season in DRC andZambia. The wet season in the DRC and Zambia generally starts in November and continues through until April, with theheaviest rainfall normally experienced in the months of January, February and March. As a result of the wet season, pitaccess and the ability to mine ore is lower in the first quarter of the year than other quarters and the cost of mining is alsohigher. In addition, the Company’s exploration program is generally curtailed during the wet season due to site accessissues.
Rainfall for the month of December 2006 was the highest monthly amount on record for each operation in Zambia and theDRC and continued throughout January and February 2007. The rainfall had an impact on the fourth quarter operatingresults, which has not been quantified, and had a minor impact on various project activities.

FIRST QUANTUM MINERALS LTD. 2006 ANNUAL REPORT 49
MANAGEMENT’S DISCUSSION & ANALYSIS
9. Outlook
Production ForecastOn a group basis, the Company expects to produce approximately 240,000 – 250,000 tonnes of copper in 2007, which is anincrease of 32% to 38% over 2006 copper production. This expected production includes approximately 145,000 tonnesfrom Kansanshi, approximately 45,000 tonnes from Bwana/Lonshi, approximately 30,000 tonnes from Guelb Moghrein, andapproximately 30,000 tonnes from Frontier. Group cash costs are expected to be in the range of $0.90 to $0.95 per poundof copper for 2007 before considering the impact of the accounting change for the removal of deferred stripping.
As of December 31, 2006, due to the continued lack of smelter capacity on the Zambian Copperbelt, the Company hadstockpiled approximately 9,000 tonnes of contained copper in concentrates. In addition, approximately 6,000 tonnes ofcontained copper has been stockpiled at Guelb Moghrein. These stockpiles are expected to be fully processed in 2007.
TC and RC terms for the majority of concentrate treatment are based on annual Japanese Smelter Pool benchmarks and for2007 have been settled at $60 per tonne of concentrate (TC), and 6.0 cents per pound of copper (RC) with no priceparticipation.
KansanshiDuring the first two months of 2007, Kansanshi produced approximately 24,000 tonnes of copper, which included 15,500tonnes of copper cathode and 8,500 tonnes of copper in concentrate. In 2007, the Mufulira smelter will process the majorityof Kansanshi’s concentrate. Kansanshi cash costs for 2007 are forecast in the range of $0.90 to $0.95 per pound of copperbefore considering the impact of the accounting change for the removal of deferred stripping.
Construction of a second sulphide crushing and milling circuit expansion is currently underway. Design work is wellprogressed and the majority of major equipment and long lead items have been purchased. Site works will begin in the dryseason (April). The expansion will increase sulphide throughput to 12 million tonnes per year beginning in 2008 and assistin treating the harder ore expected over the next few years. The expansion will result in increases in copper production from2008 onwards. The total capital cost for the throughput expansion is expected to be approximately $60 million, excludingmining equipment.
During the 2006 year, orders were placed for more mining equipment. It was discovered that more ore blending for both theoxide and sulphide ores were needed to accommodate variations in grade, hardness and acid consumption. The intentionof the additional mining equipment was to improve the flexibility in the pit by enabling additional ore exposure. Some of thisequipment arrived in mid 2006, which has already increased the exposure of additional high grade ore and has offset thecontinuing impact of lower grade sulphide ore on copper production in January and February of 2007.
At Kansanshi, the Company is investing in a high pressure leach (“HPL”) facility to treat a portion of the increased copperconcentrate production. The main components of the HPL facility are two autoclaves, an oxygen plant and an additional35,000 tonne per annum solvent extraction and electrowinning (“SX/EW”) facility. The total HPL capital cost is budgeted at$100 million including an upgrade to the Zesco power supply to Kansanshi and working capital requirements. The newSX/EW facility has been commissioned and is currently in use. This enabled the mine to exploit higher grade oxides inJanuary and February of 2007. Construction of all remaining areas was completed in 2006, and commissioning of theautoclaves commenced in November.
The commissioning of the autoclaves required a very thorough and diligent approach to testing and proving all systemsassociated with the circuit. Part of the commissioning process includes the need to have a controlled curing of the newbrickwork in the autoclave by raising the temperature and pressure in a stepped manner with hold periods of time, followedby an equally careful cooling period, internal visual inspection, and an autoclave pressure test. These activities requiredapproximately 3 weeks, and were successfully completed in January. During process testing of the high pressure circuits andthe slurry circuits, some of the high pressure valves on the autoclave exhibited an unsatisfactory amount of pressureleakage. New valves and spares, which had been ordered, have not yet been received as of the date of this report.Consequently, the existing valves have been dispatched for refurbishment by a specialist workshop. Upon receipt of therefurbished valves, process commissioning will continue with the introduction of slurry to the autoclave.
Bwana/LonshiDuring the first two months of 2007, Bwana/Lonshi exhausted its exposed ore, which has impacted the early part of 2007.Hence, during the first two months of 2007, Bwana/Lonshi has produced approximately 3,500 tonnes of copper cathode,well below its average past production. This diminished production results from the need to advance the waste stripping ata time of high rainfall. However, annual production estimates remain unchanged. Cash costs for 2007 are forecast in therange of $0.75 to $0.80 per pound of copper before considering the impact of the accounting change for the removal ofdeferred stripping. The Company continues to assess the alternative and most beneficial uses for the Bwana processingplant after the Lonshi ore has been exhausted in 2008. The Company has and will continue to process external orepurchased from third parties, to exploit the full production capacity at Bwana.

FIRST QUANTUM MINERALS LTD. 2006 ANNUAL REPORT
MANAGEMENT’S DISCUSSION & ANALYSIS
50
Guelb MoghreinAt Guelb Moghrein, the first copper in concentrate was produced in July 2006. Management determined that commercialproduction (i.e. 65% of design capacity) was achieved on October 5, 2006. During the first two months of 2007 GuelbMoghrein produced 4,200 tonnes of copper in concentrate and 9,200 ounces of gold. The process plant is currentlyproducing at a monthly rate of approximately 2,100 tonnes of copper in concentrate per month versus a design output of2,500 tonnes of copper in concentrate per month. Gold production is approximately 4,600 ounces per month which isapproximately 82% of design output. Gold production will increase both with increased copper concentrate volumes andwith higher recovery after the final commissioning of the carbon-in-leach (CIL) gold plant is completed. The Companyexpects to provide unit cost guidance for 2007 in the publication of the first quarter financial results. The Company remainsunable to release detailed information on Guelb Moghrein as the historical resource statement is not compliant withNational Instrument 43-101; however, the Company is currently awaiting assays from a drilling program, to comply with thisinstrument.
FrontierAt Frontier, construction is underway in both Zambia and the DRC. Progress at the Frontier site continues with the plantconstruction on schedule for a July start of commissioning. Excessive rainfall during the wet season has delayed thecompletion of the Run of Mine (ROM) pad and the 220/33kv substation base. The rains have also put the pre-strip miningbehind schedule. The Company continues to forecast a third quarter 2007 start of commissioning at Frontier.
Kolwezi and OtherAt the Kolwezi copper-cobalt project in the DRC, the Company has conducted metallurgical test work and piloting programfor revised process engineering. The Company is considering the construction of an initial 35,000 tonne per year copperfacility and 5,800 tonne per year cobalt facility which would be designed to be expanded to 105,000 tonnes of copper peryear and 17,400 tonnes of cobalt per year. A detailed capital estimate is currently being prepared for presentation to theproject stakeholders.
A large exploration program was carried out between May and October of 2006 with several drilling programs targetingprospects identified in 2005 including Kashime and Kibamba. Results of this program will be published when they arereceived.
The Company has adopted the strategy of making investments in public companies. The positions may be increased ordecreased at any time. At December 31, 2006, the Company had invested $35.6 million in this program.
10. Non-GAAP Measures, Future Changes in Accounting Policies, Critical Accounting Policies and Other
Non-GAAP Measures
Calculation of Cash and Total CostsThe consolidated cash (C1) and total (C3) costs presented for the Company are a non-GAAP measure that is prepared on abasis consistent with the industry standard Brook Hunt definitions. In calculating the cash and total costs for each segment,the costs are prepared on the same basis as the segmented financial information that is contained in the financialstatements.
For the purposes of calculating the cash costs at Kansanshi, TC RCs that are normally deducted from concentrate revenuesare added to the cash costs to show the cash costs of producing finished copper. The revenues presented in the incomestatement for concentrates are shown net of these deductions and therefore the cost of sales in the financial statementsdoes not include treatment and refining charges.
Cash costs, therefore, include all mining and processing costs less any profits from by-products such as gold or acid thatis allocated to that segment. In addition, treatment and refining revenue deductions on concentrates are added to cash coststo arrive at an approximate cost of finished copper. Total costs are cash costs plus depreciation, interest and realized foreignexchange costs.
The cash and total costs per pound presented in this MD&A have only been calculated post commercial production,therefore, any costs and production prior to commercial production have not been considered in determining the cash andtotal costs of the consolidated group or segments except for capitalized costs, which are depreciated and included in totalcost per pound.
Calculation of Operating Cash Flow per ShareThe calculations of operating cash flow per share, before and after working capital movements, are a non-GAAP measurethat is prepared for analysts’ use to measure the Company’s cash flows from operations on a per share basis.

FIRST QUANTUM MINERALS LTD. 2006 ANNUAL REPORT 51
MANAGEMENT’S DISCUSSION & ANALYSIS
In calculating the operating cash flow per share, before and after working capital movements, the operating cash flowcalculated for GAAP purposes is divided by the weighted average common shares outstanding for the respective period.
Future Changes in Accounting Policies
Deferred Stripping The CICA Emerging Issues Committee (“EIC”) has issued EIC – 160 Stripping Costs Incurred in the Production Phase of aMining Operation. EIC – 160 requires stripping costs to be accounted for as variable production costs to be included in thecosts of inventory produced, unless the stripping activity can be shown to be a betterment of the mineral property, in whichcase the stripping costs would be capitalized. Betterment occurs when stripping activity increases future output of the mineby providing access to additional sources of reserves.
The Company will adopt the provisions of this EIC on a retroactive basis, effective January 1, 2007. As a result of thisadoption, the Company will retroactively restate the financial statements for first quarter of 2007 as follows:
As stated at RestatedDecember 31, 2006 December 31, 2006
$ $Inventory 147,374 169,158Other assets (includes deferred stripping) 66,287 21,679Future income tax liability (173,319) (167,572)Minority interest (88,646) (85,407)Retained earnings (539,084) (525,246)
Financial InstrumentsIn April 2005, the Canadian Accounting Standards Board issued new accounting standards dealing with the recognition,measurement and disclosure of financial instruments, hedges and comprehensive income, together with manyconsequential changes throughout the CICA Handbook. These new standards will affect the Company’s interim and annualfinancial statements beginning in the first quarter of 2007. These new standards are as follows:
Financial Instruments – Recognition and Measurement, Section 3855This standard prescribes when a financial asset, financial liability, or non-financial derivative is to be recognized on thebalance sheet and whether fair value or cost-based methods are used to measure the amounts. It also specifies howfinancial instrument gains and losses are to be presented.
The Company has designated its marketable security investments as available for sale, which at 31 December 2006 wouldhave resulted in a reduction of investments of $2.9 million and a decrease in comprehensive income of $2.9 million.
The Company currently accounts for derivatives on a mark to market basis (except embedded derivatives), therefore, therewill be no change upon the adoption of this new standard. However, the Company is currently assessing the impact of anyembedded derivatives to the Company.
Hedges, Section 3865This standard is applicable when a company chooses to designate a hedging relationship for accounting purposes. Theadoption of this standard is not expected to impact the Company.
Comprehensive Income, Section 1530This standard requires the presentation of a statement of comprehensive income and its components. Comprehensiveincome includes both net earnings and other comprehensive income. Other comprehensive income for the Company willinclude holding gains and losses on investments designated as available for sale.
Critical Accounting Policies
Mineral properties and deferred exploration costsThe Company expenses exploration and associated costs relating to non-specific projects/properties in the period they areincurred. For specific properties or projects any acquisition, exploration, or development costs are deferred until the projectto which they relate is sold, abandoned, impaired or placed into production. Property acquisition and mine developmentcosts, including costs incurred during production to expand ore reserves within existing mine operations, are deferred anddepleted on a units-of-production basis over their reserves.
Management’s estimates of mineral prices, recoverable reserves, and operating, capital and reclamation costs are subjectto certain risks and uncertainties which may affect the recoverability of mineral property costs. Although management hasmade its best estimate of these factors, it is possible that changes could occur in the near term that could adversely affectmanagement’s estimate of the net cash flow to be generated from its projects.

FIRST QUANTUM MINERALS LTD. 2006 ANNUAL REPORT
MANAGEMENT’S DISCUSSION & ANALYSIS
52
The Company performs impairment tests on property, plant and equipment and mineral properties when events orcircumstances occur which indicate the assets may not be recoverable. Where information is available and conditionssuggest impairment, estimated future net cash flows for each project are calculated using estimated future prices, mineralresources, and operating, capital and reclamation costs on an undiscounted basis. When these estimated future cash flowsare less than the carrying value, the project is considered impaired. Reductions in the carrying value of each project wouldbe recorded to the extent the net book value of the investment exceeds the discounted estimated future cash flows. Whereestimates of future net cash flows are not available and where other conditions suggest impairment, management assesseswhether the carrying value can be recovered.
Pre-production costsDetermination of the start of commercial production is an important consideration as during the development phase costswill continue to be capitalized/deferred while during the production phase these costs would be treated as operatingexpenses. As noted in the Company’s financial statements, the Company defers all production costs and revenues until sucha time that the project achieves commercial production.
The exercise of assessing when commercial production levels are achieved is not straight-forward and requiresconsideration of many factors including, but not limited to, when: a nominated percentage of design capacity for the mineand mill has been achieved; mineral recoveries reaching or exceeding expected levels; and the achievement of continuousproduction. The Company, when evaluating whether or not commercial production has been achieved, will generallyconsider that commercial production has been achieved when between 65% and 70% of design capacity has been achievedcontinuously for a period of at least a week and recoveries are approaching expected levels. Notwithstanding, each projectis also viewed in isolation and specific circumstances may exist that alter the above general framework on any individualproject.
Income taxesThe Company uses the asset and liability method of accounting for future income taxes. Under this method, future incometax assets and liabilities are recognized for temporary differences between the tax and accounting bases of assets andliabilities as well as for the benefit of losses available to be carried forward to future years. The amount of future tax assetsrecognized is limited to the amount that is more likely than not to be realized.
The determination of the Company’s tax expense for the year and its future tax liabilities and assets involves significantmanagement estimation and judgement involving a number of assumptions. In determining these amounts managementinterprets tax legislation in a variety of jurisdictions and makes estimates of the expected timing of the reversal of futuretax assets and liabilities. Management also makes estimates of the future earnings which affect the extent to whichpotential future tax benefits may be used. The Company is subject to assessment by various taxation authorities which mayinterpret tax legislation in a manner different from the Company. These differences may affect the final amount or thetiming of the payment of taxes. When such differences arise the Company makes provision for such items based onmanagement’s best estimate of the final outcome of these matters.
Stock Based CompensationThe Company grants stock options under its stock option plan and PSUs and RSUs under its new long-term incentive planto its directors and employees. The Company expenses the fair value of stock options, PSUs and RSUs granted over thevesting period.
The fair value of stock options is determined using an option pricing model that takes into account, as of the grant date, theexercise price, the expected life of the option, the current price of the underlying stock and its expected volatility, expecteddividends on the stock, and the risk-free interest rate over the expected life of the option. Cash consideration receivedfrom employees when they exercise the options is credited to capital stock.
The fair value of PSUs is determined using a valuation model that takes into account, as of the grant date, the expected lifeof the PSU, expected volatility, expected dividend yield, and the risk free interest rate over the life of the PSU, to generatepotential outcomes for stock prices, which are used to estimate the probability of the PSUs vesting at the end of theperformance measurement period.
The fair value of RSUs is determined by reference to the share price of the Company at the date of grant.
Asset retirement obligations The Company records asset retirement obligations at fair value in the period in which the liability is incurred. Fair value isdetermined based on the estimated future cash flows required to settle the liability discounted at the Company’s creditadjusted risk free interest rate. The liability is adjusted for changes in the expected amounts and timing of cash flowsrequired to discharge the liability and accreted over time to its full value. The associated asset retirement costs arecapitalized as part of the carrying amount of the long-lived asset and amortized over the expected useful life of the asset.

FIRST QUANTUM MINERALS LTD. 2006 ANNUAL REPORT 53
MANAGEMENT’S DISCUSSION & ANALYSIS
Critical Accounting EstimatesIn preparing the financial statements, management has to make estimates and assumptions that affect the reportedamounts of assets, liabilities, revenues and expenses. Specifically, estimates and assumptions are made in regards toreserve and resource estimation; future copper, cobalt, sulphuric acid and gold prices; foreign currency exchange rates;stock prices; estimated costs of future production; changes in government legislation and regulations; estimated futureincome tax amounts; and the availability of financing and various operational factors.
Based on historical experience, current conditions and expert advice, management makes assumptions that are believedto be reasonable under the circumstances. These estimates and assumptions form the basis for judgments about thecarrying value of assets and liabilities and reported amounts for revenues and expenses. Different assumptions wouldresult in different estimates and actual results may differ from results based on these estimates. These estimates andassumptions are also affected by management’s application of accounting policies. Critical accounting estimates are thosethat affect the consolidated financial statements materially and involve a significant level of judgment by management. Thefollowing section outlines those critical accounting policies that have changed since the filing of the Company’s 2005Audited Financial Statements or that are particularly relevant to the current year.
As is common in the mining industry, a number of the Company’s sales agreements require final prices to be determined ina future period. For this purpose, it is necessary for management to estimate the final price received based on currentprices for both copper and gold. As a result of the significant volatility in current metal prices, actual results may materiallydiffer from those initially recorded when final prices are determined. Management follows the industry practice of re-pricing any provisional priced sales at the end of each reporting period and any differences / adjustments are recorded inthe current period’s earnings.
Disclosure Controls and ProceduresThe Company’s disclosure controls and procedures are designed to provide reasonable assurance that all relevantinformation is communicated to senior management, to allow timely decisions regarding required disclosure.
An evaluation of the effectiveness of the Company’s disclosure controls and procedures, as defined under the rules of theCanadian Securities Administration, was conducted as of December 31, 2006 under the supervision of the Company’sDisclosure Committee and with the participation of management. Based on that evaluation, the Chief Executive Officer andChief Financial Officer concluded that the Company’s disclosure controls and procedures were effective.
Internal Controls Over Financial ReportingInternal controls over financial reporting are designed to provide reasonable assurance regarding the reliability of theCompany’s financial reporting and the preparation of financial statements in compliance with Canadian generally acceptedaccounting principles.
An evaluation of the design effectiveness of the Company’s internal controls over financial reporting was conducted as ofDecember 31, 2006 by the Company’s management, including the Chief Executive Officer and Chief Financial Officer. Basedon this evaluation, management has concluded that the design of the Company’s internal controls over financial reportingwas effective.
There were no changes in the Company’s internal controls over financial reporting during the year ended December 31,2006 that have materially affected, or are reasonably likely to materially affect, its internal controls over financial reporting.
Forward Looking StatementsCertain information contained in the Management’s Discussion and Analysis constitutes “forward-looking statements”within the meaning of the Private Securities Litigation Reform Act of 1995 and forward-looking information under applicableCanadian securities legislation. Such forward-looking statements or information, including but not limited to those withrespect to the prices of gold, copper, cobalt and sulphuric acid, estimated future production, estimated costs of futureproduction, the Company’s hedging policy and permitting time lines, involve known and unknown risks, uncertainties, andother factors which may cause the actual results, performance or achievements of the Company to be materially differentfrom any future results, performance or achievements expressed or implied by such forward-looking statements orinformation. Such factors include, among others, the actual prices of copper, gold, cobalt and sulphuric acid, the factualresults of current exploration, development and mining activities, changes in project parameters as plans continue to beevaluated, as well as those factors disclosed in the Company’s documents filed from time to time with the Alberta, BritishColumbia, and Ontario Securities Commissions, the Autorité des marchés financiers in Quebec, the United States Securitiesand Exchange Commission and the Alternative Investment Market operated by the London Stock Exchange.

FIRST QUANTUM MINERALS LTD. 2006 ANNUAL REPORT
MANAGEMENT’S DISCUSSION & ANALYSIS
55
11. Summary of Quarterly ResultsThe following table sets out a summary of the quarterly results for the Company for the last eight quarters:
Table 10: Summary of Quarterly Results (unaudited)2005 2005 2005 2005 2006 2006 2006 2006
Q1 Q2 Q3 Q4 Q1 Q2 Q3 Q4Statement of Operations and Retained Earnings(millions, except where indicated)Total revenues $38.2 $86.5 $143.0 $176.9 $187.2 $362.5 $328.4 $216.4Cost of sales 16.2 35.0 53.8 46.9 54.5 63.5 72.5 74.1Net earnings 27.2 29.0 39.5 57.1 54.8 150.5 139.1 70.0Basic earnings per share $0.44 $0.47 $0.64 $0.93 $0.89 $2.33 $2.09 $1.04Diluted earnings per share $0.43 $0.46 $0.63 $0.90 $0.86 $2.28 $2.05 $1.02Gross copper selling price (per lb) $1.47 $1.53 $1.77 $2.09 $2.53 $3.71 $3.48 $2.54Realized copper price (per lb) $1.44 $1.42 $1.58 $1.97 $2.26 $3.36 $3.17 $2.32Average LME cash copper price (per lb) $1.44 $1.54 $1.71 $1.95 $2.24 $3.29 $3.48 $3.21Realized gold price (per oz) - $427 $482 $467 $563 $631 $581 $628Average gold price (per oz) $427 $427 $440 $485 $554 $627 $622 $614
Total copper sold (tonnes)(2) 12,000 26,535 39,864 40,203 36,635 48,171 46,227 41,454Total copper produced (tonnes) (3) 12,028 28,673 36,196 42,220 42,086 49,180 45,480 46,531Total gold sold (ounces) - 1,370 7,130 5,766 8,079 9,611 8,863 6,944
Cash Costs (C1) (per lb) (1) $0.58 $0.60 $0.64 $0.71 $0.81 $0.87 $0.90 $1.00Total Costs (C3) (per lb) (1) $0.75 $0.80 $0.87 $0.89 $1.01 $1.07 $1.13 $1.24
Financial Position (millions)Working capital $61.4 $47.1 $32.2 $76.2 $102.0 $234.6 $290.9 $292.9Total assets $523.1 $561.9 $641.5 $746.5 $842.4 $1,401.2 $1,584.5 $1,744.4Weighted average # shares (000’s) 61,267 61,499 61,583 61,639 61,808 64,564 66,615 67,287
Cash Flows from (millions)Operating activities
Before working capital movements $19.7 $43.0 $81.1 $101.0 $105.7 $215.2 $185.5 $85.0After working capital movements 22.9 2.3 69.8 115.5 84.6 150.6 133.5 146.4
Financing activities 24.8 (22.8) (5.1) (1.6) (17.7) 27.1 (41.7) 50.9Investing activities (19.0) (2.3) (57.8) (94.4) (42.4) (94.6) (92.4) (137.5)Cash Flows from Operating activities per share(3)
Before working capital movements 0.32 0.70 1.32 1.64 1.71 3.33 2.78 1.26After working capital movements 0.37 0.04 1.13 1.87 1.37 2.33 2.00 2.18
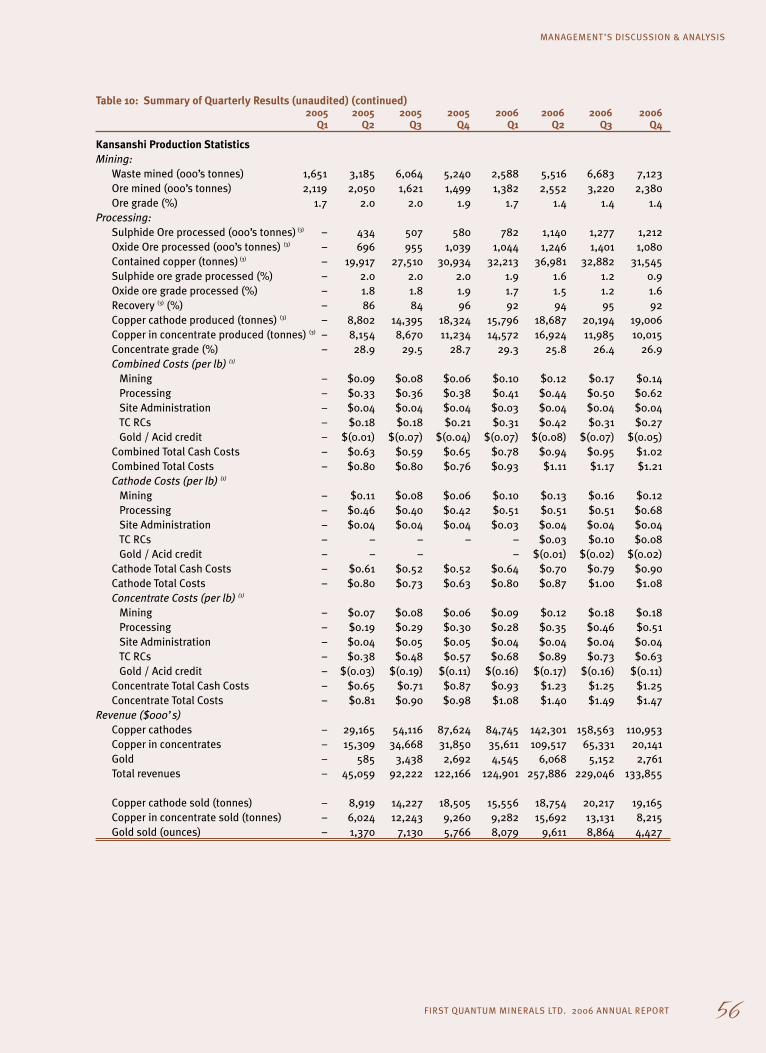
FIRST QUANTUM MINERALS LTD. 2006 ANNUAL REPORT 56
MANAGEMENT’S DISCUSSION & ANALYSIS
Table 10: Summary of Quarterly Results (unaudited) (continued)2005 2005 2005 2005 2006 2006 2006 2006
Q1 Q2 Q3 Q4 Q1 Q2 Q3 Q4
Kansanshi Production StatisticsMining:
Waste mined (000’s tonnes) 1,651 3,185 6,064 5,240 2,588 5,516 6,683 7,123Ore mined (000’s tonnes) 2,119 2,050 1,621 1,499 1,382 2,552 3,220 2,380Ore grade (%) 1.7 2.0 2.0 1.9 1.7 1.4 1.4 1.4
Processing:Sulphide Ore processed (000’s tonnes) (3) – 434 507 580 782 1,140 1,277 1,212Oxide Ore processed (000’s tonnes) (3) – 696 955 1,039 1,044 1,246 1,401 1,080Contained copper (tonnes) (3) – 19,917 27,510 30,934 32,213 36,981 32,882 31,545Sulphide ore grade processed (%) – 2.0 2.0 2.0 1.9 1.6 1.2 0.9Oxide ore grade processed (%) – 1.8 1.8 1.9 1.7 1.5 1.2 1.6Recovery (3) (%) – 86 84 96 92 94 95 92Copper cathode produced (tonnes) (3) – 8,802 14,395 18,324 15,796 18,687 20,194 19,006Copper in concentrate produced (tonnes) (3) – 8,154 8,670 11,234 14,572 16,924 11,985 10,015Concentrate grade (%) – 28.9 29.5 28.7 29.3 25.8 26.4 26.9Combined Costs (per lb) (1)
Mining – $0.09 $0.08 $0.06 $0.10 $0.12 $0.17 $0.14Processing – $0.33 $0.36 $0.38 $0.41 $0.44 $0.50 $0.62Site Administration – $0.04 $0.04 $0.04 $0.03 $0.04 $0.04 $0.04TC RCs – $0.18 $0.18 $0.21 $0.31 $0.42 $0.31 $0.27Gold / Acid credit – $(0.01) $(0.07) $(0.04) $(0.07) $(0.08) $(0.07) $(0.05)
Combined Total Cash Costs – $0.63 $0.59 $0.65 $0.78 $0.94 $0.95 $1.02Combined Total Costs – $0.80 $0.80 $0.76 $0.93 $1.11 $1.17 $1.21Cathode Costs (per lb) (1)
Mining – $0.11 $0.08 $0.06 $0.10 $0.13 $0.16 $0.12Processing – $0.46 $0.40 $0.42 $0.51 $0.51 $0.51 $0.68Site Administration – $0.04 $0.04 $0.04 $0.03 $0.04 $0.04 $0.04TC RCs – – – – – $0.03 $0.10 $0.08Gold / Acid credit – – – – $(0.01) $(0.02) $(0.02)
Cathode Total Cash Costs – $0.61 $0.52 $0.52 $0.64 $0.70 $0.79 $0.90Cathode Total Costs – $0.80 $0.73 $0.63 $0.80 $0.87 $1.00 $1.08Concentrate Costs (per lb) (1)
Mining – $0.07 $0.08 $0.06 $0.09 $0.12 $0.18 $0.18Processing – $0.19 $0.29 $0.30 $0.28 $0.35 $0.46 $0.51Site Administration – $0.04 $0.05 $0.05 $0.04 $0.04 $0.04 $0.04TC RCs – $0.38 $0.48 $0.57 $0.68 $0.89 $0.73 $0.63Gold / Acid credit – $(0.03) $(0.19) $(0.11) $(0.16) $(0.17) $(0.16) $(0.11)
Concentrate Total Cash Costs – $0.65 $0.71 $0.87 $0.93 $1.23 $1.25 $1.25Concentrate Total Costs – $0.81 $0.90 $0.98 $1.08 $1.40 $1.49 $1.47
Revenue ($000’s)Copper cathodes – 29,165 54,116 87,624 84,745 142,301 158,563 110,953Copper in concentrates – 15,309 34,668 31,850 35,611 109,517 65,331 20,141Gold – 585 3,438 2,692 4,545 6,068 5,152 2,761Total revenues – 45,059 92,222 122,166 124,901 257,886 229,046 133,855
Copper cathode sold (tonnes) – 8,919 14,227 18,505 15,556 18,754 20,217 19,165Copper in concentrate sold (tonnes) – 6,024 12,243 9,260 9,282 15,692 13,131 8,215Gold sold (ounces) – 1,370 7,130 5,766 8,079 9,611 8,864 4,427

FIRST QUANTUM MINERALS LTD. 2006 ANNUAL REPORT
MANAGEMENT’S DISCUSSION & ANALYSIS
56
Table 10: Summary of Quarterly Results (unaudited) (continued)2005 2005 2005 2005 2006 2006 2006 2006
Q1 Q2 Q3 Q4 Q1 Q2 Q3 Q4Bwana/Lonshi Production StatisticsMining:
Waste mined (000’s tonnes) 2,596 4,025 4,707 5,918 3,241 5,607 5,915 4,081Ore mined (000’s tonnes) 152 319 300 209 147 183 110 80Ore grade (%) 5.3 5.5 3.9 6.1 8.4 10.7 11.9 10.4
Processing:Oxide Ore processed (000’s tonnes) 264 328 363 397 335 314 322 294Contained copper (tonnes) 13,804 13,354 15,003 14,262 13,401 15,625 15,011 13,037Oxide ore grade processed (%) 5.2 4.1 4.1 3.6 4.0 5.0 4.7 4.3Recovery (%) 87 88 88 89 87 87 89 96Copper cathode produced (tonnes) 12,028 11,717 13,131 12,662 11,718 13,569 13,302 12,479Acid produced (tonnes) 55,275 69,218 64,263 72,040 68,195 71,421 63,830 73,901Surplus acid (tonnes) 49 14,939 7,120 219 937 910 508 8Cathode Costs (per lb) (1)
Mining $0.23 $0.29 $0.43 $0.49 $0.51 $0.32 $0.32 $0.34Processing $0.31 $0.31 $0.30 $0.34 $0.38 $0.35 $0.38 $0.43Site Administration $0.06 $0.06 $0.06 $0.09 $0.10 $0.10 $0.10 $0.07TC RCs – – – – – – – –Gold / Acid credit $(0.02) $(0.09) $(0.05) $(0.08) $(0.09) $(0.08) $(0.06) $(0.09)
Cathode Total Cash Costs $0.58 $0.57 $0.74 $0.84 $0.90 $0.69 $0.74 $0.75Cathode Total Costs $0.75 $0.79 $1.01 $1.16 $1.20 $0.98 $1.00 $1.00
Revenues ($000’s)Copper cathodes 38,172 38,899 49,602 54,694 62,085 104,455 99,283 75,820
Copper cathodes sold (tonnes) 12,000 11,592 13,394 12,438 11,797 13,648 12,954 12,766
Guelb Production StatisticsMining:
Waste mined (000’s tonnes) – – – – 1,156 1,721 1,660 1,719Ore mined (000’s tonnes) – – – – 41 144 179 400Ore grade (%) – – – – 1.9 1.9 1.8 1.5
Processing:Sulphide Ore processed (000’s tonnes) (3) – – – – – – – 334
Contained copper (tonnes) (3) – – – – – – – 6,552Sulphide ore grade processed (%) – – – – – – – 2.0Recovery (3) (%) – – – – – – – 78Copper concentrate produced (tonnes) (3) – – – – – – – 5,031
Concentrate Costs (per lb) (1)
Mining – – – – – – – $0.13Processing – – – – – – – $0.77Site Administration – – – – – – – $0.08TC RCs – – – – – – – $0.86Gold / Acid credit – – – – – – – $(0.15)
Concentrate Total Cash Costs – – – – – – – $1.69Concentrate Total Costs – – – – – – – $2.18
Revenues ($000’s)Copper in concentrates – – – – – – – 5,551Gold – – – – – – – 1,601Total revenues – – – – – – – 7,152Copper concentrates sold (tonnes) – – – – – – – 1,308Gold sold (ounces) – – – – – – – 2,516
(1) For the definition of cash and total costs, reference should be made to Section 10.
(2) Copper sold does not include tonnes sold prior to pre-commercial production.
(3) Copper produced does not include tonnes produced prior to pre-commercial production.

FIRST QUANTUM MINERALS LTD. 2006 ANNUAL REPORT 57
MANAGEMENT’S & AUDITORS’ REPORTS
Management’s Responsibility for Financial ReportingThe consolidated financial statements of First Quantum Minerals Ltd. and the information contained in the annual reporthave been prepared by and are the responsibility of the Company’s management. The consolidated financial statementshave been prepared in accordance with generally accepted accounting principles (GAAP) in Canada and, where appropriate,reflect management’s best estimates and judgements based on currently available information.
Management has developed and is maintaining a system of internal controls to obtain reasonable assurance that theCompany’s assets are safeguarded, transactions are authorized and financial information is reliable.
The Company’s independent auditors, PricewaterhouseCoopers LLP, who are appointed by the shareholders, conduct anaudit in accordance with Canadian generally accepted auditing standards. Their report outlines the scope of their audit andgives their opinion on the consolidated financial statements.
The Audit Committee of the Board of Directors meets periodically with management and the independent auditors to reviewthe scope and results of the annual audit, and to review the consolidated financial statements and related financial reportingmatters prior to approval of the consolidated financial statements.
Philip K.R. Pascall David E. J. MoroneyChairman and Chief Executive Officer Chief Financial Officer
February 24, 2007
Auditors’ Report
To the Shareholders of First Quantum Minerals Ltd.
We have audited the consolidated balance sheets of First Quantum Minerals Ltd. as at December 31, 2006 and 2005 and theconsolidated statements of earnings and retained earnings and cash flows for the years then ended. These financialstatements are the responsibility of the Company’s management. Our responsibility is to express an opinion on thesefinancial statements based on our audits.
We conducted our audits in accordance with Canadian generally accepted auditing standards. Those standards requirethat we plan and perform an audit to obtain reasonable assurance whether the financial statements are free of materialmisstatement. An audit includes examining, on a test basis, evidence supporting the amounts and disclosures in thefinancial statements. An audit also includes assessing the accounting principles used and significant estimates made bymanagement, as well as evaluating the overall financial statement presentation.
In our opinion, these consolidated financial statements present fairly, in all material respects, the financial position of theCompany as at December 31, 2006 and 2005 and the results of its operations and its cash flows for the years then endedin accordance with Canadian generally accepted accounting principles
Chartered Accountants
Vancouver, B.C.
February 24, 2007

FIRST QUANTUM MINERALS LTD. 2006 ANNUAL REPORT
CONSOLIDATED BALANCE SHEET
58
Consolidated Balance Sheet
As at December 31, 2006 and 2005
(expressed in thousands of U.S. dollars, except where indicated)2006 2005
$ $
AssetsCurrent assetsCash and cash equivalents (note 17) 249,544 82,910Restricted cash (note 8) 15,000 20,162Accounts receivable 142,821 62,938Inventory (note 4) 147,374 60,854Current portion of other assets (note 7) 10,108 7,506
564,847 234,370Investments (note 5) 45,171 9,522Property, plant and equipment (note 6) 1,068,118 471,294Other assets (note 7) 66,287 31,325
1,744,423 746,511
LiabilitiesCurrent liabilitiesAccounts payable and accrued liabilities 84,802 63,492Current taxes payable 110,039 16,055Current portion of long-term debt (note 8) 57,713 58,255Current portion of other liabilities (note 9) 19,389 20,377
271,943 158,179Long-term debt (note 8) 237,203 176,767Other liabilities (note 9) 38,211 34,340Future income tax liabilities (note 11) 173,319 43,330
720,676 412,616Minority interests 88,646 22,454
809,322 435,070
Shareholders’ equityEquity accounts (note 12) 396,017 166,592Retained earnings 539,084 144,849
935,101 311,441
1,744,423 746,511
Commitments (note 18)
Approved by the Board of Directors
Director Director
The accompanying notes are an integral part of these consolidated financial statements.

CONSOLIDATED STATEMENTS OF EARNINGS AND RETAINED EARNINGS
FIRST QUANTUM MINERALS LTD. 2006 ANNUAL REPORT 59
Consolidated Statements of Earnings and Retained Earnings
For the years ended December 31, 2006 and 2005
(expressed in thousands of U.S. dollars, except where indicated)2006 2005
$ $
Sales revenuesCopper 1,073,943 434,100Gold 20,128 6,715Acid 412 3,799
1,094,483 444,614Cost of sales (264,600) (151,904)Depletion and amortization (56,067) (36,545)
Operating profit 773,816 256,165Other expenses/income
Exploration (18,889) (7,493)General and administrative (19,182) (9,724)Interest and financing fees on long-term debt (32,729) (19,385)Other expenses/income (note 14) (57,416) (16,996)Gain on disposal of investment 1,805 16,127
(126,411) (37,471)
Earnings before income taxes and minority interests 647,405 218,694Income taxes (note 11) (166,845) (45,612)Minority interests (66,174) (20,264)
Net earnings for the year 414,386 152,818Retained earnings (deficit) – beginning of year 144,849 (3,936)Dividends (20,151) (4,033)
Retained earnings – end of year 539,084 144,849
Earnings per common shareBasic $6.37 $2.48Diluted $6.24 $2.43
Weighted average shares outstanding (000’s) 65,088 61,498
The accompanying notes are an integral part of these consolidated financial statements.

FIRST QUANTUM MINERALS LTD. 2006 ANNUAL REPORT
CONSOLIDATED STATEMENTS OF CASH FLOWS
60
Consolidated Statements of Cash Flows
For the years ended December 31, 2006 and 2005
(expressed in thousands of U.S. dollars, except where indicated)2006 2005
$ $
Cash flows from operating activitiesNet earnings for the year 414,386 152,818
Items not affecting cashDepletion and amortization 56,067 36,545Minority interests 66,174 20,264Unrealized foreign exchange loss (gain) 4,567 (7,744)Future income tax expense 22,381 26,632Stock-based compensation expense 6,660 2,656Unrealized derivative instruments loss 5,577 14,890Amortization of deferred finance fees 12,381 2,290Other 1,797 3,903Gain on disposal of investment (1,805) (16,127)
588,185 236,127Change in non-cash operating working capital
Increase in accounts receivable (81,791) (44,518)Increase in inventory (85,339) (25,218)Increase in accounts payable and accrued liabilities 12,535 22,645Increase in current taxes payable 93,984 12,806
Long term incentive plan contribution (note 12) (15,563) -
512,011 201,842
Cash flows from financing activitiesProceeds from long-term debt 307,000 68,023Repayments of long-term debt (251,507) (39,819)Proceeds on issuance of common shares 3,461 2,159Dividends paid (20,151) (4,033)Deferred premium obligation, finance fees (25,443) (12,763)
13,360 13,567
Cash flows from investing activitiesRestricted cash 5,162 (18,231)Acquisition of Adastra Minerals Inc., net of cash acquired (note 3) (27,829) –Property, plant and equipment (264,256) (180,195)Deferred exploration and stripping costs (37,806) (6,545)Net investments (33,843) 21,944
(358,572) (183,027)
Effect of exchange rate changes on cash (165) 172Increase in cash and cash equivalents 166,634 32,554Cash and cash equivalents – beginning of year 82,910 50,356
Cash and cash equivalents – end of year 249,544 82,910
The accompanying notes are an integral part of these consolidated financial statements.

FIRST QUANTUM MINERALS LTD. 2006 ANNUAL REPORT 61
NOTES TO CONSOLIDATED FINANCIAL STATEMENTS
Notes to Consolidated Financial StatementsFor the years ended December 31, 2006 and 2005
(tabular amounts expressed in thousands of U.S. dollars, except where indicated)
1. Nature of OperationsFirst Quantum Minerals Ltd. (“FQM” or the “Company”) is engaged in the production of copper, gold and acid and relatedactivities including exploration, development and processing. These activities are conducted principally in Zambia, theDemocratic Republic of Congo (“DRC”), and Mauritania.
2. Significant Accounting Policies
Basis of presentationThese financial statements have been prepared in accordance with Canadian generally accepted accounting principles(“Canadian GAAP”).
Principles of consolidationThese consolidated financial statements include the accounts of the Company and all of its subsidiaries. The principaloperating subsidiaries are First Quantum Mining and Operations Limited (“FQMO”), Compagnie Minera De Sakania SPRL(“Comisa”), Kansanshi Mining Plc (“Kansanshi”), Mauritanian Copper Mines SARL (“Guelb Moghrein”), Frontier SPRL(“Frontier”), and Adastra Minerals Inc. (“Adastra”).
The Company also consolidates entities that are subject to control on a basis other than ownership of a majority of thevoting interests, or variable interest entities. The Company established an independent trust to purchase the commonshares necessary to satisfy the Company’s long term incentive plan. The Company consolidates the trust as it constitutesa variable interest entity.
Estimates, risks and uncertaintiesThe preparation of financial statements in conformity with Canadian generally accepted accounting principles requiresmanagement to make estimates and assumptions that affect the amounts reported in the financial statements andaccompanying notes. Actual results could differ from those estimates.
Measurement of the Company’s assets and liabilities is subject to risks and uncertainties, including ones related to reserveand resource estimation; future copper, cobalt, sulphuric acid and gold prices; estimated costs of future production; futurecosts of asset retirement obligations; changes in government legislation and regulations; estimated future income taxamounts; the availability of financing and various operational factors.
Foreign currency translationThe functional currency of all of the Company’s operations is the U.S. dollar. The Company’s foreign currency transactionsare translated into U.S. dollars at the rate of exchange in effect during the period. Monetary assets and liabilities aretranslated using period end exchange rates with any gains and losses included in the determination of operating results.Non-monetary assets and liabilities are translated using historical rates.
Cash and cash equivalentsCash and cash equivalents comprise cash at banks and on hand and other short-term investments with initial maturities ofless than three months. It excludes cash subject to restrictions under long term debt facilities (note 8).
InventoryProduct inventories comprise ore in stockpiles, acid and metal work-in-progress and acid and finished cathode and metalin concentrate, which are recorded at the lower of average cost and net realizable value. Cost includes materials, labour andamortization of plant, equipment and mineral properties directly involved in the mining and production processes.
Consumable stores are valued at the lower of purchase cost and replacement cost and recorded as a current asset.
InvestmentsThe Company’s investment in Carlisa Investment Corp. (“Carlisa”), a privately held entity, is accounted for under the costmethod.
Marketable securities are carried at cost less reductions for other than temporary decreases in value.

FIRST QUANTUM MINERALS LTD. 2006 ANNUAL REPORT
NOTES TO CONSOLIDATED FINANCIAL STATEMENTS
62
Mineral properties and mine development costsGeneral exploration and associated costs are expensed in the period incurred. Significant property acquisition, explorationand development costs relating to specific properties are deferred until the project to which they relate is sold, abandoned,impaired or placed into production.
Property acquisition and mine development costs, including costs incurred during production to expand ore reserves withinexisting mine operations, are deferred and depleted on a units-of-production basis over their reserves.
Management’s estimates of mineral prices, recoverable reserves, and operating, capital and reclamation costs are subjectto certain risks and uncertainties that may affect the recoverability of mineral property costs. Although management hasmade its best estimate of these factors, it is possible that changes could occur in the near term that could adversely affectmanagement’s estimate of the net cash flow to be generated from its projects.
Property, plant and equipmentProperty, plant and equipment are recorded at cost less accumulated depletion and amortization. Costs recorded for plantsunder construction include all expenditures incurred in connection with the development and construction of the plants.Interest and financing costs that relate to the project and are incurred during the construction period are capitalized. Noamortization is recorded until the plants are operational. Where relevant, the Company has estimated residual values oncertain plant and equipment.
Property, plant and equipment are amortized over the estimated lives of the assets on a units-of-production basis overtheir reserves or straight-line basis as appropriate.
Pre-production costsProduction costs and revenues related to development projects are deferred until the project achieves commercialproduction. These deferred costs are amortized over the expected period of benefit of these costs on a units-of-productionbasis using their reserves.
Asset impairmentThe Company performs impairment tests on property, plant and equipment and mineral properties when events orcircumstances occur that indicate the assets may not be recoverable. Where information is available and conditions suggestimpairment, estimated future net cash flows for a mine or development project are calculated using estimated future prices,mineral resources, and operating, capital and reclamation costs on an undiscounted basis. When estimated future cashflows are less than the carrying value, the project is considered impaired. Reductions in the carrying value of a mine ordevelopment project are recorded to the extent the net book value exceeds the discounted estimated future cash flows.Where estimates of future net cash flows are not available and where other conditions suggest impairment, managementassesses whether the carrying value can be recovered.
Deferred financing feesCosts incurred to obtain long-term debt are deferred and amortized over the term of the underlying debt, or capitalizedwhere they relate to eligible development projects.
Deferred stripping Stripping costs associated with waste rock removal in excess of the life-of-mine average are deferred and charged toinventory on the basis of the average stripping ratio for the life of the mine. When the cumulative stripping ratio is less thanthe life-of-mine average, a provision for future stripping is made.
The amount charged to cost of sales is therefore subject to management’s ability to estimate the stripping ratio over the lifeof the mine. Any changes in this estimate are applied prospectively and could have a material effect on the financialstatements.
Asset retirement obligations The Company records asset retirement obligations at fair value in the period in which the liability is incurred. Fair value isdetermined based on the estimated future cash flows required to settle the liability discounted at the Company’s creditadjusted risk free interest rate. The liability is adjusted for changes in the expected amounts and timing of cash flowsrequired to discharge the liability and accreted over time to its full value. The associated asset retirement costs arecapitalized as part of the carrying amount of the long-lived asset and amortized over the expected useful life of the asset.
Revenue recognitionThe Company produces copper cathode, copper in concentrate, gold and acid. Revenues from copper products arerecognized at market prices when the risks and rewards of ownership pass to the customer. Copper products are sold underpricing arrangements where final prices may be determined by quoted market prices in periods subsequent to the date ofsale. The products are provisionally priced using forward prices for the expected date of final settlement. Subsequentvariations in price are recognized as revenue adjustments until the price is finalized. Gold revenue results from the sale ofcopper concentrate and is recorded net of realization charges. Acid revenue is recorded when title has passed to thecustomer.

FIRST QUANTUM MINERALS LTD. 2006 ANNUAL REPORT 63
NOTES TO CONSOLIDATED FINANCIAL STATEMENTS
Derivatives and hedging The Company enters into derivative instruments to mitigate exposures to copper and gold commodity prices, foreignexchange rates, and interest rates. The Company does not apply hedge accounting. All derivative financial instruments(apart from embedded derivatives) are recorded on the balance sheet at fair value with realized and unrealized gains andlosses recorded as other expense. Realized gains and losses are recorded as a component of operating cashflow.
Income taxesCurrent income taxes are recorded based on estimated income taxes payable for the current year. Future income tax assetsand liabilities are recognized for temporary differences between the tax and accounting bases of assets and liabilities andare calculated using substantively enacted tax rates for the period in which the differences are expected to reverse. Theamount of future tax assets recognized is limited to the amount that is more likely than not to be realized.
Stock-based compensationThe Company grants stock options under its stock option plan and performance stock units (“PSUs”) and restricted stockunits (“RSUs”) under its new long-term incentive plan to its directors and employees. The Company expenses the fair valueof stock options, PSUs and RSUs granted over the vesting period.
The fair value of stock options is determined using an option pricing model that takes into account, as of the grant date, theexercise price, the expected life of the option, the current price of the underlying stock and its expected volatility, expecteddividends on the stock, and the risk-free interest rate over the expected life of the option. Cash consideration receivedfrom employees when they exercise the options is credited to capital stock.
The fair value of PSUs is determined using a valuation model that takes into account, as of the grant date, the expected lifeof the PSU, expected volatility, expected dividend yield, and the risk free interest rate over the life of the PSU, to generatepotential outcomes for stock prices, which are used to estimate the probability of the PSUs vesting at the end of theperformance measurement period.
The fair value of RSUs is determined by reference to the share price of the Company at the date of grant.
Earnings per shareEarnings per share are calculated using the weighted average number of shares outstanding during the period. Sharesacquired under the long-term incentive plan are treated as treasury shares and are deducted from the number of sharesoutstanding for the calculation of basic earnings per share. Diluted earnings per share are calculated using the treasurystock method whereby all “in the money” options, warrants and equivalents are assumed to have been exercised at thebeginning of the period and the proceeds from the exercise are assumed to have been used to purchase common shares atthe average market price during the period.
3. Acquisition of Adastra Minerals Inc. (“Adastra”)The Company acquired 100% of the outstanding shares of Adastra in a two step transaction. Adastra is an internationalmining company currently developing the Kolwezi Copper-Cobalt Tailings Project in the DRC. On May 1, 2006, the Companyacquired 75% of the outstanding shares of Adastra and therefore consolidated Adastra’s operating results from May 1,2006. On August 11, 2006, the Company acquired the remaining 25% of the outstanding shares of Adastra.
The acquisition of Adastra has been accounted for as an asset purchase. The total purchase cost was $273.3 millioncomprising:
$Issuance of common shares (a) 234,868Cash 34,972Transaction costs 3,441
273,281
a) The Company issued 3.5 million common shares at CA$ 55.87 per share for the initial acquisition of Adastra and afurther 1.2 million common shares at CA$ 57.41 per share for the second step acquisition of Adastra. Themeasurement of the common share component of the consideration is based on the average share price of theCompany’s common shares immediately before and after the date of acquisition.
b) The cash paid to acquire Adastra including transaction costs less the cash received was $27.8 million.

FIRST QUANTUM MINERALS LTD. 2006 ANNUAL REPORT
NOTES TO CONSOLIDATED FINANCIAL STATEMENTS
64
The allocation of the purchase price to the assets and liabilities acquired is as follows:$
AssetsCash 10,584Restricted cash 2,972Accounts receivable 709Property, plant and equipment 387,617
LiabilitiesAccounts payable and accrued liabilities 10,114Other liabilities 8,957Future income tax liability 109,512Minority interest 18
Net assets acquired 273,281
4. Inventory2006 2005
$ $Ore in stockpiles 33,920 23,480Work-in-progress 4,620 3,744Finished product 38,124 5,130
Total product inventory 76,664 32,354Consumable stores 70,710 28,500
Total inventory 147,374 60,854
5. Investments2006 2005
$ $Carlisa Investment Corp. (a) 9,522 9,522Marketable securities (b) 35,649 –
45,171 9,522
a) The Company has an 18.8% interest in Carlisa, a privately owned company, which holds a 90% interest in MopaniCopper Mines Ltd (“Mopani”). Mopani operates the Nkana mine and the Mufulira mine and smelter. As Carlisa is aprivately held entity, the fair value of this investment is not readily determinable.
b) The marketable securities had a quoted market value of $32.7 million at December 31, 2006.
6. Property, Plant and Equipment2006 2005
Accumulated Net Accumulated NetCost amortization $ Cost amortization $
Plant and Equipment 520,940 133,384 387,556 383,405 84,980 298,425Capital work-in-progress 264,219 – 264,219 140,918 – 140,918Mineral properties and mine
development costs 440,984 24,641 416,343 52,420 20,469 31,951
Total 1,226,143 158,025 1,068,118 576,743 105,449 471,294
During 2006, $2.2 million (2005 – $3.1 million) of interest and financing costs were capitalized.
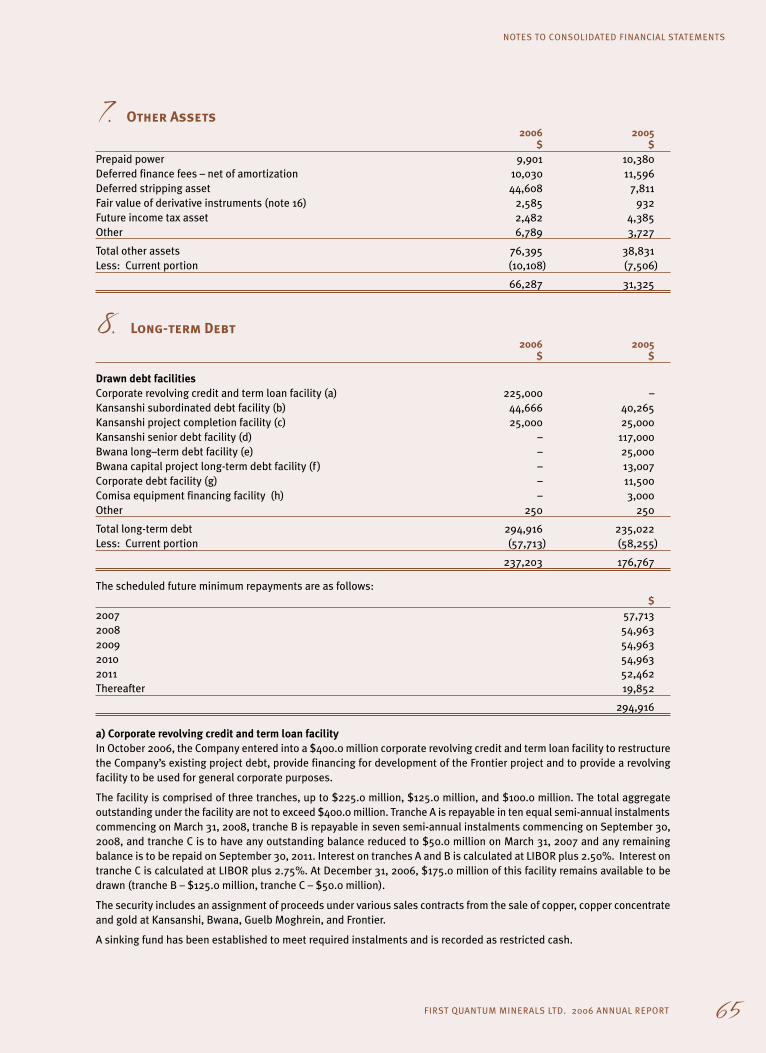
NOTES TO CONSOLIDATED FINANCIAL STATEMENTS
FIRST QUANTUM MINERALS LTD. 2006 ANNUAL REPORT 65
7. Other Assets2006 2005
$ $Prepaid power 9,901 10,380Deferred finance fees – net of amortization 10,030 11,596Deferred stripping asset 44,608 7,811Fair value of derivative instruments (note 16) 2,585 932Future income tax asset 2,482 4,385Other 6,789 3,727
Total other assets 76,395 38,831Less: Current portion (10,108) (7,506)
66,287 31,325
8. Long-term Debt2006 2005
$ $
Drawn debt facilitiesCorporate revolving credit and term loan facility (a) 225,000 –Kansanshi subordinated debt facility (b) 44,666 40,265Kansanshi project completion facility (c) 25,000 25,000Kansanshi senior debt facility (d) – 117,000Bwana long–term debt facility (e) – 25,000Bwana capital project long-term debt facility (f ) – 13,007Corporate debt facility (g) – 11,500Comisa equipment financing facility (h) – 3,000Other 250 250
Total long-term debt 294,916 235,022Less: Current portion (57,713) (58,255)
237,203 176,767
The scheduled future minimum repayments are as follows:$
2007 57,7132008 54,9632009 54,9632010 54,9632011 52,462Thereafter 19,852
294,916
a) Corporate revolving credit and term loan facility In October 2006, the Company entered into a $400.0 million corporate revolving credit and term loan facility to restructurethe Company’s existing project debt, provide financing for development of the Frontier project and to provide a revolvingfacility to be used for general corporate purposes.
The facility is comprised of three tranches, up to $225.0 million, $125.0 million, and $100.0 million. The total aggregateoutstanding under the facility are not to exceed $400.0 million. Tranche A is repayable in ten equal semi-annual instalmentscommencing on March 31, 2008, tranche B is repayable in seven semi-annual instalments commencing on September 30,2008, and tranche C is to have any outstanding balance reduced to $50.0 million on March 31, 2007 and any remainingbalance is to be repaid on September 30, 2011. Interest on tranches A and B is calculated at LIBOR plus 2.50%. Interest ontranche C is calculated at LIBOR plus 2.75%. At December 31, 2006, $175.0 million of this facility remains available to bedrawn (tranche B – $125.0 million, tranche C – $50.0 million).
The security includes an assignment of proceeds under various sales contracts from the sale of copper, copper concentrateand gold at Kansanshi, Bwana, Guelb Moghrein, and Frontier.
A sinking fund has been established to meet required instalments and is recorded as restricted cash.

FIRST QUANTUM MINERALS LTD. 2006 ANNUAL REPORT
NOTES TO CONSOLIDATED FINANCIAL STATEMENTS
66
b) Kansanshi subordinated debt facility In December 2003, Kansanshi entered into a 34.0 million Euro subordinated debt facility agreement to finance the Kansanshiproject. This facility is repayable in nine equal annual payments commencing October 31, 2007. Interest is calculatedannually, within a range of 3.2% to 13.2%, based on the average LME cash copper price for the preceding calendar year. Theinterest rate is at its lower limit at a realized copper price of less than $1,300 per tonne and increases incrementally untilthe copper price reaches its $2,200 per tonne upper limit. No recognition has been made of the fair value of this embeddedderivative. As this facility is in Euros, the Company has entered into cross-currency principal and interest rate swaps tomitigate the effects of movements in the Euro. Due to the copper indexed interest rate, the fair value of this instrument doesnot approximate its carrying value (note 16b).
c) Kansanshi project completion facilityIn March 2004, Kansanshi entered into a $25.0 million project completion facility, which was amended and restated in2006. This facility was drawn down in 2005 and is repayable in 9 semi-annual instalments commencing December 31, 2006.Interest is calculated at LIBOR plus 3.5%.
d) Kansanshi senior debt facilityIn 2003, Kansanshi entered into a $120.0 million secured senior debt facility to finance the Kansanshi project. The Companyrepaid this facility with proceeds from the corporate revolving credit and term loan facility.
e) Bwana long-term debt facility In 2004, Bwana entered into a $30.0 million long-term debt facility. The Company repaid this facility from the proceeds ofthe corporate revolving credit and term loan facility.
f ) Bwana capital project long-term debt facility In 2003, Bwana entered into a project debt facility for $30.0 million to re-finance an existing facility and provide funding forcapital projects and working capital purposes. The Company repaid this facility with proceeds from the corporate revolvingcredit and term loan facility.
g) Corporate debt facility In 2005, the Company entered into an $11.5 million corporate debt facility. The Company repaid this facility in September2006.
h) Comisa equipment financing debt facilityIn 2003, Comisa entered into a $6.0 million long-term debt facility to assist with financing the mining fleet. This facility wasextended in 2004 to $10.0 million to provide additional financing for Comisa’s larger mining fleet. The Company repaid thisfacility in April 2006.
9. Other Liabilities2006 2005
$ $Unrealized fair value of derivative liability (note 16) 26,632 20,417Deferred premium obligation (note 16) 8,509 15,714Kolwezi deferred payment (a) 7,898 -Zesco Limited (b) 2,947 3,368ZCCM deferred payment (c) 3,333 3,333Guelb Moghrein deferred payment – 4,845Deferred stripping liability – 1,009Asset retirement obligations (note 10) 5,023 4,195Other 3,258 1,836
Total other liabilities 57,600 54,717Less: Current portion (19,389) (20,377)
38,211 34,340
a) Kolwezi deferred paymentThe Company holds a 65% interest in the Kolwezi project. Under the terms of the Contract of Association with the DRC, itwas agreed by the parties involved to pay $15.0 million as consideration for the Tailings Exploration Rights (“TER”), ofwhich $5.0 million was paid in May 2004. The remaining $10.0 million will become due and payable upon completion of thefinancing arrangements for the Kolwezi project. Of this amount, the Company expects to pay $7.9 million, which representsthe Company’s share of the TER. Financing arrangements are expected to be completed in November 2007.

NOTES TO CONSOLIDATED FINANCIAL STATEMENTS
FIRST QUANTUM MINERALS LTD. 2006 ANNUAL REPORT 67
b) Zesco LimitedThe Company has entered into an agreement with Zesco Limited (“Zesco”) whereby Zesco will provide the Kansanshi minewith power for 10 years from the first day of commercial operations. The Company agreed to pay a connection fee of $10.0million, of which $6.0 million was paid during 2004 with the balance of $4.0 million to be paid in equal bi-annual paymentsbeginning in 2004. Interest is calculated on the outstanding balance at a fixed rate of 6% per annum.
c) ZCCM deferred paymentUnder the terms of the Kansanshi development agreement, the Company agreed to pay $0.6 million to ZambianConsolidated Copper Mines (“ZCCM”) on the first business day of April, July and October 2003 and January, April and July2004 subject to the price of copper.
10. Asset Retirement ObligationsThe Company has restoration and remediation obligations associated with its operating mines and processing facilities. Thefollowing table summarizes the movements in the asset retirement obligation for the years ended December 31, 2006 and2005:
2006 2005$ $
At January 1 4,195 4,172Obligations incurred 578 488Changes in cash flow estimates – (264)Expenditures (27) (354)Accretion expense 277 153
At December 31 5,023 4,195Less: Current portion (452) (229)
4,571 3,966
The asset retirement obligations have been recorded initially as a liability at fair value, assuming a credit adjusted risk-freediscount rate between 7.0% and 7.62% and an inflation factor of 3%. The liability for retirement and remediation on anundiscounted basis before an inflation factor of 3% is estimated to be approximately $8.1 million. Payments are expectedto occur over a period exceeding 18 years.
As a result of the commencement of production at the Guelb Moghrein mine and commencement of development of theFrontier project, an additional asset retirement obligation of $0.6 million was recognized during the year.
11. Income TaxesThe income taxes shown in the consolidated statements of earnings differ from the amounts obtained by applying statutoryrates to the earnings before provision for income taxes due to the following:
2006 2005Amount Amount
$ % $ %Earnings before income taxes, minority interest
and equity earnings 647,365 218,694Income taxes at statutory rates 220,881 34 76,237 35Difference in foreign tax rates (58,203) (9) (25,069) (11)Non-deductible expenses 4,396 1 6,015 3Tax losses recognized and other (229) – (11,571) (5)
Taxation expense 166,845 26 45,612 22
Income tax expenseCurrent income taxes 144,464 18,980Future income taxes 22,381 26,632
166,845 45,612
The significant components of the Company’s future income tax liability are as follows:2006 2005
$ $Operating loss carry-forwards – (26,704)Property, plant and equipment 177,550 70,690Other (4,231) (656)
Net future income tax liability 173,319 43,330

FIRST QUANTUM MINERALS LTD. 2006 ANNUAL REPORT
NOTES TO CONSOLIDATED FINANCIAL STATEMENTS
68
The significant components of the Company’s future income tax asset are as follows:2006 2005
$ $Operating loss carry-forwards 17,065 1,535Other 2,482 2,850Valuation allowance (17,065) –
2,482 4,385Less: Current portion – (1,725)
Net future income tax asset 2,482 2,660
The Company has nil non-capital loss carry-forwards (2005 – $111.8 million) that may be available for tax purposes.
The currency basis of the Company’s tax losses in Zambia are currently subject to legal interpretation. The Companymaintains its tax records in U.S. dollars rather than Kwacha; formal approval for this treatment has not been received fromthe Zambian Revenue Authority (ZRA). The calculation of the future income tax liability assumes that the Company canmaintain its tax losses and taxation base of its assets in U.S. dollars. A number of Zambian companies are currently innegotiations with the ZRA to resolve this issue. Management is confident that maintaining the tax records in U.S. dollars isthe appropriate treatment and therefore has calculated the tax liability on this basis. As of the preparation of these financialstatements, this issue was still pending with the ZRA.
The Guelb Moghrein operation is subject to a five year tax holiday as agreed to by the Mauritanian government. Thisoperation will become subject to Mauritanian income taxes based on income earned commencing subsequent to September2010.
12. Equity Accounts 2006 2005
$ $Common shares (a) 399,576 160,733Treasury shares (note 13) (15,563) –Contributed surplus (b) 12,004 5,859
396,017 166,592
a) Common shares
Authorized
Unlimited common shares without par value
IssuedNumber of
Shares Amount(000’s) $
Balance as at December 31, 2004 61,239 158,538Stock options exercised (note 13) 435 2,195
Balance as at December 31, 2005 61,674 160,733Stock options exercised (note 13) 930 3,975Acquisition of Adastra (note 2) 4,687 234,868
Balance as at December 31, 2006 67,291 399,576
Weighted average shares outstanding (000’s) 65,088
b) Contributed surplus2006 2005
$ $Balance – Beginning of year 5,859 3,238Compensation expense for the year 6,660 2,979Transfers upon exercise of stock options (515) (358)
Balance – End of year 12,004 5,859
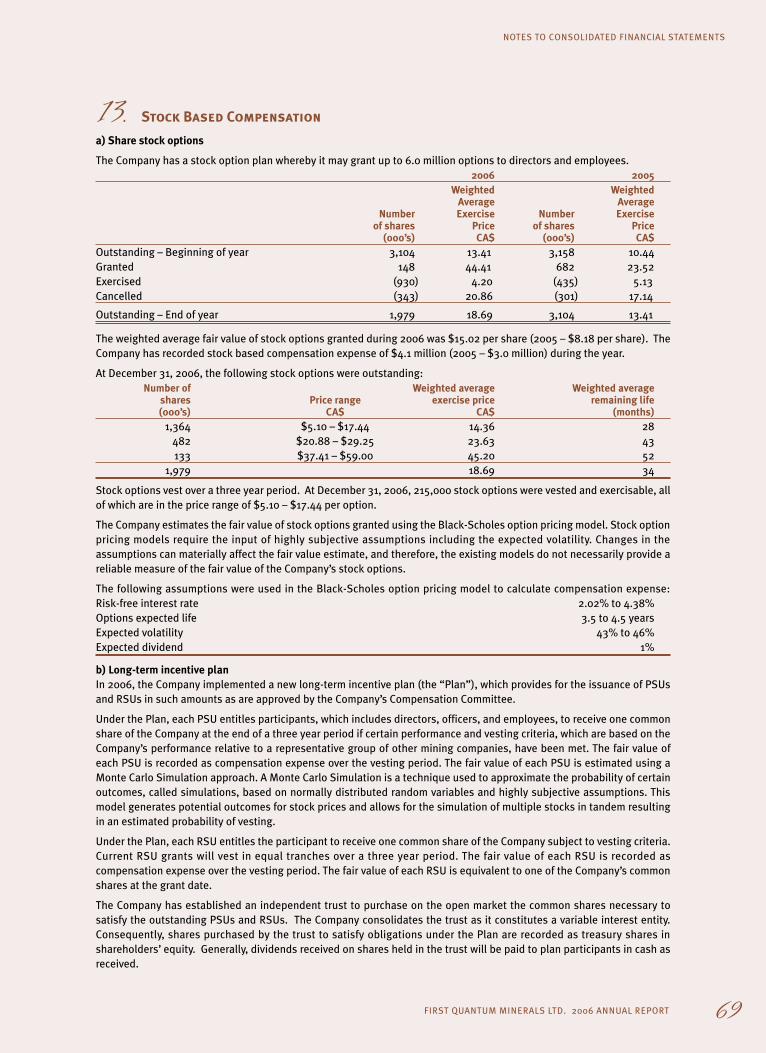
NOTES TO CONSOLIDATED FINANCIAL STATEMENTS
FIRST QUANTUM MINERALS LTD. 2006 ANNUAL REPORT 69
13. Stock Based Compensation
a) Share stock options
The Company has a stock option plan whereby it may grant up to 6.0 million options to directors and employees.2006 2005
Weighted WeightedAverage Average
Number Exercise Number Exerciseof shares Price of shares Price
(000’s) CA$ (000’s) CA$Outstanding – Beginning of year 3,104 13.41 3,158 10.44Granted 148 44.41 682 23.52Exercised (930) 4.20 (435) 5.13Cancelled (343) 20.86 (301) 17.14
Outstanding – End of year 1,979 18.69 3,104 13.41
The weighted average fair value of stock options granted during 2006 was $15.02 per share (2005 – $8.18 per share). TheCompany has recorded stock based compensation expense of $4.1 million (2005 – $3.0 million) during the year.
At December 31, 2006, the following stock options were outstanding:Number of Weighted average Weighted average
shares Price range exercise price remaining life(000’s) CA$ CA$ (months)
1,364 $5.10 – $17.44 14.36 28482 $20.88 – $29.25 23.63 43133 $37.41 – $59.00 45.20 52
1,979 18.69 34
Stock options vest over a three year period. At December 31, 2006, 215,000 stock options were vested and exercisable, allof which are in the price range of $5.10 – $17.44 per option.
The Company estimates the fair value of stock options granted using the Black-Scholes option pricing model. Stock optionpricing models require the input of highly subjective assumptions including the expected volatility. Changes in theassumptions can materially affect the fair value estimate, and therefore, the existing models do not necessarily provide areliable measure of the fair value of the Company’s stock options.
The following assumptions were used in the Black-Scholes option pricing model to calculate compensation expense:Risk-free interest rate 2.02% to 4.38%Options expected life 3.5 to 4.5 yearsExpected volatility 43% to 46%Expected dividend 1%
b) Long-term incentive planIn 2006, the Company implemented a new long-term incentive plan (the “Plan”), which provides for the issuance of PSUsand RSUs in such amounts as are approved by the Company’s Compensation Committee.
Under the Plan, each PSU entitles participants, which includes directors, officers, and employees, to receive one commonshare of the Company at the end of a three year period if certain performance and vesting criteria, which are based on theCompany’s performance relative to a representative group of other mining companies, have been met. The fair value ofeach PSU is recorded as compensation expense over the vesting period. The fair value of each PSU is estimated using aMonte Carlo Simulation approach. A Monte Carlo Simulation is a technique used to approximate the probability of certainoutcomes, called simulations, based on normally distributed random variables and highly subjective assumptions. Thismodel generates potential outcomes for stock prices and allows for the simulation of multiple stocks in tandem resultingin an estimated probability of vesting.
Under the Plan, each RSU entitles the participant to receive one common share of the Company subject to vesting criteria.Current RSU grants will vest in equal tranches over a three year period. The fair value of each RSU is recorded ascompensation expense over the vesting period. The fair value of each RSU is equivalent to one of the Company’s commonshares at the grant date.
The Company has established an independent trust to purchase on the open market the common shares necessary tosatisfy the outstanding PSUs and RSUs. The Company consolidates the trust as it constitutes a variable interest entity.Consequently, shares purchased by the trust to satisfy obligations under the Plan are recorded as treasury shares inshareholders’ equity. Generally, dividends received on shares held in the trust will be paid to plan participants in cash asreceived.
FIRST QUANTUM MINERALS LTD. 2006 ANNUAL REPORT
NOTES TO CONSOLIDATED FINANCIAL STATEMENTS
70
At December 31, 2006, 109,957 PSUs and 166,064 RSUs have been granted. The trust has purchased 276,021 shares of theCompany for allocation subject to performance and vesting criteria being satisfied. The Company has recordedcompensation expense of $2.6 million during the year ended December 31, 2006 in respect of these units.
14. Other Expenses/Income2006 2005
$ $Derivative instrument losses (58,245) (21,801)Foreign exchange losses/gains (7,957) 2,670Interest and sundry income 8,786 2,135
(57,416) (16,996)
15. Segmented InformationThe Company’s reportable operating segments are strategic business units that produce different but related products orservices. Each business unit is managed separately because each requires different technology and marketing strategies.
Kansanshi The Kansanshi operation is located in the northwest province of Zambia, approximately 15 kilometres north of Solwezi.
Bwana/Lonshi The Bwana plant and the Lonshi mine are owned by separate legal entities but from a management perspective are viewedas an integrated operation, with the Bwana plant, located in Zambia, processing the ore mined at Lonshi, which is locatedin the DRC.
Guelb Moghrein The Guelb Moghrein operation is located near Akjoujt in Mauritania.
Frontier The Frontier project is located near the town of Sakania in the DRC, within 2 kilometeres of the Zambian border.
Corporate The corporate segment is responsible for the evaluation and acquisition of new mineral properties, regulatory reporting, andcorporate administration. It includes the Kolwezi project, which is in the engineering study phase and also holds theConnemara gold mine in Zimbabwe, which is currently on a care and maintenance basis, and other strategic investments.
For the year ended December 31, 2006, segmented information is presented as follows:
2006
Bwana/ Guelb Kansanshi Lonshi Moghrein Frontier Corporate Total
$ $ $ $ $ $Segmented revenues 745,688 374,474 7,152 – 14,712 1,142,026Less inter-segment revenues (32,831) – – (14,712) (47,543)
Revenues 745,688 341,643 7,152 – – 1,094,483Cost of sales (161,549) (102,208) (843) – – (264,600)Depletion and amortization (31,079) (23,440) (1,097) – (451) (56,067)
Operating profit (loss) 553,060 215,995 5,212 – (451) 773,816Interest on long-term debt (30,663) (724) (612) – (730) (32,729)Other (62,967) (13,339) (1,328) – (16,048) (93,682)
Segmented profit (loss) before undernoted items 459,430 201,932 3,272 – (17,229) 647,405
Income taxes (117,952) (52,177) – – 3,284 (166,845)Minority interests (65,697) – (477) – – (66,174)
Segmented profit 275,781 149,755 2,795 – (13,945) 414,386
Property, plant and equipment 411,327 49,123 106,045 116,368 381,709 1,064,572Total assets 645,483 164,835 148,223 122,780 663,102 1,744,423Capital expenditures 110,969 2,384 44,938 106,500 381,062 645,853
NOTES TO CONSOLIDATED FINANCIAL STATEMENTS
FIRST QUANTUM MINERALS LTD. 2006 ANNUAL REPORT 71
For the year ended December 31, 2005, segmented information is presented as follows:
2005
Bwana/ Guelb Kansanshi Lonshi Moghrein Frontier Corporate Total
$ $ $ $ $ $Segmented revenues 259,448 198,777 – – 11,986 470,211Less inter-segment revenues – (13,611) – – (11,986) (25,597)
Revenues 259,448 185,166 – – – 444,614Cost of sales (67,467) (84,437) – – – (151,904)Depletion and amortization (14,987) (21,443) – – (115) (36,545)
Operating profit (loss) 176,994 79,286 – – (115) 256,165Interest on long-term debt (16,140) (2,865) – – (380) (19,385)Gain on disposal of investment – – – – 16,127 16,127Other (19,159) (6,468) – – (8,586) (34,213)
Segmented profit before undernoted items 141,695 69,953 – – 7,046 218,694
Income taxes (31,497) (18,842) – – 4,727 (45,612)Minority interests (20,264) – – – – (20,264)
Segmented profit 89,934 51,111 – – 11,773 152,818
Property, plant and equipment 323,194 71,488 65,991 9,868 753 471,294Total assets 488,342 117,064 66,600 9,868 64,637 746,511Capital expenditures 93,099 35,073 55,719 6,177 (12) 190,056
Capital assets and revenues by geographic segment
The Company’s capital assets, including plant and equipment, capital work-in-progress, and mineral properties and minedevelopment costs, are located primarily in Africa. Specifically, the Company has capital assets of $442.4 million in Zambia(2005 – $373.3 million), $516.2 in the DRC (2005 – $32.0 million), and $106.0 million in Mauritania (2005 – $66.0 million).
The Company’s revenues by country of origin, are $1,087.3 million from Zambia (2005 – $444.6 million), and $7.2 millionfrom Mauritania (2005 – nil).
16. Financial Instruments
a) Derivative instruments
The Company enters into derivative instruments to mitigate the exposures to copper and gold commodity prices, foreignexchange rates, and interest rates. The Company does not apply hedge accounting and all derivatives (excluding embeddedderivatives) are marked-to-market.
Changes in fair value of derivatives entered into in relation to the Kansanshi mine were capitalized as pre-commercialproduction costs up to April 19, 2005. Changes in fair value subsequent to this date have been recorded as a componentof other expenses.
As at December 31, 2006, the following derivative positions were outstanding:
2007 2008 2009 Total Fair Value
Copper (i)Put options (tonnes) 86,016 – – 86,016 $0Price ($/tonne) $1,800 – – –
Gold (ii)Put options (oz) 37,380 24,060 38,028 99,468 $3Price ($/oz) $350 $350 $350Forward Contracts (oz) 37,380 24,060 38,028 99,468 $(26,635)Price ($/oz) $400 $400 $400 –
Other (iii)Interest rate swaps $169Cross currency swaps $2,416

FIRST QUANTUM MINERALS LTD. 2006 ANNUAL REPORT
NOTES TO CONSOLIDATED FINANCIAL STATEMENTS
72
i) CopperIn 2004, the Company was required to enter into copper put option contracts related to its expected copperproduction at the Kansanshi mine, to satisfy lending requirements. Upon entering into these contracts, the Companyassumed a premium obligation of $21.0 million, which is due and payable between January 2005 and December2007. As at December 31, 2006, there were put option contracts for 86,016 tonnes of copper outstanding with apremium obligation of $8.5 million
ii) GoldIn 2004, the Company was required to enter into put option contracts related to its gold production at the Kansanshimine, to satisfy lending requirements. To cover the cost of these put option contracts, the Company has also enteredinto contingent gold forward contracts of the same volume.
iii) OtherThe Company has entered into cross-currency principal and interest rate swaps to hedge the Euro interest andprincipal payments on the Kansanshi subordinated debt facility.
b) Fair valuesAs at December 31, 2006, the Company’s carrying values of cash and cash equivalents, restricted cash, accounts receivable,accounts payable and accrued liabilities, and financial instruments included in other liabilities approximate their fair valuesdue to their short term to maturity. The majority of the Company’s long-term debt approximates fair value due to the floatingrate nature of the facilities, except for the Kansanshi subordinated debt facility, with a carrying value of $44.5 million (2005– $40.3 million) compared to an estimated fair value at December 31, 2006 of $46.3 million (2005 – $42.1 million).Information on long-term debt is presented in note 8; information on investments is presented in note 5.
c) Credit riskFinancial instruments that potentially subject the Company to credit risk consist of cash and cash equivalents and accountsreceivable. The Company deposits cash and cash equivalents with high credit quality financial institutions. The Company’sfuture copper concentrate and cathode production has been committed to four customers on market pricing terms.
17. Supplementary Cash Flow InformationCash and cash equivalents at December 31 comprise the following:
2006 2005$ $
Cash on hand and balances in bank 173,879 74,290Short-term investments 75,665 8,620
249,544 82,910
During the year ended December 31, 2006, the Company paid interest of $24.0 million (2005 – $12.3 million) and taxes of$46.7 million (2005 – $7.9 million).
18. Commitments In conjunction with the development of Frontier, upgrades at Kansanshi and other projects, the Company has committed toapproximately $96.1 million in capital expenditures as at December 31, 2006.
Copper Production(tonnes)
Revenue ($ millions)
Operating Cash Flow($ millions)
Earnings ($ millions)
First Quantum Minerals Ltd. (“First Quantum” or “the Company) is focused on its
core expertise of discovering, developing and operating copper mines throughout
the world. The Company has operations in the Central African Copperbelt region
of Zambia and the Democratic Republic of Congo (“DRC”), and in Mauritania.
Cautionary Statement
Certain information contained in this annual report constitutes “forward-looking statements” within the meaning of the PrivateSecurities Litigation Reform Act of 1995 and forward-looking information under applicable Canadian securities legislation. Suchforward-looking statements or information, including but not limited to those with respect to the prices of gold, copper, cobaltand sulphuric acid, estimated future production, estimated costs of future production, the Company’s hedging policy andpermitting time lines, involve known and unknown risks, uncertainties, and other factors which may cause the actual results,performance or achievements of the Company to be materially different from any future results, performance or achievementsexpressed or implied by such forward-looking statements or information. Such factors include, among others, the actual pricesof copper, gold, cobalt and sulphuric acid, the factual results of current exploration, development and mining activities, changesin project parameters as plans continue to be evaluated, as well as those factors disclosed in the Company’s documents filedfrom time to time with the Alberta, British Columbia, and Ontario Securities Commissions, the Autorité des marchés financiers inQuebec, the United States Securities and Exchange Commission and the Alternative Investment Market operated by the LondonStock Exchange.
As of the date of this annual report, the Company has not yet completed the work necessary to verify the classification of themineral resource estimates at Guelb Moghrein. The Company is not therefore treating the resource as a National Instrument 43-101 defined current mineral resource estimate verified by a qualified person under National Instrument 43-101. Consequently, atpresent, information based on any existing historical resource estimate should not and cannot be relied upon.
Unless otherwise noted, all amounts in this annual report are expressed in United States dollars.
‘02 ‘05 ‘06
41,546
119,117
183,277
‘02 ‘05 ‘06
114
445
1,095
‘04 ‘06
46
236
588
‘02 ‘05 ‘06
28
153
414
29,51311,898
‘04‘03 ‘04‘03
6051
‘05‘03‘02
18(0.6)
‘04‘03
5-4
54% 146% 149% 171%
Officers & Directors
Philip K. R. Pascall 4
Chairman of the Board, Chief Executive Officer, Director
G. Clive Newall 4
President, Director
Martin R. RowleyExecutive Director of Business Development, Director
David E. J. MoroneyChief Financial Officer
Andrew C. HancharykGeneral Counsel and Corporate Secretary
Andrew B. Adams 1, 2, 3
Lead Independent Director
Rupert Pennant-Rea 1, 2, 3, 4
Independent Director
Peter St George 1, 2, 3
Independent Director
1 Member of Audit Committee
2 Member of Compensation Committee
3 Member of Nominating and Governance Committee
4 Member of Environmental, Health and Safety Committee
AuditorsPricewaterhouseCoopers LLP7th Floor – 250 Howe StreetVancouver, BC Canada V6C 3S7
Transfer Agent & RegistrarComputershare Investor Services Inc.3rd Floor – 510 Burrard StreetVancouver, BC Canada V6C 3B9
Shares ListedToronto Stock Exchange – Symbol FMMember of S&P/TSX Composite Index
London Stock Exchange – Symbol FQM
Listed in Standard & Poor’s12g3-2b-82-4461
CUSIP #335934-10-5
Head Office & Investor Relations8th Floor – 543 Granville StreetVancouver, British Columbia, Canada V6C 1X8Tel: +1 604 688 6577Toll Free: +1 888 688 6577Fax: +1 604 688 3818Website: www.first-quantum.comE-mail: [email protected]
Representative OfficesUnited Kingdom 1st Floor, Mill House, Mill Bay LaneHorsham, West Sussex, England RH12 1SSTel: +44 140 327 3484 Fax: +44 140 327 3494
Australia PO Box 1407Level 1, 24 Outram StreetWest Perth, Western Australia 6005 AustraliaTel: +618 9346 0100 Fax: +618 9226 2522
Zambia P.O. Box 230022 Ndola, Zambia Tel: +260 2 651 555 Fax: +260 2 651 553
Democratic Republic of Congo 88, Avenue Kabalo B.P. 400 Lumbashi/Katnga Democratic Republic of Congo Tel: +243 97 031133 Fax: +243 23 42212
Corporate Directory
DE
SIG
N B
Y X
Y3
DE
SIG
N +
CO
MM
UN
ICAT
ION
S I
NC
. P
RIN
TED
IN
CA
NA
DA
2006 Annual Report
Pure CopperBased on a proven track record of building andoperating low cost mining, mineral processing andmetal refining operations in Africa, First Quantum is committed to achieving positive returns for itsshareholders while promoting the health, safety and development of its employees and enriching theenvironment and communities in which it operates.
FIR
ST
QU
AN
TUM
MIN
ER
ALS
LTD
.
20
06
AN
NU
AL
RE
PO
RT