fourth quarter 2015 conference call &...
TRANSCRIPT
FOURTH QUARTER 2015 CONFERENCE CALL & WEBCAST
FEBRUARY 19, 2016
TSX: FM; LSE: FQM

CAUTIONARY NOTE REGARDING FORWARD-LOOKING STATEMENT
2
Certain statements and information herein, including all statements that are not historical facts, contain forward-looking statements and forward-looking information within the meaning of applicable securities laws. The forward looking statements include estimates, forecasts and statements as to the Company’s expectations of production and sales volumes, commissioning and reaching commercial production at Sentinel and expected timing of completion of project development at Enterprise and Cobre Panama and are subject to the impact of ore grades on future production, the potential of production disruptions, capital expenditure and mine production costs, the outcome of mine permitting, the outcome of legal proceedings which involve the Company, information with respect to the future price of copper, gold, cobalt, nickel, zinc, pyrite, PGE, and sulphuric acid, estimated mineral reserves and mineral resources, First Quantum’s exploration and development program, estimated future expenses, exploration and development capital requirements, the Company’s hedging policy, and goals and strategies. Often, but not always, forward-looking statements or information can be identified by the use of words such as “plans”, “expects” or “does not expect”, “is expected”, “budget”, “scheduled”, “estimates”, “forecasts”, “intends”, “anticipates” or “does not anticipate” or “believes” or variations of such words and phrases or statements that certain actions, events or results “may”, “could”, “would”, “might” or “will” be taken, occur or be achieved.
With respect to forward-looking statements and information contained herein, the Company has made numerous assumptions including among other things, assumptions about continuing production at all operating facilities, the price of copper, gold, nickel, zinc, pyrite, PGE, cobalt and sulphuric acid, anticipated costs and expenditures and the ability to achieve the Company’s goals. Forward-looking statements and information by their nature are based on assumptions and involve known and unknown risks, uncertainties and other factors which may cause the actual results, performance or achievements, or industry results, to be materially different from any future results, performance or achievements expressed or implied by such forward-looking statements or information. These factors include, but are not limited to, future production volumes and costs, the temporary or permanent closure of uneconomic operations, costs for inputs such as oil, power and sulphur, political stability in Zambia, Peru, Mauritania, Finland, Spain, Turkey, Panama, Argentina and Australia, adverse weather conditions in Zambia, Finland, Spain, Turkey and Mauritania, labour disruptions, power supply, mechanical failures, water supply, procurement and delivery of parts and supplies to the operations, and the production of off-spec material.
See the Company’s Annual Information Form for additional information on risks, uncertainties and other factors relating to the forward-looking statements and information. Although the Company has attempted to identify factors that would cause actual actions, events or results to differ materially from those disclosed in the forward-looking statements or information, there may be other factors that cause actual results, performances, achievements or events not to be anticipated, estimated or intended. Also, many of these factors are beyond First Quantum’s control. Accordingly, readers should not place undue reliance on forward-looking statements or information. The Company undertakes no obligation to reissue or update forward-looking statements or information as a result of new information or events after the date hereof except as may be required by law. All forward-looking statements and information made herein are qualified by this cautionary statement.
While First Quantum may elect to update the forward-looking statements at any time, First Quantum does not undertake to update them at any particular time or in response to any particular event, other than as may be required by applicable securities laws. Investors and others should not assume that any forward-looking statement contained in this presentation represents management's estimate as of any date other than the date of this presentation.
Neither First Quantum nor any of its directors or officers has verified the accuracy or completeness of information or statements contained herein which are made by or derived from third-party sources (including any projections or estimates made by third-party research analysts). Such third-party sources may have failed to identify events or facts which may have occurred or which may affect the significance or accuracy of any such information or statements. First Quantum has no means of verifying the accuracy or completeness of such information or statements made by or derived from third-party sources or whether there has been any failure by such sources to identify events that may have occurred or may affect the significance or accuracy of any information or statements.
This presentation does not constitute an offer to buy or an invitation to sell, or the solicitation of an offer to buy or invitation to sell, any securities of First Quantum. Such an offer may only be made pursuant to the offer and takeover bid circular First Quantum has filed with the Canadian securities regulators and pursuant to registration or qualification under the securities laws of any other such jurisdiction.
In accordance with applicable Canadian securities regulatory requirements, all mineral reserve and mineral resource estimates disclosed herein have been prepared in accordance with Canadian National Instrument 43-101 - Standards of Disclosure for Mineral Projects ("NI 43-101"), classified in accordance with Canadian Institute of Mining Metallurgy and Petroleum's "CIM Standards on Mineral Resources and Reserves Definitions and Guidelines" (the "CIM Guidelines"). The terms "mineral resources", "measured mineral resources", "indicated mineral resources" and "inferred mineral resources" are recognized by Canadian securities regulatory authorities, however, they may not be recognized by the securities regulatory authorities of other jurisdictions. Pursuant to the CIM Guidelines, mineral resources have a higher degree of uncertainty than mineral reserves as to their existence as well as their economic and legal feasibility. Inferred mineral resources, when compared with measured or indicated mineral resources, have the least certainty as to their existence, and it cannot be assumed that all or any part of an inferred mineral resource will be upgraded to an indicated or measured mineral resource as a result of continued exploration. Pursuant to NI 43-101, inferred mineral resources may not form the basis of any economic analysis, including any feasibility study. Accordingly, readers are cautioned not to assume that all or any part of a mineral resource exists, will ever be converted into a mineral reserve, or is or will ever be economically or legally mineable or recovered.
Note: all dollar amounts in US dollars unless otherwise indicated; C$ indicates Canadian dollars

STRONG 2015 FINANCIAL RESULTS
• Comparative earnings* = $267 million
• Cash flows from operations = $1,191 million
• Achieved through:
• strong performances at all the operations,
• the increasing realization of benefits from operating our own smelter in
Zambia,
• the on-going company-wide cost reduction program, and
• our copper sales hedge program were all contributors in the period.
3
* Net earnings (loss) attributable to shareholders of the Company have been adjusted to exclude impacts which are not reflective of
underlying performance to arrive at comparative earnings. Comparative earnings is not a measure recognized under International
Financial Reporting Standards (“IFRS”) and do not have a standardized meaning prescribed by IFRS. The Company has disclosed
these measures to assist with the understanding of results and to provide further financial information about the results to investors.
Refer to the “Regulatory Disclosures” section in the MD&A for the year ended December 31, 2015, for further information.

PLAN TO REDUCE DEBT POSITION ADVANCING
• Initiatives expected to be finalized at various times over the next
several months
• Secured lenders remain supportive
4
GOALS:
A lower debt position
&
A capital structure better suited to
the development and start-up timetable
of our Cobre Panama project

COBRE PANAMA CAPEX REDUCED TO $5.48B
Total reduction of 15% from our original estimate of $6.42B
Savings mostly from: efficiencies achieved to date in the critical earthworks, concrete
and construction phases of the project,
better pricing for equipment and materials,
plus savings in some other areas.
5
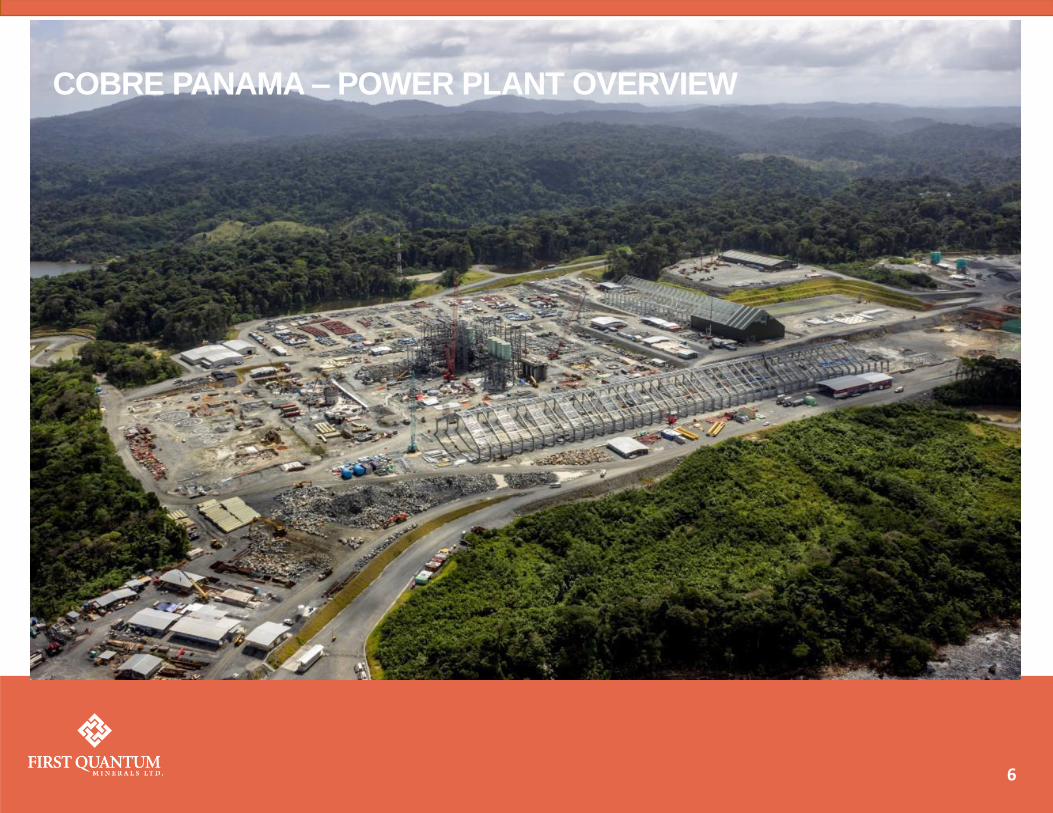
COBRE PANAMA – POWER PLANT OVERVIEW
6

COBRE PANAMA – PORT FACILITY AND JETTY CONSTRUCTION
7

COBRE PANAMA – PROCESS PLANT OVERVIEW
8

FINANCIAL REVIEW
9

Copper C1 cost below original guidance and 14% lower than 2014
Production increases in second half of year with increased contribution from Kansanshi and increased pre-commercial production at Sentinel
Comparative results year on year impacted by lower copper price
2015 Highlights
10
(1) Earnings attributable to shareholders of the Company and EBITDA have been adjusted to exclude impacts which are not reflective of underlying performance to arrive at comparative earnings and comparative EBITDA. Items excluded from comparative measures include impairment charges, foreign exchange and revisions in estimates of closed site restoration provisions. A reconciliation of comparative EBITDA and comparative earnings is provided in the Q4 2015 MD&A.
Nickel C1 cost below original guidance range
$ million
Comparative EBITDA 1 773 1,417
Comparative EPS (Basic) 0.41 0.81
20142015
Production H1 2015 H2 2015
Copper ('000 tonnes) 201 227
Nickel ('000 contained tonnes) 15 20
Gold ('000 ounces) 110 114

Net acid costs $134m lower driven by Kansanshi smelter production of sulphuric acid
Fuel costs $55m lower across the group
General and administration and exploration costs $80m lower including lower headcount and salary reductions
$105m lower costs driven from operational headcount, salary reduction and lower contractor costs
$452m annualized cost savings excluding FX based on Q4 15 vs. Q4 14
11
2%
$452m
annualized
savings
The cost savings shown represent the annualized run rate of the $113 million Q4 2015 on Q4 2014 cost savings, which consist of $93 million operational savings and $20m of G&A and exploration savings, excluding FX. All savings shown are annualized amounts.
$1.74bn reduction in future capex vs prior year plan
12
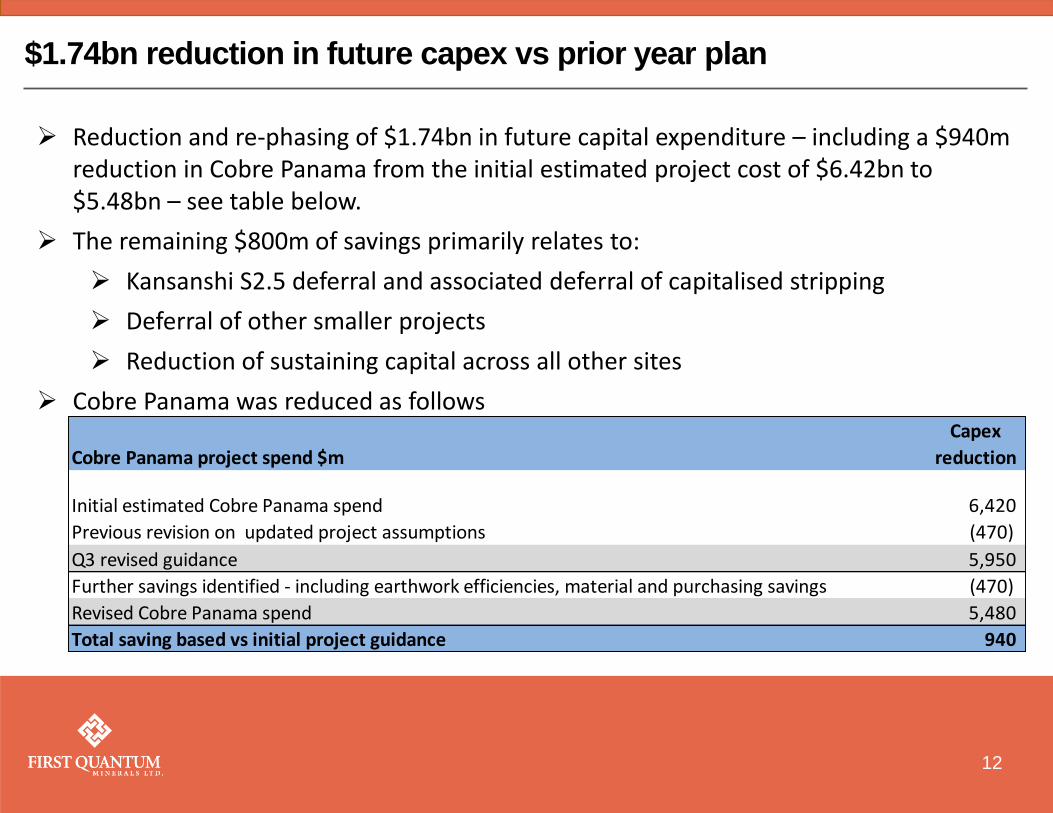
2% Reduction and re-phasing of $1.74bn in future capital expenditure – including a $940m
reduction in Cobre Panama from the initial estimated project cost of $6.42bn to $5.48bn – see table below.
The remaining $800m of savings primarily relates to:
Kansanshi S2.5 deferral and associated deferral of capitalised stripping
Deferral of other smaller projects
Reduction of sustaining capital across all other sites
Cobre Panama was reduced as follows
Cobre Panama project spend $m
Capex
reduction
Initial estimated Cobre Panama spend 6,420
Previous revision on updated project assumptions (470)
Q3 revised guidance 5,950
Further savings identified - including earthwork efficiencies, material and purchasing savings (470)
Revised Cobre Panama spend 5,480
Total saving based vs initial project guidance 940

Copper ('000 tonnes) 124.6 +19.9 +29.7
Nickel ('000 contained tonnes) 11.2 +0.5 -1.0
Sales Q4 2015 vs Q3 2015 vs Q4 2014
Copper C1 cost below both Q3 2015 and Q4 2014 due to cost savings and favourable FX
Cu production above Q4 2014 and Q3 2015 with pre-commercial Sentinel production.
Q4 2015 Highlights
13
Copper Nickel
Ni production ahead of Q3 2015 and Q4 2014 driven by Kevitsa.
Nickel C1 cost below Q3 2015 and Q4 2014 due to cost savings and favourable FX
13
Copper ('000 tonnes) 120.2 +12.7 +15.0
Nickel ('000 contained tonnes) 10.2 +0.2 +0.3
Production Q4 2015 vs Q4 2014vs Q3 2015
Copper sales significantly higher than Q3 2015 and Q4 2014 driven by Kansanshi production and anode sell down Nickel higher than Q3 2015

Comparative EBITDA impact of lower metal prices partly offset by cost savings
Financial Overview
Gross profit against Q3 2015 higher due to higher sales volumes and favourable FX, partly offset by lower realized prices.
Q3 2015 Comparative EBITDA includes $49m Ravensthorpe insurance proceeds in other income. Excluding this Q4 2015 Comparative EBITDA is $18m (or 8%) higher.
Financial results are below Q4 2014 due to lower metal prices partially offset by cost reductions, higher copper sales volumes and appreciation of the US dollar.
Net debt decreased from Q3 2015 with Franco-Nevada receipt, favourable working capital and EBITDA.
(1) Earnings attributable to shareholders of the Company and EBITDA have been adjusted to exclude impacts which are not reflective of underlying performance to arrive at comparative earnings and comparative EBITDA. Items excluded from comparative measures include impairment charges ,foreign exchange and revisions in estimates of closed site restoration provisions. A reconciliation of comparative EBITDA and comparative earnings is provided in the Q4 2015 MD&A.
14
Q4 2015 comparative earnings and EPS benefitted from $43m of tax credits in relation to hedging gains and the actualization of full year tax rates.
Revenue 765 673 821
Gross Profit 110 103 183
Comparative EBITDA 1 230 261 282
Comparative Earnings 190 70 62
Comparative EPS (Basic) 0.28 0.10 0.10
Net Debt (4,696) (5,053) (5,372)
$ million Q4 2015 Q4 2014Q3 2015
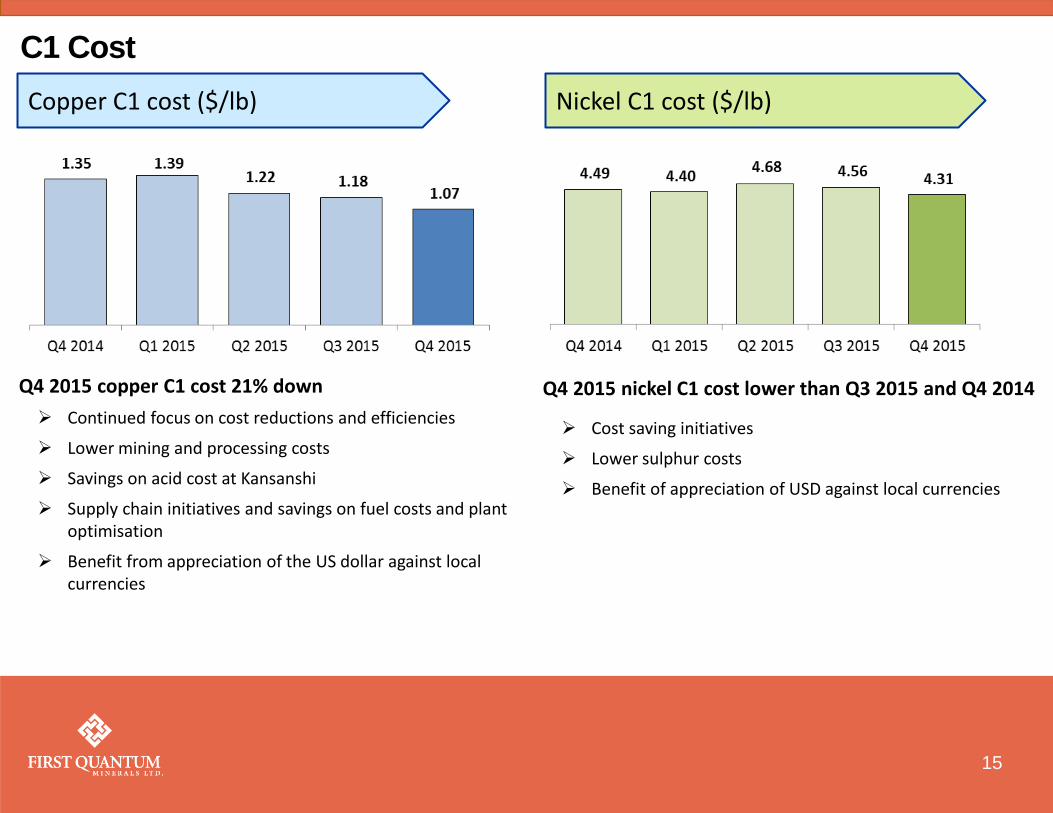
Q4 2015 copper C1 cost 21% down
Continued focus on cost reductions and efficiencies
Lower mining and processing costs
Savings on acid cost at Kansanshi
Supply chain initiatives and savings on fuel costs and plant optimisation
Benefit from appreciation of the US dollar against local currencies
C1 Cost
Copper C1 cost ($/lb) Nickel C1 cost ($/lb)
Q4 2015 nickel C1 cost lower than Q3 2015 and Q4 2014
Cost saving initiatives
Lower sulphur costs
Benefit of appreciation of USD against local currencies
15

Q4 2015 Gross Profit versus Q4 2014
Gross profit below Q4 2014 driven by lower realized metal prices partially offset by cost savings, higher sales volumes and favourable FX
16
Q4 2014
Gross
realized
price
FXSales
VolumesCosts Depreciation Royalty Q4 2015
110
183
(249)
40
67
93
(11)(13)
$ m
illio
n
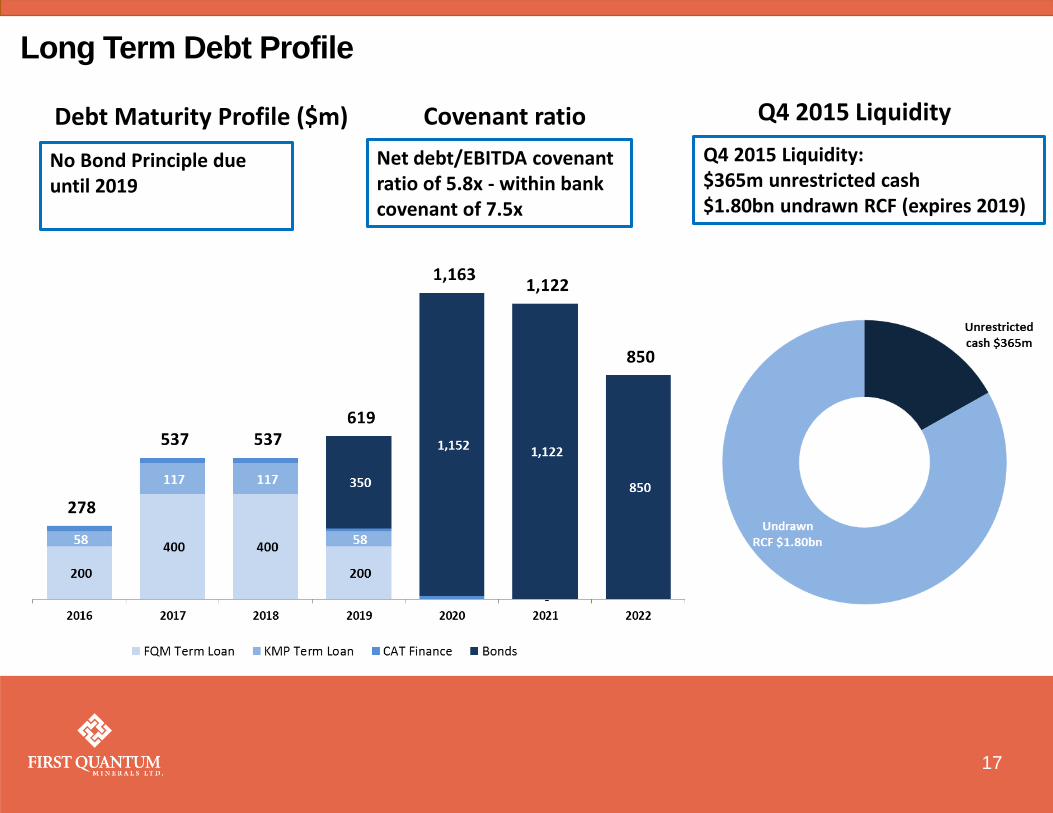
Debt Maturity Profile ($m)
Long Term Debt Profile
No Bond Principle due until 2019
Q4 2015 Liquidity: $365m unrestricted cash $1.80bn undrawn RCF (expires 2019)
Q4 2015 Liquidity
17
Net debt/EBITDA covenant ratio of 5.8x - within bank covenant of 7.5x
Covenant ratio

Capital Expenditure - $1.74bn reduction in Total Capital spend
18
(1) Capital expenditure excludes capitalized interest and capitalized pre-production costs
Cobre Panama Funding ($bn)
$5.48bn
Cobre Panama total capex
reduced from $6.42bn to
$5.48bn with savings on
earthworks, material and
equipment costs
First Quanum incurred 3rd Party incurred
First Quantum to spend 3rd Part to spend
US$ billon
2015
Actual
2016
Guidance
2017
Guidance
2018
Guidance
Cobre Panama 0.61 0.65 0.80 0.80
Net to First Quantum 0.37 0.39 0.48 0.48
Kansanshi 0.15 - - -
Trident 0.20 0.02 - -
Other 0.03 - 0.01 0.02
Total projects 0.75 0.41 0.49 0.50
Stripping costs 0.23 0.20 0.20 0.20
Other sustaining capex 0.20 0.10 0.13 0.12
Total net capex (1) 1.18 0.71 0.82 0.82
Pro
ject
s
US$ billion Total First Quantum 3rd Party
Cobre Panama project
Capital spend to Dec 2015 2.72 1.86 0.86
2016 Guidance capital spend 0.65 0.39 0.26
Estimated remaining capital spend 2.12 1.27 0.85
Total Cobre Panama 5.48 3.52 1.97
Funded by

Cu 2016 Cu 2017 and 2018
$1.15 – 1.35/lb $1.20 – 1.40/lb
$1.70 – 1.90/lb $1.70 – 1.90/lb
Market Guidance
Copper cost guidance3 Nickel cost guidance reduced from 2015
Production guidance for copper increasing against 2015
Copper production1
2016: 400k tonnes 2017: 400k tonnes 2018: 407k tonnes
Zinc production 2016: 26k tonnes 2017: 20k tonnes 2018: 20k tonnes
Nickel production 2016: 40k contained tonnes 2017: 40k contained tonnes 2018: 42k contained tonnes
Gold production 2016: 215k ounces 2017: 225k ounces 2018: 225k ounces
Palladium production 2016: 24 – 30k ounces 2017: 24 – 30k ounces 2018: 25 – 30k ounces
Platinum production 2016: 30 – 40k ounces 2017: 30 – 40k ounces 2018: 35 – 40k ounces
19
Ni 2016 to 2018
$4.00 – 4.40/lb
$4.80 – 5.10/lb
C1
AISC2
1) Copper production excludes Sentinel. 2) All-in sustaining costs includes C1, royalties, allocation of corporate overheads and sustaining capital expenditure including stripping costs. 3) C1 and AISC cost guidance excludes Sentinel in 2016, including Sentinel: C1 $1.25/lb - $1.45/lb; AISC $1.75/lb - $1.95/lb.
Sentinel Copper production1
2016: 135 - 155k tonnes 2017: 210 - 240k tonnes 2018: 230 - 260k tonnes

APPENDIX
20

Quarterly Net Debt Movement
(1) Includes $51m of capitalized interest (2) Excludes $93m restricted cash (3) $1,800m on the senior debt facility
Comparative EBITDA 230
Working capital and tax 192
Franco-Nevada 338
Capital expenditure (399)
Net interest paid(1) (55)
Part repayment of ENRC promissory note and prepaid interest 23
Other 28
Net debt movement 357
Opening Net Debt at October 1, 2015 ($ million) (5,053)
Closing Net Debt at December 31, 2015 ($ million) (4,696)
Available committed undrawn debt facilities at December 31, 2015(3) 1,800
Net Debt comprised of: Cash & cash equivalents(2) 365 Total debt (5,061)
21

FOURTH QUARTER 2015 CONFERENCE CALL & WEBCAST
FEBRUARY 19, 2016
TSX: FM; LSE: FQM