2. forecast demand
TRANSCRIPT
8/12/2019 2. Forecast Demand
http://slidepdf.com/reader/full/2-forecast-demand 1/22
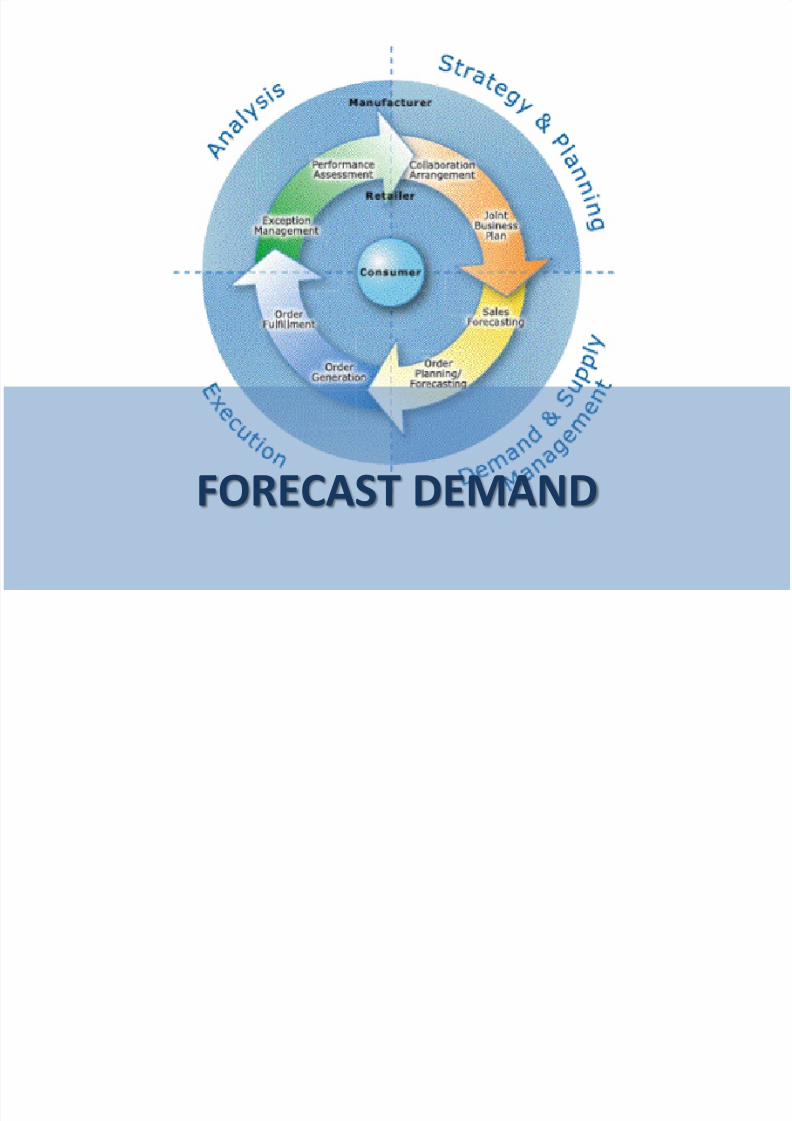
FORECAST DEMAND
8/12/2019 2. Forecast Demand
http://slidepdf.com/reader/full/2-forecast-demand 2/22
FORECAST IS DIFFICULT
“Prediction is very difficult, especially if it's about thefuture”
-Niels Bohr-
" It is often said there are two types of forecasts ... luckyor wrong!!!! “
-in "Control" magazine published by Institute ofOperations Management-
"Forecasting is the art of saying what will happen, andthen explaining why it didn't! “
-Anonymous (communicated by Balaji Rajagopalan)-
8/12/2019 2. Forecast Demand
http://slidepdf.com/reader/full/2-forecast-demand 3/22
FORECASTING
Prediction, projection, estimationoccurrence of uncertain future events or levels activity
8/12/2019 2. Forecast Demand
http://slidepdf.com/reader/full/2-forecast-demand 4/22
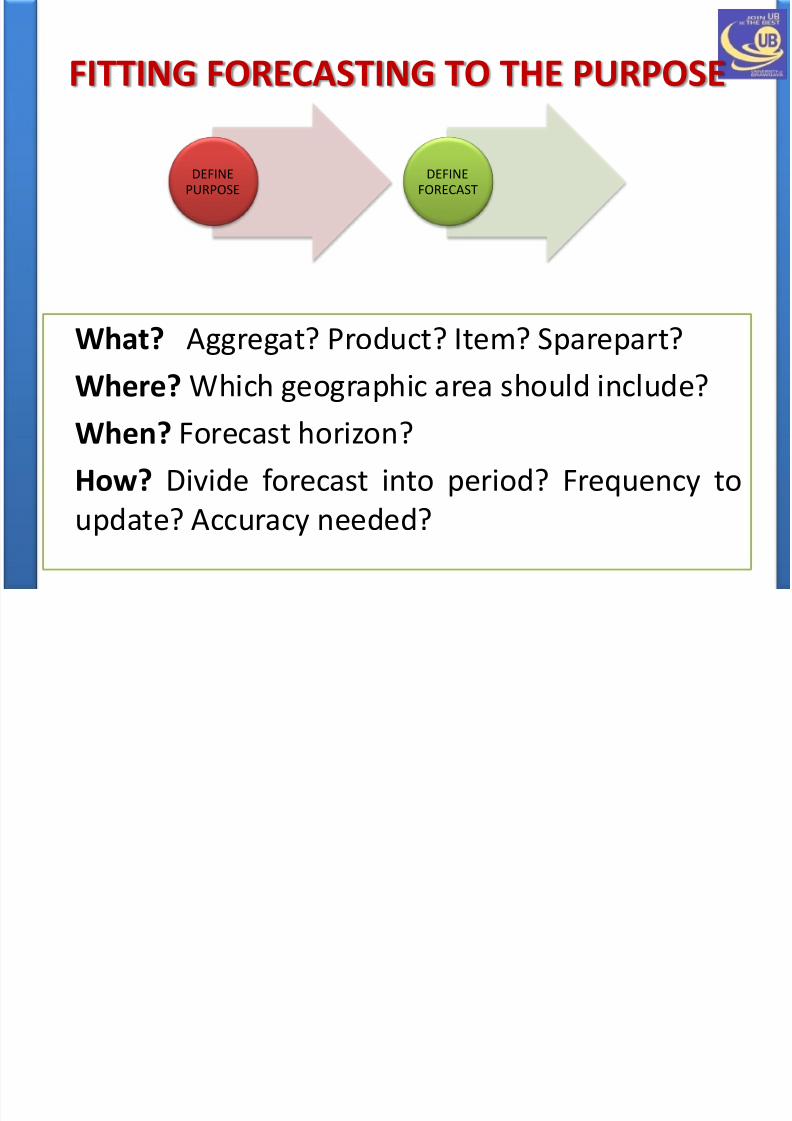
FITTING FORECASTING TO THE PURPOSE
What? Aggregat? Product? Item? Sparepart?
Where? Which geographic area should include?
When? Forecast horizon?
How? Divide forecast into period? Frequency to
update? Accuracy needed?
DEFINE
PURPOSE
DEFINE
FORECAST
8/12/2019 2. Forecast Demand
http://slidepdf.com/reader/full/2-forecast-demand 5/22
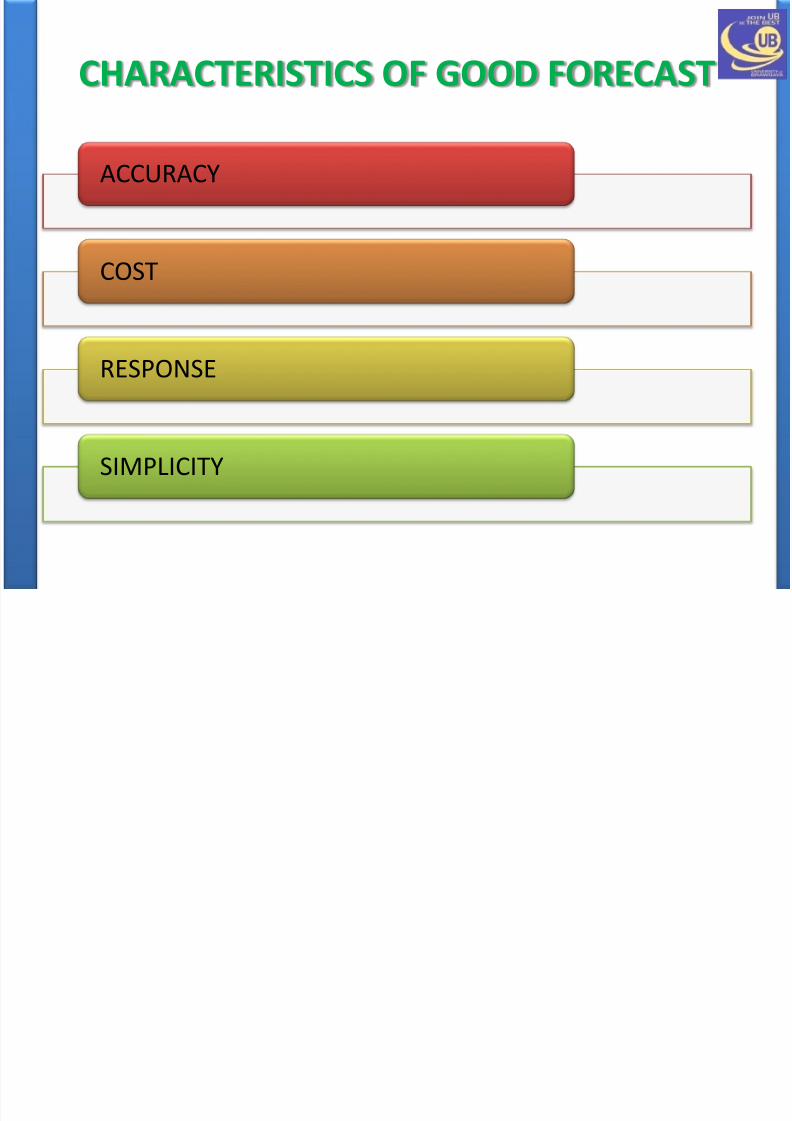
CHARACTERISTICS OF GOOD FORECAST
ACCURACY
COST
RESPONSE
SIMPLICITY
8/12/2019 2. Forecast Demand
http://slidepdf.com/reader/full/2-forecast-demand 6/22
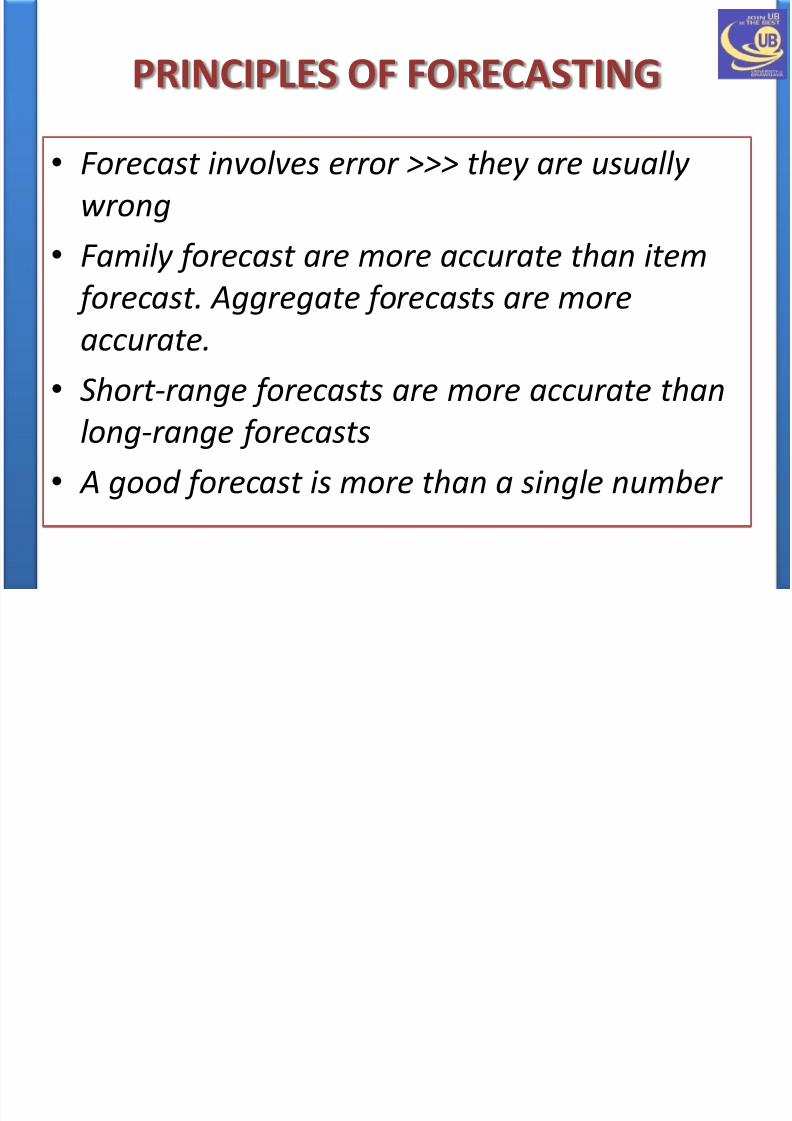
PRINCIPLES OF FORECASTING
• Forecast involves error >>> they are usually
wrong
• Family forecast are more accurate than item
forecast. Aggregate forecasts are more
accurate.
• Short-range forecasts are more accurate than
long-range forecasts
• A good forecast is more than a single number
8/12/2019 2. Forecast Demand
http://slidepdf.com/reader/full/2-forecast-demand 7/22
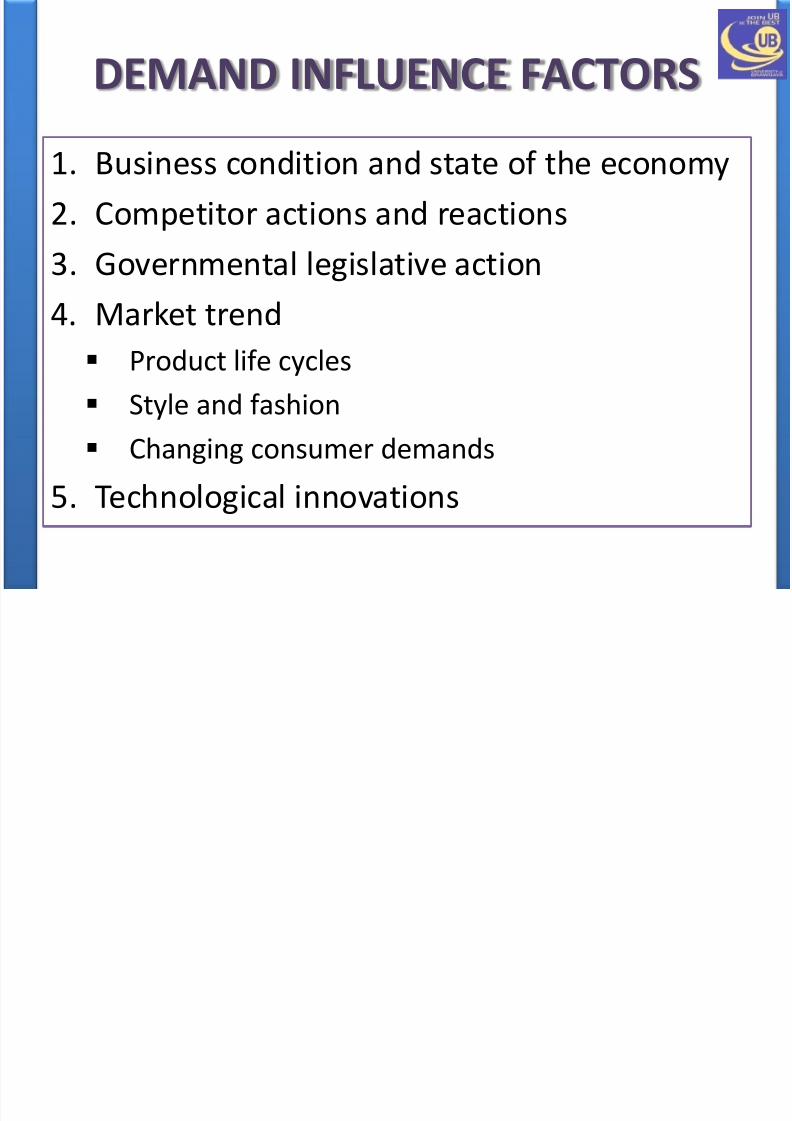
DEMAND INFLUENCE FACTORS
1. Business condition and state of the economy
2. Competitor actions and reactions
3. Governmental legislative action4. Market trend
Product life cycles
Style and fashion
Changing consumer demands
5. Technological innovations
8/12/2019 2. Forecast Demand
http://slidepdf.com/reader/full/2-forecast-demand 8/22
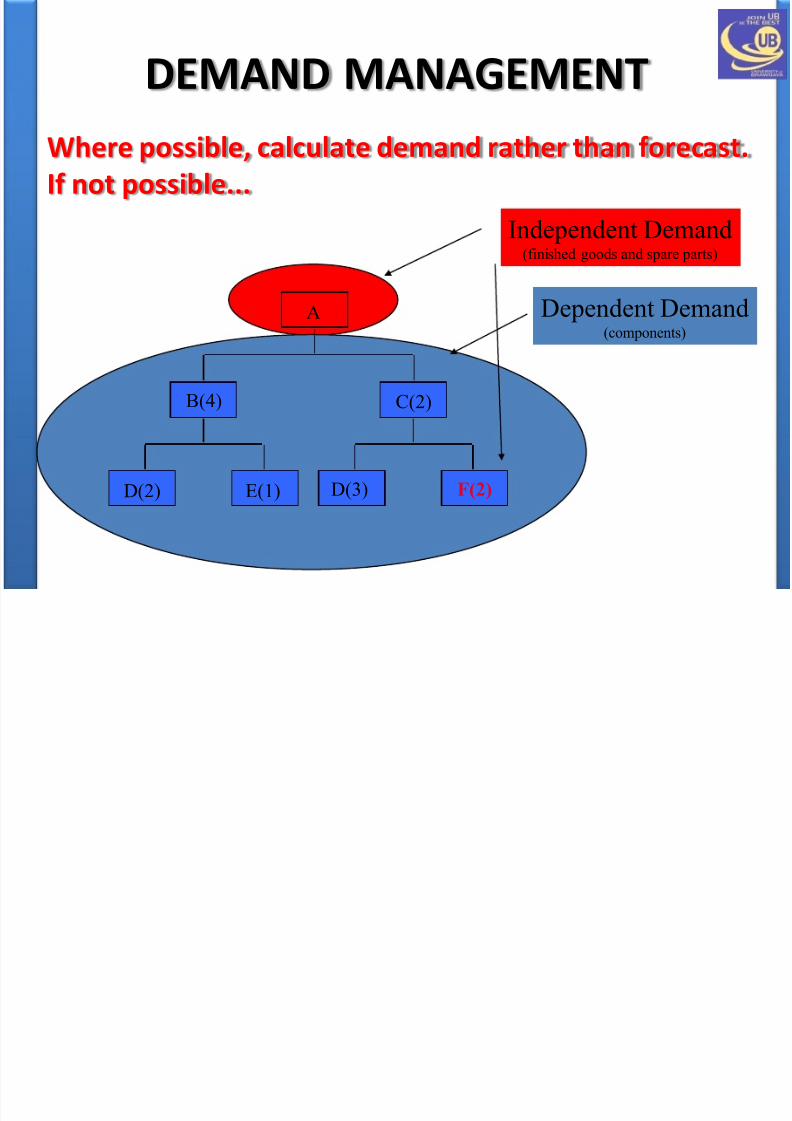
DEMAND MANAGEMENT
A
Independent Demand(finished goods and spare parts)
B(4) C(2)
D(2) E(1) D(3) F(2)
Dependent Demand(components)
Where possible, calculate demand rather than forecast.If not possible...

8/12/2019 2. Forecast Demand
http://slidepdf.com/reader/full/2-forecast-demand 9/22
DemandEstimates
SalesForecast
ProductionResource
Forecast

8/12/2019 2. Forecast Demand
http://slidepdf.com/reader/full/2-forecast-demand 10/22
Examples of Production Resource Forecasts
Forecast
Horizon Time Span Item Being Forecast
Units of
Measure
Long-Range Years
• Product lines
• Factory capacities
• Planning for new products
• Capital expenditures
• Facility location or expansion
• R&D
Dollars, tons,
etc.
Medium-
RangeMonths
• Product groups
• Department capacities
• Sales planning
• Production planning and
budgeting
Dollars, tons,
etc.
Short-Range Weeks
•
Specific product quantities• Machine capacities
• Planning
• Purchasing
• Scheduling
• Workforce levels
• Production levels
•Job assignments
Physical units
of products

8/12/2019 2. Forecast Demand
http://slidepdf.com/reader/full/2-forecast-demand 11/22
FORECAST METHODS
• QUALITATIVE
– Sales force composite
– Market Research
– Management Decision (Jury of executive opinion)
– The Delphi Method
• QUANTITATIVE
– Time series
8/12/2019 2. Forecast Demand
http://slidepdf.com/reader/full/2-forecast-demand 12/22
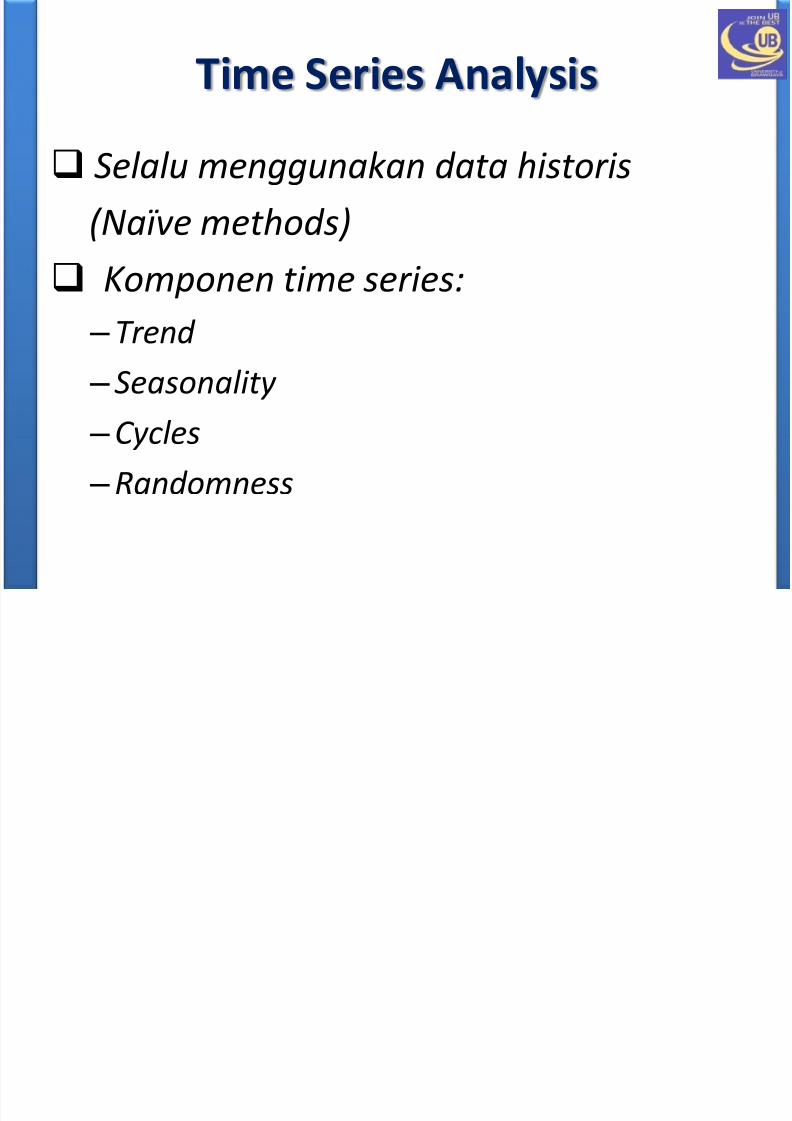
Time Series Analysis
Selalu menggunakan data historis
(Naïve methods)
Komponen time series: – Trend
– Seasonality
– Cycles
– Randomness
8/12/2019 2. Forecast Demand
http://slidepdf.com/reader/full/2-forecast-demand 13/22
Simple Time Series Models
• Moving Average (Simple & Weighted)
• Exponential Smoothing (Single)
•
Double Exponential Smoothing (Holt’s)• Winter’s Method for Seasonal Problems
8/12/2019 2. Forecast Demand
http://slidepdf.com/reader/full/2-forecast-demand 14/22
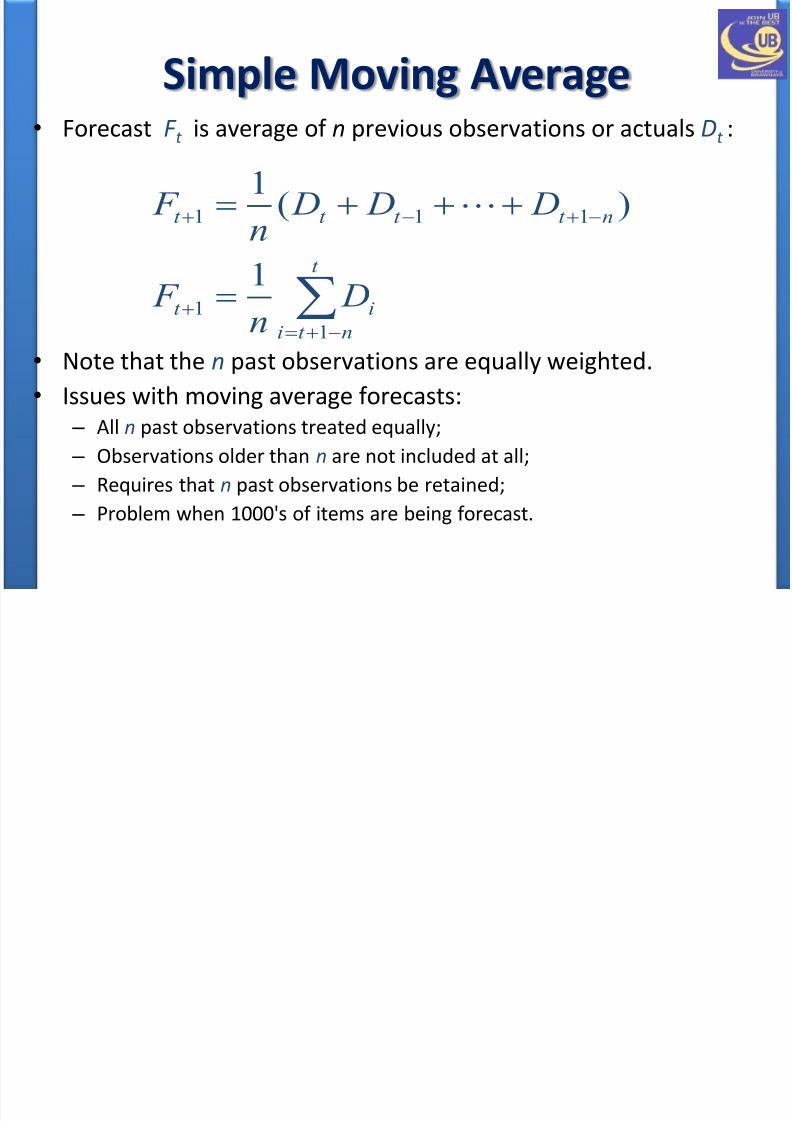
Simple Moving Average•
Forecast F t is average of n previous observations or actuals Dt :
• Note that the n past observations are equally weighted.
• Issues with moving average forecasts:
– All n past observations treated equally;
– Observations older than n are not included at all;
– Requires that n past observations be retained;
– Problem when 1000's of items are being forecast.
t
nt i
it
nt t t t
Dn
F
D D Dn
F
1
1
111
1
)(1
8/12/2019 2. Forecast Demand
http://slidepdf.com/reader/full/2-forecast-demand 15/22
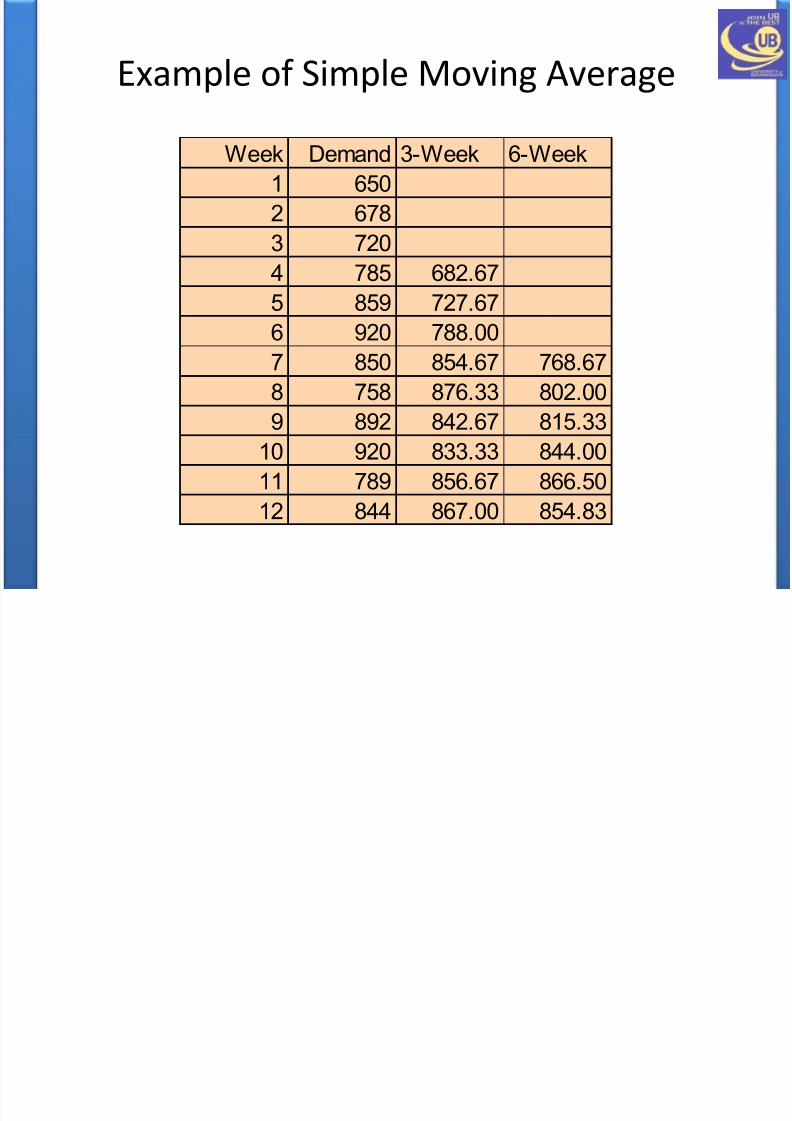
Example of Simple Moving Average
Week Demand 3-Week 6-Week
1 650
2 678
3 720
4 785 682.675 859 727.67
6 920 788.00
7 850 854.67 768.67
8 758 876.33 802.00
9 892 842.67 815.33
10 920 833.33 844.00
11 789 856.67 866.50
12 844 867.00 854.83
8/12/2019 2. Forecast Demand
http://slidepdf.com/reader/full/2-forecast-demand 16/22
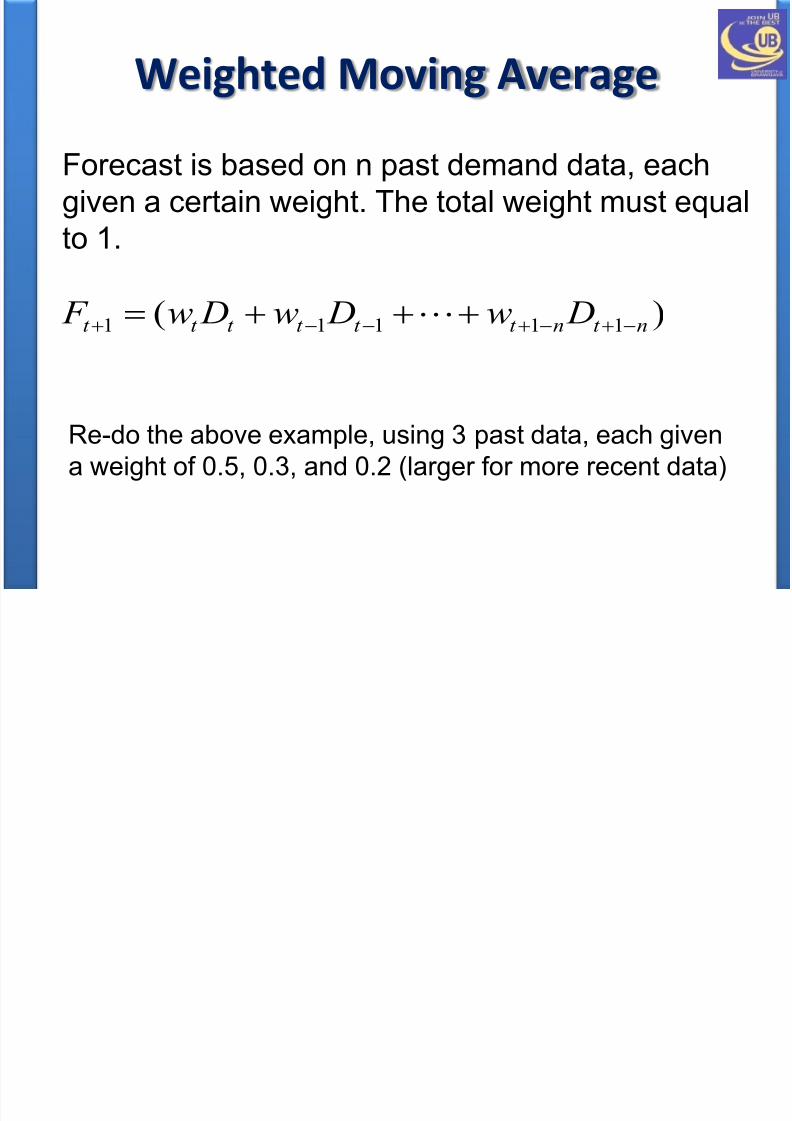
Weighted Moving Average
)( 11111 nt nt t t t t t Dw Dw Dw F
Forecast is based on n past demand data, each
given a certain weight. The total weight must equal
to 1.
Re-do the above example, using 3 past data, each given
a weight of 0.5, 0.3, and 0.2 (larger for more recent data)
8/12/2019 2. Forecast Demand
http://slidepdf.com/reader/full/2-forecast-demand 17/22
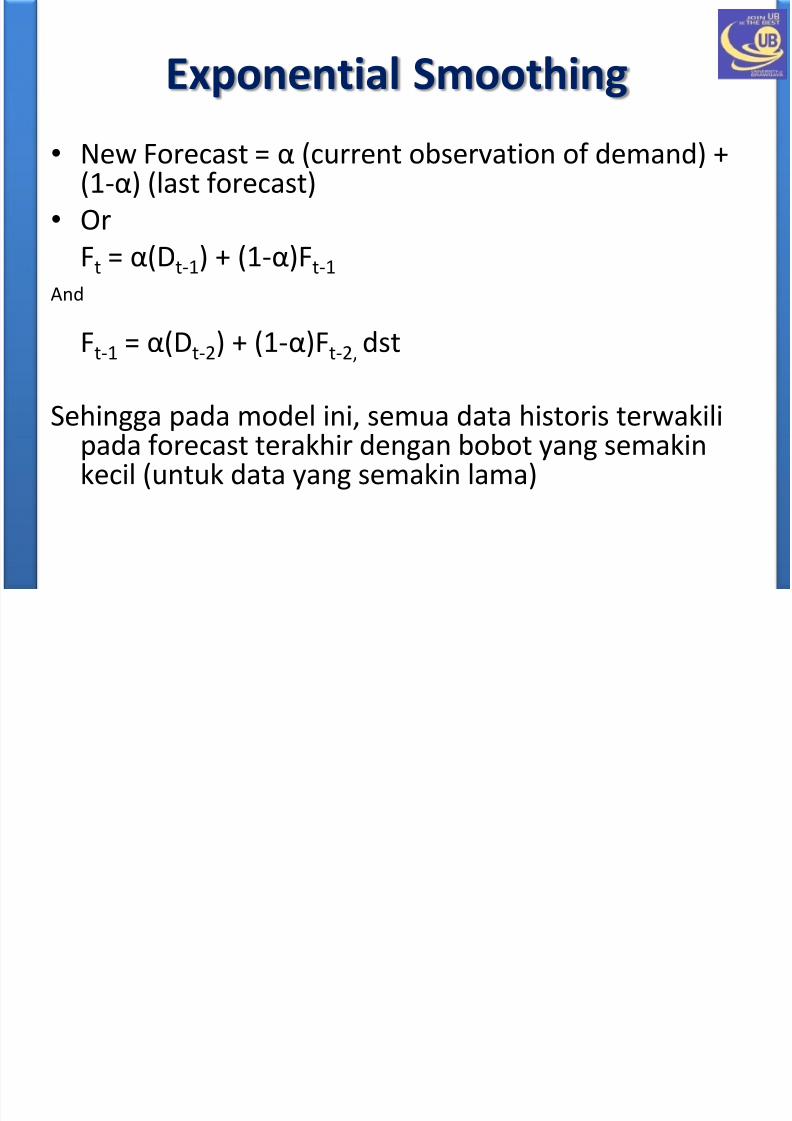
Exponential Smoothing
• New Forecast = α (current observation of demand) +(1-α) (last forecast)
• Or
Ft = α(Dt-1) + (1-α)Ft-1
And
Ft-1 = α(Dt-2) + (1-α)Ft-2, dst
Sehingga pada model ini, semua data historis terwakilipada forecast terakhir dengan bobot yang semakinkecil (untuk data yang semakin lama)
8/12/2019 2. Forecast Demand
http://slidepdf.com/reader/full/2-forecast-demand 18/22
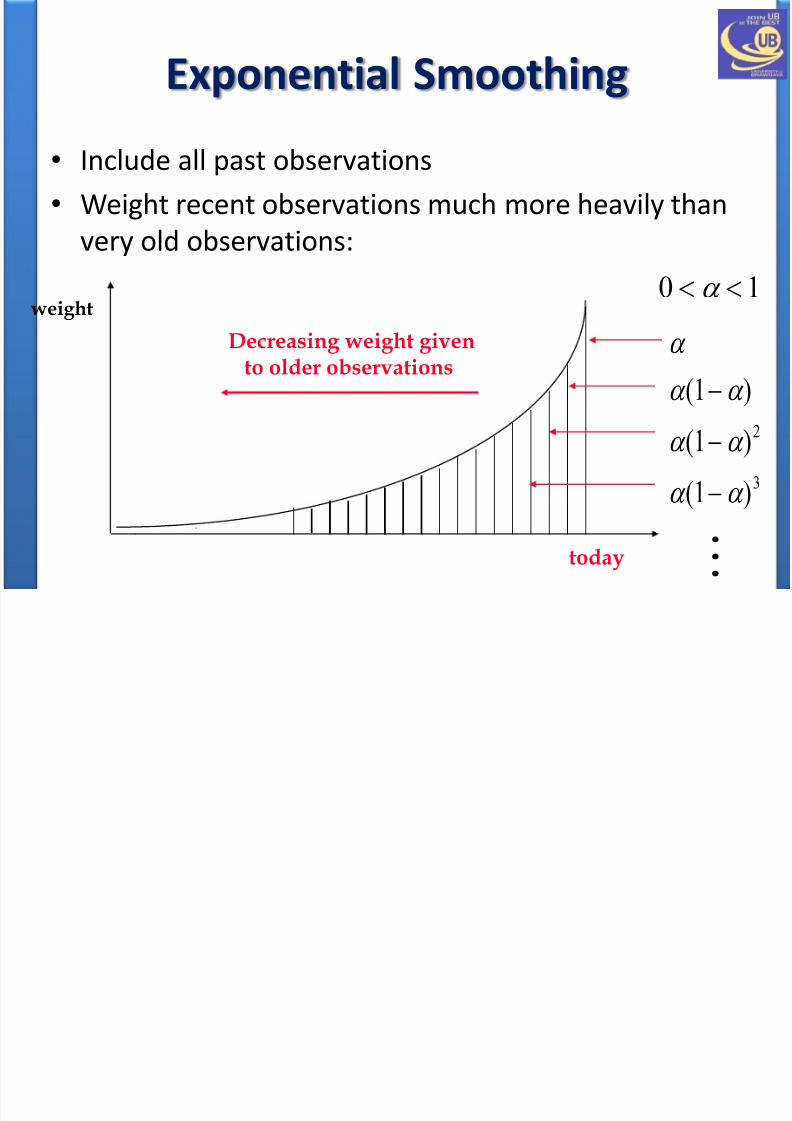
Exponential Smoothing
• Include all past observations
• Weight recent observations much more heavily than
very old observations:
weight
today
Decreasing weight givento older observations
0 1
( )
( )
( )
1
1
1
2
3
8/12/2019 2. Forecast Demand
http://slidepdf.com/reader/full/2-forecast-demand 19/22
8/12/2019 2. Forecast Demand
http://slidepdf.com/reader/full/2-forecast-demand 20/22
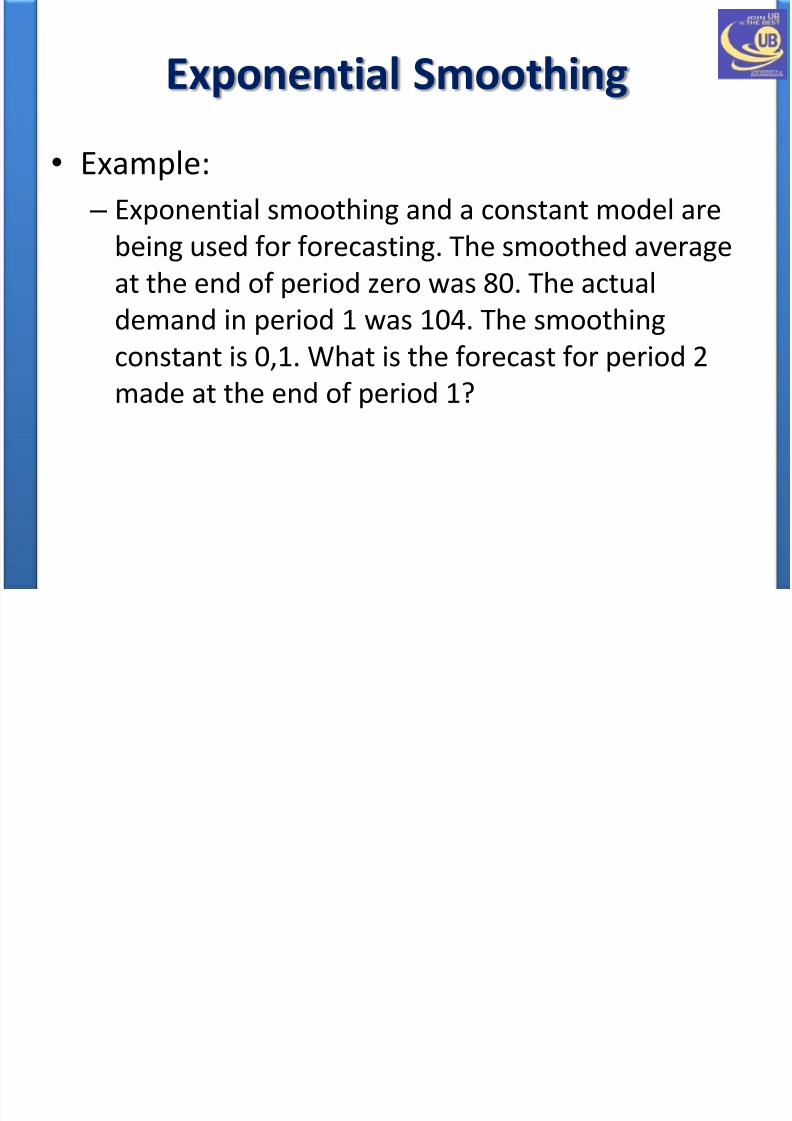
Exponential Smoothing
• Example:
– Exponential smoothing and a constant model are
being used for forecasting. The smoothed average
at the end of period zero was 80. The actualdemand in period 1 was 104. The smoothing
constant is 0,1. What is the forecast for period 2
made at the end of period 1?
8/12/2019 2. Forecast Demand
http://slidepdf.com/reader/full/2-forecast-demand 21/22
Persamaan MA dan ES
• Sama-sama mengasumsikan demand bersifat
stationary
• Keduanya tergantung pada 1 nilai parameter,
N pada MA dan α pada ES.
• Kalau ada trend, kedua-duanya terlambat
dalam merespon

8/12/2019 2. Forecast Demand
http://slidepdf.com/reader/full/2-forecast-demand 22/22
Perbedaan MA dan ES
• MA mengakomodasikan lebih banyak data
• ES hanya menyimpan dua data: forecast
terakhir dan actual demand terakhir, sedang
MA menyimpan N data demand terakhir