2 access presentation2
DESCRIPTION
UK Biodiversity Information Systems Steve Wilkinson [email protected] What do we need to know? • Where are they / where are they not? • How are they changing? • What is their ecology? Pressures • What pressures are driving change? • How/where are these operating? • How are they changing? Pressures Actions • What are we doing / where? • Is it ‘joined up’? • What effect is it having?TRANSCRIPT


• Where are they / where are they not? • How are they changing? • What is their ecology?
What do we need to know?

What do we need to know?
Pressures
• What pressures are driving change? • How/where are these operating? • How are they changing?

What do we need to know?
Pressures
Actions
• What are we doing / where? • Is it ‘joined up’? • What effect is it having?

Species • Range of surveillance schemes – good data for a small
number of groups • Huge amount of unstructured samples • Value of mobilising these data recognised – led to the
formation of National Biodiversity Network (NBN) • Invested hard in this area – lot of very dispersed data • Developed standards to improve data exchange and use • Tools are what get standards applied!

Species - National Gateway • http://data.nbn.org.uk • Now holds over 50 million records from 500 datasets • Still unique in having controlled access to data • Allows simple visualisations of the data but also
downloads (in standard format)

Species – next steps • Exploring and developing uses – difficult given the data
are patchy • Improving data quality (tools and rules) • On-line data capture • Better sharing at broader scales

Habitats • Broad scale – Land Cover Map
– Inventory derived from remote sensed data – Combines soil and digital boundary data – BUT – coarse and infrequent – value is limited – Published through a range of portals (NBN and http://
www.magic.gov.uk)
8km across

Habitats • Broad scale – Land Cover Map • Local surveys
– Patchy and not well standardised – Useful locally but not strategically – Not really published

Habitats • Broad scale – Land Cover Map • Local surveys • Priority habitats
– Small patches of habitat with high conservation value – Derived locally (from local survey) and collated – Expensive process – Main value is where it is – Again published through NBN, http://www.magic.gov.uk etc
Habitats – looking ahead • Still don’t have a good method of picking up the scale of
habitat change we are expecting • Developing area for us – extracting more value from
remote sensing
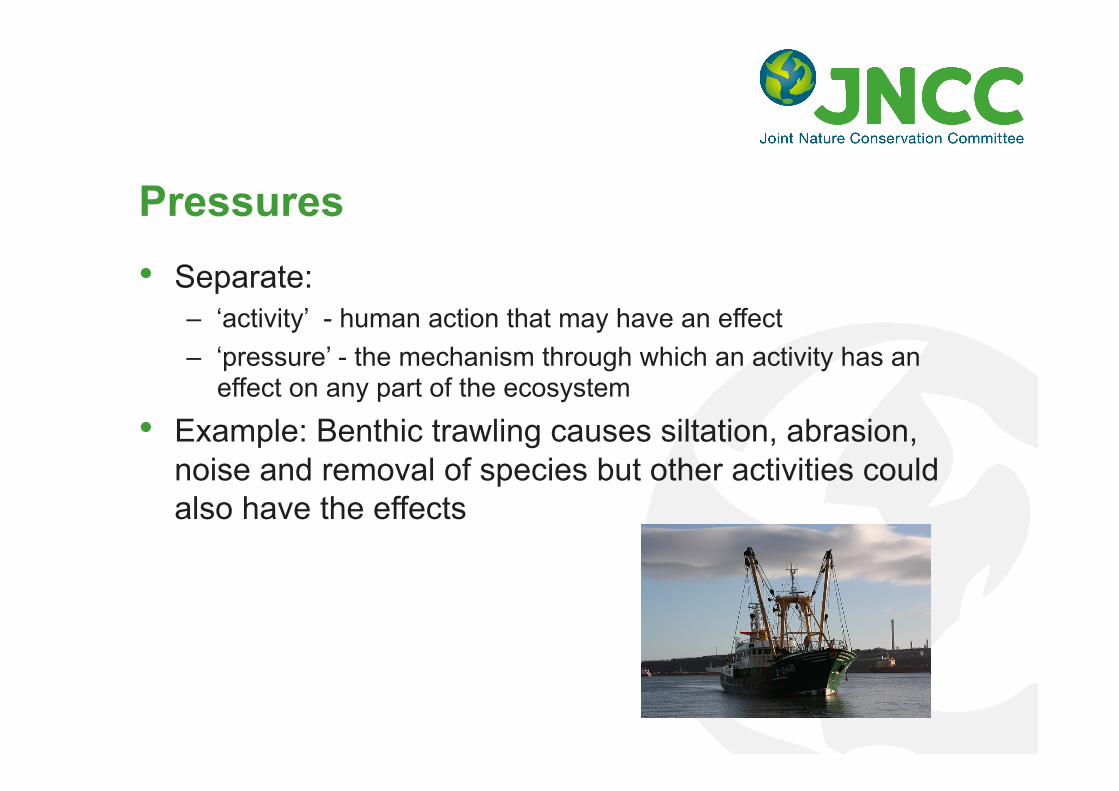
Pressures • Separate:
– ‘activity’ - human action that may have an effect – ‘pressure’ - the mechanism through which an activity has an
effect on any part of the ecosystem
• Example: Benthic trawling causes siltation, abrasion, noise and removal of species but other activities could also have the effects
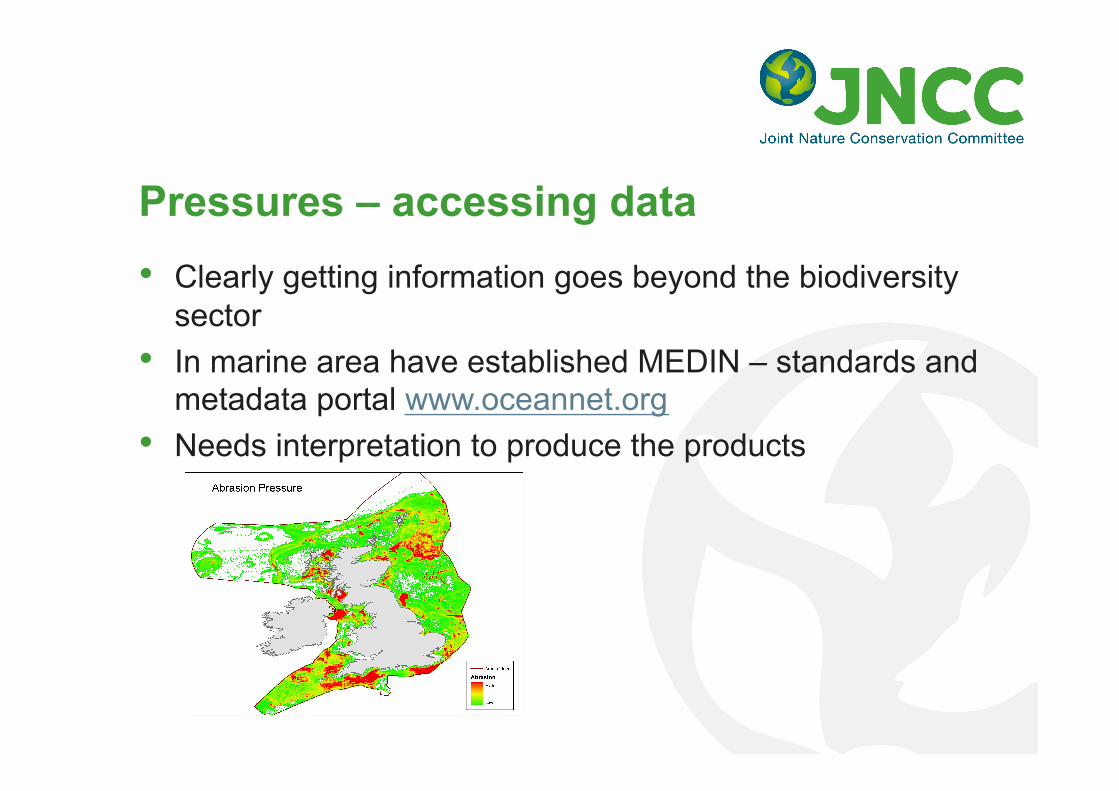
Pressures – accessing data • Clearly getting information goes beyond the biodiversity
sector • In marine area have established MEDIN – standards and
metadata portal www.oceannet.org • Needs interpretation to produce the products

Pressures – accessing data • Terrestrially have established UKEOF (www.ukeof.org) to
develop monitoring catalogue • Metadata only at the moment • Big emerging area for the UK – especially in the marine
environment

Action • What we are doing to address the pressures • For example:
– Protected areas – Habitat restoration or creation – Incentivising activities
• Usually target driven and involves many partners

Actions - targets
Global
European
National
Regional
Local
• Needs co-ordination • Have developed BARS (ukbap-reporting.org.uk)

Actions – looking ahead • Not enough content in BARS (tends to be held in local
systems). How to incentivise transfer and sharing? • Developing standards for exchanging the data • Making the website more geographical

How far to go?
Metadata only
Metadata and a data standard
Metadata, a data standard and tools
Summary of experience • Mobilising data is expensive! • Need to think carefully about whether metadata is
enough • Data standards more expensive – need to weigh up the
benefits • Getting standards adopted in hard but can use control,
benefit to provider or tools