2 - 1© 2011 pearson education, inc. publishing as prentice hall 10 strategic om decisions 1.goods...
TRANSCRIPT

2 - 1© 2011 Pearson Education, Inc. publishing as Prentice Hall
10 Strategic OM Decisions10 Strategic OM Decisions
1. Goods and service design
2. Quality
3. Process and capacity design
4. Location selection
5. Layout design
6. Human resources and job design
7. Supply-chain management
8. Inventory
9. Scheduling
10. Maintenance

2 - 2
Goods & ServicesGoods & ServicesGOODS (a pizza)
Actual useful objects
Produced ahead of use
Same for everyone
Business consumer
Standardisation important
Quality from specifications
Can be returned
tangible
SERVICES (a haircut)
Only exist as happening
Simultaneous prod/cons.
Unique for each person
Business with consumer
Flexibility important
Quality from experience
Can’t be returned
intangible
© 2011 Pearson Education, Inc. publishing as Prentice Hall

2 - 3
G&S tangibility spectrum G&S tangibility spectrum (an idea from marketing)(an idea from marketing)
© 2011 Pearson Education, Inc. publishing as Prentice Hall
saltsoftdrinks
automobilescosmetics
fastfood outlets
fastfood outletsadvertising agencies
airlinesconsulting
teaching
Tangible ‘dominant’(‘goods’ focus)
Intangible ‘dominant’(‘service’ focus)

2 - 4
More ideas from marketingMore ideas from marketingGoodsTangibleEasy to patent, stockpile, display, price
StandardisedEasy to state quality, meet customer expectations.
Production separateDifferent location (centralise & scale), no customer interaction, can mass produce
NonperishableEasy to match supply & demand, can return etc.
ServicesIntangible Difficult to patent, stockpile, display, price
HeterogeneousQuality varies for each customer interaction
Production simultaneousHappens ‘as consumed’, same location, (decentralise & small), cannot mass produce.
PerishableMade ‘on-the-spot’ – difficult to match S&D, or to return.

2 - 5© 2011 Pearson Education, Inc. publishing as Prentice Hall
Goods and Services and Goods and Services and the 10 OM Decisionsthe 10 OM Decisions
OperationsOperationsDecisionsDecisions GoodsGoods ServicesServicesGoods and service design
Product is usually tangible
Product is not tangible
Quality Many objective standards
Many subjective standards
Process and capacity design
Customers not involved
Customer may be directly involved
Capacity must match demand
Table 2.1

2 - 6© 2011 Pearson Education, Inc. publishing as Prentice Hall
Goods and Services and Goods and Services and the 10 OM Decisionsthe 10 OM Decisions
OperationsOperationsDecisionsDecisions GoodsGoods ServicesServicesLocation selection
Near raw materials and labor
(reduce cost)
Near customers
(increase revenue)
Layout design Production efficiency
(reduce cost)
Increase product exposure
(increase revenue)Human resources and job design
Technical skills, consistent labor standards, output based wages
Interact with customers, labor standards vary
Table 2.1

2 - 7
Goods and Services and Goods and Services and the 10 OM Decisionsthe 10 OM Decisions
OperationsOperationsDecisionsDecisions GoodsGoods ServicesServicesSupply chain Relationship critical
to final productImportant, but may not be critical
Inventory Raw materials, work-in-process, and finished goods may be held
Cannot be stored
Scheduling Level schedules possible
Meet immediate customer demand
(biggest issue)

2 - 8© 2011 Pearson Education, Inc. publishing as Prentice Hall
Goods and Services and Goods and Services and the 10 OM Decisionsthe 10 OM Decisions
OperationsOperationsDecisionsDecisions GoodsGoods ServicesServicesMaintenance Often preventive
and takes place at production site
Often “repair” and takes place at customer’s site
Table 2.1

2 - 9
Assessment OneAssessment One
© 2011 Pearson Education, Inc. publishing as Prentice Hall
Apply the 10 OM areas to a business
Assume you can identify the business strategy
Show how the 10 OM areas support the strategy

2 - 10© 2011 Pearson Education, Inc. publishing as Prentice Hall

2 - 11© 2011 Pearson Education, Inc. publishing as Prentice Hall
Operations Management History(major themes)
1960 = cost and efficiency
1970 = quality revolution
1980 = customisation & design
1985 = time / speed of response
1995 = service & value
2000 =sustainability
( all part of OM today)

2 - 12© 2011 Pearson Education, Inc. publishing as Prentice Hall
Developing Missions and StrategiesDeveloping Missions and Strategies
MissionMission statements set an organization’s goal.
StrategyStrategy is how the organization reaches the goal

2 - 13© 2011 Pearson Education, Inc. publishing as Prentice Hall
Mission
Factors Affecting MissionFactors Affecting Mission
Philosophy and Values
Profitability and GrowthEnvironment
Customers Public Image

2 - 14© 2011 Pearson Education, Inc. publishing as Prentice Hall
Strategic ProcessStrategic Process
Marketing Operations Finance/ Accounting
Functional Area Missions
Organization’s Mission

2 - 15© 2011 Pearson Education, Inc. publishing as Prentice Hall
StrategyStrategy Action plan to achieve mission
Functional areas each have strategies
Strategies should
exploit opportunities & strengths,
neutralize threats
avoid weaknesses

2 - 16© 2011 Pearson Education, Inc. publishing as Prentice Hall
Strategies for Competitive AdvantageStrategies for Competitive Advantage(really only three of them)(really only three of them)
Differentiation Having a unique selling point (USP)
Market driven
Cost leadership Having the lowest price
Industry driven
Focus Finding a target market within a target market

2 - 17
Porters Competitive StrategiesPorters Competitive Strategies
© 2011 Pearson Education, Inc. publishing as Prentice Hall

2 - 18© 2011 Pearson Education, Inc. publishing as Prentice Hall
Competing on Competing on Differentiation (D)Differentiation (D)
Uniqueness can go beyond both the physical characteristics and service
attributes to encompass everything that impacts customer’s perception of value
Blunt umbrellas https://www.bluntumbrellas.com/nz/
Burger Wisconsin https://www.burgerwisconsin.co.nz/

2 - 19© 2011 Pearson Education, Inc. publishing as Prentice Hall
Competing on Cost Competing on Cost Leadership (CL)Leadership (CL)
Provide the maximum value as perceived by customer. Does not imply low quality.
(Customer expectations define quality)
Pak n Save http://www.paknsave.co.nz/
Jet Star http://www.jetstar.com/nz/en/home

2 - 20
Competing on Focus (F)Competing on Focus (F)
42 below http://www.42below.com/lda
(super premium vodka)
homebrand (extra cheap products
http://www.countdown.co.nz/our-brands/homebrand
© 2011 Pearson Education, Inc. publishing as Prentice Hall
Finding a ‘sweet spot’ within another strategy by focusing on ‘doing-the-strategy’ more

2 - 21
Strategy Development and Strategy Development and ImplementationImplementation
Decide on strategy (D, CL, F)
Identify key success factors for that strategy
Build and staff the organization
Integrate OM with other activities to deliver strategy
The operations manager’s job is to set up an OM strategy, provide competitive advantage, and
increase productivity

2 - 22© 2011 Pearson Education, Inc. publishing as Prentice Hall
Process DesignProcess Design
Low Moderate HighVolume
High
Moderate
Low
Var
iety
of
Pro
du
cts
Process-focusedJOB SHOPS
(Print shop, emergency room, machine shop,
fine-diningrestaurant)
Repetitive (modular) focus
ASSEMBLY LINE(Cars, appliances,
TVs, fast-food restaurants) Product focused
CONTINUOUS(Steel, beer, paper, bread, institutional
kitchen)
Mass CustomizationCustomization at high
Volume(Dell Computer’s PC,
cafeteria)

2 - 23© 2011 Pearson Education, Inc. publishing as Prentice Hall
Operations Strategies of Operations Strategies of Two Drug CompaniesTwo Drug Companies
Brand Name Drugs, Inc.Brand Name Drugs, Inc. Generic Drug Corp.Generic Drug Corp.
Competitive Competitive AdvantageAdvantage Product DifferentiationProduct Differentiation Low CostLow Cost
Product Selection and Design
Heavy R&D investment; extensive labs; focus on development in a broad range of drug categories
Low R&D investment; focus on development of generic drugs
Quality Major priority, exceed regulatory requirements
Meets regulatory requirements on a country by country basis
Table 2.2

2 - 24© 2011 Pearson Education, Inc. publishing as Prentice Hall
Issues In Operations StrategyIssues In Operations Strategy Resources view
What the business resources (finance, people, assets) can deliver.
Value Chain analysis Where & how the business adds value leads to
advantage.
Porter’s Five Forces model Power of suppliers, customers,
Competition in industry
Threat of substitutes, new entrants
Constant change E.g. product life cycle.

2 - 25© 2011 Pearson Education, Inc. publishing as Prentice Hall
OM’s Contribution to StrategyOM’s Contribution to Strategy
Product
Quality
Process
Location
Layout
Human resource
Supply chain
Inventory
Scheduling
Maintenance
DIFFERENTIATIONInnovative design … Safeskin’s innovative gloves Broad product line … Fidelity Security’s mutual
funds After-sales service … Caterpillar’s heavy equipment
service Experience … Hard Rock Café’s dining
experience
COST LEADERSHIP Low overhead … Franz-Colruyt’s warehouse-
type stores Effective capacity use … Southwest Airline’s
aircraft utilization Inventory management … Wal Mart’s sophisticated
distribution system
RESPONSE Flexibility … Hewlett-Packard’s response to
volatile world market Reliability … FedEx’s “absolutely,
positively, on time” Quickness … Pizza Hut’s 5-minute guarantee
at lunchtime
Figure 2.4
10 Operations CompetitiveDecisions Approach Example Advantage
Focus(e.g.faster)
Cost leadership(cheaper)
Differentiation(better)

2 - 26© 2011 Pearson Education, Inc. publishing as Prentice Hall

2 - 27© 2011 Pearson Education, Inc. publishing as Prentice Hall
Reasons to GlobalizeReasons to Globalize
Reasons to GlobalizeReasons to Globalize
1. Reduce costs (labour, taxes, tariffs, etc.)2. Improve supply chain3. Provide better goods and services4. Understand markets5. Learn to improve operations6. Attract and retain global talent
Tangible Reasons
Intangible Reasons

2 - 28© 2011 Pearson Education, Inc. publishing as Prentice Hall
Reduce CostsReduce Costs Foreign locations with lower wage rates can
lower costs
Special economic zones http://en.wikipedia.org/wiki/Shenzhen
Free-Trade relationships New Zealand-Hong Kong, China Closer Economic Partnership (2011)
New Zealand-Malaysia Free Trade Agreement (2010)
ASEAN-Australia-New Zealand Free Trade Agreement - 2010
New Zealand-China Free Trade Agreement - 2008
Trans-Pacific Strategic Economic Partnership (P4) - 2005
New Zealand-Thailand Closer Economic Partnership - 2005
New Zealand-Singapore Closer Economic Partnership - 2001
Australia-New Zealand Closer Economic Relationship - 1983

2 - 29© 2011 Pearson Education, Inc. publishing as Prentice Hall
Improve the Supply ChainImprove the Supply Chain Locating facilities closer to centres of
excellence Auto design to California
Athletic shoe production to China
Perfume manufacturing in France
Locating near resources Deep water port ( Whangarei, Napier).
Electricity Supply (Bluff).

2 - 30© 2011 Pearson Education, Inc. publishing as Prentice Hall
Provide Better Goods and ServicesProvide Better Goods and Services
Objective (tangible) features. On-time deliveries
Subjective (intangible) features. Cultural variables
Localised customisation eg packaging and promotions.
Improved customer service Staff language and cultural skills
New market opportunities Being ‘in-the-market’ brings better market intelligence

2 - 31© 2011 Pearson Education, Inc. publishing as Prentice Hall
Learn to Improve OperationsLearn to Improve Operations
Gain expertise from foreign partners General Motors partnered with a
Japanese auto manufacturer to learn new approaches to production and inventory control
Equipment and layout have been improved using Scandinavian ergonomic competence
NZ Uraguay Farm partnership
2 - 32
Issues in Global OperationsIssues in Global Operations
© 2011 Pearson Education, Inc. publishing as Prentice Hall

2 - 33© 2011 Pearson Education, Inc. publishing as Prentice Hall
Cultural and Ethical IssuesCultural and Ethical Issues
Cultural Differences Attitudes can be quite different towards
Punctuality
Lunch breaks
Environment
Intellectual property
Thievery
Bribery
Child labor

2 - 34© 2011 Pearson Education, Inc. publishing as Prentice Hall
P.E.S.T.L.E. AnalysisP.E.S.T.L.E. Analysis
National literacy rate
Rate of innovation
Rate of technology change
Number of skilled workers
Political stability
Product liability laws
Export restrictions
Variations in language
Work ethic
Tax rates
Inflation
Availability of raw materials
Interest rates
Population
Number of miles of highway
Phone system

2 - 35© 2011 Pearson Education, Inc. publishing as Prentice Hall
Four International Four International Operations StrategiesOperations StrategiesC
ost
Red
uct
ion
Co
nsi
der
atio
ns
High
Low
HighLowLocal Responsiveness Considerations
(Quick Response and/or Differentiation)
Standardized product Economies of scale Cross-cultural learning
Examples:Texas InstrumentsCaterpillarOtis Elevator
Global Strategy Transnational Strategy
Move material, people, ideas across national boundaries
Economies of scale Cross-cultural learning
ExamplesCoca-ColaNestlé
International Strategy
Import/export or license existing product
ExamplesU.S. SteelHarley Davidson
Multidomestic Strategy Use existing
domestic model globally Franchise, joint ventures,
subsidiaries
ExamplesHeinz The Body ShopMcDonald’s Hard Rock Cafe
Figure 2.9

2 - 36© 2011 Pearson Education, Inc. publishing as Prentice Hall

2 - 37
Porters Five Forces AnalysisPorters Five Forces Analysis
© 2011 Pearson Education, Inc. publishing as Prentice Hall
Many = goodFew = bad
Many = goodFew = bad
Many = badFew = good
High = goodLow = bad

2 - 38
Porters Value ChainPorters Value Chain
© 2011 Pearson Education, Inc. publishing as Prentice Hall

2 - 39© 2011 Pearson Education, Inc. publishing as Prentice Hall
Product Life CycleProduct Life Cycle
Best period to increase market share
R&D engineering is critical
Practical to change price or quality image
Strengthen niche
Poor time to change image, price, or quality
Competitive costs become criticalDefend market position
Cost control critical
Introduction Growth Maturity Decline
Co
mp
an
y S
tra
teg
y/Is
sue
s
Figure 2.5
Internet search engines
Sales
Drive-through restaurants
CD-ROMs
Analog TVs
iPods
Boeing 787
LCD & plasma TVs
Avatars
Xbox 360
2 - 40© 2011 Pearson Education, Inc. publishing as Prentice Hall
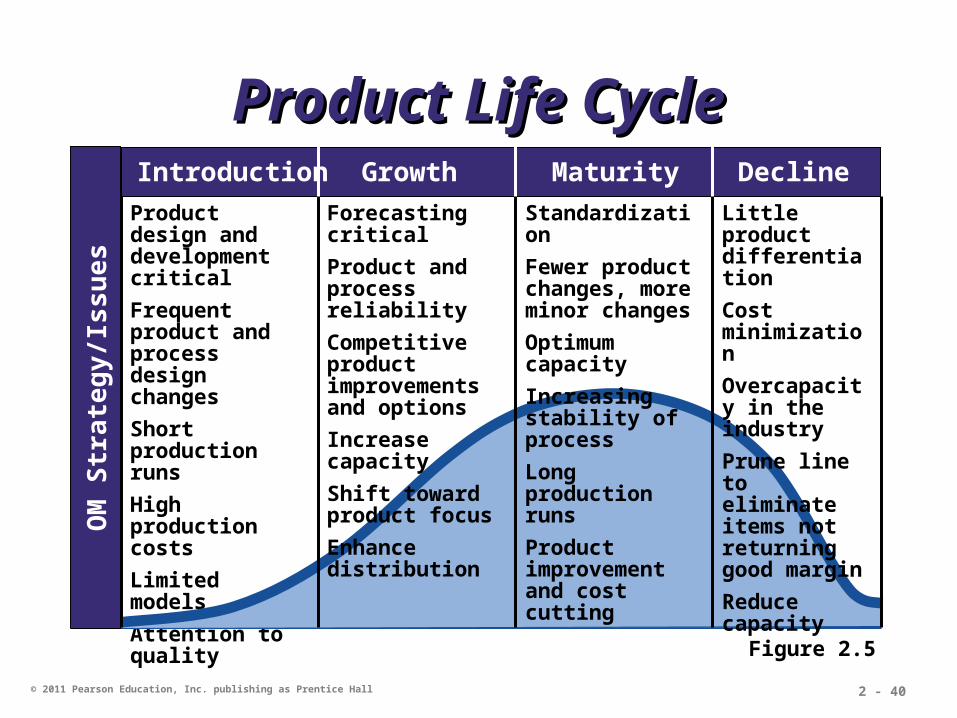
Product Life CycleProduct Life Cycle
Product design and development critical
Frequent product and process design changes
Short production runs
High production costs
Limited models
Attention to quality
Introduction Growth Maturity Decline
OM
Str
ate
gy
/Issu
es
Forecasting critical
Product and process reliability
Competitive product improvements and options
Increase capacity
Shift toward product focus
Enhance distribution
Standardization
Fewer product changes, more minor changes
Optimum capacity
Increasing stability of process
Long production runs
Product improvement and cost cutting
Little product differentiation
Cost minimization
Overcapacity in the industry
Prune line to eliminate items not returning good margin
Reduce capacity
Figure 2.5