1996 - annual reports
TRANSCRIPT

1 9 9 6


Operating revenue
Net income
Net income per share
Dividends declared per share
SCHLUMBERGER IN BRIEF
1996 1995 1994
$8,956,150,000 $7,621,694,000 $6,696,845,000
$ 851,483,000 $ 649,157,000 $ 536,077,000
$3.47 $ 2.69 $2.21
$1.50 $ 1.425 $1.20

LETTER FROM THE CHAIRMAN
he positive oil industry trends noted in the latter
part of 1995 accelerated as 1996 progressed. As a
result, Schlumberger had an excellent year. Net
income of $851 million and earnings per share of
$3.47 were 31 % and 29%, respectively, above 1995levels, while oper
ating revenue grew 18% to $8.96 billion.
Oilfield Services results were outstanding. All areas and services
made contributions to growing the revenue by 26% and increasing
the pretax operating income by 57%. The fact that the worldwide
growth in rig count was only 7.5% highlights the strength of our strat
egy based on new technology focused on oilfield productivity.
Measurement & Systems had a disappointing year. The signifi
cant changes in technology and markets in our metering businesses
and a mid-year hiccup in the semiconductor industry slowed the
growth of the group to 3%, while pretax operating income was
down 18%. The improved results of the last quarter of the year and
the high level of orders for Automatic Test Equipment and Electronic
Transactions suggest that the segment is poised for recovery.
Over the last 12 months, in response to these results and re
inforced by very strong stock markets around the world, the value
of Schlumberger stock has increased by over 65%. What have been
the major factors underlying this strong performance?
The oil business is driven by demand. Over the last ten years
the world demand for oil has risen by an average of 2% per year
despite a severe drop of six million barrels per day in the former
Soviet Union. Major contributors to this demand include the rapidly
expanding economies of Asia and South America, the opening of
Central and Eastern European markets and the strong economic per
formance of the United States. Ten years ago the world had a 20%
2

surplus in production capacity, left over from the massive exploration
and production expenditures of the 1970s. Today, due to economic
growth boosted by low oil prices, the world consumes more than 90%
of the oil it can produce. As a consequence, the industry has turned
its attention toward developing new production which will be viable
even with an oil price of $15 per barrel. The oil companies have real
ized that to reach this level of productivity, they need to be aggressive
in the use of new technology and coopera te more effectively with the
service industry.
Schlumberger has always believed that low oil prices and grow
ing demand would require more technology, not less. Since the end
of the last up cycle, we have focused our research and development
efforts on the fundamental factors affecting oilfield productivity. The
deployment of these new techniques, which have to be customized to
local conditions, requires excellent teamwork between the oil company,
which is responsible for the design of the field development, and the
service company, which will execute it. Service companies are becom
ing involved much earlier in the planning of the project, so that their
ideas can be incorporated into the initial design. Indeed, when current
industry best practices do not provide optimum solutions, these oper
ational alliances between the oil company and the service company
often develop into longer term joint research and development projects.
In addition, financial incentives are being built into service contracts
to help the service companies align their goals with those of the oil
companies. This approach has yielded some impressive improvements
in the productivity of the industry and there are many more to come.
Schlumberger is investing heavily to meet the demand for these new
services. In 1996, we spent more than $1.6 billion in product develop
ment and fixed assets and we expect the figure for 1997 to be higher.
3

With business fundamentals so solid and the industry in such a
buoyant mood, it is easy to forget that progress in the oil industry is
rarely predictable.
First, although the average increase in the demand for oil is
expected to be 2% for at least the next ten years, there will be short
term fluctuations as the strength of the world economy varies. The
delicate balance between supply and demand will ensure that the
upstream oil industry remains highly cyclical even if more flexible
production techniques may make the cycles shorter and less severe.
Second, the history of the oil business has always been, and
will continue to be, heavily influenced by political events capable of
reshaping the industry. What will the next chapter in the politics of
the Middle East bring? How will the political regimes of the former
Soviet Union and China evolve? What will be the outcome of the
world debate on the environment? Not only is the occurrence of such
events unpredictable, but their effect on our industry is difficult to
assess. We need to remain flexible and be prepared to respond quick
ly to the unexpected.
Third, to preserve the new atmosphere of cooperation between
the oil companies and the service sector, which has played a vital role
in the gains of productivity, both sides must have clear and distinct
roles. As a case in point, some major service companies are taking
equity positions in oil and gas production, in direct competition with
the oil companies. If this trend were to develop further, it would be
much more difficult for oil companies and service companies to work
together in full confidence. Schlumberger strongly believes that pro
ductivity gains founded on teamwork will flourish only if the service
companies stick to their service role and avoid any potential conflict
of interest with the oil companies.
And fourth, the triumph of market economies over government
controlled, centrally planned systems will continue only as long as
4

the social costs of the necessary changes are not perceived to be too
high and the international business community handles its new
found freedom responsibly and ethically. Failure of business to do
so will invite a new and stifling wave of government intervention.
As we consider the longer term, the challenges for the service
businesses of Schlumberger are becoming clearer. To take the appro
priate decisions swiftly, our customers need usable information,
delivered in real time, anywhere in the world. In addition, the deliv
ery system has to be fully interactive. This means that the service
companies must provide integra ted solutions all the way from the
field measurement or service to the desktop of the decision maker.
This is as true in the distribution of electricity or gas as it is in the
production of an oil field. We perceive the next decade to be one
where information technology changes, in a fundamental way, how
we and our customers run our businesses.
This new market offers Schlumberger the opportunity to devel
op and deploy an expanding range of services and products that
builds on the strengths of our core businesses. It also promises new
sources of competition as these service networks become big enough
to attract players from other industries. We are convinced, however,
that the depth of our global culture, the strong dedication of our
people to client service, and our steadfast belief in the importance of
new technology, will provide Schlumberger w ith the essential skills
needed to thrive in this highly competitive, global marketplace.
Euan Baird Chairman & Chief Executive Officer january 23, 1997
5

SCHLUMBERGER
;;; ;;;
f I e e
9 .0 900
7.5 750
6.0 600
4.5 450
3.0 300
1.5 150
0 0 92 93 94 95 96 92 93 94 95 96
;;; ;;; & I "' ~ e
3.5 1200
3.0 1000
2.5 800
2.0
600
1.5
400 1.0
0.5 200
0 0 92 93 94 95 96 92 93 94 95 96
D Additions - Depreciation
1 1993 In come and Eamings Per Share before cnn1nlative effect of a change in accouuling priuciple for post ret ire111ent beuefits.
6

SCHLUMBERGER
500
400
300
200
100
0 92 93 94 95 96 92 93 94 95 96
"' I &I
350 6 30%
300 5 25%
250 4 20%
200
3 15%
150
2 10% 100
50 1 5%
0 0 0% 92 93 94 95 96 92 93 94 95 96
- Return on Equity% 1
7

Financial Review

FINANCIAL REVIEW
Management's Discussion and Analysis of Results of Operations The Company has two reportable business industry segments, Oilfield Services and Measurement
& Systems. (S tnterl ;, ,;u;o, s! OILFI ELD SERVICES MEASUREMENT & SYSTEMS
1996 1995 % CHANGE 1996 1995 % CHANGE
Operating revenue $6,129 $ 4,868 26% $2,834 $ 2,759 3% Operating income' $ 986 $ 627 57% $ 124 $ 151 (18%)
10 perntmg mcome represents mcome before mcome taxes, excludmg tnterest expense and mterest and other mcome, and tile unusual itettts pn'Viously amtottttced in tile third quarter of 1996. Explanation of these tttwsua/ itettt s appears on page 26 in tile No tes to Consolidated Fitlmtcial Statements under "Unusual ltettts:·
OILFIELD SERVICES
1996 RESULTS
Operating revenue for Oilfield Services was 26%
above last yea r with strong contributions from all activities. Operating income increased 57%.
North America
In 1996, North American revenue and operating income rose 21% and 111%, respectively, compared to 1995, while rig count increased 10%.
All activities contributed to this growth. Most significantly, GeoQuest revenue increased 52%, w ith Information Technology and Data Management revenue quadrupling. Dowell and Wireline & Testing revenues increased 17% and 13%, respectively.
Geco-Prakla significantly expanded its marine activities to acquire high-quality, nonexclusive seismic data in the Gulf of Mexico. After a five-year absence, Sedco Forex returned to North America with two rigs w1der management contract, the Litffit Pincay in the Gulf of Mexico and the Bill Shoemaker being readied for work offshore Canada in early 1997.
Outside North America
Outside North America, revenue and operating income increased 28% and 51%, respectively, and rig count rose 5%. All regions grew, with significant upswings in the North Sea, Latin
9
America and West Africa . The larges t contributors were Wireline & Testing and Sedco Forex, up 17% and 42%, respective ly. Offshore dayra tes for Sedco Forex increased significantly. Activity for heavy land rigs g rew in the Middle East during the fourth quarter. The trend toward integrated services continued , resulting in the expansion of Integrated Project Management (IPM) operations.
Highlights
The strong 26% grow th of Schlumberger Oilfield Services in 1996 drew from four fac tors:
• growth of the overall market • added value of new technology • client outsourcing and Schlurnberger joint services • new markets.
GROWTH OF THE OVERALL MARKET
l.n 1996, many events impacted the oilfield environment and Schlumberger business. The most significant has been an increase in worldwide oil demand of 2.3% over 1995, to a daily average of 72 million barrels. This has driven up the oi l price from $17 to $24 a ba rrel, a sizable increase of 41%, despite the partia l resumption of Iraqi exports after a six-year absence from the market. In this environment of strong demand and higher oil prices, oil companies increased their exploration and

production expenditure by 15% in 1996.
With its broad portfolio of services, lead ing
technology and g lobal presence, Schlumberger
is uniquely positioned to take full advantage of
this indus try growth. To keep pace w ith mar
ket expansion, Schlumberger boosted capital
expenditures for Oilfield Services by 27%.
Increased ex plora tion and production
activi ty may grea tly impact some prices, as
illu strated by surging dayrates for drilling rigs,
driven by the shrinking supply of offshore
rigs. The average Sedco Forex rig utilization
ra te for 1996 was 78.5% compared to 66% in
the previous yea r. Average offshore rig utiliza
tion increased from 89% to 94%, aided by jack
up utili za tion of 100% and semisubmersible
utiliza tion of 96%. Industry-w ide competitive
offshore rig utilization was 89% compa red to
81% last yeor. At yea r end, the Sed co Forex
flee t consisted of 83 rigs, up from 76 at the end
of 1995, w ith 33 land rigs and 50 offshore rigs,
including fou r offshore units under charter,
plus three lake barges and three semisub
mersibles under management contrac t. The
third-generation semisubmersible Actin ia was
acquired in October. In other business a reas,
prices have been genera lly stable, improving
w here new technology was introduced and
where activity increased significa ntl y, such as
in North America.
ADDED VALUE OF NEW TECHNOLOGY
During the market downturn in the late 1980s,
Schlumberger continued to in vest heavily in
resea rch and engineering. Today the Compa ny
is harves ting the fruits of this com mitment. In
response to client needs, new technology is
successfully being applied to improve recov
ery from existing fields, to lower finding and
producing cos ts for new reservoirs and to
reduce ri sk. Schlumberger affirmed its lead er-
10
shi p in all its Oilfield Services activities in '1996,
and successfully introduced new technologies
and products, among them:
The GeoSteering* tool, w hich enables the
driller to make rapid course corrections w hile
drilling, made subs tantial ga ins in marke ts in
the Far East, w here it contributed to improving
well productivity. The PowerPak* steerable drilling motor,
the PowerPulse* measurements-while-d rilling ,
(MWD) telemetry tool and the CDR* Compen
sa ted Dual Resistivity tool enabled Anadrill to
set a world record of '15,446 fee t drilled in a s in
gle run in an ex tend ed-reach well in Argentina.
Clients recognized benefits in econom ic effi
ciency and reduced environ mental impact.
The SIMPL ER* '10'1 dri lling rig, a new modu
iilf land rig, was introduced in Gabon, where it
began a fi ve-year integra ted services contract
in April. Th is revolutionary rig introdu ces a
major redesign with streamlined fun \tiona li
ties to drill high-qua lity wells at optimum cos t.
It achieves g rea ter efficiency through integra
tion of the various elements of the dri lling
process, requiring fewer rig person nel.
Because it is much smaller than conventional
lil nd rigs, SIMPLER equipment can be quickly
moved to new locations, occupies a smaller
footprint and has the flexibility to reduce non
drilling expenses.
Several Dowell drilling fluid s products, in
cluding QUADRILL *, VISPLEX* and ULTIDR ILL *
fluid s, gained increased accep tance in 1996, in
recognition of their contributions to d rilling
effic iency and well producti vity. Dowell
became the leader in the technica lly cha lleng
ing high-pressure, high-temperature pumping
and cementing markets in the North Seil, Far
East and Gulf of Mexico. This lead ership was
affirmed by the success of the DeepSEA EX PRES*
cementing head, an innovative technology

used for subsea completions. This system
greatly improves the effi ciency of cas ing
cementing operations in d eep water. PLATFORM EXPRESS* services, providing
the industry's most advanced basic form ation
evaluation, and the CMR* Combinable Magnetic
Resonance tool, improve the efficiency of
wireline logging and d eliver critical answers
to difficult formation evaluation problems. Activities of both services increased eightfold
over 1995 levels.
Marine seismi c efficiency continued to
improve due to aggressive deployment of the TRILOGY* onboard data management system
and Monowing* multistreamer towing tech
nology, the most advanced in the industry. Late in the year, the introduction of the fourth
generation NESSIE* marine s treamer, the slimmest in the world with a 54-mm [2.1-inch]
outside diameter, further extended the towing capacity and efficiency of Geco-Prakla vessels.
Efficiency also improved for Land and Transition
Zone seismic, where the Olympus-IMS* land information management system was com
pleted. These improvements, combined with
highly successful geographic positioning of the fleet, better weather offshore and stable prices
per streamer, led to a 32% increase in revenue.
CLIENT OUTSOURCING AND SCHLUMBERGER JOINT SERVICES
The trend among oil companies to refocus on
their core business and outsource noncore
activities plays directly to the technical strength of Schlumberger. Indicative of this continuing
trend, GeoQuest realized its strongest growth in
1996 from Data Management and Information
Technology products and services, as major data management contracts were awarded to
Schlumberger for projects throughout the world.
Because of the increased d emand for integrated solutions in the various phases of the
11
exploration and production process, !PM, the
Schlumberger Integra ted Project Management
group, was formed in 1995. At the end of 1996,
!PM was supervising, on behalf of clients, the
operations of 34 drilling rigs. Having started
mainly with well construction projects, IPM is
now also expanding into production enhance
ment and maintenance. The priority of !PM is
to provide bes t-in-class solutions using an
independent approach that brings together
!PM expertise, including management tools
su ch as the well engineering management sys
tem, with other Schlumberger expertise and
third parties as needed.
Customers are demanding more sophis
tica ted reservoir characteriza tion, more accu
rate reservoir monitoring and grea ter produc
tion performance. By taking advantage of the
synergy of technologies across Schlumberger
oilfield activities, the Company has been able
to meet these new client d ema nds. For exam
ple, the combination of our efforts in direc
tional drilling, in MWD service and in wireline
logging led to a 57% leap in the Schlumberger
logging-while-drilling (LWD) business. Also,
as part of the industry's push toward grea ter
reservoir efficiency and integra tion of services,
Sedco Forex won the management contract
for two lake barges from Lagoven in Lake
Maracaibo, Venezu ela. These two barges were
converted to multipurpose service vessels,
which can each offer the combined inter
vention capabilities of several barges and
boats.
Another crossdisciplinary technology intro
duced worldwide in 1996 was the RAPID*
Reentry and Production Improvement Drilling
service. RAPID technology is the single source
for a complete range of multidisciplinary
services d edicated to improving production
economics through reentry, sidetracking and

extending existing wellbores. The RAPID con
cept was accepted by our clients and activity
increased briskly, led by s trong gains in North America .
Coiled tubing drilling (CTD*) technology is
providing an effective alternative to conven
tional drilling in reentry drilling markets.
Dowell and Sedco Forex joined forces and
expertise in CTD technology, and Anadrill
developed the new VIPER* slimhole directional
bottomhole assembly for coiled tubing service
and introduced it in the North Sea and in
South America. The VIPER system is able to
orient, measure and drill simultaneously,
resulting in improved wellbore efficiency.
Coiled tubing technology also benefited
workover activity. In the fourth quarter,
Dowell and Baker Oil Tools introduced
CoilWORKS* technology, drawing on the
strategic alliance between Schlumberger and
Baker Hughes. The CoilWORKS service is a
seamless answer to workover applications by
which the two companies have combined their
best-in-class technologies to address the grow
ing d emand for economic, total system workover solutions for mature fields.
NEW MARKETS
The world's first commercial 4D seismic service
using a proprietary seabed sensor to compare
3D seismic surveys over time, was successfully
launched with several surveys acquired in the
North Sea. This service d elivers to clients
improved reservoir characteriza tion and mon
itoring over the life of the reservoir and allows
more efficient production management.
Reservoir optimization is a key developing
marke t. To enhance Schlumberger capability
in this field and to improve our expertise in
fluid acquisi tion and analysis, Wireline &
Testing acquired the Aberdeen-based company,
12
Oilphase Sampling Services Limited, a reser
voir fluid sampling company. In order to broaden its software offerings,
GeoQuest acquired The Production Analyst*
and OilField Manager* products. Added to
existing applications, such as the Dowell CADE Office* suite of software and the QLA* Quick
Look Analysis software, these products
allowed GeoQuest to move fully into both
PC- and UNIX'-based production data analysis,
reservoir management applications and sup
port. With the ECLIPSE* reservoir simulation
software, the GeoFrame* integrated reservoi r
characterization system and the Finder* line of
data management products, GeoQuest now
offers the oil industry the most comprehensive
range of integrated software sys tems, data
management solutions and processing and
interpretation services.
Throughout the year, solutions were imple
mented to respond to complex well problem s.
For instance, tracking the flow of different
fluids in h orizontal and high-angle wells
was once nearly impossible. Now, the newly
introduced production logging technology,
PL Flagship* advanced well flow diagnosis ser
vice, can evaluate complex multiphase flow
behavior and diagnose production problems in
horizontal wells.
Building on a solid track record in well
testing, the Wireline & Testing early produc
tion system (EPS) group has expanded signifi
cantly. Modular EPS technology reduces clients' capital investment, improves their cash
flow and lowers risk. It also provides an effi
cient means to improve the economics of mar
ginal fi eld s. Early production systems saw
activity in the North Sea and Africa. An addi
tional unit is being readied for installation in
early 1997.
In Marine seismic, Geco-Prakla continued

to develop its onboard offshore processing services. This premium-rate business is now regularly provided on many deep-sea vessels, reducing d ras ti ca lly the processing turnaround time fo r large-volume surveys.
1995 RESULTS
North America
North American revenue in 1995 rose 3%, and operating income declined 43%, compared to 1994, whi le rig count declined 8%.
During the year, PLATFORM EX PRESS technology, the latest-generation w ireline logging service, was introduced , se tting new standards for efficiency, reliability and answers in the wireline logging industry. By year end, there were 17 PLATFORM EX PRESS units dep loyed in North America.
The erosion of gas prices in 1995 hindered pressure pumpi ng activity. New stimulation techniques, such as the PropNET* fl uid system for hydraulic fracturing, were successfully implemented, helping to improve customers' hydrocarbon recovery.
Seismic activ ities were adverse ly impacted by weather in the Gu lf of Mexico and lower profitability on sales of non-exclusive seismic data. Market and technological leadership in MWD and LWD services con tinued . The ARCS* Array Resistivity Compensated tool was introduced and received wide client acceptance. This tool provides accurate LWD resistivity measurements in sma ll -diameter well bores.
Sales for Software Products rose sharply, driven by demand for geological, petrophysical and seismic interpretation software products. During the year, GeoQuest purchased the Petroleum Division of Intera Information Technologies Corporation, which was renamed Reservoir Technologies.
13
Outside North America
Outsid e North America, revenue and opera ting income increased 16% and 53%, respecti vely, and rig count rose 3%. Acti vity was dri ven predominantly by Latin America, Africa and the North Sea.
Several important rig contrac ts were signed, including integra ted service contracts in Thailand and Gabon and the opportunity to reen ter the Gulf of Mexico after a five-year absence. Demand for Modular Early Production Facilities and sales of the Uni versa l Pressure Platfo rm continued to grow at a rapid rate. Drill ing Fluids services grew substantially in 1995, led by activity in La tin America and the UK sector of the North Sea.
Momentum built in the first three quarters of 1995 in seismic opera tions was offset in the fourth quarter by poor weather in the North Sea and operationa l d ifficul ties in Transition Zone operations. Deployment of Monowing multistreamer towing technology and the TRILOGY data management system conti nued.
Higher activity and improved dri ll ing rig dayrates in both the North Sea a nd West Africa contributed to revenue growth, which was partially offset by a temporary softening in the swamp barge and tender markets and falling demand for semisubmersibles in Southeast Asia .
New IDEAL* Integrated Drilling Eva luation and Logging systems were deployed worldwide, while the PowerPulse MWD telemetry tool continued to set new standards for reliability and durability.
1994 RESULTS
North America
In 1994, revenue and opera ting income in North America rose 19% and 28%, respectively, over 1993, while rig count grew 11 %.

Growth was supported by the continuing
d eployment of the MAXIS 500* Multitask
Acquisition and Imaging System and the suc
cessful introduction of the MAXIS Express*
high-efficiency acquisition system. This innov
a tive sys tem was sp ecifically d esigned to
operate in high-volume and development mar
kets. Coiled tubing services, rig-rela ted activi
ty and increased client acceptance of DESC*
Design and Evalua tion Services for Clients
program combined to offset a slowdown in
fra cturing activity due to softening of natural
gas prices. In Louisiana, the Digiseis-FLX* tran
sition zone telemetric acquisition system was
successfull y introduced. Directional drilling
activity grew with continued implementation
of PowerPak steerable motors and the su c
cessful integration of Grea t Land Directional
Drilling Inc., Alaska's leading direc tional
dri lling company.
Outside North America
Outside North America, revenue and operat
ing income fell 6% and 1%, respectively, and
rig count fell 5%.
The MAXIS 500 acquisition system was
aggressively d eployed worldwide, together
with new imaging technology logging tools.
Activity from recently acquired Drilling Fluids
services contributed positively to results, with
s trong activity in the Far East and Latin
America. In Marine seismic, there was a shift
away from proprietary surveys in favor of
non-exclusive da ta in the Gulf of Mexico and
the North Sea. Fleet upgrading was continued
to expand the number of streamers towed per
vessel. A d ecline in Land and Transition Zone
activity had an adverse impact on results. In
drilling, weak activity in the first two quarters
was offset by higher activity in the second half
of the year. Two semisubmersibles, the Sedco 700
14
and Sedneth 701, underwent life-enhancement
modifications in prepara tion for contracts for
tender-assisted drilling in 1995 . Directiona l
drilling activity was s trong, su pported by
MWD and LWD services. The GeoSteering tool
performed successfull y in the Gulf of Mexico,
the North Sea, Africa and the Far East. Long
term data management contracts were final
ized in Afri ca, Europe, Latin America and the
Middle East to assist oil companies in max i
mizing their computing and da ta resources.
MEASUREMENT & SYSTEMS
1996 RESULTS
Revenue fo r Measurement & Sys te ms
increased 3% from 1995, as significant ga ins in
Electronic Transactions and Systems & Services
offset poorer performance in Electricity & Ga s
Metering. Orders for the yea r were up 2%, led
by Electronic Transactions, Water Management
and Systems & Services.
Measurement & Systems opera ting income
was 18% below 1995 due to a shi ft in the
business environment for Electricity & Gas
Metering in Europe and a temporary d ecline in
the demand for semiconductor tes t equipment,
which affected the Automatic Test Equipment
business.
Metering revenue and orders fell 1% and
3%, respectively. Electricity & Gas Metering revenue was down 5%. European results suf
fered due to lower demand for electricity
meters, particularly in the UK and Germany,
which led to weaker prices. In France, a shift
from electromechanical to lower priced elec
tronic products exacerbated this problem. In
the US, the metering businesses experienced
growth, led by increased worldwide accep
tance of their multifunction and multimeasure
ment products. Sales of gas meters increased,
led by strong demand from the CIS. Water

Management revenue improved 7% supported by a greater worldwide recognition of the need
to conserve water. Systems & Services revenue increased 12%
from 1995. The service businesses grew in Europe, particularly in the UK, where d eregulation h~s enabled us to do work previously handled by the utilities. Meter Communica tion Systems (MCS) grew through increased shipments of radio meter communication devices
to electric utilities. A new business group, Distributed Measurement Solutions (OMS),
was formed to address opportunities crea ted by deregulation of the energy industry. Orders were up 10% from 1995 through increased contractua l activity in France and the UK.
In 1996, Electronic Transactions revenue and ord ers grew 18% and 17%, respectively, from 1995. These results include the impact of the acquisition of a majority interes t in Printer, a Mexican magnetic stripe card manufac turer, and of Germann, a German turnkey gasoline station provid er. Electronic Transactions also acquired Solaic, a French smart card manufacturer, on December 31, 1996. Sales of smart
cards grew 42% from 1995, excluding the effect of business acquisitions. This growth was driven by widening acceptance of memory and microprocessor cards for payphones and cellular phones in China, Italy and the US. The growth accelerated rapidly throughout the year. Electronic Transactions was the principal supplier of electronic cash cards and terminals for the 1996 Olympic Games in Atlanta.
Automatic Test Equipment revenues in 1996 were comparable to 1995. Significantly higher volume of IDSlOOOO* diagnostic systems compensated for reduced demand fo r other products. Orders increased 3% due to a surge in orders for ITS9000* test systems during the last quarter.
15
199S RESULTS
Revenue and orders increased 18% and 21 %, respectively, from 1994 due primarily to acquisitions, favorable currency fluctuations and strong ac tivity in Europe and Asia . O perating income increased 25% from 1994, led by the
metering business and robust growth of Electronic Transactions.
Compared to 1994, revenue and orders from the metering business improved 14% and 17%, respectively, due to the acquisition of AEG's world wide elec tricity metering operations and hea lthy d emand across Europe.
Gains in Elec tricity can be a ttributed to increased d emand for remote reading systems in the US, for electronic meters from EDF, the French national utility, and from telemanagement systems from ENEL, the national utility in Italy. Demand increased for gas products in the CIS and Eastern Europe. Expansion in the UK
was supported by the reorganiza tion of Briti sh Gas and higher demand from municipalities. Wa ter Management continu ed to grow in Western Europe and the US, combined with significant demand in both Eas tern Europe and Asia. During the year, the MAPS* communica tions sys tems were introduced.
In 1995, Systems & Services revenue and ord ers increased 25 %, primarily due to solid growth of service activities in the UK.
Electronic Transactions revenue and ord ers
increased 31% and 36%, respectively. These results include the effects of the acquisition of Malco Plastics and Messerschmidt Apparate in la te 1994 and the acquisition of Danyl in 1995. Cards ac tivity continued to grow due to stronger cellular subscriber demand in Europe
and shipments to China. Telecom benefited from card-based payphone applica tions, with higher shipments to Latin America, the Middle Eas t and France. Retail Petroleum Systems

exhibited growth from equipment and service revenue from North America and Europe, and was further supported by a new service operation in Russia.
Automatic Tes t Equipment revenu e and ord ers were both up 32% from 1994. At Tes t Systems, susta ined growth was spurred by stro ng demand for the ITS9000 fa mily of semicond uctor test sys tems in North America, Europe and Asia. Revenue doubled at Automated Systems, driven by contributions fro m the entire prod uct range.
1994 RESULTS
Revenue and orders decreased ·1% and 2%, respectively, from 1993. Operating income was 34% below the prior yea r.
Compared to 1993, metering revenue was essentially fl a t while orders d ropped 3%. The majority of growth resulted from the acquisition of AEG's European metering operations, with additional support from exports to the Middle Eas t and Europe, and the acquisition of Heliowatt Germany in 1993. For Gas, growth in the UK was severely impacted by significa nt
16
curtailments in the conventional res idential meter replacement program. Improvements in Water Management were driven by the continued strength of the US economy, the economic recovery in France arid Germany, and hea lthy d emand for wa ter meters in Mexico and Argentina.
Systems & Services revenue and ord er:, increased 32% from 1993.
In 1994, Electronic Transactions revenut and orders were up by 9% and 6%, respecti vely. Retail Petroleum Systems revenu increased fo r both equipment and services in most countries; however, lower product price:, resulted in red uced ma rgins. Messerschmidt Appara te and Ma lco Plastics were acqu ired Ia te in the year.
Revenue and orders at Automatic Test Equipment increased 23% and 29%, respectively, with all activities experiencing growth. The 105"10000 sys tem was successfull y lau nched by Diagnostic Systems, and Automated Systems doubled its ac tivity run rate. Acti vity continued to strengthen through the yea r, most notably in Asia.

Net Income
(S taled ;,, willio11s except per share mnowtfs)
Net Jncome
1996 PER
AMOUNT SHARE
$851 $3.47
1995 1994 PER PER
AMOUNT SHARE AMOUNT SHARE
$649 $2.69 $536 $2.21
(n 1996, opera ting income o f the Oilfield
Services segment increased $359 million, or 57%, to $986 mi llion. Growth was d ue to underlying econom ic fac tors, strong demand ~nd the price increases of oil and gas. O ther factors included the success of new and existing services such as PLATFORM EXPRESS and LWD technologies. In addition, the strong contribution of Geco-Prakla, which has returned to profi tability, had a s ignifica nt impact.
Measurement & Systems operating income declined by 18% to $124 mi ll ion because of steep declines a t Automatic Test Equipment
and Electricity & Gas Metering. A temporary weakness in the semicond uctor ind ustry was due to soft market conditions and red uced
capital spending by our customers leading to postponements of product deliveries. Turbu[ence in the electricity metering markets was
due to strong pricing pressures and lower volu mes in the Europea n markets.
In 1995, operating income of the Oilfield Services segment increased $132 million, or 27%, to $627 mi ll ion. Higher activity outside !North America and an improved Geco-Prakla were partially offset by lower results in the United States. The only setback was the deteri ora tion in the results of Geco-Prakla, where opera tional problems in the las t quarter offset " ignificant improvements during the first nine months. Severe wea ther in the Gulf of Mexico 1and West of Shetland in the North Sea region, lower profitability on NEPS sales and losses
17
resu lting from technical and opera tional problems in Tra nsition Zone acti vi ti es were the
major factors. Measurement & Systems operating income increased by 25% to $151 million beca use of s trong g rowth a t Elec troni c Transactions and Automatic Test Equ ipment, and acquisitions.
In '1 994, operating income of the Oilfield
Services segment increased $27 million, or 6%, to $495 mi ll ion. Strong oil field ac tivity in North America and an im proved Geco-Prakla were only pa rtially offset by decl ines in activity outside North America. Measu rement &
Systems operating income d ecl ined 34% to $121 million due mainly to lower results a t Electronic Transactions, Gas Management and
Elec tricity Management. Improvements a t Automatic Test Equ ipment were not sufficient to offset these shortfa lls.
Currency Risks
Re fer to page 24, "Trans la ti on of Non-US Currencies," for a d escription of the Com
pany's policy on currency hedging. There are no materia l unhed ged asse ts, liabiliti es or commitments which are d enominated in other than a business' functional currency.
While changes in exchange ra tes do affect revenu e, especially in the Measu rement &
Systems segmen t, they a lso a ffec t cos ts . Generally spea king, the Company is currencyneutra l. For example, a 5% change in average exchange rates of OECD cu rrencies would have had no material effect on consolida ted revenue and net income.
In general, when the US dollar weakens against other cu rrencies, consolida ted revenue increases with usually no material effect on net income. This is principally beca use the fall
through incremental margin in Measurement & Systems offsets the higher Oilfield Services
non-US dollar denominated expenses. The Company's businesses operate princi
pa lly in US d ollars, most European currencies
and most South America n currencies.
Income Tax Expense
With increasing profitability and strong outlook in the US, the Company recognized 50% of the US income tax benefit related to its US subsidiary's tax loss carryforward and all temporary differences. This resulted in a credit of
$360 million . Refer to page 30, in the Notes to Consolid a ted Financial Statements und er "Income Tax Expense" for more information.
Research & Engineering
Expenditures were as follows:
1996 ---
Oilfield Services $294 Measurement & Systems 158 Other 1
---$453
(Sinl crl iu millio11s)
1995 1994 ---
$ 279 $ 279 148 139
1 1 ---
$428 $419 =========
Interest Expense
Interes t expense d ecreased $10 million in 1996 following a $18 million rise in 1995. The decrease in 1996 was due to lower average ra tes which more than offset higher average debt ou tstanding.
The increase in 1995 was due to an increase in both average debt outs tanding and average rates.
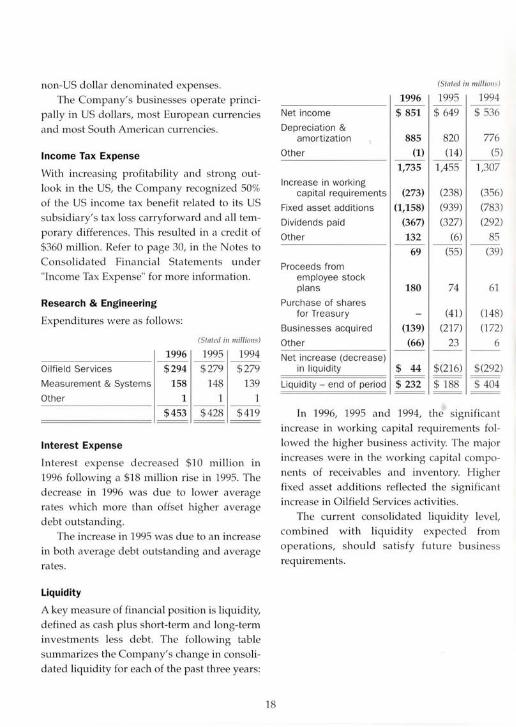
Liquidity
A key measure of financial position is liquidity, defined as cash plus short-term and long-term inves tments less debt. The fo llowing table summarizes the Company's change in consolidated liquidity for each of the pas t three years:
18
(Sta ted in millions)
1996 1995 1994
Net income $ 851 $649 $536
Depreciation & amortization 885 820 776
Other (1) (14) (5)
1,735 1,455 1,307 Increase in working
capita l requirements (273) (238) (356)
Fixed asset additions (1,158) (939) (783)
Dividends paid (367) (327) (292)
Other 132 (6) 85 ---
69 (55) (39)
Proceeds from employee stock plans 180 74 61
Purchase of shares for Treasury (41) (148)
Businesses acquired (139) (217) (172)
Other (66) 23 6 Net increase (decrease)
in liquidity $ 44 $(216) $(292)
Liquidity - end of period $ 232 $ 188 $ 404
In 1996, 1995 and 1994, the significant
increase in working capital requirements followed the higher business activity. The major increases were in the working ca pita l components of receivables and inventory. Higher fixed asset add itions reflected the significant increase in Oilfi eld Services activities.
The current consolidated liquidity level, combin ed with liquidity expected from
opera tions, should sa tisfy future business requirements.

Common Stock, Market Prices and Dividends Declared per Share
Q uarterly high and low prices for th e
Company's Common Stock as reported by The New York Stock Exchange (composite transactions), together with dividends d eclared per share in each quarter of 1996 and 1995 were:
1996
QUARTER S
First
Second
Third
Fourth
1995
QUARTERS
First
Second
Third
Fourth
PRICE RANGE
HIGH ---
$80% 91 %
89 Ys 108 Y.
$ 60 Ys
66% 69 % 70 Y,
LOW ---
$ 65% 80 Ys 79 % 84 Y.
$ SO Ys 58 Ys 61 y.
58%
DIVIDENDS DECLARED
$ 0.375 0.375
0.375 0.375
$ 0.300 0.375 0.375 0.375
The number of holders of record of the Common Stock of the Company a t December 31, 1996, was approximately 22,000. There are no legal restrictions on the payment of divi
dends or ownership or voting of such shares. United States s tockhold ers are not subject to any N etherlands Anti lles withholding or other Netherlands Antilles taxes a ttributable to ownership of such shares.
19
Environmental Matters
The Company and its subsidiaries comply with
government laws and regula tions and responsible management practices for the protection of the environment. The Consolida ted Balance Sheet includ es accruals for the es timated future costs associa ted with certain en vironmental remediation activities rela ted to the past use or disposal of hazardous materials.
Substantially a ll such costs relate to divested opera tions and to facilities or locations that are no longer in opera tion . Due to a number of uncertainties, including uncertainty of timing, the scope of remediation, future technology, regulatory changes and other factors, it is possible that the ultimate remediation costs may
exceed the amounts accrued . However, in the opinion of management, such additional costs are not expected to be material relative to consolidated liquidity, financial position or future results of operations. Consis tent with the
Company's commitment to protection of the en vironm ent, sa fe ty and employee hea lth, additional cos ts, including capital expenditures, a re incurred rela ted to current opera tions.

CONSOLIDATED STATEMENT OF INCOME
(S in/eel iu thousands except per sftnre f/ 11/0IIIIfS)
Year Ended December 31, 1996 1995 1994
Revenue
Operating $8,956,150 $7,621,694 $6,696,845
Interest and other income 69,515 91,536 83,898
9,025,665 7,713,230 6,780,743
Expenses
Cost of goods sold and services 6,835,444 5,804,157 5,107,889
Research & engineering 452,608 427,848 418,871
Marketing 301,304 283,790 251,750
General 355,392 345,441 321,433
Interest 72,020 81,620 63,328
Unusual items 333,091
Taxes on income (175,677) 121,217 81,395
8,174,182 7,064,073 6,244,666
Net Income $ 851,483 $ 649,157 $ 536,077
Net income per share $3.47 $2.69 $ 2.21
Average shares outstand ing 245,021 242,374 243,423
See Notes to Consolidated Financial Statements Schlurnberger Limited (Schlumberger N.V., Incorporated in the Netherlands Antilles) and Subsidiary Cornpanies
20

CONSOLIDATED BALANCE SHEET
ASSETS
December 31,
Current Assets
Cash and short-term investments
Re,ceivables less al lowance for doubtful accounts
(1996 $58,981 ; 1995 $58,246)
Inventories
Deferred taxes on income
Ot~er current assets
Long-Term Investments, held to maturity
Fixed Assets less accumulated depreciation
Excess of Investment Over Net Assets
of Companies Purchased less amorti zation
Deferred Taxes on Income
Other Assets
LIABILITIES AND STOCKHOLDERS' EQUITY
Current Liabilities
Accounts payable and accrued liabi lities
Estimated liability for taxes on income
Bank loans
Dividend payable
Long-term debt due within one year
Long-Term Debt
Postretirement Benefits
Other Liabilities
Stockholders' Equity
Common stock
Income reta ined for use in the business
Treasury stock at cost
Translation adjustment
See Notes to Consolidated Financial Statements
(S lated i11 thousn11ds)
1996 1995
$ 1,358,948 $1,120,533
2,260,091 1,939,873 938,974 782,168 222,456 262,148 181,129
5,042,617 4,023,703 323,717 279,950
3,358,581 3,11 8,458
1,225,335 1,330,490 203,983 170,818 157,499
$10,325,051 $8,910,100
$ 2,200,161 $ 1,773,605 367,562 299,841 743,018 515,703
92,842 91,706 70,827 83,417
3,474,410 2,764,272 637,203 613,404 383,129 354,830 203,929 213,577
4,698,671 3,946,083
818,803 737,328 7,137,744 6,654,072
(2,315,946) (2,414,577) (14,221) (12,806)
5,626,380 4,964,017
$10,325,051 $8,910,100
Schlwnberger Limited (Schlumberger N.V., Incorporated in the Netherlands Antilles) and Subsidiary Companies
21

CONSOLIDATED STATEMENT OF CASH FLOWS
(S tated i11 thou sa11ds)
Year Ended December 31, 1996 1995 1994
Cash fl ows from operating activities :
Net income $ 851,483 $649,157 $536,077
Adjustments to reconci le net income to net cash provided by operating activities:
Depreciation and amort ization 885,198 820,196 776,167
Earnings of companies carried at equity, less dividends received (1996 $1,911; 1995 $1,000; 1994 $5,377) 5,212 (3,791) (1,621)
Provision for losses on accounts receivable 27,036 20,306 23,039
Other adjustments (4,613) (3,562) (3,574)
Change in operating assets and liabi lities:
Increase in receivables (319,448) (1 36,312) (182,989)
Increase in inventori es (144,774) (99,334) (37,444)
Increase in deferred taxes (26,226)
Increase (decrease) in accounts payable and accrued liabilit ies 161,463 (9,243) (77,412)
Increase (decrease) in estimated liability for taxes on income 39,851 (3,684) (73,801)
Other - net (73,044) (39,389) (15,379)
NET CASH PROVIDED BY OPERATING ACTIVITIES 1,402,138 1,194,344 943,063
Cash flows from investing activities :
Purchases of fixed assets (1,157,957) (938,847) (782,837)
Sales/ retirements of fixed assets 98,584 26,936 105,240
Payment for purchase of businesses (115,262) (200,805) (171,631)
(Increase) decrease in investments (218,914) 129,165 50,230
Decrease (increase) in other assets 1,050 42,496 (88)
NET CASH USED IN INVESTING ACTIVITIES (1,392,499) (941,055) (799,086)
Cash flows from financi ng activities:
Dividends paid (366,791) (327,189) (292,368)
Proceeds from employee stock purchase plan 38,807 36,159 36,183 Proceeds from exercise of stock options 141,299 37,518 25,145 Purchase of shares for Treasury (40,552) (148,089)
Proceeds from issuance of long-term debt 195,009 486,518 143,889 Payments of pri ncipa l on long-term debt (165,742) (287,455) (176,420)
Net increase (decrease) in short-term debt 212,523 (143,444) 261,616
NET CASH PROVIDED BY (USED IN) FINANCING ACTIVITIES 55,105 (238,445) (150,044)
Net increase (decrease) in cash 64,744 14,844 (6,067)
Cash , beginning of year 72,515 57,671 63,738
CASH, END OF YEAR $ 137,259 $ 72,515 $ 57,671
See Notes to Consolidated Financial Statements Schlwnberger Lilnited (Sch lmnberger N.V., Incorporated in the Netherlands Antilles) and Subsidiary Corupanies
22

CONSOLIDATED STATEMENT OF STOCKHOLDERS' EQUITY (Dollar amounts i11 thousm1ds)
COMMON STOCK INCOME
ISSUED IN TREASURY RETAINED FOR
TRANSLATION USE IN SHARES AMOUNT SHARES AMOUNT ADJUSTMENT THE BUSINESS
Balance, January 1, 1994 306,667,168 $660,129 63,11 8,111 $2,283,743 $ (76,507) $6,106,461
Translation adjustment 19,403
Sa les to opt ionees less shares exchanged (366) (702,621) (25,511)
Purchases for Treasury 2,754,000 148,089
Employee stock purchase pl an 734,284 36,183
Net income 536,077 Dividends dec lared
($1.20 per share) (292,105)
Balance, December 31, 1994 307,401 ,452 695,946 65,169,490 2,406,321 (57,104) 6,350,433
Translation adjustment 44,298
Sales to optionees less sha res exchanged 5,223 (871,330) (32,296)
Purchases for Treasury 690,000 40,552
Employee stock purchase plan 724,794 36,159
Net income 649,157
Dividends declared ($1.425 per share) (345,518)
Balance, December 31, 1995 308,126,246 737,328 64,988,160 2,414,577 (12,806) 6,654,072 Translation
adjustment (1,415)
Sales to optionees less shares exchanged 42,668 (2,657,348) (98,631)
Pu rchases for Treasury
Employee stock pu rchase plan 741,747 38,807
Net income 851,483 Dividends declared
($1.50 per share) (367,811)
Balance , December 31, 1996 308,867,993 $818,803 62,330,812 $ 2,315,946 $ (14,221 ) $7,137,744
See Notes to Consolidated Financial Staternents Schlnmberger Limited (Schlumberger N. V, Incorporated in the Netherlands Antilles) and Subs idiary Cornpanies
23

NOTES TO CONSOLIDATED FINANCIAL STATEMENTS
Summary of Accounting Policies
The Consolidated Financial Statements of Schlumberger Limited and its subsidiaries have been prepared in accordance with accounting principles generally accepted in the United States.
PRINCIPLES OF CONSOLIDATION
The Consolidated Financial Sta tements includ e the accounts of majority-owned subsidiaries. Significant 20% - 50% owned companies are
ca rried on the equity method and classified in Other Assets. The Company's pro rata share of after-tax earnings is included in Interest and other income. Equity in undis tributed earnings of all 50% owned companies at December 31, 1996, was not material.
USE OF ESTIMATES
The preparation of financial sta tements in con
formity with generally accepted accounting principles requires management to make esti
mates and assumptions that affect the reported amounts of assets and liabi lities, disclosure of
contingent assets and liabilities a t the date of the financial s tatements and the repor ted amounts of revenues and expenses during the reporting period. While actua l results could differ from these es tima tes, management believes that the es timates are reasonable.
REVENUE RECOGNITION
Genera ll y, revenue is recognized after services are rendered and products are shipped.
TRANSLATION OF NON-US CURRENCIES
AU assets and liabilities recorded in functional currencies other than US dollars are transla ted
at current exchange rates. The resulting adjustments are charged or credited d irectly to the Stockholders' Equity section of the Consolidated Balance Sheet. Revenue and expenses are
24
translated at the weighted average exchange ra tes for the period. All rea lized and unrea lized transaction gains and losses are includ ed in income in the period in which they occur. Included in the 1996 results were transaction
gains of $10 million, compared to a loss of $2
million and a gain of $2 million in 1995 and 1994, respectively.
Currency exchange contracts are entered into as a hedge against the effect of future settlement of assets and liabilities denominated in other than the func tional currency of the individual businesses. Gains or losses on the con
tracts are recognized when the currency exchange rates flu ctuate, and the resulting
charge or credit offsets the unrealized currency ga ins or losses on those assets and liabi lities. At December 31, 1996, contracts were outstand ing to purchase the US d ollar equivalent of $103
million in va rious foreign currencies and to sell the equivalent of $62 million at forward ra tes on the dates the contracts were entered. These contracts mature on va rious dates in 1997.
INVESTMENTS
The Consolidated Balance Sheet reflects t11e
Company's inves tment portfolio separated between current and long-term based on matu
rity. Except for $111 million of investments which are considered trading at December 31,
1996 (1995 $104 million), it is the Company's intent to hold the investments until maturity.
Both short-term and long-term investments held to maturity are stated at cost plus accrued interest, w hich approximates market, and comprise primarily Eurodollar time deposits, certifica tes of deposit and commercial paper, Euronotes and Eurobonds, substantially a ll denominated in US dollars. Substantially a ll the investments designated as held to maturity that were purchased and sold during the year had

original maturities of less than three months. Short-term inves tments that are designated as trading are stated at market. The unrealized holding gain on such securities was not significant.
Longcterm investments mature in 1998 $78 million, in 1999 $92 million and $154 million therea fter.
For purposes of the Consolidated Statement of •Cash Flows, the Company does not consider short-term investments to be cash equiva lents as they genera lly have original maturities in excess of three months. Shortterm investments at December 31, 1996 and 1995, were $1.2 billion and $1.0 billion, respectively.
INVENTORIES
Inventories are s tated principally at average or standard cost, which approximates average cos t, or at market, if lower. Inventory consists primarily of materials and supplies.
EXCESS OF INVESTMENT OVER NET ASSETS OF COMPANIES PURCHASED
Cost in excess of net assets of purchased companies is amortized on a straight-line basis over periods ranging from 7 to 40 years. Accumulated amortiza tion was $287 million and $278 million at December 31, 1996 and 1995, respectively.
FIXED ASSETS AND DEPRECIATION
Fixed assets are stated at cost less accumula ted depreciation, which is provided for by charges to income over the es timated useful li ves of the assets by the straight-line method. Fixed assets includ e the manufacturing cost (average cos t) of oilfield technical equipment manufactured by subsidiaries of the Company. Expenditures fo r renewals, replacements and betterments are capitalized . Ma intenance and repairs are charged to opera ting expenses as incurred . Upon sa le or other disposi tion, the applicable
25
amounts of asset cost and accumulated depreciation are removed from the accounts and the net amount, less proceeds from disposal, is charged or credited to income.
TAXES ON INCOME
The Company and its subsidiaries compute taxes on income in accordance with the tax rules and regulations of the many taxing authorities where the income is earned . The income tax rates imposed by these taxing authorities vary substantially. Taxable income may differ from pretax income for financial accounting purposes. To the extent that differences are d ue to revenue or expense items reported in one period for tax purposes and in another period for fin ancial accounting purposes, an appropria te provision for deferred income taxes is made.
Approximately $2.5 billion of consolidated income retained for use in the business at December 31, 1996, represented undistributed earnings of consolidated subsidiaries and the Company's pro rata share of 20% -50% owned companies. No provision is made for deferred income taxes on those earnings considered to be indefinitely reinves ted or earnings that would not be taxed when remitted .
Tax credits and other allowances are credited to current income tax expense on the flowthrough method of accounting.
NET INCOME PER SHARE
Net income per share is computed by dividing net income by the average number of common shares outstanding during the yea r. The effect of common stock equiva lents on the computation of earn ings per share was not significant.
RESEARCH & ENGINEERING
All research and engineering expenditures are expensed as incurred, including costs rela ting

to patents or rights that may result from such ex penditures.
Unusual Items
The Company announced a charge of $300 million after tax in the third quarter rela ted
primarily to the Electricity & Gas and GecoPrakla Land and Transition Zone businesses.
During the quarter, the Electricity and Gas Management product lines were combined into a single business in response to the huge market and technology changes occurring in the energy supply sector. This combination will result in lower headcount and fewer manufacturing facilities and products. At Geco-Prakla, the Land and Transition Zone businesses have improved , however, they are still in a loss position and accordingly, require radical changes in organiza tion and structure, and the write-off of Land good will . The after-tax charge of $300 million includes pre- tax charges of $112 mil lion for severance and termination costs, o ther
facilities' closure cos ts of $39 million, good will write-offs of $122 million, and other asset impairments/charges of $60 million .
The severance and termination costs rela te to less than 5% of the worldw ide workforce primarily in Europe a nd pertain to both manufac turing and operating personnel in about 30 locations. Most of the o ther facilities' closure cos ts rela te to the w rite-d own of build ings, equipment and other asse ts to net realizable value.
In addition, the Company recorded a charge of $58 million a fter tax, including a loss on the divestiture of the remaining defenserelated activity, certain asset impairments and other charges. The amount is classified in cost of goods sold and services ($47 million) and taxes on income ($11 million).
As of December 31, 1996, $12 million of the
26
severance and termination had been spent. The remainder should be spent within the next 18 months.
Acquisitions
During 1996, subsidiaries of the Compa ny acquired Solaic, SA (on December 31, 1996), a magnetic and smart card manufacturer; an 80% interest in Prin ter, a magnetic stripe ca rd manufacturer; Oil phase Sampling Services Ltd ., a reservoir fluid sa mpling company; The Production Analys t* and OilField Manager* software products from OGCI Software, Inc.;
Germann, a turnkey gasoline sta tion provider; Gw§ant, a gas d ispenser service company; and a 33% equity in terest in DAP Technologies Limited , a developer and manufac turer of rugged handheld computer products. The purchase prices were $75 million, $9 million, $7 million, $8 million, $8 million, $7 million and $4 million, respectively. These acquisitions were accounted fo r as purchases. Costs in excess of net assets acquired were $91 million which are being amortized on a stra ight-line basis over periods between 7 and 25 years.
During 1995, su bsid iaries of the Company acquired a furth er 40% interest in CGST Save, a French gas meter service company; the remaining 40% interes t in J.B. Rombach, a German metering business; G.S.I. Saudi Arabia Ltd. , a land seismic company; the Petroleum Division of Intera Information Technologies Corporation, a reservoir simulation software company; and Danyl Inc., a point-of-sale terminal manufacturer. The purchase prices were $71 million, $42 million, $15 million, $59 million and $12 million, respectively. These acquisitions were accounted for as purchases. Costs in excess of net assets acquired were $167 million which are being amortized on a s traigh t-line basis over periods between 15 and 25 years.

Fixed Assets
A summary of fixed asse ts follows:
(Sta ted i11 millio11s)
December 31 , 1996 1995
La nd $ 71 $ 78
Buildings & improvements 1,040 1,027
Machinery and equi pment 8,467 8,003
Total cost 9,578 9,108
Less accumu lated depreciation 6,219 5,990
$3,359 $3,118
Es tima ted useful lives of Buildings &
improvements range from 5 to 50 years and of Machinery and equipment from 2 to 25 years.
Long-Term Debt
A summary of long-term debt by currency fo llows:
(Stated i11 miffio11s)
December 31 , 1996 1995
US dollar $ 195 $ 110
German mark 185 165 UK pound 137 192 Japanese yen 101 113
Other 19 33
$ 637 $ 613
Long- term debt is at va riable rates; substantially all of the debt is at rates up to 7%.
Such rates are reset every six months or sooner. Accordingly, the ca rrying value of long-term debt at December 31, 1996, approximates the aggrega te fair value.
Long-term debt at December 31, 1996, is due $208 million in 1998, $33 million in 1999,
$190 million in 2000, $101 million in 2001 and $105 million thereafter.
At December 31, 1996, there were no inter-
27
est rate swap arrangements outstanding. At times, interes t rate swa p arrangements are entered into to adjust non-US dollar denominated debt and interest rates into US dollars. Interest rate swap arrangements had no impact in 1996 and an immaterial effect on consolidated interest expense in 1995. The exposure in the event of nonperformance by the other parties to the arrangements is not signi fica nt.
Lines of Credit
At December 31,1996, the Company's principal US subsidiary had a n ava il able unused Revolving Credit Agreement with a group of banks. The Agreement provided that the subsid iary may borrow up to $500 million until December 1998 at money market-based rates. ln addition, at December 31, 1996, the Company and its subsidiaries had ava ilable unused lines of credit of approxima tely $626 million.
Capital Stock
The Company is authorized to issue 500,000,000
shares of Common Stock, par va lue $0.01 per share, of which 246,537,181 and 243,138,086
shares were outstanding on December 31, 1996
and 1995, respectively. The Company is also authorized to issue 200,000,000 shares of cumulative Preferred Stock, par value $0.01 per share, which may be issued in series with terms and conditions determined by the Boa rd of Directors. No shares of Preferred Stock have been issued. Holders of Common Stock and Preferred Stock are entitled to one vote for each share of stock held.
In January 1993, Schlumberger acquired the remaining 50% interes t in the Dowell Schlumberger group of companies. The purchase price included a warrant, expiring in 7.5
years and valued at $100 million, to purchase 7.5 million shares of Schlumberger Limited

Common Stock at an exercise price of $59.95 per share. The warrant is fully vested and nontransferable.
Stock Compensation Plans
As of December 31, 1996, the Company has two types of stock-based compensation plans, which are described below. The Company applies APB Opinion 25 and related Interpretations in accounting for its plans. Accordingly, no compensa tion cost has been recognized for its stock option plans and its stock purchase p lan. Had compensation cost for the Company's s tock-based plans been determined based on the fair value at the grant dates for awards under those plans, consistent with the method of FASB Statement 123, the Company's net income and earnings per share would have been the pro forma amounts indicated below:
(Stal ed i11 milfious except per share nmouuts)
1996 1995
Net Income
As reported $ 851 $ 649 Pro forma $ 809 $ 641
Earnings per share
As reported $3.47 $2.69 Pro forma $3.30 $2.65
As required by FASB Statement 123, the above pro forma data reflec ts the effec t of stock option grants and the employee stock purchase plan during 1996 and 1995.
28
STOCK OPTION PLANS
During 1996, 1995 and in prior years, officers and key employees were granted stock options und er the Company's s tock option plans. The .exercise price of each option equals the market price of the Company's stock on the date of grant, an option's maximum term is ten years, and options genera lly vest in 20% increments over five years.
As required by FASB Statement 123, the fair va lue of each grant is estimated on the date of grant using the mu ltip le option Black-Scholes option-pricing model with the following weighted-average assumptions used for 1996 and 1995: dividend yield of 1.5%; expected volatility of 20%; risk-free interest ra tes for 1996 grants of 5.38% - 6.36% for officers and 5.09% - 6.01 o/o for all o ther employees; risk-free interest ra tes for 1995 grants of 5.85% - 7.88% for officers and 5.70% - 7.66% for all other employees; and expected option li ves of 5.50 yea rs for officers and 2.39 yea rs for other employees. The weighted-average fair va lue of options granted during 1996 and 1995 is $21.07 and $17.40, respectively.

A summary of the status of the Com pany's
stock option plans as of December 31, 1996 and
19~,5. and changes d uring the yea rs end ing on
those d a tes is presented below:
NUMBER WEIGHTED AVERAGE OF SHARES EXERCISE PRICE
Outstanding Jan. 1 , 1995 11,560,849 $56 Granted 753,700 $62 Exercised (897,919) $44 Lapsed or
cance ll ed (346,150) $61
Outstanding Dec. 31, 1995 11 ,070,480 $58 Granted 4,131,000 $79 Exerc ised (2,758,242) $54 Lapsed or
cancelled (244,840) $64
Outstand ing Dec. 31, 1996 12,198,398 $65
Exercisable at Dec. 31 , 1995 6,259,270 Dec. 31, 1996 4,963,908
Ava il ab le for grant Dec. 31, 1995 9,444,095 Dec. 31, 1996 5,557,935
29
The following table sum marizes information
concerning cu rrently ou ts tanding and exercis
able options by two ra nges of exercise prices:
Range of exercise prices $29.250 - $64.500
Number outstanding at 12/31/96 7,343,448
Weighted ave rage remain ing contractual life 5.93
Weighted average exercise price $58
Number exercisable at 12/31/96 4,494,418
Weighted ave rage exercise price $58
Range of exercise prices $64.813- $93.625
Number outstanding at 12/31/ 96 4,854,950
Weighted average remaining contractual life 8.83
Weighted average exercise price $77
Number exercisable at 12/31/ 96 469,490
Weighted ave rage exercise price $59
EMPLOYEE STOCK PURCHASE PLAN
Under the Schlu mberger Discoun ted Stock
Purchase Plan, the Com pany is au thorized to
issue up to 8,000,000 shares of Common Stock
to its em ployees. Under the terms of the Plan,
emp loyees can choose each year to have up to
10% of their annual earni ngs withheld to pur
chase the Com pany's Common Stock. The p ur
chase price of the s tock is 85% of the lower of
its beginning or end of the plan yea r market
price. Under the Plan, the Company sold
741,747 shares and 724,794 shares to employ
ees in 1996 and 1995, respectively. Comp en
sa tion cost has been com pu ted for the fa ir
value of the employees' purchase rights, which
was estimated using the Black-Scholes model with the following assumptions for 1996 and
1995: dividend yield of 1.5%; expected life of one year; expected vola tility of 20%; and riskfree interest ra tes of 5.71% for 1996 and 5.61% for 1995. The weighted-average fa ir va lue of those purchase rights granted in 1996 and 1995 is $19.45 and $14.42, respectively.
Income Tax Expense
With increasing profitability and strong outlook in the US, in the third quarter of 1996 the
Company recognized 50% of the US income tax benefit related to its US subsidiary's tax loss carryforward and all temporary differences. This resulted in a credit of $360 million.
The Company and its subsidiaries operate in over 100 taxing jurisdictions.
At December 31, 1996, the US deferred tax asset was $381 million and the valuation allowance was $53 million .
The Company's US consolidated group has a net operating loss carryforward at December 31, 1996, of $293 million and net deductible
temporary differences were $782 million. Significant temporary differences pertain to pos tre tirement medical benefits and fixed assets. Most of the tax loss carryforward will expire in the years 2002- 2003.
The normal recurring provision for income taxes in 1996 was $206 million; effective tax ra te was 20%. In 1995 and 1994, the effective tax rates were 16% and 13%, respectively. The effect of the US operating loss carryforward was a significant reconciling item between the US sta tutory fed eral tax ra te (35%) and the Company's effective tax rate in each year.
The Company's provision for d eferred taxes (excluding the effec t of the unusual items) was less than $5 million in each of the
30
three years in the period ended December 31,
1996. The remaining component of income tax expense was the current provision in each year.
Leases and Lease Commitments
Total rental expense was $232 million in 1996, $206 million in 1995 and $192 million in 1994. Future minimum rental commitments und er
no nca ncelable leases for yea rs endin g December 31 are: 1997 $90 million; 1998 $72 million; 1999 $58 million; 2000 $40 million; and 2001 $30 million. For the ensuing three fi ve-year periods, these commitments decrease from $35 million to $3 million. The minimum rentals over the remaining terms of the leases aggrega te $25 million .
Contingencies
The Company and its subsidiaries comply
with government laws and regula tions and responsible management practices for the protection of the environment. The Consolida ted Balance Sheet includes accruals for the estimated future costs associated with certain environmental remedia tion acti vities related to the past use or disposal of haza rdous materials. Substantially all such cos ts rela te to d ivested operations and to facilities or locations that are no longer in opera tion. Due to a number of uncertainties, including uncerta in
ty of timing, the scope of remed ia tion, future technology, regulatory changes and other factors, it is possible that the ultimate remediation costs may exceed the amounts accrued. However, in the opinion of management, such additional costs are not expected to be material relative to consolidated liquidity, financial position or future results of operations.
In a case in Texas involving the validity of a 1988 se ttlement and release in connection

with an incidental business venture, the trial court, in 1993, rendered a judgment notwithstanding the verdict of the jury, exonerating Schlumberger from any liability. In late 1994, a
Texas Court of Appeals reversed the trial court judgment and reinsta ted the jury award of about $75 million against Schlumberger. The Texas Supreme Court granted the Schlumberger motion to hear the case. Oral argument was held before the Texas Supreme Court on
October 11, 1995. Schlumberger and outside counsel believe the decision of the trial court was correct. Consequently, no provision has been mad e in the Consolidated Financial Statements for this matter.
In May 1996, in a case involving a $3-million contract dispute, the trial court in
Johnson County, Texas, entered judgment on jury findings adverse to Schlumberger for $23 million in damages, which has been doubled ,
plus attorneys' fees and interest. The Company and its outsid e counsel believe the findings and the judgment are not supported by the evidence and law, and have filed an appeal. Accordingly, no provision has been made in the accompanying financial sta tements for this matter.
In addition, the Company and its subsidiaries are party to various other legal proceedings. Although the ultimate disposition of
these proceedings is not presently determinable, in the opinion of the Company any liability that might ensue would not be material in relation to the Consolidated Financial Statements.
Segment Information
The Company's business comprises three segments: Oilfield Services, Measurement &
Systems and Omnes. Services and products are
described in more detail on pages 64-65 in this
31
report. Oilfield Services and Measurement &
Systems are reportable segments. Financial information for the years ended
December 31, 1996, 1995 and 1994, by industry
segment and by geographic area is as follows:

(Staled in millious) OILFIELD MEASUREMENT ADJUST. CON SOL-
SERVICES & SYSTEMS & ELIM. I DATED
INDUSTRY SEGMENT 1996 Operating revenue
Customers $6,129 $2,827 $ - $ 8,956 Inter-segment transfers - 7 (7)
$6,129 $ 2,834 $ (7) $ 8,956 Operating income $ 986 $ 124 $(52) $ 1,058 Interest expense (72) Interest and other income 70 Unusual items (380) Income before taxes $ 676
Depreciation expense $ 700 $ 111 $ 8 $ 819 Fixed asset additions $ 1,018 $ 131 $ 9 $ 1,158 At December 31
Identifiable assets $5,961 $2,518 $(41) $ 8,438 Corporate assets 1,887 Total assets $10,325
INDUSTRY SEGMENT 1995 Operating revenue
Customers $4,867 $ 2,755 $ - $ 7,622 Inter-segment transfers 1 4 (5)
$4,868 $2,759 $ (5) $ 7,622
Operating income $ 627 $ 151 $(1 7) $ 761 Interest expense (82) Interest and other income less other charges - $1 91 Income before taxes $ 770 Depreciation expense $ 650 $ 104 $ 6 $ 760 Fixed asset add itions $ 800 $ 122 $ 17 $ 939 At December 31
Identifi able assets $5,192 $2,213 $(29) $ 7,376 Corporate assets 1,534 Total assets $ 8,910
INDUSTRY SEGMENT 1994 Operating revenue
Customers $4,362 $2,335 $ - $ 6,697 Inter-segment transfers 3 4 (7)
$4,365 $ 2,339 $ (7) $ 6,697 Operating income $ 495 $ 121 $(23) $ 593 Interest expense (63) Interest and other income plus other credits- $3 87 Income before taxes $ 617 Depreciation expense $ 625 $ 92 $ 5 $ 722 Fi xed asset additions $ 661 $ 91 $ 31 $ 783 At December 31
Identifi ab le assets $ 4,766 $ 1,936 $(14) $ 6,688 Corporate assets 1,634 Total assets $ 8,322
32

Transfers between segments and geographic areas are for the most part made at regular prices ava ilable to unaffilia ted customers. Certain Oilfield Services segment fixed assets are manufactured within that segment.
During the years ended December 31, 1996, 1995 and 1994, neither sales to any government nor sales to any single customer exceeded 10% of consolidated operating revenue.
Corporate assets largely comprise shortterm and long-term investments.
ne IIIII/I tollS WESTERN HEMISPHERE EASTERN HEMISPH ERE
(511 d. "II" )
ADJUST. CONSOL-us OTHER EUROPE OTHER & ELIM. I DATED
GEOGRAPHIC AREA 1996 Operating revenue
Customers $2,103 $ 1,150 $3,065 $2,638 $ - $ 8,956 Inter-area t ransfers 443 7 169 35 (654) -
$2,546 $1,157 $3,234 $2,673 $ (654) $ 8,956 Operating income $ 195 $ 166 $ 243 $ 546 $ (92) $ 1,058 Interest expense (72) Interest and other income 70 Unusual items (380) Income before taxes $ 676 At December 31
Ident ifi ab le assets $2,249 $ 885 $3,300 $2,069 $ (65) $ 8,438 Corporate assets 1,887 Total assets $10,325
GEOGRAPHIC AREA 1995 Operating revenue
Customers $1,826 $ 905 $2,779 $ 2,112 $ - $ 7,622 Inter-area t ransfers 358 17 149 30 (554) -
$2,184 $ 922 $2,928 $2,142 $ (554) $ 7,622 Operating income $ 130 $ 135 $ 170 $ 367 $ (41) $ 761 Interest expense (82) Interest and other income
less other charges - $1 91 Income before taxes $ 770 At December 31
Identi f iable assets $1,748 $ 720 $2,894 $2,025 $ (11) $ 7,376 Corporate assets 1,534 Total assets $ 8,910
GEOGRAPHIC AREA 1 994 Operat ing revenue
Customers $ 1,650 $ 749 $2,299 $1,999 $ - $ 6,697 Inter-area transfers 251 10 140 30 (431) -
$1,901 $ 759 $2,439 $2,029 $ (431) $ 6,697 Operating income $ 177 $ 106 $ 49 $ 304 $ (43) $ 593 Interest expense (63) Interest and other income
plus other credits- $3 87 Income before taxes $ 617 At December 31
Identifiable assets $1,660 $ 620 $2,387 $2,210 $ (189) $ 6,688 Corporate assets 1,634 Total assets $ 8,322
33

Pension and Other Benefit Plans
US PENSION PLANS
The Company and its US subs idiary sponsor
several defined benefit pension plans that cover
substa ntia lly a ll employees. The benefits are
based on years of service and compensa tion on a
ca reer-average pay basis . These plans are sub
stantia lly fu lly fund ed wi th a trustee in respect
to past and current service. Charges to expense
are based upon costs computed by independent
actuaries. The funding policy is to contribute
annually amounts tha t are a llowable for federa l
income tax purposes. These contributions are
intended to provide for benefits earned to date
and those expected to be earned in the future.
The assumed discount rate, compensa tion
increases and return on plan assets used to
d etermine pension expense in all yea rs w ere
7.5%, 4.5% and 8.5%, respectively. Net pension cos t in the US for 1996, 1995
and 1994, includ ed the fo llowing components:
(Stated in millions)
1996 1995 1994
Service cost -benefits earned during the period $27 $26 $25
Interest cost on projected benefit obligat ion 50 46 44
Expected retu rn on plan assets (actual return: 1996 $94; 1995 $137; 1994 $3) (52) (47) (46)
Amortization of t rans it ion asset (2) (2) (2)
Amortization of prior service cost/ othe r 4 4 6
-- - -Net pension cost $27 $27 $27
Effective January 1, 1996, the Company and
its subsidiaries amended their pension plans to
improve retirement bene fits for current
employees. The fund ed status at December 31,
1995, reflects the amendment.
34
The funded sta tus of the p lans a t December
31, 1996 and 1995, was as follows:
(Stated ill millions)
1996 1995 ------------------- ---- ----Actuarial present value
of obligations:
$639 $615 Vested benefit ob li gat ion =========== ----- -----
$641 $617 Acc umulated benefit
ob ligation ==~====== ----- -----
Projected benefit obligation $700 $675
Plan assets at market va lue 771 698 -------------------------------Excess of assets over projected
benefit obligation
Unrecogni zed net ga in
Unrecogni zed prior service cost
Unrecogni zed net asset
71 (155)
34
23 (96)
39
at transition date (7) (9) -------------------------------Pension liab ility $ (57) $ (43) ===~===== - - --
Assumed discount rate and ra te of com
pensa tion increases u sed to determine the
projected benefit obliga tions were 8% and 4.5%,
respectively; the expected long-term ra te of
return on plan assets was 8.5%. Plan assets a t
December 31, 1996, consis t of common stocks
($504 million), cash or cash equiva lents ($42
million), fixed income investments ($135 million)
and other investments ($90 million). Less than 1%
of th e plan assets a t December 31, 1996, rep
resented Schlumberger Limited Common Stock.
NON-US PENSION PLANS
Outside of the US, subsid iaries of the Company
sponsor several defin ed benefit and d efined
contribution plans tha t cover substantially all
employees w ho are not covered by statutory
plans. For d efined benefit plans, charges to
expense are based upon costs computed by
independent actuaries. These plans are sub
stantia lly fully fund ed with trustees in respect
to past and current serv ice. For a ll defin ed ben
efit plans, pension expense was $16 million,

$13 million and $16 million in 1996, 1995 and 1994, respectively. The only significant defined benefit p lan is in the UK.
The assumed discount rate, compensation increases and return on plan assets used to determine pension expense in all years were 7.5%, 5% and 8.5%, respectively.
Net pension cost in the UK p lan for 1996, 1995 and 1994 (translated into US dollars at the average exchange ra te for the periods),
included the fo llowing components: (Stated i11 111illio11S)
1996 1995 1994 Service cost - benefits
earned during the period $12 $ 10 $ 10 Interest cost on projected
benefit ob ligation 9 9 10 Expected return on
plan assets (actual return : 1996 $36; 1995 $43; 1994 $(11)) (18) (16) (15)
Amortization of transit ion asset and other (3) (2) (3)
-- -- --Net pension cost $ - $ 1 $ 2
======== = = = The fund ed sta tus of the plan (translated
into US dollars at year-end exchange rates) was as fo llows:
(Stat ed in mi/Jio11s)
1996 1995 Actuarial present va lue
of obligations: Vested benefit obligation $132 $108
Accumu lated benefit ob ligation $132 $108
Projected benefit obl igation $150 $129 Plan assets at market va lue 276 222
Excess of assets over projected benefit obligation 126 93
Unrecognized net gain (111) (85)
Unrecognized prior service cost 4 4 Unrecognized net asset
at transition date (4) (5)
Pension asset $ 15 $ 7
35
The assumed discount rate and rate of compensation increases used to determine the projected benefit obligation were 8% and 5%, respectively; the expected long-term rate of return on plan assets was 8.5%. Plan assets consis t of common stocks ($219 million), cash or cash equivalents ($6 million) and fixed income investments ($52 million). None of the plan assets represents Schlumberger Limited Common Stock.
For defined contribution plans, funding and cost are genera lly based upon a predetermined percentage of employee compensation. Charges to expense in 1996, 1995 and 1994, were $15 million, $14 million and $12 million, respectively.
OTHER DEFERRED BENEFITS
In addition to providing pension benefits, the Company and its subsidia ries have other deferred benefit programs. Expense for these
programs was $93 million, $80 million and $71 million in 1996, 1995 and 1994, respectively.
HEALTH CARE BENEFITS
The Company and its US subsidiary provide health care benefits for certain active employ
ees. The cost of providing these benefits is recognized as expense when incurred and aggrega ted $38 million, $37 million and $34 million in 1996, 1995 and 1994, respectively. Outside of the United States, such benefits are mostly provided through governmentsponsored programs.
POSTRETIREMENT BENEFITS OTHER THAN PENSIONS
The Company and its US subsidiary provide certain health care benefits to former employees w ho have retired under the US pension plans.
In 1996, service cost and interes t cost expenses were $13 million and $26 million,

respectively, compared to $12 million and
$25 million in 1995. The principal actuarial
assumptions used to measure the above
mentioned costs were a d iscount ra te of 7.5%
in 1996 and 7.5% in 1995, and a medical cost
trend ra te of 10% graded to 6% over the next
six yea rs and 6% thereafter.
The funded status a t December 31, 1996 and
1995, was as fo llows:
(Stated i11 111illions)
1996 1995 --- ---
Accumul ated postretirement benefi t obligation:
Retirees $143 $ 173 Ful ly e ligible 8 6
Actives 135 181 --- ---
$ 286 $360 Unrecogni zed net ga in (loss) 92 (5)
Unrecogni zed prior service 5
Postretirement benefit liabi lity at December 31 $ 383 $355
The assum ed discount ra te used to de termine the accu m u lated postre ti remen t
benefit obliga tion was 8% fo r 1996 and 7.5 %
in 1995. A t December 31, 1996, the medica l
cos t trend ra te has been lowered to re fl ec t
ac tual experience over the las t four years to
9% grad ed to 5% over the n ext six yea rs and
5% th ereafter.
If the assumed medical cost trend rate was
increased by one percentage point, health care
cost in 1996 would have been $45 million,
and the accumulated postretirement benefit
obliga tion would have been $324 million a t
December 31, 1996.
36
Supplementary Information
Operating revenue and related cost of goods
sold and services comprised the fo llowing:
(S tated in 111ilfions)
Year ended December 31 , 1996 1995 1994
Operating revenue
Sales $ 2,428 $2,372 $2,019
Services 6,528 5,250 4,678
$ 8,956 $7,622 $6,697
Direct operating costs
Goods sold $ 1,704 $ 1,645 $1,372
Services 5,131
$6,835
4,159
$5,804
3,736
$5,108
Cash paid for interest and income taxes was
as follows:
Year ended December 31,
Inte rest
Income taxes
1996
$ 73
$ 179
(S tated i11 milliotts)
1995
$ 81
$132
1994
$ 64
$148
Accounts payable and accrued liabilities a re
summarized as fo llows:
(S tated i11 miff ions)
December 31, 1996 1995
Payroll, vacation and employee benefits $ 488 $ 425
Trade 712 564
Taxes, other than income 182 156
Other 818 629
$2,200 $ 1,774
The caption "Interest and other income"
includes inte res t income, principally from
short-term and long-term investments, of $73
million, $89 million and $78 million for 1996,
1995 and 1994, respectively, partially offset by
the Company's share of the loss from the
Omnes joint venture of $5 million in 1996.

REPORT OF INDEPENDENT ACCOUNTANTS
To the Board of Directors and Stockholders
of Schlumberger Limited
In our opinion, the accompanying consolidated balance sheet and the rela ted consolidated statements of income, of stockholders' equity and of cash flows present fairly, in all material respects, the financial position of Schlumberger Limited and its subsidiaries at December 31,
1996 and 1995, and the results of their operations and their cash flows for each of the three years in the period ended December 31, 1996, in conformity with generally accepted accounting principles. These financial statements are
the responsibility of the Company's management; our responsibility is to express an opinion on these financia l statements based on our audits. We conducted our audits of these state
ments in accordance with generally accepted auditing standards which require that we plan
37
and perform the audit to obtain reasonable assurance about whether the fin ancial s tatements are free of material missta tement. An audit includes examining, on a test basis, evi
dence supporting the amounts and disclosures in the fin ancial s tatements, assess ing th e
accounting principles used and significant es timates made by management, and evaluating the overall financial sta tement presentation. We believe that our audits provide a reasonable basis for the opinion expressed above.
~- ~ !~e~o~:L '-New York, New York January 23, 1997

QUARTERLY RESULTS (UNAUDITED)
The following table summarizes results for each of the four quarters for the years ended December 31, 1996 and 1995. Gross profit
QUARTERS- 1996
First
Second
Third
Fourth
QUARTERS-1995
First
Second
Third
Fourth
equals operating revenue less cos t of goods sold and services.
(Stated i11 111iffions except per share nll/011111 5)
OPERATING NET INCOME
REVENUE GROSS PROFIT AMOUNT PER SHARE
$2,028 $ 478 $ 171 $ 0.70 2,151 519 196 0.80 2,262 510 229 0.93 2,515 614 255 1.04
$8,956 $2,121 $ 851 $ 3.47
$ 1,762 $ 426 $ 147 $ 0.61 1,877 459 167 0.69 1,919 464 169 0.70 2,064 469 166 0.69
$ 7,622 $1,818 $ 649 $ 2.69
38

FIVE-YEAR SUMMARY
(S tntecl in mi/l io11s except per share mi/Otllt fs)
Year Ended December 31 , 1996 1995 1994 1993 1992
SUMMARY OF OPERATIONS Operating revenue:
Oi lfield Services $ 6,129 $4,868 $4,365 $ 4,338 $3,849 Measurement & Systems 2,834 2,759 2,339 2,370 2,484
Tota l operating revenue $ 8,956 $7,622 $6,697 $ 6,705 $6,332
% increase over prior year 18% 14% -% 6% 3%
Operating income : Oi lfield Services $ 986 $ 627 $ 495 $ 468 $ 546 Measurement & Systems 124 151 121 184 178 Eliminations (52) (17) (23) (23) (28)
$ 1,058 $ 761 $ 593 $ 629 $ 696
% increase (decrease) over prior year 39% 28% (6%) (10%) (5%) --- ---
Interest expense 72 82 63 69 77 ---
Taxes on income' (176) 121 81 81 86
Income, before cumu lative effect of a change in accounting princ iple $ 851 $ 649 $ 536 $ 583 $ 662
% increase (decrease) over prior year 31% 21 % (8%) (12%) (19%)
Postretirement benefits (248)
Net income $ 851 $ 649 $ 536 $ 335 $ 662
Income per share: Before cumulative effect of a
change in accounting principle $ 3.47 $ 2.69 $ 2.21 $ 2.40 $ 2.75 Postretirement benefits (1.03)
Net income $ 3.47 $ 2.69 $ 2.21 $ 1.37 $ 2.75
Cash dividends declared $ 1.50 $ 1.425 $ 1.20 $ 1.20 $ 1.20
SUMMARY OF FINANCIAL DATA Income as% of operating revenue 10% 9% 8% 9% 10%
---Return on average stockholders' equity 16% 14% 12% 14% 16%
--- --- --- ---Fixed asset additions $ 1,158 $ 939 $ 783 $ 691 $ 809
Depreciation expense $ 819 $ 760 $ 722 $ 739 $ 671
Average number of shares outstanding 245 242 243 243 241
AT DECEMBER 31, Liquidity $ 232 $ 188 $ 404 $ 696 $ 663 ---Working capita l $ 1,568 $ 1,259 $1,037 $ 908 $ 1,242
Total assets $10,325 $8,910 $8,322 $7,917 $7,007
Long-term debt $ 637 $ 613 $ 394 $ 447 $ 374 ---
Stockholders ' equity $ 5,626 $ 4,964 $ 4,583 $ 4,406 $ 4,231
Number of employees 57,000 51,000 48,000 48,000 51,000
'ln1996, the normal recurring provision for income taxes, before recognition of the US tax loss carryforward benefit and the tax effect of the unusual items, was $206 million.
39


CAPTURING NEW MARKETS
n the North Sea, one hundred fifty miles
northeast of Aberdeen, Scotland, a new
approach to oilfield management is helping con
vert marginal fields to attractive prospects.
n Atlanta, Georgia, at the Centennial
Olympic Games, a crucial foothold for
smart card technology was established in the
potentially huge North American market.
These two Schlumberger businesses-separated
by an ocean, but united by a common entrepre
neurial culture-illustrate the fundamentals that
contributed to excellent results in 1996.
The stories in both places express a core theme
for Schlumberger: Anticipate customer needs,
address them with superior technology and
deliver the best possible solutions.
Atlanta and Aberdeen frontiers:
New markets for smart cards,
new techniques for North Sea oil.
41

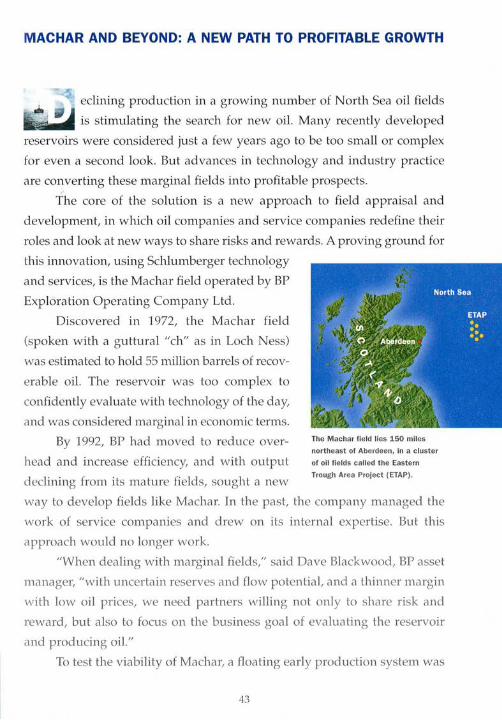
MACHAR AND BEYOND: A NEW PATH TO PROFITABLE GROWTH
eclining production in a growing number of North Sea oil fields
•alllllllll is stimulating the search for new oil. Many recently developed
reservoirs were considered just a few years ago to be too small or complex
for even a second look. But advances in technology and industry practice
are converting these marginal fields into profitable prospects.
The core of the solution is a new approach to field appraisal and
development, in which oil companies and service companies redefine their
roles and look at new ways to share risks and rewards. A proving ground for
this innova tion, using Schlumberger technology
and services, is the Machar field opera ted by BP
Exploration Operating Company Ltd.
Discovered in 1972, the Machar field
(spoken with a guttural "ch" as in Loch Ness)
was estimated to hold 55 million barrels of recov
erable oil. The reservoir was too complex to
confidently evaluate with technology of the day,
and was considered marginal in economic terms.
By 1992, BP had moved to reduce over-
head and increase efficiency, and with output
declining from its mature fields, sought a new
The Machar field lies 150 mi les
northeast of Aberdeen, in a cluster
of oil fields called the Eastern
Trough Area Project (ETAP).
way to develop fields like Machar. In the past, the company managed the
work of service companies and drew on its internal expertise. But this
approach would no longer work.
"When dea ling with marginal fields," sa id Dave Blackwood, BP asset
manager, "with uncertain reserves and flow potential, and a thinner margin
with low oil prices, we need partners w illing not only to share risk and
reward, but also to focus on the business goal of evaluating the reservoir
and producing oil."
To test the viability of Machar, a fl oating early production system was
43

consisting of a semisubmersible drilling rig connected to a
tanker. In addition to its usual function of drilling and servicing wells,
the rig was converted to also handle production of oil and gas. With
this setup, a few existing wells were recompleted to evaluate the
reservoir size and flow rates, which determine whether permanent
production is feasible. Testing took place for 21 months, far longer than
a conventional two- or three-day test, and therefore yielded a more
confident appraisal of the reservoir. Oil produced during testing was
exported to the tanker, providing cash flow even before full-fled ged
production began. What was new was the
way the sys tem was managed, employing
new technology and a unique alliance.
In the past, the oil company would have
managed the entire appraisal, shouldering
all risk and accepting all reward. Instead, in
1994 BP enlis ted what became the Turnkey
Additional Production (TAP) alliance, which
drew together contractors who would sup
ply the best possible solutions. The alliance
evolved into:
• Schlumberger Integrated Project Man
agement (IPM), managing well engineering and well construction;
• Sedco Forex, providing a drilling semisubmersible rig, Sedco 707,
retrofitted with equipment to handle production from the reservoir,
and managing logis tics, such as transportation and supplies;
• Coflexip Stena Offshore, supplying the tanker, subsea construc
tion and flow lines connecting the rig and tanker;
• ABB Vetco Gray, providing subsea engineering, managing pro
curement of subsea equipment, and designing production

and water injection equipment.
•Schlumberger Wireline & Testing, providing low-cost,
reusable early production and testing equipment installed on Sedco
707, conducting wireline logging, perforating, and managing per
manent downhole sensors, which provide a continuous stream of
information for better, more cost-effective well management.
•Cameo, working through Wireline & Testing, providing light
w ireline services and completion hardware for one of the wells.
Other Schlumberger companies were awarded work on the
project. Anadrill provided directional
and reentry drilling, with wells steered in
real time using the GeoQuest GeoViz*3D
reservoir modeling software. Well plan
ning also drew on comparison of seismic
with logging-while-drilling and wire
line data . In addition, GeoQuest helped
identify drillable structures by integrat
ing actual rock samples with data from
logs. This was especially important in
mapping Machar's complex geology.
Dowell supplied drilling fluid s
and fluids engineering, well cementing and stimulation. Strengths
tha t contributed to the selection of Dowell included its advanced
synthetic drilling fluid and innova tive technique for well stimula
tion, which coaxes out more oil than would flow naturally. Use of
ULTIDRILL fluid enhanced drilling efficiency and protected reser
voir producibility. In addition, monitoring of drilling fluids
w ith the automated FMP* fluids monitoring package
allowed for rapid modifica tion of fluid chemistry
In an early pro
duction system,
a flexible line
from the drilling
rig offloads
oil to a tanker
about one mile
away. (Inset)
Tanker Stena
Savonita and
Sedco 707 in
early production
mode at
Conoco's Banff
field in the
North Sea .

Some of the team involved in development of Machar and other oil fields of the Eastern Trough Area Project ( ETAP)
in the North Sea: From left across both pages are John Kozicz of Sedco Forex; Tony Oldfield and Kevin Forbes, both
of Schlumberger Integrated Project Management (IPM) ; Bob Talbott of IPM with Gerald Smith of Wireline & Testing;
in response to changing well conditions. Dowell also d eveloped a s timula
tion setup that avoids "killing" the well, thereby further protecting reservoir
producibility. Use of this technique in one well, with treatment from the
Dowell BIGORANGE*X Vlll s timula tion vessel, achieved a world-record
First appraisal
oil flowed
just 19 weeks
after approval
of the project.
460-foid increase in well productivity.
In a departure from conventional field development,
Schlumberger and Cofl ex ip Stena took increasing responsibility
for various operations at Machar. BP retained full ownership of
reservoir assets and developed the production strategy and well
design, with Schlumberger compa nies supporting well com-
pletions. Later, the contractors' roles expanded. "Basica ll y, the
clien t said 'Here's our reservoir,"' sa id Bob Ta lbott, then Schlumberger dis
trict manager of Testing. '"We want you to work with us and manage the
field- from well design, drilling, completion, production and processing to
transport of oil. Take it from the reservoir to the refinery."'
At first, the Machar team worked from their home offices sca ttered
across Aberdeen. Later, they moved to a single loca tion for better effi ciency.
"When you walked into a Machar meeting," sa id Jon Turnbull,
Machar team leader for BP, "you would struggle to tell who worked for
Coflexip Stena, for Schlumberger or BP-we actually had our people report
ing to Schlumberger people, Schlumberger people reporting to Coflexip
Stena people."
All parties participated in risk and reward, so all focu sed on reducing
46

Graeme Wood of Coflexip Stena Offshore; David Blackwood and Jon Turnbull of BP Exploration Operating Company Ltd. ,
which developed the Machar field and three others in ETAP; and Tom O'Rourke (background) with Martha Jones of
GeoQuest. Most personnel were based in Aberdeen, which serves as the control center for development of ETAP fi elds.
risk, raising efficiency and maximizing return. With a very thin manage
ment layer, decisions were made quickly by those nearest the action.
The results were impressive. First appraisal oil flowed just 19 weeks
after approval of the project, rather than in the typical one or two years for
the conventional approach. The rest of the appraisal was then phased to
reduce risk. Phase I increased recoverable reserves to 77 million barrels of
oil without water injection, which pushes oil toward producing wells. Phase
IT confirmed that water injection would indeed work, and would double
recoverable reserves to 120 million barrels.
During the 25-month project, 14.5 million barrels of oil were exported
to the tanker, covering the cost of phase I and providing a cash advance for
fu ture investment. When Sedco 707 finally concluded phase II in May 1996,
there had been no loss of work time due to accidents, no leaks or spills, and
an overall efficiency 7% above plan. Machar proved to be a viable field, the
floating early production system proved it could safely function through
two North Sea winters, and Schlumberger proved it could effici ently man
age and execute a complex field appraisal project.
"Machar blazed a new trail for Schlumberger," sa id Tony Oldfield of
IPM, manager of phase I. "It showed that we are more than a service
provider, working on single wells on short notice. We' re the only one who
could supply total service integration to manage all aspects of a client project.
Early involvement with the customer led us to jointly commit to an aggres
sive development plan, despite $13-per-barrel oil, in which our revenue was
47

based on the success, efficiency and safety of the project."
In addition to the alliance companies controlling all resources to
develop the reservoir, providing the entire scope of services and assuring
availability of equipment, success also came from parallel engineering.
"Parallel engineering allowed us to create solutions as we moved
along," sa id Kevin Forbes, region vice president of IPM. For example, the
tanker was being converted to dynamic positioning as drilling was finish
ing. Design of the production sys tem for Sedco 707 was carried out in parallel
w ith its construction. While Sedco 707 was completing wells, the deck of the
rig was strengthened to accept 220 tons of new equipment, including 30 km
[19 miles] of wiring and 4 km [2.5 miles] of pipe for handling crude oil pro
cessing. The retrofitting took 60 days, a t a 15% savings over dry-dock cost-
"~arallel engi
neering allowed
us to create
solutions as we
moved along."
and without losing a day of work.
The total project engineering required new ways of think
ing and behaving. "We had service companies thinking like
operating companies," said Jon Turnbull of BP. In line w ith this
approach, the alliance companies sometimes suspended their
own short-term gain for the ultimately larger, more enduring
reward of the project's long-term success. For example, flow
lines mad e by a Coflexip Stena competitor and subsea equipment by a
Schlumberger competitor were sometimes chosen as better suited to the
success of the project.
"The success was based on a small but dedicated project team," sa id
Graeme Wood of Coflexip Stena, project manager for Machar phase II. "We
all lea rned to operate on the grounds that our reward was based foremost
on the overall project' s success, w hich is ultimately in all our best interes ts."
Success at Machar ex tended the reach of Schlumberger both geo
graphically and in service diversity, and contributed to development of the
current largest BP Exploration project worldw ide: the Eastern Trough Area
Project (ETAP), a collection of initially seven neighboring fi elds, including
Machar, tha t contain a half billion barrels of oil scheduled to begin
48

Early production systems
consist of modular hard
ware, framed here in
green, that Is customized
for each rig. The system
allows for earlier flow of
oil - and revenue.

Oil fields in the Eastern Trough of the
North Sea, shown as colored domes,
will all produce to a platform
at the Marnock field . Central Processing Facility

production in 1998. The ETAP fields are up to 35 miles apart and the satellite
fields will produce through subsea pipelines to a single central processing
facility, which will pipe oil ashore to the UK.
Schlumberger will be a key service provider in ETAP. GeoQuest will
process and analyze all of the BP North Sea data, through a five-person
dedicated client center in the customer office. In addition, GeoQuest will
perform data validation and database management through "service at the
screen,"-a fiber-optic link that speeds data from the GeoQuest data archive
to the customer. 'This gives them a nearly immediate response time," said
Martha Jones, GeoQuest information technology manager. "Through our
economy of scale, we can offer operating
companies a significant savings in data
management."
The process improvement and
expertise developed at Machar have
also benefited Dowell. It is scheduled
to provide reservoir stimulation, fluids
engineering and coiled tubing work on
ETAP wells, and has delivered cement
ing, coiled tubing and fluids engineer-
ing services on several wells in the
northern frontier, West of Shetland.
After leaving Machar, Sedco 707
Michelle Churchward, a Schlumberger Oilfield
Services attorney who negotiates contracts for
early production systems, aboard a helicopter
headed for Sedco 707, the rig that operated at
the Machar and Banff fields.
and the tanker Stena Savonita performed an early production encore this
year at Conoco's Banff field. Although the current reserves range remains
broad, the early production system has reduced some key uncertainties
about the recovery mechanism, the long-term productivity and reservoir
connectivity. By the end of November, the system had produced 2.1 million
barrels of crude, providing Conoco with a significant revenue stream 18
months sooner than would be acquired conventionally. Likewise, a similar
floating early production scheme with the Sedco Explorer was put in place at
51

the Clair field West of Shetland, one of the largest in the North Sea region,
holding an estimated six billion barrels of oil.
"Machar showed that we all had the ability to reorganize our skill
sets," said Dave Blackwood of BP. "In the past, we conducted our business
dialogue across the boundary between the oil company and the contractor.
52

Now, we're trying not to create that boundary in the first place. It's a less
comfortable arrangement if you're used to command and control, but any
discomfort is far outweighed by the benefits of a better quality product."
Charlie Cosad, wells alliance team leader and Schlumberger project manager for the Eastern Trough Area Project, with
his family-from left, Matt, Tess and Dominique-at Castle Dunnottar, a 13th-century ruin near Aberdeen, Scotland.
53


THE EXPANDING WORLD OF THE SMART CARD
mpty your wallet and what do you find? Some paper money and
•\ a handful of plastic-a credit card or two, an ATM card, some
frequent flyer cards, a telephone ca lling card, a hotel frequent guest ca rd, a
health plan card ....
Now fast forward beyond the year 2000. The paper money may still be
around, but you use it less often . The plethora of plastic has converged into
a single card. Embedded in the face of that card is a jewel-like integrated
circuit tha t flexes enough computing muscle to make the card an electronic
jack-of-all-trades. It is an all-purpose credit-ATM
frequent flyer-phone-health plan card. It is also
a new type of payment method called stored
value, containing electronic cash for small pur
chases: a tank of fuel, the curbside parking
meter, the morning paper and coffee at the news
stand, bus fare, and a call at a pay phone. Less
need for coins and paper money, and more con
venience in single, multipurpose card. Welcome
to the fast-approaching world of the smart card.
The era of this multiapplica tion relation
ship card, in which the computing power of a
microprocessor allows the card to serve many
Roving Visa Cash Corp representa
tive Dawn Turner explains Visa Cash
at Atlanta 's Hartsfield International
Airport . Schlumberger provided the
majority of smart cards for the trial
during the Summer Olympics.
functions, lies some distance over the horizon. But the first generation of
such cards has already arrived. Smart cards are rapidly transforming
existing markets and helping create new ones, bringing higher efficiency,
greater convenience and additional services to transactions of all kinds.
Schlumberger is a leader in smart card technologies and has produced 350
million smart cards used in 80 countries for a variety of applica tions-retail
and banking terminals, cellular and pay phone systems, fuel dispensers,
mass transit, parking meter systems and medical applications.
55

Smart card applications cover a range of markets, including financial transactions, telecommunications, health care and transportation.
The Smart VIllage * Infrastructure Introduced in 1996 is a modular set of smart card-based solutions for public and private markets.

The smart card is widely used in Europe, where its application over
the last ten years has expanded from pay phones and financial applica tions
to mass transit and health care. Smart cards are now taking off in Asia,
where surging economies are fueling demand for card applications in ,. banking and telephone systems. Another frontier is North America, where
highly diverse banking and telecommunications
markets have begun to develop and where the
emerging application of electronic cash is being
utilized by nearly one million people.
The typical electronic cash, or s tored
value, smart card is used for incidental pur
chases, usually under $10 or $20. To make a
purchase, the card is inserted into a terminal,
which displays the value loaded on the card.
The consumer then pushes a button to verify the
transaction and deduct the purchase amount.
Industry studies show the transaction takes 1 to
6 seconds-much faster than the 30 to 40 sec
onds of the typical cash transaction.
For the consumer, the cards make budget
ing easy and they are convenient- faster than
cash or a credit card, no waiting for on-line
authorization and no fumbling for change .
Retailers also like the simplicity and speed
the cards eliminate errors, losses and delays
associated with handling cash.
This year at the Centennial Olympic
Fast cash for fast food . The speed of
smart card transactions-typically a
few seconds-makes them popular
with customers at fast-food venues.
Domino's Pizza equipped Corporate
Area Supervisor Sean Harper (top)
with a mobile card reader. Dunkin'
Donuts (above) uses fixed card readers.
Garnes in Atlanta, Georgia, Schlurnberger participated in the largest pilot
program to date of stored value cards. Three sponsoring banks teamed with
Visa to bring to Atlanta the Visa Cash stored value system. Schlurnberger
was the lead supplier, providing 200 card dispensing machines, 2700 card
57

readers, and more than half the 2 million smart cards. Across Atlanta, the
Visa Cash pilot involved 1500 retail merchant locations, including fast-food
retailers, convenience stores, movie theaters, filling stations, pay phones and
the city's transit system, the Metropolitan Atlanta Rapid Transit Authority
(MARTA). During the 17 days from the opening to closing ceremonies of the
Olympics, more than 200,000 transactions totaling $1.1 million took place.
"From our perspective, the message to the market was strong and
unequivocal," said Jean-Paul Bize, vice president of Schlumberger Electronic
Transactions. "The Atlanta games proved the inherent strength of our value
proposition to our clients. No other company in the industry can roll out a
complete card-terminal-support solution as quickly as Schlumberger."
Atlanta was also the first large-scale "open system" pilot, in which
"At the 1996
Olympics, people
began to under
stand smart card
technology."
cards from multiple issuers were accepted by many different
merchants and service providers. Most previous programs
were in closed systems, in which cards were issued and accept
ed by only one service provider, such as a mass transit system
or concessions in a sports stadium.
"Open systems take time to ga ther momentum," said
Edgar Brown, senior vice president with First Union Corpo
ration, one of the sponsoring banks. "You need to build an infrastructure
and educate consumers and retailers-it's a culture change, going from
cash to a card that contains cash. The great concentration of people at the
Olympics and the visibility of the event gave us that rocket-assist to move
ahead quickly."
Most of the cards sold in Atlanta during the Olympics were dispos
able, with a fixed value of $10, $20, $50 or $100. They were purchased at
Schlumberger dispensing machines or at one of the three sponsor banks
First Union, NationsBank and Wachovia. First Union also issued reloadable
cards to a small test group of account holders. These cards could be reloaded
at ATMs by transferring value from debit or credit cards.
The Visa Cash system in Atlanta continues to expand after the close
58

of the Olympics. "Our goal in introducing Visa Cash was to use the high
profile Olympic environment to test an entirely new payment method and
find out how consumers and merchants felt about it," said Michael
Beindorff, executive vice president of marketing and product management
for Visa USA. In an independent survey, two-thirds of Visa Cash users
found the transaction superior to one with
cash. Leading advantages were not having to
carry cash or change, not having to count
change and having it work just like cash.
A second stored value card pilot with
Schlumberger technology is scheduled for
launch in 1997 in the upper west side of
Manhattan, which has a high concentration of
retail establishments. Sponsoring banks plan to
issue 50,000 new credit or debit smart cards
with microprocessors and equip approximately
500 retail sites w ith terminals that can read
smart cards. The New York trial, involving
both Visa and MasterCard, goes a step beyond
Atlanta and uses mainly reloadable cards,
which customers can recharge at ATMs or
other terminals.
Demand for smart cards continues to
move forward. Last year, 50,000 cards was a
significant order, whereas this year a large order
might reach a half million cards, said Mike
Smith, general manager of operations at the
Kevin Stone, production manager at
the Schlumberger Danyl factory in
New Jersey (top), wheels a new
smart card dispensing machine into
a demonstration area. At the
Schlumberger Malco factory in
Maryland (above) , individual smart
cards are printed on larger sheets.
Schlumberger Danyl manufacturing center in New Jersey, USA. This center,
in the expanding North American market, helps position Schlumberger to
better develop stored value and other card applications. These develop
ments will lead to the future multiapplication rela tionship card-a single
59

Visa Cash cards issued
at the 1996 Games
(left) featured limited
editions of different
Olympic events,
increasing their appeal
among collectors. The
gymnastics venue in
Atlanta (right) was one
of the most popular.
card for the cellular phone, for banking and for loyalty programs, such as
frequent flyer programs.
Addressing this demand for expanded smart card capabilities, in
October Schlumberger announced the Cyberflex* smart card line, the first
to utilize the Javaf programming language. Java makes programming faster,
easier and independent of the computer platform. As a result, a larger num
ber of developers can write secure smart card applications, leading to more
choices for companies that use smart card products and services.
In the emerging North American market, growth today is fueled by
increasing the number of acceptance locations and broadening usage of
stored value cards. But ultimately, growth will come from m oving to a
multiple usage relationship card.
"The importance of the Atlanta pilot was not the launch of a stored
value card;' said Fred Winkler, executive vice president at First Union. "At
the Olympics, people began to understand smart card technology, which
opens the door to new applications. Stored value cards aren't the end of the
trail. They're the beginning of a new trail."
60


DIRECTORS
Don E. Ackerman1·2
Private Investor New Canaan, Connecticut
Euan Baird3A Chairman & Chief Executive Officer Schh11nberger
Denys Henderson2
Chairman The Rank Group Pic London
Andre Levy-Lan~ Chairman of the Board of Management Compagnie Financiere de Paribas Paris
William T. McCormick, Jr.3·4
Chairman & Chief Executive Officer CMS Energy Corp. Dearborn, Michigan
Didier Primat2
President Primwest Holding N. V. Cura~ao, N.A.
Nicolas Seydoux7•4
Chairman & Chief Executive Officer Gaumont Paris
Linda Gillespie Stuntz3
Partner Stuntz & Davis P.C. Wa shington, D.C.
Sven Ullring1·4
President & Chief Executive Officer Det Norske Veritas Hovik, Norway
Eiji Umene2
Consultant US-Japanese markets Tokyo
62
'Member, Audit Comrniltee ' Member, Compensation Cornmittee 3Member, Finance Com mittee ' Member, Nonrinnling Committee

OFFICERS
Euan Baird Chairman & Chief Executive Officer
Arthur Lindenauer Executive Vice President Chief Financial Officer
Victor E. Grijalva Executive Vice President
Clermont A. Matton Executive Vice Pres ident
Ian Strecker Executive Vice President
David S. Browning Secretary & General Counsel
Pierre E. Bismuth Vice Presiden t- Personnel
Jean-Marc Perraud Vice Pres ident
Jean-Dominique Percevault Vice President
William J. Prins Vice President
Michel Soublin Vice President
Pierre-Jean Sivignon Treasurer
Carole H. Finamore Assistant Secretary
63

SCHLUMBERGER ORGANIZATION
OILFIELD SERVICES
Wireline & Testing
Formation eva luation, well testing and produc
tion services for o il and gas wells: borehole
measurements of petrophysica l, geologica l and
seismic properties; cement and corrosion evalu
ation; perforating; modular prod uction systems;
permanent monitoring and control systems;
production logging; and light remedial and
abandonment services.
Dowell
Engi neering and pumping services for cement
ing, drilling fluid s, frac turing, acidizing, sa nd
con trol, wa ter control and coi led tubing appli
ca tions.
Geco-Prakla
Seismic data acquisition, processing and inter
pretation services for marine, land and transi
tion zone; seismic reservoir monitoring and
characteriza tion services; fully integra ted pro
ject management including survey evaluation
and design services; acquisition, processing
and sales of non-exclusive surveys.
64
Sedco Forex
Contract drilling services, offshore and on
land, w ith dynamica lly posi tioned drillships,
semisubmersibles, jackup rigs, dri ll ing ten
ders, swamp barges and land rigs; 83 rigs,
comprising 50 offshore (4 offshore charters and
6 management contracts) and 33 land rigs.
Anadrill
Rea l-time drilling services: d irec tional drilling,
measurements-w hil e-d rillin g a nd logging
while-drilling.
GeoQuest
Explora tion and produ cti on soluti ons for
optimizing the value of oil and gas reservoirs:
integra ted software systems, data manage
ment solutions and processing and interpre
tive services.
Integrated Project Management
Projec t management and well engineering
services: selection of optimum oilfield technol
ogy; implementa tion of safe ty and quality
management systems; coordina tion and man
agement of operations for well cons truction,
production and field development projects.

MEASUREMENT & SYSTEMS
Metering
ELECTRICITY
Systems for management of electricity distribution and usage: res id ential metering and energy management systems; utility revenue collection sys tems; commercial, industria l, transmission and distribution measurement and billing products and systems; load management systems.
GAS
Systems for management of gas usage: residential, commercial and industrial gas meters; regulators, governors, sa fety valves, stations and systems; gas trea tment including filtration, odoriza tion and heating; network management; and prepayment systems.
WATER
Meters and systems for management of residential, commercial and indus trial water usage covering the range of effective water distribution management and diverse heat distribution and industrial applica tions.
Systems & Services
Meter communication system s, including remote metering and wireless communication systems for utility markets; distributed measurement solutions, systems integration and data services; and services, providing software and turnkey installation, repair and maintenance solutions to add va lue in fully managed projects.
65
Electronic Transactions
Electronic transaction sys tems: smart and magnetic cards, terminals, equipment and management systems for transactions in a wid e range of sectors, including teleco mmunica ti ons, retail and banking, network access and securi ty, systems for retail petroleum, parking and mass transit, health care management and ca mpus communities.
Automatic Test Equipment
Design and manu fac ture of automatic test equipm ent, di agnostic systems, ba ck-end automation systems for the tes ting of semiconductor devices, board test systems as well as testing complete electronic assemblies.
OMNES
Communications a nd informa tion technology solutions: wide- and local-area networks, including sa tellite based networks, security, Internet, Intranet, messaging and business applica tion solutions for the energy exploration and production sector that allow information technology systems to communicate anywhere in the world.

STOCKHOLDER INFORMATION
Schlumberger Common Stock is li sted on the New York Stock Exchange, trad ing symbol SLB, and on exchanges in Paris, London, Amsterdam, Brussels, Frankfurt, Basel, Geneva, Zurich and Tokyo.
For quarterly earnings, dividend announcements and other information requests. ca ll Schlumberger Shareholder Direct® at 1-800-99-SLB-99 from the US and Canada. Intern ati onal ca llers dial 1-402·573-9796.
Schlumberger can be accessed on the Internet at http:/ ; www.slb .com
STOCK TRANSFER AGENT AND REGISTRAR
The First National Bank of Boston c;o Boston EquiServe Investor Relations P.O. Box 8040 Boston, Massachusetts 0 2266-8040 1·800-733·5001 or 1-617-575-3400
FORM 10-K
The Company's 1996 annual report on Form 10·K filed with the Securities and Exchange Commiss ion is ava ilab le without charge. From the US and Canada, ca ll 1-800-99-SLB-99 . Internati onal ca llers dial 1·402-573-9796 . Alternatively, wri te to the Secretary. Schlumberger Limited, 277 Park Avenue, New York , NY 10172.
DUPLICATE MAILINGS
When a stockholder owns shares in more than one account , or when stockholders li ve at the same address, duplicate mailings may result. If you rece ive duplicate reports. you can help eli minate the added expense by requesting that on ly one copy be sent. To eliminate duplicate ma1 11ngs . contact the First Nationa l Bank of Boston , cjo Boston EquiServe, Stock Transfer Agent and Registrar, listed above.
* Mark of Schlumberger ' UNIX is a registered trademark li censed exc lusive ly through X/ Open Company Limited.
' Java is a trademark of Sun Microsystems, Inc.
66
Design by Mi lton Glaser. Inc. Photographs for pages 40 -53 by Ph il ippe Cllarl iat Photographs for pages 55 -61
by Erich Hartmann/Magnum Illustrations on pages 43, 44-45 and 56 by Mirko llic Illustration on page 50 by M~rko llic. adapted from
Offshore Design Limited CD·ROM images on mside back cover by
Broadway Interactive Group Water and sand photographs: Image Bank
This report is printed on recyc led paper. fti! The text pages contain 10% post-consumer Ci. fi ber consisting almost entirely of wastepaper recyc ed from Schlumberger ATE faci lit ies in San Jose and Simi Valley, Californ ia.


277 PARK AVENUE, NEW YORK, NEW YORK 10172 42, RUE SAINT-DOMINIQUE, 75007 PARIS
LAAN VAN MEEROERVOORT 55, 2517 AG THE HAGUE