14th conference on applied climatology abstract # 71520
TRANSCRIPT

1
14th Conference on Applied ClimatologyAbstract # 71520
Using PRISM Climate Grids and GIS for Extreme Precipitation MappingGeorge H. Taylor and Christopher Daly
Oregon State UniversityCorvallis Oregon 97331-2209
Extreme precipitation information is of interest for a variety of purposes, including public safety,water supply, dam design and operation, and transportation planning. Two common parameterscalculated for extreme precipitation purposes are probable maximum precipitation (PMP) andintensity-duration-frequency (IDF). The definition of PMP is “theoretically, the greatest depth ofprecipitation for a given duration that is physically possible over a given area at a particulargeographical location at a certain time of the year.” PMP estimates are used to calculate theprobable maximum flood (PMF), which in turn is used to evaluate the adequacy of hydraulicstructures. IDF calculations are used in a variety of precipitation-related tasks, including PMP.The primary agency responsible for establishing standards for PMP and IDF has been theNational Oceanic and Atmospheric Administration (NOAA) – see, for example, U.S.Department of Commerce(1994). Specific regional and local analyses have generally beenperformed by local agencies or private contractors.
Historically, computations of these parameters have been accomplished using mostly manualtechniques (e.g., hand-drawn maps). Advances in spatial climate mapping and geographicalinformation systems (GIS) technology have created new opportunities for mapping extremeprecipitation. Using GIS software and climate grids created using PRISM, new approaches toextreme precipitation mapping have been applied to specific locations with good success. Inaddition to automating analytical processes, thereby saving time, the new techniques have beenshown to produce more consistent and defensible coverages (digital map layers) than those ofprevious analyses.
PRISM (Parameter-elevation Regressions on Independent Slopes Model) is an expert system thatuses point data and a digital elevation model (DEM) to generate gridded estimates of climateparameters (Daly et al., 2002). Unlike other statistical methods in use today, PRISM was writtenby a meteorologist specifically to address climate. PRISM is well-suited to mountainous regions,because the effects of terrain on climate play a central role in the model's conceptual framework.We call it an expert system, because it attempts to mimic the process an expert would use to mapclimate parameters. The user interacts with the process through a graphical interface.
The general procedure for estimating 24-hour PMP includes the following steps:
1) Collect hourly and daily precipitation data for major historical storms and select major stormsfor analysis;
2) Obtain or develop station information representing computed or estimated 100-year 24-hour(or other averaging period) precipitation amounts (see Figure 1);

2
3) For each storm, calculate the percent of 100-year 24-hour precipitation observed at eachavailable station
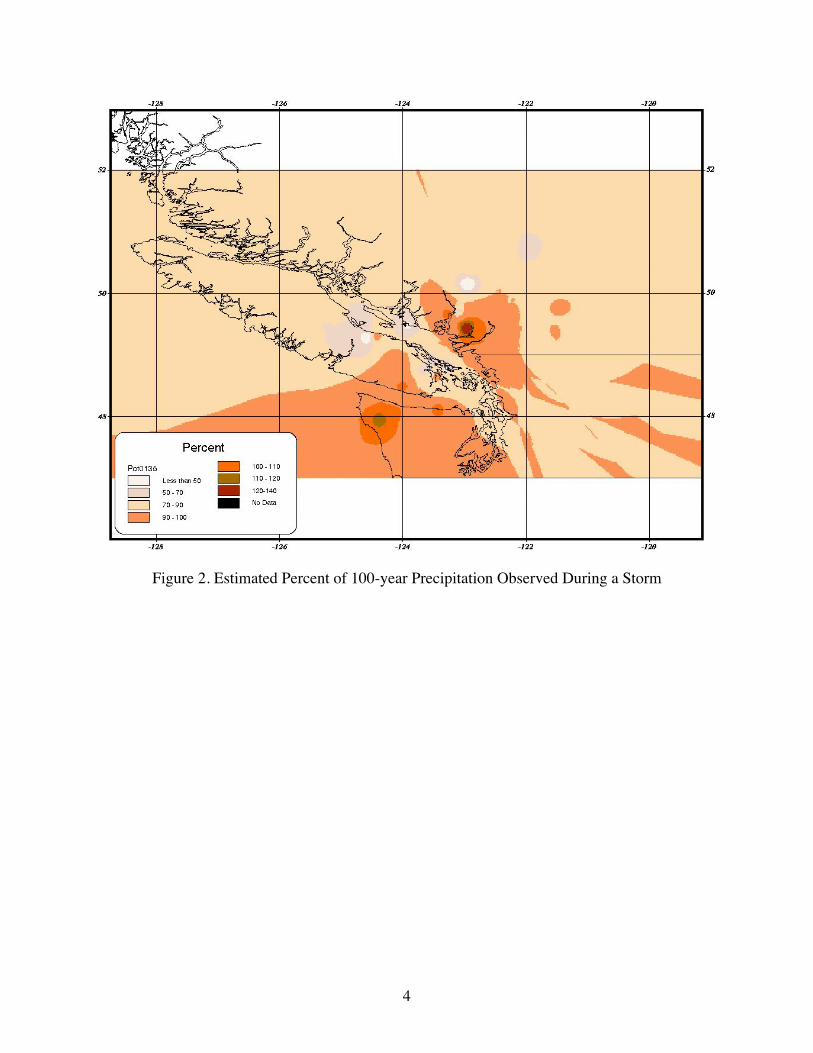
4) Create a GIS coverage representing the percentage of 100-year precipitation using the stationdata above (Figure 2);
5) Create isohyetal maps of maximum 24-hour precipitation for each selected historical stormusing the coverages from 2) and 4) – Figure 3.
6) Estimate the 100-year convergence precipitation (defined as the maximum precipitationcomponent operating independent of terrain influences) using a spatial grid and GIS (Figure3);
7) Determine the convergence precipitation from significant historical storms;8) Maximize the convergence component of historical storms using a set of maximization
factors, particularly the ratio of maximum observed dew point to observed dew point duringeach storm;
9) Transpose maximized convergence from each storm across a spatial grid using variations inmaximum persisting dew point applying both vertical and horizontal transposition limits;
10) Estimate the ratio of 100-year total precipitation to 100-year convergence precipitation (T/C)using the above data (Figure 4);
11) Estimate the variation in values of the storm intensity factor, M, to derive the orographicfactor, K; and
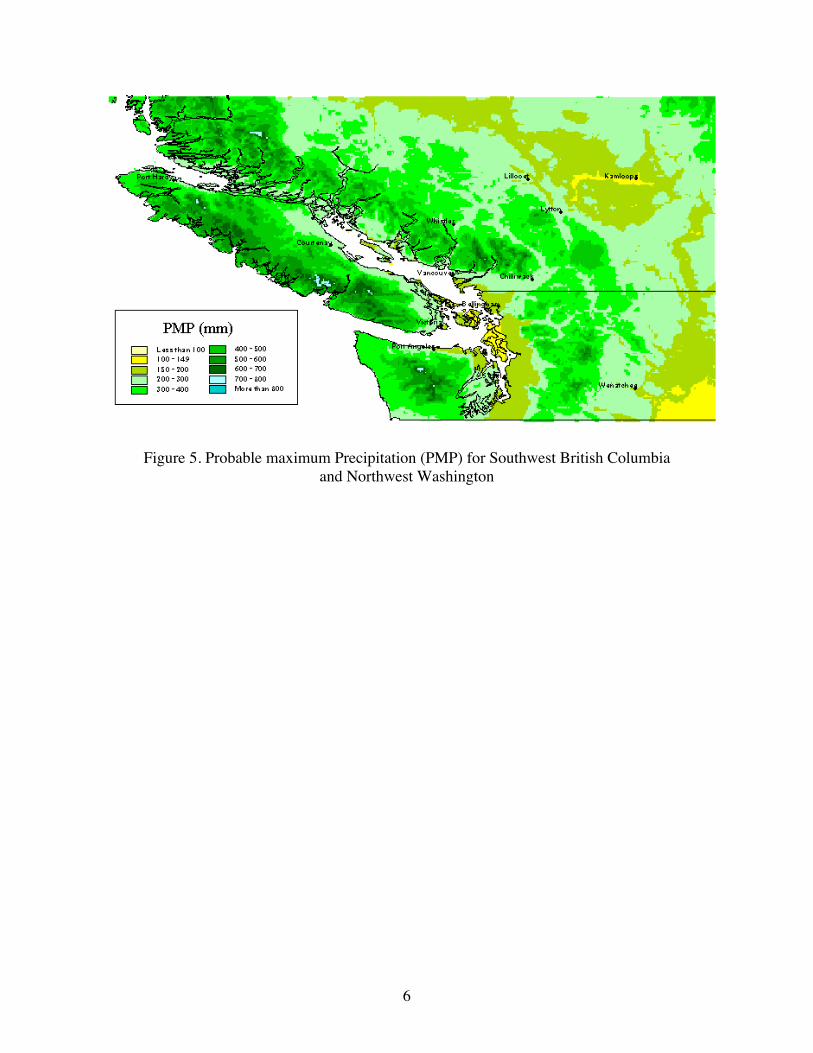
11) Determine the total PMP by multiplying GIS coverage of convergence PMP by grid of K(Figure 5).
The figures shown were developed for two PMP projects in the Pacific Northwest: PMP forSouthwestern British Columbia, for B.C. Hydro of Canada; and Extreme Precipitation (IDF) forWestern Washington for the Washington Department of Transportation.
References
Daly, C., W. P. Gibson, G.H. Taylor, G. L. Johnson, P. Pasteris, 2002. A Knowledge-basedApproach to Statistical mapping of Climate. Climate Research, 22, 99-113.
MGS Engineering and Oregon Climate Service (2001), Spatial Mapping of 100-Year and 1000-Year Precipitation for 6-Hour, 24-Hour, and 72-Hour Durations for Southwest BritishColumbia. Report to BC Hydro.
Schaefer, M., 2001. Catalog Of Extreme Storms for use in Probable Maximum PrecipitationStudy for Southwest British Columbia. MGS Engineering, Olympia, WA.
U.S. Department of Commerce, 1994. Probable Maximum Precipitation – Pacific NorthwestStates. Hydrometeorological Report No. 57 (HMR-57), Silver Spring, MD.

3
Figure 1. Example of a 100-year, 24-hour Maximum Precipitation Map
4
Figure 2. Estimated Percent of 100-year Precipitation Observed During a Storm

5
Figure 3. Estimated One-Day Precipitation for a Storm Event
Figure 4. T over C (total to convergence precipitation) for Southwest British Columbiaand Northwest Washington
6
Figure 5. Probable maximum Precipitation (PMP) for Southwest British Columbiaand Northwest Washington