13. regional maritime trends
TRANSCRIPT


13-1
13. REGIONAL MARITIME TRENDS 13.1 Singapore 13.1.1 Port Management Singapore Harbor Board had been responsible for the management of Port of Singapore until 1964. Port of Singapore Authority was established in April 1964 and it assumed complete responsibility for port construction and operation. In 1996, the former PSA was split into two, PSA corporation limited and MPA (Maritime and Port Authority of Singapore). The new PSA was established as a private entity responsible for port operation, although the government still holds its entire equity. On the other hand, MPA is in charge of the regulatory functions relative to the port including port planning, harbor master, ship registration, and port industry issues. Since May 1997, PSA comprises two main divisions, administrative division and strategic business division. The strategic business division is made up of three main groups, container terminal operation, storage and distribution, and overseas business. PSA established a subsidiary, PSA Marine, which takes care of tug and pilot services. Consequently, PSA now focuses on container terminal operation. PSA was privatized mainly because it would help streamline the government sector and facilitate PSA’s overseas business. Currently, PSA operates nine ports overseas including Dalien (China) and Aden (Yemen). PSA’s investment activity is now focused on overseas projects rather than domestic projects. PSA predicts that its overseas operation will become profitable in 2007. MPA and PSA are completely independent with no exchange of employees. Taking port development as an example, MPA prepares a development plan and PSA constructs and operates port facilities. The government continues to own the land and leases it out to the operator for a period of 20-30 years. Channel dredging is taken care of by a terminal operator if the channel is dedicated to the terminal. Otherwise, MPA is responsible for channel dredging. 13.1.2 Port Operation (1) Throughput Container throughput in Singapore reached 17 million TEUs in 2000, 80% of which was transshipment. The existing terminals have a capacity of 19-20 million TEUs/year. On top of that, PSA terminals developed overseas handled another 2.7 million TEUs in 2000. PSA is the only operator in Singapore and it has no plan to invite other operators. (2) Facilities Singapore has 37 container berths with 120 gantries, which are developed in four areas (Table 13.1.1, Figure 13.1.1). Among them, Pasir Panjang Terminal is still under construction. Development of Pasir Panjang is now in the second phase of a four-stage development in which 26 berths will be provided in total. The draft of Pasir Panjang is 15m at present, but PSA is ready to increase it to 16m if users request

13-2
it. In fact, areas 40m from the quay line are already dredged to 16m. MPA and URA (Urban Redevelopment Agency) have a plan to convert older terminals, Tanjong Pagar and Keppel, into urban use. Their plan is to transfer port activities in the two terminals to Pasir Panjang. This will reduce the intra-terminal transportation. The schedule of the redevelopment is not yet fixed because of the slow economy in recent years.
Table 13.1.1 Container Terminals in Singapore
Terminal Tanjong Pagar
Keppel Brani Pasir Panjang Total
Number of berths (Mother) (Feeder)
6 2
3 11
5 4
6 -
20 17
Operator PSA PSA PSA PSA PSA Draft (m) 11-14.6 9.8-14.6 12-15 15
Yard Handling RTG RTG RTG Overhead
Bridge Crane, RMG
Gantries 29 36 30 24 119
Yard Cranes 117 106 105 44 bridge Crane,
15 RMG 387
Yard Area (ha) 80 96 79 84 339 Storage Capacity (TEU)
15,308 20,290 15,424 14,020 65,042
Source: PSA
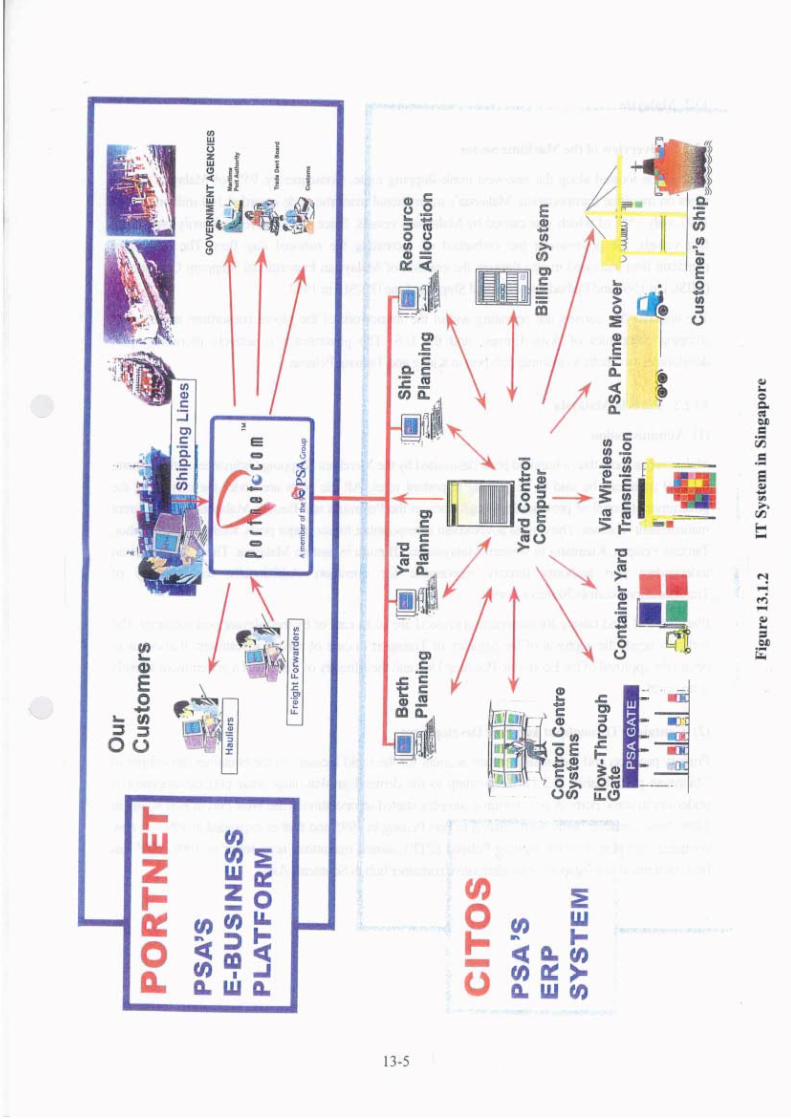
(3) Terminal Operation All the container terminals are for common users, though some shipping companies request dedicated terminals. In order to provide efficient services, PSA offers “ Virtual terminal agreement” to shipping companies. With this agreement, major users are given almost dedicated use of a terminal. If a user is offered a berth different from a usual one, PSA pays the transportation cost between the berths. This intra-berth transportation somewhat decreases the overall productivity. PSA also offers “Volume rebate service” to major users which promise to bring in a certain amount of cargo. PSA is responsible for all port-related services including cargo handling, pilotage, tug, and bunkering. Port charge is determined by a negotiation between PSA and users. Fixed tariff has therefore not been published since 1997. Crane operators are PSA employees, while contractors provide rushers and truck drivers. IT system of Singapore comprises two systems, PORTNET and CITOS (Figure 13.1.2). PORTNET was established in 1989 to provide an efficient link of information on vessels and cargoes between users and PSA. It links 7000 domestic users and carries out 5 million transactions a year. It established an internet link in 2000 to provide services to users overseas. CITOS is a terminal operation system introduced in 1988. It allocates workers, equipment, and berths. Supported by this system, gate

13-3
processing time is now 25 seconds (In-gate) and 35 seconds (Out-gate) per box, a remarkable reduction from the 5 minutes per box required in 1982. Container berths are equipped with four gantries each. Maximum seven (usually 5-6) gantries are deployed to cater for large vessels. Quay Productivity is 25-28 boxes/hour. 13.1.3 Traffic between Indonesia and Singapore (1) Container MOL (Mitsui OSK Line) provides container feeder services from Singapore to Indonesia using local shipping companies. It has a Jakarta service (4-5 calls a week with 500-1,000 TEU vessels), a Surabaya/Sumaran service (4-5 calls a week each with 300-700 TEU vessels), a Belawan/Palembang/Panjan service (3 calls a week each with 300-500 TEU vessels), and a Pontianak service (weekly). Currently, no major Japanese shipping companies provides direct container services between Japan and Indonesia. A source in Singapore indicated that Tanjung Priok was not suitable for calls by large vessels at present because of the insufficient draft and turning basin. The source also pointed out that calling Tanjung Priok would need a two-day deviation from the trunk line. Mainly because of these reasons, shipping companies provide Indonesian ports with feeder services not from Tanjung Priok but from Singapore. Containers to/from smaller ports in Indonesia are often carried by barges, though PSA discourages the use of barges due to safety reasons. These barges are requested to moor at the inner harbor of Marine Bay or conventional berths at Pasir Panjan. Exports from Jakarta are electric appliances, machinery, robot parts, textile, and cloths. Imports from Singapore are mainly heavy cargo such as parts. Exports and imports are relatively well balanced between Indonesia and Singapore. Imports to Indonesia are mostly by 20 feet containers, while many 40 feet containers are deployed for exports from there. A source in the shipping industry indicated that Indonesian ports needed to expedite the processing of port-related documents by introducing an EDI system. (2) Break Bulk Singapore used to be a distribution hub of break bulk cargo for Indonesia. That changed four years ago when PSA revised its regulation reducing the free storage time from 28 days to 14 days. Storage time is now counted from day one if the time exceeds 14 days. This move is aimed to provide containers with as much yard space as possible and greatly discouraged shippers from using Singapore for break bulk cargo. Due to the above reasons, there is almost no move of break bulk cargo between Singapore and Indonesia. Considering the operation costs, Port Klang and Medan will likely to take over the position as a distribution center of break bulk for local ports in Indonesia.

Figu
re 1
3.1.
1 C
onta
iner
Ter
min
als i
n Si
ngap
ore
13-4

13-6
13.2 Malaysia 13.2.1 Overview of the Maritime Sector Malaysia is located along the east-west trunk-shipping route. Consequently, 95% of Malaysia’s trade relies on maritime transportation. Malaysia’s international maritime trade recorded 160 million tons in 1997, only 15% of which was carried by Malaysian vessels. Since Malaysia relies heavily on foreign flag vessels, the government has embarked on increasing the national flag fleet. The Malaysian merchant fleet increased in size through the creation of Malaysian International Shipping Corporation (MISC) in 1968 and Perbadanan National Shipping Line (PNSL) in 1982. The national flag carriers are operating within the framework of the global consortium made up of shipping companies of Asia, Europe, and the U.S. The government is actively promoting port development to create a container hub port in Klang and Tanjung Pelapas. 13.2.2 Ports in Malaysia (1) Administration Malaysia has more than a hundred ports designated by the Merchant Shipping Ordinance. Among them, only 20 ports can be said to be playing important roles. All the ports are under the control of the government (central or provincial), though ports in the Peninsula and Eastern Malaysia have different management schemes. The central government is responsible for six major ports, Klang, Penang, Johor, Tanjung Pelapas, Kuantang in western Malaysia and Bintulu in eastern Malaysia. These ports have an independent port authority directly responsible for operation. Additionally, the Ministry of Transportation controls 30 minor ports. Planning and fund raising for construction projects are taken care of by the relevant port authority. The authority needs the approval of the Ministry of Transport in case of private investment. It also has to obtain the approval of the Economic Planning Unit and the Ministry of Finance if a government subsidy is involved. (2) Container Throughput and Port Development Primary products and industrial products account for the rapid increase of the container throughput in Malaysian ports (Table 13.2.1). Responding to the demand growth, large-scale port development is underway in some ports. A new terminal complex started an operation at the West Port in Port Klang in 1996. New container berths were created in Port Penang in 1995 and further expanded in 1997. A new container hub port, Port of Tanjung Pelapas (PTP), started operations near Johor in 1998. PTP has become a threat to Singapore as an alternative container hub in Southeast Asia.

13-7
Table 13.2.1 Container Throughput in Malaysian Ports Port 1997 1998 1999 Remarks
Klang 1,684,513 1,819,958 2,550,419 Klang Container Terminal 993,014 788,703 938,924 Klang Port Management 578,628 570,916 810,439 West Port 112,871 460,339 801,056 Penang 506,863 510,307 566,409 Johor 429,448 439,661 558,056 Kuching 105,320 79,602 96,962 Kota Kinabalu 102,446 77,499 85,181 Kuantan 54,855 50,989 56,056 Rajang 40,009 28,032 37,100 Bintulu 32,571 29,536 36,541 Tawau 30,473 25,865 31,541 Tanjung Pelapas (PTP) - - 20,400 Opened in October 1999 Sandakan 21,749 18,881 19,949 Labuan 9,562 9,634 11,430 Miri 3,917 2,904 2,505
13.2.3 Port of Tanjung Pelapas (PTP) (1) Outline Development of PTP started in 1995 as a green field project with private sector participation (Figure 13.2.1). It began to operate in October 1998. AP Moller (Maersk-Sealand) acquired 30 % of the equity in August 2000. The remaining stake is owned by a Malaysian share holding company (Sea Port Terminal). PTP is one-hour drive from Singapore with an excellent highway access linking PTP with various destinations in Malaysia and Thailand. PTP finances all the costs involved in port development and procurement. Maersk provides terminal operating experts and job training for local employees. The total work force is about 900, 200 of which are in the administrative section. (2) Facilities
PTP boasts a state-of-the-art container terminal (Table 13.2.2). Since Maersk already occupies 4-4.5 berths of the total six berths, PTP has a plan to expand the terminal providing the draft of 17m, which will make PTP the deepest container hub in the region. Due to the topographical features, PTP is quite easy to expand, which is a major advantage. An inter-modal yard, the first of its kind in Southeast Asia, will become operational at the end of 2001.

13-8
Table 13.2.2 Container Terminal in PTP Terminal Existing Facilities Short-term Plan Expansion Plan
Number of Berths 6 3 Operator PTP PTP Draft (m) 15 17 Yard Handling RTG Gantries 14 (18 boxes across) 10 gantries will be
introduced in early 2002
Gantries will be 22 boxes across
Yard Cranes 36 (1 over 5) 6 RTGs will be introduced in early 2002
Yard Area (ha) 120 Storage Capacity (TEU) 110,000 Handling Capacity (TEU/year) 4-4.5 million
Source: PTP
(3) Terminal Operation PTP handled 418,000 TEUs in 2000 and 923,000 TEUs from Jan.-Jun. 2001. The throughput since the beginning of 2001 is expected to exceed 2 million TEUs in November. In the middle of 2001, PTP achieved around 200,000 TEUs/month and 40+ vessels/week. Transshipment makes up 95% of the throughput and Maersk’s cargo accounts for 91% of the total. With the productivity at 27-30 moves/hour/crane, PTP provides the most efficient handling service in South East Asia. On average, more than 2,000 TEUs are handled per vessel call taking 13-14 hours, which is equivalent to 150 TEUs/hour. Up to 6-7 cranes are deployed to cater for a container vessel. Mother- to-mother transshipment is sometimes carried out at PTP in order to make up for a delay in other ports, though it is not encouraged. Marshalling yard is made up of nine blocks with a stacking height of 5 tiers. Average dwelling time is 3-4 days and PTP offers a free storage time of 14 days (transshipment) and 5 days (local cargo). In order to deal with yard planning, ship planning, and container management, PTP adopted a renowned operation system, NAVIS. 13.2.4 Port Klang (1) Outline Port Klang is located 40 km to the west of Kuala Lumpur and serves as the main port of Malaysia. This port comprises three sub ports, South Port, North Port, and West Port, in order of establishment (Figure 13.2.2). Port Klang is served by highways and railways for cargo distribution. The North-South Expressway runs from Bukit Kayu Hitam at the Malaysia-Thai border to the Johor Causeway in the south, covering a distance of 900 kilometers. This Expressway along the western side of the peninsula together with the

13-9
Klang Valley Expressway and the Federal Highway Route 2, play an important role in the distribution of both import and export cargo between Port Klang and its hinterland. Keretapi Tanah Melayu Berhad (KTMB), a private railway company, operates a daily block train service between Port Klang and Penang and Bangkok. There is also a 6-day-a-week rail service between the Ipoh Cargo Terminal (an inland port in the northern state of Perak) and Port Klang. (2) Management Klang Port Authority (KPA), a government organization, is responsible for port administration including navigational safety, asset management, port promotion, and port planning. In accordance with the privatization policy of Malaysia, port operation has been privatized in Port Klang. Operation of the container terminals was privatized in 1986 and Klang Container Terminal (KCT) was established as an operating company. Conventional terminals were also privatized in 1992 and Klang Port Management (KPM) was established for their operation. KCT and KPM later merged and formed North Port Corporation. PNB, an investment arm of the government, holds 53% of its stake, while KPA owns 5.3% of the share. The local government and private investors hold the remainder. In 1994, Klang Multi-terminal was created in the Westport on a 30-year BOT scheme. Huchison, an international terminal operator, acquired 30% of the Westport’s equity at the end of 2000. (3) Facilities Port facilities are spread across the three sub ports of Klang. Among them, the Westport is equipped with the most modern facilities (Table 13.2.3). Three berths in the North Port are going to be converted to container berths and extension of the container quay is contemplated in the West Port.
Table 13.2.3 Container Facilities in Port Klang Facility KCT KPM Westport
Berths 4 6 5 Quay length (m) 1,079 1,313 1,600 Draft (m) 13.2 14 15 Quay cranes 12 12 11 Storage capacity (TEUs) 20,000 25,000 20,000 Ground slots (TEUs) 10,308 7,080 7,797 Annual capacity (million TEUs) 1.4 1.2 1.7
Source: Port Klang Authority

13-10
Table 13.2.4 Break Bulk Facilities in Port Klang Facility North Port (KPM) South Port (KPM) Westport
Berths 4 4 4 Quay length (m) 803.5 332.5 800 Draft (m) 12 10.5 15 Transit shed (m2) 20,471 3,555 9,630 Warehouse (m2) 7,990 32,530 18,198 Open storage (m2) 68,300 14,500 92,942
Source: Port Klang Authority
Table 13.2.5 Liquid Bulk Facilities in Port Klang Facility North Port (KPM) South Port (KPM) Westport
Berths 2 2 2 Quay length (m) 426 353.6 1,050 Draft (m) 11.5 10.5 13.6 Petroleum storage (kl) 100,000 - 942,221 Chemical storage (t) - 25,143 140,030
Source: Port Klang Authority
Table 13.2.6 Dry Bulk Facilities in Port Klang Facility North Port (KPM) South Port (KPM) Westport
Berths 2 2 4 Quay length (m) 426 167.7 935 Draft (m) 11.5 10 15 Covered storage (m2) 30,935 - 264,660 Open storage (m2) 12,356 - -
Source: Port Klang Authority
Table 13.2.7 Passenger Terminals in Port Klang Facility North Port (KPM) South Port (KPM) Berths 1 3
Quay length (m) 43 350 Draft (m) 11 11
Source: Port Klang Authority
(4) Operation Port Klang handled 3.2 million TEUs in 2000, 1.1 million TEUs of which were transshipment. Transportation between the port and hinterland is by railways (10-15 %) and trucking (85-90 %). 98 % of customs clearance is carried out through an EDI system. The North Port handles 70 % of the total container throughput of Port Klang and it is in competition with the West Port. Its productivity is 22-23 moves/crane/hour and the average dwelling time is 2-3 days. (5) Throughput
13-11
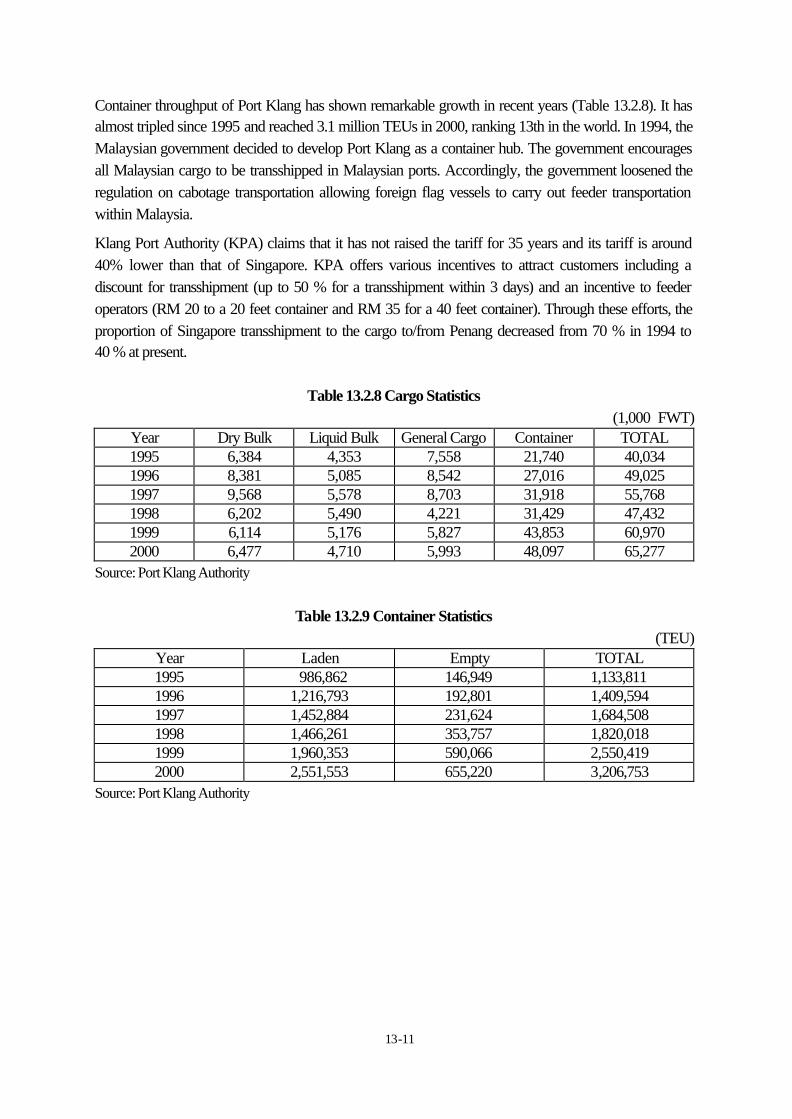
Container throughput of Port Klang has shown remarkable growth in recent years (Table 13.2.8). It has almost tripled since 1995 and reached 3.1 million TEUs in 2000, ranking 13th in the world. In 1994, the Malaysian government decided to develop Port Klang as a container hub. The government encourages all Malaysian cargo to be transshipped in Malaysian ports. Accordingly, the government loosened the regulation on cabotage transportation allowing foreign flag vessels to carry out feeder transportation within Malaysia. Klang Port Authority (KPA) claims that it has not raised the tariff for 35 years and its tariff is around 40% lower than that of Singapore. KPA offers various incentives to attract customers including a discount for transshipment (up to 50 % for a transshipment within 3 days) and an incentive to feeder operators (RM 20 to a 20 feet container and RM 35 for a 40 feet container). Through these efforts, the proportion of Singapore transshipment to the cargo to/from Penang decreased from 70 % in 1994 to 40 % at present.
Table 13.2.8 Cargo Statistics (1,000 FWT)
Year Dry Bulk Liquid Bulk General Cargo Container TOTAL 1995 6,384 4,353 7,558 21,740 40,034 1996 8,381 5,085 8,542 27,016 49,025 1997 9,568 5,578 8,703 31,918 55,768 1998 6,202 5,490 4,221 31,429 47,432 1999 6,114 5,176 5,827 43,853 60,970 2000 6,477 4,710 5,993 48,097 65,277
Source: Port Klang Authority
Table 13.2.9 Container Statistics (TEU)
Year Laden Empty TOTAL 1995 986,862 146,949 1,133,811 1996 1,216,793 192,801 1,409,594 1997 1,452,884 231,624 1,684,508 1998 1,466,261 353,757 1,820,018 1999 1,960,353 590,066 2,550,419 2000 2,551,553 655,220 3,206,753
Source: Port Klang Authority
13-12
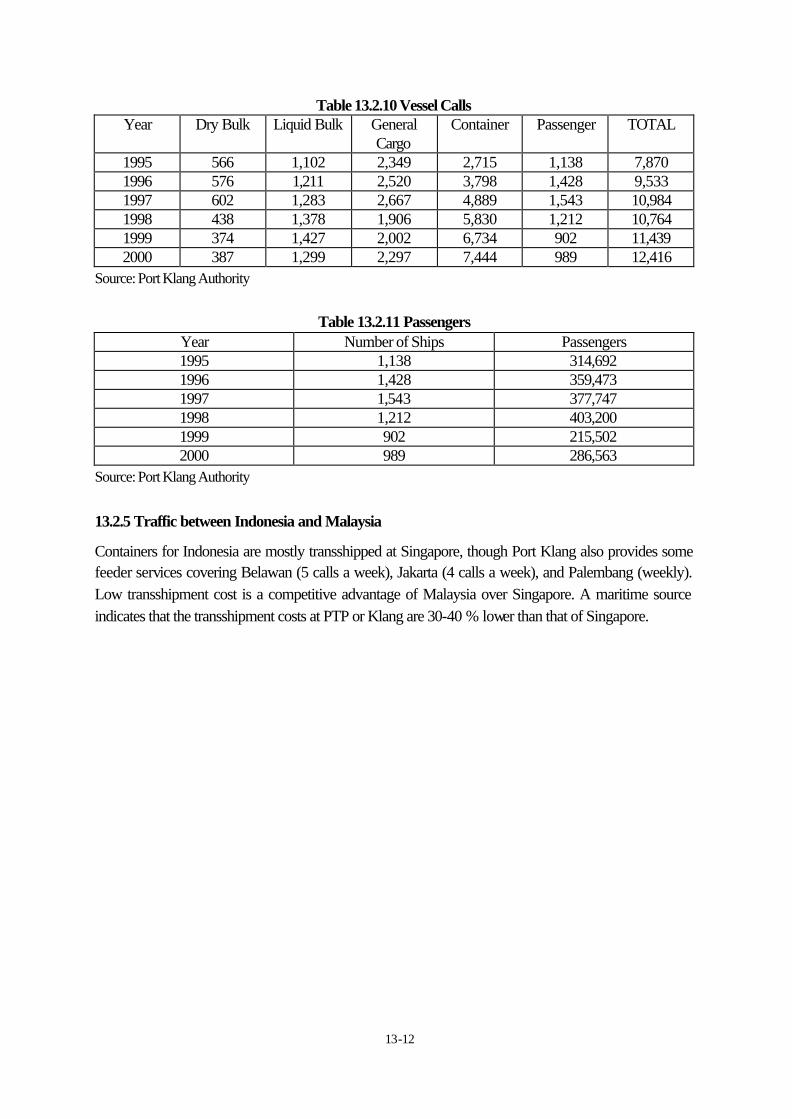
Table 13.2.10 Vessel Calls Year Dry Bulk Liquid Bulk General
Cargo Container Passenger TOTAL
1995 566 1,102 2,349 2,715 1,138 7,870 1996 576 1,211 2,520 3,798 1,428 9,533 1997 602 1,283 2,667 4,889 1,543 10,984 1998 438 1,378 1,906 5,830 1,212 10,764 1999 374 1,427 2,002 6,734 902 11,439 2000 387 1,299 2,297 7,444 989 12,416
Source: Port Klang Authority
Table 13.2.11 Passengers Year Number of Ships Passengers 1995 1,138 314,692 1996 1,428 359,473 1997 1,543 377,747 1998 1,212 403,200 1999 902 215,502 2000 989 286,563
Source: Port Klang Authority
13.2.5 Traffic between Indonesia and Malaysia Containers for Indonesia are mostly transshipped at Singapore, though Port Klang also provides some feeder services covering Belawan (5 calls a week), Jakarta (4 calls a week), and Palembang (weekly). Low transshipment cost is a competitive advantage of Malaysia over Singapore. A maritime source indicates that the transshipment costs at PTP or Klang are 30-40 % lower than that of Singapore.
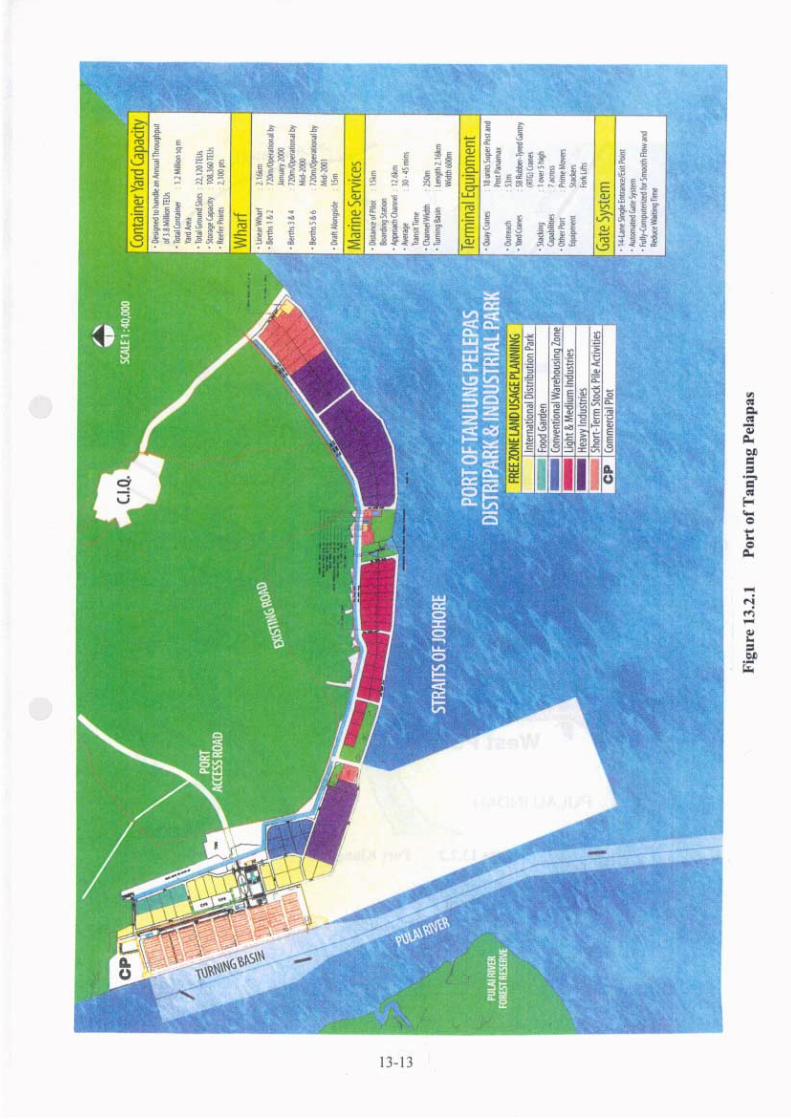

Figure 13.2.2 Port Klang
13-14
13-15
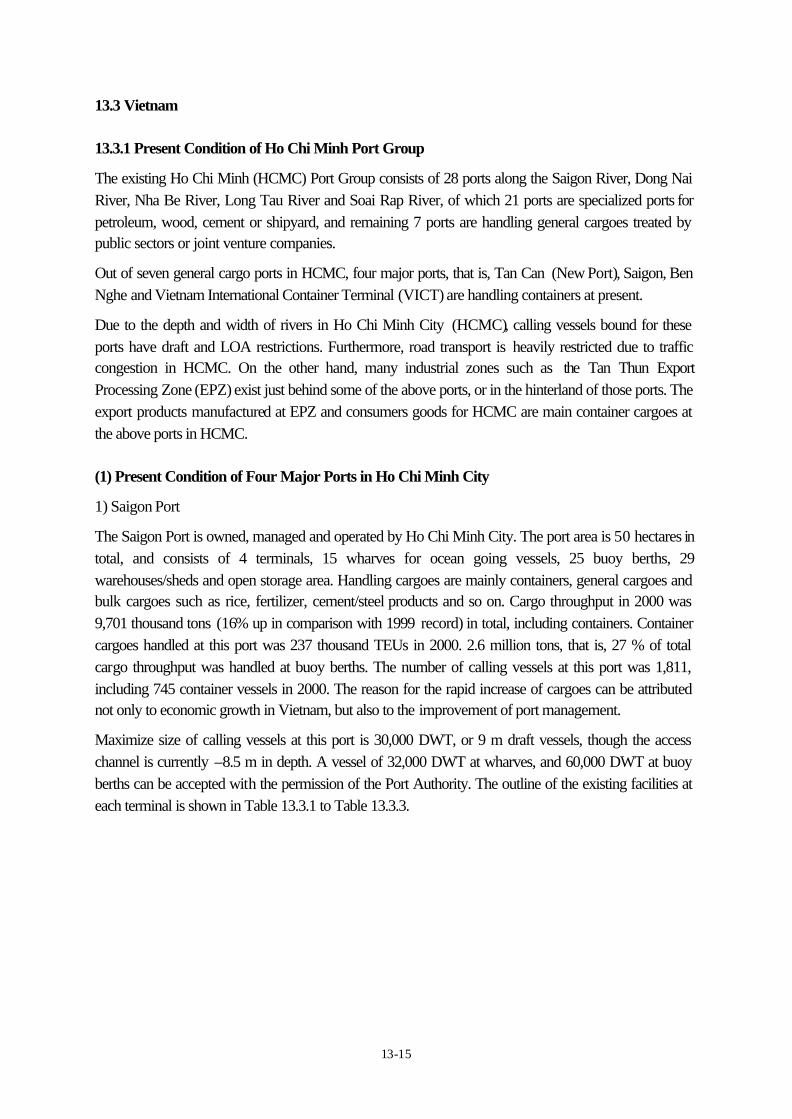
13.3 Vietnam 13.3.1 Present Condition of Ho Chi Minh Port Group The existing Ho Chi Minh (HCMC) Port Group consists of 28 ports along the Saigon River, Dong Nai River, Nha Be River, Long Tau River and Soai Rap River, of which 21 ports are specialized ports for petroleum, wood, cement or shipyard, and remaining 7 ports are handling general cargoes treated by public sectors or joint venture companies. Out of seven general cargo ports in HCMC, four major ports, that is, Tan Can (New Port), Saigon, Ben Nghe and Vietnam International Container Terminal (VICT) are handling containers at present. Due to the depth and width of rivers in Ho Chi Minh City (HCMC), calling vessels bound for these ports have draft and LOA restrictions. Furthermore, road transport is heavily restricted due to traffic congestion in HCMC. On the other hand, many industrial zones such as the Tan Thun Export Processing Zone (EPZ) exist just behind some of the above ports, or in the hinterland of those ports. The export products manufactured at EPZ and consumers goods for HCMC are main container cargoes at the above ports in HCMC. (1) Present Condition of Four Major Ports in Ho Chi Minh City 1) Saigon Port The Saigon Port is owned, managed and operated by Ho Chi Minh City. The port area is 50 hectares in total, and consists of 4 terminals, 15 wharves for ocean going vessels, 25 buoy berths, 29 warehouses/sheds and open storage area. Handling cargoes are mainly containers, general cargoes and bulk cargoes such as rice, fertilizer, cement/steel products and so on. Cargo throughput in 2000 was 9,701 thousand tons (16% up in comparison with 1999 record) in total, including containers. Container cargoes handled at this port was 237 thousand TEUs in 2000. 2.6 million tons, that is, 27 % of total cargo throughput was handled at buoy berths. The number of calling vessels at this port was 1,811, including 745 container vessels in 2000. The reason for the rapid increase of cargoes can be attributed not only to economic growth in Vietnam, but also to the improvement of port management. Maximize size of calling vessels at this port is 30,000 DWT, or 9 m draft vessels, though the access channel is currently –8.5 m in depth. A vessel of 32,000 DWT at wharves, and 60,000 DWT at buoy berths can be accepted with the permission of the Port Authority. The outline of the existing facilities at each terminal is shown in Table 13.3.1 to Table 13.3.3.

13-16
Table 13.3.1 Mooring Facility Terminal Berth Length Water Depth Cargo Handling Type
Nha Rong (5 Berths) 883 m 8.5 to 9.1 m General Cargo/Passenger
Khanh Hoi (5 Berths) 861 m 8.5 to 10.0 m General Cargo/Container
Tan Thuan (4 Berths) 713 m 9.6 to 11.0 m General Cargo/Container
Tan Thuan II (4 Berths) 485 m 2.5 to 10.5 m Bagged Cargo/Bulk
Buoy Berth (25 Berths) 4,591 m 3.3 to 13.5 m General Cargo/Container
Total (43 Berths) 7,533 m Max 13.0 m
Table 13.3.2 Storage Facility Terminal Shed CFS Open Storage Container Yard
Nha Rong 19,559 m2 30,891 m2 Khanh Hoi 28,168 m2 2,800 m2 13,845 m2 35,700 m2 Tan Thuan 7,760 m2 5,400 m2 81,600 m2
Tan Thuan II 6,480 m2 17,000 m2 Tan Thuan Inland
Depot 34,000 m2
Total 61,967 m2 8,200 m2 95,736 m2 117,300 m2
Table 13.3.3 Cargo Handling Equipment Equipment Capacity Nha Rong Khanh Hoi Tan Thuan Tan Thuan II
RTG 40 t 2 Mobile Crane 80 to 100 t 2 2 Mobile Crane 10 to 40 t 4 4 5 1 Crawler Crane 60, and 200 t 2 Rail Mounted Quay Crane 6 to 12.5 t 5 2
Reach Stacker 42 t 5 2 Reach Stacker 8 t 2
Fork Lift 10 to 40 t 2 6 8 Fork Lift 2.5 to 7 t 21 26 3
CFS Fork Lift 1.5 to 2.5 t 9 9 Tractor 20’ to 40’ 1 11 6
Dozer/Trimmer 2 13 10 Cargo Truck 12 t 34 Reefer Point 220 V 117 50 Weigh Bridge 60 t/ 80 t 2 2
Hopper for Bulk Cargo 10 m3 9

13-17
2) Ben Nghe Port The Ben Nghe Port is owned, managed and operated by Ho Chi Minh City (HCMC). There are four quays and seven buoy berths at the port. Total land area consists of 32.22 ha, of which the developed area is 22 ha. Maximum-sized vessel which can be accommodated to this port is 30,000 DWT with the draft of 10 m. The number of calling vessels was 670 in 2000. The general cargo stockyard of this port is currently being converted into container yard in order to cope with rapidly increasing container cargoes in HCMC. Cargo throughput in 2000 was 2,770 thousand tons, including 111 thousand TEUs of containers. About 30 % of the total cargo throughput was handled at buoy berths in 2000. The outline of the existing facilities at each berth is shown in Table 13.3.4 to Table 13.3.6.
Table 13.3.4 Mooring Facility Berth Length of Berth Water Depth Handling Cargo Objective Vessel K 14 88 m 7.5 m General Cargo 5,000 DWT K 15 265 m 9.0 m General Cargo 15,000 DWT
K 15 B 175 m 9.5 m Container 20,000 DWT K 15 C 288 m 10.5 m Container 30,000 DWT
Buoy Berth (11 Berths) 1,422 m 8.0 to 9.5 m General
Cargo/Bulk 9,000 to 30,000
DWT
Total 2,238 m Max 9.5 m Max 30,000 DWT
Table 13.3.5 Storage Facility
Storage Area Handling Cargo Shed (9 Shed) 10,800 m2 General Cargo Open Storage 145,000 m2 General Cargo/ Container Container Yard 51,000 m2 Container Reefer Container Yard 4,500 m2 Reefer Container
Total 211,000 m2
Table 13.3.6 Cargo Handling Equipment Equipment Capacity Number of Equipment
Mobile Crane 64 to 104 t 2 Mobile Crane 20 to 30 t 5 Reach Stacker/Top Lifter 42 t 4 Forklift 10 t 4 Forklift 2.5 to 3 t 8 Tractor/Trailer 10 to 30 t 10 Bagging System 500 t/h 4 Bagging System 250 t/h 6 Reefer Point 220 V 60 Weigh Bridge 60 t 1

13-18
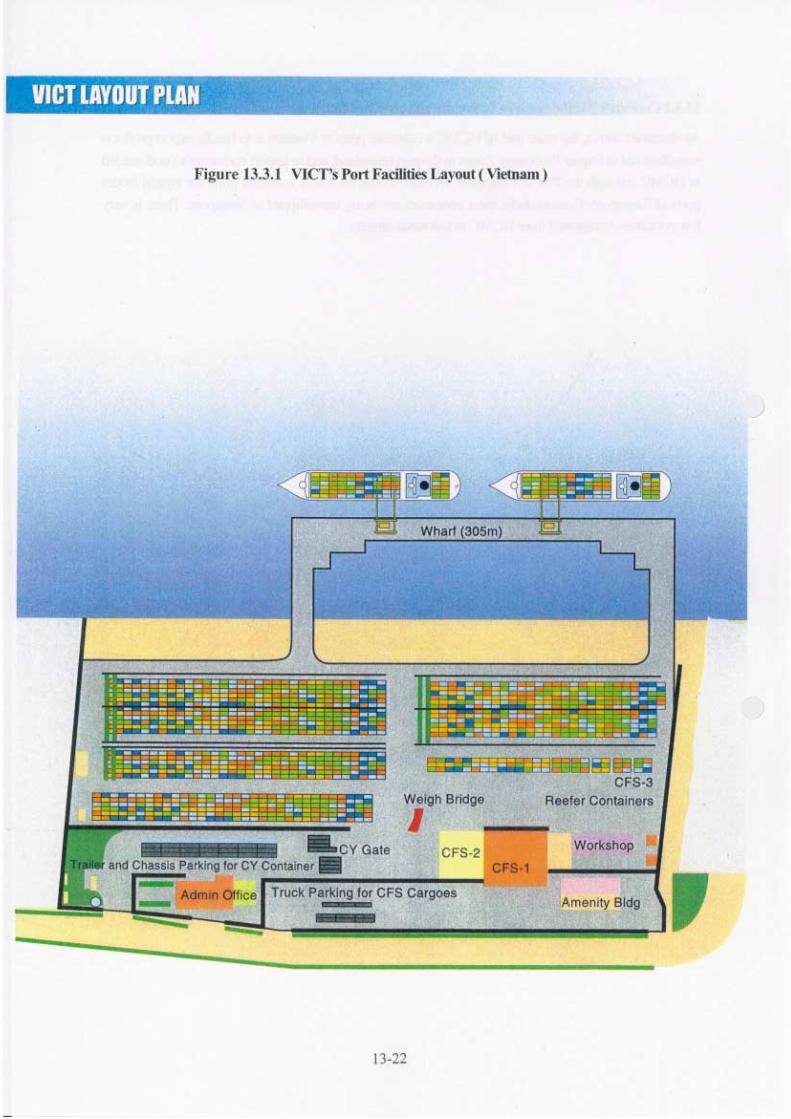
3) Vietnam International Container Terminal ( VICT ) Vietnam International Container Terminal (VICT) is owned, managed and operated by the joint venture company. VICT is the first true container terminal in Vietnam, having 12 ha ground area with 1,332 TEUs ground slots and 305 m pier with two Rail-mounted quayside container cranes and four Rubber-tired gantry cranes (RTGs). Container cargo throughput was 129, 852 TEUs in 2000. The number of calling vessels at this port was 460, including domestic container vessels and barges carrying containers between VICT and ICDs. The number of regular calling vessels to the port is scheduled as 12 vessels per week with ten shipping lines as of July 2001. Maximum size of calling container vessels at the port is 1,000 to 1,500 TEUs, 20,000 DWT, 200 m LOA, 28.7 m Beam, and 10.0 m draft. The outline of the existing facilities at each wharf is shown in Table 13.3.7 to Table 13.3.9. Vessel calling schedule to VICT is shown in Table 13.3.10, and the port facility layout is also described in Figure 13.3.1.
Table 13.3.7 Mooring Facility Berth Length of Berth Water Depth Handling Cargo Remarks
Present 2 Berths 305 m 10.0 m Container Max 200,000 TEUs
Future 5 Berths (Final Stage)
715 m 10.0 m Container Final Plan 600,000 TEUs
Table 13.3.8 Storage Facility
Storage Area CFS NO. 1 2,000 m2 CFS NO. 2 1,650 m2 Container Yard 80,000 m2 Administration Office 1,200 m2 Amenity Compound 820 m2 Maintenance Shop 740 m2
Total 86,410 m2
Table 13.3.9 Cargo Handling Equipment Equipment Capacity Number of Equipment
Rail-mounted Shore Gantry Crane 35.5 t 2 RTG 35 t 4 Reach Stacker 41 t 2 Side-lifter 8 t 2 CFS Forklift 2.5 t 8 Yard Tractor 40’ 10 Yard Chassis 40’ 16 Reefer Point 220 V 112 Weigh Bridge 80 t 1

13-20
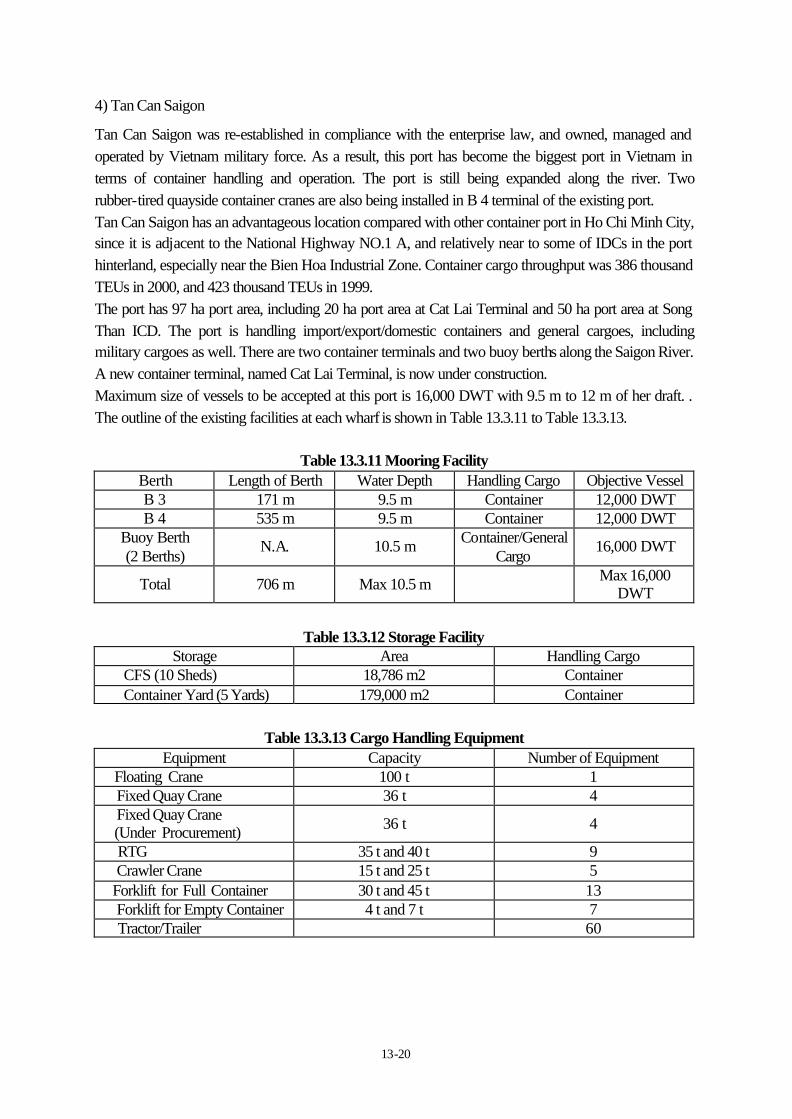
4) Tan Can Saigon Tan Can Saigon was re-established in compliance with the enterprise law, and owned, managed and operated by Vietnam military force. As a result, this port has become the biggest port in Vietnam in terms of container handling and operation. The port is still being expanded along the river. Two rubber-tired quayside container cranes are also being installed in B 4 terminal of the existing port. Tan Can Saigon has an advantageous location compared with other container port in Ho Chi Minh City, since it is adjacent to the National Highway NO.1 A, and relatively near to some of IDCs in the port hinterland, especially near the Bien Hoa Industrial Zone. Container cargo throughput was 386 thousand TEUs in 2000, and 423 thousand TEUs in 1999. The port has 97 ha port area, including 20 ha port area at Cat Lai Terminal and 50 ha port area at Song Than ICD. The port is handling import/export/domestic containers and general cargoes, including military cargoes as well. There are two container terminals and two buoy berths along the Saigon River. A new container terminal, named Cat Lai Terminal, is now under construction. Maximum size of vessels to be accepted at this port is 16,000 DWT with 9.5 m to 12 m of her draft. . The outline of the existing facilities at each wharf is shown in Table 13.3.11 to Table 13.3.13.
Table 13.3.11 Mooring Facility Berth Length of Berth Water Depth Handling Cargo Objective Vessel B 3 171 m 9.5 m Container 12,000 DWT B 4 535 m 9.5 m Container 12,000 DWT
Buoy Berth (2 Berths)
N.A. 10.5 m Container/General Cargo
16,000 DWT
Total 706 m Max 10.5 m Max 16,000 DWT
Table 13.3.12 Storage Facility
Storage Area Handling Cargo CFS (10 Sheds) 18,786 m2 Container Container Yard (5 Yards) 179,000 m2 Container
Table 13.3.13 Cargo Handling Equipment
Equipment Capacity Number of Equipment Floating Crane 100 t 1 Fixed Quay Crane 36 t 4 Fixed Quay Crane (Under Procurement) 36 t 4
RTG 35 t and 40 t 9 Crawler Crane 15 t and 25 t 5 Forklift for Full Container 30 t and 45 t 13 Forklift for Empty Container 4 t and 7 t 7 Tractor/Trailer 60
13-21
13.3.2 Container Traffic between Indonesia and Ho Chi Minh City As described above, the main role of HCMC’s container ports in Vietnam is to handle export products manufactured at Export Processing Zones in the port hinterland, and to import consumer’s good needed in HCMC, through the Port of Singapore. In other words, HCMC’s container ports are typical feeder ports of Singapore. Consequently, most containers are being transshipped at Singapore. There is very few containers transported from HCMC to Indonesia directly.
13-23
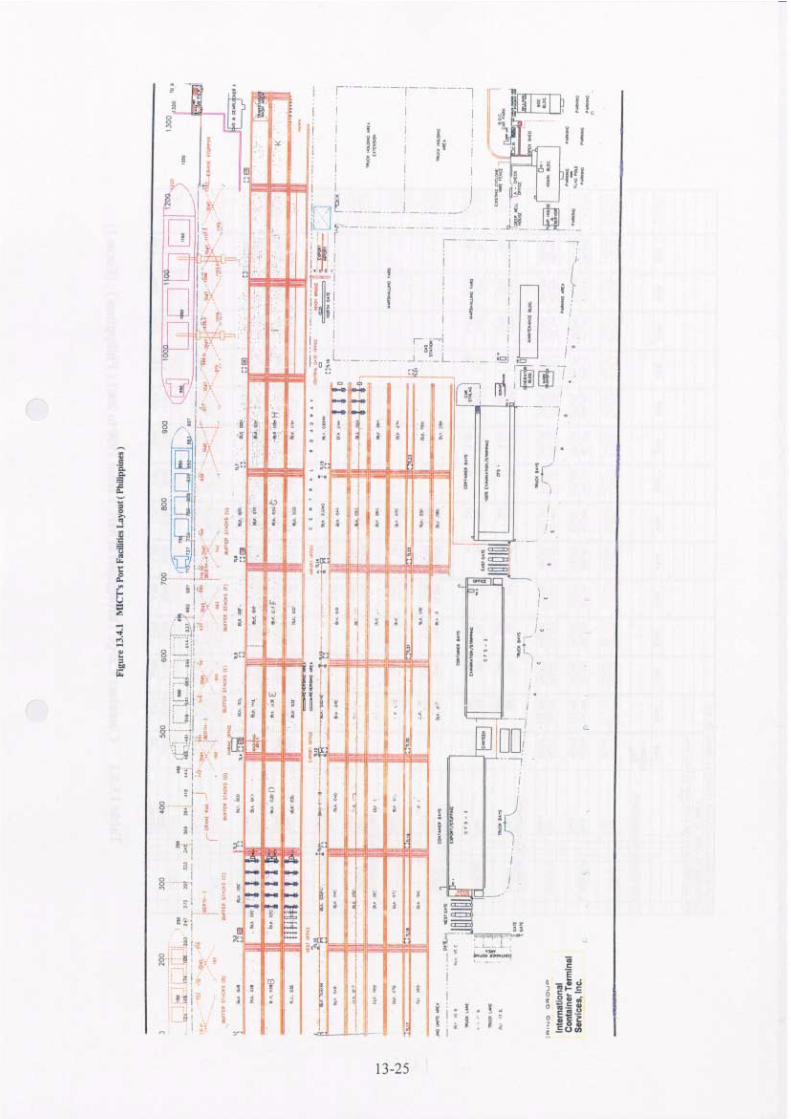
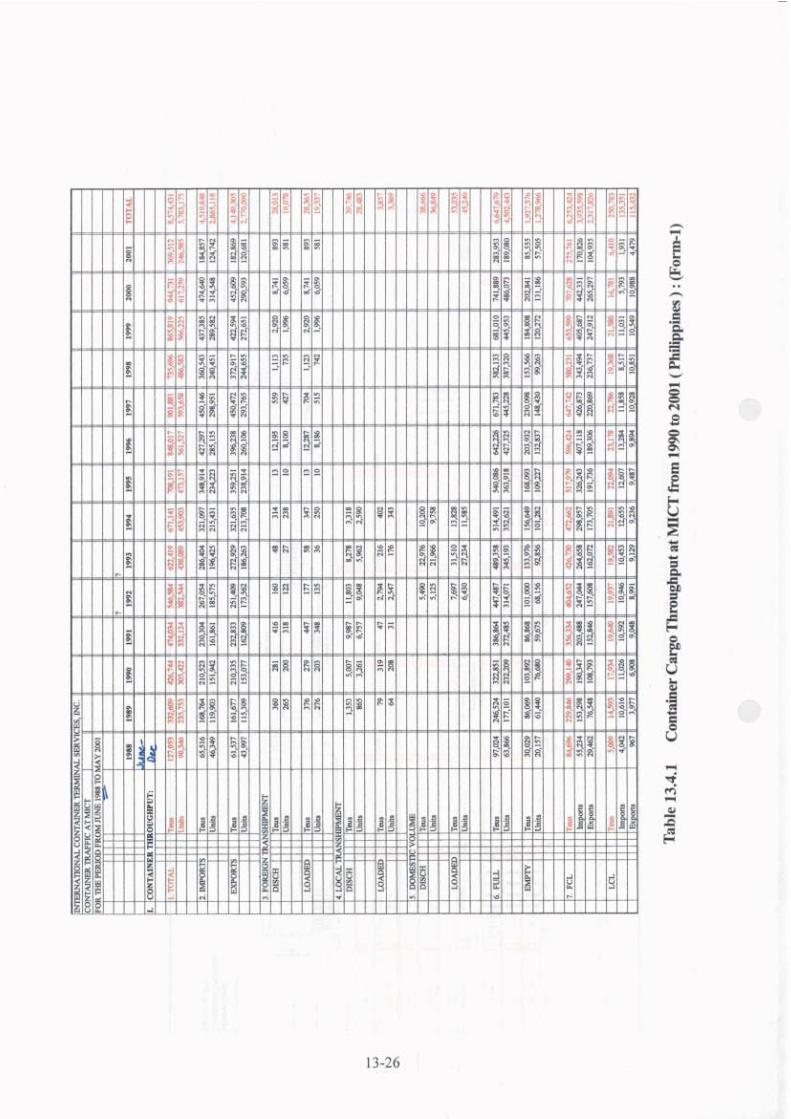
13.4 Philippines 13.4.1 Manila International Container Terminal Manila International Container Terminal (MICT) is a Philippine private company, involved in management, operation, and development of ports and terminals. MICT lies between the North Harbor and the South Harbor, protruding westward into the Bay of Manila. MICT has been operating since June 1988. MICT has continuous line container wharves with length of 1,300 m. MICT’s container wharves have 5 berths, whose water depth is 12.5 to 14.5 m. MICT terminal can take on five to six container vessels at any one time. The fairway channel has length of 2,000 m and width of 250 m. Today, MICT is the Philippines’ most modern and largest container terminal with annual handling capacity of 1.5 million TEUs. Annual container traffic growth has been averaging 12 per cent over the past five years. Container throughput averages 70,000 TEUs in a month, and MICT handles 60 per cent of all international containers passing through the Port of Manila. MICT’s main infrastructures and equipments are as follows: (1) Infrastructure - Container Wharf : 1,300 m, 5 Berths - Wharf Draft alongside : 12.5 m for Berth No.1 to No.4; 15 m for berth No.5 - Container Yard : 29 ha - CFS : 2 CFSs; Total Area of 18,723 m2 for Inbound Cargo. 1 CFS ; Total Area of 8,515 m2 for Outbound Cargo - Rail Marshalling Yard. : 1 Unit (2) Equipment - Mitsubishi Heavy Industries (MHI) Quay Cranes : 6 - Liebherr Quay Cranes : 3 - Gottwald Heavy-lift Mobile Crane : 1 - MHI Rubber-tired Gantry Cranes : 21 -Mitsui/Keppel Rubber-tired Gantry Cranes : 2 - Ottawa Prime Movers : 63 -Hino Prime Movers : 2 -Capacity Prime Movers : 6 -Forklift : 54 and so on.
13-24
13.4.2 Container Traffic between Indonesia and Manila The Port of Manila is one of main container feeder ports in Southeast Asia. The port has a strong feeder service connection between Manila and Taiwan, and between Manila and Hong Kong. Major cargo from Manila is export products manufactured at export processing zones in the greater Manila Metropolitan area. The port also imports foreign consumer’s goods needed in Manila by means of transshipment at Taiwan and Hong Kong. There are very few direct container transport service between Manila and Indonesia, because Indonesian ports are all located comparatively remote from the major container transport service routes between Asia and Europe, or between Asia and U.S.A. In general, container traffic between Indonesia and Manila will not play an important role in the South-east Asia for the time being. On the other hand, there are several container vessel services between Indonesia and Manila Tokyo Senpaku Kaisha has three container transport services between Japan and Indonesia through Hong Kong and Singapore. The “Pegasus Service” vessel calls at Manila, Singapore, Port Klang, Jakarta, Pasir Gudang. The “Southern Cross Service” vessel calls at Keelung, Hong Kong, Singapore, Jakarta, Port Klang. And the “Gemini Service” vessel calls at Keelung, Port Klang, Singapore, Jakarta, Surabaya, Hong Kong. The vessel size of those container services is 25,000 DWT ( 1,500 TEUs ), 180 m LOA, and 8-9 m draft. Main cargo for Indonesia is automobile parts, and main cargo from Indonesia is electric products manufactured in Indonesia. However, cargo volumes between Indonesia and Japan are not so large, and tend to slightly decrease in these days.


14-1
14. PORT AND CHANNEL MANAGEMENT OF INDONESIA 14.1 Outline In Indonesia, the Shipping Law (Law No.21/1992) separates ports into two groups, public ports and special ports. Public ports are managed by the central government (MOC) and public corporations (IPC). On the other hand, special ports are managed by the private sector. There are 2,293 ports in Indonesia of which 656 are public ports (including 110 commercial ports and 546 non-commercial ports) and 1,484 are special ports (including special wharves). Ports and channels are administrated according to the New Port Regulation (Government Regulation No.69/2001) and the Minister of Communication Decree (Keputusuan Menteri No.26/1998). 110 Commercial ports are operated by four port corporations (IPC). IPC is responsible for the planning, construction and management of the commercial ports. Since the central government owns the entire equity of I PC, I PC is still considered to be a part of the government. ADPEL (Port Administrator Office) and KANPEL (Port Administration Office), local branches of the Ministry of Communications, are in charge of safe navigation in ports and channels. In addition, KANPEL is responsible for port administration in non-commercial ports. Until the end of 2000, KANWIL had been functioning as a local branch office of the Ministry of Communications overseeing ADPEL and KANPEL. KANWIL has started to be transferred to the provincial government in line with the decentralization process since 2001. Port Working Area (water area and land area) and Port Interest Area (water area) are established in public ports to secure enough areas for port operation. The new Port Regulation (Government Regulation No.69/2001) requires the revision of these areas.

14-2
14.2 Current System of Ports and Channels Management (Government Regulation No.70/1996) The former management system of ports and channels in the commercial ports and non-commercial ports is summarized below.
Table 14.2.1 Current Port Management System of Commercial Ports (Government Regulation No.70/1996)
Responsible Party Central Government I PC
Local Government (Province and Municipality)
Private
< Basic Functions > Port Management (Commercial Activity) 〇
Port Management (Navigational Safety) 〇
<Responsibility for the Development of the Facilities > Navigational Aids 〇 <Port Facilities> Basins 〇 □ Access Channels ( inside the Port Working Area)
△ 〇 □
Channel(outside the Port Working Area) 〇 △ ※
(Musi River) Breakwater 〇 △ Wharf/ Loading Point △/〇 〇/△ P Port Road △/〇 〇/△ P <Support Facilities> Yard △/〇 〇/△ P Equipment △/〇 〇/△ P Warehouse △/〇 〇/△ P Tug △/〇 〇/△ P <Industrial Facilities> Business Area 〇 〇 P Industry Area 〇 〇 P
Note: 〇 Principal Responsible Party △ Secondary Responsible Party (providing subsidy or sharing costs) □ Port Charge ※ Voluntary Contribution P Private Sector Participation
14-3
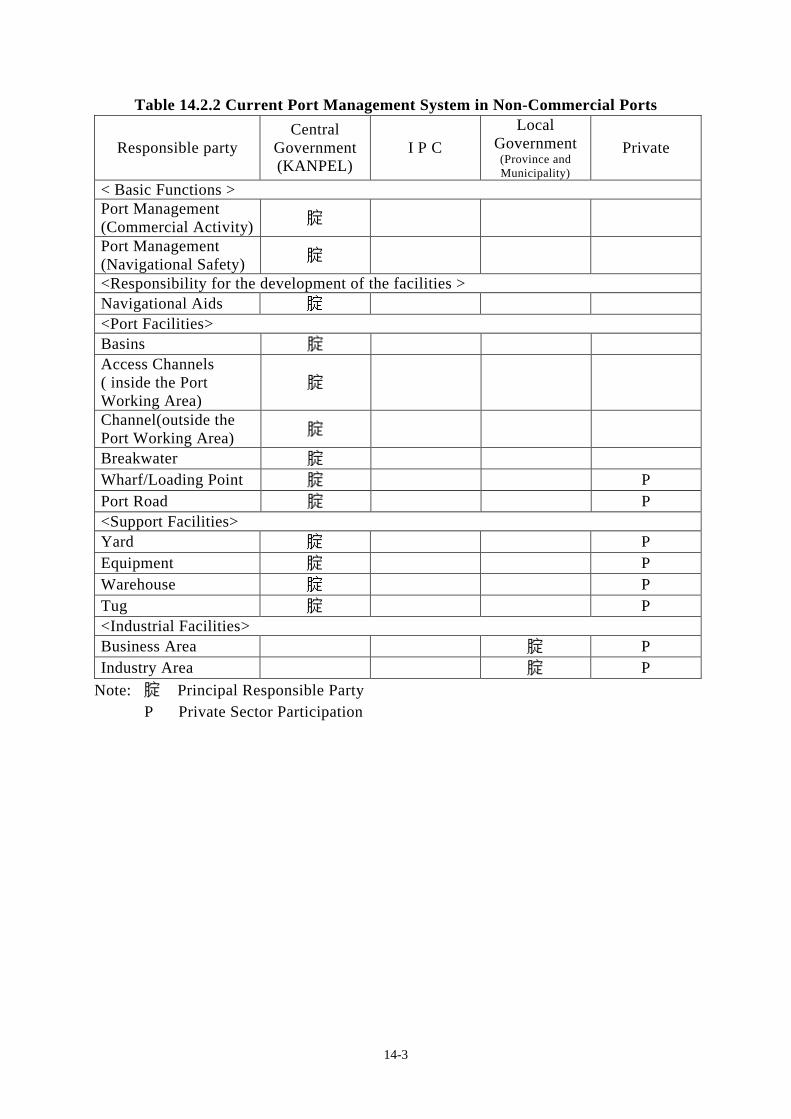
Table 14.2.2 Current Port Management System in Non-Commercial Ports
Responsible party Central
Government (KANPEL)
I P C Local
Government (Province and Municipality)
Private
< Basic Functions > Port Management (Commercial Activity) 〇
Port Management (Navigational Safety) 〇
<Responsibility for the development of the facilities > Navigational Aids 〇 <Port Facilities> Basins 〇 Access Channels ( inside the Port Working Area)
〇
Channel(outside the Port Working Area) 〇
Breakwater 〇 Wharf/Loading Point 〇 P Port Road 〇 P <Support Facilities> Yard 〇 P Equipment 〇 P Warehouse 〇 P Tug 〇 P <Industrial Facilities> Business Area 〇 P Industry Area 〇 P
Note: 〇 Principal Responsible Party P Private Sector Participation
14-4
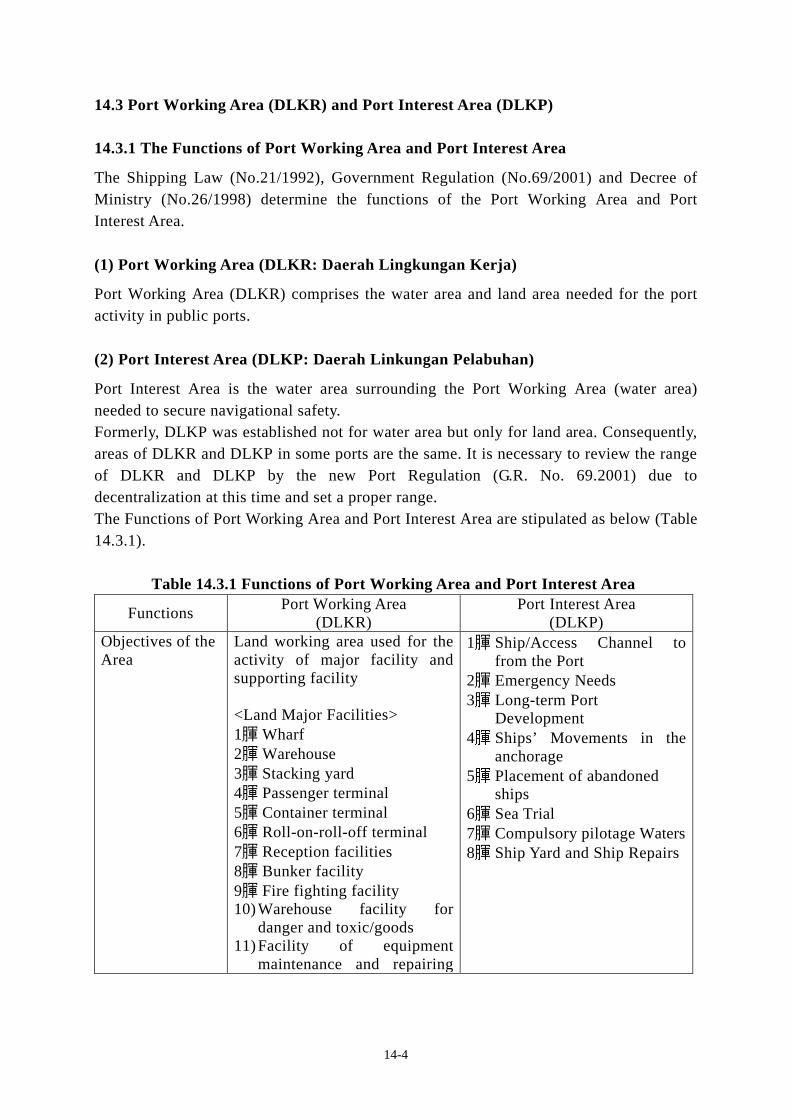
14.3 Port Working Area (DLKR) and Port Interest Area (DLKP) 14.3.1 The Functions of Port Working Area and Port Interest Area The Shipping Law (No.21/1992), Government Regulation (No.69/2001) and Decree of Ministry (No.26/1998) determine the functions of the Port Working Area and Port Interest Area. (1) Port Working Area (DLKR: Daerah Lingkungan Kerja) Port Working Area (DLKR) comprises the water area and land area needed for the port activity in public ports. (2) Port Interest Area (DLKP: Daerah Linkungan Pelabuhan) Port Interest Area is the water area surrounding the Port Working Area (water area) needed to secure navigational safety. Formerly, DLKP was established not for water area but only for land area. Consequently, areas of DLKR and DLKP in some ports are the same. It is necessary to review the range of DLKR and DLKP by the new Port Regulation (G.R. No. 69.2001) due to decentralization at this time and set a proper range. The Functions of Port Working Area and Port Interest Area are stipulated as below (Table 14.3.1).
Table 14.3.1 Functions of Port Working Area and Port Interest Area
Functions Port Working Area (DLKR)
Port Interest Area (DLKP)
Objectives of the Area
Land working area used for the activity of major facility and supporting facility <Land Major Facilities> 1) Wharf 2) Warehouse 3) Stacking yard 4) Passenger terminal 5) Container terminal 6) Roll-on-roll-off terminal 7) Reception facilities 8) Bunker facility 9) Fire fighting facility 10) Warehouse facility for
danger and toxic/goods 11) Facility of equipment
maintenance and repairing
1) Ship/Access Channel to from the Port
2) Emergency Needs 3) Long-term Port
Development 4) Ships’ Movements in the
anchorage 5) Placement of abandoned
ships 6) Sea Trial 7) Compulsory pilotage Waters 8) Ship Yard and Ship Repairs
14-5
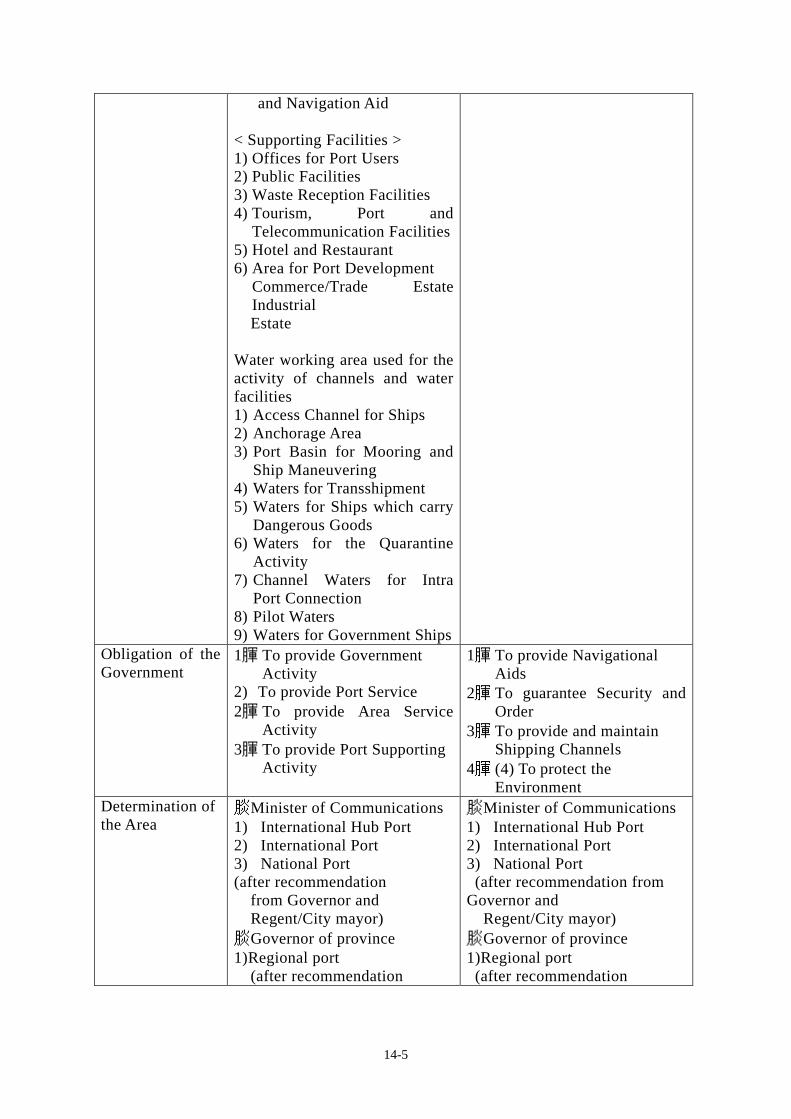
and Navigation Aid < Supporting Facilities > 1) Offices for Port Users 2) Public Facilities 3) Waste Reception Facilities 4) Tourism, Port and
Telecommunication Facilities 5) Hotel and Restaurant 6) Area for Port Development
Commerce/Trade Estate Industrial
Estate Water working area used for the activity of channels and water facilities 1) Access Channel for Ships 2) Anchorage Area 3) Port Basin for Mooring and
Ship Maneuvering 4) Waters for Transshipment 5) Waters for Ships which carry
Dangerous Goods 6) Waters for the Quarantine
Activity 7) Channel Waters for Intra
Port Connection 8) Pilot Waters 9) Waters for Government Ships
Obligation of the Government
1) To provide Government Activity
2) To provide Port Service 2) To provide Area Service
Activity 3) To provide Port Supporting
Activity
1) To provide Navigational Aids
2) To guarantee Security and Order
3) To provide and maintain Shipping Channels
4) (4) To protect the Environment
Determination of the Area
・Minister of Communications 1) International Hub Port 2) International Port 3) National Port (after recommendation from Governor and Regent/City mayor) ・Governor of province 1) Regional port (after recommendation
・Minister of Communications 1) International Hub Port 2) International Port 3) National Port (after recommendation from Governor and Regent/City mayor) ・Governor of province 1)Regional port (after recommendation
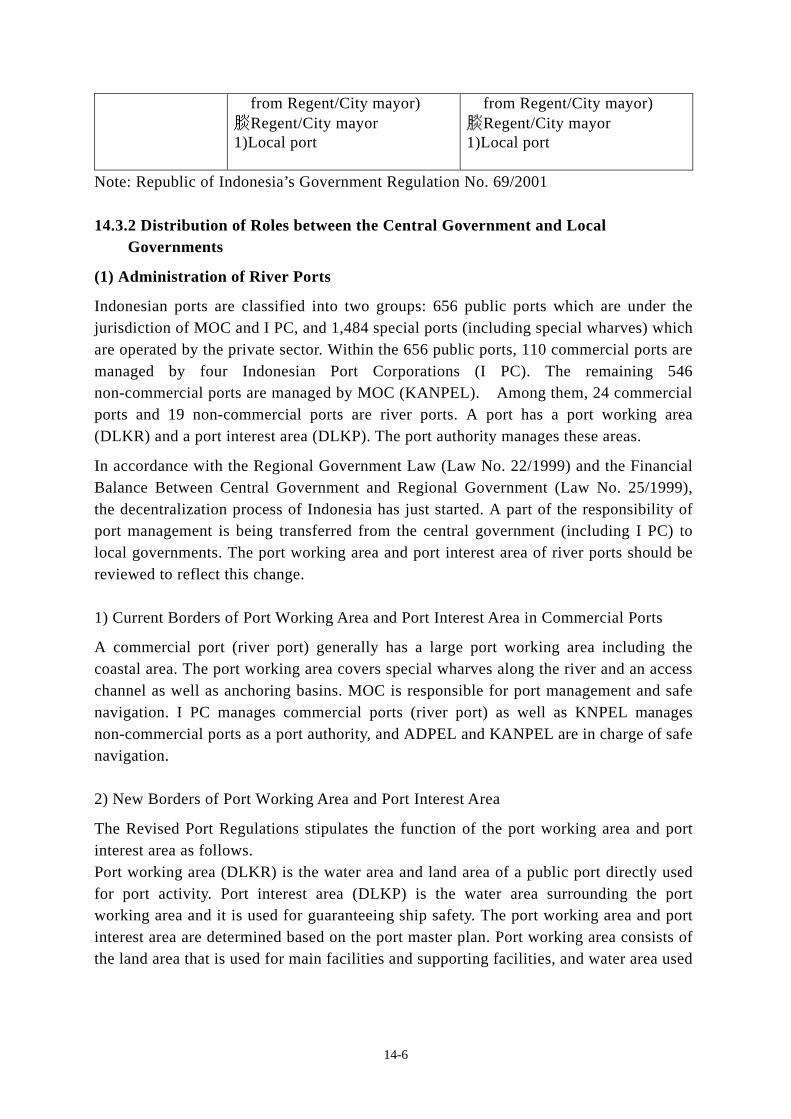
14-6
from Regent/City mayor) ・Regent/City mayor 1)Local port
from Regent/City mayor) ・Regent/City mayor 1)Local port
Note: Republic of Indonesia’s Government Regulation No. 69/2001 14.3.2 Distribution of Roles between the Central Government and Local Governments (1) Administration of River Ports Indonesian ports are classified into two groups: 656 public ports which are under the jurisdiction of MOC and I PC, and 1,484 special ports (including special wharves) which are operated by the private sector. Within the 656 public ports, 110 commercial ports are managed by four Indonesian Port Corporations (I PC). The remaining 546 non-commercial ports are managed by MOC (KANPEL). Among them, 24 commercial ports and 19 non-commercial ports are river ports. A port has a port working area (DLKR) and a port interest area (DLKP). The port authority manages these areas. In accordance with the Regional Government Law (Law No. 22/1999) and the Financial Balance Between Central Government and Regional Government (Law No. 25/1999), the decentralization process of Indonesia has just started. A part of the responsibility of port management is being transferred from the central government (including I PC) to local governments. The port working area and port interest area of river ports should be reviewed to reflect this change. 1) Current Borders of Port Working Area and Port Interest Area in Commercial Ports A commercial port (river port) generally has a large port working area including the coastal area. The port working area covers special wharves along the river and an access channel as well as anchoring basins. MOC is responsible for port management and safe navigation. I PC manages commercial ports (river port) as well as KNPEL manages non-commercial ports as a port authority, and ADPEL and KANPEL are in charge of safe navigation. 2) New Borders of Port Working Area and Port Interest Area The Revised Port Regulations stipulates the function of the port working area and port interest area as follows. Port working area (DLKR) is the water area and land area of a public port directly used for port activity. Port interest area (DLKP) is the water area surrounding the port working area and it is used for guaranteeing ship safety. The port working area and port interest area are determined based on the port master plan. Port working area consists of the land area that is used for main facilities and supporting facilities, and water area used

14-7
for an access channel, berthing area, transshipment area, port basin for mooring and ship maneuvering, pilotage activity, and ships repair. Port interest area consists of waters out of the port working area and it is used for an access channel to and from port, emergency needs, long term development, beached ship placing, trial run, pilot age activity, facility for development and maintenance of ship. 3) Management of Port Working Area and Port Interest Area The study team proposes the revision of the port working area and port interest area in each river ports. As follows: a. A port authority is responsible for the port working area covering the entire river channel to the river mouth. b. The central government is responsible for the port interest area covering the outer sea including the access channel and anchoring basin. The central government should take charge of this area due to the following reasons: a. Navigational safety is one of the most important areas of the marine transportation
sector. b. The central government will continue to be responsible for navigational safety after
decentralization. c. Navigational safety should be ensured across the nation in a uniform way. d. The central government of many developed countries manages access channels out of
the port basin on its own.

15-1
15. RESPONSE TO THE DECENTRALIZATION PROCESS IN INDONESIA 15.1 Ports and Marine Safety after the Decentralization 15.1.1 Ports after Decentralization The Regional Governments Law (Law No.22/1999), and the Financial Balance Between Central and Regional Government Law (Law No.25/1999) were enacted in April 1999 under the Habibi Administration. Distribution of roles between the central government and local government used to be governed by two other laws, the Local Administration Law (Law No.5/1974) and the Village Administration Law (Law No.5/1979), which were enacted under the Suharto Administration. The Regional Governments Law and the Financial Balance Between Central and Regional Government Law define the financial responsibility of the central government. The local government can no longer rely entirely on the central government for its development needs. Instead, initiatives of the local people are encouraged. There is a downside in the decentralization policy as well. Relatively rich local governments can promote development projects, while poor local governments cannot. The new laws clearly separate local administration from legislation. The method to elect the head of a local government was also changed. Financial decentralization is one of the major features of the new laws. According to these laws, local governments are entitled to the following sources of revenue: their own revenue, balance fund, and loan. DGSC started a review of the Port Regulation (Government Regulation No.70/1996) in February 2001. The following aspects were currently examined and after that the new Port Regulation (Government Regulation No.69/2001) was established in October 2001. As the decentralization process proceeds, the distribution of roles for port development changes as shown below.
15-2
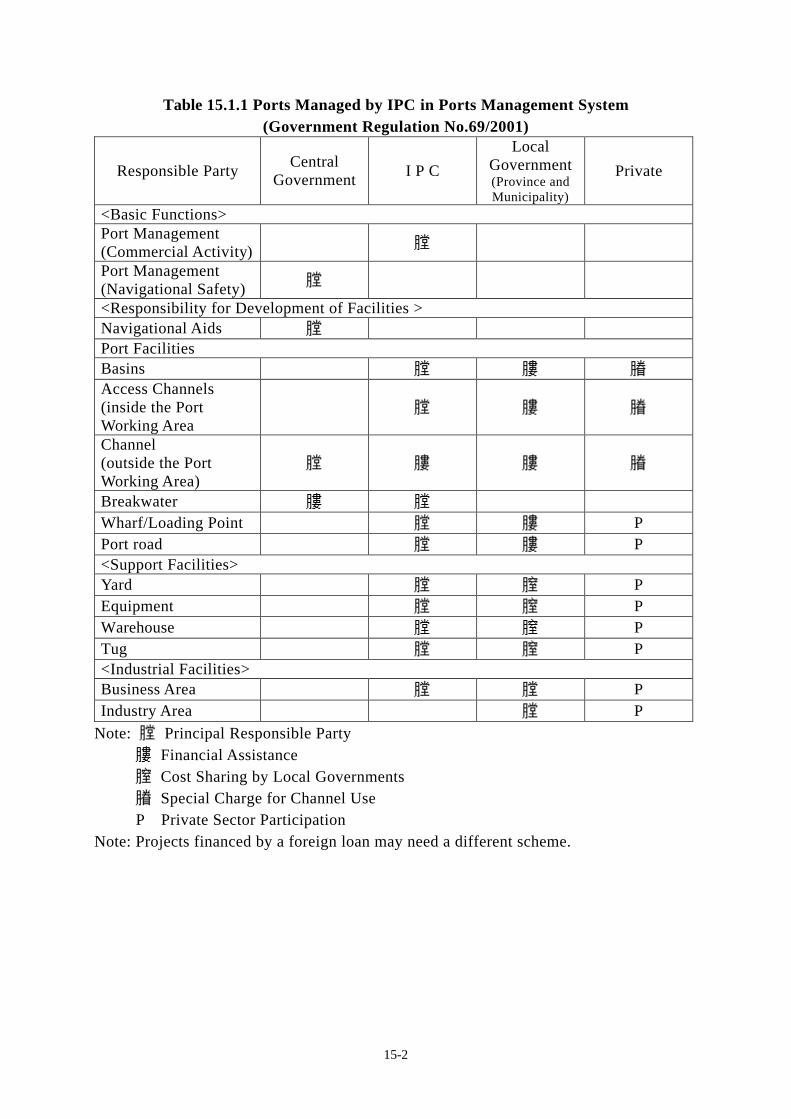
Table 15.1.1 Ports Managed by IPC in Ports Management System (Government Regulation No.69/2001)
Responsible Party Central Government I P C
Local Government (Province and Municipality)
Private
<Basic Functions> Port Management (Commercial Activity) ○
Port Management (Navigational Safety) ○
<Responsibility for Development of Facilities > Navigational Aids ○ Port Facilities Basins ○ △ ■ Access Channels (inside the Port Working Area
○ △ ■
Channel (outside the Port Working Area)
○ △ △ ■
Breakwater △ ○ Wharf/Loading Point ○ △ P Port road ○ △ P <Support Facilities> Yard ○ ▲ P Equipment ○ ▲ P Warehouse ○ ▲ P Tug ○ ▲ P <Industrial Facilities> Business Area ○ ○ P Industry Area ○ P
Note: ○ Principal Responsible Party △ Financial Assistance ▲ Cost Sharing by Local Governments ■ Special Charge for Channel Use P Private Sector Participation Note: Projects financed by a foreign loan may need a different scheme.

15-3
Table: 15.1.2 Ports Managed by Municipal Government in Ports Management System (Government Regulation No.69/2001)
Responsible party Central Government
Local Government (province)
Port Authority
(municipal) Private
<Basic Functions> Port Management (Commercial Activity) ○
Port Management (Navigational Safety) ○
<Responsibility for Development of Facilities > Navigational Aids ○ <Port Facilities> Basins △ ○ ■ Access Channels (inside the Port Working Area)
△ ○ ■
Channel (outside the Port Working Area)
〇 △ △ ■
Breakwater △ △ ○ Wharf/Loading Point △ ○ P Port Road △ ○ P <Support Facilities> Yard ○ P Equipment ○ P Warehouse ○ P Tug ○ P <Industrial Facilities> Business Area ○ ○ P Industry Area ○ ○ P
Note: ○ Principal Responsible Party △ Subsidy ■ Special Charge for Channel Use P Private Sector Participation Considering the importance of the shipping industry in Indonesia, it is necessary to establish a new burden-sharing scheme for port development and clearly define the role of the central government. A port consists of various facilities in water area and land area and functions as a synthesized organ. As the requirement for a port becomes more diversified and complex, the cost of port development gets higher and a wider variety of port facilities becomes necessary. Appropriate measures need to be taken to ensure the financial soundness of the

15-4
government (central and local) and the private sector as well as a fair distribution of the costs among the concerned parties.
Table 15.1.3 Port Development Scheme
Points to be examined Alternatives Others
Who should assume the financial burden of port development?
Central Government, Local Government, Port administrator or Private Sector
How should the port development costs be shared?
Central Government, Local Government and Port Administrator depending on Port Class
How should the port development costs be recovered?
Operational Revenue, Bond, Subsidy or Loan
How should the port facilities be used?
Common Use or Exclusive Use changes how with the Classification
Who should assume the financial burden of port maintenance?
Central Government, Local Government, Port Administrator or Private Sector
Central Government's Role in Port Management is as follows: 1) Policy formulation for the development and administration of nationwide ports and
harbors 2) Establishment of necessary laws and regulations 3) Providing advice and guidance on port administration and operation to port
management bodies 4) Authorizing development plans for major ports 5) Financial assistance for port management bodies in relation to port construction
projects 6) Implementation of port construction projects (projects under the direct control of the
central government) 7) Improvement and maintenance of shipping channels outside the port area 8) Establishment of technological standards for planning, design, and construction of
ports and harbors 9) Surveys and research concerning port technology 15.1.2 Marine Safety Administration in Indonesia The sea traffic and marine safety administration of Indonesia is managed by DGSC, MOC. The Directorate of Maritime-Safety & Seamanship of DGSC is responsible for marine safety implementing safety rules and standards and carrying out ship inspection. The Directorate of Guard & Rescue of DGSC is in charge of search and rescue in and out of ports. It is also responsible for marine disaster prevention and control of port

15-5
traffic. ADPEL (port administration office) and KANPEL (port office) are local offices of MOC and established as shown below.
Class ADPEL (DGSC direct control) ADPEL KANPEL
Class I 4
(Belawan, Tanjung Priok, Surabaya, Makassar)
Class II 5 1 Class III 14 8 Class IV 21 20 Class V 44 160
Total 4 84 189 ADPEL and KAPEL may be transferred to local governments in the near future in line with the decentralization process. The Directorate of Sea Transport & Traffic of DGSC has 82 boats to install navigation aids. It installs, operates, maintains and manages aids such as lighthouse and sea marine communication facilities. It is in charge of hydrographic survey within ports as well as in the coastal area. The Directorate of Navigation has 24 district offices (District Navigasi) and 217 marine communication stations around Indonesia. Port users based in Singapore and Malaysia are requesting that the procedures relative to marine safety should be simplified and expedited.

15-6
15.2 Channel Dredging Scheme after the Decentralization 15.2.1 Outline of Channel Dredging in Indonesia Indonesia has 34 river ports in the commercial ports throughout the country. In addition, there are also seaports that require maintenance dredging. For this reason, funds for dredging need to be secured every year. However, IPC finds that it difficult to secure enough funds for dredging due to the budgetary constraints of the central government. After IPC was established, IPC took over the responsibility about port administration and construction in commercial ports fundamentally. When the budget of IPC is not enough, the central government pays a part of the cost. According to the agreement between IPC IV and Private Companies in Samarinda port, 50% of the port charge should be allocated to the dredging expense. On one occasion, private companies along Musi River had agreed to assume a part of the dredging expense. RUKINDO, a government organization, is mainly responsible for the dredging in Indonesia. In order to keep RUKINDO operational, various issues need to be addressed, such as its large staff and old dredger fleet. 15.2.2 Cost Sharing Scheme for Maintenance Dredging Expenses As long as a river port is operational, siltation cannot be avoided. Maintaining the navigable draft is indispensable. The Indonesian government has had difficulty in securing the funds for dredging. Shipping companies and owners of special ports are greatly benefiting from river ports. The economic impacts of a port on the regional economy are substantial. Development of a river port should be carried out by a joint effort of the local community and port users. It is necessary to identify the zone where public management is required. In Samarinda, a new cost-sharing scheme is under study for dredging in fiscal 2001. 15.2 3 Channel Dredging Scheme for the Principal River Ports A careful study to determine a new cost-sharing scheme for channel dredging is required. 1) The outline of the channel of the principal river ports The outline of the channel of the principal river ports is as follows (Table 15.2.1).
15-7
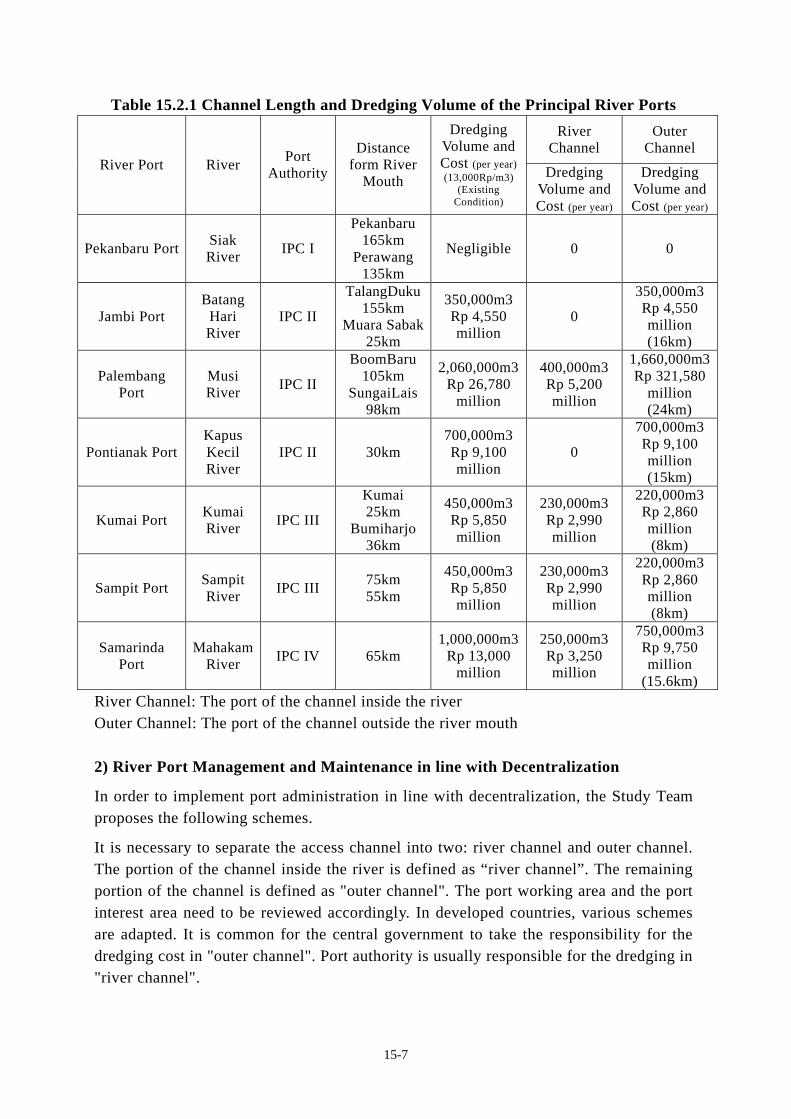
Table 15.2.1 Channel Length and Dredging Volume of the Principal River Ports
River Channel
Outer Channel
River Port River Port Authority
Distance form River
Mouth
Dredging Volume and Cost (per year) (13,000Rp/m3)
(Existing Condition)
Dredging Volume and Cost (per year)
Dredging Volume and Cost (per year)
Pekanbaru Port Siak River IPC I
Pekanbaru 165km
Perawang 135km
Negligible 0 0
Jambi Port Batang
Hari River
IPC II
TalangDuku 155km
Muara Sabak 25km
350,000m3 Rp 4,550 million
0
350,000m3 Rp 4,550 million (16km)
Palembang Port
Musi River IPC II
BoomBaru 105km
SungaiLais 98km
2,060,000m3 Rp 26,780
million
400,000m3 Rp 5,200 million
1,660,000m3 Rp 321,580
million (24km)
Pontianak Port Kapus Kecil River
IPC II 30km 700,000m3 Rp 9,100 million
0
700,000m3 Rp 9,100 million (15km)
Kumai Port Kumai River IPC III
Kumai 25km
Bumiharjo 36km
450,000m3 Rp 5,850 million
230,000m3 Rp 2,990 million
220,000m3 Rp 2,860 million (8km)
Sampit Port Sampit River IPC III 75km
55km
450,000m3 Rp 5,850 million
230,000m3 Rp 2,990 million
220,000m3 Rp 2,860 million (8km)
Samarinda Port
Mahakam River IPC IV 65km
1,000,000m3 Rp 13,000
million
250,000m3 Rp 3,250 million
750,000m3 Rp 9,750 million
(15.6km) River Channel: The port of the channel inside the river Outer Channel: The port of the channel outside the river mouth 2) River Port Management and Maintenance in line with Decentralization In order to implement port administration in line with decentralization, the Study Team proposes the following schemes. It is necessary to separate the access channel into two: river channel and outer channel. The portion of the channel inside the river is defined as “river channel”. The remaining portion of the channel is defined as "outer channel". The port working area and the port interest area need to be reviewed accordingly. In developed countries, various schemes are adapted. It is common for the central government to take the responsibility for the dredging cost in "outer channel". Port authority is usually responsible for the dredging in "river channel".

15-8
a. Case -1 The Port Authority (IPC) is responsible for the Entire Reach of the Channel. In this case, the port working area continues to be wide. IPC will pay the entire channel dredging costs, while receiving the revenue from the anchoring charge. Local governments might be requested to subsidize the dredging cost. They can give a subsidy within the budgetary limitation in order to realize the regional development.
Distribution of the Responsibility for Maintenance Dredging
Channel Management Revenue Dredging Cost
River Channel IPC (Port Authority) IPC IPC
Access Channel IPC (Port Authority) IPC IPC
b. Case-2 The Central Government is responsible for the "Outer Channel" and the Port Authority (I PC) is responsible for the "River Channel". In this case, the port working area is limited within the river reaching as far as the river mouth. The "River Channel" is managed by the port authority. Because the port working area is shorter, the maintenance dredging cost can be reduced. (*-1) IPC maintains authority over special ports in the river. (*-2) I PC may be assisted by local governments as mentioned in case 1. The central government is responsible for the management of the "Outer Channel" and the anchoring area to ensure safe navigation. The area covering the "Outer Channel" and the anchorage should be defined as the port interest area. Note: (*-1 and *-2)
Distribution of the Responsibility for Maintenance Dredging
Channel Management Revenue Dredging Cost
River Channel IPC (Port Authority) IPC IPC
Outer Channel Central Government
Central Government
Central Government
c. Case-3 The Central Government entrust the Port Authority with the Management of the "Outer Channel". In this case, port authority (IPC) manages the port interest area including the "Outer Channel" and anchoring area entrusted by the central government. A similar practice is under way in Japan. The central government constructs major port facilities and entrust the port authority with their management. The Team proposes this scheme for the managing of river ports.

15-9
The port working area is limited inside the river reaching as far as the river mouth. The river channels are managed by IPC. The dredging cost is comparatively small. (same as in -1) same. In addition, IPC can get the port charge for the "Outer Channel" and anchoring area. The dredging cost of the "Outer Channel" is shared by the central government and IPC though negotiation (same as in -2) same. It is also necessary to examine whether the existing port charges on special wharves should be revised.
Distribution of the Responsibility for Maintenance Dredging
Channel Owner Management Revenue Dredging Cost
River Channel IPC IPC (Port Authority)
IPC IPC
Outer Channel Central Government IPC IPC
IPC and Central
Government d. Case-4 Conceptual Cost Sharing Scheme for Maintenance Dredging in Jambi Port without Master Plan
Jambi Port
Parties concerned Current Scheme
(until 1998)
Provisional Scheme
(1999-2001)
Future Scheme (Draft) Note
River Channel Central Government
0 % (50%) 0 % 0 %
Port Authority IPC Ⅱ
100 % (50%) 100 % 50 ~80%
Local Government 0 % 0 % 10~40% ※ 1. Related Business Circles (beneficiaries) 0 % 0 % 5 % Beneficiary
Charge Calling vessels (greater than 105 GRT)
0 % 0% 5 % Channel Use Charge
Outer Channel 16km 350,000m3
Central Government 0 % (50%) 0% 50 %
Rp 2,275million
Port Authority IPC Ⅱ
100 % (50%) 100 % 50 %
Rp 2,275million
Note: Beneficiaries include the owners of special ports and vessels larger than 105t Note: ※ 1. Subsidy (within the budgetary limitation) from Province and Municipality Note: Currently, maintenance dredging is carried out only in the outer channel. e. Case 5) Conceptual Cost Sharing Scheme for Maintenance Dredging in Samarinda
15-10
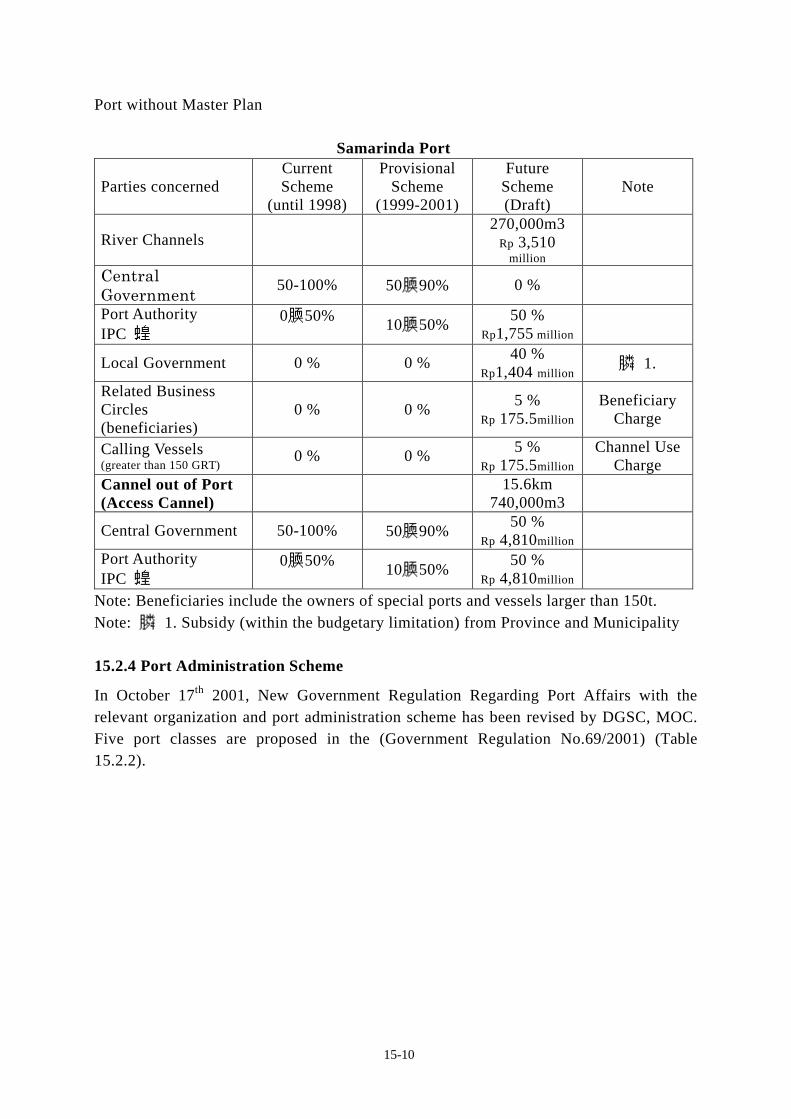
Port without Master Plan
Samarinda Port
Parties concerned Current Scheme
(until 1998)
Provisional Scheme
(1999-2001)
Future Scheme (Draft)
Note
River Channels 270,000m3
Rp 3,510 million
Central Government
50-100% 50‐90% 0 %
Port Authority IPC Ⅳ
0‐50%
10‐50% 50 % Rp1,755 million
Local Government 0 % 0 % 40 % Rp1,404 million ※ 1.
Related Business Circles (beneficiaries)
0 % 0 % 5 % Rp 175.5million
Beneficiary Charge
Calling Vessels (greater than 150 GRT)
0 % 0 % 5 % Rp 175.5million
Channel Use Charge
Cannel out of Port (Access Cannel) 15.6km
740,000m3
Central Government 50-100% 50‐90% 50 % Rp 4,810million
Port Authority IPC Ⅳ
0‐50%
10‐50% 50 % Rp 4,810million
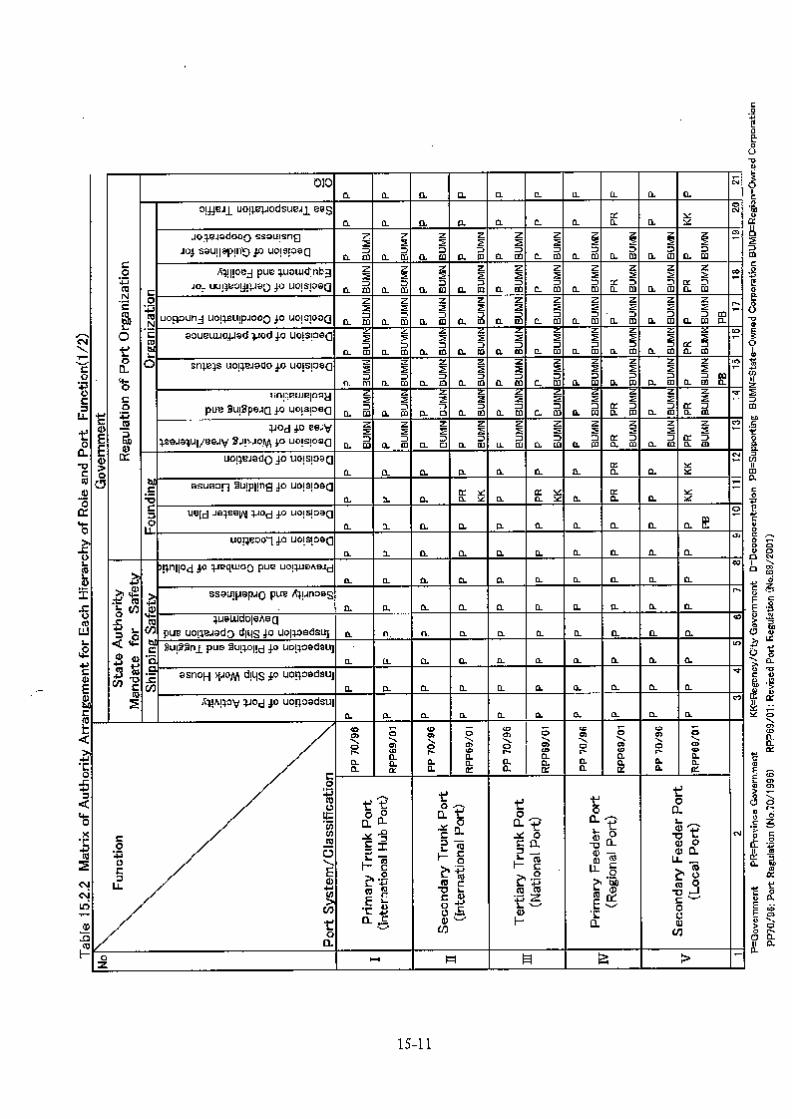
Note: Beneficiaries include the owners of special ports and vessels larger than 150t. Note: ※ 1. Subsidy (within the budgetary limitation) from Province and Municipality 15.2.4 Port Administration Scheme In October 17th 2001, New Government Regulation Regarding Port Affairs with the relevant organization and port administration scheme has been revised by DGSC, MOC. Five port classes are proposed in the (Government Regulation No.69/2001) (Table 15.2.2).


16-1
16.PORT AND CHANNEL MANAGEMENT SYSTEM IN FOREIGN COUNTRIES 16.1 Ports in Japan 16.1.1 Overview In Japan, the maintenance and administration of ports and harbors is governed mainly by the Port and Harbor Law (Law No.218/1950), the Law Concerning Dissolution of Port Development Authorities and Succession of Their Functions, and the Emergency Measures Law for Port and Harbor Development. In addition, activities carried out in ports and harbors must adhere to the following laws: • Immigration-Control and Refugee-Recognition Act (Ministry of Justice) • Quarantine Law (Ministry of Health, Labour and Welfare) • Plant Quarantine Law (Ministry of Health, Labour and Welfare) • Livestock Infectious Diseases Prevention Law (Ministry of Agriculture, Forestry,
and Fisheries) • Customs Law (Ministry of Finance) • Foreign Exchange and Foreign Trade Control Law (Ministry of Finance, Ministry
of Economy, Trade and Industry) • All laws related to the prevention of environmental pollution(Ministry of
Environment, Ministry of Land, Infrastructure and Transport) The Japanese government shoulders a portion of the cost for the development of port that significantly affect the national interest (specially designated major ports, major ports and harbors of refuge) based on the characteristics of the port and its benefits to the public. When a particular need is recognized and the national budget allows, the government may assist the port management bodies with the costs of port construction, in order to support the use by the general public. The Ministry of Land, Infrastructure and Transport also assists them when they issue local bonds for port development. The Japanese government takes some measures to promote private sector participation in port projects. The measures include tax incentives and concession loans.

16-2
Table 16.1.1 Port Facility Development System in Japan
Project Type of Facilities Financial Responsibility
Government Assistance
Development of Port Infrastructure
Breakwaters, Basins, Channels, Berthing Facilities, Port Roads,
Central Government or Local Government
Subsidy
Port Environment Improvement
Ecological Conservation Works Local Government Subsidy
Development of Port Superstructure
Cargo Handling Facilities (Warehouse, Cargo Handling Equipment, Marshalling Yards) Storage Facilities, Industrial Sites, Urban Redevelopment
Local Government Public Financing (Government Bonds)
Private Sector Projects
Passenger Terminals Offices, Museums
Private Sector Tax Incentives, Subsidy , Concession Loan

16-3
Table 16.1.2 Cost Sharing Scheme for Port Development in Japan
Breakwaters, Basins, Channels Berthing Facilities Port Roads
Specially designated Major Ports ( 22 ports )
Projects implemented by Central government
N .G 5.5 /10 M. B 4.5 /10 The central ( N.G 2/3 M.B 1/3 for facilities needed for deep-draft container terminals)
N. G 5.5 /10 M. B 4.5 /10 (N.G 2/3 M.B1/3 for reinforcement of deep draft containers terminals in the gateway ports
N. G 2 /3 M. B 1 /3
Projects by the central government
N. G 5 /10 M. B 5 /10 (N.G 4 /10 M.B 6/10 for minor facilities.)
N. G 5 /10
Major ports (106 ports ) Projects implemented by Central government
N. G 5.5 /10 M. B 4.5 /10
N. G 5.5 /10 M. B 4.5 /10
N. G 5.5 /10 M. B 4.5 /10
Projects subsidized by the central government
N. G 5 /10 M .B 5 /10 ( N.G. 4 /10, M.B 6/10 for minor facilities).
5 /10
Local ports (892 ports ) Projects subsidized by the central government
N. G 4 /10 M. B 6 /10
Shipping channels outside the port area Channels N. G 10 / 10
Note: As of 2000 Note: N.G.: National Government Note: M.B.: Port Management Body (mostly local government)

16-4
Table 16.1.3 Types of Ports and Harbors and Port Management Bodies in Japan (As of April 2001)
Port Management Bodies Classification Number Prefectures Municipal
ities Port authorities
Local government association for port management
Total Article 56 ports
Specially designated major ports
22 11 8 0 3 22 0
Major ports 106 86 17 1 2 106 0 Local ports (including harbors of refuge)
960 (35)
522 (29)
370 (6)
0 (0)
0 (0)
892 (35)
68 (0)
Total 1088 619 395 1 5 1020 68 Notes: Specially designated major ports: Port of paramount importance for the international marine
transport network.
The revision of the Port and Harbor Law in 2000 increased the central government's share for the construction of quay walls and shipping channels which concern the national interest. Conversely, its share for the construction of minor facilities was reduced. 16.1.2 Applicability to Indonesia Every port in the world has its port management body. In carrying out port development, port management bodies usually receive a subsidy from the government. Local communities and beneficiaries shoulder a part of the development costs as well. Public ports in Indonesia are managed by IPC. IPC receives a government subsidy in some ports but does not get a contribution from the local communities. Since port activity generates a large amount of economic benefits for the regional economy, it is quite reasonable to ask for a financial contribution to port development. In Indonesia, many port facilities have been developed by private companies such as special ports and special wharves. It would be worth encouraging private companies to form a cooperative to help develop efficient port facilities for specific cargo items such as timber, palm oil, and coal.

16-5
16.2 Present Conditions in Major Countries 16.2.1 Contribution of the Central Government toward Port Development The share of port infrastructure development cost (including shipping channels, navigation aids and break-waters) borne by the national government and port management authorities in Germany, the Netherlands, Belgium, France, the United States, and Great Britain is shown in the following table.
Table 16.2.1 Financial Scheme of Port Development in Major Countries Country Channel Navigation Aids Breakwater Berth, Dock,
Reclamation Germany Construction/Maintenance
Out of Port Area Inside Port Area CG: 100% CG: 0% PB: 0% PB: 100%
Construction/ Maintenance CG: 0% PB: 100%
Construction CG: 100% PB: 0%
Holland
Maintenance CG: 100% PB: 0%
Different by each Port
Construction/Maintenance CG: 0% PB: 100%
Construction CG: 100% PB: 0%
Construction CG: 100% PB: 0%
Construction CG: 60-100% PB: 40-0%
Belgium
Maintenance CG: 100% PB: 0%
Installation/Maintenance Out of Port Area CG: 100% PB: 0% Inside Port Area CG: 0% PB: 100%
Maintenance CG: 0% PB: 100%
Maintenance Sharing between Local Government &PB
Construction CG: 0% PB: 100%
United Kingdom
Maintenance CG: 0% PB: 100%
Installation/Maintenance Out of Port Area CG: 100% PB: 0% Inside Port Area CG: 0% PB: 100%
Construction/Maintenance CG: 0% PB: 100%
Construction/Maintenance CG: 0% PB: 100%
Construction CG: 80% PB: 20%
Construction CG: 80% PB: 20%
France
Maintenance CG: 100% PB: 0%
Installation Out of Port Area CG: 100% PB: 0% In Port Area CG: 60-80% PB: 40-20% Maintenance CG:100% PB: 0%
Maintenance CG: 100% PB: 0%
Construction/Maintenance CG: 0% PB: 100%

16-6
Construction Out of Port Area CG: 80-40% PB: 20-60% In Port Area CG: 0% PB: 100%
U.S.
Maintenance Out of Port Area CG: 100% PB: 0% In Port Area CG: 0% PB: 100%
Installation/Maintenance CG: 100% PB: 0%
Construction/Maintenance CG: 0% PB: 0%
Different by each Part
Source: ESPO Fact Finding Report 1996
Note: CG: Central Government, PB: Port Management
16.2.2 Applicability to Indonesia Port users are requested to bear a part of the channel dredging costs in most countries. It would be worth introducing a new cost-sharing scheme in Indonesia as well, asking port users and local communities for a fair financial contribution.

16-7
16.3. River Administration in Japan 16.3.1 Japanese System (1) Outline The River Law (law No.167/1964), the basic law for the management and administration of rivers, stipulates that rivers be managed by river management bodies. All of the Japanese rivers are managed by the national government or the local government (metropolitan, prefecture, etc.). A river needs to be managed with the entire catchment area taken into consideration. Japanese rivers are classified into two, the 1st class rivers (managed by the national government), and the 2nd class rivers (managed by local government). Japan's river maintenance has been carried out mainly as a mitigation measure against floods and drought. Recently, rivers are expected to have a wider range of functions, such as habitats and an area for recreation. It is becoming important for the government to achieve various policy goals regarding the river administration. The cost sharing system is shown below.
Table 16.3.1 Cost Sharing for River Maintenance in Japan The 1st Class Rivers Matters
Central Gov. Section Local Gov. Section The 2nd Class
Rivers
Ordinary River Maintenance
C.G. 2/3 L.G. 1/3
C.G. 1/2 L.G. 1/2
C.G. 1/2 L.G. 1/2
Urban River Maintenance
C.G. 1/3 L.G. 1/3
City 1/3
C.G 1/3 L.G 1/3 City 1/3
C. G 1/3 L. G 1/3 City 1/3
Note: C.G.: Central Government Note: L.G.: Metropolitan and Prefectural Government
Table 16.3.2 Cost Sharing for River Environment Improvement in Japan The 1st Class Rivers Matters
Central Gov. Section Local Gov. Section The 2nd Class
Rivers
Ordinary River Environmental Improvement
C.G. 1/2 L.G. 1/2
C.G. 1/3 L.G. 2/3
C.G. 1/3 L.G. 2/3
Urban River Environmental Maintenance
C.G.1/3 L.G. 1/3 City 1/3
C.G. 1/3 L.G. 1/3 City 1/3
C.G.1/3, L.G. 1/3 City 1/3
Note: C.G.: Central Government. Note: L.G.: Metropolitan and Prefectural government. (2) River Administration

16-8
River management bodies have the following authorities. Actually, a large portion of the authority is assumed by municipal governments.
Table 16.3.3 Authority of River Management 1) River Zone Establishment 2) Storage of River Data 3) Formulation of River Management Principles 4) Formulation of River Management Plan 5) Permission of the Use of River Water 6) Permission of the Use of Land 7) Permission of the Building of a New Structure 8) Permission of the Land Excavation
Table 16.3.4 Authority Assumed by Municipal Governments
1) Consultation on the Creation of a Structure 2) Enforcement of a River Condition Recovery 3) Supplementary Construction Works 4) Compensation of the Loss accompanying Construction 5) Request for a Payment to an Accountable Party 6) Request for a Payment by a Beneficiary 7) Burden Command of the Expense which – Incidental Construction takes 8) Compulsory Collection 9) Entry for Investigation and Construction
(3) River Transportation River Transportation used to be an important transportation means of goods and people in Japan. It requires renewed attention as a means to alleviate traffic congestion and to promote tourism. It is indispensable to establish a fundamental principle to prevent damage in river structures and to coordinate various uses of rivers. Japanese government enacted an ordinance based on the River Law, which stipulates the rules for vessel navigation. 16.3.2 Applicability to Indonesia Major rivers in Indonesia play an important role as a traffic infrastructure, assuming a wider range of roles than the rivers in Japan. On the other hand, there is no established river administration system in Indonesia. It is expected that more activities will be carried out in the rivers in Indonesia, such as installation of structure, private use of the water surface, implementation of construction works, and water supply. Therefore, it is necessary to build a river administration system covering various functions. Since DGSC has the authority over river traffic, it needs to exercise leadership in coordinating the use of rivers.

16-9
16.4 Marine Safety Administration in Japan 16.4.1 Japanese System Japan has the Sea Traffic Safety Law (Law No.115/July, 1972), Port Regulation Law ( Law No.174/July, 1948) and Sea Collision Prevention Law (Law No.62/June, 1977) to secure the safety of vessel traffic. Sea Collision Prevention Law was enacted to ratify an international convention. (1) Sea Traffic Safety Law (Law No.115/July 3, 1972) in Japan To achieve the safety of ship traffic, the Sea Traffic Safety Law is enacted as a special law of the Sea Collision Prevention Law to cover three areas (Tokyo Bay, Ise Bay and Seto Inland). Sea navigation channels are established in areas where sea traffic is badly congested including Uraga channel. (2) Port Regulation Law (Law No.174/July 15, 1948) in Japan Port Regulation Law is enacted to achieve the safety of ship traffic and the orderly use of the port area. It is a special law of the Sea Collision Prevention Law. Port Regulation Law covers the ports, which have a great number of vessel calls. It regulates construction works and fishing activities within the port area. 501 ports are covered by this law as of July 2000. In addition, 86 ports are specified as a special port and managed by a harbormaster as of July 2000. In these ports, this law designates anchorage areas and regulates night port calls. This law has a nature of police regulations, requiring a fair and equal treatment to all vessels. (3) Marine Safety System Maritime Safety Agency is one of the branch organizations of the Ministry of Land Infrastructure and Transport. It has 11 Regional Maritime Safety Headquarters. This agency is in charge of the following: maintaining security, securing traffic safety, preventing a disaster and preserving marine environment.
Work Force of the Maritime Safety Agency (as of March 2000)
Number of Officials
Total 12,247
Head Office 1,654
Subtotal Seaborne and Airborne Land-based Local Office
10,593 6,199 4,394
16-10
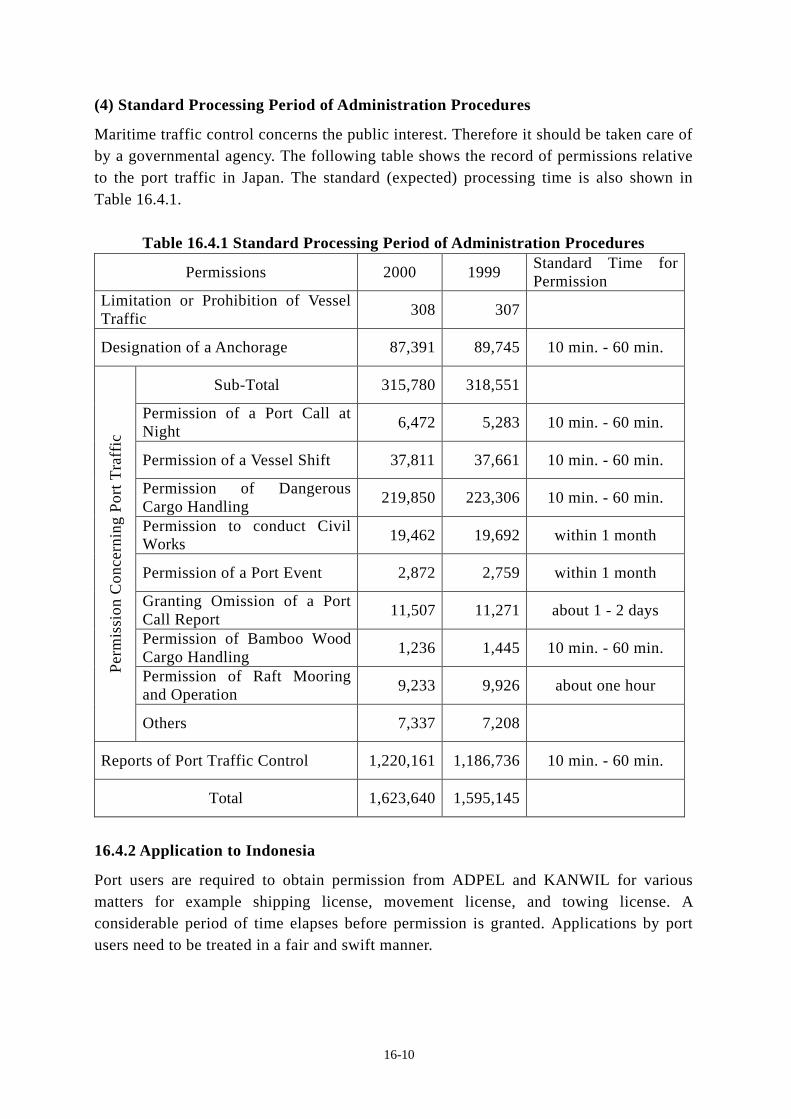
(4) Standard Processing Period of Administration Procedures Maritime traffic control concerns the public interest. Therefore it should be taken care of by a governmental agency. The following table shows the record of permissions relative to the port traffic in Japan. The standard (expected) processing time is also shown in Table 16.4.1.
Table 16.4.1 Standard Processing Period of Administration Procedures
Permissions 2000 1999 Standard Time for Permission
Limitation or Prohibition of Vessel Traffic 308 307
Designation of a Anchorage 87,391 89,745 10 min. - 60 min.
Sub-Total 315,780 318,551
Permission of a Port Call at Night 6,472 5,283 10 min. - 60 min.
Permission of a Vessel Shift 37,811 37,661 10 min. - 60 min.
Permission of Dangerous Cargo Handling 219,850 223,306 10 min. - 60 min.
Permission to conduct Civil Works 19,462 19,692 within 1 month
Permission of a Port Event 2,872 2,759 within 1 month
Granting Omission of a Port Call Report 11,507 11,271 about 1 - 2 days
Permission of Bamboo Wood Cargo Handling 1,236 1,445 10 min. - 60 min.
Permission of Raft Mooring and Operation 9,233 9,926 about one hour
Perm
issi
on C
once
rnin
g Po
rt T
raff
ic
Others 7,337 7,208
Reports of Port Traffic Control 1,220,161 1,186,736 10 min. - 60 min.
Total 1,623,640 1,595,145
16.4.2 Application to Indonesia Port users are required to obtain permission from ADPEL and KANWIL for various matters for example shipping license, movement license, and towing license. A considerable period of time elapses before permission is granted. Applications by port users need to be treated in a fair and swift manner.