10 key long term trends in the maritime business
TRANSCRIPT


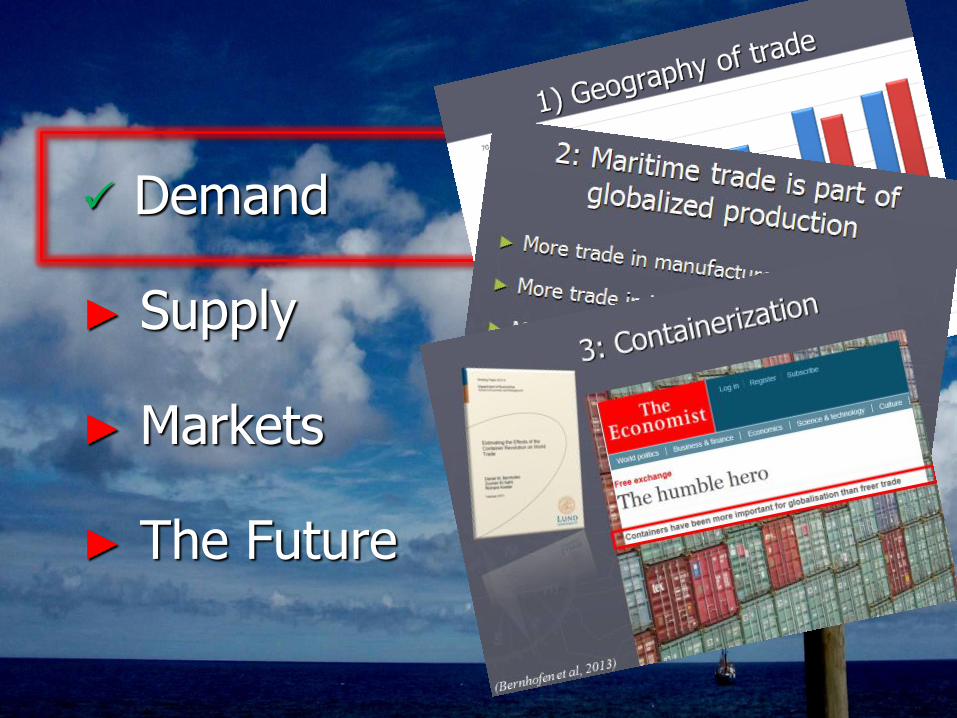
► Demand
► Supply
► Markets
► The Future

► Demand
► Supply
► Markets
► The Future
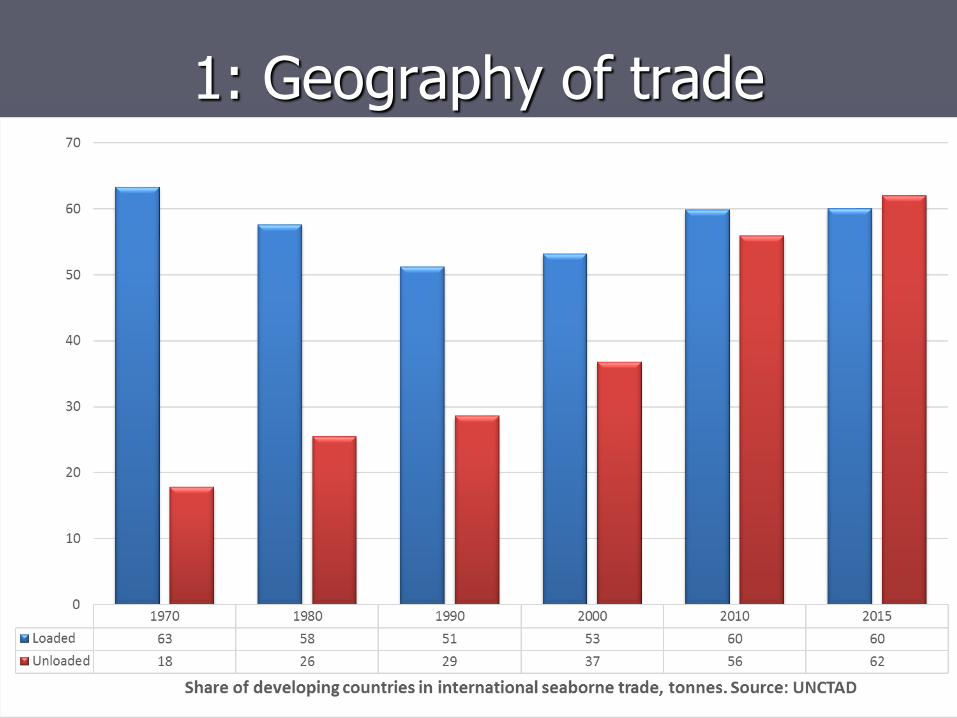
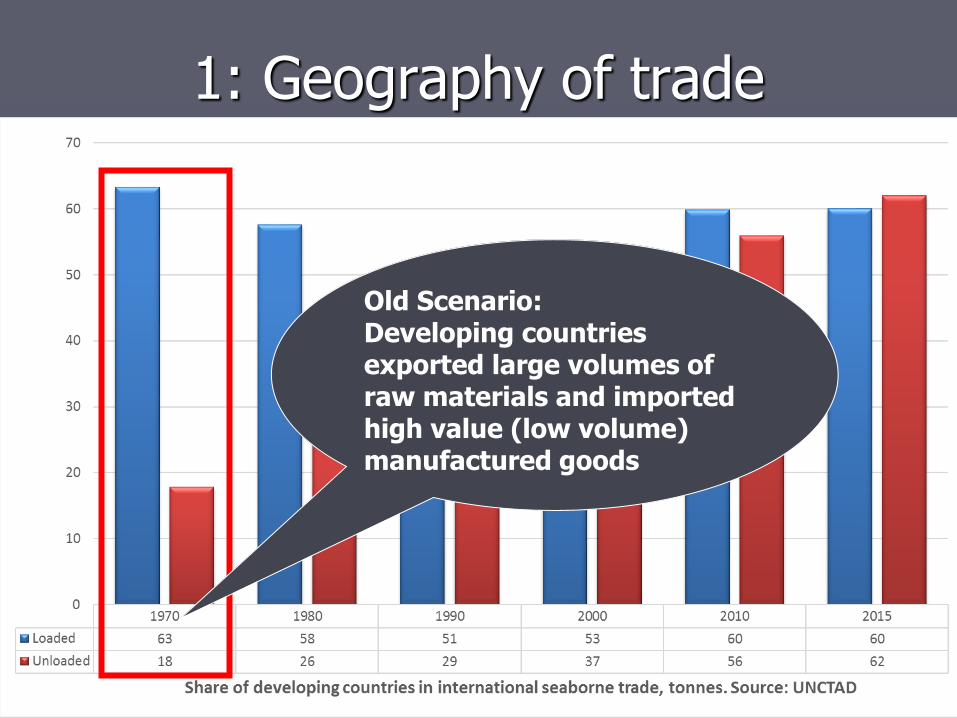
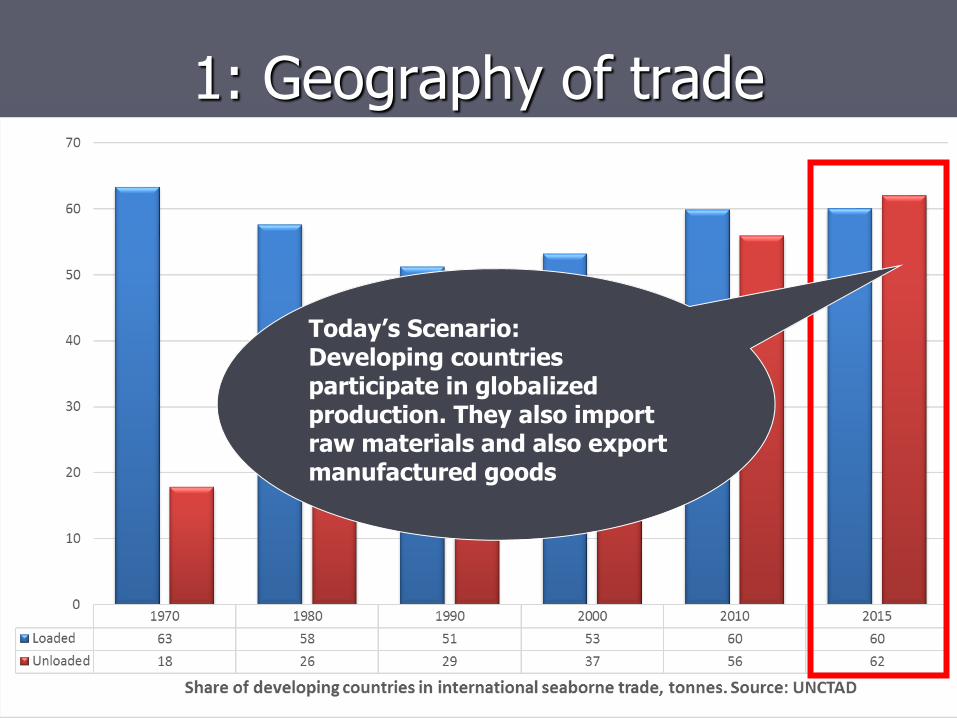
1: Geography of trade
1: Geography of trade
Old Scenario: Developing countries exported large volumes of raw materials and imported high value (low volume) manufactured goods
1: Geography of trade
Today’s Scenario: Developing countries participate in globalized production. They also import raw materials and also export manufactured goods
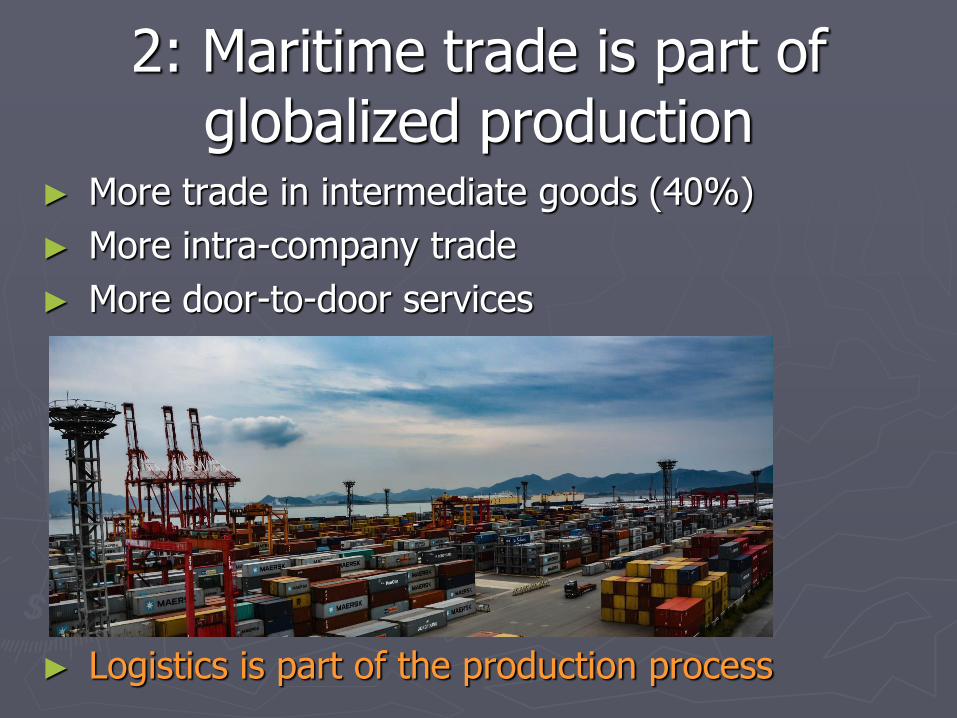
2: Maritime trade is part of globalized production
► More trade in intermediate goods (40%)
► More intra-company trade
► More door-to-door services
► Logistics is part of the production process
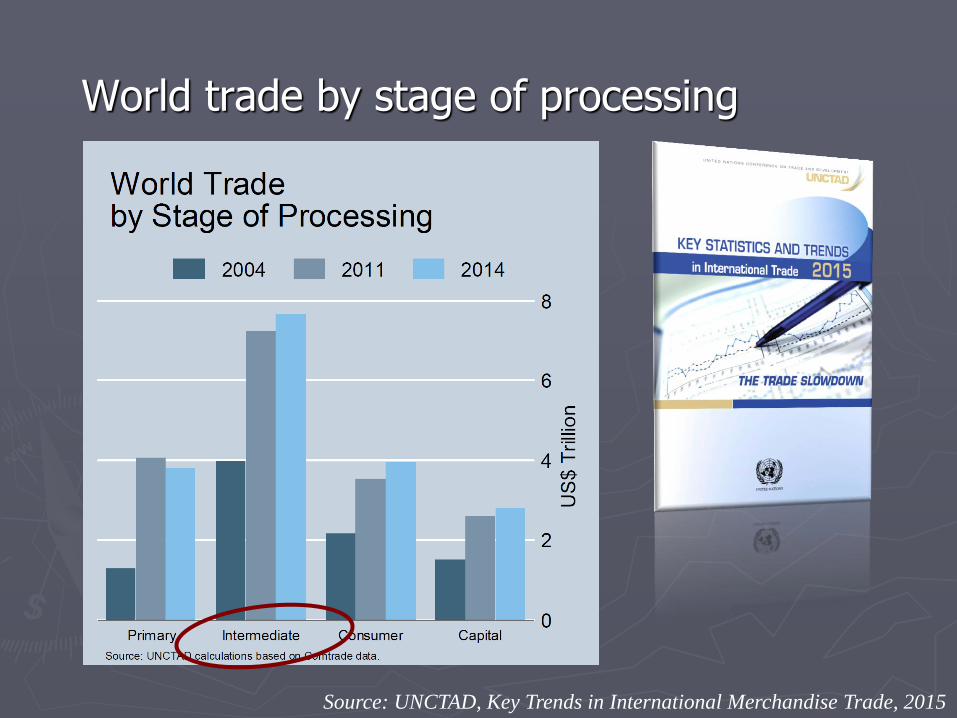
World trade by stage of processing
Source: UNCTAD, Key Trends in International Merchandise Trade, 2015

3: Containerization
(Bernhofen et al, 2013)
Demand
► Supply
► Markets
► The Future

Demand
► Supply
► Markets
► The Future
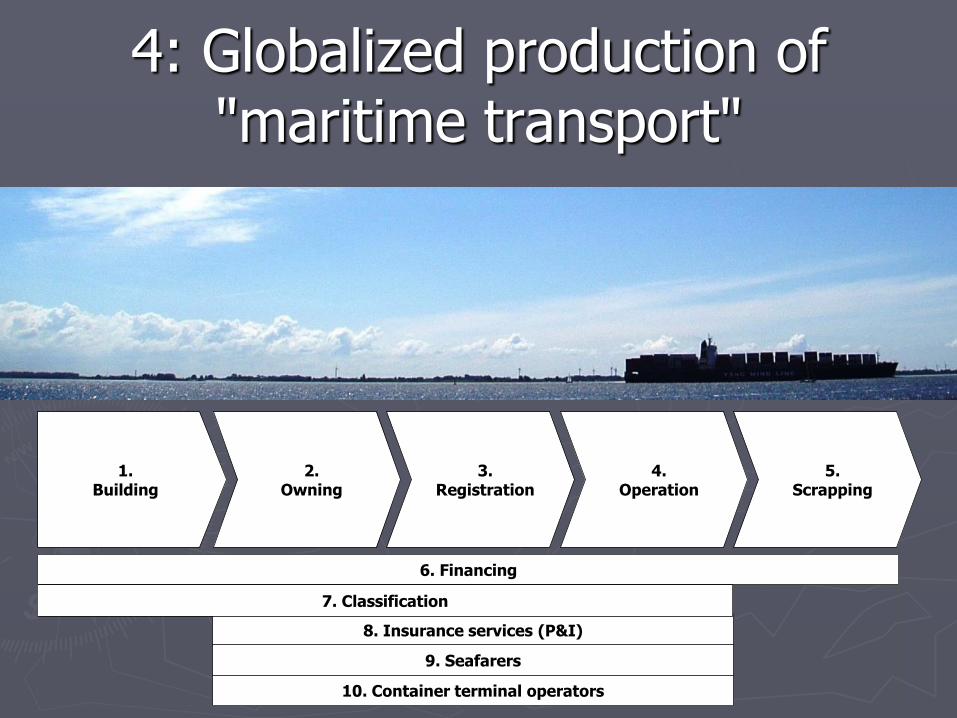
8. Insurance services (P&I)
10. Container terminal operators
9. Seafarers
6. Financing
7. Classification
1. Building
5. Scrapping
2. Owning
3. Registration
4. Operation
4: Globalized production of "maritime transport"

Example: “Hoffmann Shipping”: ►Owner: German ►Flag: Antigua and Barbuda ►Freight agent: Netherlands ►Seafarers: Poland ►Crewing agent: Cyprus ►Cargo: Turkey ► to Canada ►Fuel: Spain ►Insurance: United Kingdom ►Shipyard: Portugal
►Captains’ favourite drink: Ireland

8. Insurance services (P&I)
10. Container terminal operators
9. Seafarers
6. Financing
7. Classification
1. Building
5. Scrapping
2. Owning
3. Registration
4. Operation
4: Globalized production of "maritime transport"
8. Insurance services (P&I)
10. Container terminal operators
9. Seafarers
6. Financing
7. Classification
1. Building
5. Scrapping
2. Owning
3. Registration
4. Operation
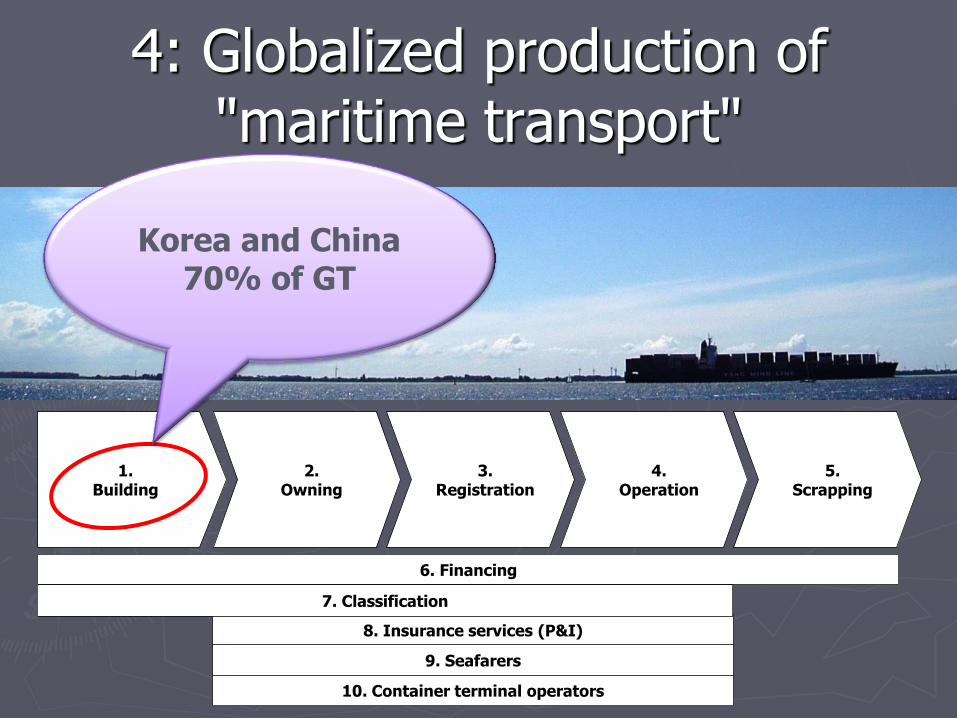
4: Globalized production of "maritime transport"
Korea and China 70% of GT

8. Insurance services (P&I)
10. Container terminal operators
9. Seafarers
6. Financing
7. Classification
1. Building
5. Scrapping
2. Owning
3. Registration
4. Operation
4: Globalized production of "maritime transport"
Greece, Japan: 29%

8. Insurance services (P&I)
10. Container terminal operators
9. Seafarers
6. Financing
7. Classification
1. Building
5. Scrapping
2. Owning
3. Registration
4. Operation
4: Globalized production of "maritime transport"
Panama, Liberia, Marshall Islands:
41%
8. Insurance services (P&I)
10. Container terminal operators
9. Seafarers
6. Financing
7. Classification
1. Building
5. Scrapping
2. Owning
3. Registration
4. Operation (container
ships)
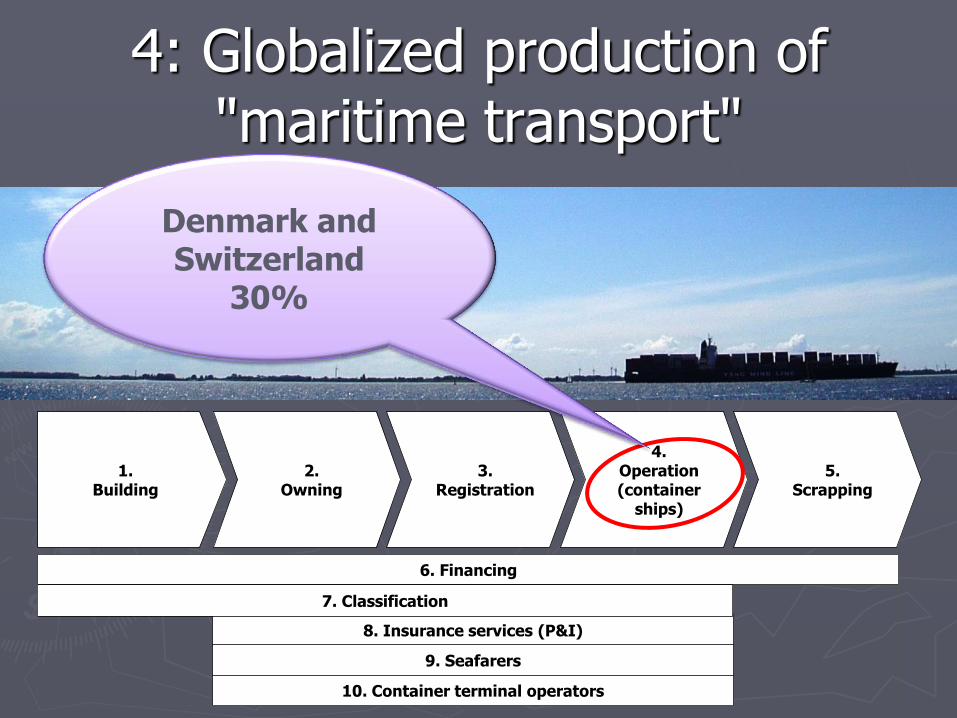
4: Globalized production of "maritime transport"
Denmark and Switzerland
30%

8. Insurance services (P&I)
10. Container terminal operators
9. Seafarers
6. Financing
7. Classification
1. Building
5. Scrapping
2. Owning
3. Registration
4. Operation (container
ships)
4: Globalized production of "maritime transport"
Denmark and Switzerland
30%
8. Insurance services (P&I)
10. Container terminal operators
9. Seafarers
6. Financing
7. Classification
1. Building
5. Scrapping
2. Owning
3. Registration
4. Operation
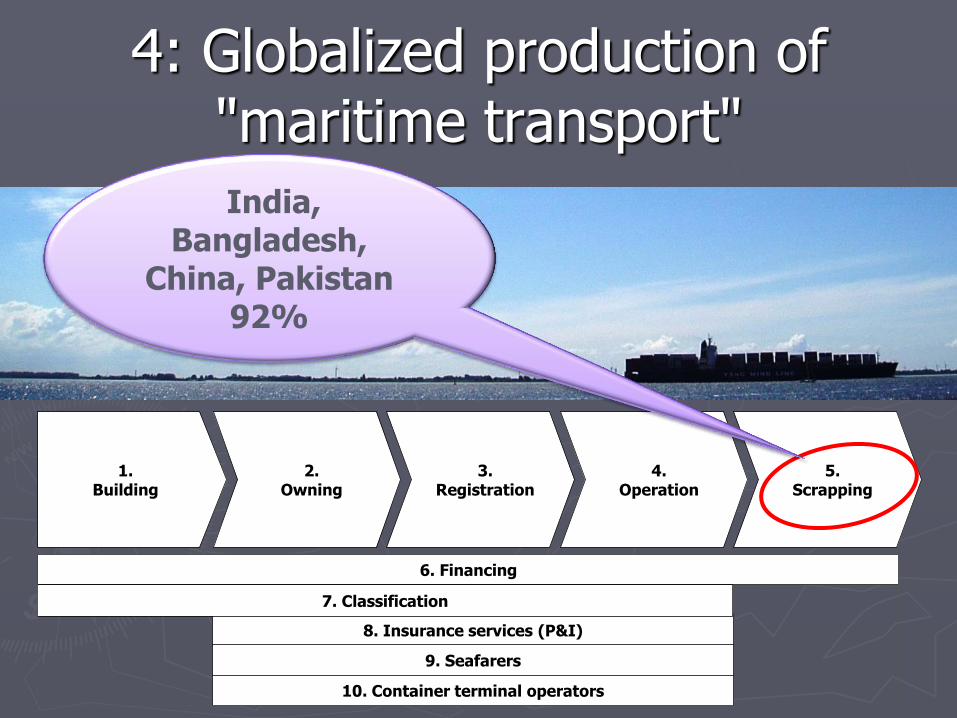
4: Globalized production of "maritime transport"
India, Bangladesh,
China, Pakistan 92%

8. Insurance services (P&I)
10. Container terminal operators
9. Seafarers
6. Financing
7. Classification
1. Building
5. Scrapping
2. Owning
3. Registration
4. Operation
4: Globalized production of "maritime transport"
Financial and other services:
UK, Scandinavia
8. Insurance services (P&I)
10. Container terminal operators
9. Seafarers
6. Financing
7. Classification
1. Building
5. Scrapping
2. Owning
3. Registration
4. Operation
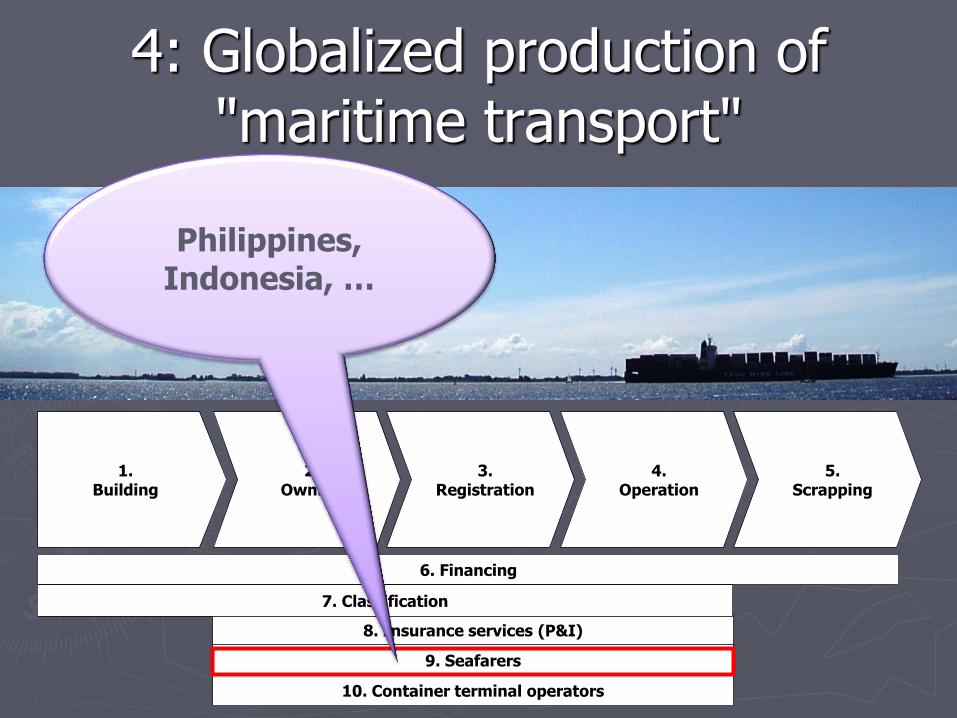
4: Globalized production of "maritime transport"
Philippines, Indonesia, …
8. Insurance services (P&I)
10. Container terminal operators
9. Seafarers
6. Financing
7. Classification
1. Building
5. Scrapping
2. Owning
3. Registration
4. Operation
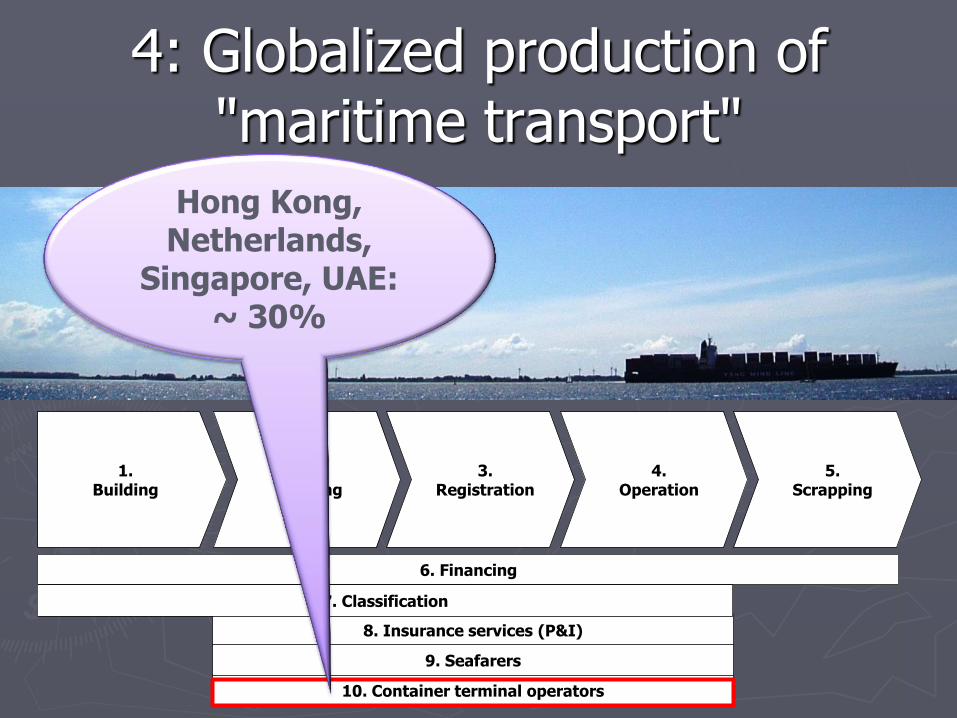
4: Globalized production of "maritime transport"
Hong Kong, Netherlands,
Singapore, UAE: ~ 30%
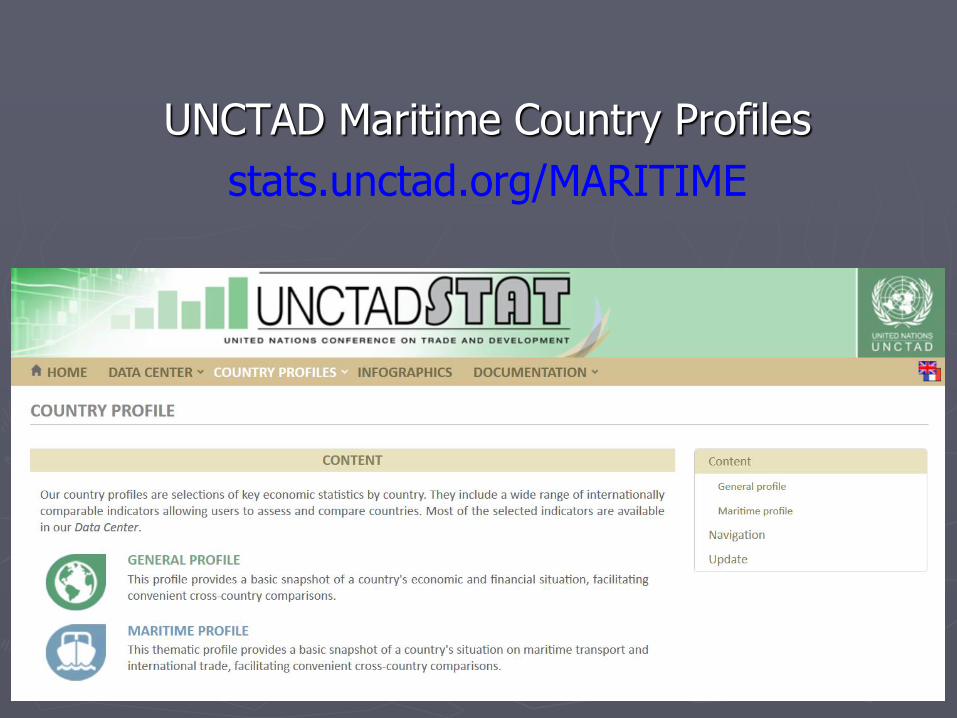
UNCTAD Maritime Country Profiles
stats.unctad.org/MARITIME
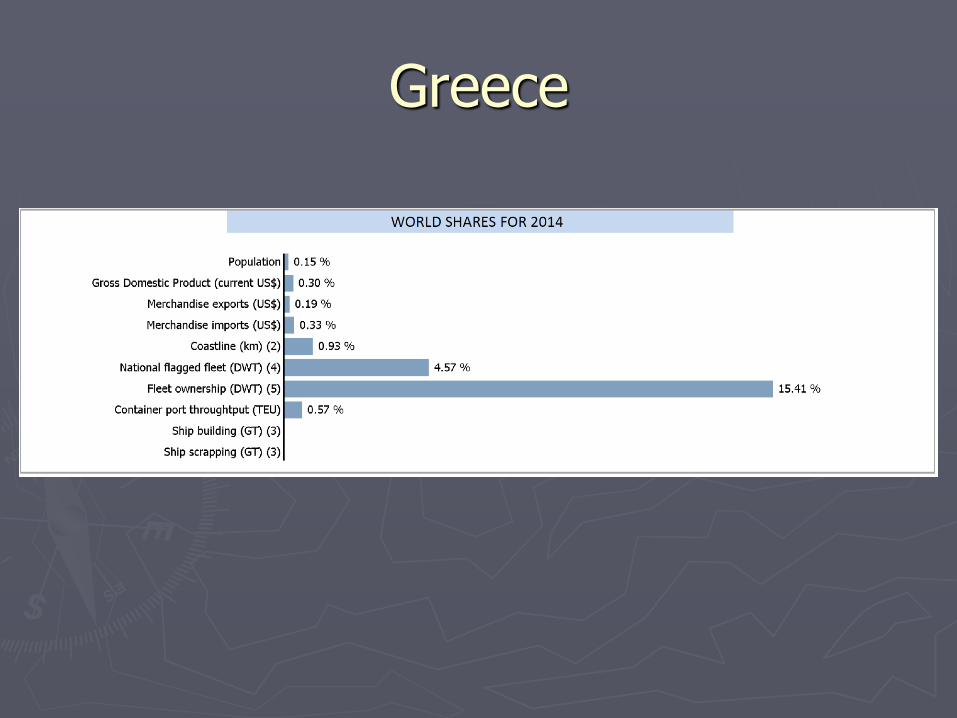
Greece
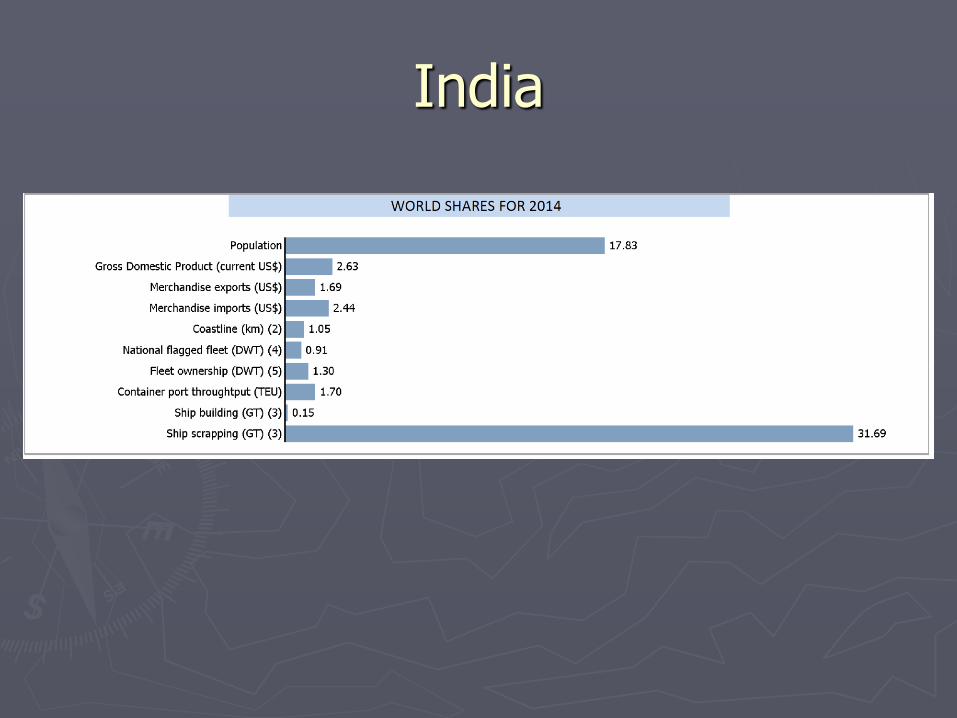
India
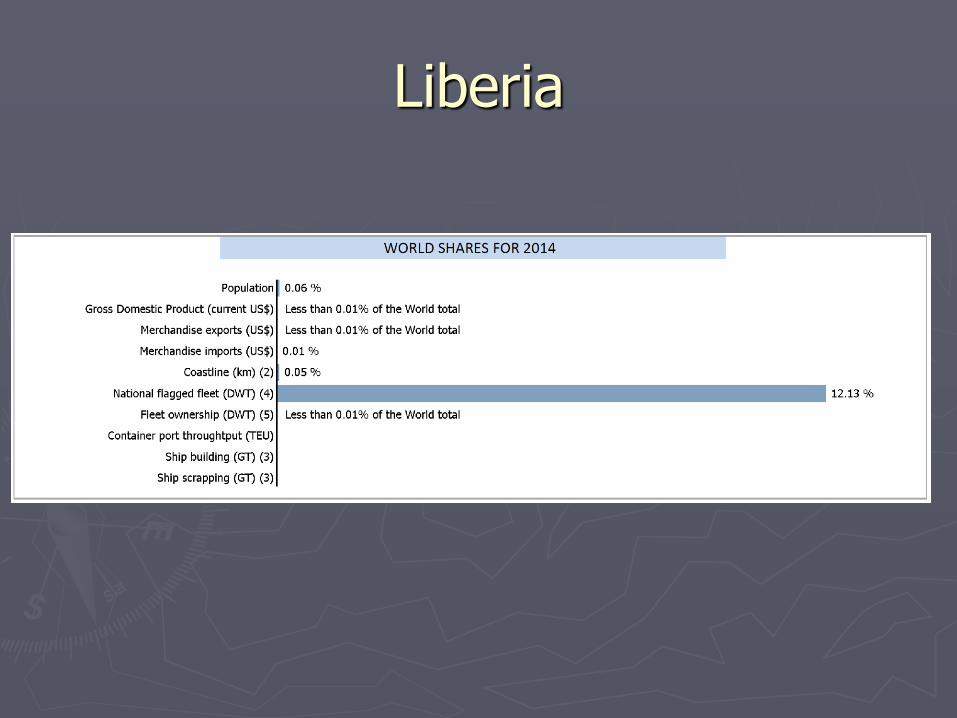
Liberia

Republic of Korea
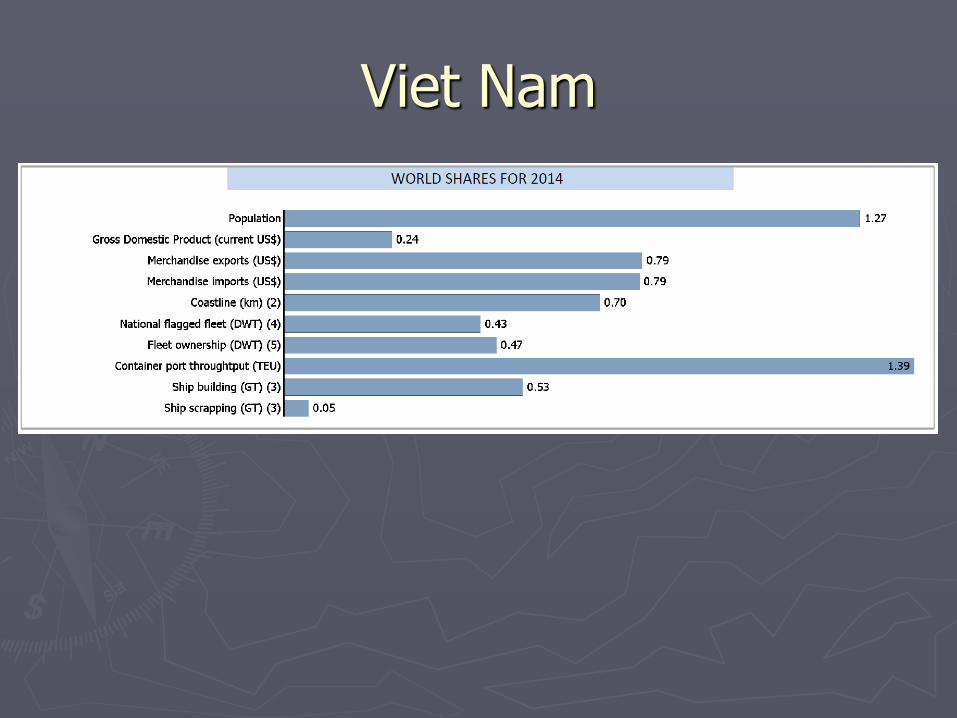
Viet Nam

UNCTAD Maritime Country Profiles
stats.unctad.org/MARITIME

8. Insurance services (P&I)
10. Container terminal operators
9. Seafarers
6. Financing
7. Classification
1. Building
5. Scrapping
2. Owning
3. Registration
4. Operation
4: Globalized production of "maritime transport"

5: Industry consolidation (the other side of the same coin)
►As countries specialize…
►Industry
sees a process of concentration
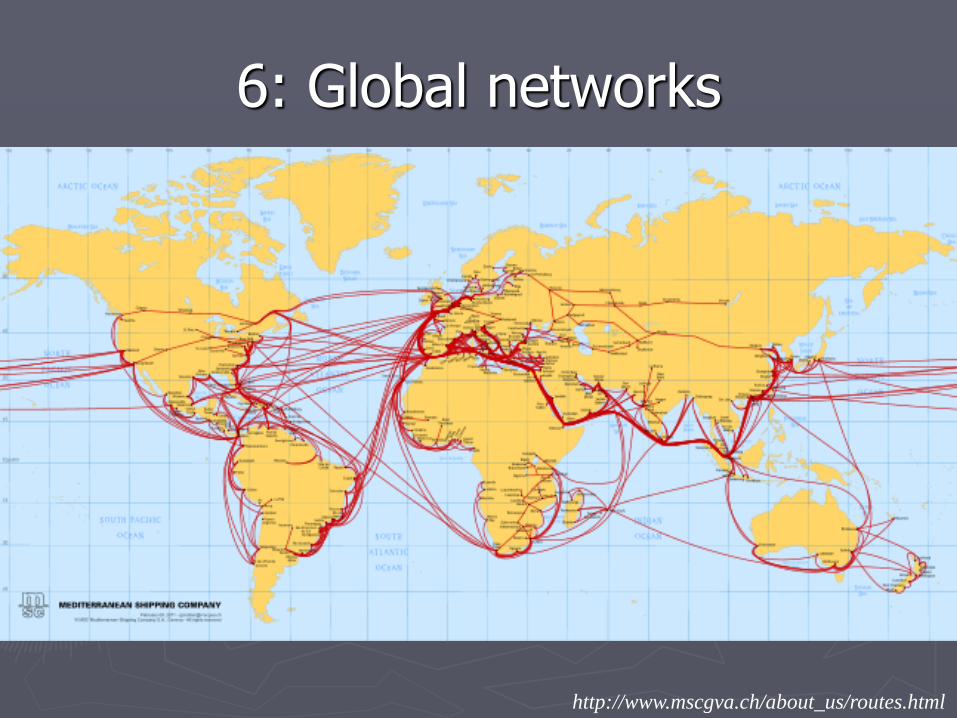
6: Global networks
http://www.mscgva.ch/about_us/routes.html

Networking
Out of 162 x 161 pairs of countries:
How many are connected by direct services?
Source: UNCTAD, based on data from Containerization International


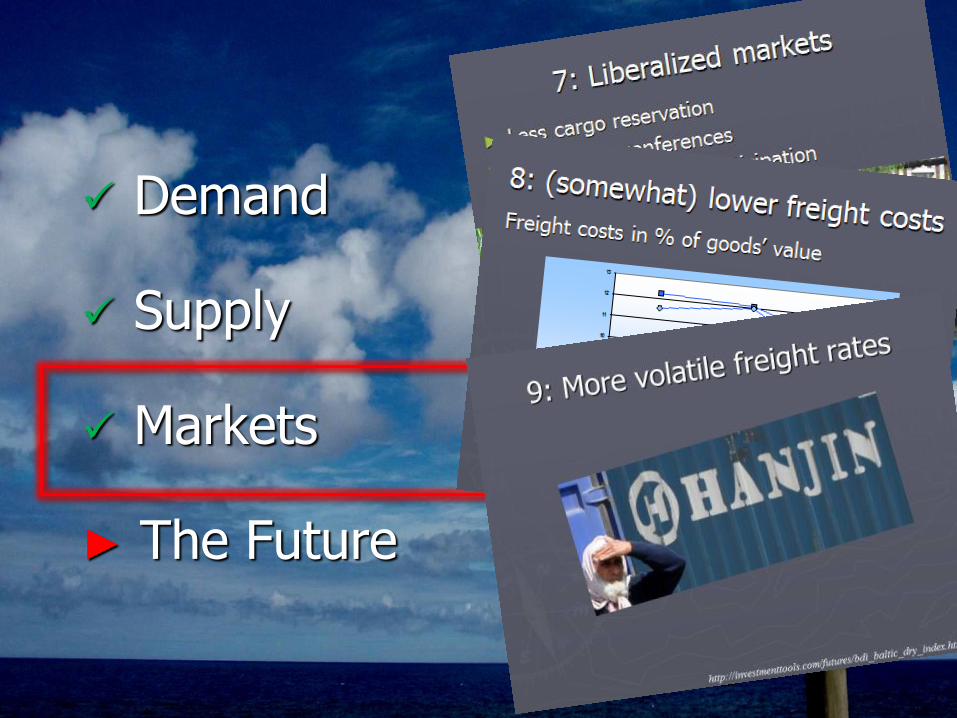
Demand
Supply
► Markets
► The Future

Demand
Supply
► Markets
► The Future

7: Liberalized markets
► Less cargo reservation
► Fewer liner conferences (cartels)
► More private sector participation
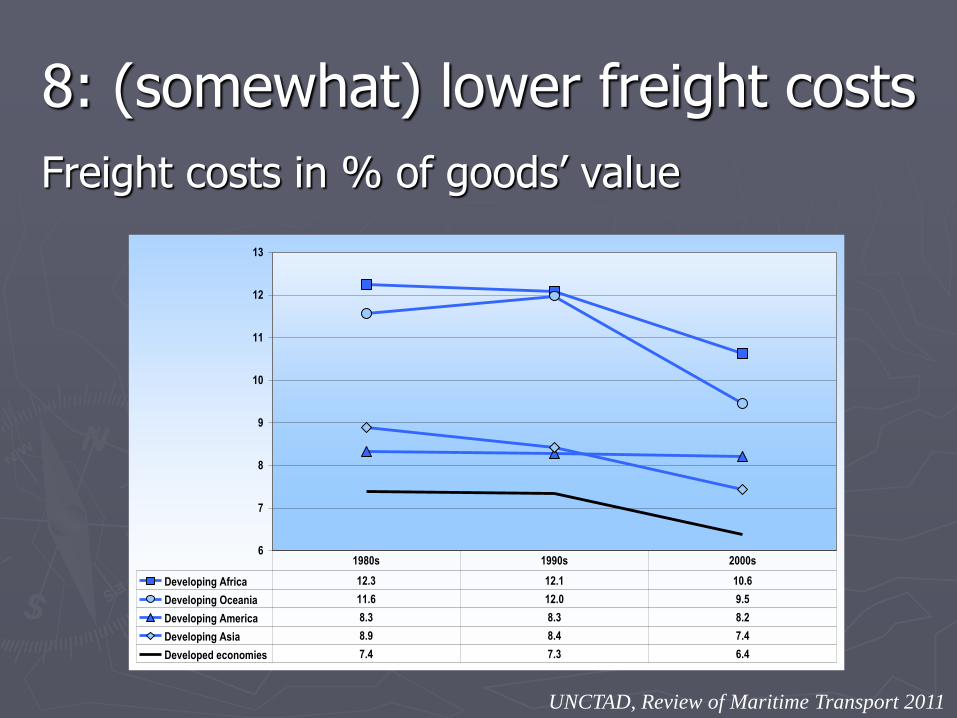
8: (somewhat) lower freight costs
UNCTAD, Review of Maritime Transport 2011
Freight costs in % of goods’ value
6
7
8
9
10
11
12
13
Developing Africa 12.3 12.1 10.6
Developing Oceania 11.6 12.0 9.5
Developing America 8.3 8.3 8.2
Developing Asia 8.9 8.4 7.4
Developed economies 7.4 7.3 6.4
1980s 1990s 2000s
9: More volatile freight rates

Today’s container shipping
►Ever larger ships
►Extremely low freight rates
►Idle fleet
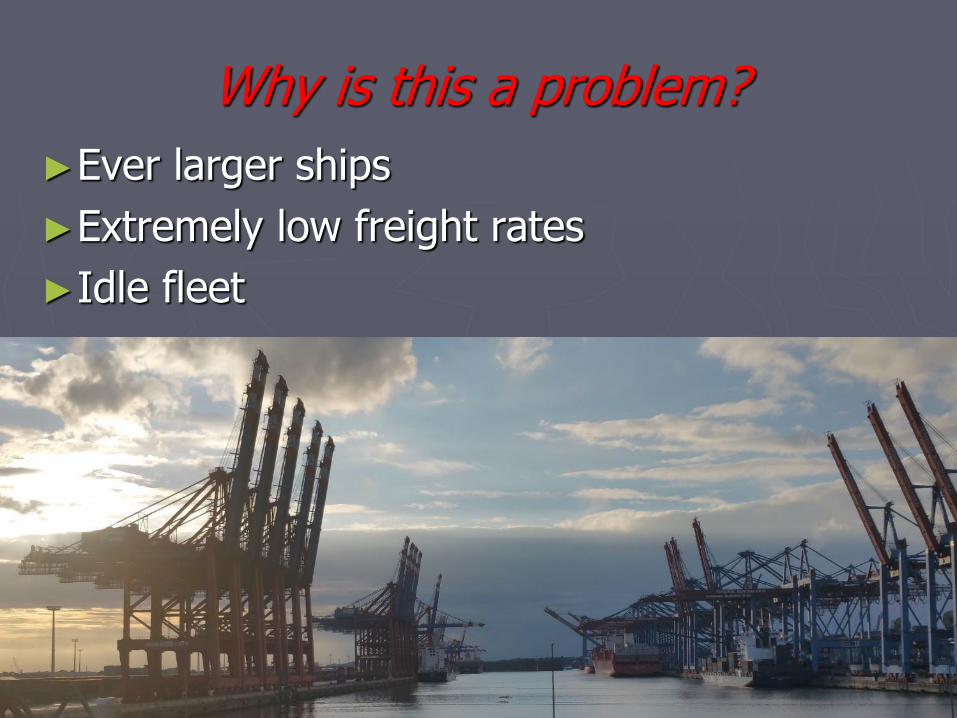
Why is this a problem?
►Ever larger ships
►Extremely low freight rates
►Idle fleet
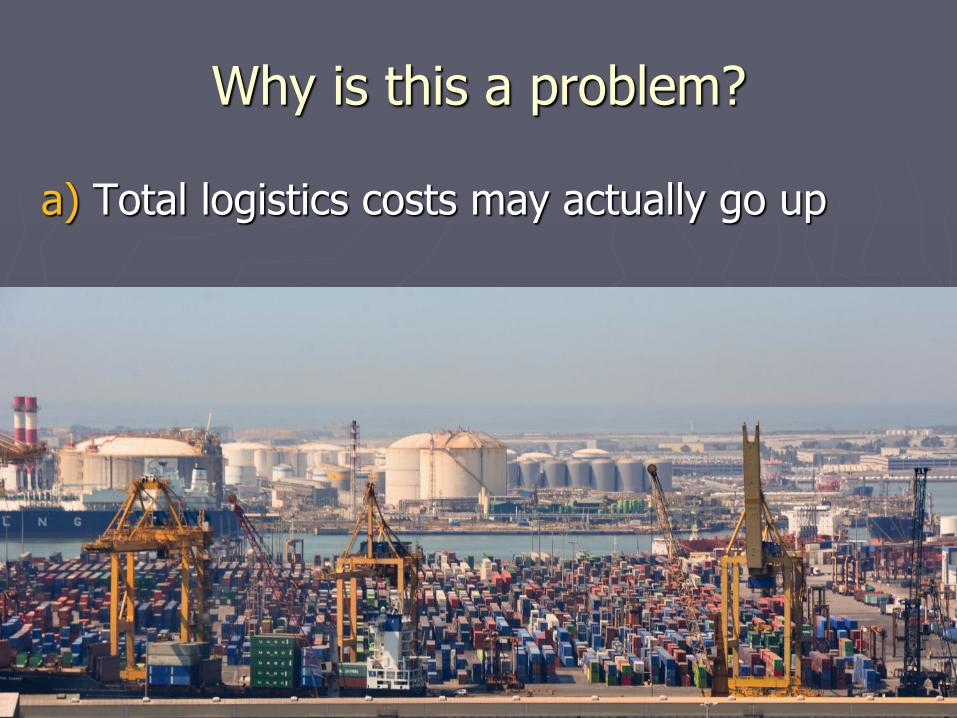
Why is this a problem?
a) Total logistics costs may actually go up
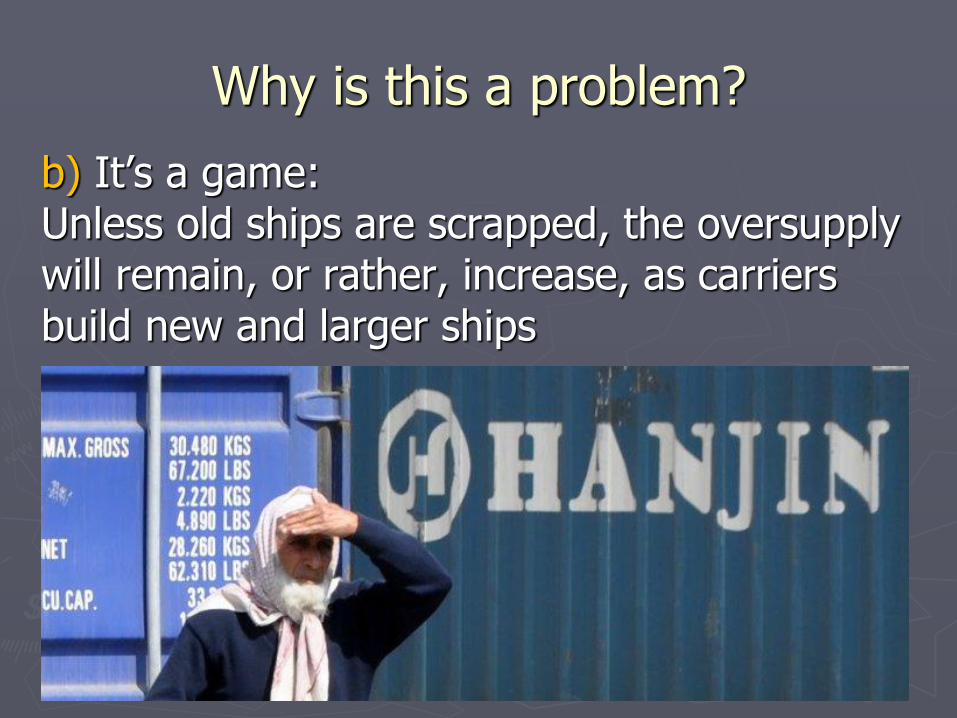
Why is this a problem?
b) It’s a game: Unless old ships are scrapped, the oversupply will remain, or rather, increase, as carriers build new and larger ships

Why is this a problem?
c) Potential oligopolies in small markets
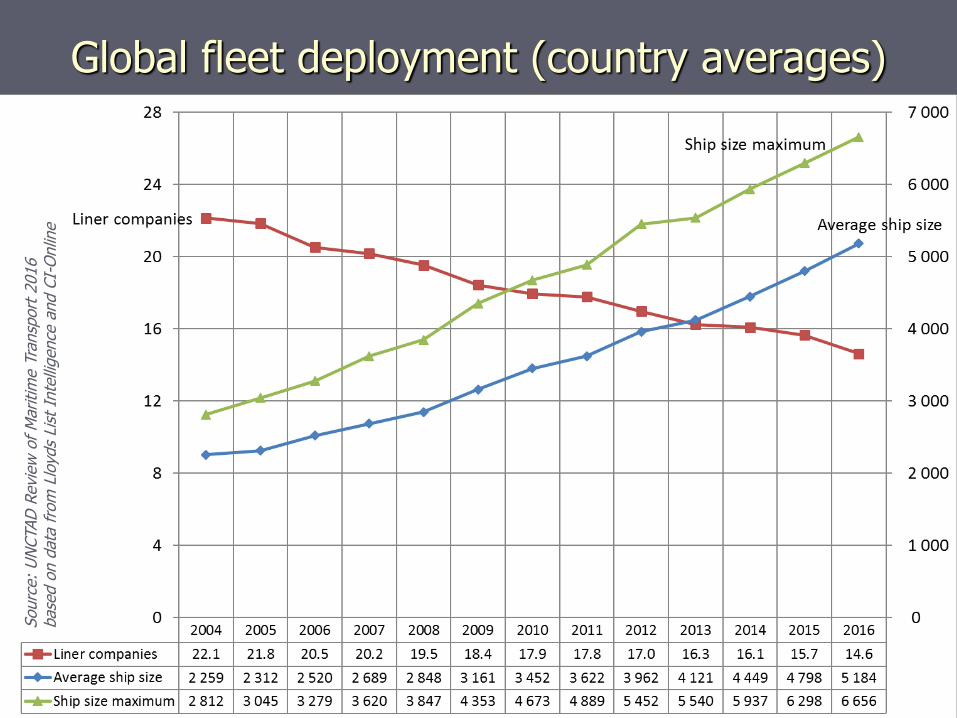
Global fleet deployment (country averages)
►Ever larger ships
►Extremely low freight rates
►Idle fleet
Sourc
e:
UN
CTAD
Revi
ew
of
Maritim
e T
ransp
ort
2016
base
d o
n d
ata
fro
m L
loyd
s Li
st I
nte
lligence
and C
I-O
nlin
e
Demand
Supply
Markets
► The Future

Demand
Supply
Markets
► The Future G
lob
ali
za
tio
n
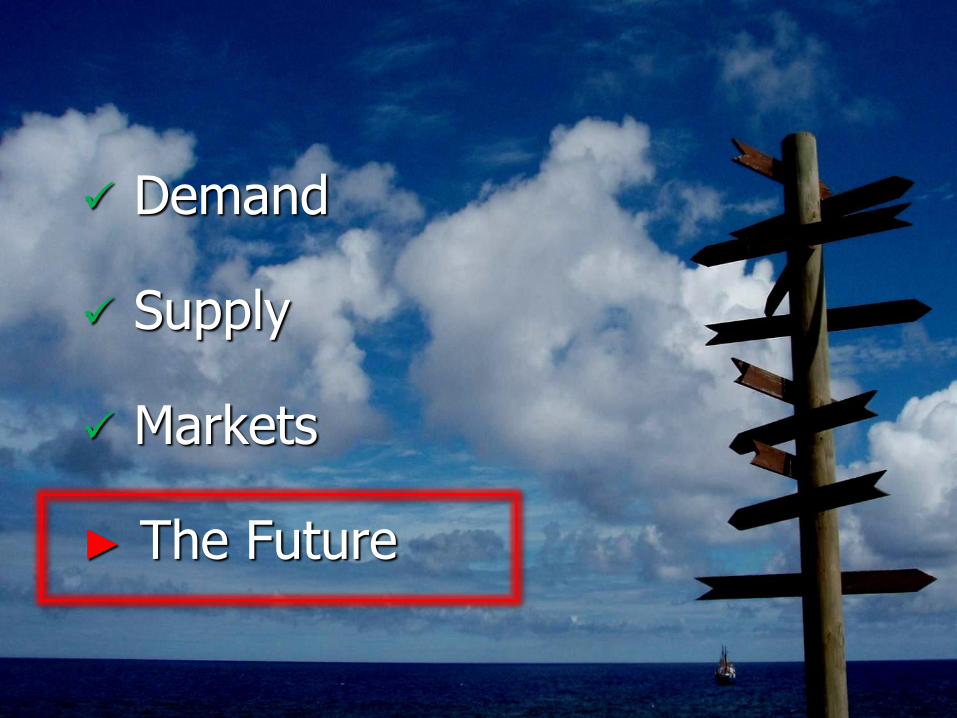
Demand
Supply
Markets
► The Future
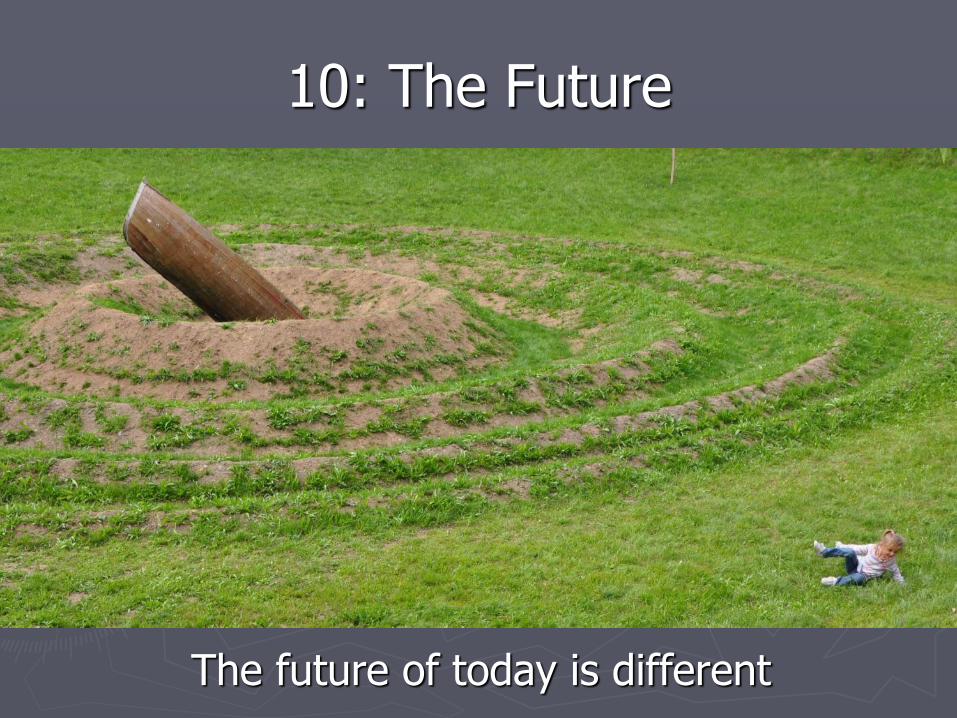
10: The Future
The future of today is different

Is the growth sustainable?
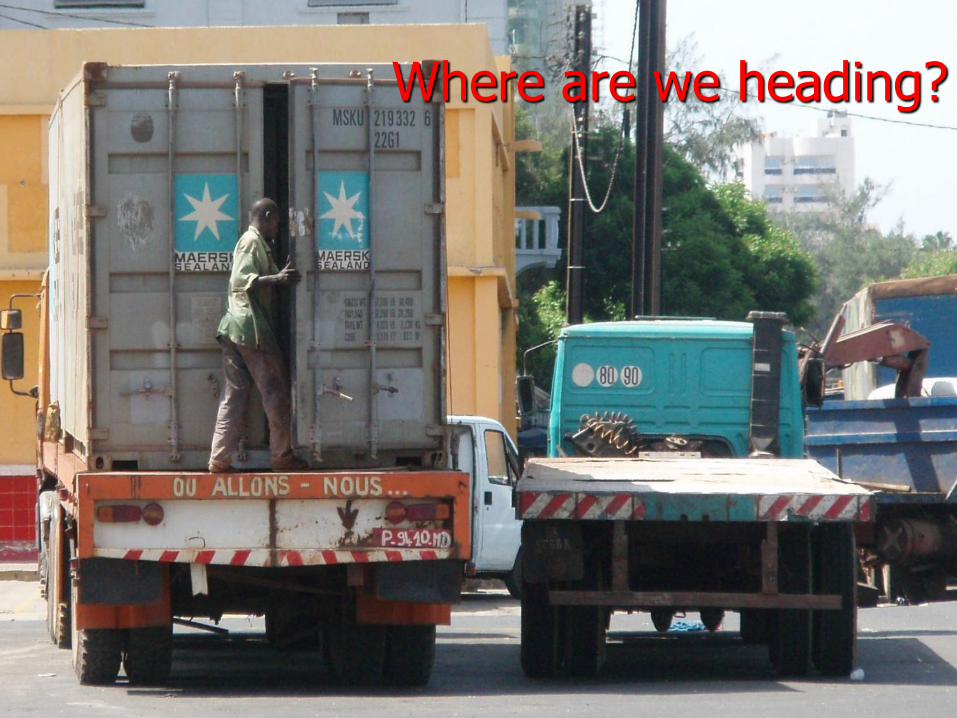
Where are we heading?
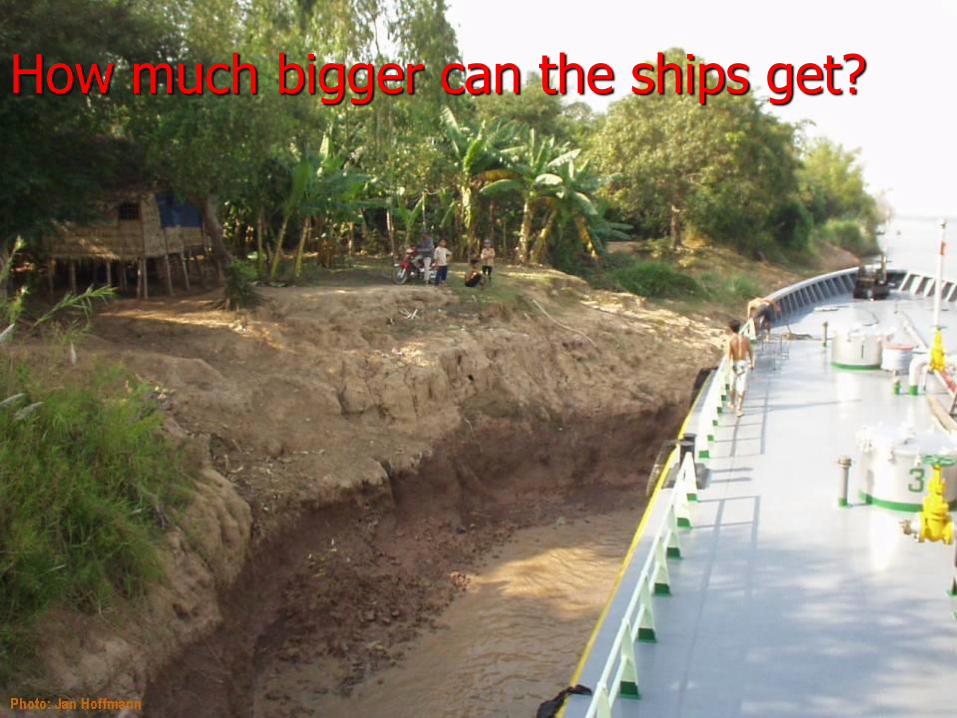
How much bigger can the ships get?

What will we do with our garbage
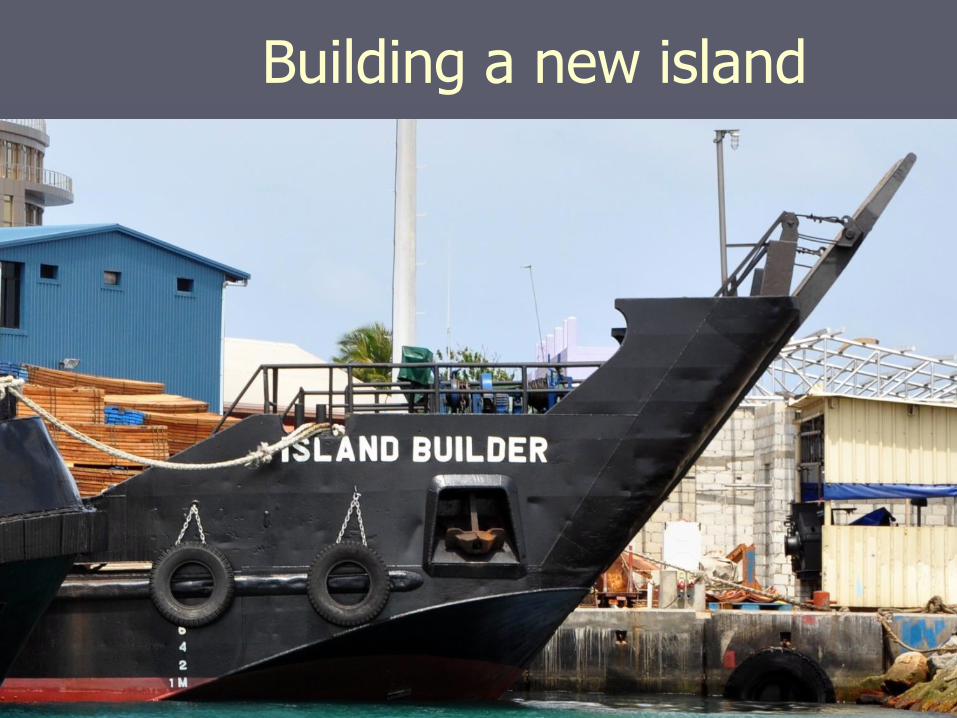
Building a new island
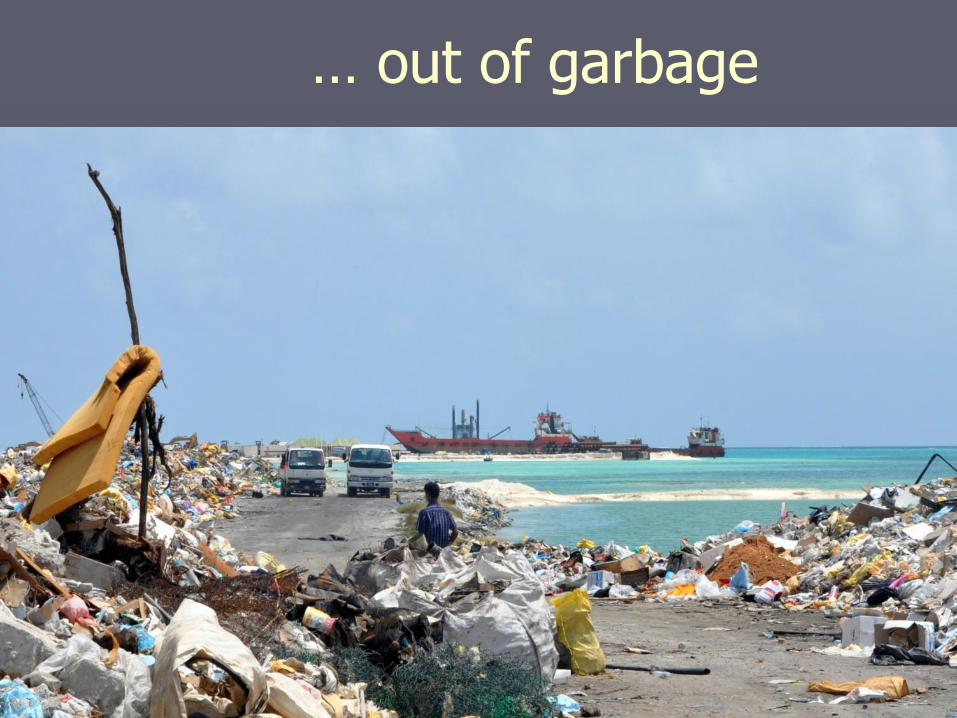
… out of garbage
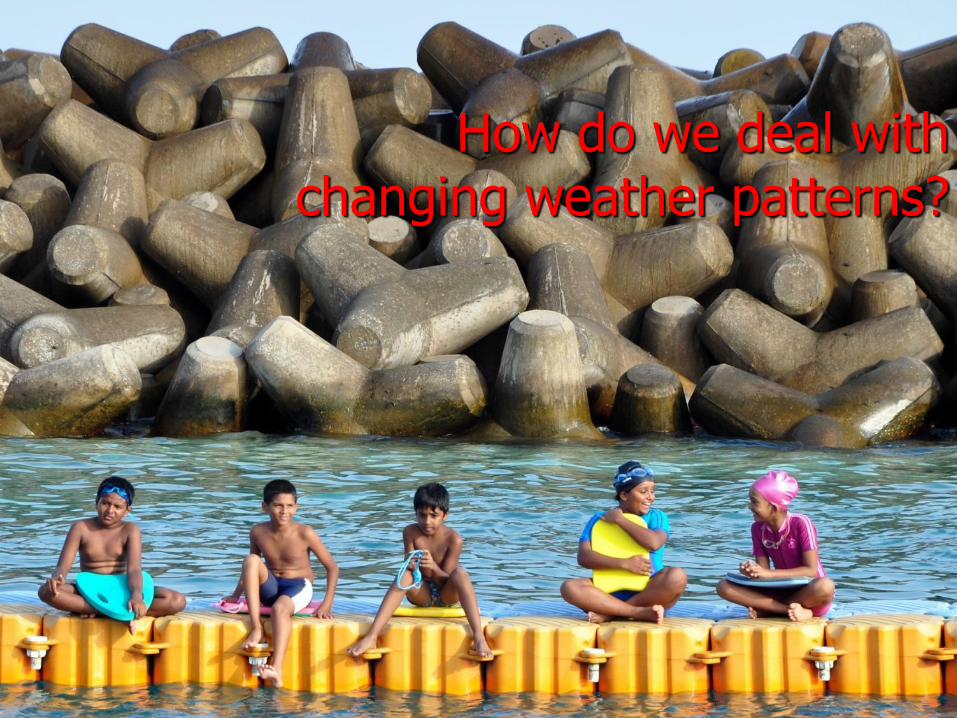
How do we deal with changing weather patterns?

How do we deal with changing weather patterns?

How much more can the ports grow?
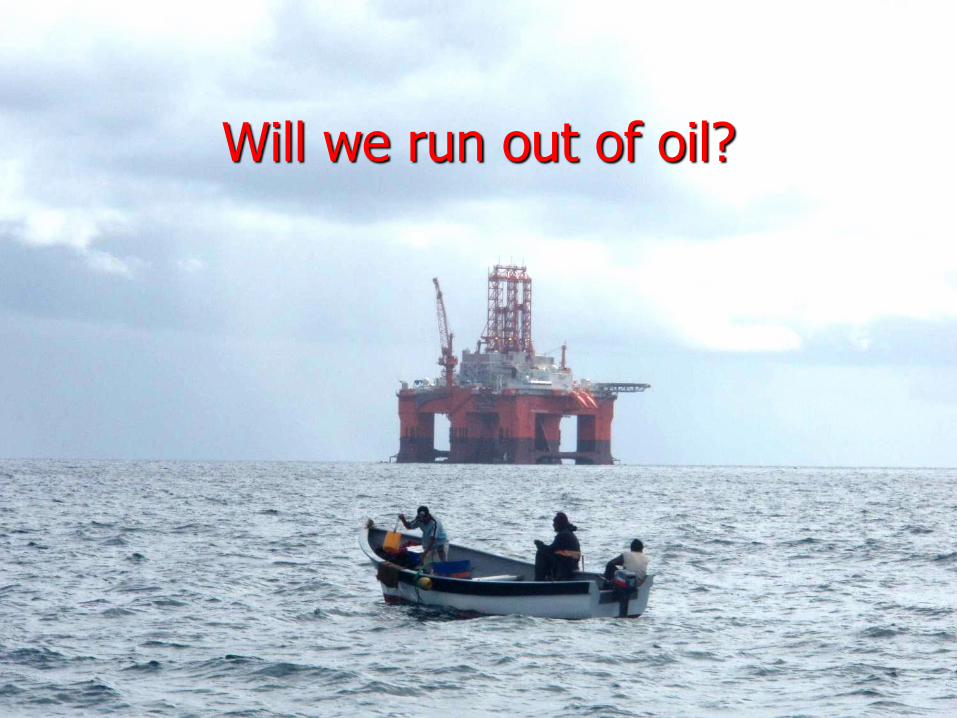
Will we run out of oil?
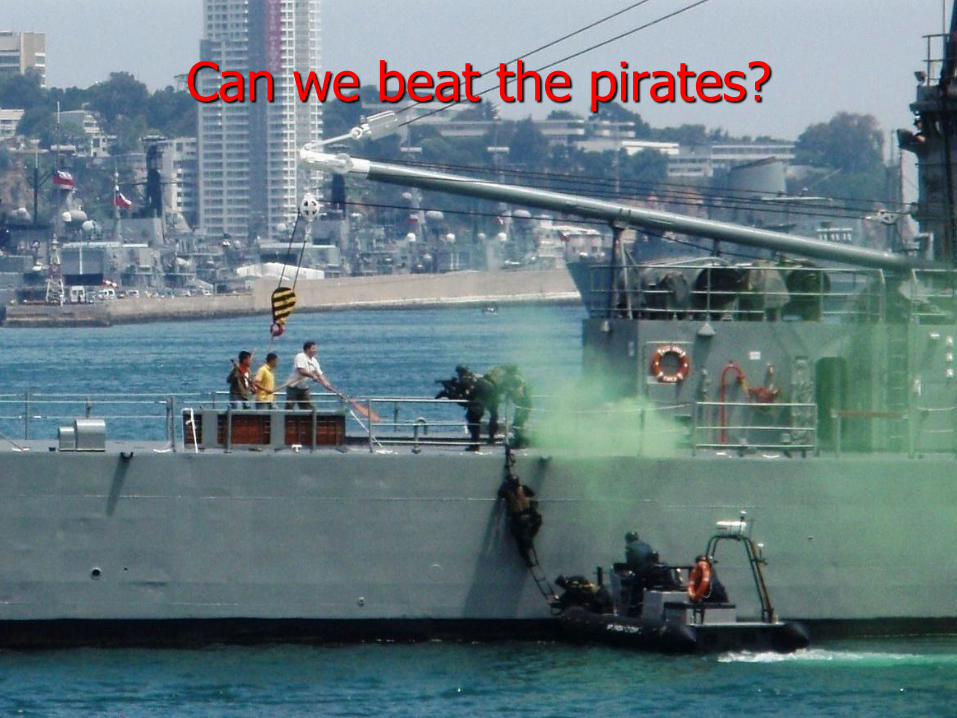
Can we beat the pirates?
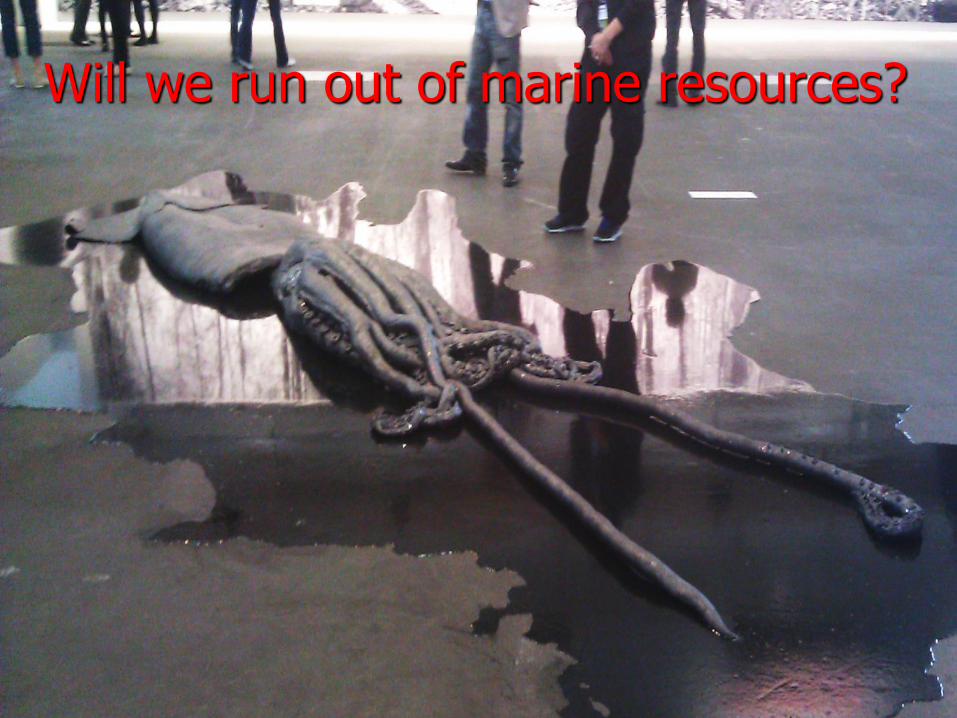
Will we run out of marine resources?

Will the sea level rise?
What will be the impact of climate change?
What will be the questions
of The Future?

10 key long term trends in maritime supply chains
Geneva / Paris, 1 December 2016, [email protected]