trends - maritime provinces higher education … trends in maritime higher education volume 15...
TRANSCRIPT
1
Trends In Maritime Higher Education
Volume 15 Number 1 -Annual Digest- January 2018
University Enrolment 2016 - 2017 New Brunswick
Change Over: 1 year 5 years 10 Years
Total Enrolment ▼ -2.5% ▼ -15.0% ▼ -19.0%
NB Residents ▼ -2.8% ▼ -20.4% ▼ -25.9%
Other Maritimers ▼ -0.6% ▼ -10.3% ▼ -18.7%
Other Canadians ▲ 4.7% ▲ 4.8% ▼ -1.1%
International ▼ -8.9% ▼ -1.8% ▲ 18.4%
Home Province Participation Rate
▼ -0.1 pts ▼ -2.1 pts ▼ -3.1 pts
Nova Scotia
Change Over: 1 year 5 years 10 Years
Total Enrolment ▼ -0.2% ▼ -0.9% ▲ 0.9%
NS Residents ▼ -1.0% ▼ -10.1% ▼ -16.8%
Other Maritimers ▲ 0.6% ▼ -6.1% ▼ -10.7%
Other Canadians ▼ -3.3% ▼ -1.3% ▲ 7.3%
International ▲ 6.3% ▲ 39.5% ▲ 109.0%
Home Province Participation Rate
▼ -0.2 pts ▼ -0.8 pts ▼ -2.5 pts
Prince Edward Island
Change Over: 1 year 5 years 10 Years
Total Enrolment ▲ 0.2% ▼ -6.7% ▲ 4.7%
PEI Residents ▼ -1.3% ▼ -24.2% ▼ -20.6%
Other Maritimers ▼ -1.5% ▲ 16.1% ▲ 39.3%
Other Canadians ▼ -7.9% ▲ 31.3% ▲ 45.1%
International ▲ 11.4% ▲ 63.3% ▲ 217.6%
Home Province Participation Rate
▼ -0.2 pts ▼ -3.9 pts ▼ -3.8 pts
Maritimes
Change Over: 1 year 5 years 10 Years
Total Enrolment ▼ -0.8% ▼ -5.7% ▼ -5.5%
NB Residents ▼ -2.5% ▼ -17.6% ▼ -23.2%
NS Residents ▼ -0.8% ▼ -9.7% ▼ -16.4%
PEI Residents ▼ -0.7% ▼ -21.2% ▼ -19.3%
Other Canadians ▼ -2.1% ▲ 0.4% ▲ 6.6%
International ▲ 3.2% ▲ 29.8% ▲ 84.9%
Maritime Participation Rate
▼ -0.1 pts ▼ -1.5 pts ▼ -3.0 pts
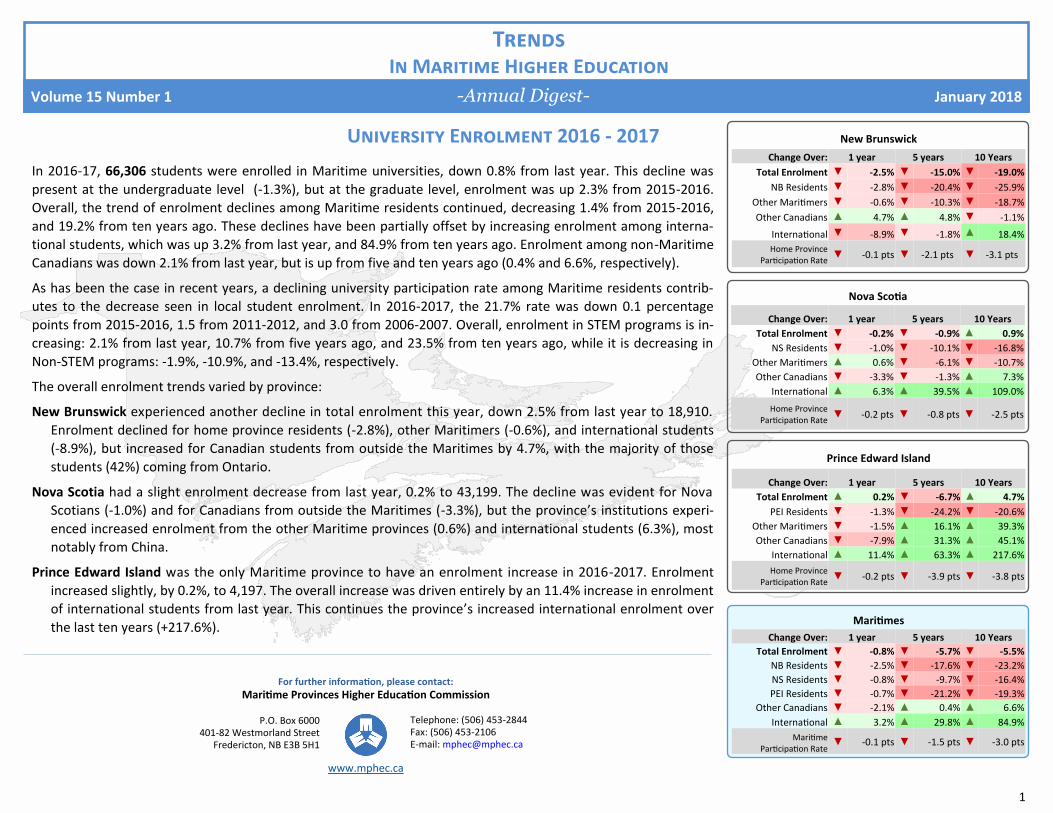
In 2016-17, 66,306 students were enrolled in Maritime universities, down 0.8% from last year. This decline was
present at the undergraduate level (-1.3%), but at the graduate level, enrolment was up 2.3% from 2015-2016.
Overall, the trend of enrolment declines among Maritime residents continued, decreasing 1.4% from 2015-2016,
and 19.2% from ten years ago. These declines have been partially offset by increasing enrolment among interna-
tional students, which was up 3.2% from last year, and 84.9% from ten years ago. Enrolment among non-Maritime
Canadians was down 2.1% from last year, but is up from five and ten years ago (0.4% and 6.6%, respectively).
As has been the case in recent years, a declining university participation rate among Maritime residents contrib-
utes to the decrease seen in local student enrolment. In 2016-2017, the 21.7% rate was down 0.1 percentage
points from 2015-2016, 1.5 from 2011-2012, and 3.0 from 2006-2007. Overall, enrolment in STEM programs is in-
creasing: 2.1% from last year, 10.7% from five years ago, and 23.5% from ten years ago, while it is decreasing in
Non-STEM programs: -1.9%, -10.9%, and -13.4%, respectively.
The overall enrolment trends varied by province:
New Brunswick experienced another decline in total enrolment this year, down 2.5% from last year to 18,910.
Enrolment declined for home province residents (-2.8%), other Maritimers (-0.6%), and international students
(-8.9%), but increased for Canadian students from outside the Maritimes by 4.7%, with the majority of those
students (42%) coming from Ontario.
Nova Scotia had a slight enrolment decrease from last year, 0.2% to 43,199. The decline was evident for Nova
Scotians (-1.0%) and for Canadians from outside the Maritimes (-3.3%), but the province’s institutions experi-
enced increased enrolment from the other Maritime provinces (0.6%) and international students (6.3%), most
notably from China.
Prince Edward Island was the only Maritime province to have an enrolment increase in 2016-2017. Enrolment
increased slightly, by 0.2%, to 4,197. The overall increase was driven entirely by an 11.4% increase in enrolment
of international students from last year. This continues the province’s increased international enrolment over
the last ten years (+217.6%).
For further information, please contact:
Maritime Provinces Higher Education Commission
P.O. Box 6000 401-82 Westmorland Street
Fredericton, NB E3B 5H1
Telephone: (506) 453-2844 Fax: (506) 453-2106 E-mail: [email protected]
www.mphec.ca
2
1 Students with gender "not reported" are excluded
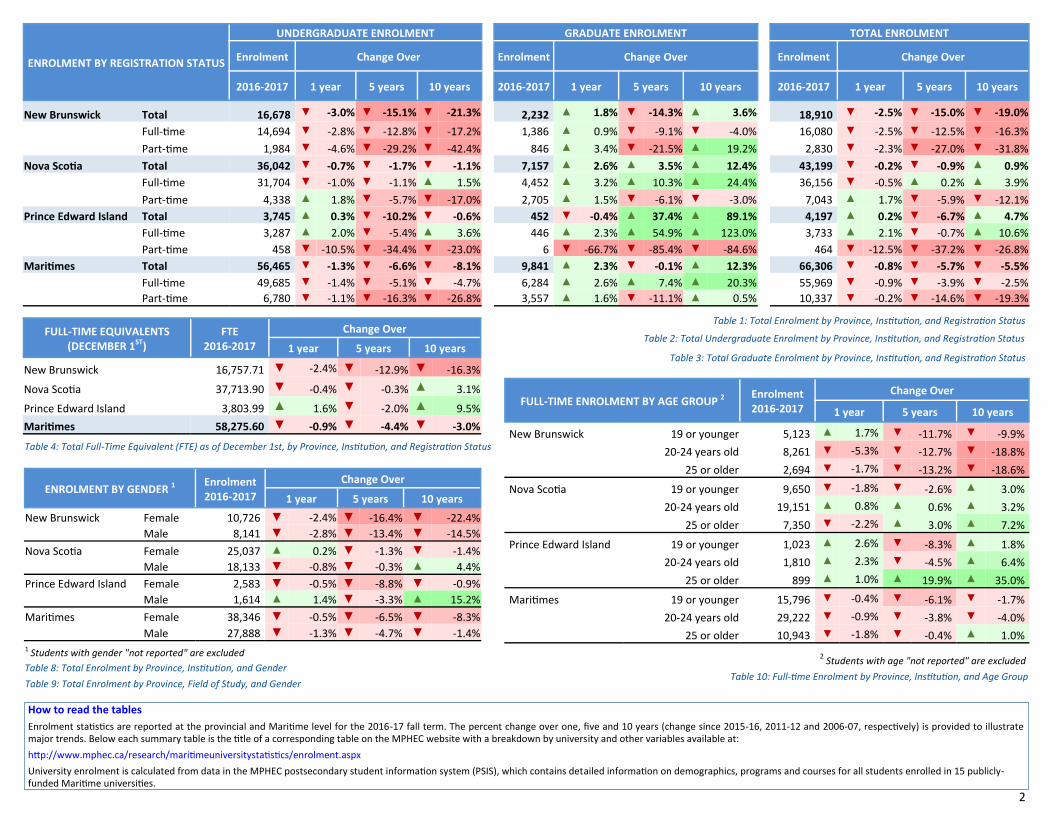
Table 1: Total Enrolment by Province, Institution, and Registration Status
Table 2: Total Undergraduate Enrolment by Province, Institution, and Registration Status
Table 3: Total Graduate Enrolment by Province, Institution, and Registration Status
Table 4: Total Full-Time Equivalent (FTE) as of December 1st, by Province, Institution, and Registration Status
Table 8: Total Enrolment by Province, Institution, and Gender
Table 9: Total Enrolment by Province, Field of Study, and Gender
2 Students with age "not reported" are excluded
Table 10: Full-time Enrolment by Province, Institution, and Age Group
How to read the tables
Enrolment statistics are reported at the provincial and Maritime level for the 2016-17 fall term. The percent change over one, five and 10 years (change since 2015-16, 2011-12 and 2006-07, respectively) is provided to illustrate major trends. Below each summary table is the title of a corresponding table on the MPHEC website with a breakdown by university and other variables available at:
http://www.mphec.ca/research/maritimeuniversitystatistics/enrolment.aspx
University enrolment is calculated from data in the MPHEC postsecondary student information system (PSIS), which contains detailed information on demographics, programs and courses for all students enrolled in 15 publicly-funded Maritime universities.
ENROLMENT BY REGISTRATION STATUS
UNDERGRADUATE ENROLMENT GRADUATE ENROLMENT TOTAL ENROLMENT
Enrolment Change Over Enrolment Change Over Enrolment Change Over
2016-2017 1 year 5 years 10 years 2016-2017 1 year 5 years 10 years 2016-2017 1 year 5 years 10 years
New Brunswick Total 16,678 ▼ -3.0% ▼ -15.1% ▼ -21.3% 2,232 ▲ 1.8% ▼ -14.3% ▲ 3.6% 18,910 ▼ -2.5% ▼ -15.0% ▼ -19.0%
Full-time 14,694 ▼ -2.8% ▼ -12.8% ▼ -17.2% 1,386 ▲ 0.9% ▼ -9.1% ▼ -4.0% 16,080 ▼ -2.5% ▼ -12.5% ▼ -16.3%
Part-time 1,984 ▼ -4.6% ▼ -29.2% ▼ -42.4% 846 ▲ 3.4% ▼ -21.5% ▲ 19.2% 2,830 ▼ -2.3% ▼ -27.0% ▼ -31.8%
Nova Scotia Total 36,042 ▼ -0.7% ▼ -1.7% ▼ -1.1% 7,157 ▲ 2.6% ▲ 3.5% ▲ 12.4% 43,199 ▼ -0.2% ▼ -0.9% ▲ 0.9%
Full-time 31,704 ▼ -1.0% ▼ -1.1% ▲ 1.5% 4,452 ▲ 3.2% ▲ 10.3% ▲ 24.4% 36,156 ▼ -0.5% ▲ 0.2% ▲ 3.9%
Part-time 4,338 ▲ 1.8% ▼ -5.7% ▼ -17.0% 2,705 ▲ 1.5% ▼ -6.1% ▼ -3.0% 7,043 ▲ 1.7% ▼ -5.9% ▼ -12.1%
Prince Edward Island Total 3,745 ▲ 0.3% ▼ -10.2% ▼ -0.6% 452 ▼ -0.4% ▲ 37.4% ▲ 89.1% 4,197 ▲ 0.2% ▼ -6.7% ▲ 4.7%
Full-time 3,287 ▲ 2.0% ▼ -5.4% ▲ 3.6% 446 ▲ 2.3% ▲ 54.9% ▲ 123.0% 3,733 ▲ 2.1% ▼ -0.7% ▲ 10.6%
Part-time 458 ▼ -10.5% ▼ -34.4% ▼ -23.0% 6 ▼ -66.7% ▼ -85.4% ▼ -84.6% 464 ▼ -12.5% ▼ -37.2% ▼ -26.8%
Maritimes Total 56,465 ▼ -1.3% ▼ -6.6% ▼ -8.1% 9,841 ▲ 2.3% ▼ -0.1% ▲ 12.3% 66,306 ▼ -0.8% ▼ -5.7% ▼ -5.5%
Full-time 49,685 ▼ -1.4% ▼ -5.1% ▼ -4.7% 6,284 ▲ 2.6% ▲ 7.4% ▲ 20.3% 55,969 ▼ -0.9% ▼ -3.9% ▼ -2.5%
Part-time 6,780 ▼ -1.1% ▼ -16.3% ▼ -26.8% 3,557 ▲ 1.6% ▼ -11.1% ▲ 0.5% 10,337 ▼ -0.2% ▼ -14.6% ▼ -19.3%
FULL-TIME EQUIVALENTS (DECEMBER 1ST)
Change Over FTE 2016-2017 1 year 5 years 10 years
New Brunswick 16,757.71 ▼ -2.4% ▼ -12.9% ▼ -16.3%
Nova Scotia 37,713.90 ▼ -0.4% ▼ -0.3% ▲ 3.1%
Prince Edward Island 3,803.99 ▲ 1.6% ▼ -2.0% ▲ 9.5%
Maritimes 58,275.60 ▼ -0.9% ▼ -4.4% ▼ -3.0%
ENROLMENT BY GENDER 1 Change Over Enrolment
2016-2017 1 year 5 years 10 years
New Brunswick Female 10,726 ▼ -2.4% ▼ -16.4% ▼ -22.4%
Male 8,141 ▼ -2.8% ▼ -13.4% ▼ -14.5%
Nova Scotia Female 25,037 ▲ 0.2% ▼ -1.3% ▼ -1.4%
Male 18,133 ▼ -0.8% ▼ -0.3% ▲ 4.4%
Prince Edward Island Female 2,583 ▼ -0.5% ▼ -8.8% ▼ -0.9%
Male 1,614 ▲ 1.4% ▼ -3.3% ▲ 15.2%
Maritimes Female 38,346 ▼ -0.5% ▼ -6.5% ▼ -8.3%
Male 27,888 ▼ -1.3% ▼ -4.7% ▼ -1.4%
FULL-TIME ENROLMENT BY AGE GROUP 2 Enrolment 2016-2017
Change Over
1 year 5 years 10 years
New Brunswick 19 or younger 5,123 ▲ 1.7% ▼ -11.7% ▼ -9.9%
20-24 years old 8,261 ▼ -5.3% ▼ -12.7% ▼ -18.8%
25 or older 2,694 ▼ -1.7% ▼ -13.2% ▼ -18.6%
Nova Scotia 19 or younger 9,650 ▼ -1.8% ▼ -2.6% ▲ 3.0%
20-24 years old 19,151 ▲ 0.8% ▲ 0.6% ▲ 3.2%
25 or older 7,350 ▼ -2.2% ▲ 3.0% ▲ 7.2%
Prince Edward Island 19 or younger 1,023 ▲ 2.6% ▼ -8.3% ▲ 1.8%
20-24 years old 1,810 ▲ 2.3% ▼ -4.5% ▲ 6.4%
25 or older 899 ▲ 1.0% ▲ 19.9% ▲ 35.0%
Maritimes 19 or younger 15,796 ▼ -0.4% ▼ -6.1% ▼ -1.7%
20-24 years old 29,222 ▼ -0.9% ▼ -3.8% ▼ -4.0%
25 or older 10,943 ▼ -1.8% ▼ -0.4% ▲ 1.0%
3
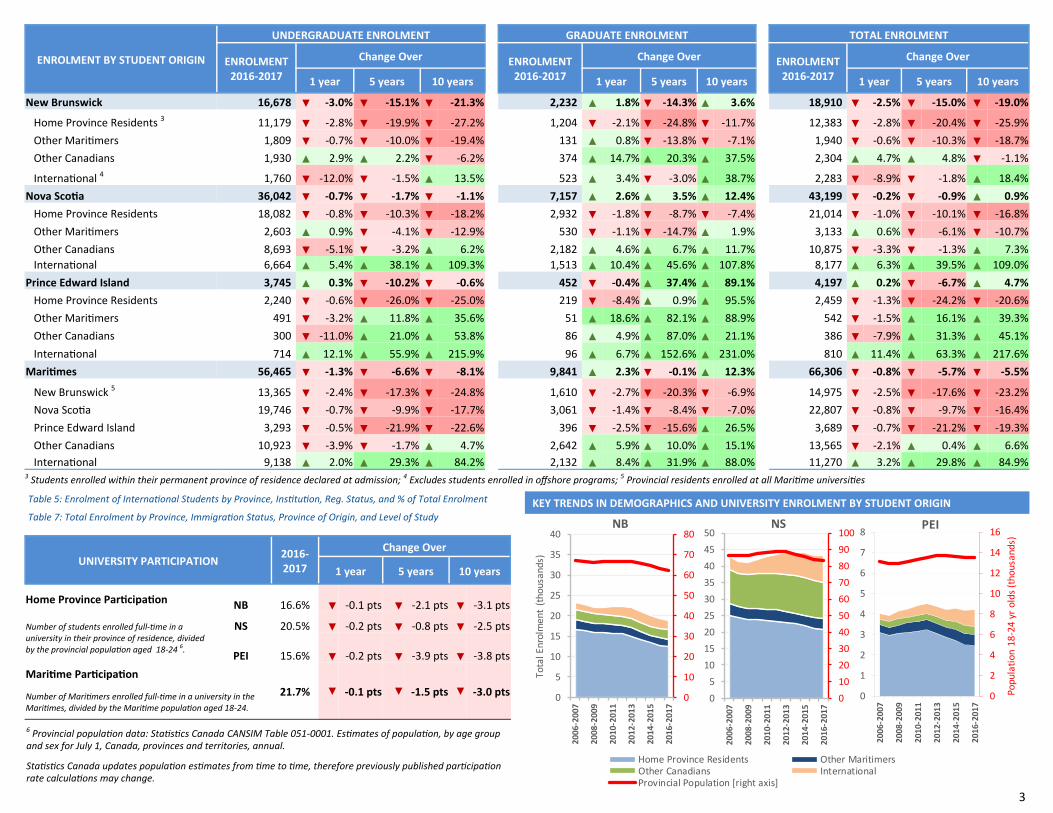
ENROLMENT BY STUDENT ORIGIN
UNDERGRADUATE ENROLMENT GRADUATE ENROLMENT TOTAL ENROLMENT
ENROLMENT 2016-2017
Change Over ENROLMENT 2016-2017
Change Over ENROLMENT 2016-2017
Change Over
1 year 5 years 10 years 1 year 5 years 10 years 1 year 5 years 10 years
New Brunswick 16,678 ▼ -3.0% ▼ -15.1% ▼ -21.3% 2,232 ▲ 1.8% ▼ -14.3% ▲ 3.6% 18,910 ▼ -2.5% ▼ -15.0% ▼ -19.0%
Home Province Residents 3 11,179 ▼ -2.8% ▼ -19.9% ▼ -27.2% 1,204 ▼ -2.1% ▼ -24.8% ▼ -11.7% 12,383 ▼ -2.8% ▼ -20.4% ▼ -25.9%
Other Maritimers 1,809 ▼ -0.7% ▼ -10.0% ▼ -19.4% 131 ▲ 0.8% ▼ -13.8% ▼ -7.1% 1,940 ▼ -0.6% ▼ -10.3% ▼ -18.7%
Other Canadians 1,930 ▲ 2.9% ▲ 2.2% ▼ -6.2% 374 ▲ 14.7% ▲ 20.3% ▲ 37.5% 2,304 ▲ 4.7% ▲ 4.8% ▼ -1.1%
International 4 1,760 ▼ -12.0% ▼ -1.5% ▲ 13.5% 523 ▲ 3.4% ▼ -3.0% ▲ 38.7% 2,283 ▼ -8.9% ▼ -1.8% ▲ 18.4%
Nova Scotia 36,042 ▼ -0.7% ▼ -1.7% ▼ -1.1% 7,157 ▲ 2.6% ▲ 3.5% ▲ 12.4% 43,199 ▼ -0.2% ▼ -0.9% ▲ 0.9%
Home Province Residents 18,082 ▼ -0.8% ▼ -10.3% ▼ -18.2% 2,932 ▼ -1.8% ▼ -8.7% ▼ -7.4% 21,014 ▼ -1.0% ▼ -10.1% ▼ -16.8%
Other Maritimers 2,603 ▲ 0.9% ▼ -4.1% ▼ -12.9% 530 ▼ -1.1% ▼ -14.7% ▲ 1.9% 3,133 ▲ 0.6% ▼ -6.1% ▼ -10.7%
Other Canadians 8,693 ▼ -5.1% ▼ -3.2% ▲ 6.2% 2,182 ▲ 4.6% ▲ 6.7% ▲ 11.7% 10,875 ▼ -3.3% ▼ -1.3% ▲ 7.3%
International 6,664 ▲ 5.4% ▲ 38.1% ▲ 109.3% 1,513 ▲ 10.4% ▲ 45.6% ▲ 107.8% 8,177 ▲ 6.3% ▲ 39.5% ▲ 109.0%
Prince Edward Island 3,745 ▲ 0.3% ▼ -10.2% ▼ -0.6% 452 ▼ -0.4% ▲ 37.4% ▲ 89.1% 4,197 ▲ 0.2% ▼ -6.7% ▲ 4.7%
Home Province Residents 2,240 ▼ -0.6% ▼ -26.0% ▼ -25.0% 219 ▼ -8.4% ▲ 0.9% ▲ 95.5% 2,459 ▼ -1.3% ▼ -24.2% ▼ -20.6%
Other Maritimers 491 ▼ -3.2% ▲ 11.8% ▲ 35.6% 51 ▲ 18.6% ▲ 82.1% ▲ 88.9% 542 ▼ -1.5% ▲ 16.1% ▲ 39.3%
Other Canadians 300 ▼ -11.0% ▲ 21.0% ▲ 53.8% 86 ▲ 4.9% ▲ 87.0% ▲ 21.1% 386 ▼ -7.9% ▲ 31.3% ▲ 45.1%
International 714 ▲ 12.1% ▲ 55.9% ▲ 215.9% 96 ▲ 6.7% ▲ 152.6% ▲ 231.0% 810 ▲ 11.4% ▲ 63.3% ▲ 217.6%
Maritimes 56,465 ▼ -1.3% ▼ -6.6% ▼ -8.1% 9,841 ▲ 2.3% ▼ -0.1% ▲ 12.3% 66,306 ▼ -0.8% ▼ -5.7% ▼ -5.5%
New Brunswick 5 13,365 ▼ -2.4% ▼ -17.3% ▼ -24.8% 1,610 ▼ -2.7% ▼ -20.3% ▼ -6.9% 14,975 ▼ -2.5% ▼ -17.6% ▼ -23.2%
Nova Scotia 19,746 ▼ -0.7% ▼ -9.9% ▼ -17.7% 3,061 ▼ -1.4% ▼ -8.4% ▼ -7.0% 22,807 ▼ -0.8% ▼ -9.7% ▼ -16.4%
Prince Edward Island 3,293 ▼ -0.5% ▼ -21.9% ▼ -22.6% 396 ▼ -2.5% ▼ -15.6% ▲ 26.5% 3,689 ▼ -0.7% ▼ -21.2% ▼ -19.3%
Other Canadians 10,923 ▼ -3.9% ▼ -1.7% ▲ 4.7% 2,642 ▲ 5.9% ▲ 10.0% ▲ 15.1% 13,565 ▼ -2.1% ▲ 0.4% ▲ 6.6%
International 9,138 ▲ 2.0% ▲ 29.3% ▲ 84.2% 2,132 ▲ 8.4% ▲ 31.9% ▲ 88.0% 11,270 ▲ 3.2% ▲ 29.8% ▲ 84.9% 3 Students enrolled within their permanent province of residence declared at admission; 4 Excludes students enrolled in offshore programs; 5 Provincial residents enrolled at all Maritime universities
UNIVERSITY PARTICIPATION 2016-2017
Change Over
1 year 5 years 10 years
Home Province Participation NB 16.6% ▼ -0.1 pts ▼ -2.1 pts ▼ -3.1 pts
Number of students enrolled full-time in a university in their province of residence, divided by the provincial population aged 18-24 6.
NS 20.5% ▼ -0.2 pts ▼ -0.8 pts ▼ -2.5 pts
PEI 15.6% ▼ -0.2 pts ▼ -3.9 pts ▼ -3.8 pts
Maritime Participation
21.7% ▼ -0.1 pts ▼ -1.5 pts ▼ -3.0 pts Number of Maritimers enrolled full-time in a university in the Maritimes, divided by the Maritime population aged 18-24.
6 Provincial population data: Statistics Canada CANSIM Table 051-0001. Estimates of population, by age group and sex for July 1, Canada, provinces and territories, annual.
Statistics Canada updates population estimates from time to time, therefore previously published participation rate calculations may change.
Table 5: Enrolment of International Students by Province, Institution, Reg. Status, and % of Total Enrolment
Table 7: Total Enrolment by Province, Immigration Status, Province of Origin, and Level of Study
0
2
4
6
8
10
12
14
16
0
1
2
3
4
5
6
7
8
2006
-200
7
2008
-200
9
2010
-201
1
2012
-201
3
2014
-201
5
2016
-201
7
Popu
lati
on 1
8-2
4 y
r o
lds
(th
ou
san
ds)
PEI
Home Province Residents Other MaritimersOther Canadians InternationalProvincial Population [right axis]
0
10
20
30
40
50
60
70
80
90
100
0
5
10
15
20
25
30
35
40
45
50
2006
-200
7
2008
-200
9
2010
-201
1
2012
-201
3
2014
-201
5
2016
-201
7
NS
0
10
20
30
40
50
60
70
80
0
5
10
15
20
25
30
35
40
2006
-200
7
2008
-200
9
2010
-201
1
2012
-201
3
2014
-201
5
2016
-201
7
Tota
l Enr
olm
ent
(tho
usan
ds)
NB
KEY TRENDS IN DEMOGRAPHICS AND UNIVERSITY ENROLMENT BY STUDENT ORIGIN
4
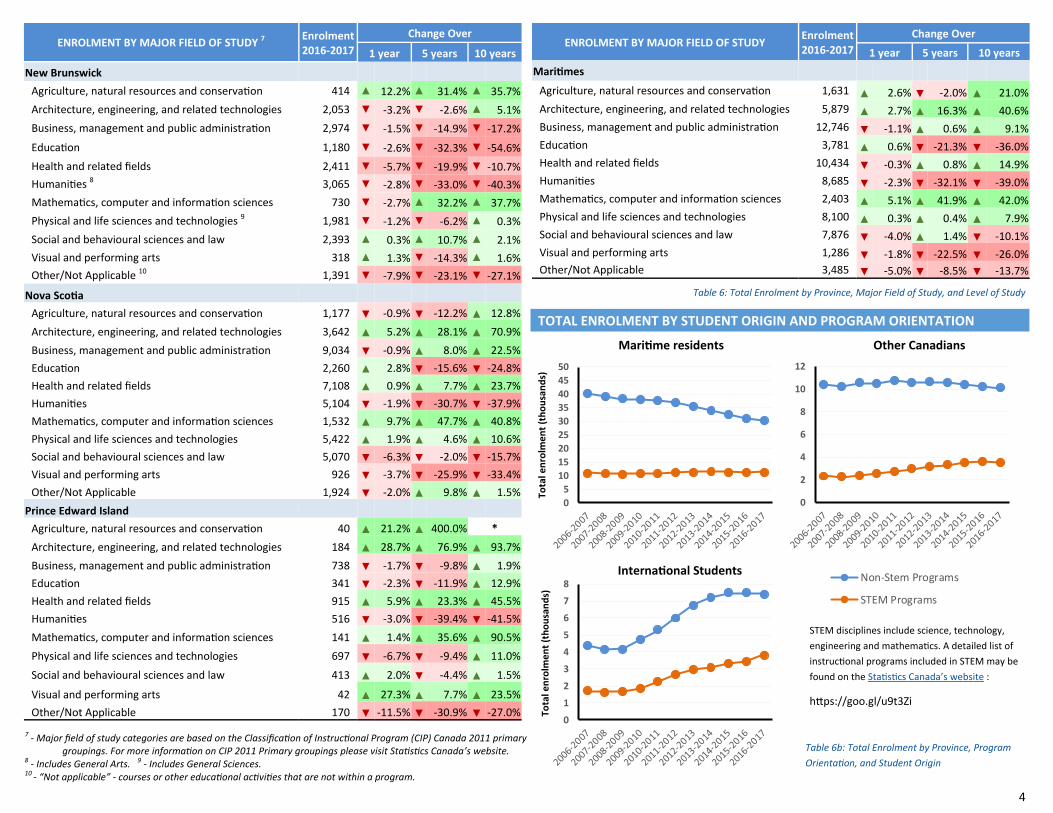
ENROLMENT BY MAJOR FIELD OF STUDY Enrolment 2016-2017
Change Over
1 year 5 years 10 years
Maritimes
Agriculture, natural resources and conservation 1,631 ▲ 2.6% ▼ -2.0% ▲ 21.0%
Architecture, engineering, and related technologies 5,879 ▲ 2.7% ▲ 16.3% ▲ 40.6%
Business, management and public administration 12,746 ▼ -1.1% ▲ 0.6% ▲ 9.1%
Education 3,781 ▲ 0.6% ▼ -21.3% ▼ -36.0%
Health and related fields 10,434 ▼ -0.3% ▲ 0.8% ▲ 14.9%
Humanities 8,685 ▼ -2.3% ▼ -32.1% ▼ -39.0%
Mathematics, computer and information sciences 2,403 ▲ 5.1% ▲ 41.9% ▲ 42.0%
Physical and life sciences and technologies 8,100 ▲ 0.3% ▲ 0.4% ▲ 7.9%
Social and behavioural sciences and law 7,876 ▼ -4.0% ▲ 1.4% ▼ -10.1%
Visual and performing arts 1,286 ▼ -1.8% ▼ -22.5% ▼ -26.0%
Other/Not Applicable 3,485 ▼ -5.0% ▼ -8.5% ▼ -13.7%
ENROLMENT BY MAJOR FIELD OF STUDY 7 Enrolment 2016-2017
Change Over
1 year 5 years 10 years
New Brunswick
Agriculture, natural resources and conservation 414 ▲ 12.2% ▲ 31.4% ▲ 35.7%
Architecture, engineering, and related technologies 2,053 ▼ -3.2% ▼ -2.6% ▲ 5.1%
Business, management and public administration 2,974 ▼ -1.5% ▼ -14.9% ▼ -17.2%
Education 1,180 ▼ -2.6% ▼ -32.3% ▼ -54.6%
Health and related fields 2,411 ▼ -5.7% ▼ -19.9% ▼ -10.7%
Humanities 8 3,065 ▼ -2.8% ▼ -33.0% ▼ -40.3%
Mathematics, computer and information sciences 730 ▼ -2.7% ▲ 32.2% ▲ 37.7%
Physical and life sciences and technologies 9 1,981 ▼ -1.2% ▼ -6.2% ▲ 0.3%
Social and behavioural sciences and law 2,393 ▲ 0.3% ▲ 10.7% ▲ 2.1%
Visual and performing arts 318 ▲ 1.3% ▼ -14.3% ▲ 1.6%
Other/Not Applicable 10 1,391 ▼ -7.9% ▼ -23.1% ▼ -27.1%
Nova Scotia
Agriculture, natural resources and conservation 1,177 ▼ -0.9% ▼ -12.2% ▲ 12.8%
Architecture, engineering, and related technologies 3,642 ▲ 5.2% ▲ 28.1% ▲ 70.9%
Business, management and public administration 9,034 ▼ -0.9% ▲ 8.0% ▲ 22.5%
Education 2,260 ▲ 2.8% ▼ -15.6% ▼ -24.8%
Health and related fields 7,108 ▲ 0.9% ▲ 7.7% ▲ 23.7%
Humanities 5,104 ▼ -1.9% ▼ -30.7% ▼ -37.9%
Mathematics, computer and information sciences 1,532 ▲ 9.7% ▲ 47.7% ▲ 40.8%
Physical and life sciences and technologies 5,422 ▲ 1.9% ▲ 4.6% ▲ 10.6%
Social and behavioural sciences and law 5,070 ▼ -6.3% ▼ -2.0% ▼ -15.7%
Visual and performing arts 926 ▼ -3.7% ▼ -25.9% ▼ -33.4%
Other/Not Applicable 1,924 ▼ -2.0% ▲ 9.8% ▲ 1.5%
Prince Edward Island
Agriculture, natural resources and conservation 40 ▲ 21.2% ▲ 400.0% *
Architecture, engineering, and related technologies 184 ▲ 28.7% ▲ 76.9% ▲ 93.7%
Business, management and public administration 738 ▼ -1.7% ▼ -9.8% ▲ 1.9%
Education 341 ▼ -2.3% ▼ -11.9% ▲ 12.9%
Health and related fields 915 ▲ 5.9% ▲ 23.3% ▲ 45.5%
Humanities 516 ▼ -3.0% ▼ -39.4% ▼ -41.5%
Mathematics, computer and information sciences 141 ▲ 1.4% ▲ 35.6% ▲ 90.5%
Physical and life sciences and technologies 697 ▼ -6.7% ▼ -9.4% ▲ 11.0%
Social and behavioural sciences and law 413 ▲ 2.0% ▼ -4.4% ▲ 1.5%
Visual and performing arts 42 ▲ 27.3% ▲ 7.7% ▲ 23.5%
Other/Not Applicable 170 ▼ -11.5% ▼ -30.9% ▼ -27.0%
7 - Major field of study categories are based on the Classification of Instructional Program (CIP) Canada 2011 primary groupings. For more information on CIP 2011 Primary groupings please visit Statistics Canada’s website. 8 - Includes General Arts. 9 - Includes General Sciences. 10 - “Not applicable” - courses or other educational activities that are not within a program.
Table 6: Total Enrolment by Province, Major Field of Study, and Level of Study
TOTAL ENROLMENT BY STUDENT ORIGIN AND PROGRAM ORIENTATION
STEM disciplines include science, technology,
engineering and mathematics. A detailed list of
instructional programs included in STEM may be
found on the Statistics Canada’s website :
https://goo.gl/u9t3Zi
Table 6b: Total Enrolment by Province, Program
Orientation, and Student Origin
Maritime residents Other Canadians
0
5
10
15
20
25
30
35
40
45
50
Tota
l en
rolm
en
t (t
ho
usa
nd
s)
0
2
4
6
8
10
12
0
1
2
3
4
5
6
7
8
Tota
l en
rolm
en
t (t
ho
usa
nd
s)
0
1
2
3
4
5
6
7
8
Non-Stem Programs
STEM Programs
International Students