1 reengineering the sipp: the new dynamics of economic well-being system david johnson cnstat panel...
TRANSCRIPT

1
Reengineering the SIPP: The New Dynamics of Economic
Well-being SystemDavid Johnson
CNSTAT Panel MeetingJanuary 26, 2007

2
Reengineering the SIPP

3
Dynamics of Economic Well-being System Mission
• To provide a nationally representative sample for evaluating:– annual and sub-annual dynamics of income
– movements into and out of government transfer programs
– family and social context of individuals and households
– interactions between these items

4
Purpose of SIPP• “The two primary goals of SIPP should be to provide improved
information on the distribution of income and other economic
resources for people and families and on eligibility for and
participation in government assistance programs.”
– The Future of the Survey of Income and Program Participation, NAS, 1993
• “... [The SIPP] provides an unprecedented opportunity to
ascertain the nature of income flows and program
participation, both for relatively short periods of time and over
extended periods of time, for individuals and families as they
experience changes in household composition, income, and
labor force participation.”
– Improving National Statistics on Children, Youth and Families, 1984

5
SIPP and Administrative Data
• “The planners of SIPP are to be congratulated for their intention to combine administrative data with field survey measurements. It is…clear that combining such disparate sources of information provides much richer insights into the status and behavior of individuals.”
- James Smith, Journal of Economic and Social Measurement, 1985

6
Uses Of SIPP
Government Agencies– SIPP is used by many government agencies to
measure the effectiveness of government programs, to anticipate effects of program changes, and to aid in program budget projections. Some specific examples are:
Survey of Income and Program Participation

7
• Department of Agriculture
– Model food stamp eligibility and measure food stamp participation
• Department of Health and Human Services
– Measure the economic effect of disabling conditions on children and
adults, and determine "triggers" that cause people to go on or to go
off programs.
• Social Security Administration
– Model SSI benefits, and the restructuring of Social Security such as
age threshold changes.
• Congressional Budget Office and Congressional Research Service
– Use micro-simulation to measure participation in major government
programs
Current Uses of SIPP

8
Dynamics of Economic Well-being Goals
• Cost reduction
• Improved accuracy
• Improved timeliness and accessibility
• Improved relevance
Use of annual data collection
Focused content selection
Lower attrition rates
Integrated administrative data
Improved documentation
Improved processing system
Work closely with disclosure review
board
Ongoing content determination process;
use of “hooks”
Use of ACS

9
Dynamics of Economic Well-being Progress
• Development of Event History Calendar and suggested survey content
• Meetings with stakeholders, and completion of matrices
• Use of ACS for sample• Administrative record prototypes• CNSTAT Panel

10
SIPP ’04 Panel Data Collection
2/04 – 5/07
2004 2005 2006 2007 2008 2009 2010
DEWS DataCollection
2009 and on
DEWS Planning2006 – 2009
SIPP ’04 PanelData Files Released
9/05 – 2/08
Time period covered by
SIPP ’04 Panel data files
2/04 – 5/07
Time period covered by DEWS data collection
2008
11
Dynamics of Economic Well-being Progress
• Development of Event History Calendar and suggested survey content
• Meetings with stakeholders, communications and content discussion
• Use of ACS for sample• Administrative record prototypes• CNSTAT Panel

12
Event history calendars
• “…the use of event history calendars has considerable potential in assisting respondents to reconstruct their personal pasts more completely and accurately, maximizing the quality of retrospective reports.”– Robert Belli

13
A few other surveys with Event History Calendars
• Panel Study of Income Dynamics – Univ. of Michigan
• National Survey of Family Growth – CDC/NCHS
• National Survey of Adolescent Health (AddHealth) - Univ. of North Carolina
• Los Angeles Family and Neighborhood Survey – UCLA
• English Longitudinal Study of Ageing – NatCen UK, University College London and the Institute for Fiscal Studies.
• Health and Retirement Study – Univ. Michigan (Nat. Inst. Ageing)
• 1998 National Retrospective Demographic Survey (EDER) – Mexico (INEGI)

14
PSID 2003 EHC instrument

15
Transitions and “seam bias” in SIPP
(Burkhead and Coder, 1985)(via Rips, et al., 2003)

16
PSID Labor transition rates, waves 1995 to 2005
0
10
20
30
40
T94_0
3_04
SEAM94
_95
SEAM95
_96
SEAM96
_97
T97_9
8WW
S
SEAM98
_99
T99_0
0WW
S
SEAM00
_01
T01_0
2WW
S
SEAM02
_03
T03_0
4WW
S
T04_1
1_12
Inflow UE+NE Outflow EU+EN

17
Seam 1995-2005 Self answers only, no immigrant samples
0
1
2
3
4
% o
f 9 p
ossi
ble
tran
sitio
ns
EU EN UE UN NE NU

18
DEWS InstrumentConsists of both BLAISE/EHC components
• EHC being developed in collaboration with– University of Nebraska and University of Michigan
• 4 EHC Prototypes currently under development by Census authoring staff
• First-pass at a ‘working’ integrated instrument slated for fall 2007

19
DEWS Survey
• Survey Instrument –– Annual administration
– Follow movers
– Limited feedback
• Calendar –– Improvement on other designs by
integrating more closely with Blaise, utilizing the Blaise database.
• Simultaneous development of processing and instrument
Front
Coverage
Demographics
Calendar UniverseScreeners
Residence History
Marriage/Cohab/Fertility
Labor Force (emp/unemp/leave)
Soc. Welfare/Soc. Ins./Other
Health Insurance Coverage
Labor Force (CommutingWork Schedule, etc.)
Assets / Balances
Annual ProgramInformation - Other GI -
Lump Sum - etc.
Child Support / Child Care
Health (Insurance,Expenditures, Disability
Wrap-up and MissingFollow-up visit/call Info
Back
Wkrs Cmp/Disab/Unemp Cmp
Housing (MaterialWellbeing), Basic Needs,
Child Well-Being
Landmark EventsEHC
CALENDAR
Type 2 Roster/Info
Relationship
Enrollment

20
Dynamics of Economic Well-being Progress
• Development of Event History Calendar and suggested survey content
• Meetings with stakeholders, communications and content discussion
• Use of ACS for sample• Administrative record prototypes• CNSTAT Panel

21
URL: http://www.sipp.census.gov/sipp/dewsSource: U.S. Census Bureau, Demographics Survey Division,
Survey of Income and Program Participation branch
Census Bureau Links: Home · Search · Subjects A-Z · FAQs · Data Tools · Catalog · Census 2000 · Quality · Privacy Policy · Contact Us
Assessing Users’ Needs

22
STAKEHOLDER MATRIX
Annual/Monthly
Critical Stakeholder
Variable (Y/N)Current SIPP Variable Description Section
ASST140 Royalties - ISS Code 140 AssetsASST150 Other financial investments, other - ISS Code 150 AssetsATT-SCHL School enrollment - full time/part time DemographicsBUS-ID1 Check Item S1 - First business ID number Labor ForceBUS-ID2 Check Item S1 - Second business ID number Labor ForceCAIDCOV Medicaid coverage Health InsuranceCARECOV Medicare coverage Health InsuranceCHAMP Health insurance this month (military) Health InsuranceCLSSWRK1 Employee of which type of organization - first job Labor ForceCLSSWRK2 Employee of which type of organization - second job Labor ForceDISAB Disability that limits type of work Health InsuranceED-FINAN Educational financing: GI Bill, Pell Grant, SEOG, et. al. Education
Variable Name(SIPP 1993)
23
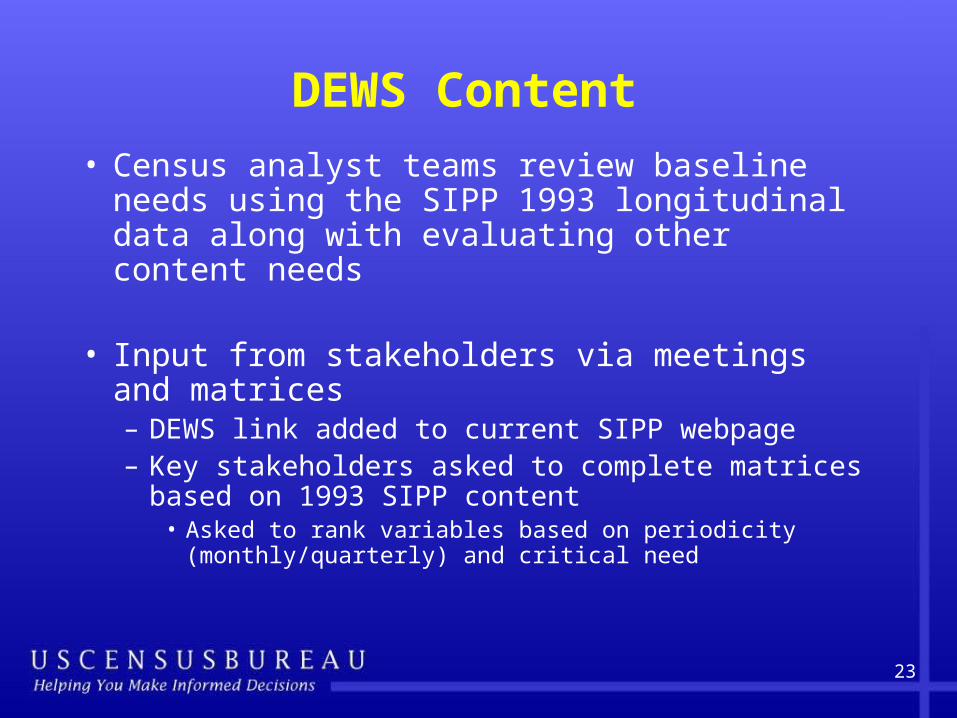
DEWS Content
• Census analyst teams review baseline needs using the SIPP 1993 longitudinal data along with evaluating other content needs
• Input from stakeholders via meetings and matrices– DEWS link added to current SIPP webpage– Key stakeholders asked to complete matrices
based on 1993 SIPP content• Asked to rank variables based on periodicity
(monthly/quarterly) and critical need

24
DEWS Content (cont.)
• Similar to the content of SIPP core– Limited topics from the topical modules included
• Use of “hook” questions for future supplementary data collections
• Questions only asked one-time per year
• Reference period is the previous calendar year

25
New Survey: Basic versus supplemental products
Basic Topics
Demographics General IncomeLabor Force Health Insurance
Assets EducationProgram Participation
Child Support
Well-being Disability
Wealth

26
Summary of DEWS ContentBased on Stakeholder Matrices
Demographics
• Family/Subfamily type and relationships within
• Marital status (Spouse Identifier)
• Race/Sex/Ethnicity
• School enrolment & highest level completed
• Age - Birth month/year
• Parent/Guardian identifier

27
Programs and Participation
• TANF – Recipiency and Coverage
• Food Stamps – Recipiency and Coverage
• WIC – Coverage
• Other welfare – Payments and Coverage
• Receipt of free and/or reduced price school meals
• Public housing – Residence/Unit and Amount
General Income
• Social Security – Coverage
• Retirement from job/business

28
General Income (cont.)
• Transfer, Property, Poverty, or Other Income and/or Earnings Totals for Persons/Families/Households
Labor Force
• Employment/Armed Forces status
• Hours worked per job/business
• Earnings/Pay Rate per job/business
• Number of Weeks – Employed, looking for work, or without pay per job/business
• Industry/Occupation Code
Assets
• Rental Property – Ownership and/or Income

29
Assets (cont.)
• Ownership, Interest, and/or Income from – Savings, CD’s Money Market Accounts/Funds, Bonds, Mortgages, etc.
• Ownership and/or Dividends received from – Stocks, Mutual Funds, and other financial investments
• Income received from – Royalties
Health Insurance
• Medicare/Medicaid coverage, Military health insurance coverage and/or ownership, Employer provided health insurance coverage
Disability
• Work limitation/prevention

30
Stakeholder Summary
• Responding users indicated a broad need for most of SIPP core content.
• Select areas were added based on lost topical module content.

31
DEWS Content Determination
What we need from stakeholders
Comments on survey content presented in December
Complete content matrices online(http://www.sipp.census.gov/sipp/dews.html)
Participate in winter/spring sessions on topic area details Health General income/Government programs Assets and wealth Labor force Demographics and other items
All DEWS stakeholder matrix recommendations will be finalized by Spring.

32
Dynamics of Economic Well-being Progress
• Development of Event History Calendar and suggested survey content
• Meetings with stakeholders, communications and content discussion
• Use of ACS for sample• Administrative record prototypes• CNSTAT Panel
33
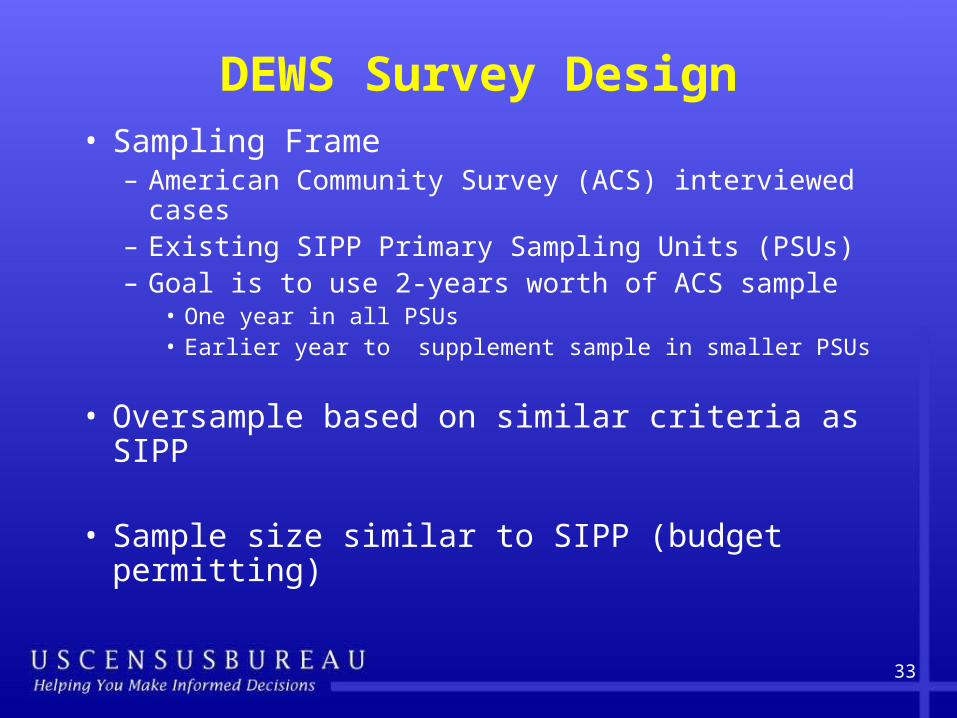
DEWS Survey Design• Sampling Frame
– American Community Survey (ACS) interviewed cases
– Existing SIPP Primary Sampling Units (PSUs)– Goal is to use 2-years worth of ACS sample
• One year in all PSUs• Earlier year to supplement sample in smaller PSUs
• Oversample based on similar criteria as SIPP
• Sample size similar to SIPP (budget permitting)

34
Dynamics of Economic Well-being Progress
• Development of Event History Calendar and suggested survey content
• Meetings with stakeholders, communications and content discussion
• Use of ACS for sample• Administrative record prototypes• CNSTAT Panel

35
Administrative Records Prototypes
• National-level prototype– CPS and SIPP linked with administrative records
data at the person level
• State-level prototype– Many social programs administered at the state-
level– 2004/2005 SIPP data linked to social program
data from the states of Maryland and Illinois

36
Percent found by SSN verification, ADDRESS, and NAME search (CPS, SIPP and ACS)
67.5%
0.0%
36.4%17.8%
74.4%
7.7%15.1%
50.2%
6.9%
0.0%
20.0%
40.0%
60.0%
80.0%
100.0%
2001 CPS 2001 SIPP 2001 ACS
SSN Verification Address Search Name Search
94%

37
Matching Valid SSA Master Benefit records With 2004 SIPP
Panel -Retirement BenefitsNo Retired
Benefit-Valid
SSN (SSA)
Retired Benefit-
Valid SSN (SSA)
No Retired
Benefit-
SIPP
84.8% 1.3%
Retired
Benefit-
SIPP
2.9% 10.9%

38
Matching Valid SSA Master Benefit records With 2004 SIPP
Panel -Retirement BenefitsNo Retired
Benefit-Valid
SSN (SSA)
Retired Benefit-
Valid SSN (SSA)
No Retired
Benefit-
SIPP
84.8% 1.3%
Retired
Benefit-
SIPP
2.9% 10.9%

39
Matching Valid SSA Master Benefit records With 2004 SIPP
Panel -Retirement BenefitsNo Retired
Benefit-Valid
SSN (SSA)
Retired Benefit-
Valid SSN (SSA)
No Retired
Benefit-
SIPP
84.8% 1.3%
Retired
Benefit-
SIPP
2.9% 10.9%

40
Matching Valid SSA Master Benefit records With 2004 SIPP
Panel -Retirement BenefitsNo Retired
Benefit-
Valid SSN
Retired
Benefit-
Valid SSN
Imputed NO
Benefit- NO
Valid SSN
Imputed
Benefit- NO
Valid SSN
No Retired
Benefit-SIPP 43.4% 0.7% 38.4% 3.8%
Retired
Benefit-SIPP 1.5% 5.6% 4.1% 2.5%

41
Synthetic Data:Means for various retirement income sources using actual admin data are similar to synthetic data for many demographic groups
(SIPP 2004 Panel and Monthly Benefit Amount)
0
200
400
600
800
1000
1200
Own Retirement Disability
Black Males - Admin Black Males - SyntheticBlack Males - SIPP White Males - AdminWhite Males - Synthetic White Males - SIPP

42
Coefficients using various measures of Retirement income (in logs) as dependent variable
Variables Synthetic Admin Rec Orig. SIPPIntercept 6.577 6.570 5.358had a college degree 0.140 0.140 0.104was divorced in 1st wave -0.262 -0.260 0.084was divorced at some point in life 0.008 0.008 0.008was born in a foreign country -0.033 -0.032 -0.043had a graduate degree 0.133 0.136 0.045had health insurance in Jan. 2004 0.021 0.022 0.035had a high school degree 0.075 0.077 0.039reported Hispanic ethnicity -0.100 -0.095 -0.057log total family income, Jan. 2004 0.027 0.028 0.176attended some college but no degree 0.075 0.077 0.053number of children in the family, Jan. 2004 -0.029 -0.029 -0.061received welfare payments in January 2004-0.162 -0.163 -0.204was widowed in 1st wave -0.126 -0.123 0.028was widowed at some point in life 0.046 0.046 0.052

43
Possible Data Products
CompletePublic Data
Internal filesand RDC
SyntheticData
DEWS

44
Dynamics of Economic Well-being Progress
• Development of Event History Calendar and suggested survey content
• Meetings with stakeholders, communications and content discussion
• Use of ACS for sample• Administrative record prototypes• CNSTAT Panel

45
Goals of CNSTAT Panel on DEWS
• To evaluate:– the costs/benefits of various strategies for data linkage,
– accessibility of relevant administrative records,
– operational feasibility of linking administrative records
and survey data,
– quality and usefulness of linked data, and
– strategies for providing public access to the linked data
while protecting the confidentiality of individual
respondents