1 fermilab recycler ring bpm upgrade based on digital receiver technology r. webber, j. crisp, p....
TRANSCRIPT

1
FermiLab Recycler Ring BPM Upgrade Based on Digital Receiver Technology
R. Webber, J. Crisp, P. Prieto, D. Voy, C. Breigel, C. McClure,
M. Mengel, S. Pordes

2
System Overview
1. Beam position split-plate capacitive pickups in the beamline vacuum.2. Signal preamplifiers in the beam enclosure near the beamline.3. Analog signal receiver (transition modules) and digital signal processing
electronics in the service buildings.4. Timing signal generators.5. VME based “front-end” data acquisition and control computers and support
hardware.6. Integrated position and intensity calibration system.
Pre-Amp GC-814
Software
Position
(A-B)/(A+B) * (-1)*Scale Factor + Offset
B
A
A
B
Calibration

3
Signal Path
FOR MORE INFO...
4
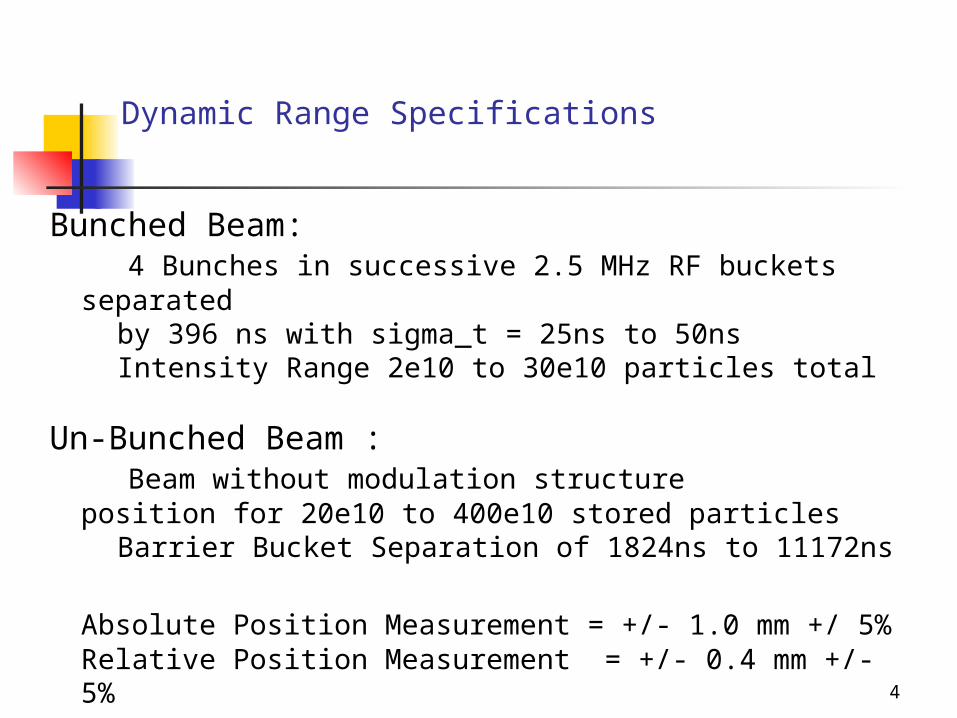
Dynamic Range Specifications
Bunched Beam: 4 Bunches in successive 2.5 MHz RF buckets separated by 396 ns with sigma_t = 25ns to 50ns Intensity Range 2e10 to 30e10 particles total
Un-Bunched Beam : Beam without modulation structure
position for 20e10 to 400e10 stored particles Barrier Bucket Separation of 1824ns to 11172ns
Absolute Position Measurement = +/- 1.0 mm +/ 5%Relative Position Measurement = +/- 0.4 mm +/- 5%

5
Signal Processing Modes
1) 2.5 MHz Ensemble-This mode measures the magnitude of the 2.5 MHz signal, the 4 bunch beam structure.
2) 2.5 MHz Bunch-by-Bunch-Measures the position of each of the four 2.5 MHz bunches.
3) 2.5 MHz Narrow Band-Measures the magnitude of the 2.5 MHz signal integrated over an interval corresponding to about 64 TBD Recycler turns.
4) Un-bunched Ensemble-This mode measures the magnitude of the signal from beam confined in a barrier bucket.
5) Un-bunched Head or Tail-This measures the position of the head and/or the tail of the barrier bucket structure beam.
6) 89 KHz Narrow Band-This mode measures the magnitude of the 89 KHz signal integrated over an interval corresponding to 32 Recycler turns).
6
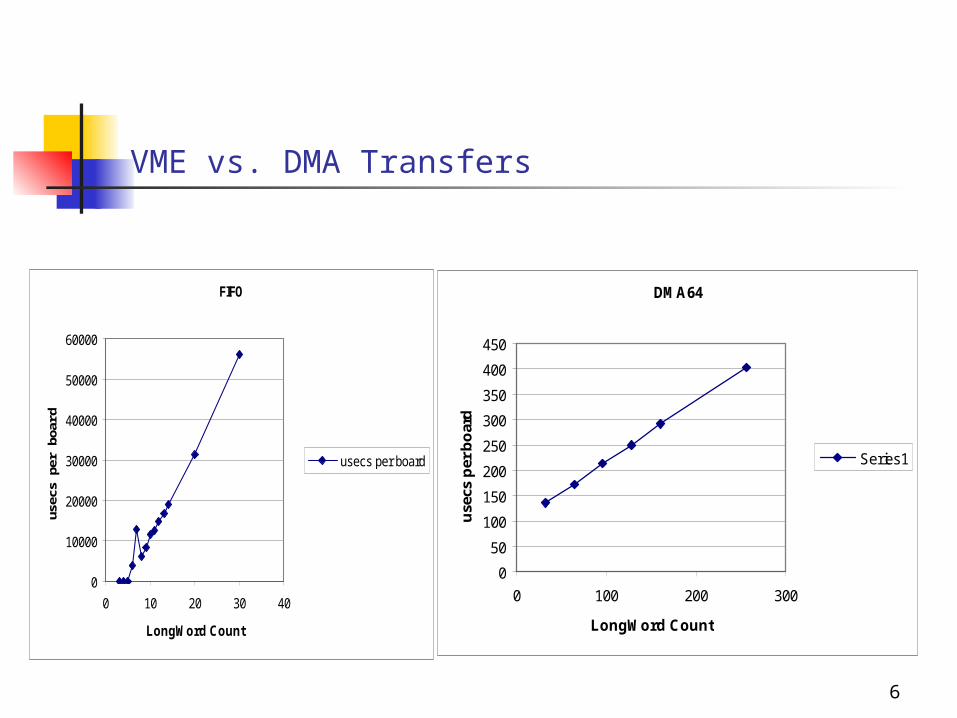
VME vs. DMA Transfers
FIFO
0
10000
20000
30000
40000
50000
60000
0 10 20 30 40
LongWord Count
usec
s pe
r boa
rd
usecs per board
DMA64
0
50
100
150
200
250
300
350
400
450
0 100 200 300
LongWord Count
use
cs p
er b
oar
dSeries1

7
Signal Attenuation In Datalene Twisted Pair Multi-Conductor Cable Between Pre-Amp Output and Transition Module Input
Cable Attenuation For Bunch Length
0
0.2
0.4
0.6
0.8
1
0 500 1000 1500
Cable Length (feet)
UnBunch
50ns
25ns
Signals with small sigma_t are attenuated more than larger sigm_t (50ns)
Signals with small sigma_t are attenuated more than larger sigm_t (50ns)

8
Frequency Response Measurements:
Green trace: BPM plate terminated in 50 Ω
Red Trace: BPM, PreAmp, and Transition Module
-100.0
-80.0
-60.0
-40.0
-20.0
0.0
20.0
0.01 0.10 1.00 10.00 100.00
MHz
S21 [
db
]
Vertical
1.5kohm preamp
into 50 ohms

9
Un-Bunched Pbar Beam Digitized through DDC Board Displayed Using Engineering Page
Fs = 80 MHz
Display Range= +/- 32768
Fs = 80 MHz
Display Range= +/- 32768

10
Engineering Page Display of Plate A and B I and Q Pair, Magnitude, Phase, Position, and Intensity

11
System Noise Contributions to Position Error
RMSRMSRMSDA VVV 58.6983.1773889.0/
m
mmrmsnoise
1.5
4
128
1
V62
V1.1
V75.1284P
rmsTranseAmpVPr rmsrms VHzeHz
nV6.1083899.417.22
rmserror me
emcorrectedP 9.17
1020
1070*1.5

12
-40
-20
0
20
40
-70 -60 -50 -40 -30 -20 -10 0 10
A+B [db]
Pos
[mm
]
0
0.25
0.5
0.75
1
-70 -60 -50 -40 -30 -20 -10 0 10
A+B [db]
Pos
Nois
e [m
m]
DDC Position vs Intensity Scan for 53 MHz 84 Bunches Using AWG Source and Switchable Attenuators Plotted as Measured Position vs. Intensity
Calculated Position noise and Measured Position Noise vs Measured Intensity (70μVrms of A/D noise at Highest Intensity)

13
Recycler TBTBPM Measured Positions Fitted To Sine Function

14
Histogram of RMS Position Deviation For Vertical and
Horizontal BPM’s