1 eea energy work dr. anca-diana barbu eionet energy meeting, 5-6 march 2015, copenhagen
TRANSCRIPT
1
EEA Energy WorkEEA Energy Work
Dr. Anca-Diana Barbu
EIONET energy meeting, 5-6 March 2015, Copenhagen
Energy support measures and Energy support measures and their impact on innovation in their impact on innovation in
renewables sectorrenewables sector
2
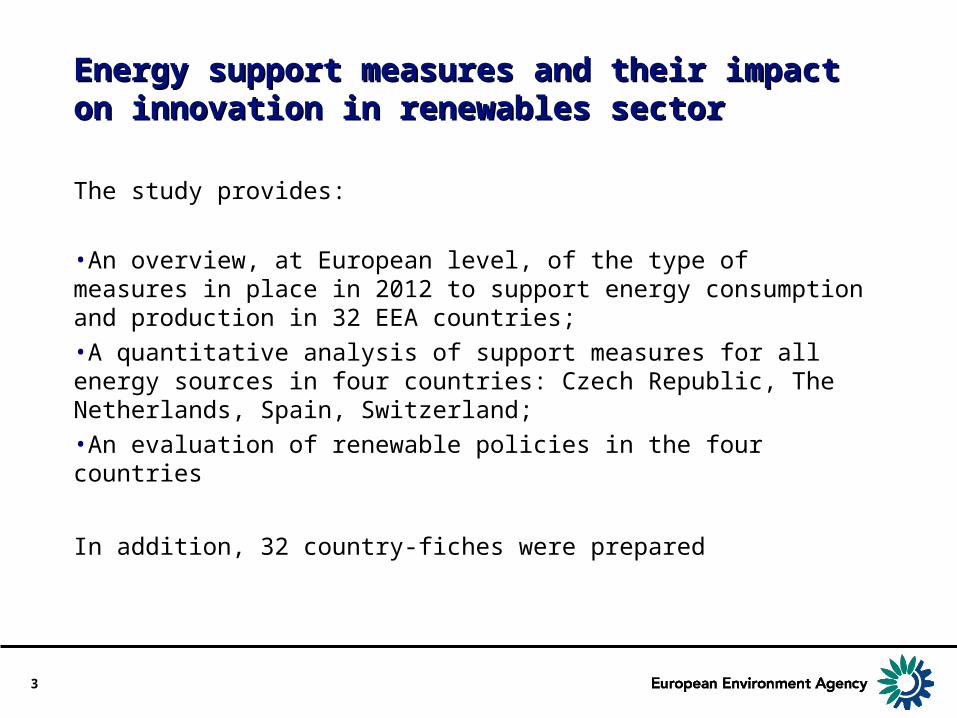
Energy support measures and their impact Energy support measures and their impact on innovation in renewables sectoron innovation in renewables sector
The study provides:
•An overview, at European level, of the type of measures in place in 2012 to support energy consumption and production in 32 EEA countries;•A quantitative analysis of support measures for all energy sources in four countries: Czech Republic, The Netherlands, Spain, Switzerland;•An evaluation of renewable policies in the four countries
In addition, 32 country-fiches were prepared
3
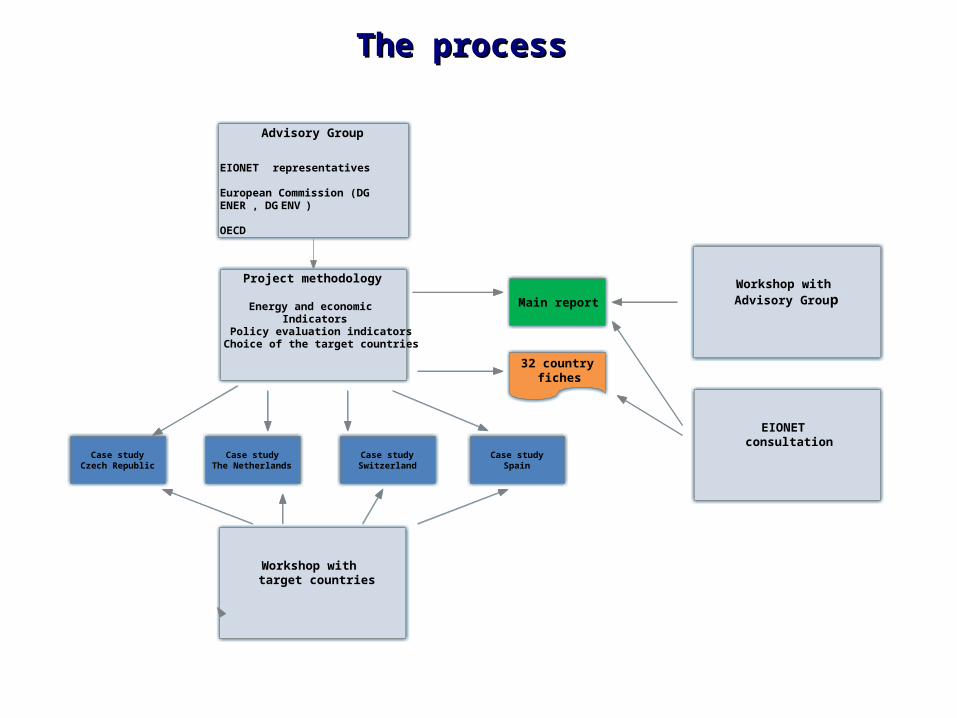
Project methodology
Energy and economicIndicators
Policy evaluation indicatorsChoice of the target countries
Advisory Group
EIONET representatives
European Commission (DGENER, DG ENV)
OECD
32 countryfiches
Case studyCzech Republic
Case studySwitzerland
Case studySpain
Case studyThe Netherlands
Workshop withAdvisory Group
Workshop withtarget countries
Main report
EIONETconsultation
The processThe process
5
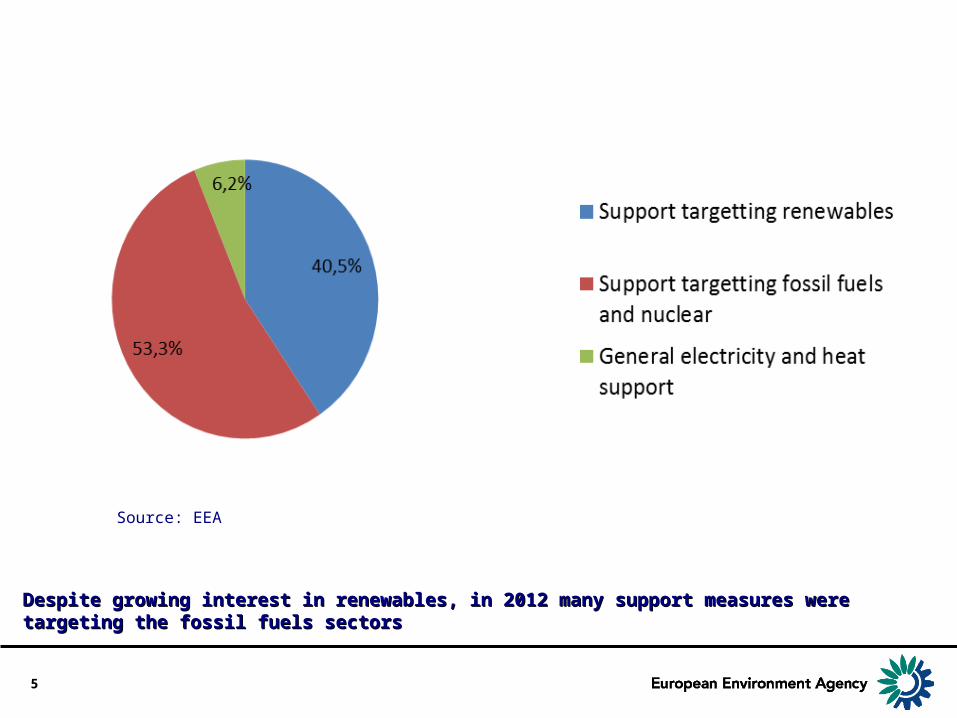
Despite growing interest in renewables, in 2012 many support measures were Despite growing interest in renewables, in 2012 many support measures were targeting the fossil fuels sectorstargeting the fossil fuels sectors
Source: EEA
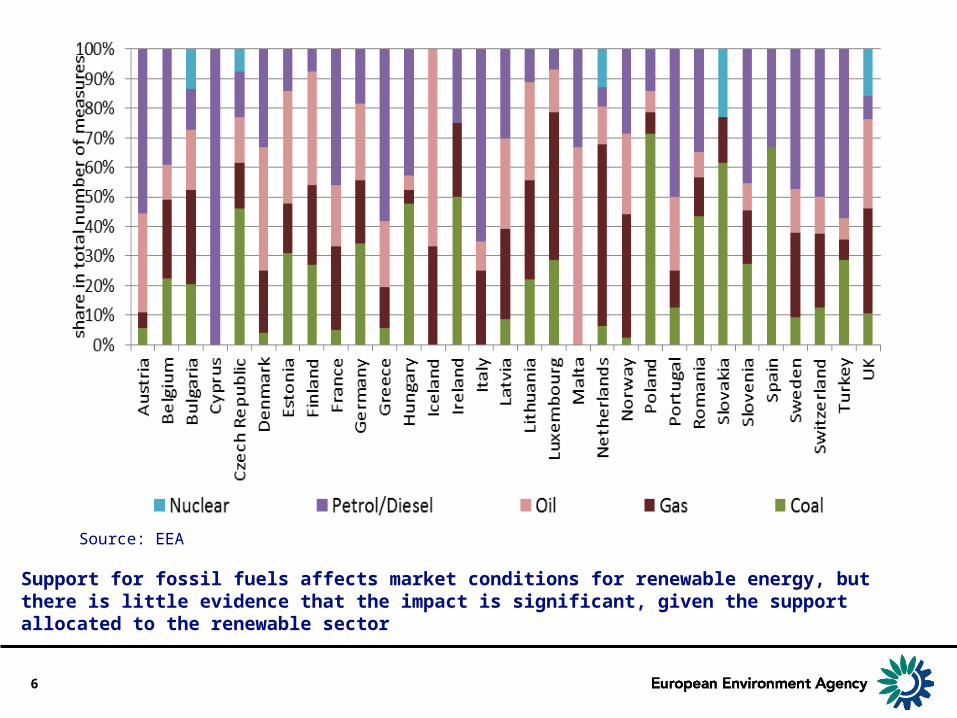
Support for fossil fuels affects market conditions for renewable energy, but there is little evidence that the impact is significant, given the support allocated to the renewable sector
6
Source: EEA
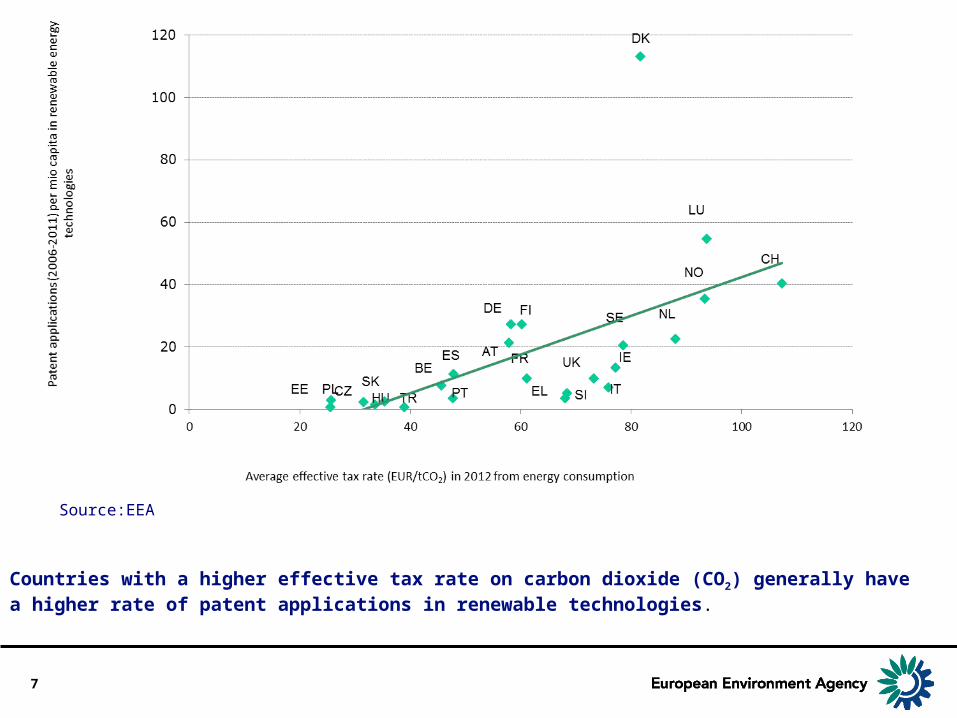
Countries with a higher effective tax rate on carbon dioxide (CO2) generally have a higher rate of patent applications in renewable technologies.
7
Source:EEA
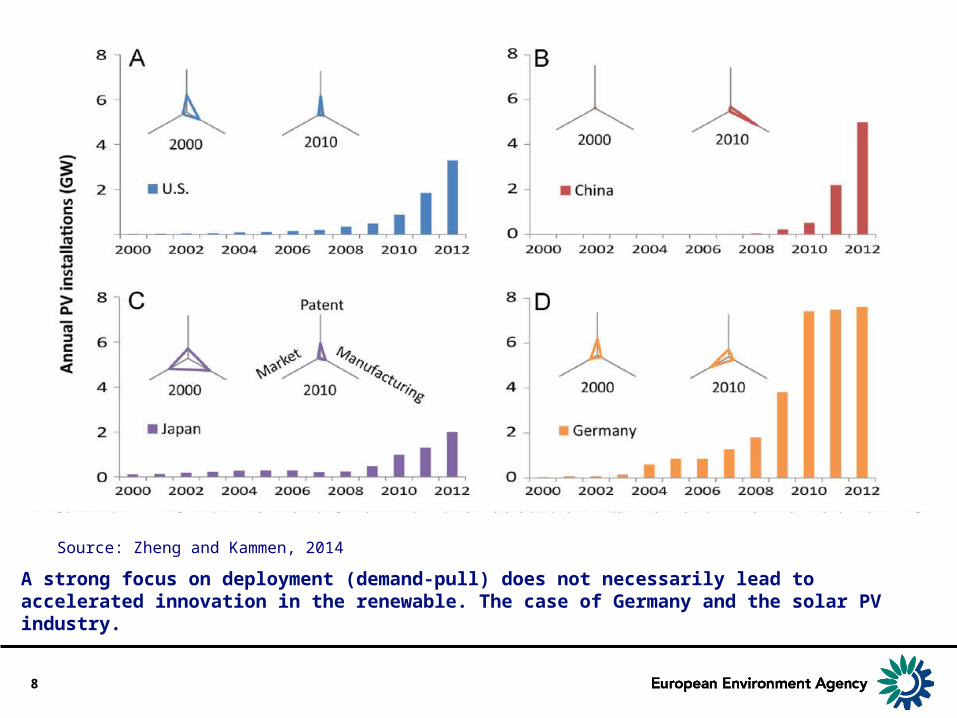
A strong focus on deployment (demand-pull) does not necessarily lead to accelerated innovation in the renewable. The case of Germany and the solar PV industry.
8
Source: Zheng and Kammen, 2014
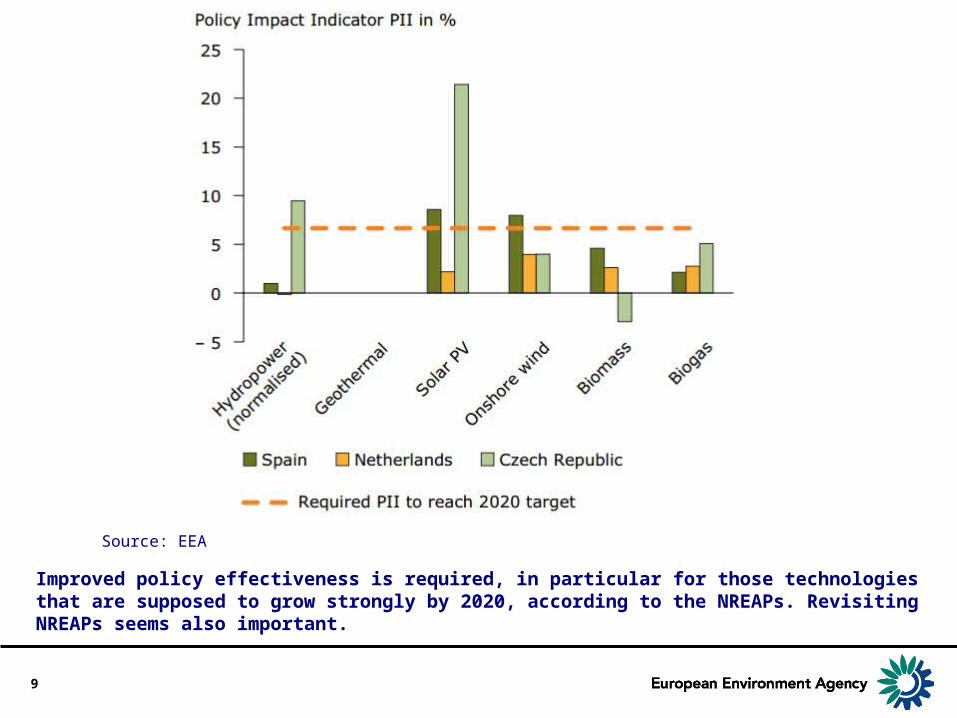
Improved policy effectiveness is required, in particular for those technologies that are supposed to grow strongly by 2020, according to the NREAPs. Revisiting NREAPs seems also important.
9
Source: EEA
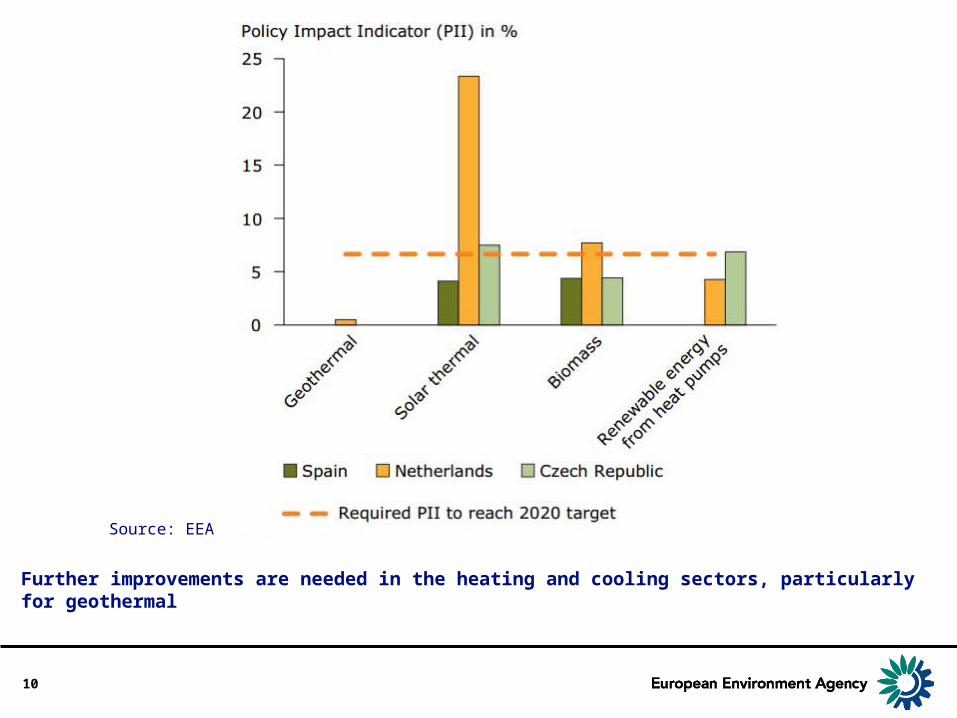
Further improvements are needed in the heating and cooling sectors, particularly for geothermal
10
Source: EEA
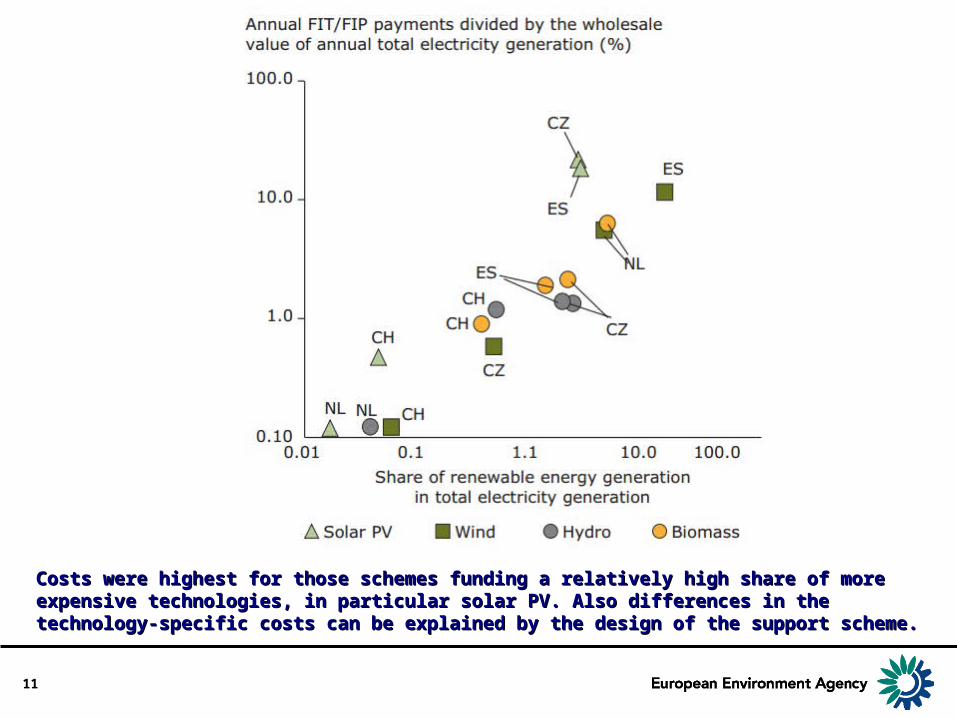
Costs were highest for those schemes funding a relatively high share of more Costs were highest for those schemes funding a relatively high share of more expensive technologies, in particular solar PV. Also differences in the technology-expensive technologies, in particular solar PV. Also differences in the technology-specific costs can be explained by the design of the support scheme. specific costs can be explained by the design of the support scheme.
11
12
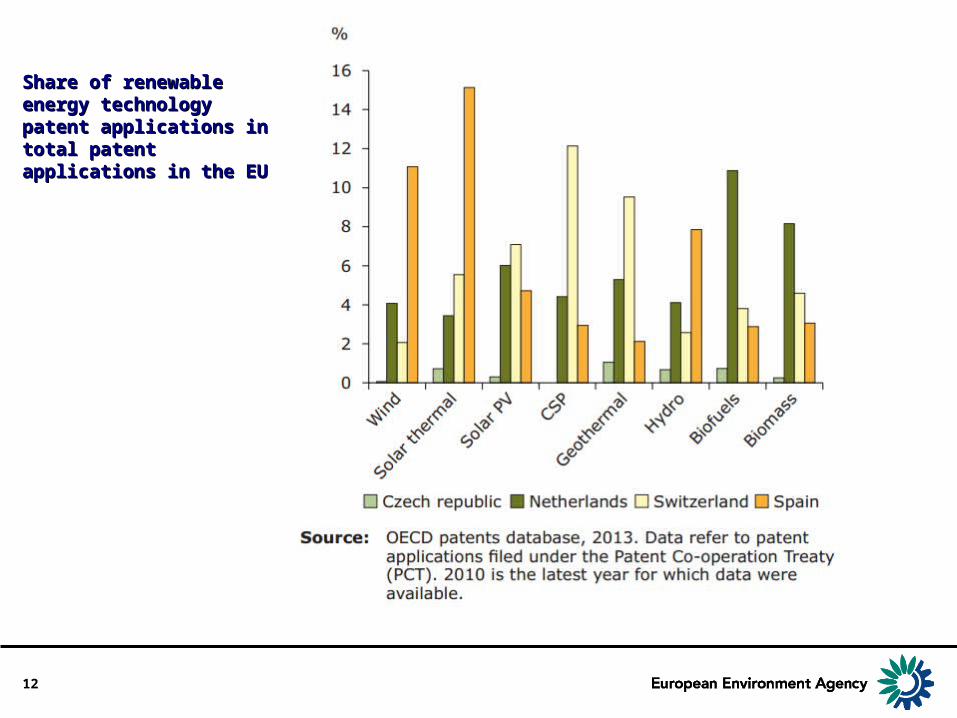
Share of renewable Share of renewable energy technology energy technology patent applications in patent applications in total patent applications total patent applications in the EUin the EU
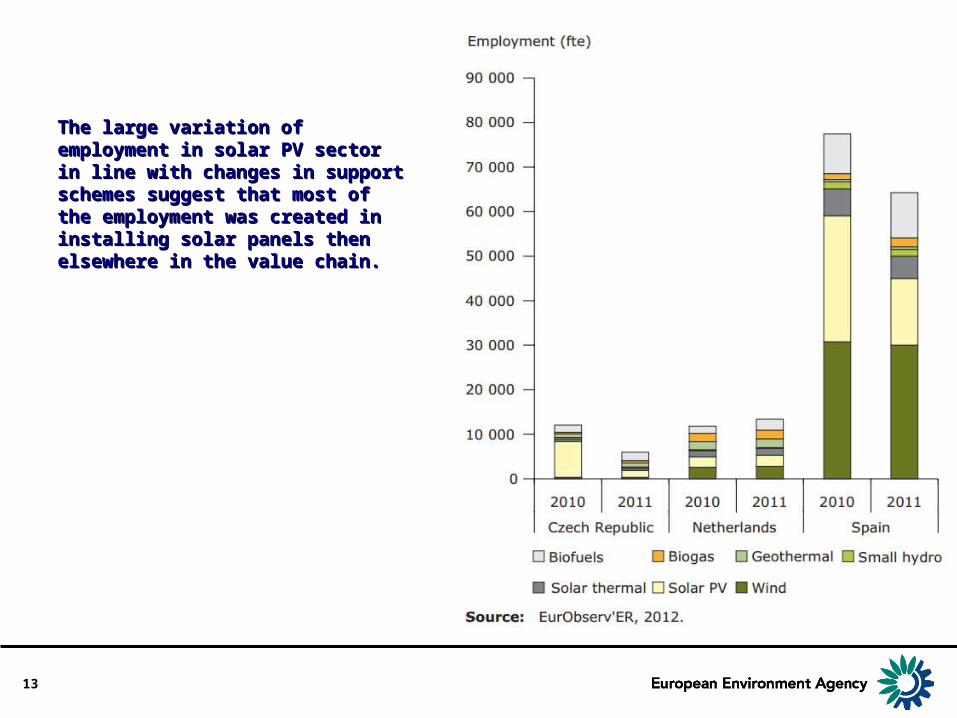
13
The large variation of The large variation of employment in solar PV sector in employment in solar PV sector in line with changes in support line with changes in support schemes suggest that most of schemes suggest that most of the employment was created in the employment was created in installing solar panels then installing solar panels then elsewhere in the value chain. elsewhere in the value chain.
Questions for the EIONETQuestions for the EIONET
• Is similar work available in the EIONET countries? If yes, what is the approach taken?
• How can we improve the methodology employed in this report? Of particular interest is the type of correlations that we could choose to strengthen the link between energy support measures and innovation.
• Are there any other indicators to measure innovation in the
renewable sector besides applications to the European Patent Office?
• How do the member countries use such information?
14
EEA Energy and environment EEA Energy and environment indicatorsindicators
15
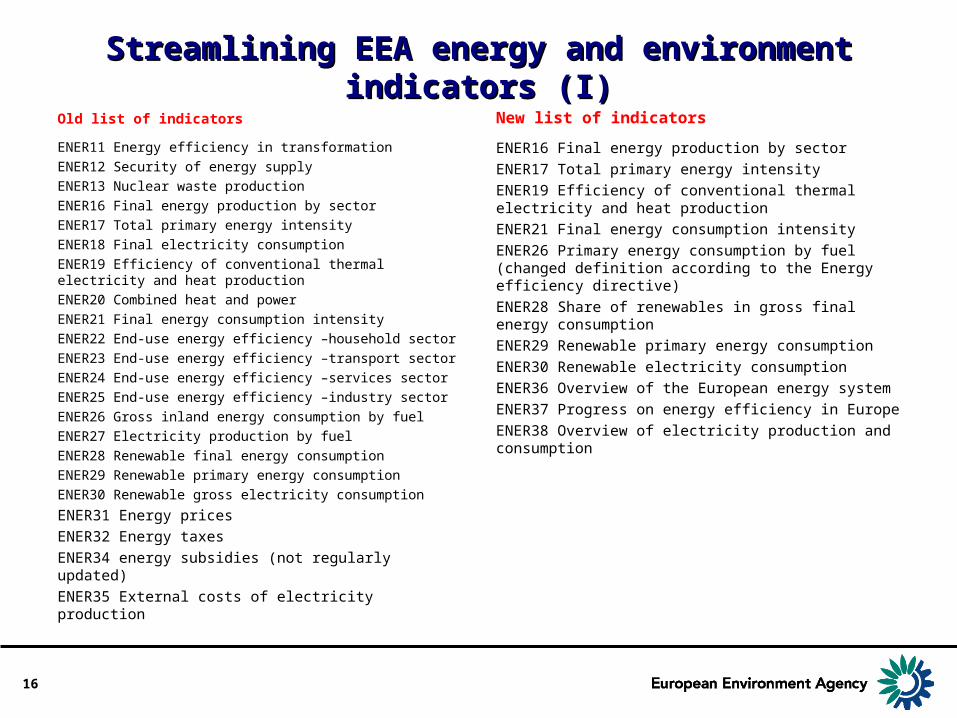
Streamlining EEA energy and environment Streamlining EEA energy and environment indicators (I)indicators (I)
Old list of indicators New list of indicators
ENER16 Final energy production by sectorENER17 Total primary energy intensityENER19 Efficiency of conventional thermal electricity and heat productionENER21 Final energy consumption intensityENER26 Primary energy consumption by fuel (changed definition according to the Energy efficiency directive)ENER28 Share of renewables in gross final energy consumption ENER29 Renewable primary energy consumptionENER30 Renewable electricity consumptionENER36 Overview of the European energy systemENER37 Progress on energy efficiency in EuropeENER38 Overview of electricity production and consumption
16
ENER11 Energy efficiency in transformationENER12 Security of energy supplyENER13 Nuclear waste productionENER16 Final energy production by sectorENER17 Total primary energy intensityENER18 Final electricity consumptionENER19 Efficiency of conventional thermal electricity and heat productionENER20 Combined heat and powerENER21 Final energy consumption intensityENER22 End-use energy efficiency –household sectorENER23 End-use energy efficiency –transport sectorENER24 End-use energy efficiency –services sectorENER25 End-use energy efficiency –industry sectorENER26 Gross inland energy consumption by fuelENER27 Electricity production by fuelENER28 Renewable final energy consumptionENER29 Renewable primary energy consumptionENER30 Renewable gross electricity consumption
ENER31 Energy pricesENER32 Energy taxesENER34 energy subsidies (not regularly updated)ENER35 External costs of electricity production
Streamlining EEA energy and environment Streamlining EEA energy and environment indicators (II)indicators (II)
2011 Pilot project 4 countries Austria, Croatia, Poland, SwitzerlandObjectives:
• What are the key policy questions addressed in national reporting mechanisms on energy and environment?
• What types of indicators are being used to answer those questions?
• What are the differences and commonalities with the indicators developed within the EEA energy and environment reporting mechanism?
• Do countries compare themselves with other countries in their national reporting? How are the EEA indicators used in the countries reviewed?
17
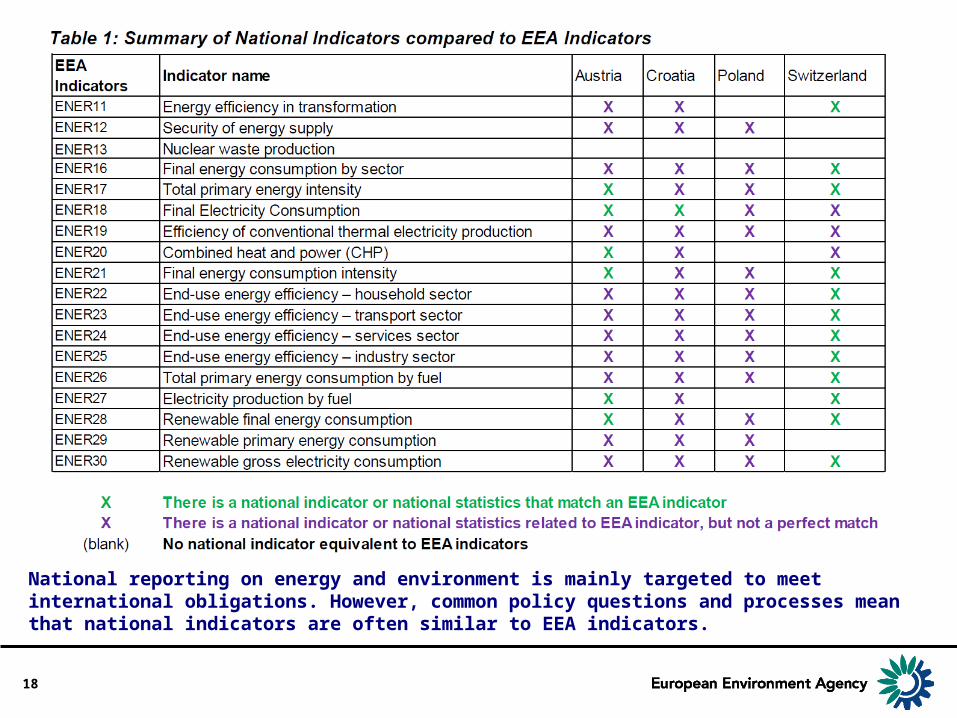
National reporting on energy and environment is mainly targeted to meet international obligations. However, common policy questions and processes mean that national indicators are often similar to EEA indicators.
18
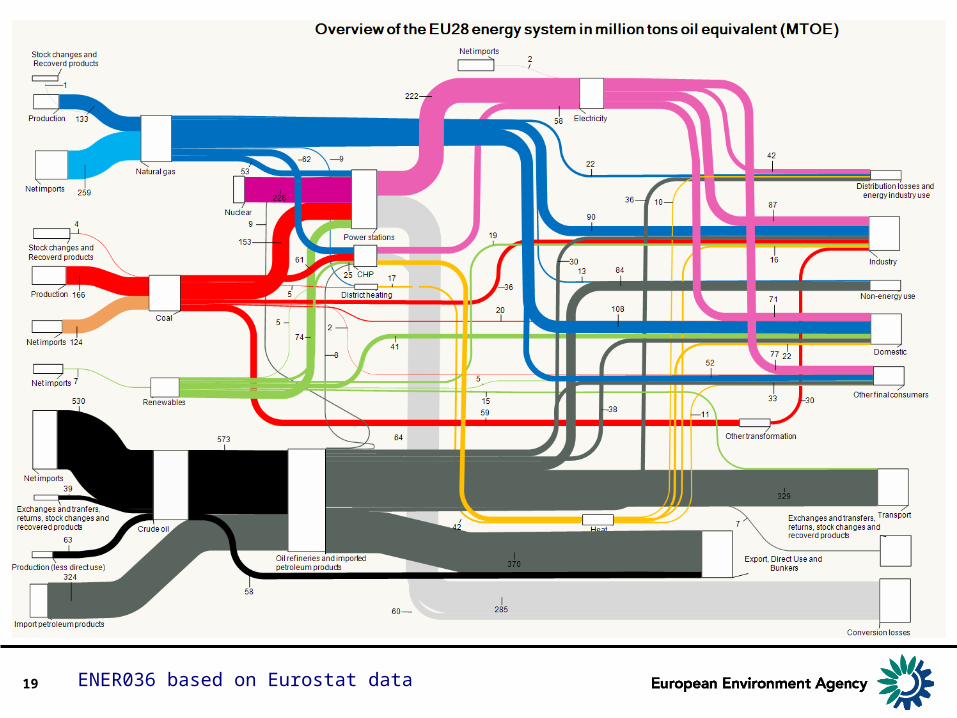
19 ENER036 based on Eurostat data
20
-2,0
-1,5
-1,0
-0,5
0,0
0,5
1,0
Consumption per dwelling
More appliances
Larger homes Ef f iciency progress
Behaviour, others
annual % change
-1,4%
-1,2%
-1,0%
-0,8%
-0,6%
-0,4%
-0,2%
0,0%EU%/year
Total decrease Decrease f rom new dwellings
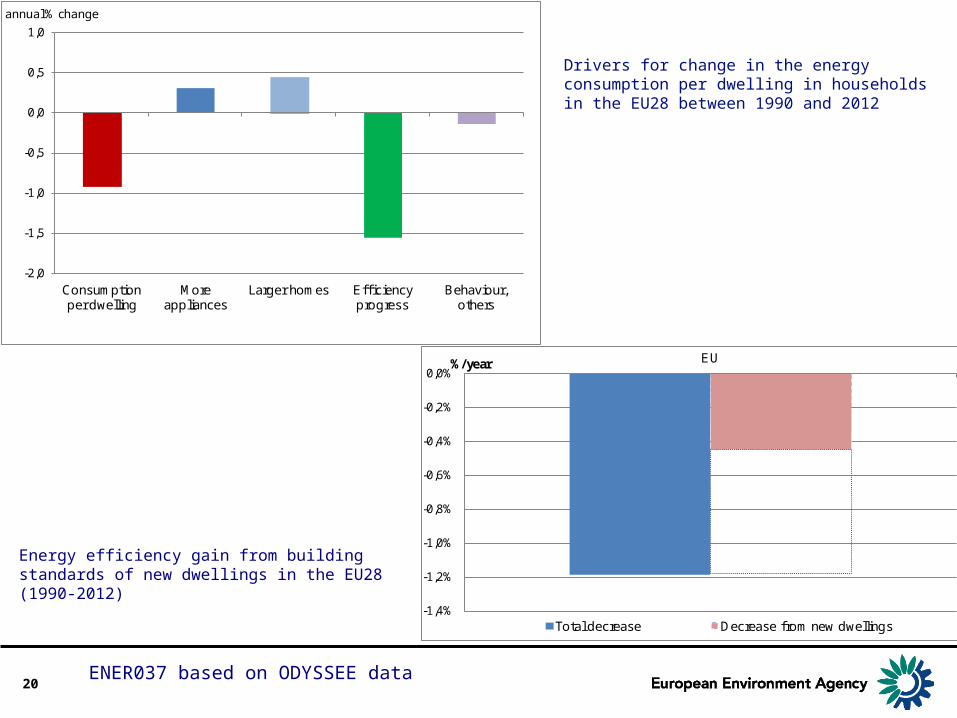
Energy efficiency gain from building standards of new dwellings in the EU28 (1990-2012)
Drivers for change in the energy consumption per dwelling in households in the EU28 between 1990 and 2012
ENER037 based on ODYSSEE data
Questions for the EIONET Questions for the EIONET
• Are these indicators still relevant?
• Are there new indicators that have become relevant and are extensively used in the EIONET countries to monitor environmental impacts of energy production and consumption for which data is available at European level?
21
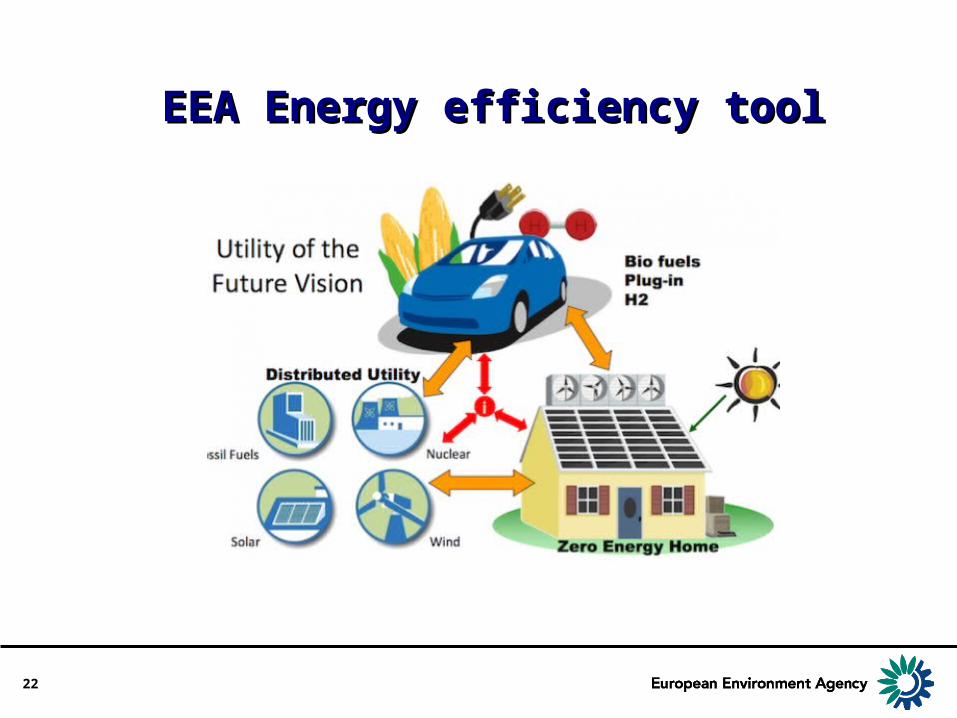
EEA Energy efficiency toolEEA Energy efficiency tool
22
The energy efficiency 2020 targetsThe energy efficiency 2020 targets
23
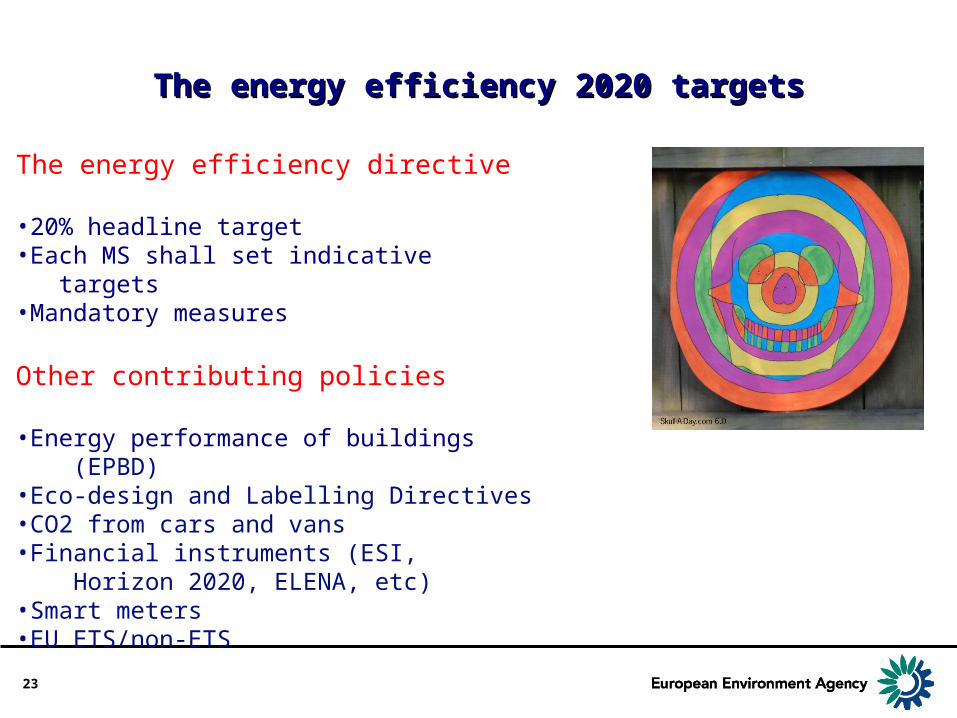
The energy efficiency directive
•20% headline target•Each MS shall set indicative targets•Mandatory measures
Other contributing policies
•Energy performance of buildings (EPBD)•Eco-design and Labelling Directives•CO2 from cars and vans•Financial instruments (ESI, Horizon 2020, ELENA, etc)•Smart meters•EU ETS/non-ETS
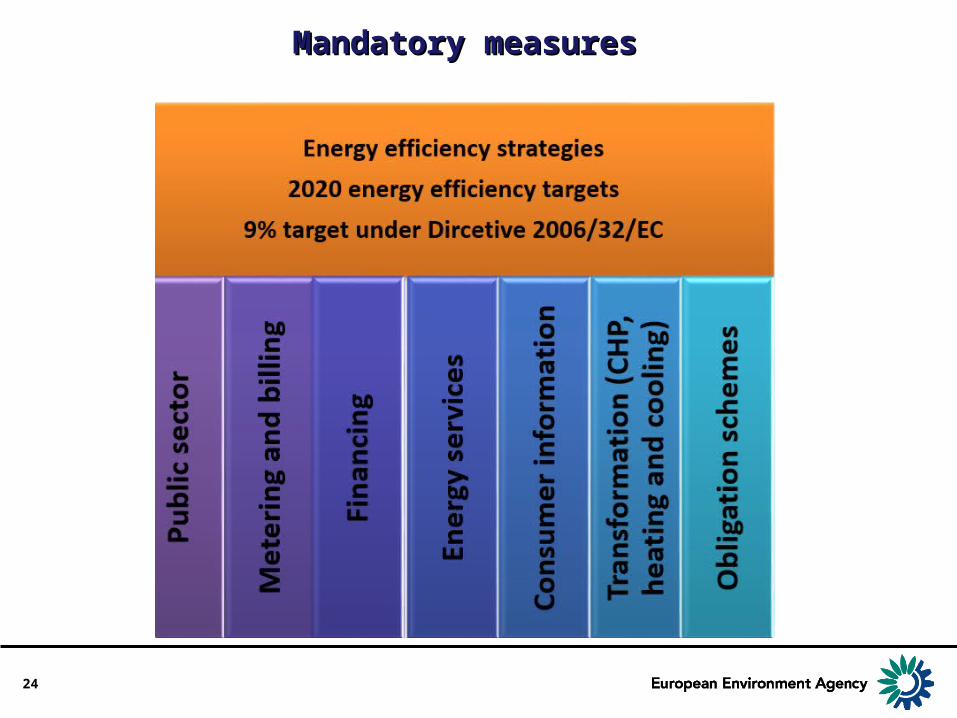
Mandatory measuresMandatory measures
24
Monitoring progress towards the EE targetsMonitoring progress towards the EE targets
• Commission: tailored Primes scenarios and decomposition analysis
• European project: CA Energy efficiency directive• ODYSSEE-MURE • The Coalition for energy savings• EEA: Trends and projections report • ECEEE• Other information platforms
No tool that provides a clear view on progress towards the target disaggregated by relevant components
25
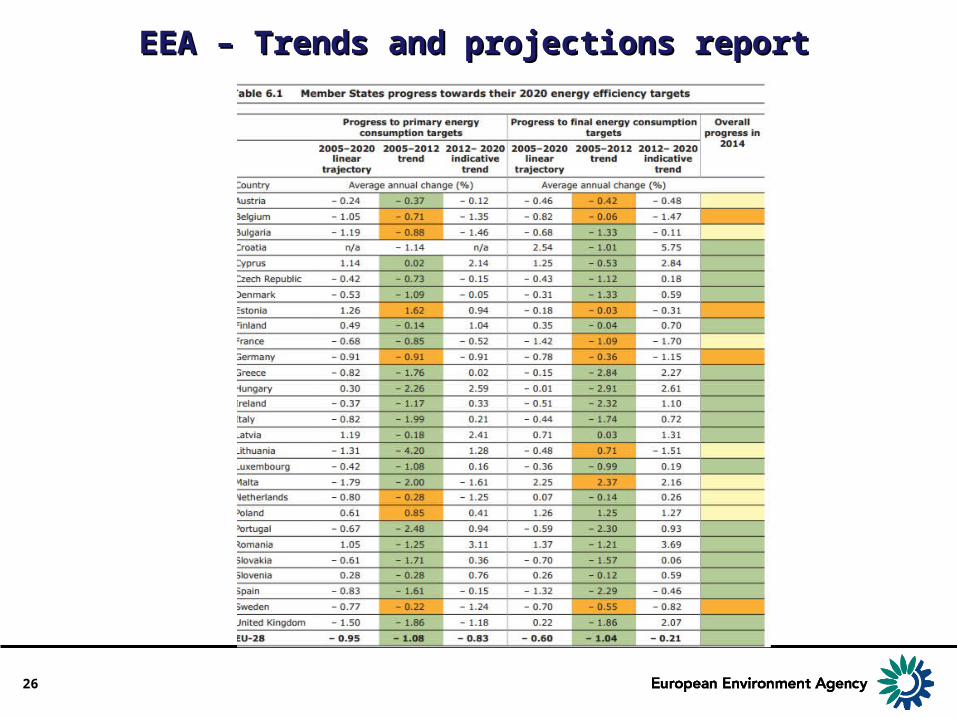
EEA – Trends and projections reportEEA – Trends and projections report
26
Tools investigatedTools investigated
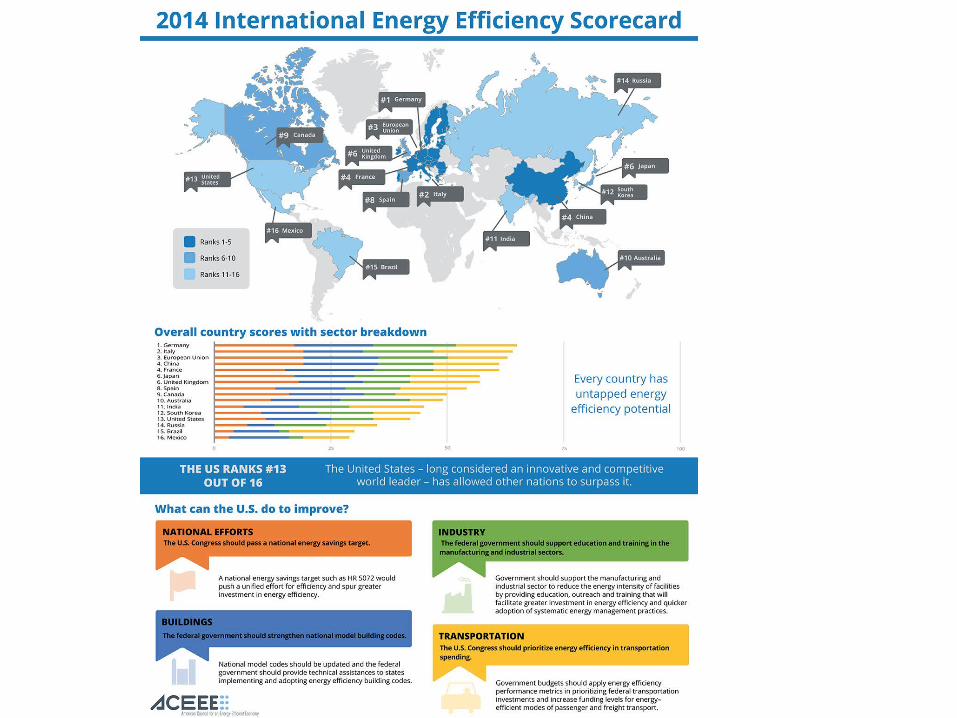
• The American Council for an energy efficient economy- The international energy efficiency scorecard (IEESC)
• Yale Center for Environmental Law and Policy – Environmental Sustainability Index (ESI) and the Environmental Performance Index (EPI)
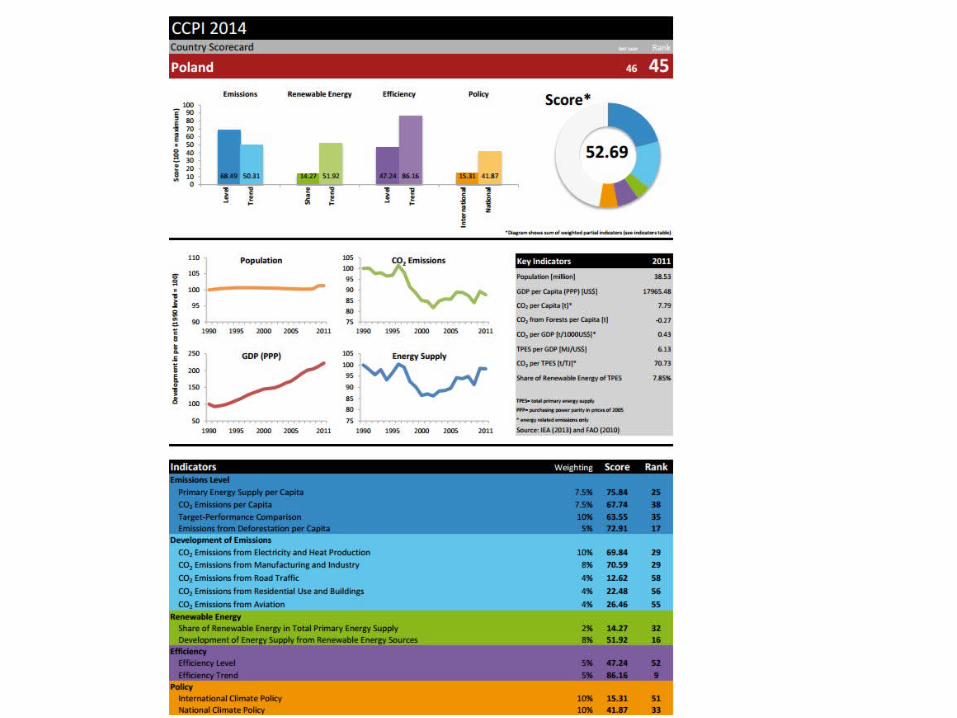
• Germanwatch - The climate performance index (CPI)
27
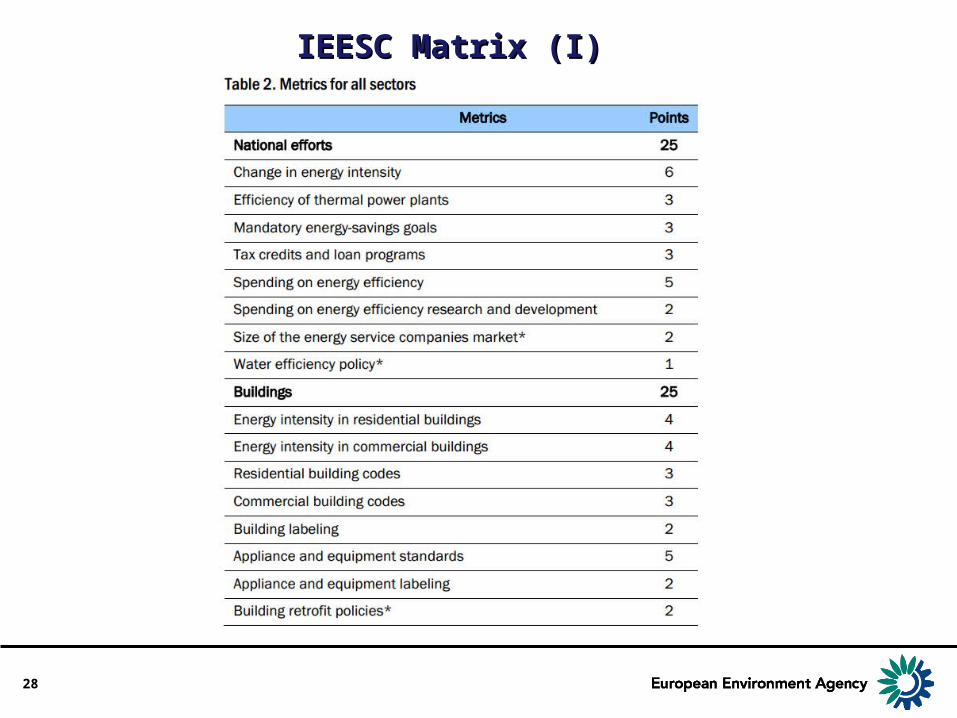
IEESC Matrix (I)IEESC Matrix (I)
28
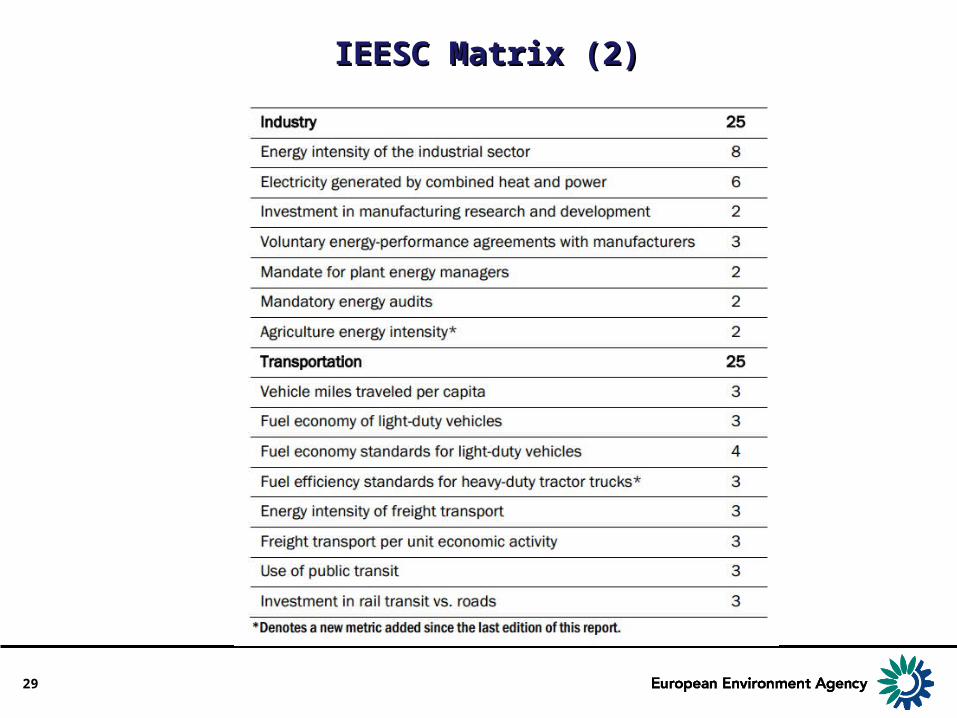
IEESC Matrix (2)IEESC Matrix (2)
29
IEESC developmentIEESC development
• From internationally recognised sources complemented with country research
• 31 indicators equally split between policies and quantifiable measures of performance
• Policy measures assessed based on best practices (e.g. targets); local policies not included
• Equal weighting for each sector; points for each indicator within each sector allocated based on expert opinion
• For quantifiable indicators thresholds have been determined based on expert opinion
Example: efficiency of thermal power plants thresholds 3 points awarded for overall efficiency of at least 39% 2 points for 31% 1 point for equal to or above 27% no points for countries with less than 27%.
30
EE tool: why?EE tool: why?
31
Allows for:
•A more nuanced assessment of progress towards the energy efficiency targets;
•Comparable information across countries;
•Identification of key drivers and policy gaps
•Easy communication of difficult messages
EE tool: how?EE tool: how?
• Build on the work we are already doing: GHG emissions, renewable energy, energy efficiency (e.g. obligation schemes, smart meters, etc), transport (e.g. CO2 from cars and vans)
• Keep costs in check through methodological choices, more extensive use of the EIONET for country specific data, work in-house, etc.
• Increase policy relevance involving relevant stakeholders early in the process, influence work in relevant EU projects (e.g. CA for energy efficiency directive), simple and attractive ways to communicate results tailored to the needs of specific audiences
32
EE tool: what? EE tool: what?
• Policy developments (e.g. good practices)
• Performance (e.g. energy consumption indicators, energy efficiency obligation schemes, CO2 from cars and vans, etc)
• Innovation
33
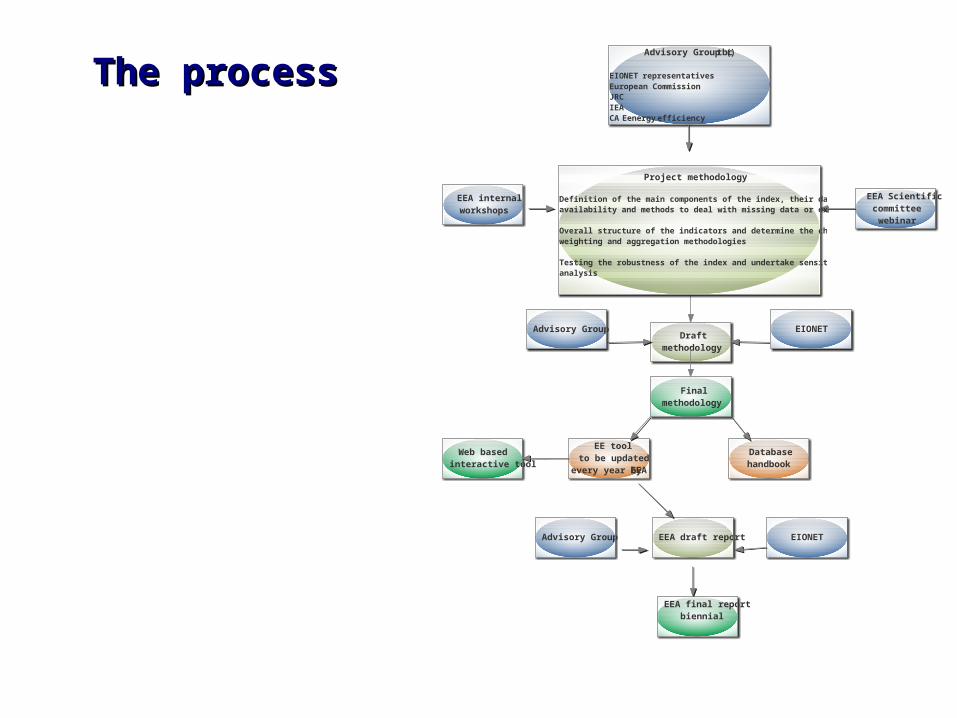
Draftmethodology
EEA Scientificcommitteewebinar
EEA internalworkshops
Advisory Group EIONET
EE toolto be updated
every year byEEA
Databasehandbook
EEA draft reportAdvisory Group EIONET
EEA final reportbiennial
Web basedinteractive tool
Advisory Group (tbc)
EIONET representativesEuropean CommissionJRCIEACAEenergy efficiency
Project methodology
Definition of the main components of the index, their dataavailability and methods to deal with missing data or extreme values
Overall structure of the indicators and determine the choice ofweighting and aggregation methodologies
Testing the robustness of the index and undertake sensitivityanalysis
Finalmethodology
The processThe process
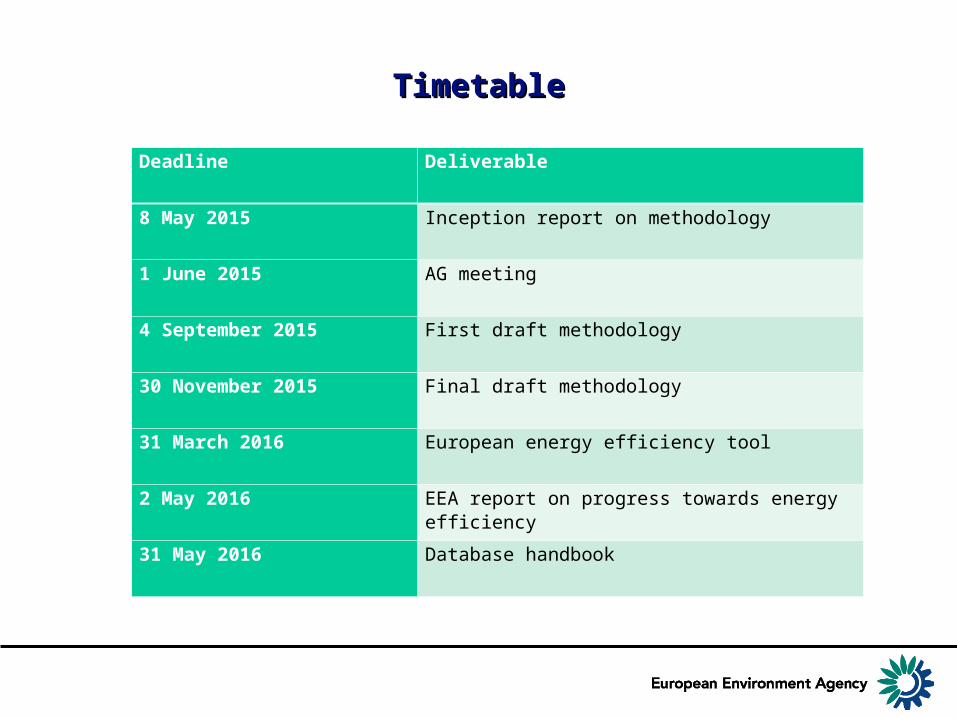
TimetableTimetable
Deadline Deliverable
8 May 2015 Inception report on methodology
1 June 2015 AG meeting
4 September 2015 First draft methodology
30 November 2015 Final draft methodology
31 March 2016 European energy efficiency tool
2 May 2016 EEA report on progress towards energy efficiency
31 May 2016 Database handbook
Questions for the EIONETQuestions for the EIONET
• How do member countries monitor progress towards the 2020 energy efficiency targets?
• What components do member countries believe are essential for the EEA energy efficiency tool (e.g. which sectors, which horizontal measures)?
• What elements do the member countries find useful to focus on when communicating results?
• How would the member countries use such a tool?
38
Energy efficiency proxy Energy efficiency proxy
39
Why do we need a t-1 proxy for energy Why do we need a t-1 proxy for energy efficiency ?efficiency ?
In the GHG Trends and projections report, we assess progress towards 2020 targets in an integrated way
T-1 proxies already available for GHG emissions and Renewables
40
How do we measure energy efficiency? How do we measure energy efficiency?
41
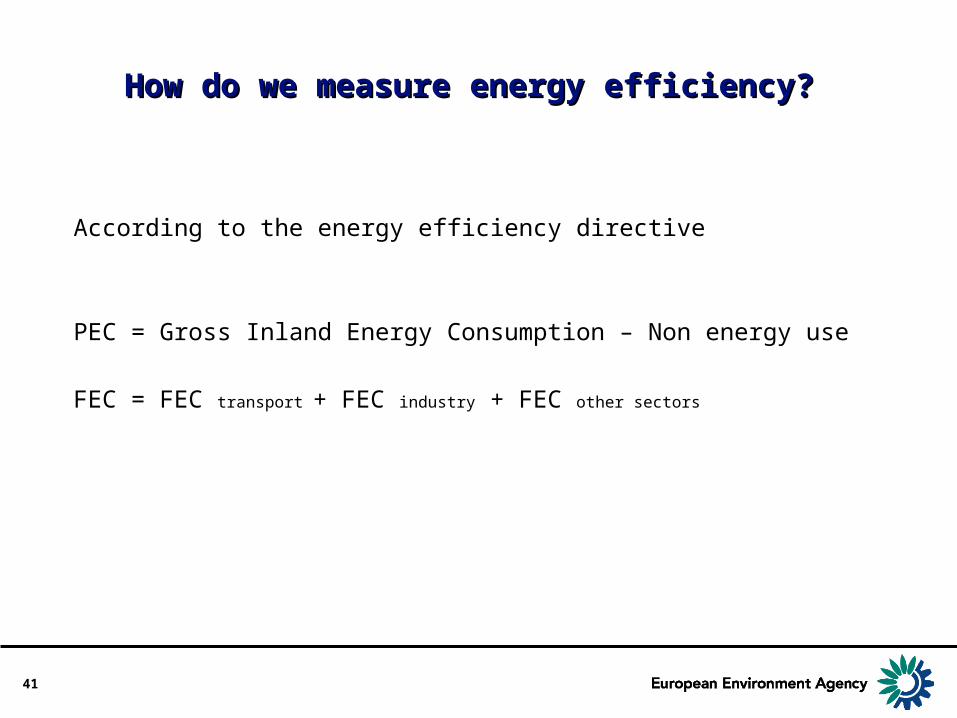
According to the energy efficiency directive
PEC = Gross Inland Energy Consumption – Non energy use
FEC = FEC transport + FEC industry + FEC other sectors
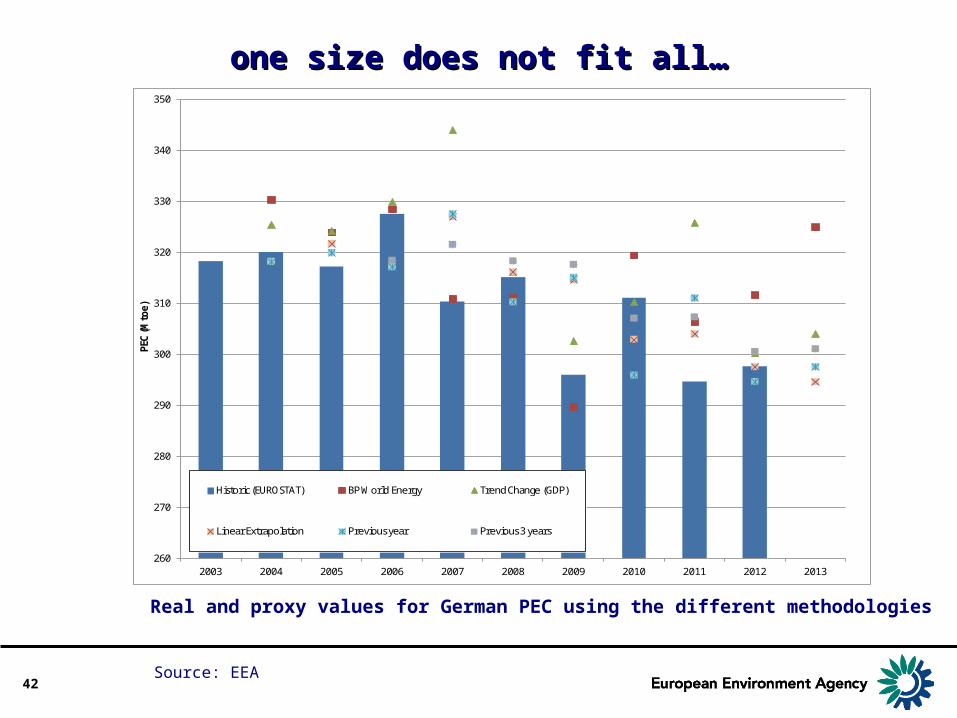
one size does not fit all…one size does not fit all…
42
260
270
280
290
300
310
320
330
340
350
2003 2004 2005 2006 2007 2008 2009 2010 2011 2012 2013
PEC
(Mto
e)
Historic (EUROSTAT) BP World Energy Trend Change (GDP)
Linear Extrapolation Previous year Previous 3 years
Real and proxy values for German PEC using the different methodologies
Source: EEA
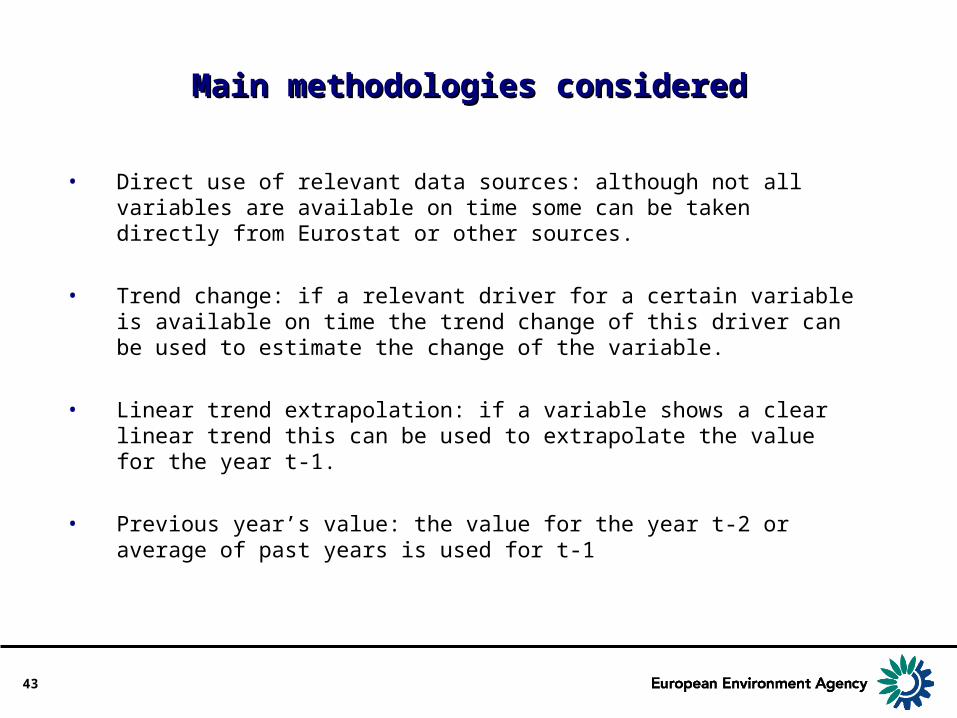
Main methodologies considered Main methodologies considered
• Direct use of relevant data sources: although not all variables are available on time some can be taken directly from Eurostat or other sources.
• Trend change: if a relevant driver for a certain variable is
available on time the trend change of this driver can be used to estimate the change of the variable.
• Linear trend extrapolation: if a variable shows a clear linear trend this can be used to extrapolate the value for the year t‑1.
• Previous year’s value: the value for the year t-2 or average of past years is used for t‑1
43
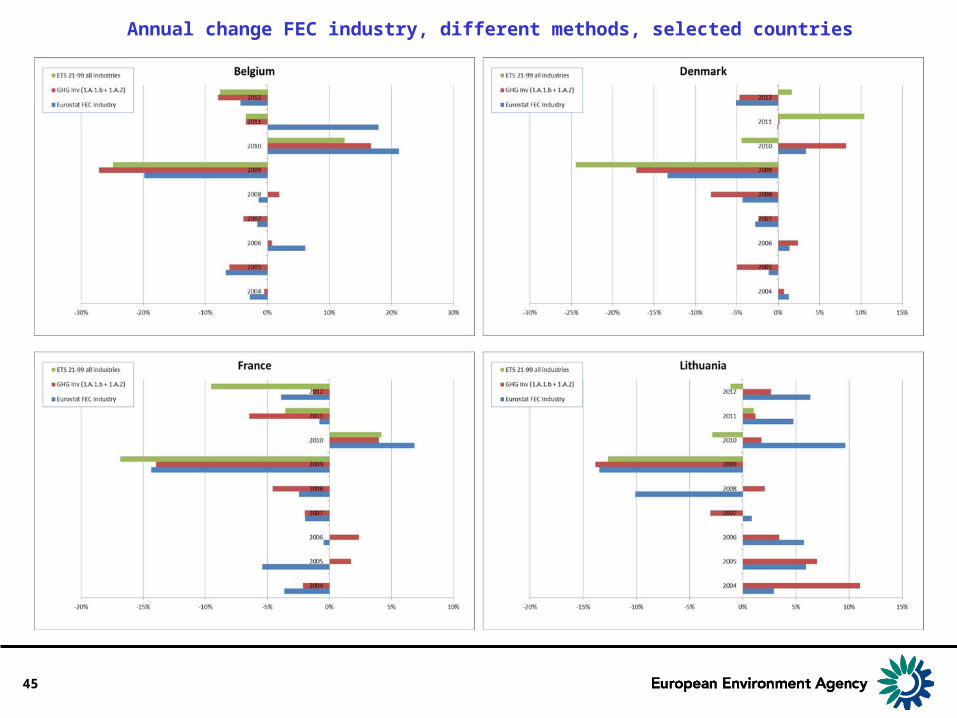
Annual change FEC industry, different methods, selected countries
45
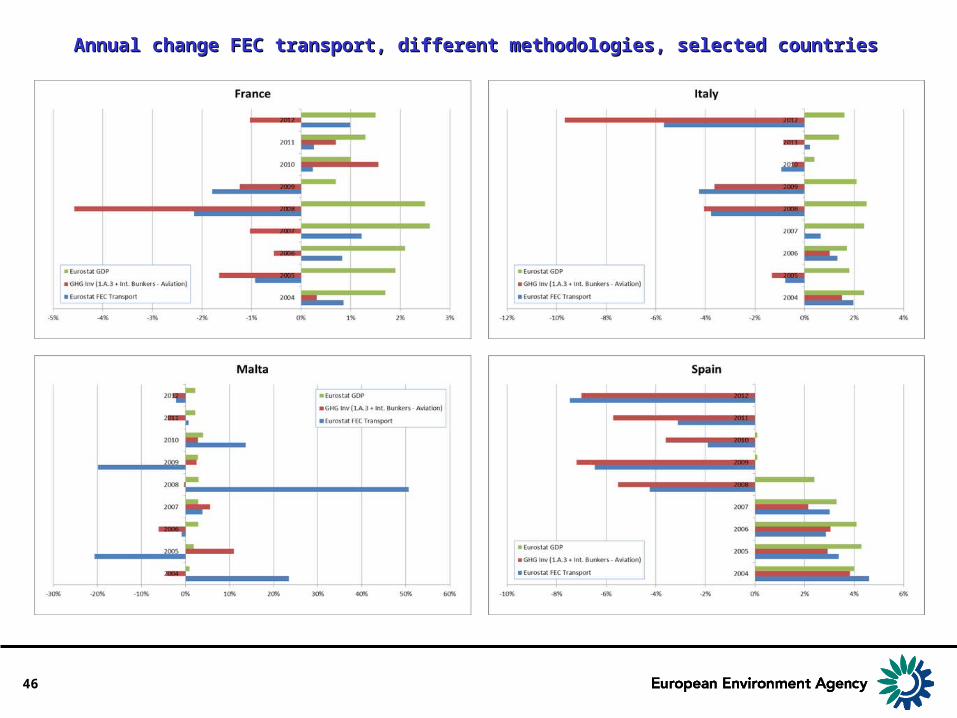
Annual change FEC transport, different methodologies, selected countriesAnnual change FEC transport, different methodologies, selected countries
46
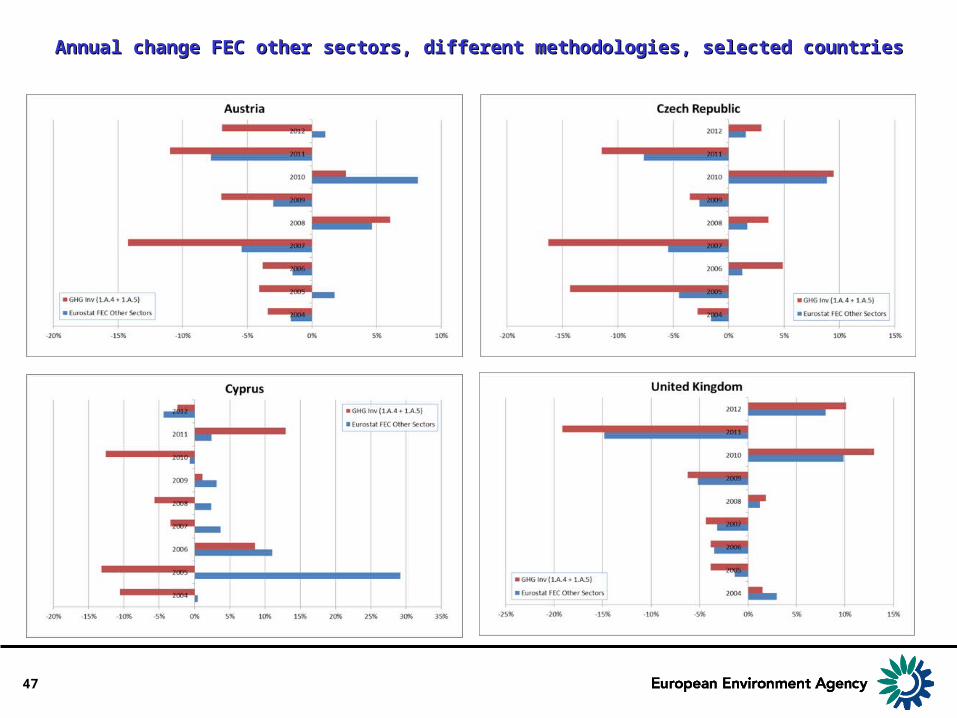
Annual change FEC other sectors, different methodologies, selected countriesAnnual change FEC other sectors, different methodologies, selected countries
47
Data sources consideredData sources considered
• Eurostat Energy statistics - quantities, annual and monthly data (nrg_10, nrg_10m)
• Approximated EU GHG inventory• Approximated EU RES share • BP Statistical Review of World Energy • European Network of Transmission System Operators for
Electricity (ENTSO-E) Production data • US Energy Information Administration (EIA)• ENERDATA (ODYSSEE database)
48
Questions for EIONETQuestions for EIONET
• Proposed methodologies to calculate t-1 proxy values for different variables. Are there any other methodologies we can consider?
• Proposed data sources. Are there any other relevant data sources that could be used?
49