1 blueprint to accelerate the achievement of african american students
Post on 22-Dec-2015
215 views
TRANSCRIPT

1
Blueprint to Accelerate the Achievement of African American Students
Blueprint to Accelerate the Achievement of African American Students

San Diego Unified School District Mission StatementSan Diego Unified School District Mission Statement
All San Diego students will Graduate with the Skills, Motivation, Curiosity and Resilience to Succeed
in their choice of College and Career in order to Lead and Participate in the society of
Tomorrow.

3
The Excellence GapThe Excellence Gap
“When we choose excellent performance as the goal, academically and socially, we change the teaching and learning paradigm in fundamental ways. By setting the required performance level at excellence, we require excellent performance to articulated.”
Dr. Asa Hilliard

4
Data: African American StudentsAnd...How are the Children? Data: African American StudentsAnd...How are the Children?

5
African American National Data African American National Data

6
Educational AttainmentEducational Attainment

7
More School, More Earnings
More School, More Earnings

8
Additional Education, Less UnemploymentAdditional Education, Less Unemployment

9
African Americans in the Labor ForceAfrican Americans in the Labor Force

10
African American Hispanic White0
10
20
30
40
50
60
70
80
90
100
14
43
26
14
44
26
14
44
25
13
44
25
12
46
24
Percent of District Enrollment (with charter schools)
2005-06 2006-07 2007-08 2008-09 2009-10
District Ethnic Demographics District Ethnic Demographics

11
Somali African - Other Other Non-English
Arabic Spanish African - Swahili
French0
10
20
30
40
50
60
70
80
90
100
53
25
5 4 4 3 2
58
23
5 52 3 2
Primary Languages of African American Students (Percent)
All Students English Learners
African StudentsAfrican Students

12
Attendance RatesAttendance Rates
African American Hispanic White91.0
92.0
93.0
94.0
95.0
96.0
97.0
98.0
99.0
100.0
94.0 94.2
95.2
94.0 94.2
95.2
94.494.6
95.5
94.5 94.5
95.4
Attendance Rates — Percent Present
2005-06 2006-07 2007-08 2008-09

13
Suspension RatesSuspension Rates
African American Hispanic White0
5
10
15
20
25
30
35
40
45
50
23.4
12.4
6.0
24.2
12.4
6.1
21.3
11.6
5.4
22.2
11.0
5.5
22.2
12.2
5.2
Suspension Rates Per 100 Students
2005-06 2006-07 2007-08 2008-09 2009-10

14
Grade 9-11 Dropout RatesGrade 9-11 Dropout Rates
African American Hispanic White0
5
10
15
20
25
30
35
40
45
50
17.3 18.0
9.5
20.2
23.3
11.210.913.2
5.5
Grade 9–12 Dropout Rates
2005-06 2006-07 2007-08
15
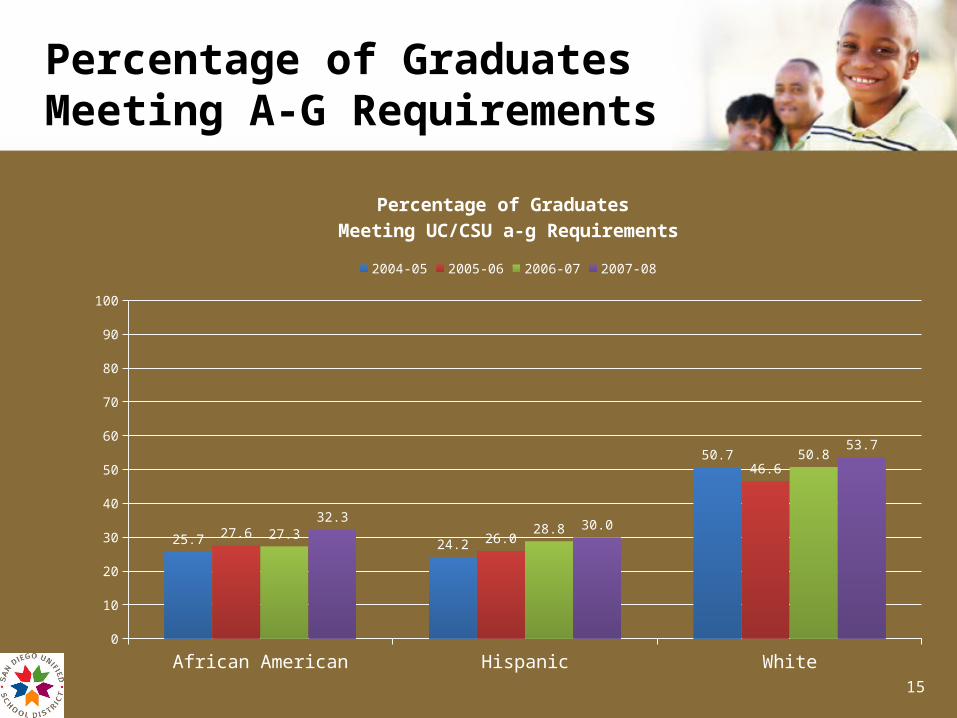
Percentage of Graduates Meeting A-G Requirements Percentage of Graduates Meeting A-G Requirements
African American Hispanic White0
10
20
30
40
50
60
70
80
90
100
25.7 24.2
50.7
27.6 26.0
46.6
27.3 28.8
50.8
32.330.0
53.7
Percentage of Graduates Meeting UC/CSU a-g Requirements
2004-05 2005-06 2006-07 2007-08

16
Percentage Proficient/Advanced on CST-English Language ArtsPercentage Proficient/Advanced on CST-English Language Arts
African American Hispanic White0
10
20
30
40
50
60
70
80
90
100
3228
67
3329
68
3532
71
4136
75
4341
78
Percent Proficient or Advanced on CST ELA
2006 2007 2008 2009 2010

17
Percent Proficient/Advancedon CST - MathematicsPercent Proficient/Advancedon CST - Mathematics
African American Hispanic White0
10
20
30
40
50
60
70
80
90
100
2629
55
2628
54
28 30
56
32 33
60
32
37
62
Percent Proficient or Advanced on CST Math
2006 2007 2008 2009 2010

18
Percent Proficient/Advancedon CST NCLB -SciencePercent Proficient/Advancedon CST NCLB -Science
African American Hispanic White0
10
20
30
40
50
60
70
80
90
100
14 14
47
19 19
52
27 28
65
34 34
71
42 42
77
Percent Proficient or Advanced on CST NCLB Science
2006 2007 2008 2009 2010

19
Proficient/Advancedon CST-HistoryProficient/Advancedon CST-History
African American Hispanic White0
10
20
30
40
50
60
70
80
90
100
19 17
51
18 17
51
21 19
54
2725
61
3230
66
Percent Proficient or Advanced on CST History
2006 2007 2008 2009 2010
20
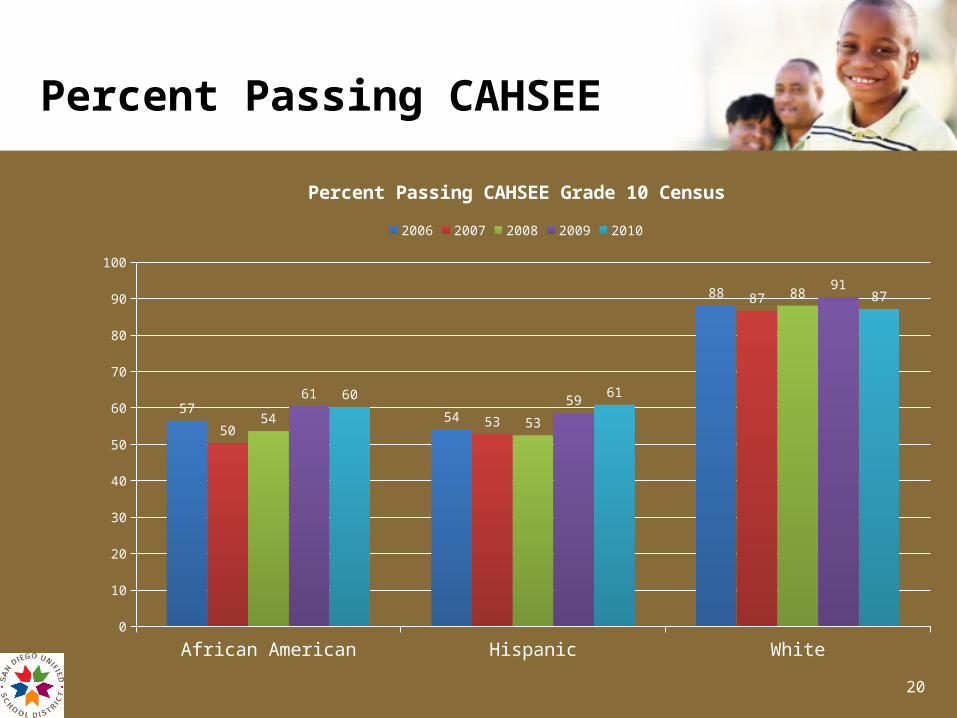
Percent Passing CAHSEEPercent Passing CAHSEE
African American Hispanic White0
10
20
30
40
50
60
70
80
90
100
5754
88
5053
87
54 53
88
61 59
91
60 61
87
Percent Passing CAHSEE Grade 10 Census
2006 2007 2008 2009 2010

21
Percent of Seniors taking SATPercent of Seniors taking SAT
African American Hispanic White0
10
20
30
40
50
60
70
80
90
100
37
26
59
40
31
57
41
33
63
38
32
58
38
31
51
Percent of Seniors Taking the SAT
2004-05 2005-06 2006-07 2007-08 2008-09

22
Average SAT ScoresAverage SAT Scores
African American Hispanic White1000
1100
1200
1300
1400
1500
1600
1700
1800
1900
2000
12881326
1627
1240
1331
1636
Average SAT Scores
2007-08 2008-09
23
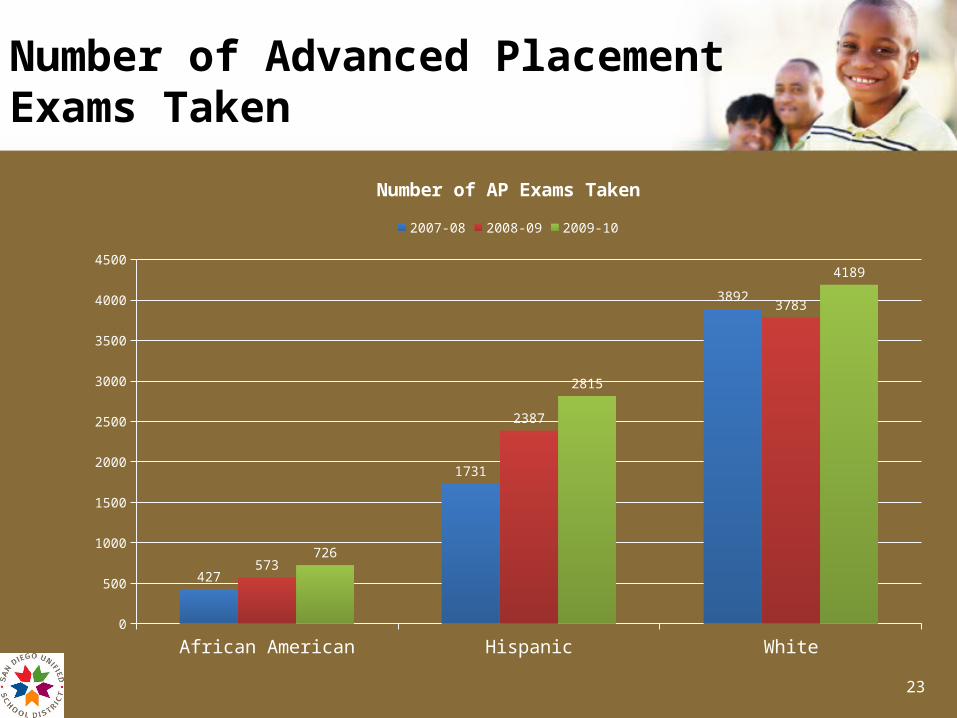
Number of Advanced Placement Exams TakenNumber of Advanced Placement Exams Taken
African American Hispanic White0
500
1000
1500
2000
2500
3000
3500
4000
4500
427
1731
3892
573
2387
3783
726
2815
4189
Number of AP Exams Taken
2007-08 2008-09 2009-10

24
Percent of Advanced Placement Exams PassedPercent of Advanced Placement Exams Passed
African American Hispanic White0
10
20
30
40
50
60
70
80
90
100
22
40
59
17
38
59
17
37
56
Percent of AP Exams Passed
2007-08 2008-09 2009-10

25
Historical Perspective in San Diego Unified School DistrictHistorical Perspective in San Diego Unified School District
• 1967 – Equal Access and Quality Education
• 1967 - Carlin Case Court Order• 1968 - Voluntary Ethnic Enrollment
Program• 1968 - Magnet Programs• 1970 -Race/Human Relations Program
– Every employee received ten hours of training every year

26
System-wide Initiative – Superintendent PayzantSystem-wide Initiative – Superintendent Payzant
• In 1989, there were only 13 African American Male high school students in the entire district with a 3.0 GPA or higher– Area Superintendent Al Cook launched Pupil Advocacy
Program– In two short years the number of grew to well over 300
students with a 3.0, eventually documenting more that 800 students
• Four Pupil Advocates were staffed to support schools identified with the highest proportion of African American students. (Fulton, Knox, Gompers and Bell)

27
Superintendent Pendleton Superintendent Pendleton
• District – wide Initiative to accelerate the achievement of all students with the introduction of 16 Expectations

28
Race/Human Relations Race/Human Relations
• 1987 -182 schools represented 750 students receiving annual awards
• 1995 - Establishment of the IAAAAS (Improving the Academic Achievement of African American Students) and LLAMA (Latinos Latinas Achieving More Academically)
• 2005 - Expansion of advocates to school sites and district-wide services
• 2008 - Established Cultural Proficiency Training and Family Friendly Schools
• 2009 - Cultural Proficiency and team building training for all departments beginning with the Superintendent and Cabinet
29
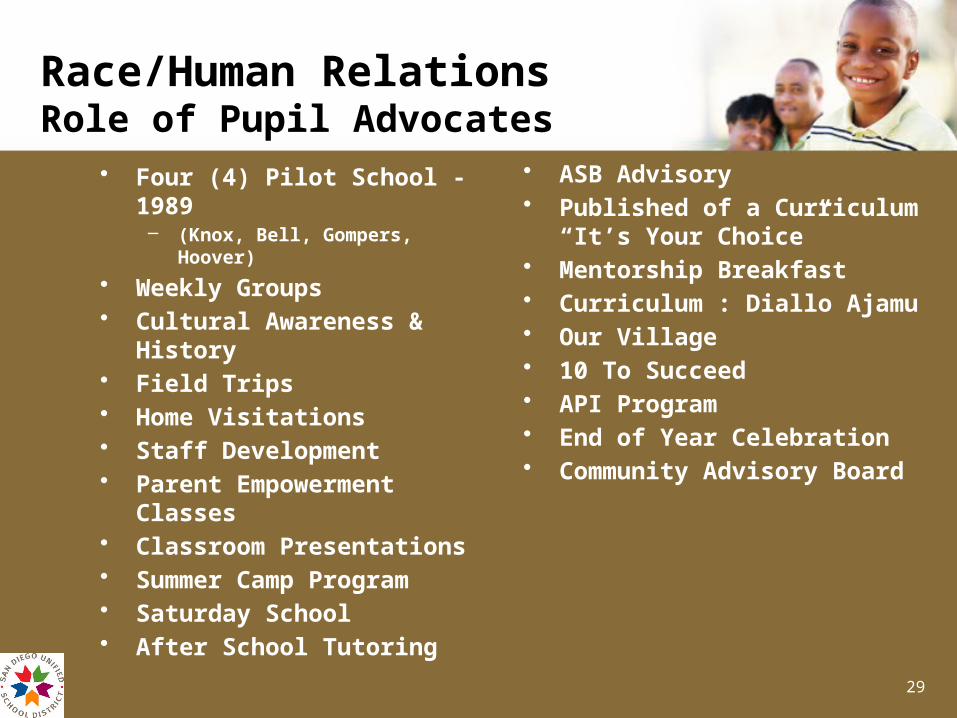
Race/Human RelationsRole of Pupil AdvocatesRace/Human RelationsRole of Pupil Advocates
• Four (4) Pilot School -1989– (Knox, Bell, Gompers, Hoover)
• Weekly Groups • Cultural Awareness & History• Field Trips• Home Visitations• Staff Development• Parent Empowerment
Classes• Classroom Presentations• Summer Camp Program• Saturday School• After School Tutoring
• ASB Advisory• Published of a Curriculum “It’s
Your Choice”• Mentorship Breakfast• Curriculum : Diallo Ajamu• Our Village• 10 To Succeed• API Program• End of Year Celebration• Community Advisory Board

30
Blueprint for Student Achievement for African American Students - 2010Blueprint for Student Achievement for African American Students - 2010
• Blueprint Prepared by:
– Association for African American Educators (AAAE)– Urban League of San Diego– National Association for the Advancement of Colored People
(NAACP)– The Neighborhood House Association– Delta Sigma Theta Sorority Inc. – National Council of Negro Women– Faith-based Organizations –Pastors on Point and UAAMAC
Approved by Board of Education– Active support from Superintendent Kowba

31
Where Do We Go From Here?Where Do We Go From Here?
• Focus Area #1- Education PoliciesImplement educational policies and practices (including personnel assignments, training and evaluation that advances and promote educational excellence for all African American students.
• Focus Area #2 – Graduations RatesImprove graduation rates for All African American and African students.
• Focus Area # 3 – Gender NeedsImprove educational progress and status of African American male and females students by understanding and coping with gender specific needs.
• Focus Area #4 – Parental SupportProvide support for parents and families of underachieving African American students.