1 announcement gc week 8 (march 4-8) deadline extended to tomorrow. technical problem is fixed....
TRANSCRIPT

1
Announcement
• GC Week 8 (march 4-8) deadline extended to tomorrow. Technical problem is fixed.
• Review session for midterm 2: this Thursday (3/14), 6-7pm in 2000 Chem.
• Midterm 2 (Monday, 3/18) will not include this week’s lectures on Energy, but they will be covered on the final.

2
Water is central to life on Earth. Energy is central to living on Earth.
We are not running out of energy, we are running out of environment.
Energy
Outline of Lectures
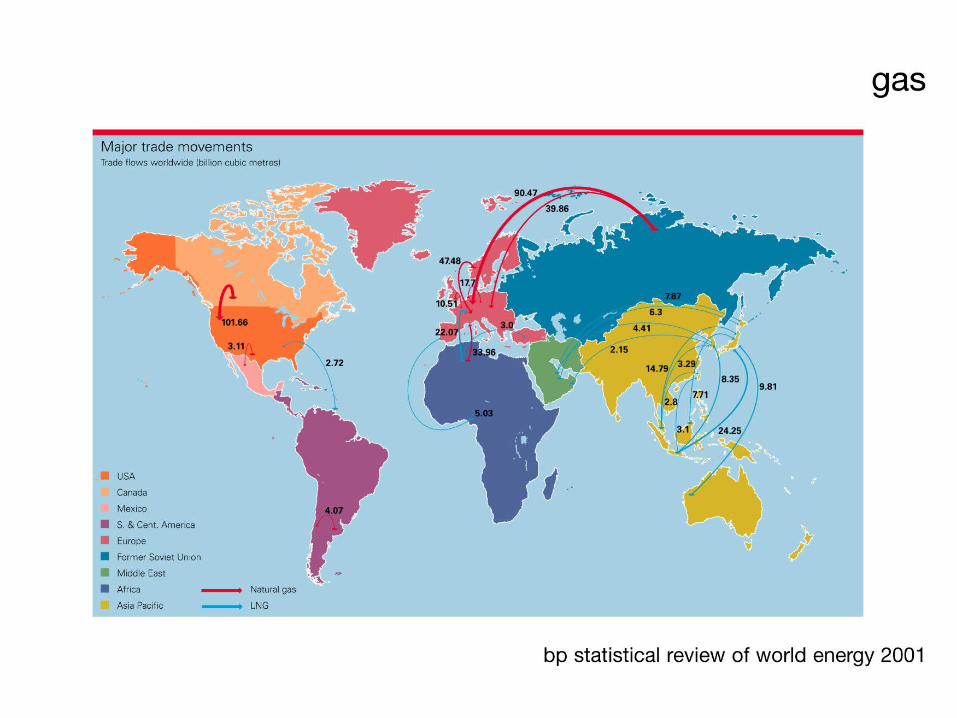
Today’s state of global energyoil, gas, coal
Alternativesrenewables, nuclear
Systems and Decisionssociopolitics of energy
Laboratory
Analyze USA energy data
3
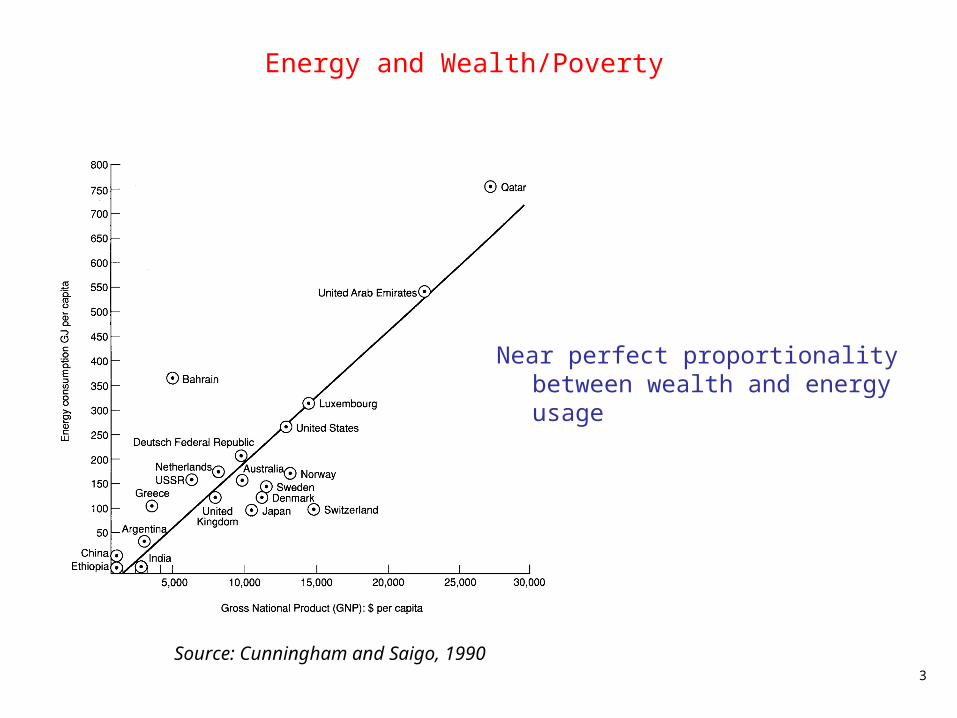
Energy and Wealth/Poverty
Near perfect proportionality between wealth and energy usage
Source: Cunningham and Saigo, 1990

4
Disclosure: my car
Am I the problem?

5
National Energy Policy, 2001

6
Some recommendations in President G.W. Bush's 2001 National Energy Policy Report
• Production Ease restrictions on oil and gas development on public lands. Open a portion of the Arctic National Wildlife Refuge in Alaska to drilling. Ease permit process for refinery expansion and construction. Speed license procedures for hydroelectric dams and geothermal plants.
• Power Plants Streamline approval process for siting power plants. Give government authority to take property through eminent domain for power lines. Provide tax breaks for developing clean coal technologies. Ease regulatory barriers, including clean air rules, to make plants more efficient.
• Nuclear Adjust regulations to speed relicensing of reactors and licensing of new plants. Pursue a national nuclear waste repository; Yucca Mountain is not singled out in the report. Tax breaks for purchase of nuclear plants. Reauthorize law that limits industry liability from a nuclear accident. Revive technology that allows spent fuel from nuclear reactors to be reused to produce
electricity (abandoned in 1970s because it was consider a proliferation risk). • Renewable Energy
Tax credits to encourage development of energy plants that use organic waste, or biomass. Continue tax credits for wind energy generation. Give tax credit of 15 percent for homeowners who purchase solar panels. Study whether to require automobiles to meet higher fuel efficiency standards. $5 billion in new spending, mostly tax credits, for renewable energy and conservation projects. Expand alternative fuels tax incentives to landfills capturing methane gas for electricity
generation. • Conservation
Tax credit for purchase of high-mileage, hybrid gas-electric vehicles. Tax benefits and regulatory relief for co-generation plants that produce both heat and electricity Expand federal Energy Star program beyond businesses into schools, homes and hospitals.

7
Everything that moves has KINETIC ENERGY. The faster an object moves, and the more mass it has, the more kinetic energy it has.
POTENTIAL ENERGY is associated with position. Potential energy is stored whenever something moves in the opposite direction to a force acting on it.
INTERNAL (HEAT) ENERGY is the kinetic energy of the countless moving atoms and molecules of matter. The hotter something is, the faster its atoms and molecules move. RADIANT ENERGY is carried by electromagnetic radiation (light rays).
The energy contained within molecular bonds is called CHEMICAL ENERGY.
Types of Energy

8
Energy and Units
Work = Force x Distance (= m.a.d)= N.m = Joule
A British thermal unit (Btu) is the amount of heat required to raise the temperature of 1lb of water by one degree Fahrenheit. Lighting a 100-watt light bulb for one hour requires 341.5 Btu.
Amounts of petroleum are measured in barrels, where one barrel contains 42 gallons.
Amounts of natural gas are measured in cubic feet. In terms of Btu energy equivalents, 6,000ft3 of gas equals one barrel of oil. One thousand cubic feet of gas heats a typical home for one winter day.

9
First Law of Thermodynamics: Conservation of Energy
Energy cannot be created or destroyed.
Energy can only change from type to type.
Second Law of Thermodynamics: Increasing Entropy
Changes always occur with less than 100% efficiency. So, no machine can every be 100% efficient, because certain amount of energy will be lost as heat (efficiency).
Energy Laws
PrimaryEnergy

10
Human Use of Energy
Before agriculture, an individual could only harness fire and own muscle power For short periods a person can work at 800 Watts (~ 1 HP) Average would be 0.3 HP over a few days
Great leap from domestication of horses, oxen, mules, camels, elephants
Egyptians used sailing boats around 3500 BC The invention of the horseshoe around 400 BC permitted horses to
plough stony fields without hurting them In Middle Ages, energy from water mills and windmills harnessed. In 1765, England close to running out of timber - James Watt invents
the steam engine late 19th C the use of heavy hydrocarbons for internal combustion
engine, leading to transportation revolution … does human innovation always save the day?

11
Non-Renewable Energy Sources
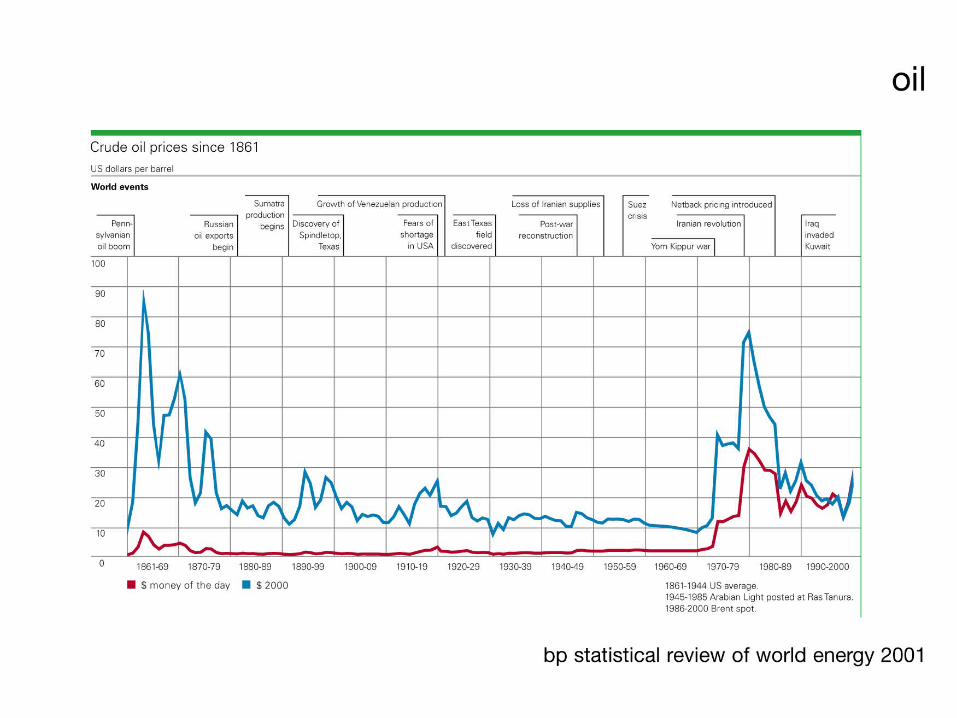
FOSSIL FUELS Oil
Refinery products include petrochemicals, jet fuel, gasoline, kerosene, stove oil, diesel oil, heating oil, greases, lubricating oils, paraffins, asphalt; versatile small volume
Coal
Used directly as heat fuel or as fuel for the generation of electricity
Natural Gas
Used directly as heat fuel or as fuel for the operation of appliances

12
Photosynthesis
Energy from the SUN taken up by plants: CO2 + H2O + PAR -> CH2O + O2
PAR = photosynthetically-active radiation CH2O = organic matter
Storage of chemical potential energy
“Biomass” - carbon storage in plants; “old biomass” used to refer to plant and animal materials that are used as fuel, e.g., firewood and dung; “new biomass” to energy crops (switchgrass, corn)

13
Energy from Earth’s Crust
Fossil fuel energy sources come from the Earth’s crust: coal, oil, natural gas; geothermal energy
Uranium ore is also extracted from the crust and processed for use in nuclear fuel plants
Source: G. Tyler Miller, Sustaining the Earth, 1994
14
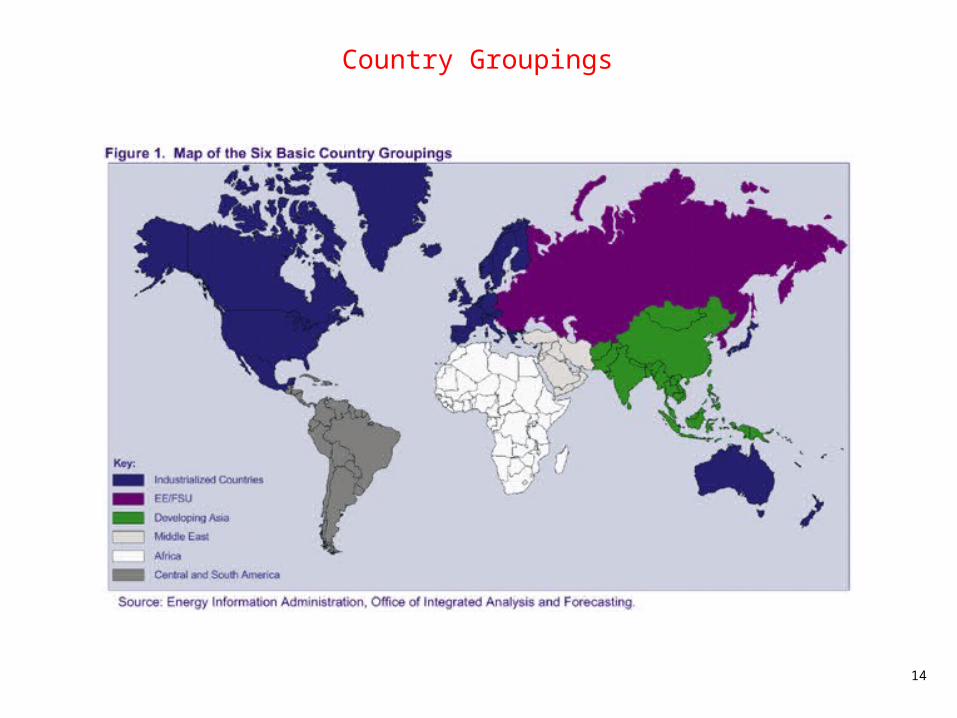
Country Groupings
15
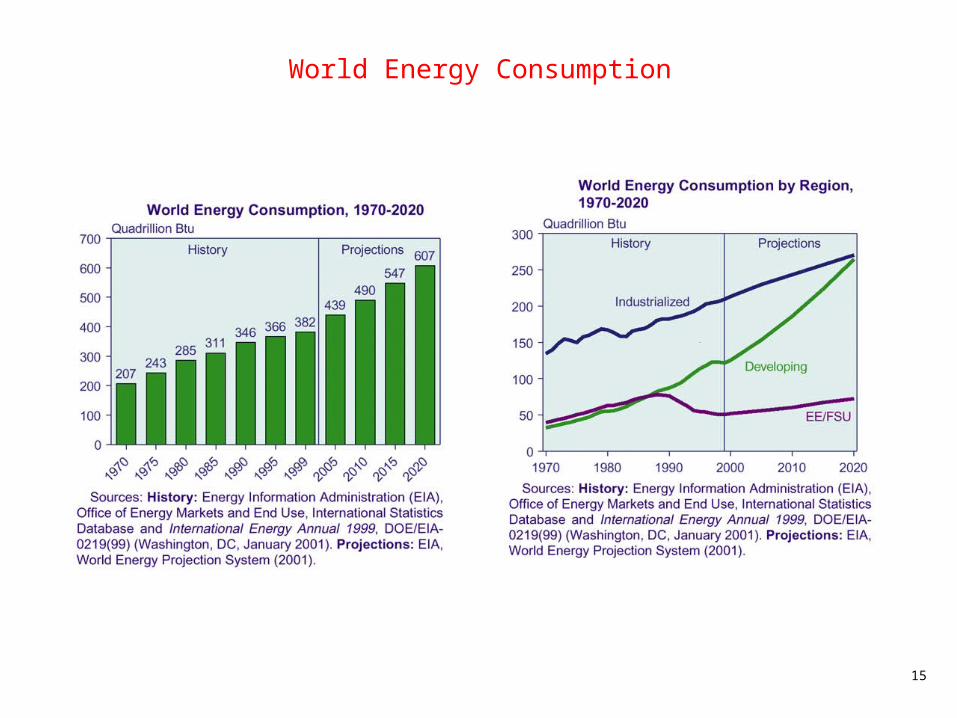
World Energy Consumption

16
World Energy by Fuel Type

17

18
Energy Consumption and C emissions, 1990-2020
Region
Energy Consumption(Quadrillion Btu)
Carbon Dioxide Emissions(Million Metric Tons Carbon
Equivalent)
1990 1999 2010 2020 1990 1999 2010 2020
Industrialized 182.4 209.6 243.4 270.4 2,842 3,122 3,619 4,043
EE/FSU 76.3 50.5 60.3 72.3 1,337 810 940 1,094
Developing
Asia 51.0 70.9 113.4 162.2 1,053 1,361 2,137 3,013
Middle East 13.1 19.3 26.9 37.2 231 330 451 627
Africa 9.3 11.8 16.1 20.8 179 218 294 373
Central and South America 13.7 19.8 29.6 44.1 178 249 394 611
Total 87.2 121.8 186.1 264.4 1,641 2,158 3,276 4,624
Total World 346.0 381.8 489.7 607.1 5,821 6,091 7,835 9,762
Sources: History: Energy Information Administration (EIA), International Energy Annual 1999, DOE/EIA-0219(99) (Washington, DC, January 2001). Projections: EIA, World Energy Projection System (2001).

19
Reserves and Resources
Terms are often confused:
Reserves are the proven supplies that can be extracted and brought to market economically
Resources represent the total quantity - found and yet to be discovered
Planning (and prices) are based on reserves!

20
role of coal !

21
US uses ~7bbl/yr in 2000)

22
23

24
0
5
10
15
20
25
30
35
1950 1960 1970 1980 1990 2000 2010 2020 2030
Billions of Barrels per Year
1800
2200
2600
GLOBAL OIL FOR RESOURCES OF 1800, 2200, AND 2600 billion of barrels(Hubbert’s peak)

25
26
27
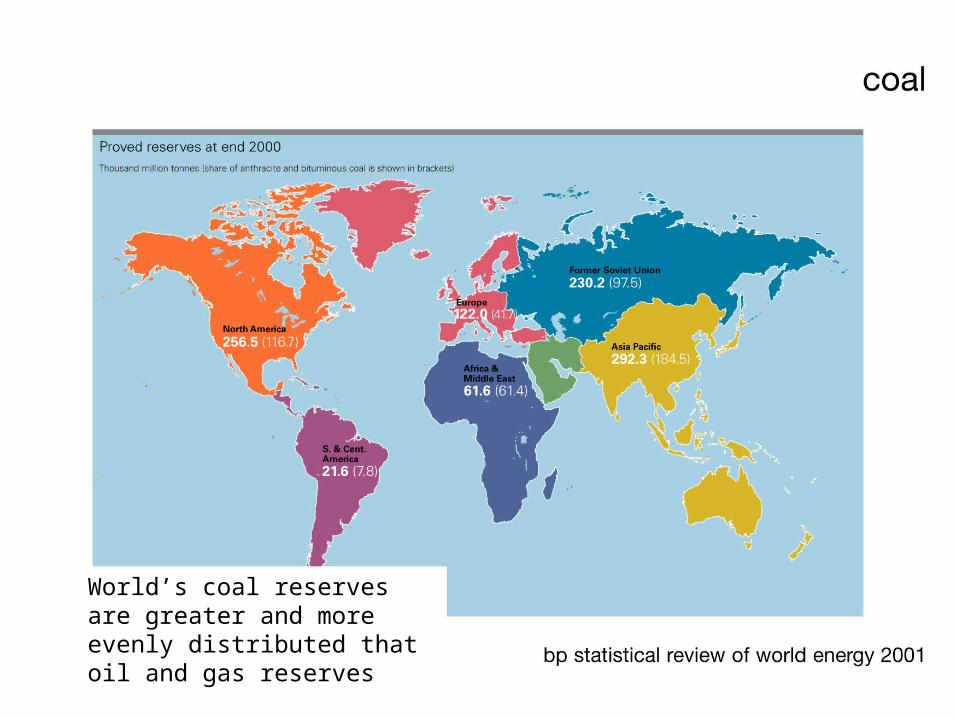
World’s coal reserves are greater and more evenly distributed that oil and gas reserves

28

29
Geology is not “fair”: energy resources are unevenly distributed.
The developed world: 25% of world’s population 67% of world’s fossil fuel resources
Use is yet more uneven:
The United States: ~ 4% of world’s population (.28/6) Uses ~24% of all energy produced
India ~ 16% of world’s population (.98/6) Uses ~2% of all energy produced
Rich vs. Poor
30
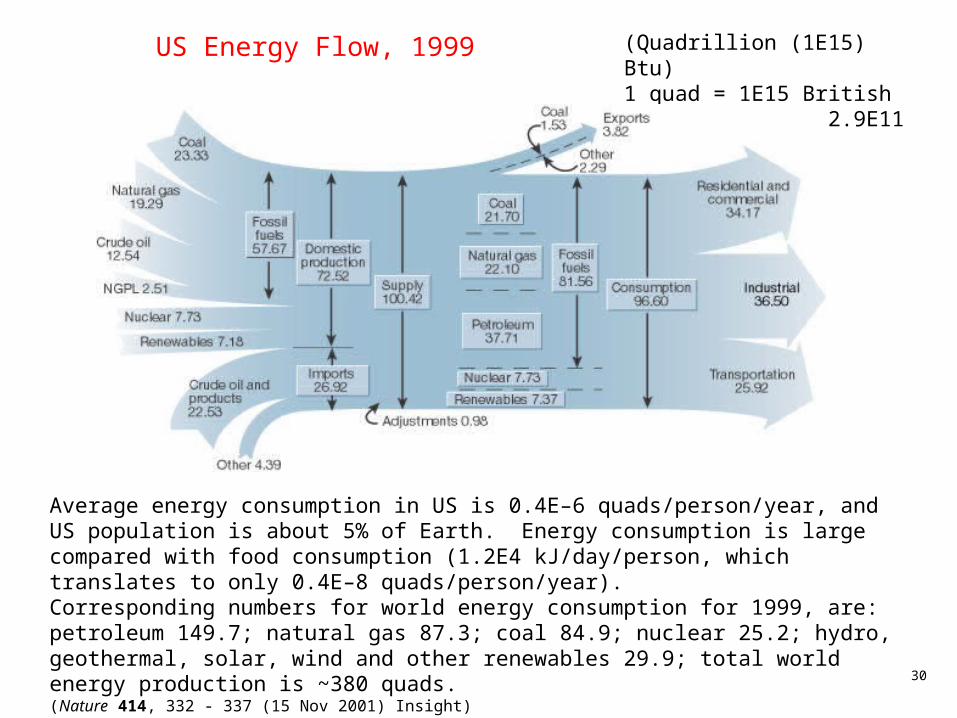
US Energy Flow, 1999 (Quadrillion (1E15) Btu)1 quad = 1E15 British thermal units = 2.9E11 kWh
Average energy consumption in US is 0.4E–6 quads/person/year, and US population is about 5% of Earth. Energy consumption is large compared with food consumption (1.2E4 kJ/day/person, which translates to only 0.4E–8 quads/person/year).Corresponding numbers for world energy consumption for 1999, are: petroleum 149.7; natural gas 87.3; coal 84.9; nuclear 25.2; hydro, geothermal, solar, wind and other renewables 29.9; total world energy production is ~380 quads. (Nature 414, 332 - 337 (15 Nov 2001) Insight)
31
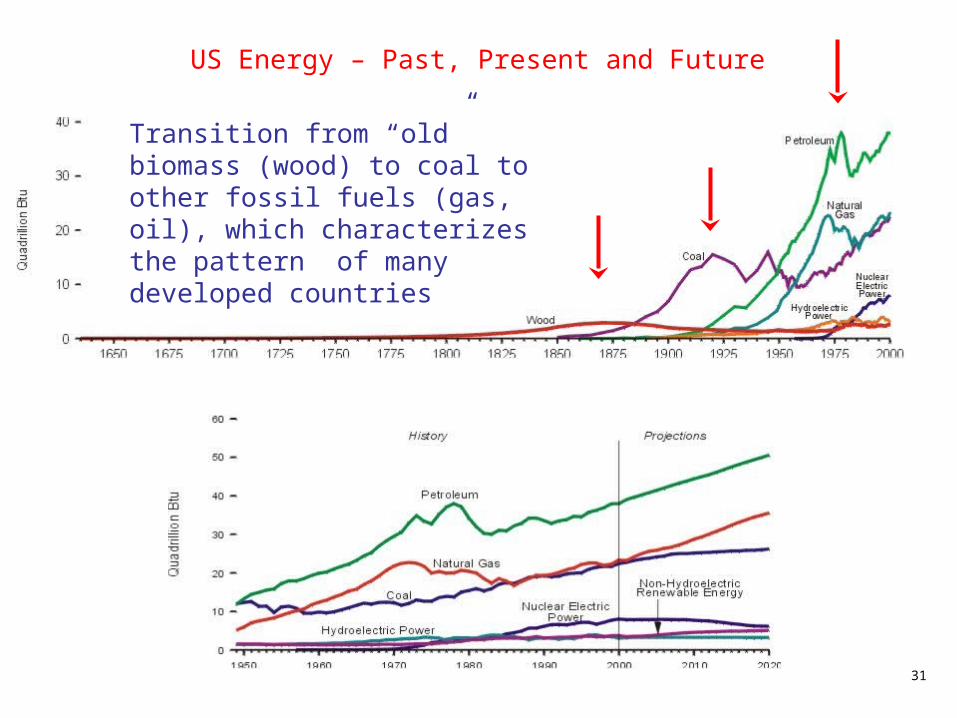
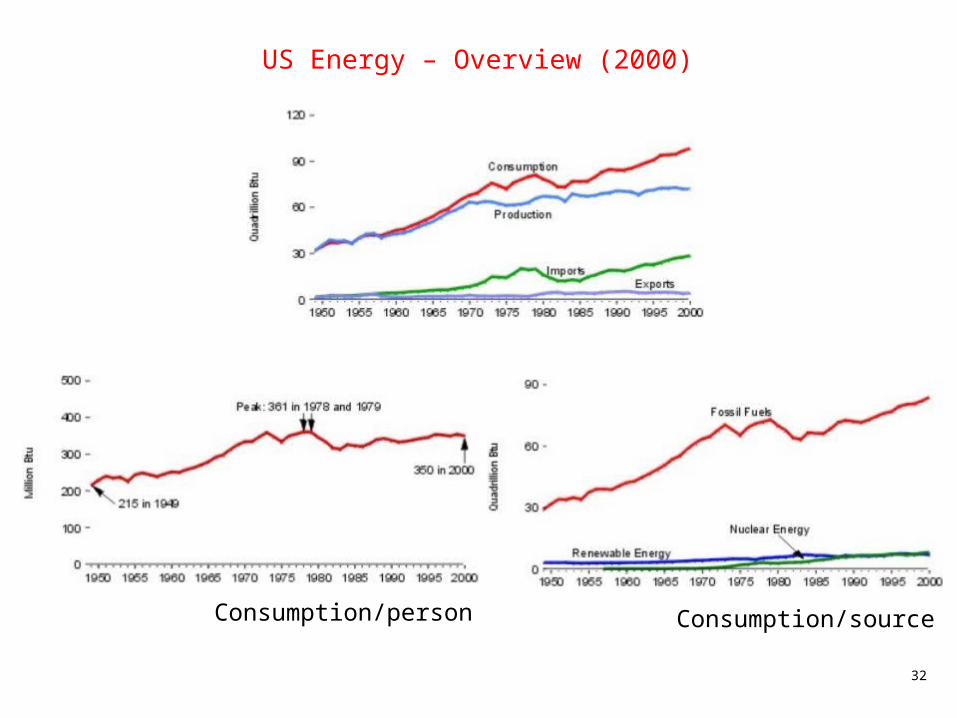
US Energy – Past, Present and Future
Transition from “old” biomass (wood) to coal to other fossil fuels (gas, oil), which characterizes the pattern of many developed countries
32
US Energy – Overview (2000)
Consumption/person Consumption/source

33
US Energy Production, Consumption and Imports(1970-2000)
Edwin L. Drake’sfirst oilwell, 1859

34
Arctic Refuge Drilling
Cumulative Savings from Higher Fuel Economy vs. Cumulative Oil Production from the Arctic Refuge NB ANWR oil may be as much as 15bbls, ~2 years of US needs.
Source: NRDC, 2001

35
•Ultimate source of energy is Sun (99%)•Humans add ~1% commercial and noncommercial energy•Commercial energy, sold in marketplace, mostly fossil fuels•Noncommercial energy, mostly firewood
•Ultimate source of energy is Sun (99%)•Humans add ~1% commercial and noncommercial energy•Commercial energy, sold in marketplace, mostly fossil fuels•Noncommercial energy, mostly firewood

36
Of the total of known energy reserves and potentially available resources in the U.S., 92% are from renewable sources:
Biomass (firewood, dung) Hydropower (rivers) Solar (panels, cells) Sea (waves, tides, currents, thermal) Geothermal (Earth’s internal heat) Wind (windmills) Nuclear (uranium)
Developing most of the untapped renewable energy resources could meet 50-80% of the projected US energy needs by 2030.
Renewable Energy Sources

37
NREL website

38
Photovoltaic Cells
Convert light energy into electricity
PV systems can be constructed to any size based on individual energy requirements, and are low-maintenance
Ideal for supplying power to homes far from utility power lines in remote areas where losses are relatively high
(Image from US Nat. Renewable Energy Lab)

39
Wind
Wind in the United States could produce more than 4.4 trillion kWh of electricity each year--more than and the 2.7 trillion kWh of electricity consumed in the United States (1990).
40
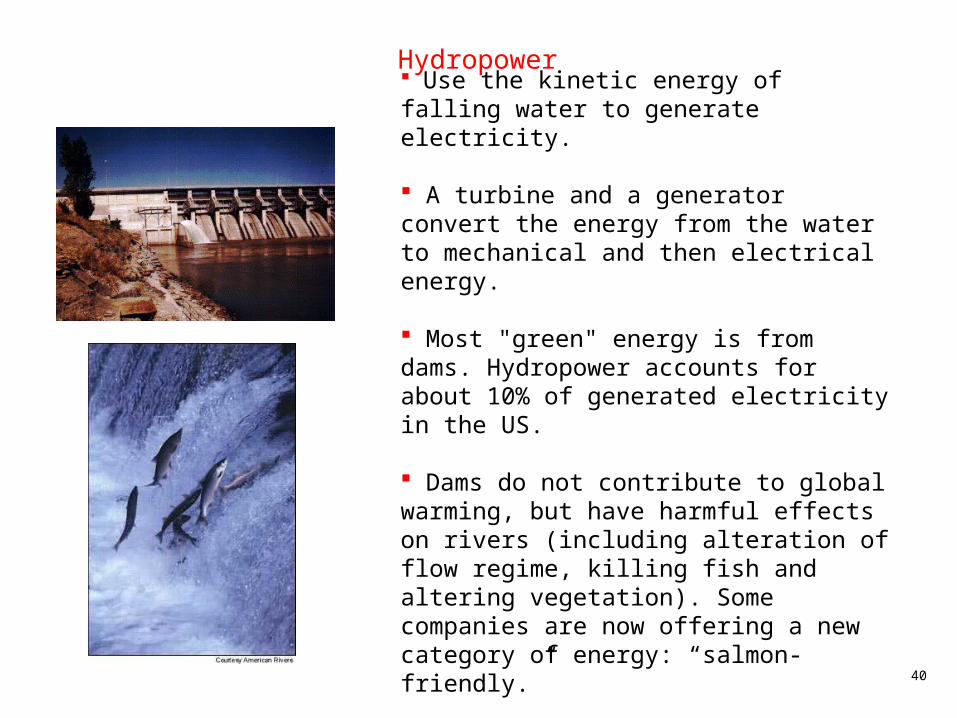
Hydropower
Use the kinetic energy of falling water to generate electricity.
A turbine and a generator convert the energy from the water to mechanical and then electrical energy.
Most "green" energy is from dams. Hydropower accounts for about 10% of generated electricity in the US.
Dams do not contribute to global warming, but have harmful effects on rivers (including alteration of flow regime, killing fish and altering vegetation). Some companies are now offering a new category of energy: “salmon-friendly.”

41
Geothermal Power
Geothermal resources range from shallow to deep (several miles) below Earth's surface.
Three types: geothermal heat pumps, direct-use applications, and power plants.
Natural steam from production wells powers a turbine generator, producing white plumes of water vapor.

42
Biomass
Biomass is organic material that stems from plants, trees, and crops.
Largest contribution to energy consumption in developing countries, traditionally used as firewood for cooking and heating.
Modern uses include combustion to produce energy in the form of electricity, steam and biofuels.
(Image from US Nat. Renewable Energy Lab)
43
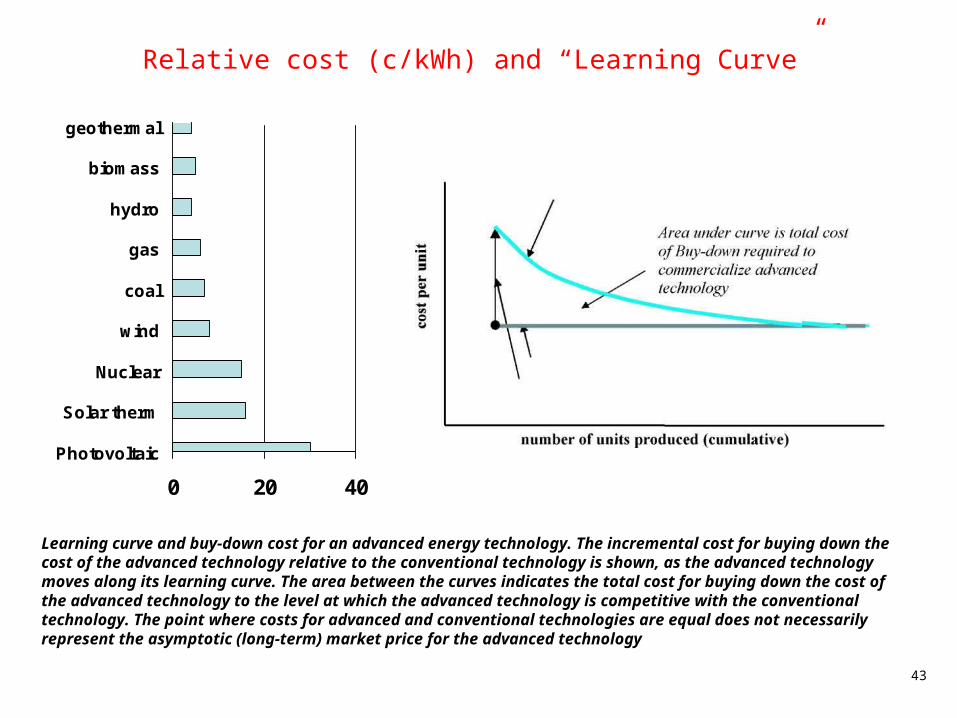
Relative cost (c/kWh) and “Learning Curve”
Learning curve and buy-down cost for an advanced energy technology. The incremental cost for buying down the cost of the advanced technology relative to the conventional technology is shown, as the advanced technology moves along its learning curve. The area between the curves indicates the total cost for buying down the cost of the advanced technology to the level at which the advanced technology is competitive with the conventional technology. The point where costs for advanced and conventional technologies are equal does not necessarily represent the asymptotic (long-term) market price for the advanced technology
0 20 40
Photovoltaic
Solar therm
Nuclear
wind
coal
gas
hydro
biomass
geothermal
44
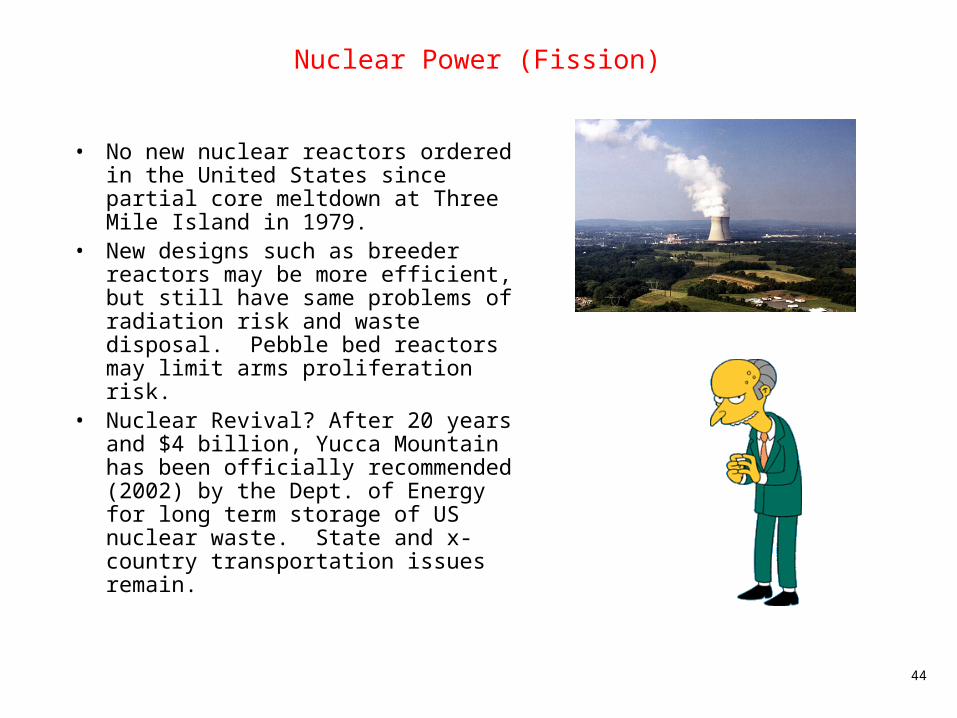
Nuclear Power (Fission)
• No new nuclear reactors ordered in the United States since partial core meltdown at Three Mile Island in 1979.
• New designs such as breeder reactors may be more efficient, but still have same problems of radiation risk and waste disposal. Pebble bed reactors may limit arms proliferation risk.
• Nuclear Revival? After 20 years and $4 billion, Yucca Mountain has been officially recommended (2002) by the Dept. of Energy for long term storage of US nuclear waste. State and x-country transportation issues remain.

45
Renewable Sources
0
20
40
60
80
100
120
140
1980
1982
1984
1986
1988
1990
1992
1994
1996
1998
2000
Photovoltaic
Wind
Renewable sources of energy have undergone significant technological development, with costs lowered
Nuclear power has been an unfulfilled dream, stifled by problems with waste, cost and reliability.
Wind systems are capital intensive, but easy to operate
Danish offshore wind farms pipe energy over fiber optic cables and generate 10% of the country’s energy in 2000
Equatorial countries have considerable potential for solar systems
California expects to generate ~10% by wind energy in early 21st century
Cen
ts p
er
kilo
watt
-hr
Compare with ~3 cents per kWh for conventional power stations

46
Current Status and Potential Future Costs of Renewable Energy Technologies
(Source: UNDP World Energy Assessment, 2000)

47
Renewables - potential

48
Energy New Approaches and Social Issues
Approaches• efficiency• alternatives
Social Issues• wealth• urbanization• health• etc……
49
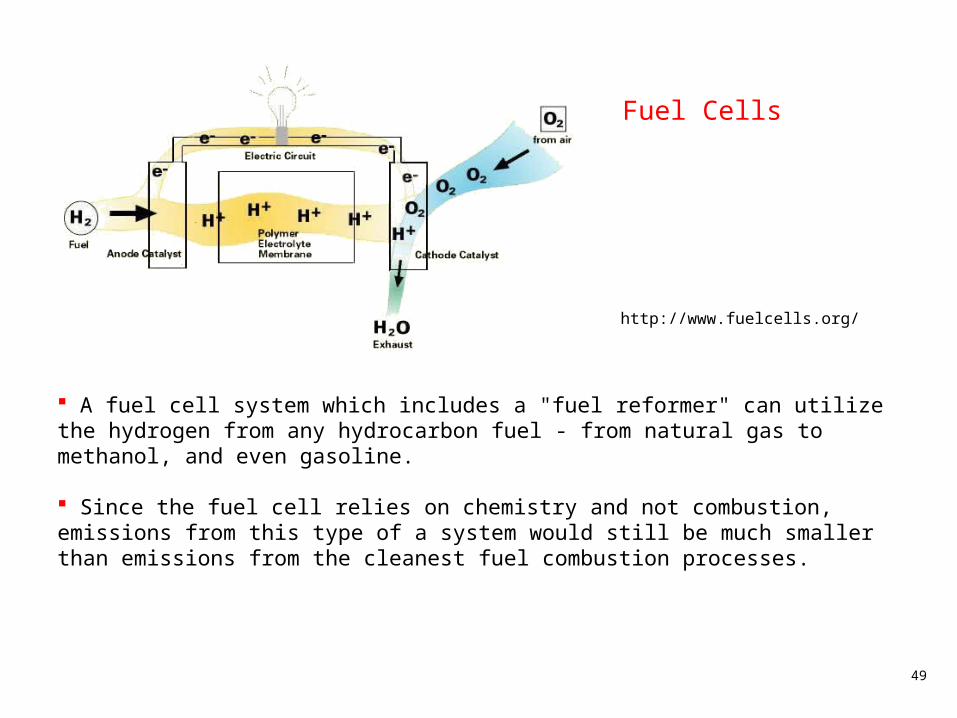
Fuel Cells
A fuel cell system which includes a "fuel reformer" can utilize the hydrogen from any hydrocarbon fuel - from natural gas to methanol, and even gasoline.
Since the fuel cell relies on chemistry and not combustion, emissions from this type of a system would still be much smaller than emissions from the cleanest fuel combustion processes.
http://www.fuelcells.org/

50
51
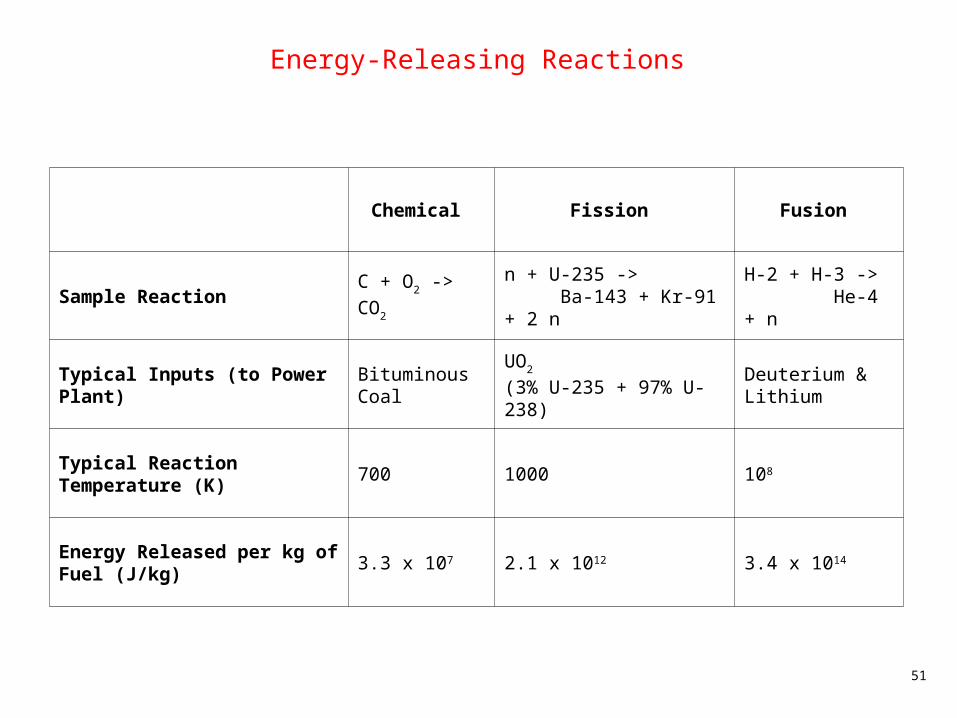
Energy-Releasing Reactions
Chemical Fission Fusion
Sample Reaction C + O2 -> CO2n + U-235 -> Ba-143 + Kr-91 + 2 n
H-2 + H-3 -> He-4 + n
Typical Inputs (to Power Plant)Bituminous Coal
UO2
(3% U-235 + 97% U-238)Deuterium & Lithium
Typical Reaction Temperature (K)
700 1000 108
Energy Released per kg of Fuel (J/kg)
3.3 x 10⁷ 2.1 x 10¹² 3.4 x 10¹⁴
52
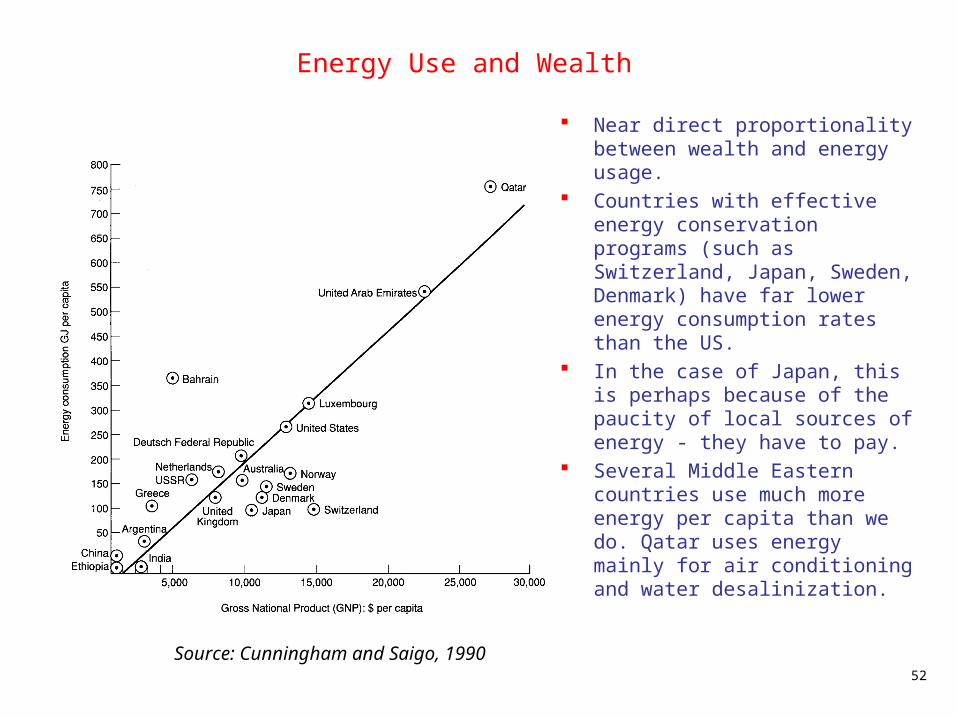
Energy Use and Wealth
Near direct proportionality between wealth and energy usage.
Countries with effective energy conservation programs (such as Switzerland, Japan, Sweden, Denmark) have far lower energy consumption rates than the US.
In the case of Japan, this is perhaps because of the paucity of local sources of energy - they have to pay.
Several Middle Eastern countries use much more energy per capita than we do. Qatar uses energy mainly for air conditioning and water desalinization.
Source: Cunningham and Saigo, 1990

53
Commercial Energy Use Compared to Development Indicators
Source: World Bank, 1997 (In UNDP World Energy Assessment)
54
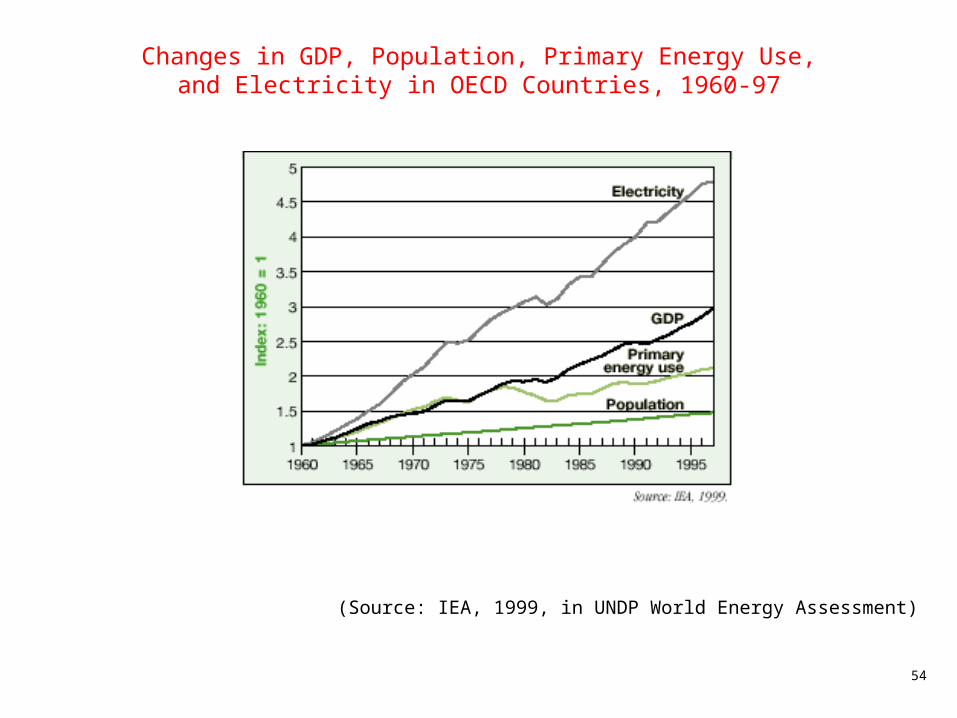
Changes in GDP, Population, Primary Energy Use, and Electricity in OECD Countries, 1960-97
(Source: IEA, 1999, in UNDP World Energy Assessment)

55
Changes in GDP,
Population, Primary Energy
Use, and electricity use by
region
(IEA, 1999, in UNDP World Energy Assessment)
56
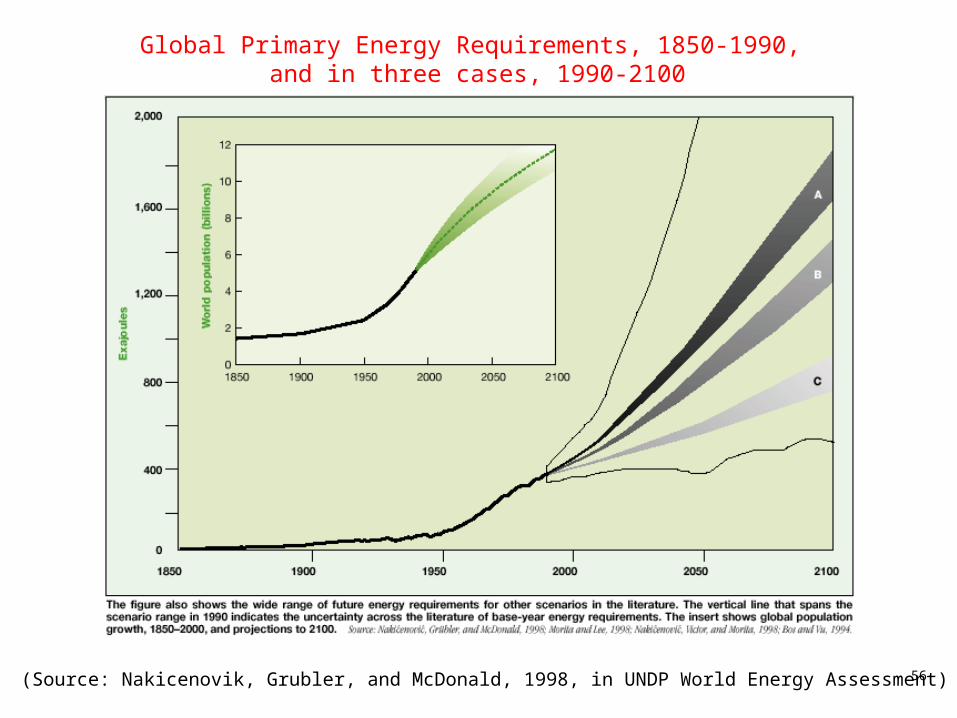
Global Primary Energy Requirements, 1850-1990, and in three cases, 1990-2100
(Source: Nakicenovik, Grubler, and McDonald, 1998, in UNDP World Energy Assessment)
57
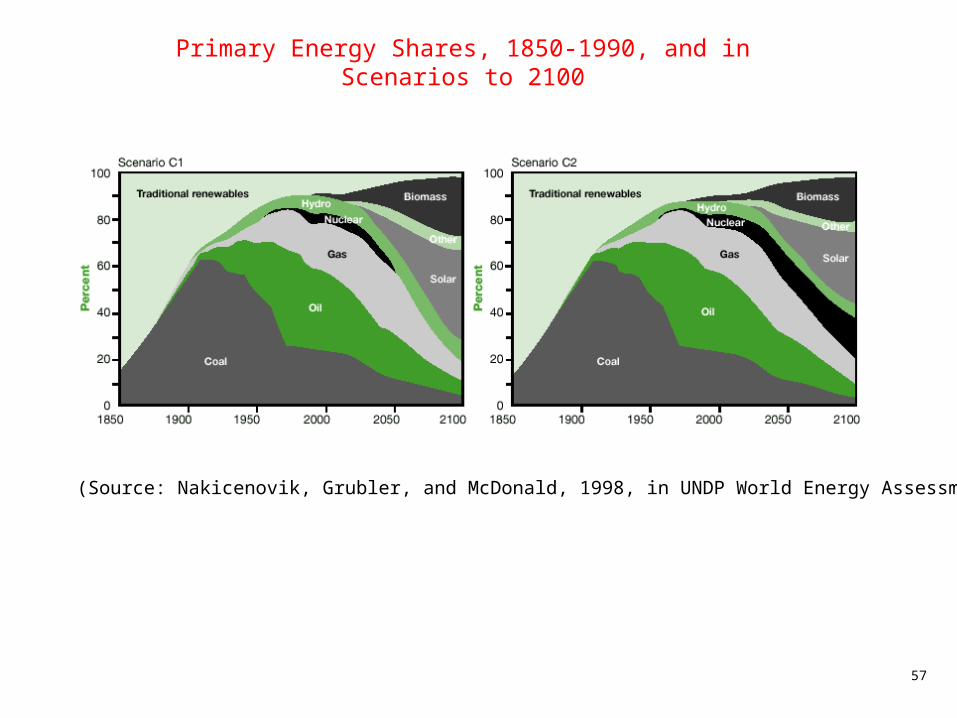
Primary Energy Shares, 1850-1990, and in Scenarios to 2100
(Source: Nakicenovik, Grubler, and McDonald, 1998, in UNDP World Energy Assessment)
58
Efficiency
• reduce energy use (conservation)• optimize energy use (efficiency)
Anecdotes:
heating efficiency and electricity generation
car mileage and traffic
59
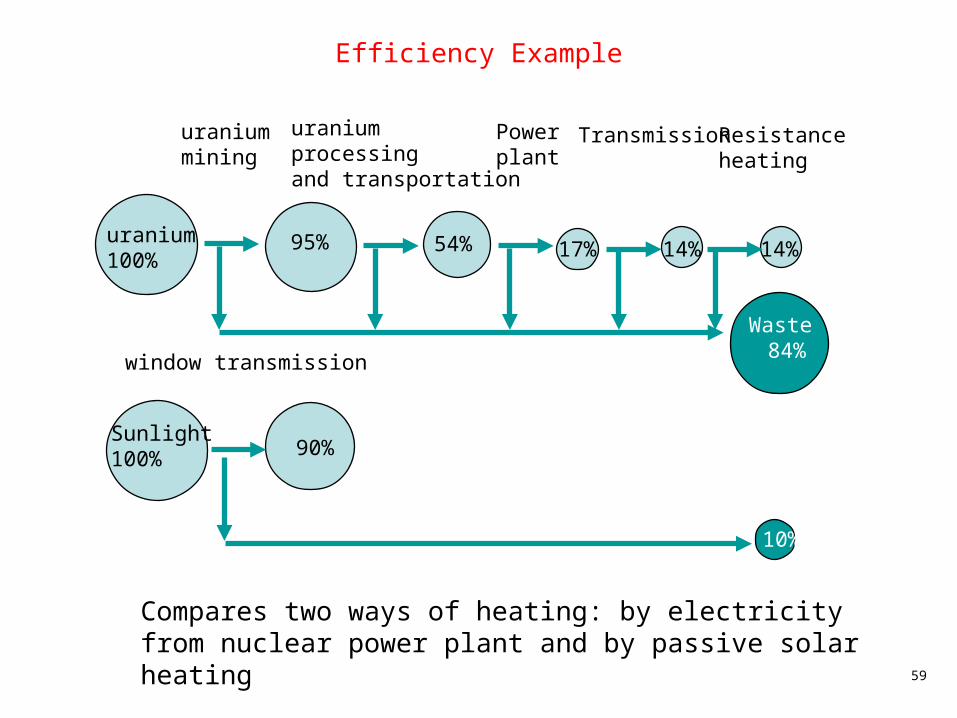
Efficiency Example
uranium100%
95% 54% 17% 14%
uraniummining
uraniumprocessingand transportation
Power plant
Transmission
Sunlight100% 90%
window transmission
14%
Resistanceheating
Waste 84%
10%
Compares two ways of heating: by electricity from nuclear power plant and by passive solar heating
60
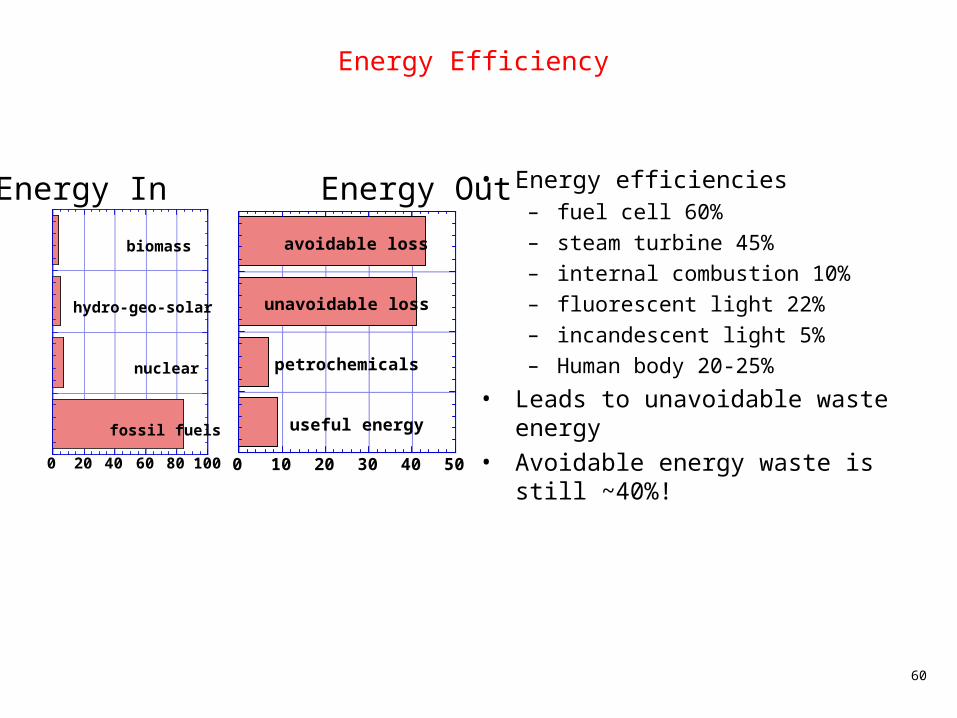
Energy Efficiency
• Energy efficiencies– fuel cell 60%– steam turbine 45%– internal combustion 10%– fluorescent light 22%– incandescent light 5%– Human body 20-25%
• Leads to unavoidable waste energy
• Avoidable energy waste is still ~40%!0 10 20 30 40 50
useful energy
petrochemicals
unavoidable loss
avoidable loss
0 20 40 60 80 100
fossil fuels
nuclear
hydro-geo-solar
biomass
Energy In Energy Out

61

62

63
Prospects
01
23
45
67
89
1990
1995
2000
2005
2010
2015
2020
SavingsAlaska
Million
s o
f b
arr
els
per
day
Energy efficiency is the first order of business
Realizable energy efficiencies:
Refrigeration (87%)Air conditioning (75%)Electric water heat (75%)Electric range (50%)Gas furnace (59%)Gas Water heater (63%)Gas range (64%)
Source: Kaufman and Franz

64
The Fuelwood Crisis
More than 2 billion people rely on wood to cook (3kg/day); more than 1 billion are over-cutting available trees
For the poorest one third of humanity the real energy crisis is wood Fuelwood can account for up to two-fifths of family income Population growth exacerbates problem Desertification in the Sahel one consequence The lack of firewood leads to the burning of dung which otherwise would be a
natural fertilizer
Deficits
Prospectivedeficits
65
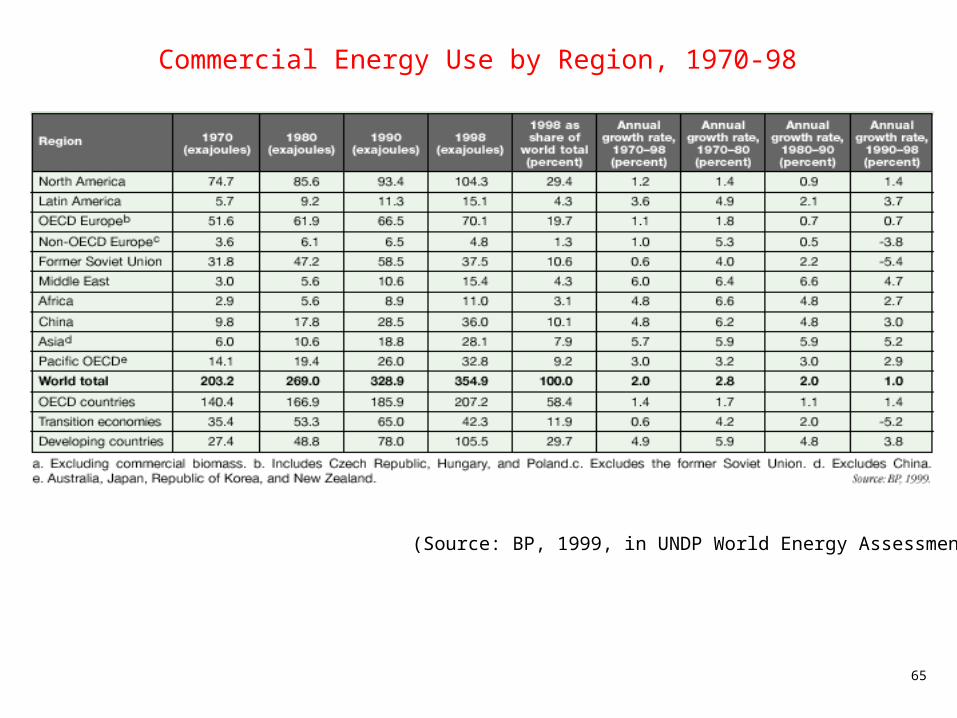
Commercial Energy Use by Region, 1970-98
(Source: BP, 1999, in UNDP World Energy Assessment)

66
World Primary Energy Consumption, 1998
(Source: UNDP World Energy Assessment, 2000)
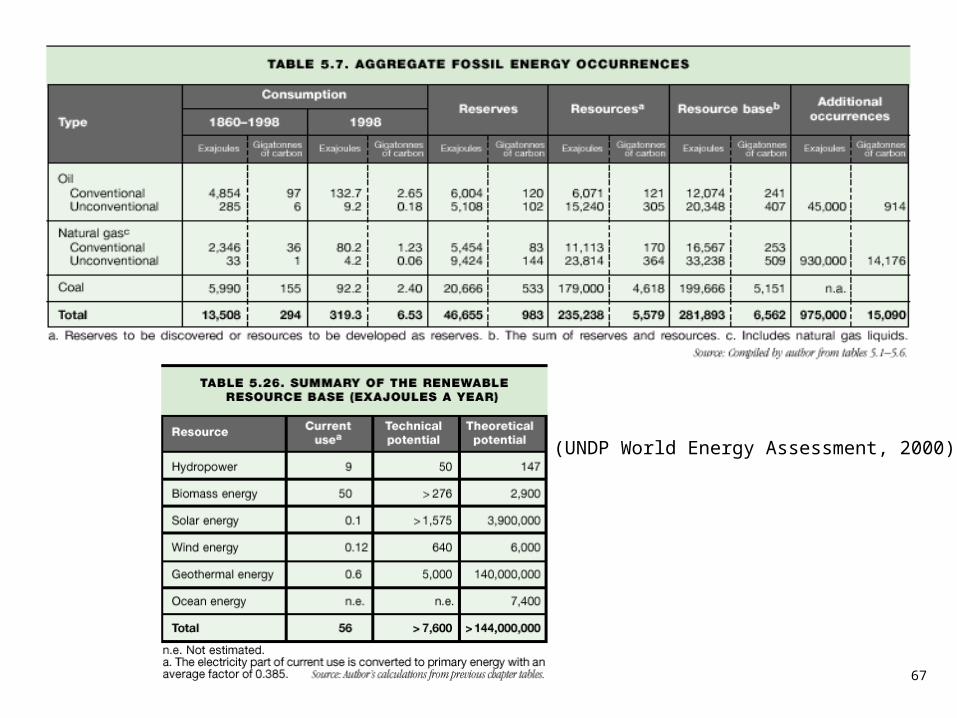
67
(UNDP World Energy Assessment, 2000)

68
Energy (in formulas)
Work = Force x Distance (= m . a . d)
N.m = Joule
Energy of motion:
d = average velocity x time = t x (vo+vf)/2 ; v0 =0
E = m . a . t . ½ vf ; vf = a . t
= m . vf . ½ vf
= ½ mvf2
Energy of position:
E = m x a x h

69

70
Oil, Gas and Coal Reserves (2000)

71
US Energy Source Distribution
Worldwide North America
Natural Gas 19.6%
Natural Gas25.0%
Oil39.5%
Oil39.2%
Coal30.3%
Coal23.1%
Hydroelectric6.7%
Nuclear3.9%
Hydroelectric7.7%
Nuclear5.0%
Natural gas provides us with a larger share relative to the rest of the world because we have a continent-wide pipeline system(Cunningham and Saigo, 1990)

72
US Energy Flow by Resource, 2000
Coal
Electricity
Natural Gas
Petroleum