08 nd powerpt
TRANSCRIPT


Children Aged <5 YearsChildren Aged <5 Years
2008 2008
NORTH DAKOTANORTH DAKOTA
Pediatric NutritionSurveillance System
GraphicsGraphics
20072007 (prior year) national (prior year) national PedNSS data are presented.PedNSS data are presented.
Contributors included 44 states, the Contributors included 44 states, the District of Columbia, 6 Indian Tribal District of Columbia, 6 Indian Tribal Organizations, and 1 U.S. territory.Organizations, and 1 U.S. territory.
Comparing Contributor and National DataComparing Contributor and National Data
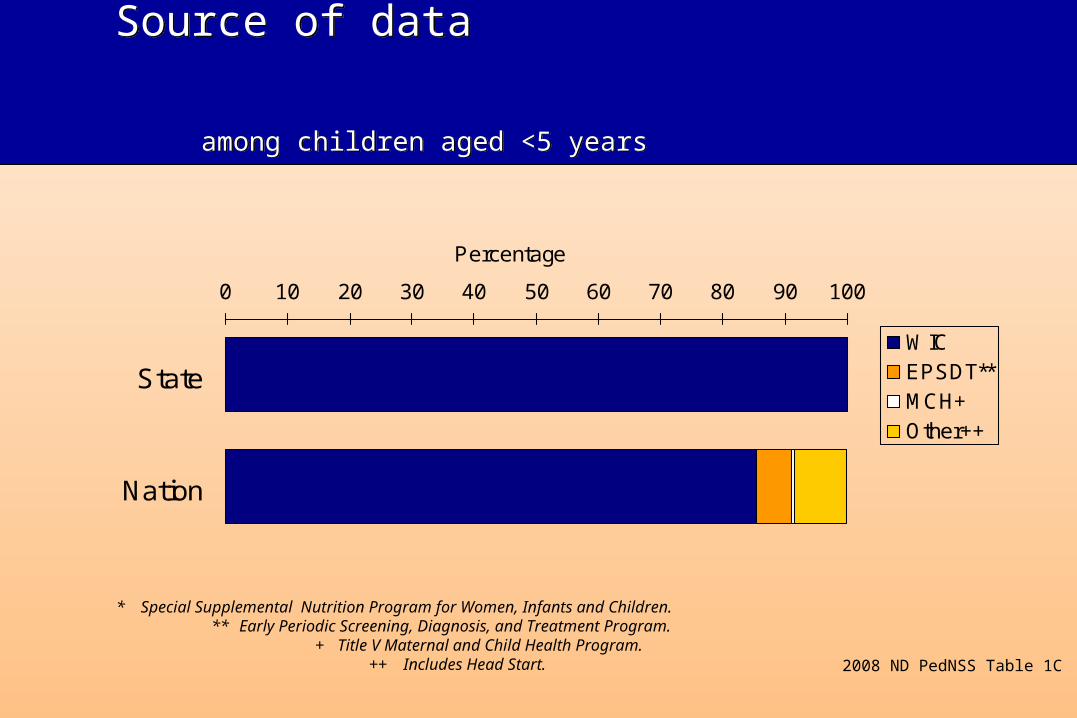
Source of data among children aged <5 years
Source of data among children aged <5 years
2008 ND PedNSS Table 1C
* Special Supplemental Nutrition Program for Women, Infants and Children. ** Early Periodic Screening, Diagnosis, and Treatment Program. + Title V Maternal and Child Health Program. ++ Includes Head Start.
0 10 20 30 40 50 60 70 80 90 100
State
Nation
Percentage
WICEPSDT**MCH+Other++
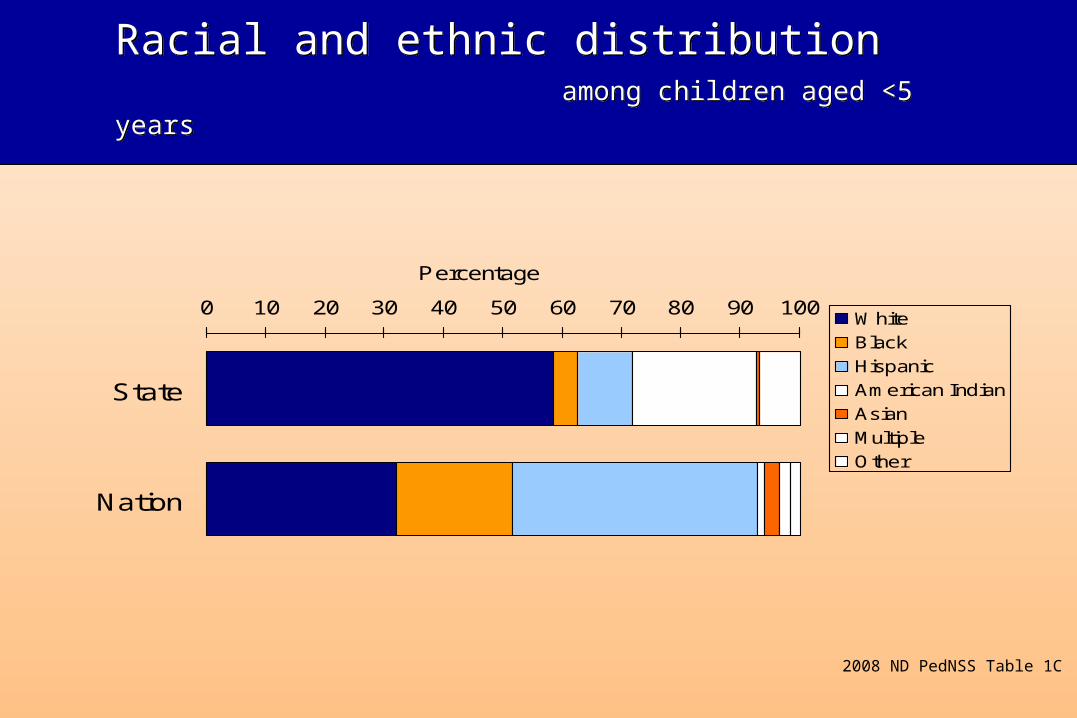
Racial and ethnic distribution among children aged <5 yearsRacial and ethnic distribution among children aged <5 years
2008 ND PedNSS Table 1C
0 10 20 30 40 50 60 70 80 90 100
State
Nation
Percentage
White
Black
Hispanic
American Indian
Asian
Multiple
Other
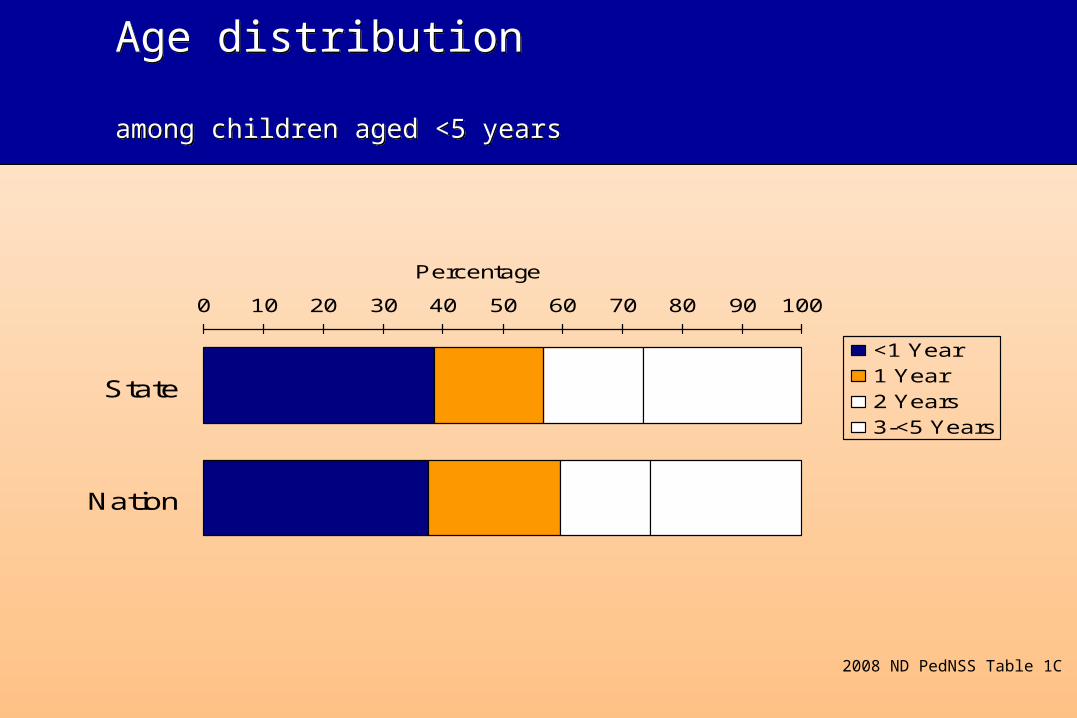
Age distribution among children aged <5 yearsAge distribution among children aged <5 years
2008 ND PedNSS Table 1C
0 10 20 30 40 50 60 70 80 90 100
State
Nation
Percentage
<1 Year1 Year2 Years3-<5 Years
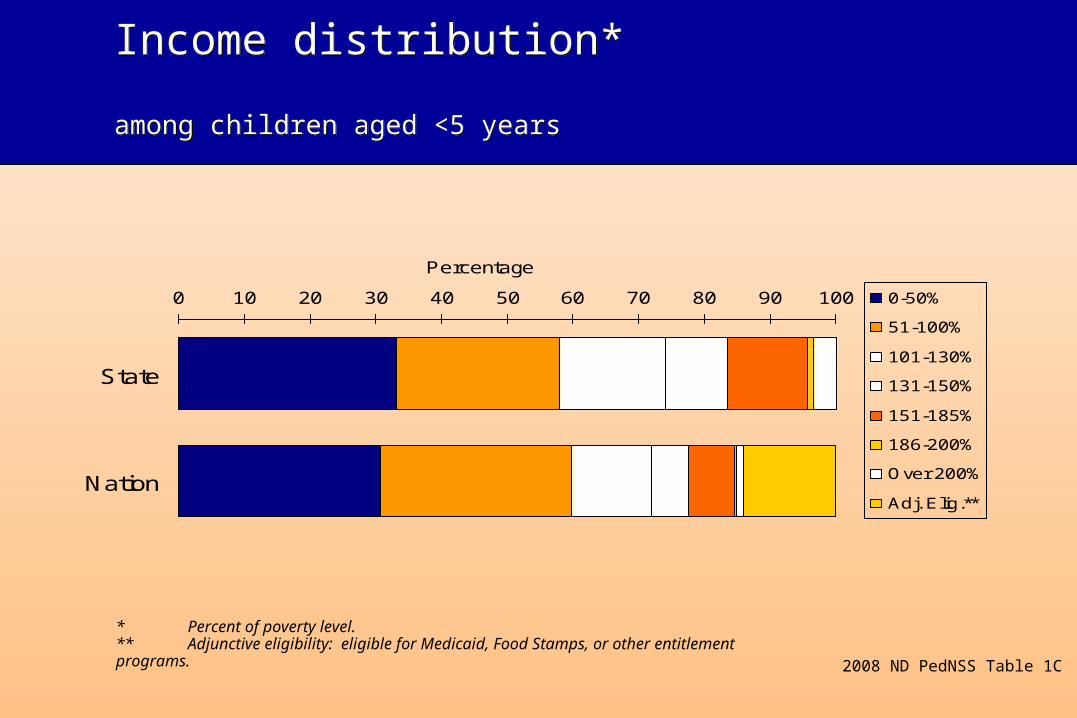
Income distribution* among children aged <5 years
Income distribution* among children aged <5 years
2008 ND PedNSS Table 1C
* Percent of poverty level. ** Adjunctive eligibility: eligible for Medicaid, Food Stamps, or other entitlement programs.
0 10 20 30 40 50 60 70 80 90 100
State
Nation
Percentage
0-50%
51-100%
101-130%
131-150%
151-185%
186-200%
Over 200%
Adj. Elig.**
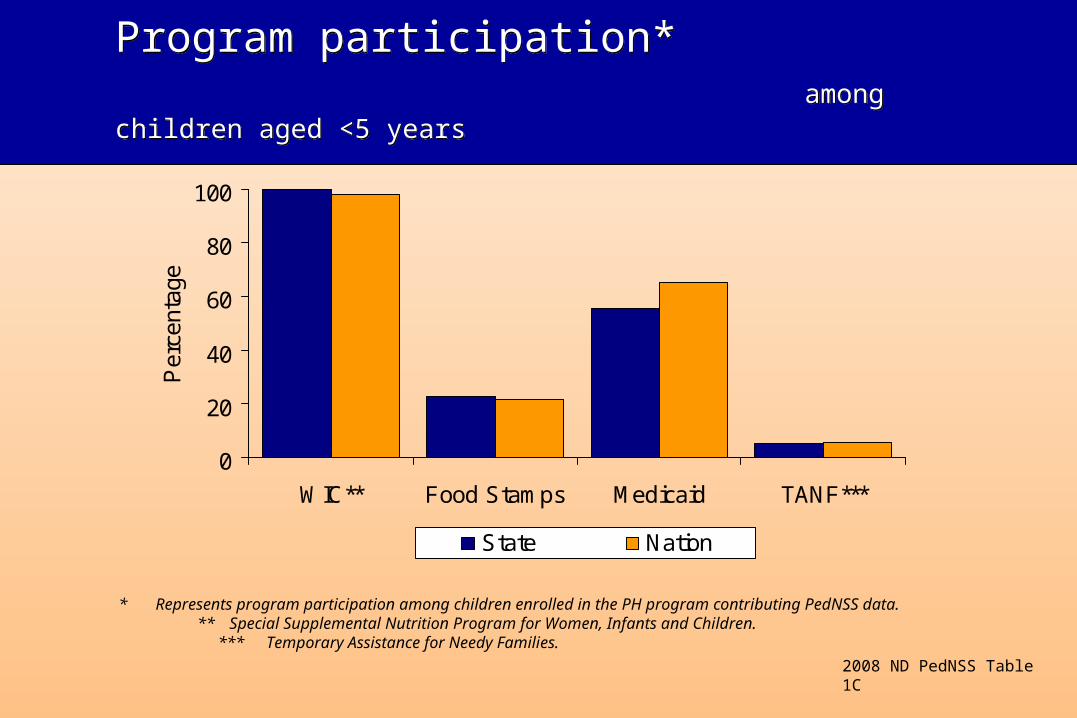
Program participation* among children aged <5 yearsProgram participation* among children aged <5 years
0
20
40
60
80
100
WIC** Food Stamps Medicaid TANF***
Per
cent
age
State Nation
2008 ND PedNSS Table 1C
* Represents program participation among children enrolled in the PH program contributing PedNSS data. ** Special Supplemental Nutrition Program for Women, Infants and Children. *** Temporary Assistance for Needy Families.
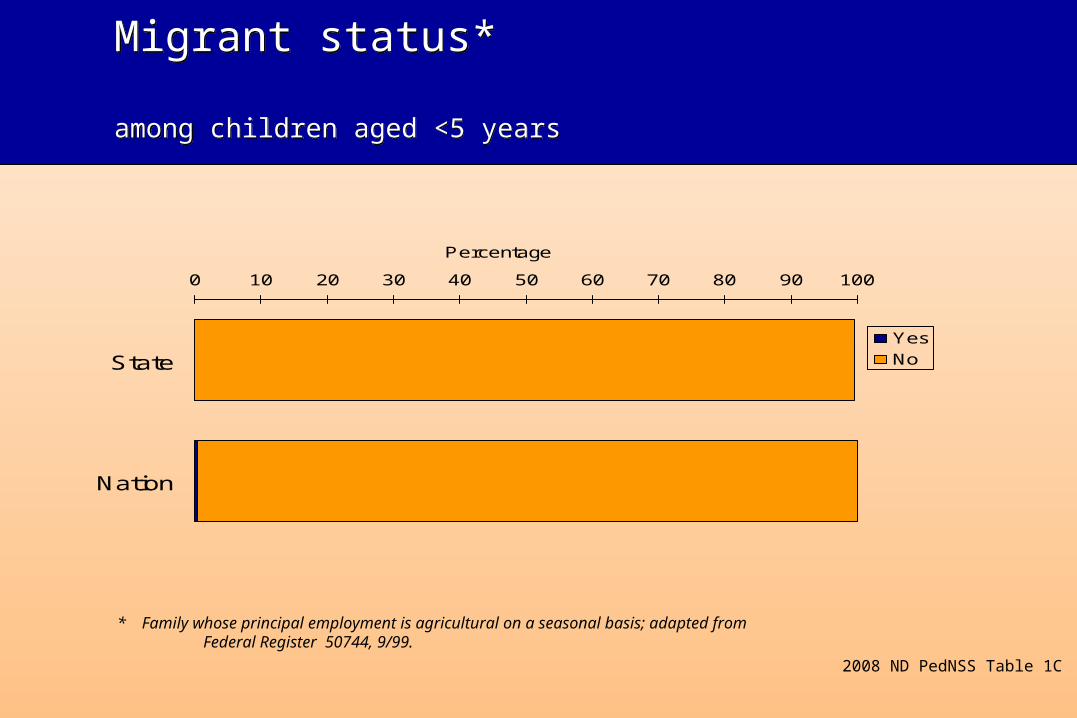
Migrant status* among children aged <5 years
Migrant status* among children aged <5 years
2008 ND PedNSS Table 1C
* Family whose principal employment is agricultural on a seasonal basis; adapted from Federal Register 50744, 9/99.
0 10 20 30 40 50 60 70 80 90 100
State
Nation
Percentage
YesNo
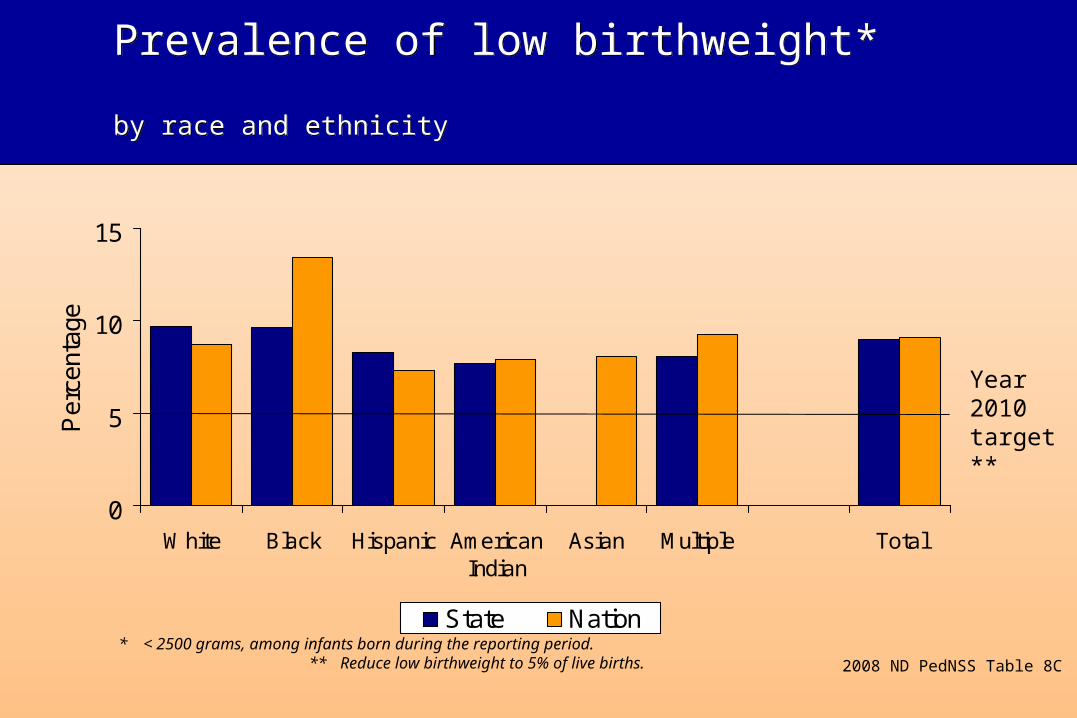
Prevalence of low birthweight* by race and ethnicity
Prevalence of low birthweight* by race and ethnicity
0
5
10
15
White Black Hispanic AmericanIndian
Asian Multiple Total
Per
cent
age
State Nation
2008 ND PedNSS Table 8C * < 2500 grams, among infants born during the reporting period. ** Reduce low birthweight to 5% of live births.
Year 2010 target**
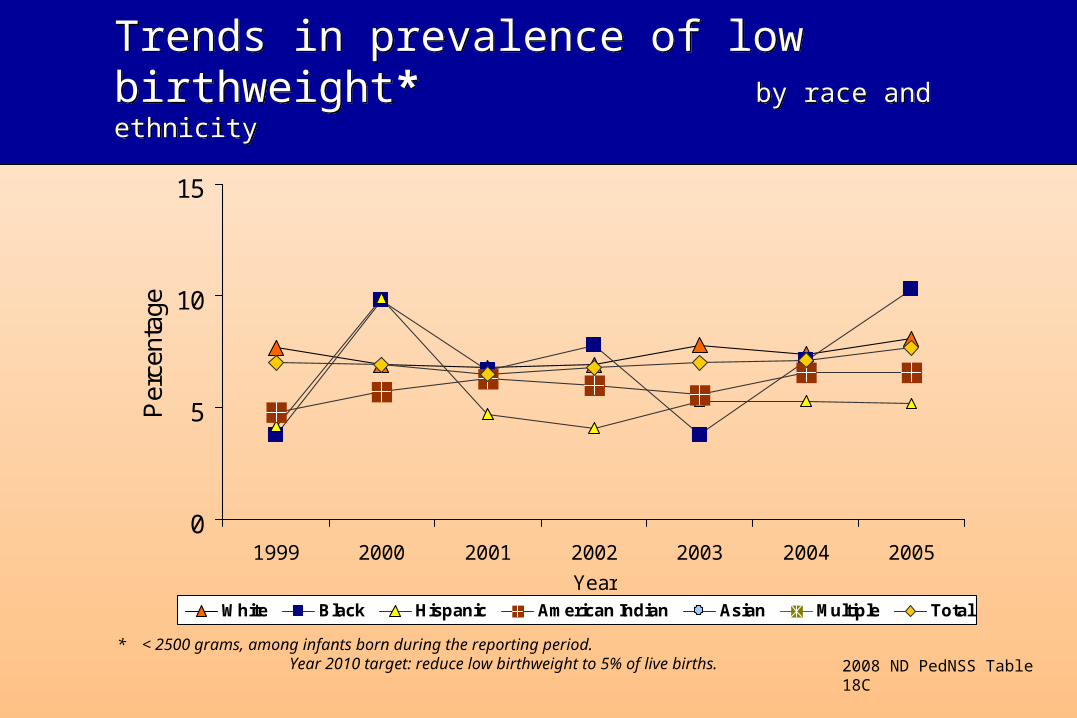
Trends in prevalence of low birthweight* by race and ethnicity
Trends in prevalence of low birthweight* by race and ethnicity
0
5
10
15
1999 2000 2001 2002 2003 2004 2005
Year
Per
cent
age
White Black Hispanic American Indian Asian Multiple Total
2008 ND PedNSS Table 18C * < 2500 grams, among infants born during the reporting period. Year 2010 target: reduce low birthweight to 5% of live births.
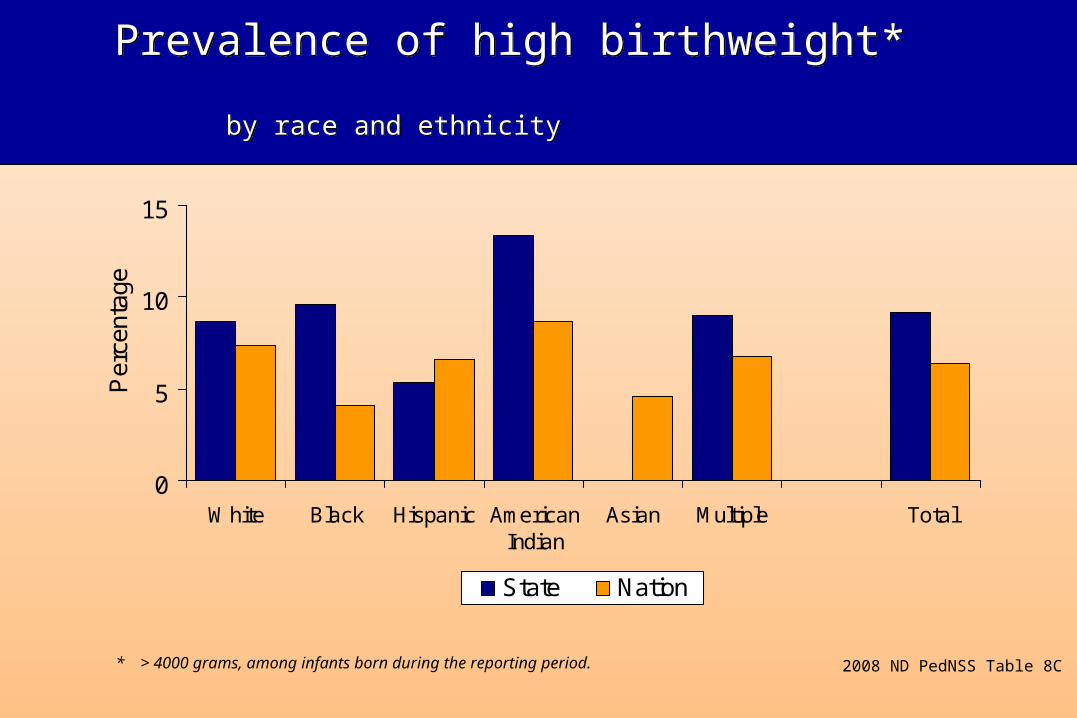
Prevalence of high birthweight* by race and ethnicity
Prevalence of high birthweight* by race and ethnicity
0
5
10
15
White Black Hispanic AmericanIndian
Asian Multiple Total
Per
cent
age
State Nation
2008 ND PedNSS Table 8C * > 4000 grams, among infants born during the reporting period.
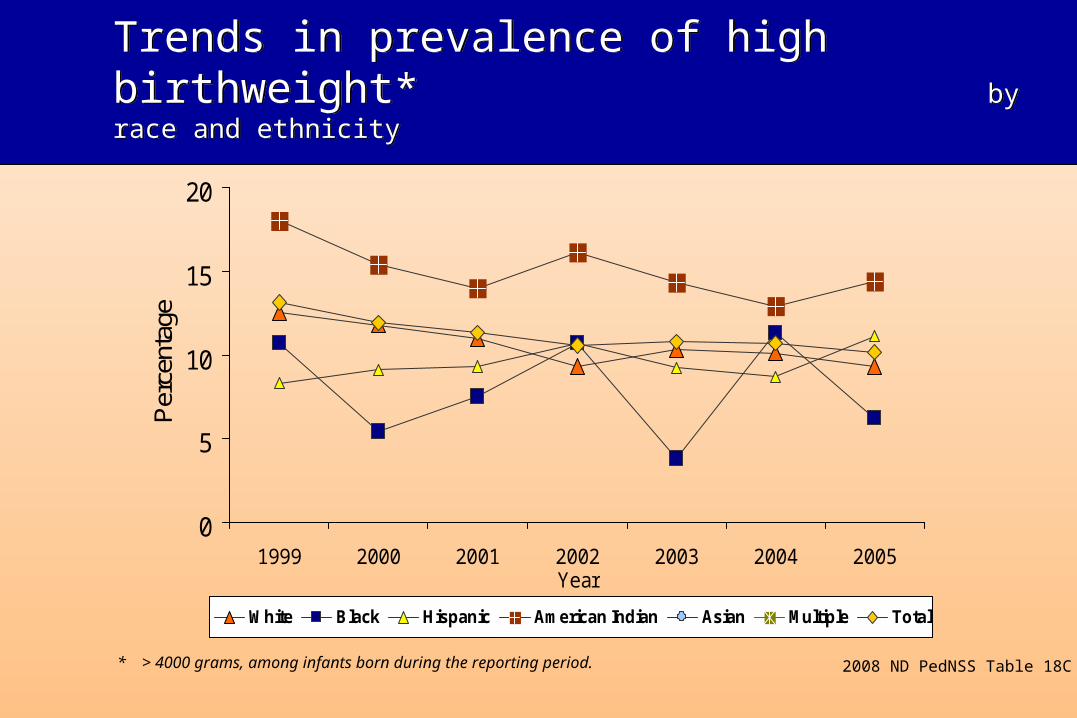
Trends in prevalence of high birthweight* by race and ethnicity
Trends in prevalence of high birthweight* by race and ethnicity
2008 ND PedNSS Table 18C * > 4000 grams, among infants born during the reporting period.
0
5
10
15
20
1999 2000 2001 2002 2003 2004 2005Year
Per
cent
age
White Black Hispanic American Indian Asian Multiple Total
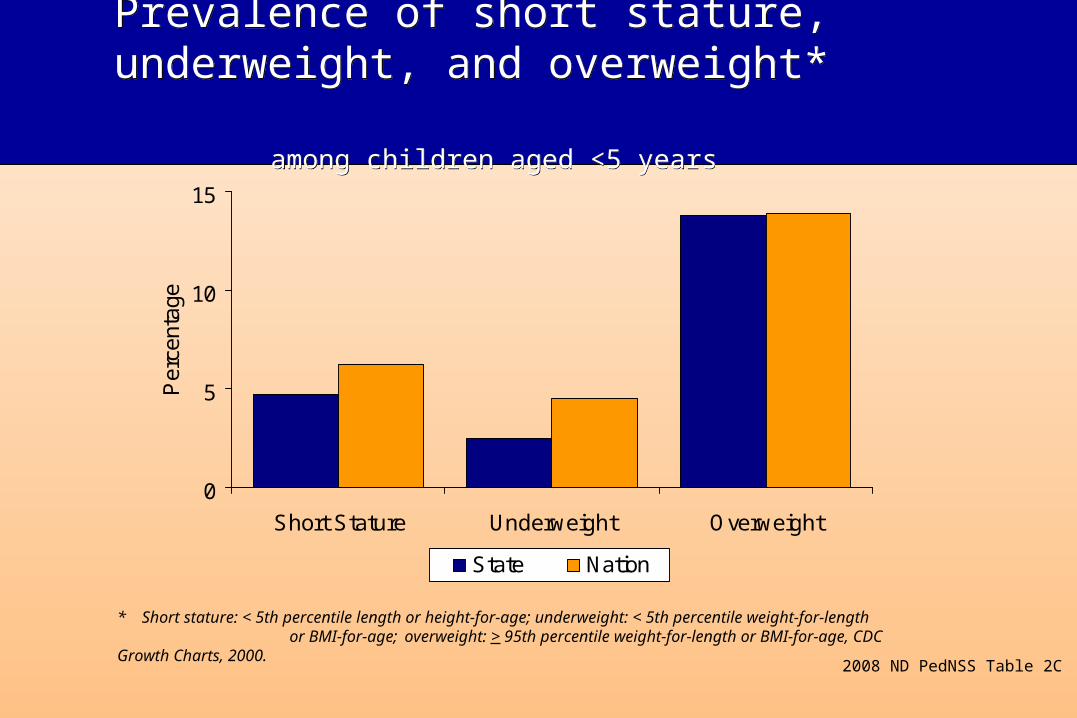
Prevalence of short stature, underweight, and overweight* among children aged <5 years
Prevalence of short stature, underweight, and overweight* among children aged <5 years
0
5
10
15
Short Stature Underweight Overweight
Per
cent
age
State Nation
2008 ND PedNSS Table 2C
* Short stature: < 5th percentile length or height-for-age; underweight: < 5th percentile weight-for-length or BMI-for-age; overweight: > 95th percentile weight-for-length or BMI-for-age, CDC
Growth Charts, 2000.
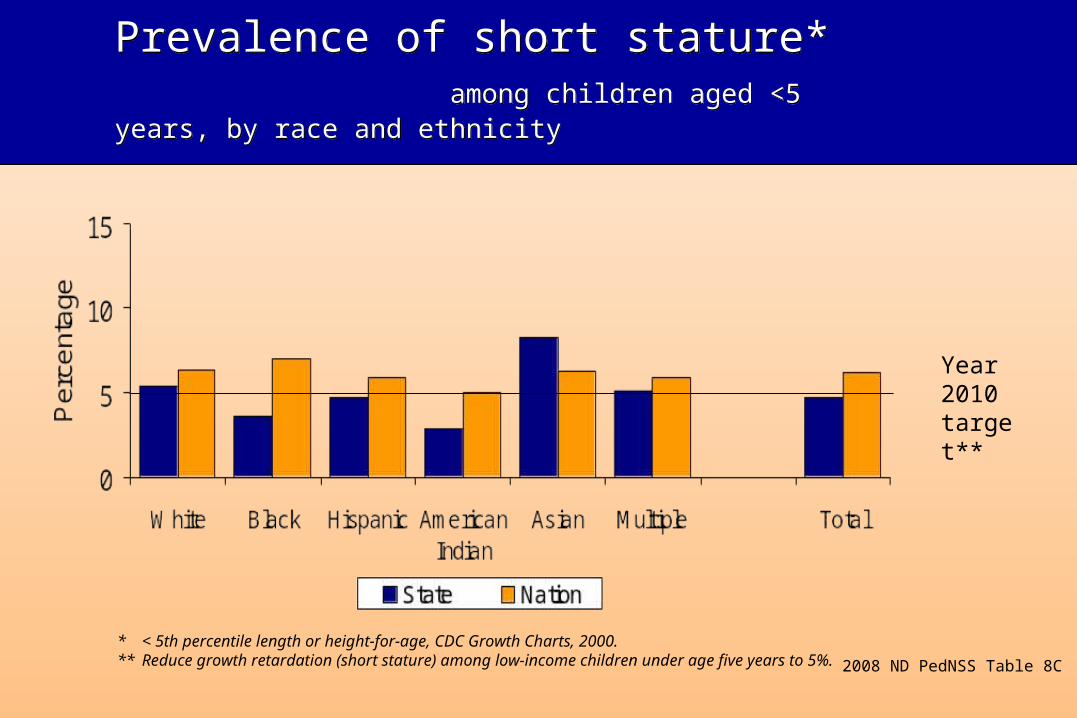
Prevalence of short stature* among children aged <5 years, by race and ethnicityPrevalence of short stature* among children aged <5 years, by race and ethnicity
* < 5th percentile length or height-for-age, CDC Growth Charts, 2000. ** Reduce growth retardation (short stature) among low-income children under age five years to 5%.
Year 2010target**
2008 ND PedNSS Table 8C
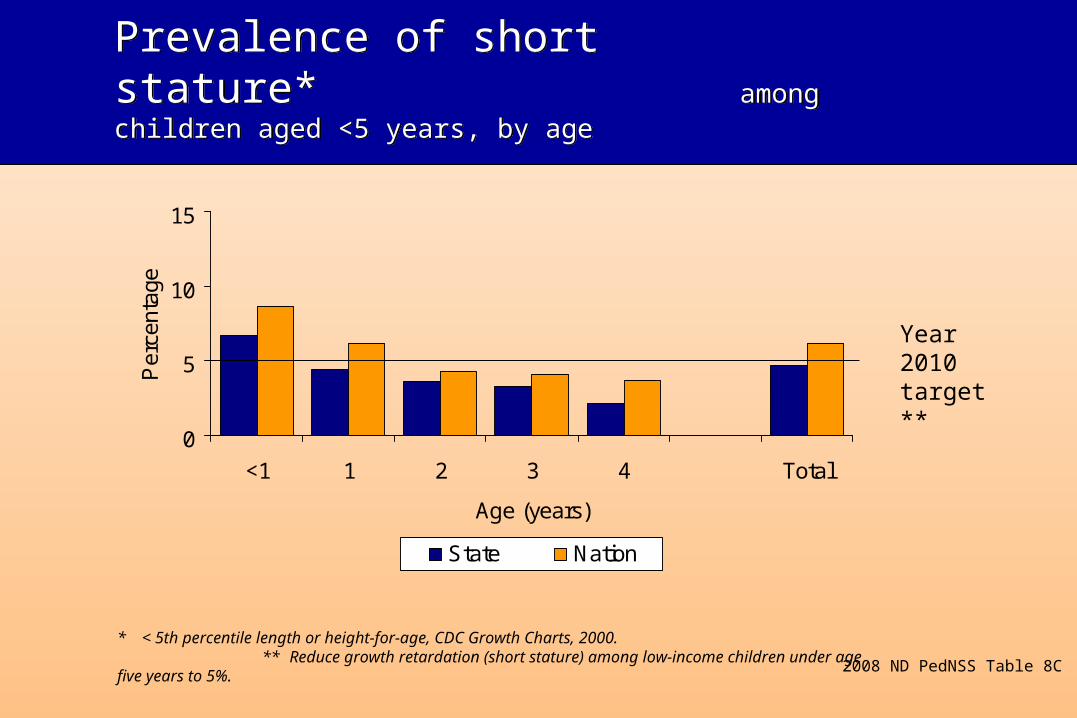
Prevalence of short stature* among children aged <5 years, by agePrevalence of short stature* among children aged <5 years, by age
0
5
10
15
<1 1 2 3 4 Total
Age (years)
Per
cent
age
State Nation
* < 5th percentile length or height-for-age, CDC Growth Charts, 2000. ** Reduce growth retardation (short stature) among low-income children under age five years to 5%.
2008 ND PedNSS Table 8C
Year 2010 target**
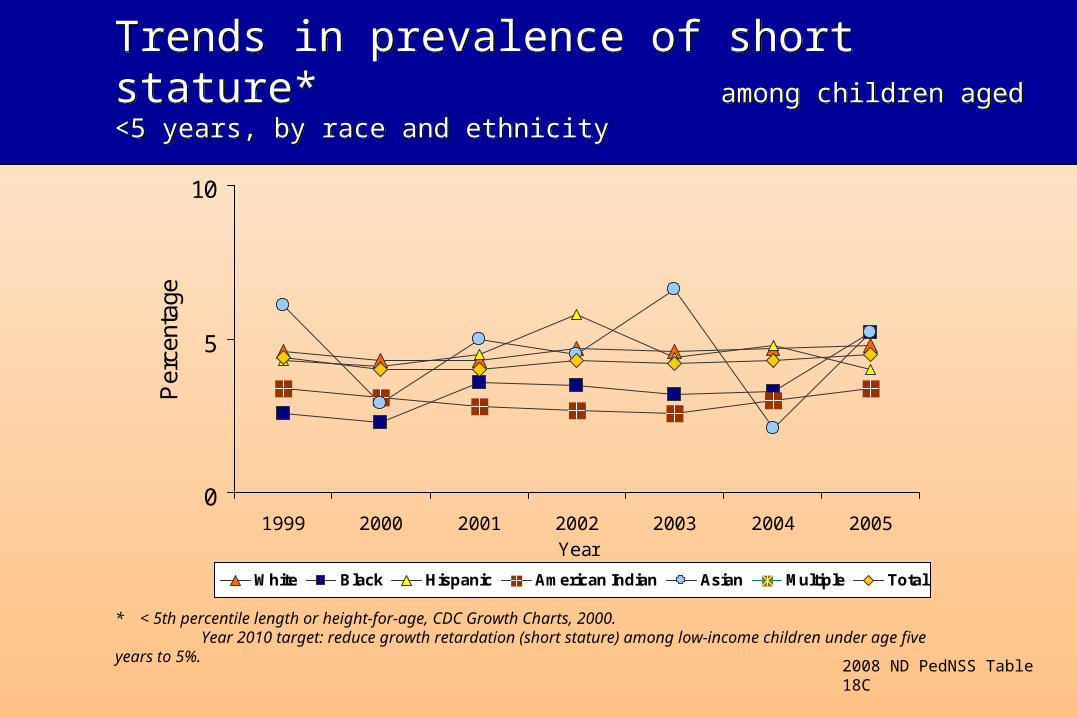
Trends in prevalence of short stature* among children aged <5 years, by race and ethnicityTrends in prevalence of short stature* among children aged <5 years, by race and ethnicity
0
5
10
1999 2000 2001 2002 2003 2004 2005Year
Per
cent
age
White Black Hispanic American Indian Asian Multiple Total
2008 ND PedNSS Table 18C
* < 5th percentile length or height-for-age, CDC Growth Charts, 2000. Year 2010 target: reduce growth retardation (short stature) among low-income children under age
five years to 5%.
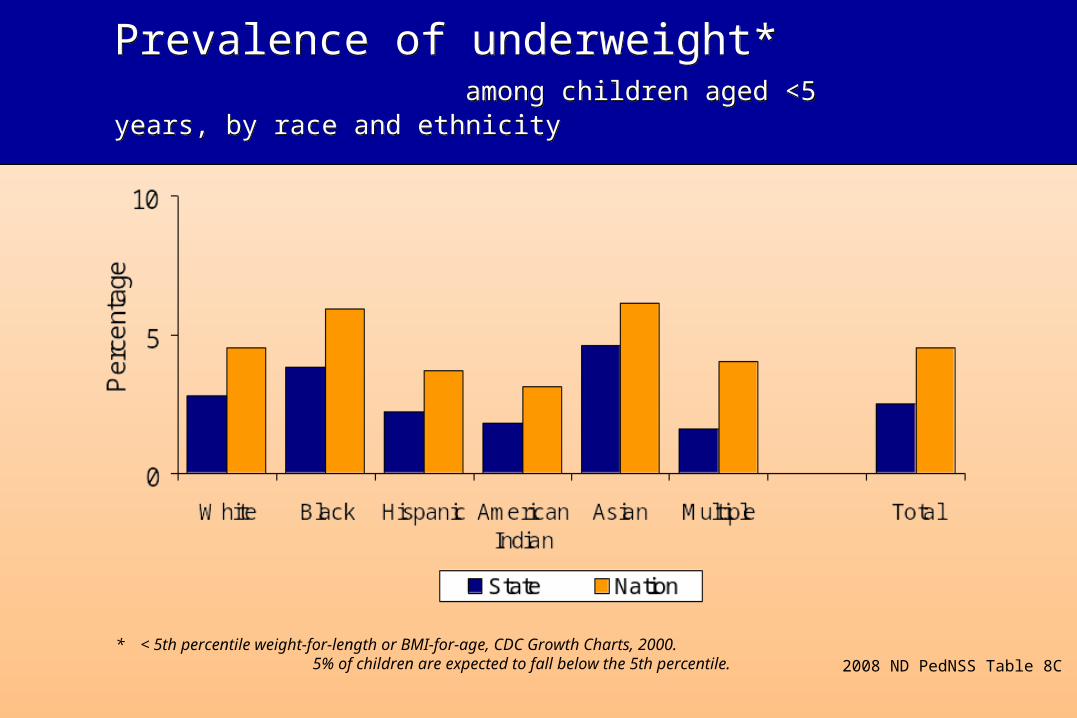
Prevalence of underweight* among children aged <5 years, by race and ethnicityPrevalence of underweight* among children aged <5 years, by race and ethnicity
* < 5th percentile weight-for-length or BMI-for-age, CDC Growth Charts, 2000. 5% of children are expected to fall below the 5th percentile. 2008 ND PedNSS Table 8C
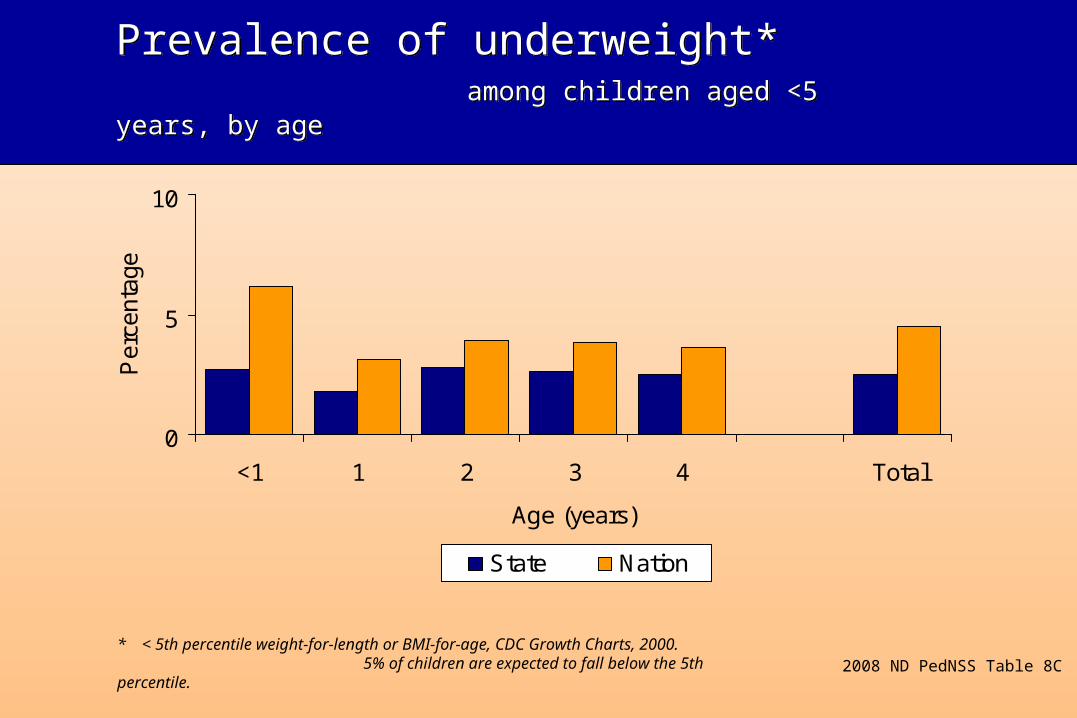
Prevalence of underweight* among children aged <5 years, by agePrevalence of underweight* among children aged <5 years, by age
0
5
10
<1 1 2 3 4 Total
Age (years)
Per
cent
age
State Nation
* < 5th percentile weight-for-length or BMI-for-age, CDC Growth Charts, 2000. 5% of children are expected to fall below the 5th percentile.
2008 ND PedNSS Table 8C
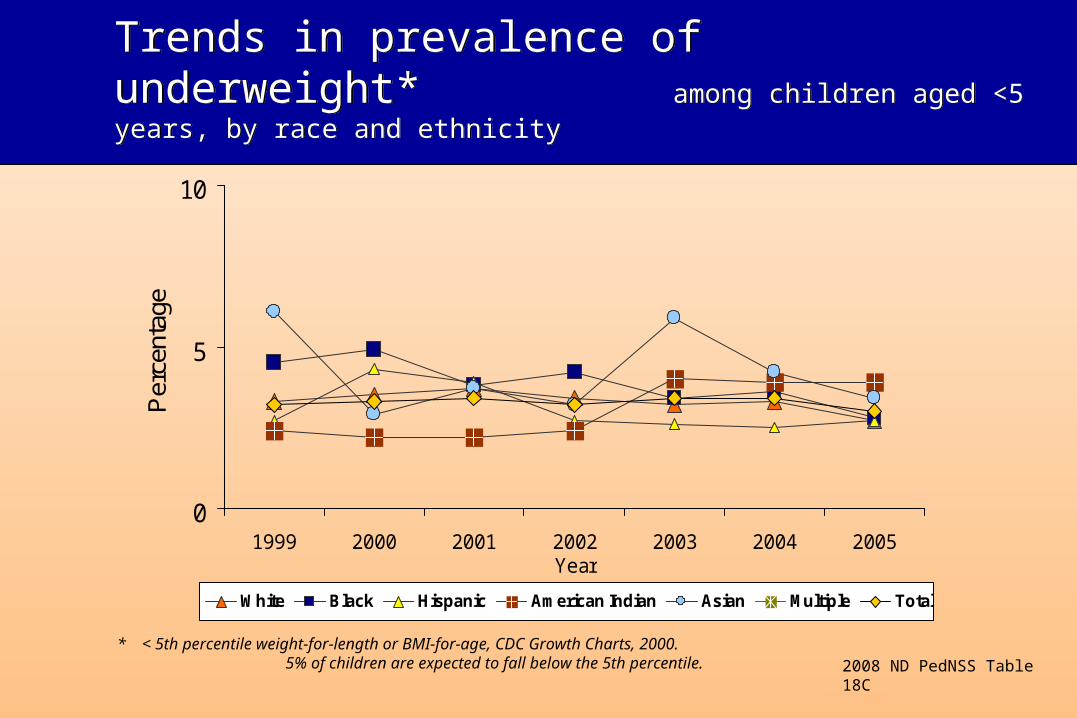
Trends in prevalence of underweight* among children aged <5 years, by race and ethnicityTrends in prevalence of underweight* among children aged <5 years, by race and ethnicity
0
5
10
1999 2000 2001 2002 2003 2004 2005Year
Per
cent
age
White Black Hispanic American Indian Asian Multiple Total
* < 5th percentile weight-for-length or BMI-for-age, CDC Growth Charts, 2000. 5% of children are expected to fall below the 5th percentile. 2008 ND PedNSS Table 18C
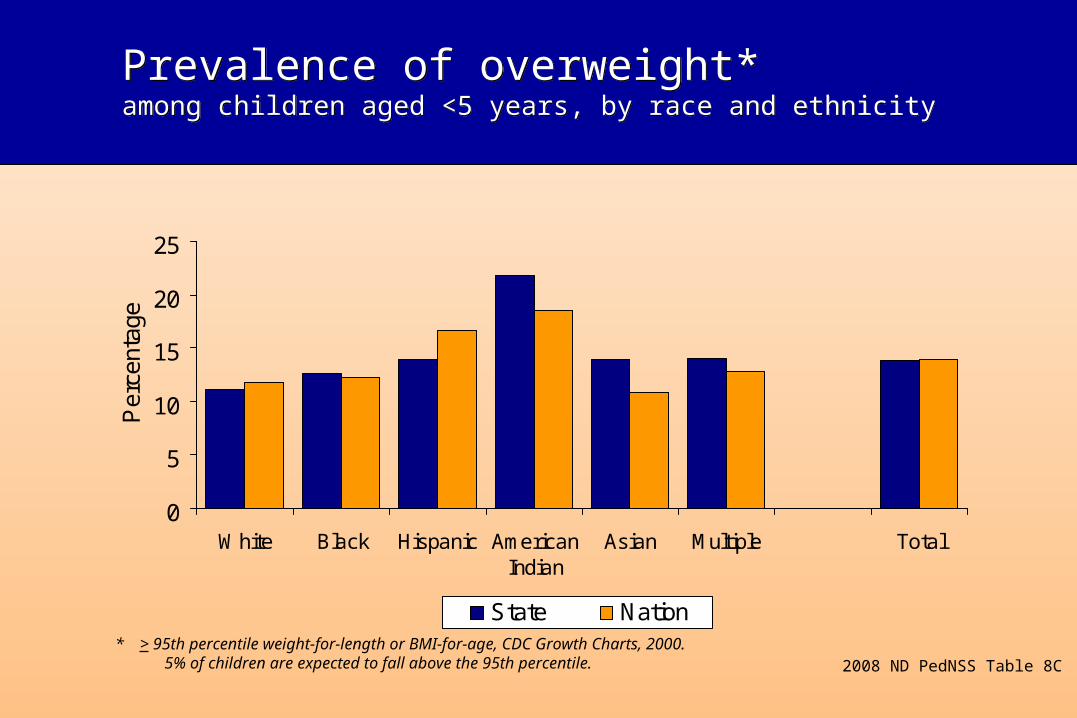
Prevalence of overweight* among children aged <5 years, by race and ethnicityPrevalence of overweight* among children aged <5 years, by race and ethnicity
* > 95th percentile weight-for-length or BMI-for-age, CDC Growth Charts, 2000. 5% of children are expected to fall above the 95th percentile. 2008 ND PedNSS Table 8C
0
5
10
15
20
25
White Black Hispanic AmericanIndian
Asian Multiple Total
Per
cent
age
State Nation
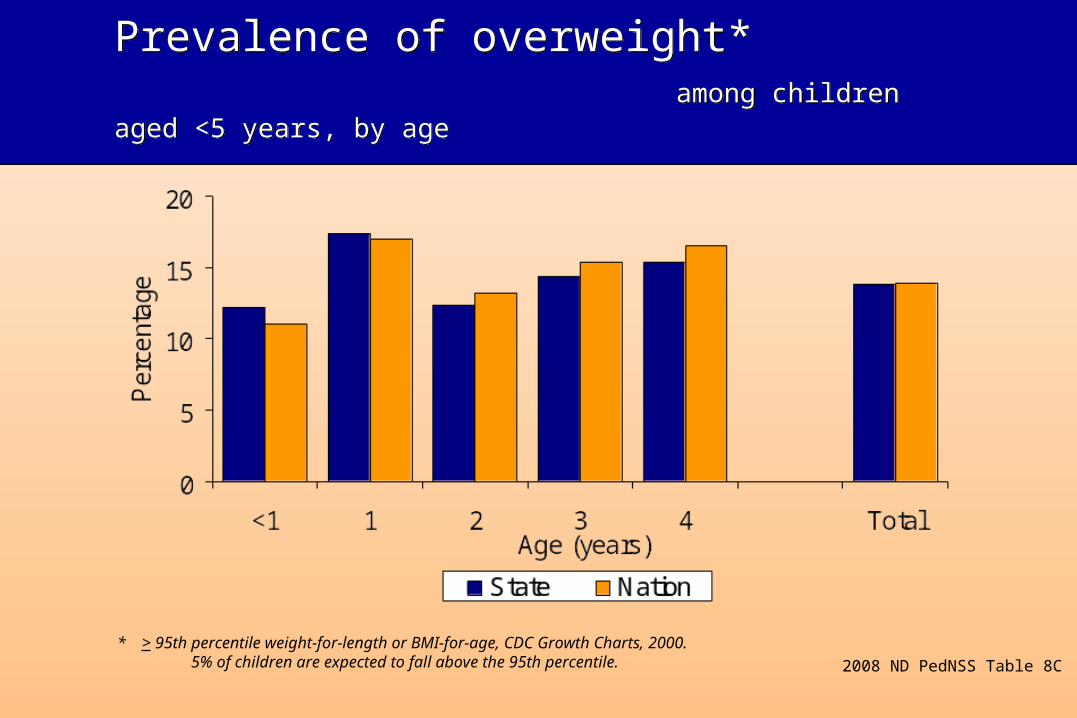
Prevalence of overweight* among children aged <5 years, by age
Prevalence of overweight* among children aged <5 years, by age
* > 95th percentile weight-for-length or BMI-for-age, CDC Growth Charts, 2000. 5% of children are expected to fall above the 95th percentile. 2008 ND PedNSS Table 8C
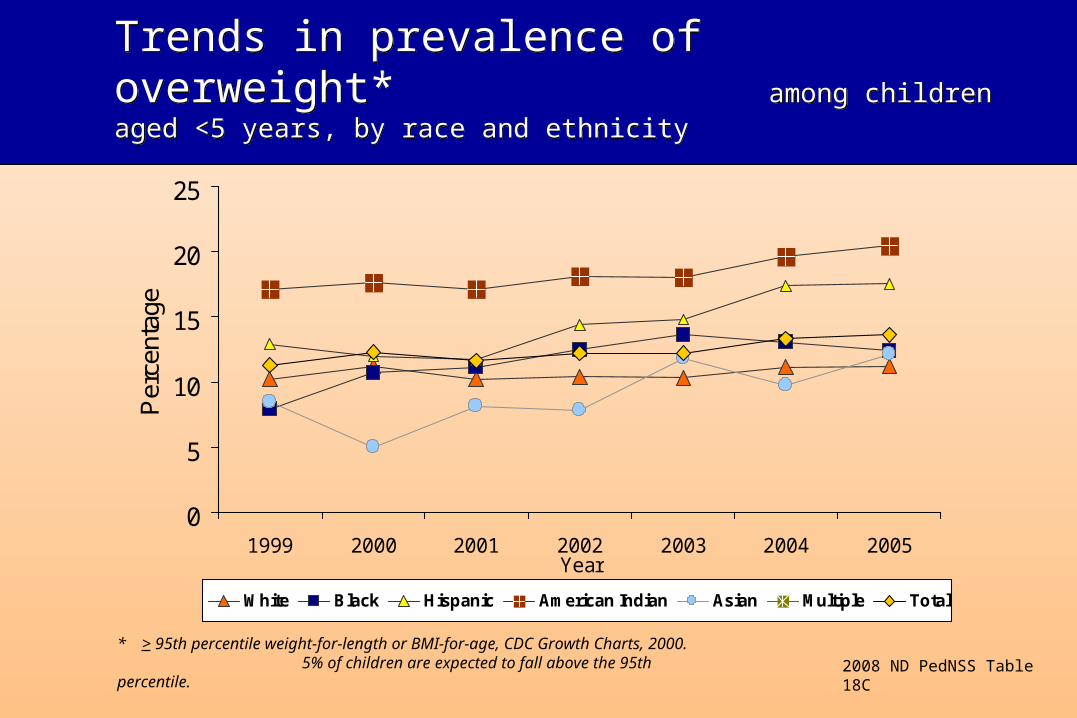
Trends in prevalence of overweight* among children aged <5 years, by race and ethnicityTrends in prevalence of overweight* among children aged <5 years, by race and ethnicity
0
5
10
15
20
25
1999 2000 2001 2002 2003 2004 2005Year
Per
cent
age
White Black Hispanic American Indian Asian Multiple Total
* > 95th percentile weight-for-length or BMI-for-age, CDC Growth Charts, 2000. 5% of children are expected to fall above the 95th percentile.
2008 ND PedNSS Table 18C
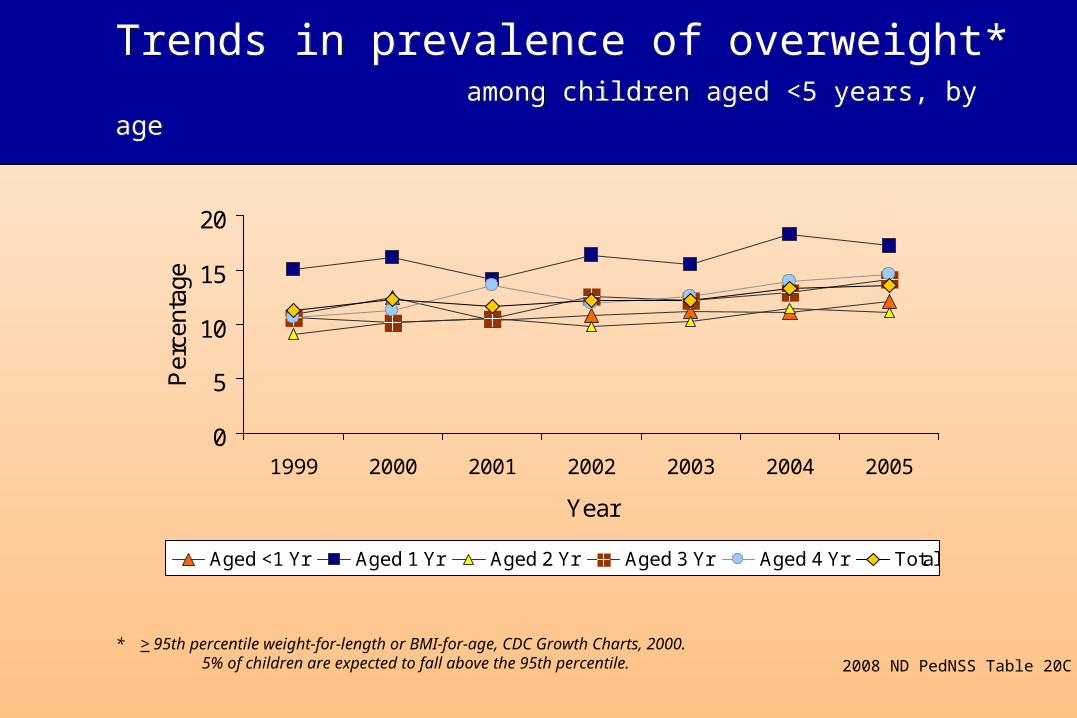
Trends in prevalence of overweight* among children aged <5 years, by ageTrends in prevalence of overweight* among children aged <5 years, by age
0
5
10
15
20
1999 2000 2001 2002 2003 2004 2005
Year
Per
cent
age
Aged <1 Yr Aged 1 Yr Aged 2 Yr Aged 3 Yr Aged 4 Yr Total
* > 95th percentile weight-for-length or BMI-for-age, CDC Growth Charts, 2000. 5% of children are expected to fall above the 95th percentile. 2008 ND PedNSS Table 20C
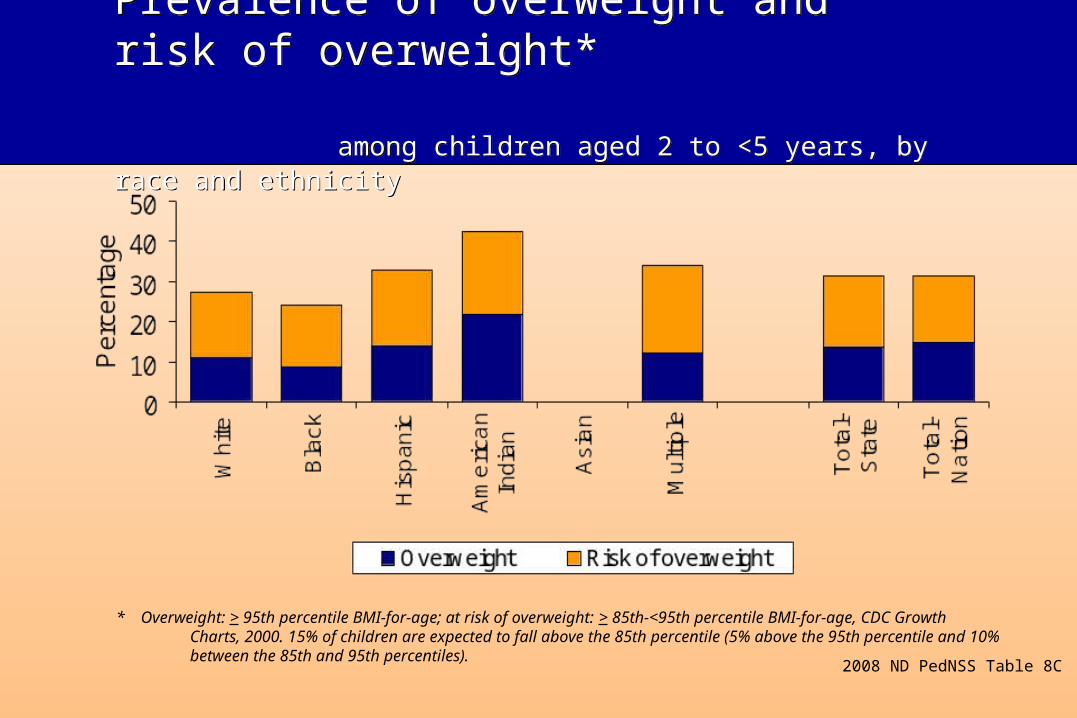
Prevalence of overweight and risk of overweight* among children aged 2 to <5 years, by race and ethnicity
Prevalence of overweight and risk of overweight* among children aged 2 to <5 years, by race and ethnicity
* Overweight: > 95th percentile BMI-for-age; at risk of overweight: > 85th-<95th percentile BMI-for-age, CDC Growth Charts, 2000. 15% of children are expected to fall above the 85th percentile (5% above the 95th percentile and
10% between the 85th and 95th percentiles).2008 ND PedNSS Table 8C
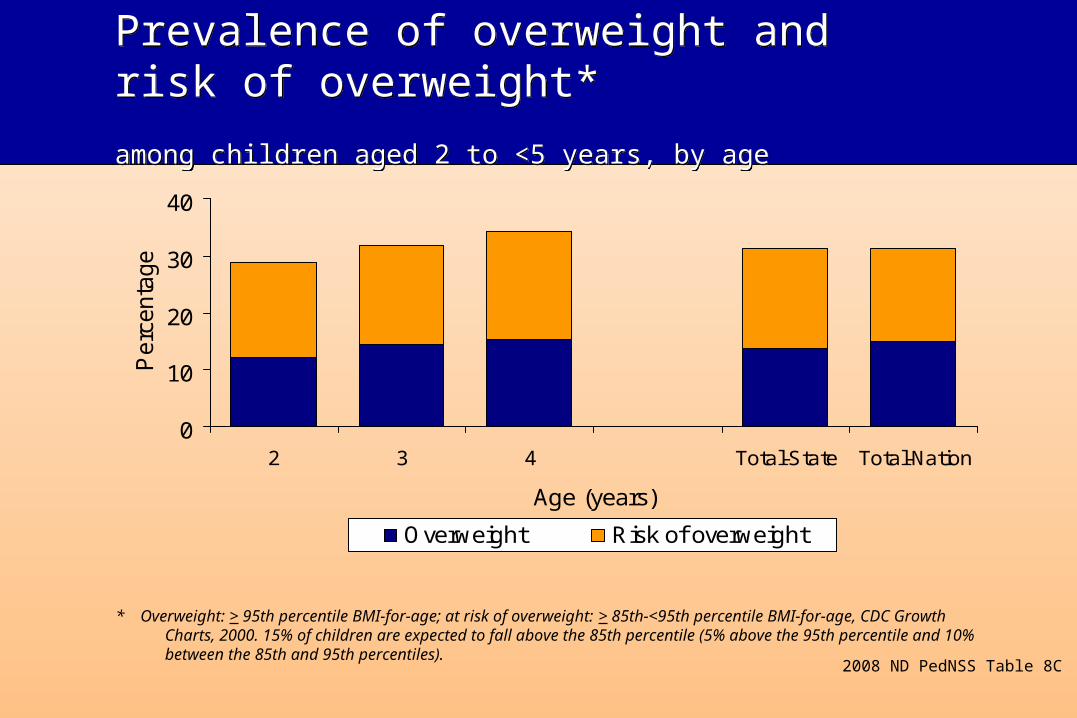
Prevalence of overweight and risk of overweight* among children aged 2 to <5 years, by age
Prevalence of overweight and risk of overweight* among children aged 2 to <5 years, by age
* Overweight: > 95th percentile BMI-for-age; at risk of overweight: > 85th-<95th percentile BMI-for-age, CDC Growth Charts, 2000. 15% of children are expected to fall above the 85th percentile (5% above the 95th percentile and
10% between the 85th and 95th percentiles).2008 ND PedNSS Table 8C
0
10
20
30
40
2 3 4 Total-State Total-Nation
Age (years)
Perc
enta
ge
Overweight Risk of overweight
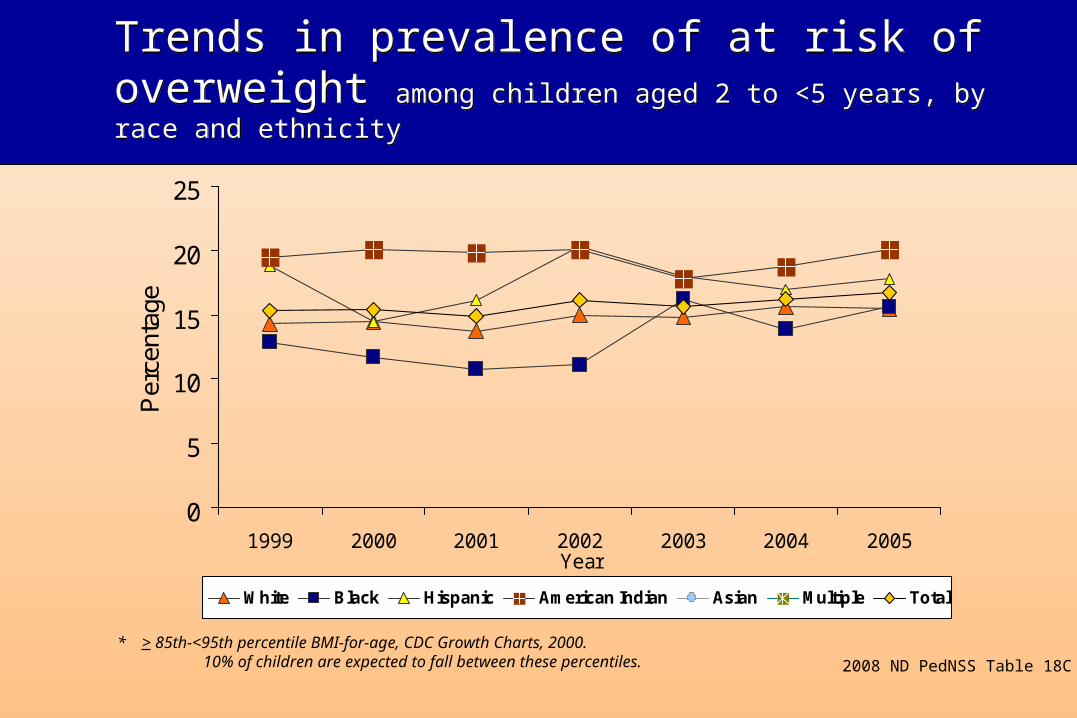
Trends in prevalence of at risk of overweight among children aged 2 to <5 years, by race and ethnicityTrends in prevalence of at risk of overweight among children aged 2 to <5 years, by race and ethnicity
0
5
10
15
20
25
1999 2000 2001 2002 2003 2004 2005Year
Per
cent
age
White Black Hispanic American Indian Asian Multiple Total
* > 85th-<95th percentile BMI-for-age, CDC Growth Charts, 2000. 10% of children are expected to fall between these percentiles. 2008 ND PedNSS Table 18C
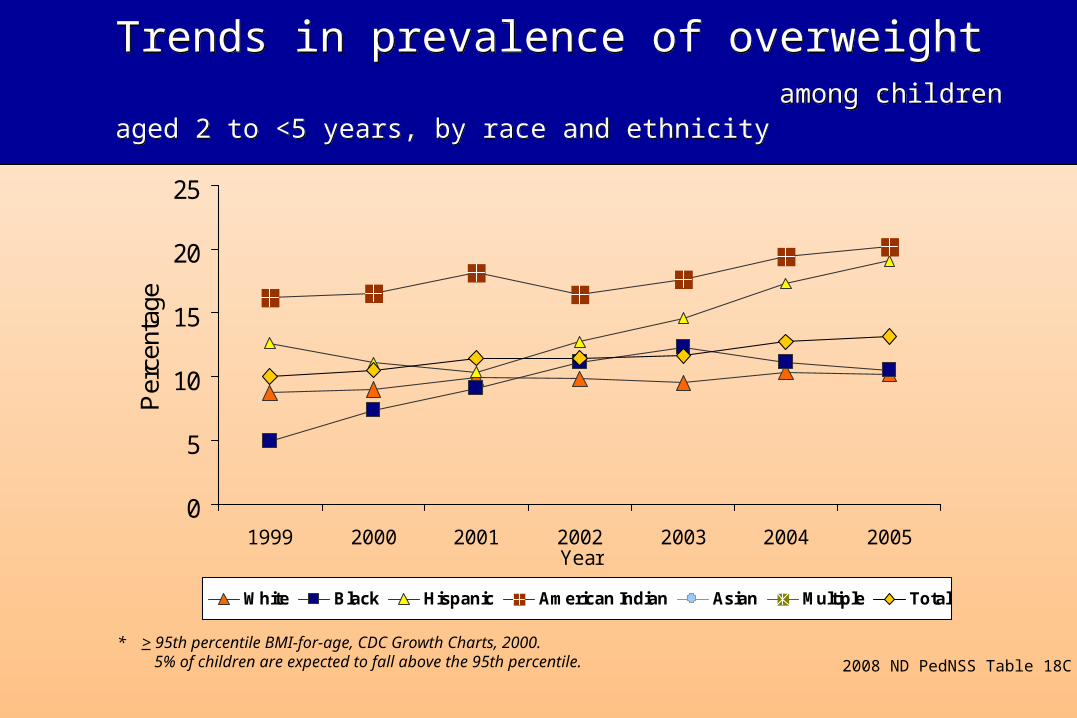
Trends in prevalence of overweight among children aged 2 to <5 years, by race and ethnicity
Trends in prevalence of overweight among children aged 2 to <5 years, by race and ethnicity
0
5
10
15
20
25
1999 2000 2001 2002 2003 2004 2005Year
Per
cent
age
White Black Hispanic American Indian Asian Multiple Total
* > 95th percentile BMI-for-age, CDC Growth Charts, 2000. 5% of children are expected to fall above the 95th percentile. 2008 ND PedNSS Table 18C
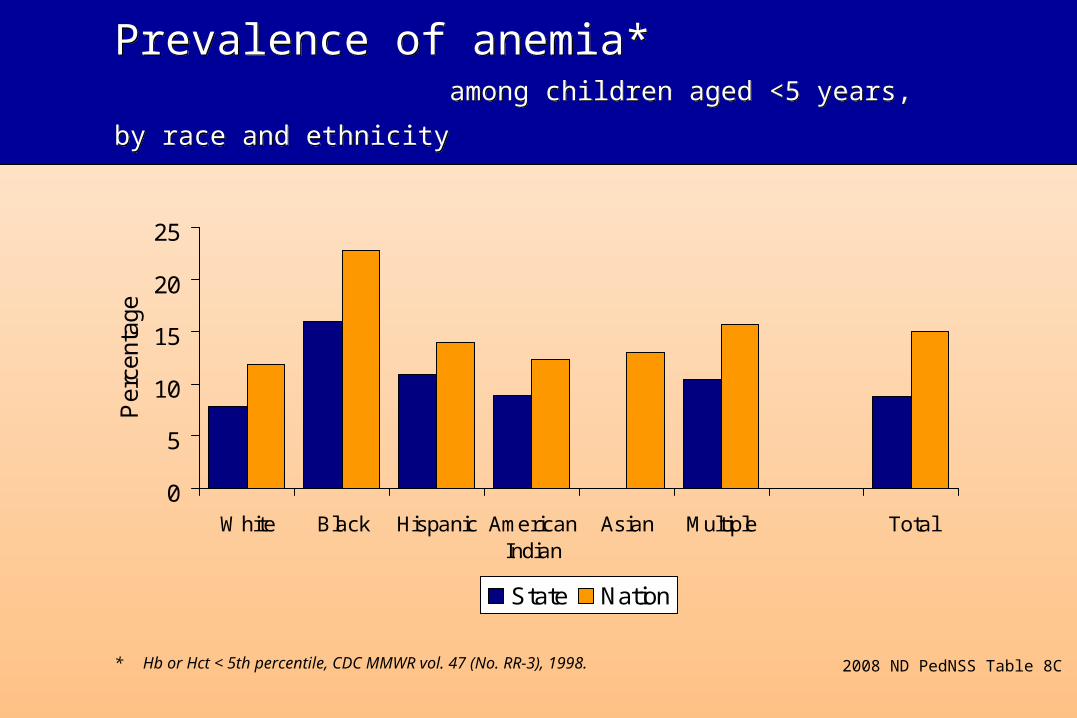
Prevalence of anemia*
among children aged <5 years, by race and ethnicity Prevalence of anemia*
among children aged <5 years, by race and ethnicity
* Hb or Hct < 5th percentile, CDC MMWR vol. 47 (No. RR-3), 1998.
0
5
10
15
20
25
White Black Hispanic AmericanIndian
Asian Multiple Total
Per
cent
age
State Nation
2008 ND PedNSS Table 8C
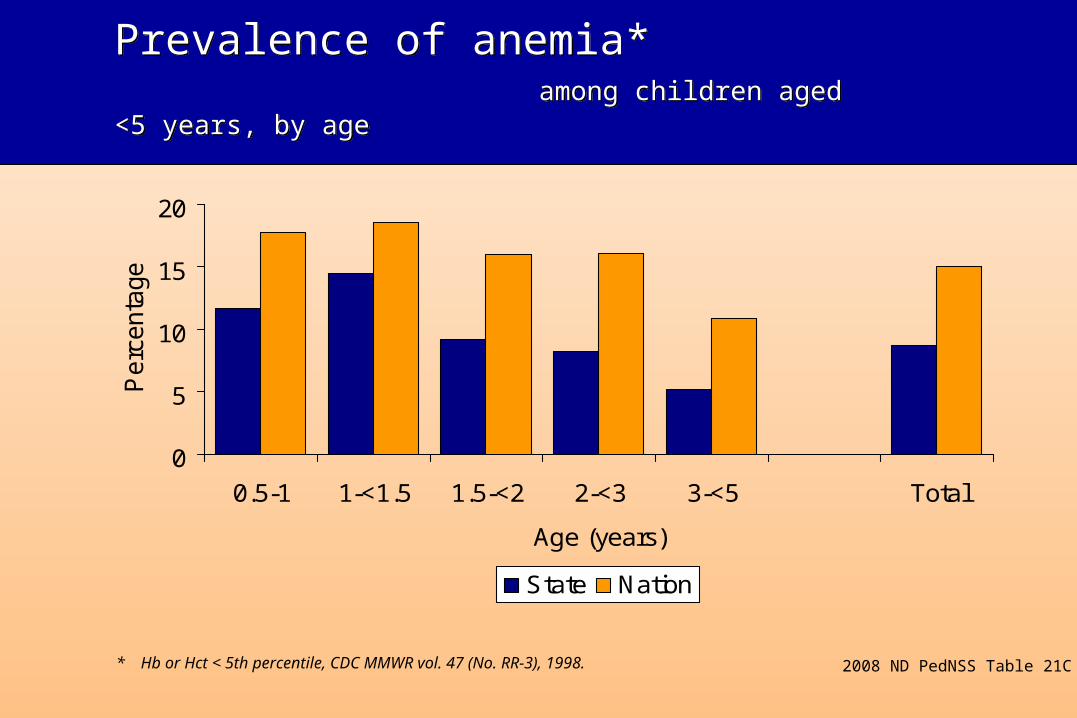
Prevalence of anemia* among children aged <5 years, by agePrevalence of anemia* among children aged <5 years, by age
0
5
10
15
20
0.5-1 1-<1.5 1.5-<2 2-<3 3-<5 Total
Age (years)
Perc
enta
ge
State Nation
* Hb or Hct < 5th percentile, CDC MMWR vol. 47 (No. RR-3), 1998. 2008 ND PedNSS Table 21C
0
5
10
15
20
25
1999 2000 2001 2002 2003 2004 2005Year
Per
cent
age
White Black Hispanic American Indian Asian Multiple Total
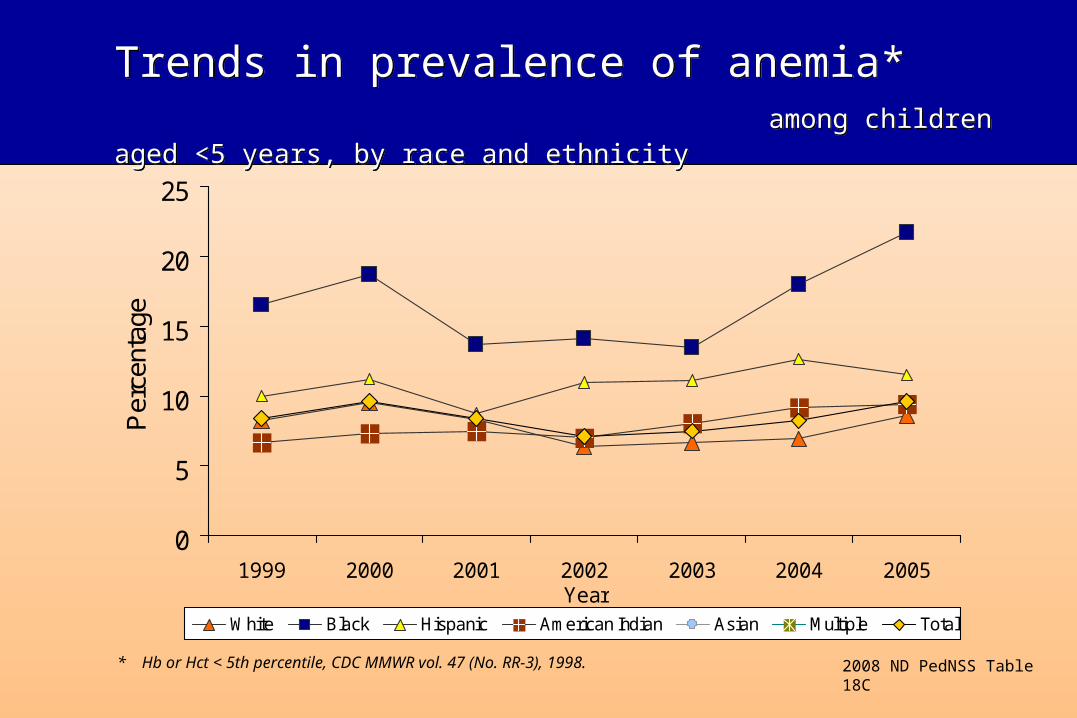
Trends in prevalence of anemia* among children aged <5 years, by race and ethnicityTrends in prevalence of anemia* among children aged <5 years, by race and ethnicity
* Hb or Hct < 5th percentile, CDC MMWR vol. 47 (No. RR-3), 1998.
2008 ND PedNSS Table 18C
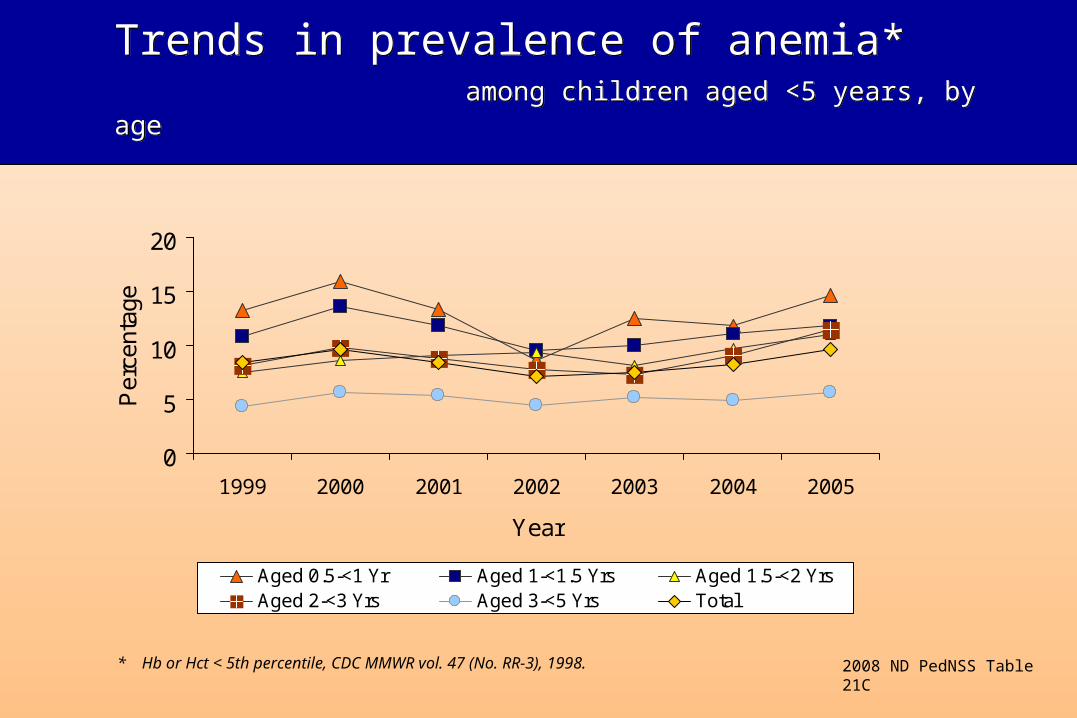
Trends in prevalence of anemia* among children aged <5 years, by ageTrends in prevalence of anemia* among children aged <5 years, by age
* Hb or Hct < 5th percentile, CDC MMWR vol. 47 (No. RR-3), 1998. 2008 ND PedNSS Table 21C
0
5
10
15
20
1999 2000 2001 2002 2003 2004 2005
Year
Per
cent
age
Aged 0.5-<1 Yr Aged 1-<1.5 Yrs Aged 1.5-<2 YrsAged 2-<3 Yrs Aged 3-<5 Yrs Total
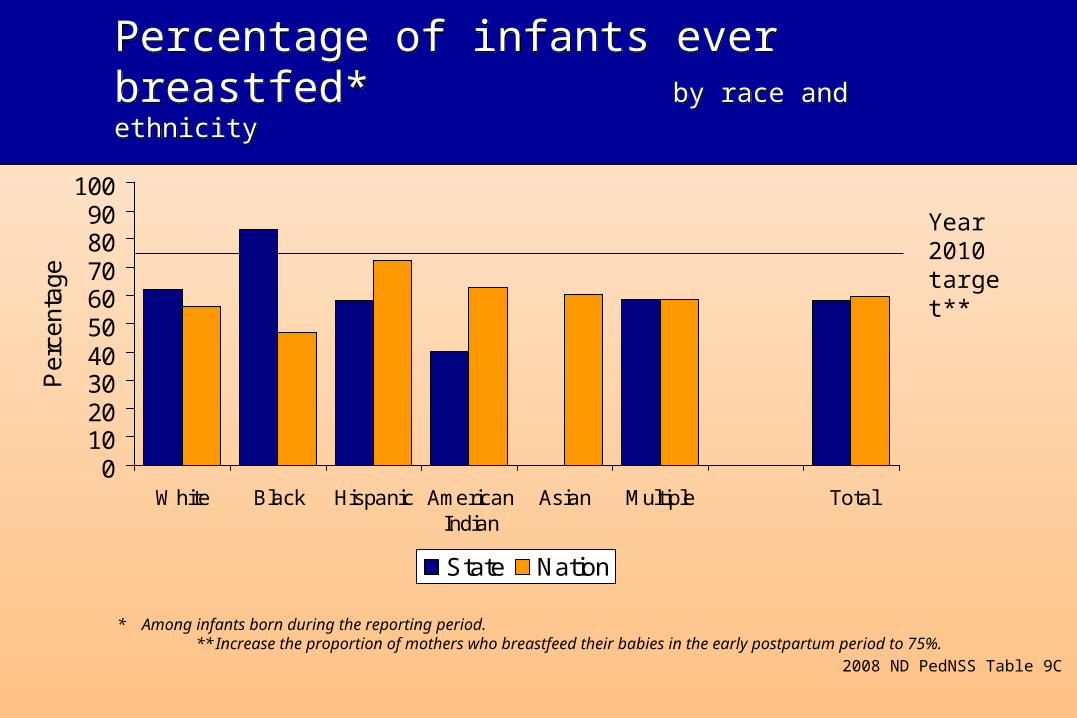
Percentage of infants ever breastfed* by race and ethnicityPercentage of infants ever breastfed* by race and ethnicity
0102030405060708090
100
White Black Hispanic AmericanIndian
Asian Multiple Total
Pe
rce
nta
ge
State Nation
Year 2010 target**
2008 ND PedNSS Table 9C
* Among infants born during the reporting period. ** Increase the proportion of mothers who breastfeed their babies in the early postpartum period to 75%.
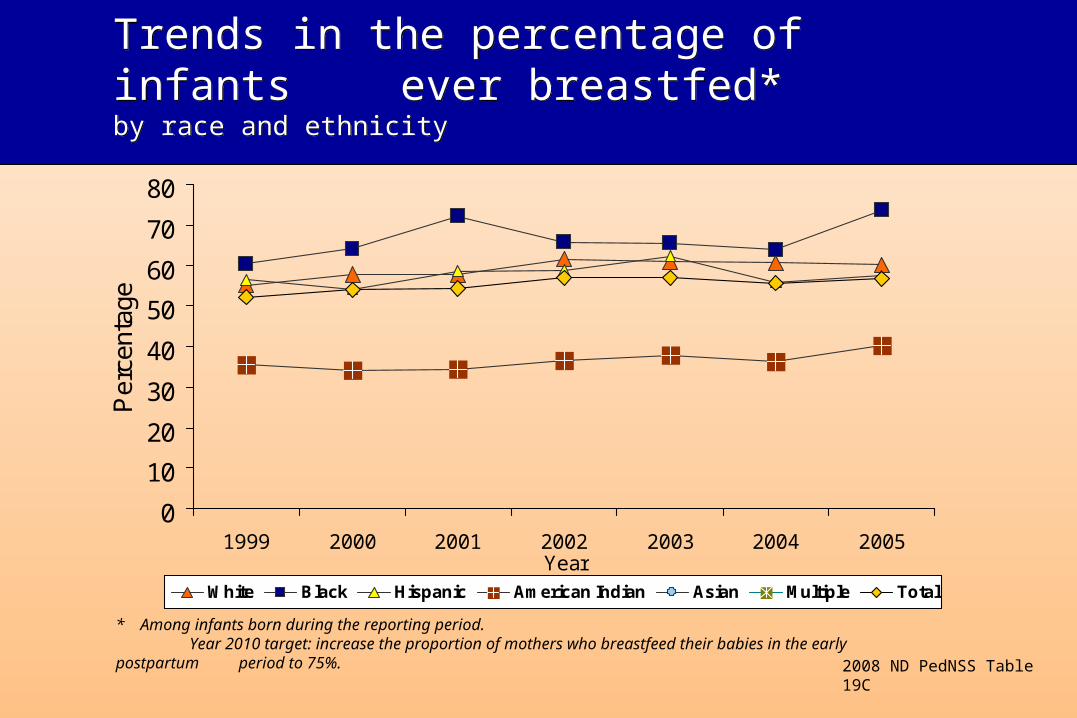
Trends in the percentage of infants ever breastfed*by race and ethnicity
Trends in the percentage of infants ever breastfed*by race and ethnicity
0
10
20
30
40
50
60
70
80
1999 2000 2001 2002 2003 2004 2005Year
Per
cent
age
White Black Hispanic American Indian Asian Multiple Total
2008 ND PedNSS Table 19C
* Among infants born during the reporting period. Year 2010 target: increase the proportion of mothers who breastfeed their babies in the early postpartum period to 75%.
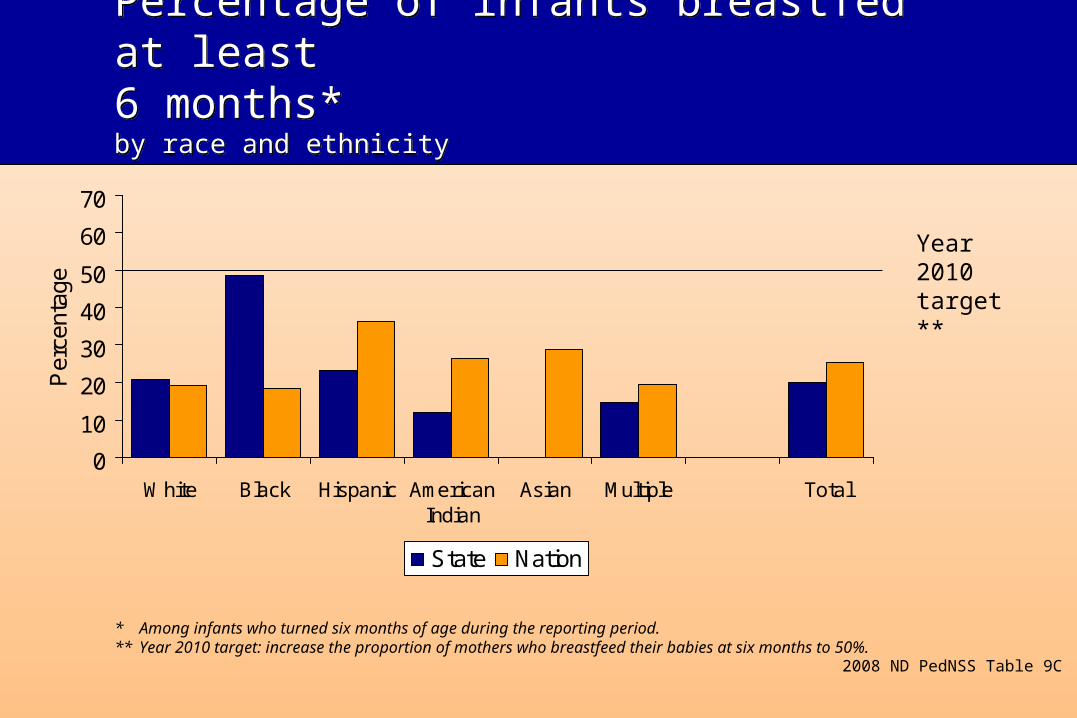
Percentage of infants breastfed at least 6 months*by race and ethnicity
Percentage of infants breastfed at least 6 months*by race and ethnicity
Year 2010 target**
2008 ND PedNSS Table 9C
* Among infants who turned six months of age during the reporting period. ** Year 2010 target: increase the proportion of mothers who breastfeed their babies at six months to 50%.
0
10
20
30
40
50
60
70
White Black Hispanic AmericanIndian
Asian Multiple Total
Per
cent
age
State Nation
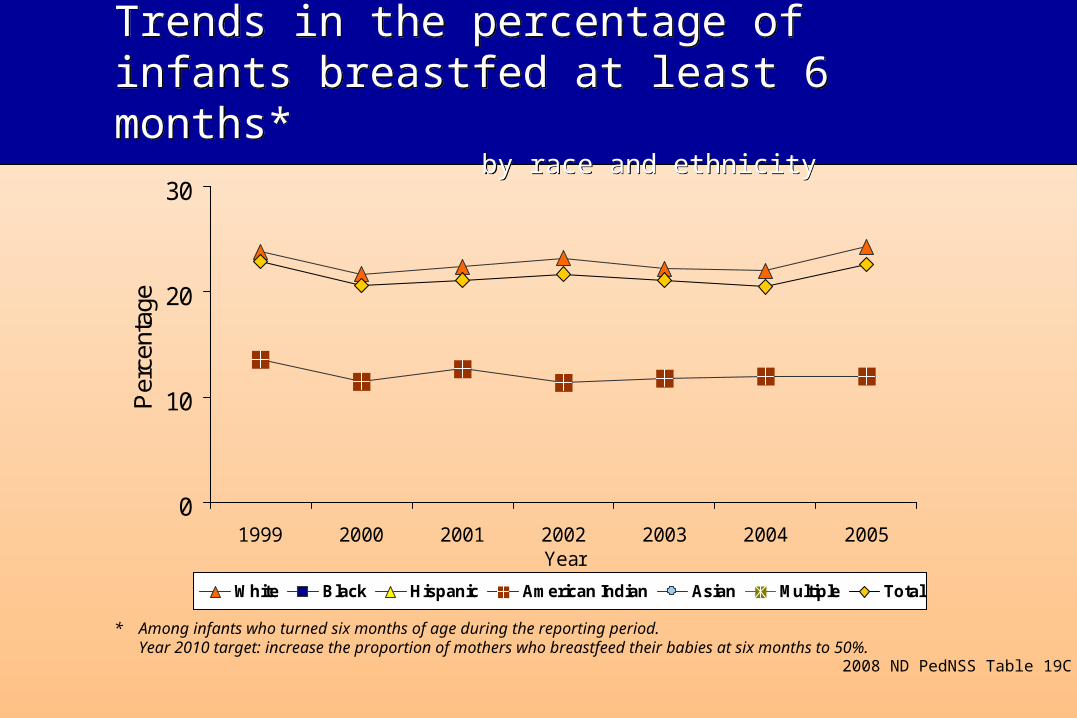
Trends in the percentage of infants breastfed at least 6 months* by race and ethnicity
Trends in the percentage of infants breastfed at least 6 months* by race and ethnicity
0
10
20
30
1999 2000 2001 2002 2003 2004 2005Year
Per
cent
age
White Black Hispanic American Indian Asian Multiple Total
2008 ND PedNSS Table 19C
* Among infants who turned six months of age during the reporting period. Year 2010 target: increase the proportion of mothers who breastfeed their babies at six months to 50%.
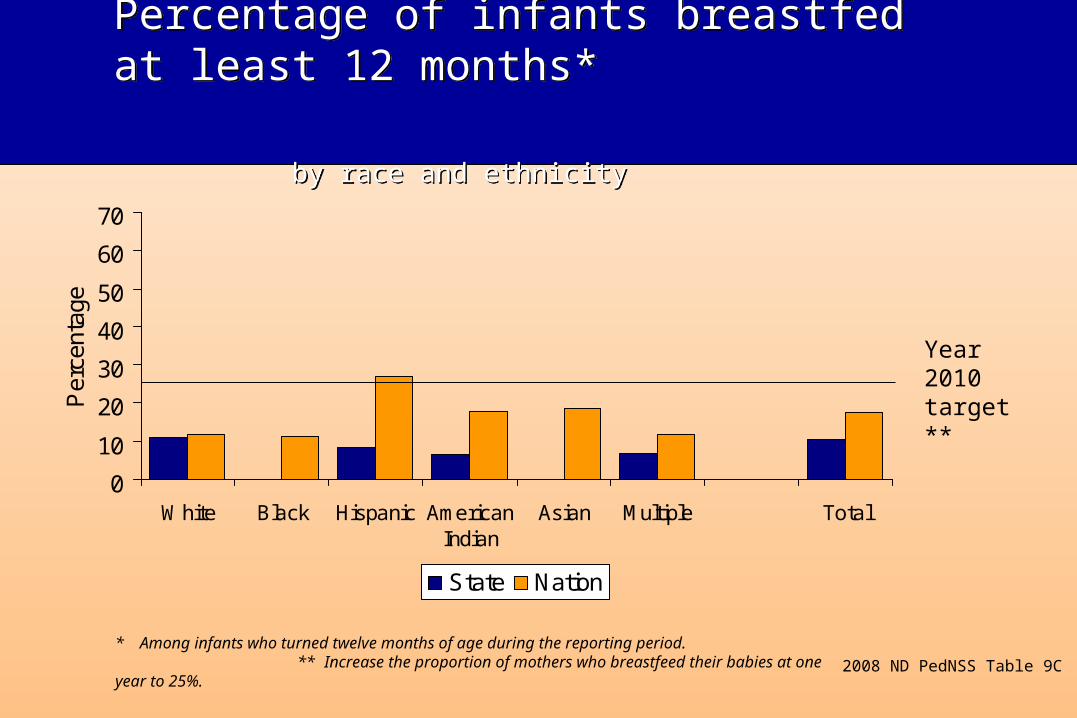
Percentage of infants breastfed at least 12 months* by race and ethnicity
Percentage of infants breastfed at least 12 months* by race and ethnicity
Year 2010 target**
2008 ND PedNSS Table 9C
* Among infants who turned twelve months of age during the reporting period. ** Increase the proportion of mothers who breastfeed their babies at one year to 25%.
0
10
20
30
40
50
60
70
White Black Hispanic AmericanIndian
Asian Multiple Total
Per
cent
age
State Nation
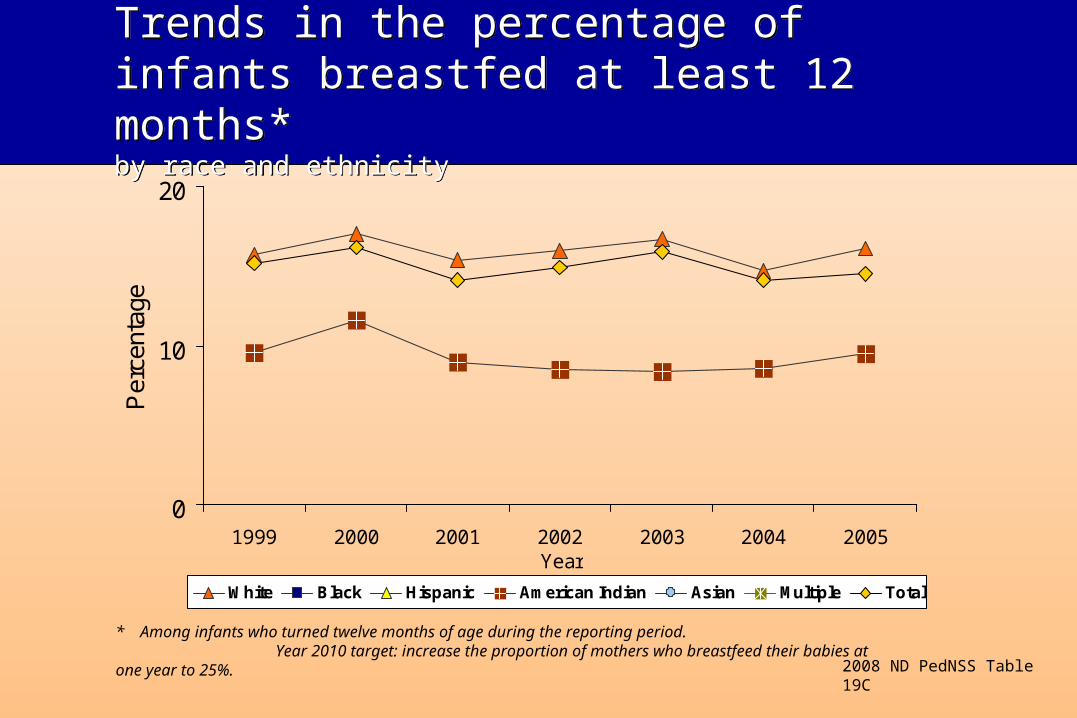
Trends in the percentage of infants breastfed at least 12 months*by race and ethnicity
Trends in the percentage of infants breastfed at least 12 months*by race and ethnicity
0
10
20
1999 2000 2001 2002 2003 2004 2005Year
Per
cent
age
White Black Hispanic American Indian Asian Multiple Total
2008 ND PedNSS Table 19C
* Among infants who turned twelve months of age during the reporting period. Year 2010 target: increase the proportion of mothers who breastfeed their babies at one year to 25%.
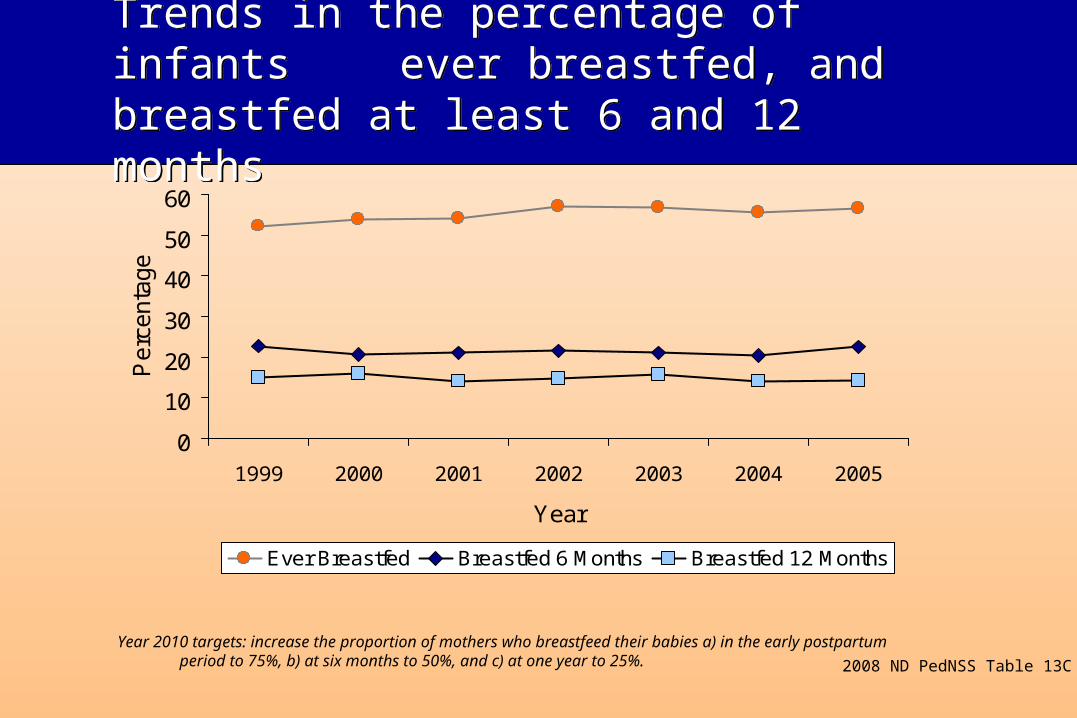
Trends in the percentage of infants ever breastfed, and breastfed at least 6 and 12 months
Trends in the percentage of infants ever breastfed, and breastfed at least 6 and 12 months
0
10
20
30
40
50
60
1999 2000 2001 2002 2003 2004 2005
Year
Perc
enta
ge
Ever Breastfed Breastfed 6 Months Breastfed 12 Months
Year 2010 targets: increase the proportion of mothers who breastfeed their babies a) in the early postpartum period to 75%, b) at six months to 50%, and c) at one year to 25%. 2008 ND PedNSS Table 13C
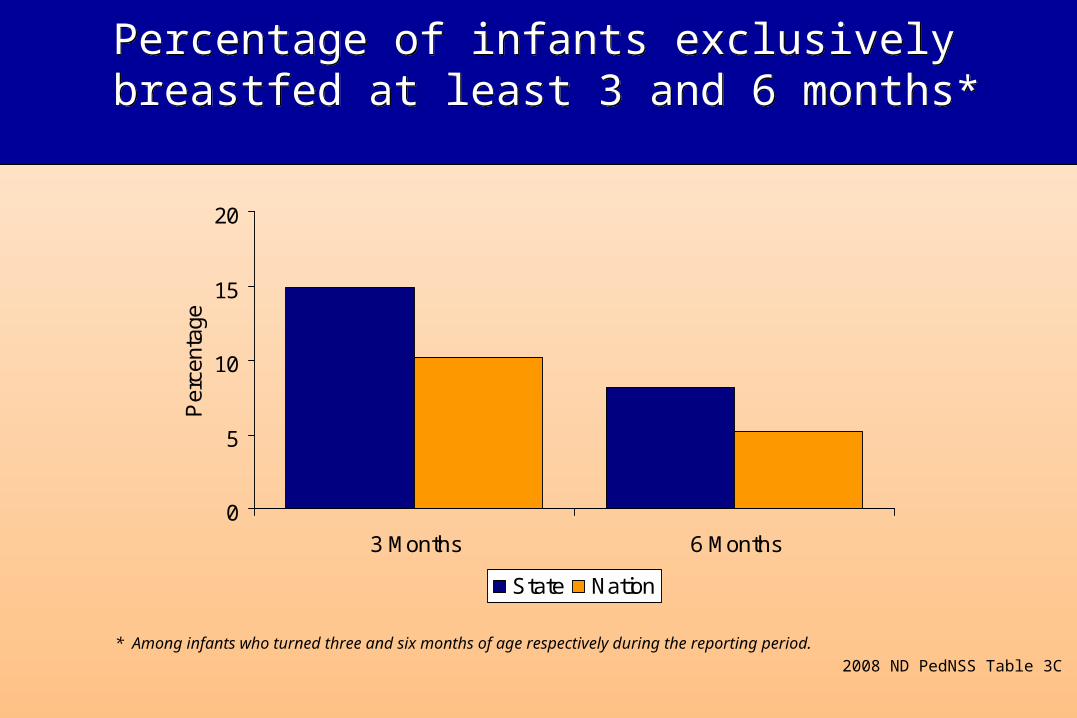
Percentage of infants exclusively breastfed at least 3 and 6 months*Percentage of infants exclusively breastfed at least 3 and 6 months*
2008 ND PedNSS Table 3C
* Among infants who turned three and six months of age respectively during the reporting period.
0
5
10
15
20
3 Months 6 Months
Per
cent
age
State Nation
* Increase the proportion of children and adolescents who view TV two or fewer hours per day to 75%.
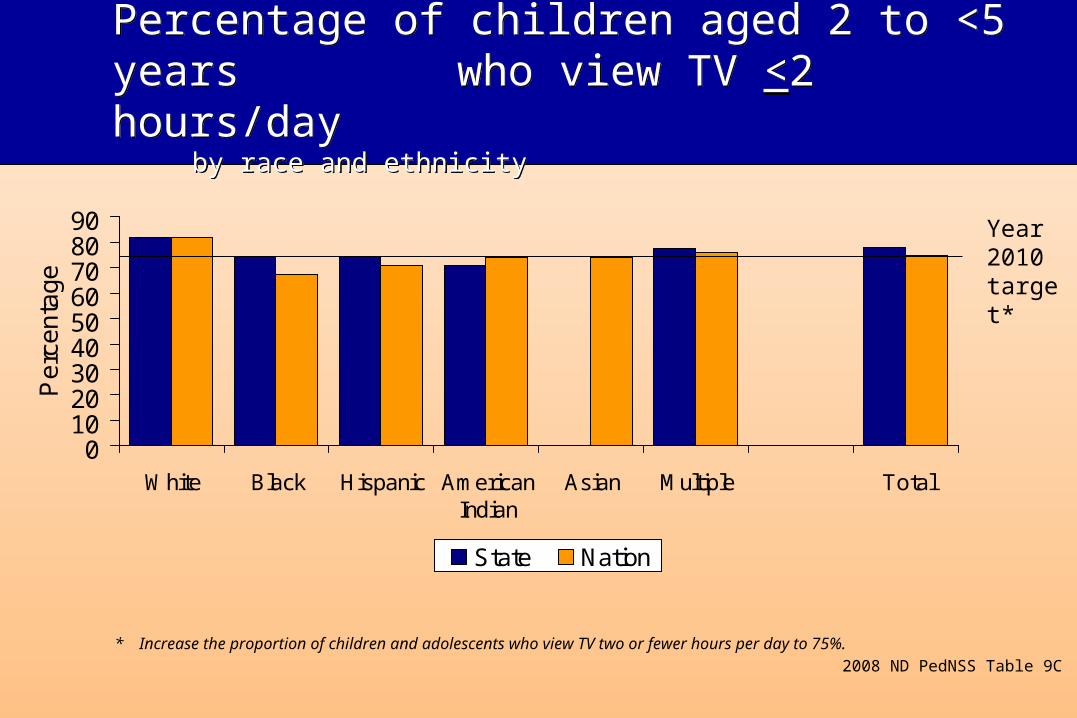
Percentage of children aged 2 to <5 years who view TV <2 hours/day by race and ethnicity
Percentage of children aged 2 to <5 years who view TV <2 hours/day by race and ethnicity
2008 ND PedNSS Table 9C
0102030405060708090
White Black Hispanic AmericanIndian
Asian Multiple Total
Pe
rce
nta
ge
State Nation
Year 2010 target*
* Increase the proportion of children and adolescents who view TV two or fewer hours per day to 75%.
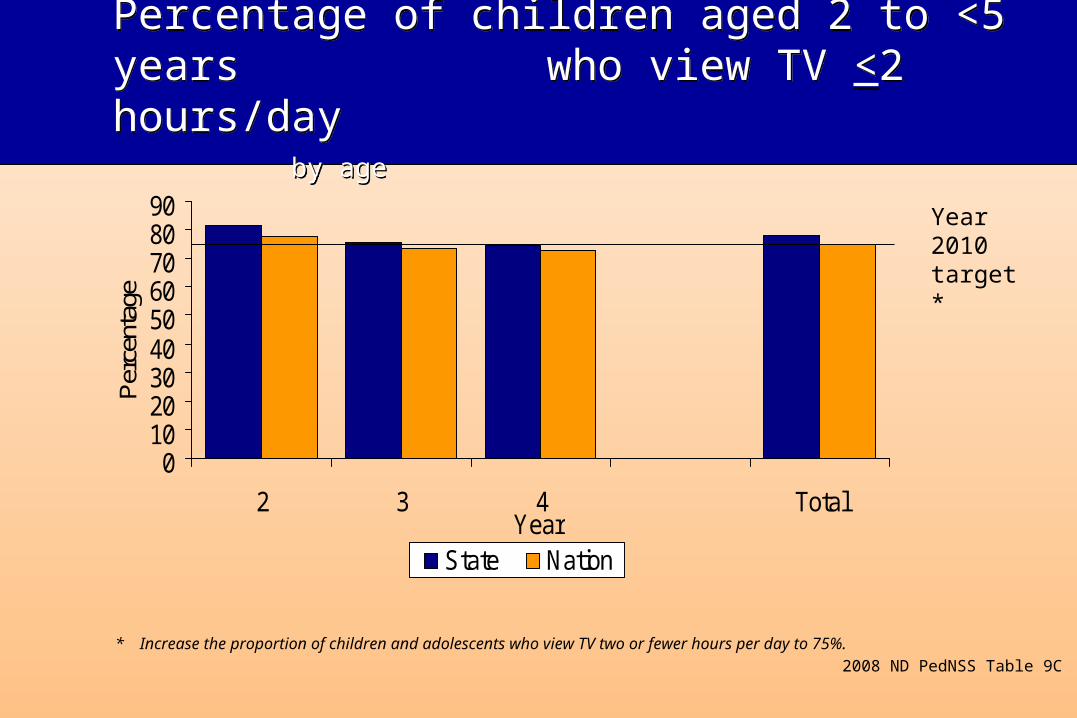
Percentage of children aged 2 to <5 years who view TV <2 hours/day by age
Percentage of children aged 2 to <5 years who view TV <2 hours/day by age
2008 ND PedNSS Table 9C
Year 2010 target*
0102030405060708090
2 3 4 TotalYear
Per
cent
age
State Nation
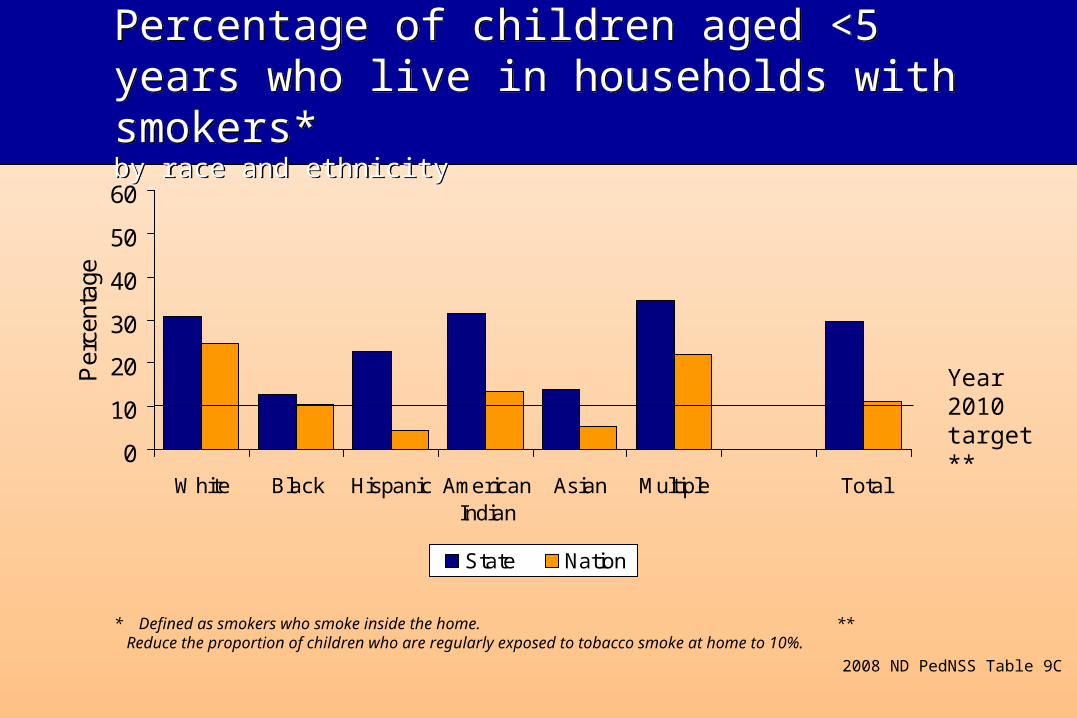
Percentage of children aged <5 years who live in households with smokers*by race and ethnicity
Percentage of children aged <5 years who live in households with smokers*by race and ethnicity
2008 ND PedNSS Table 9C
Year 2010 target**
* Defined as smokers who smoke inside the home. ** Reduce the proportion of children who are regularly exposed to tobacco smoke at home to 10%.
0
10
20
30
40
50
60
White Black Hispanic AmericanIndian
Asian Multiple Total
Per
cent
age
State Nation
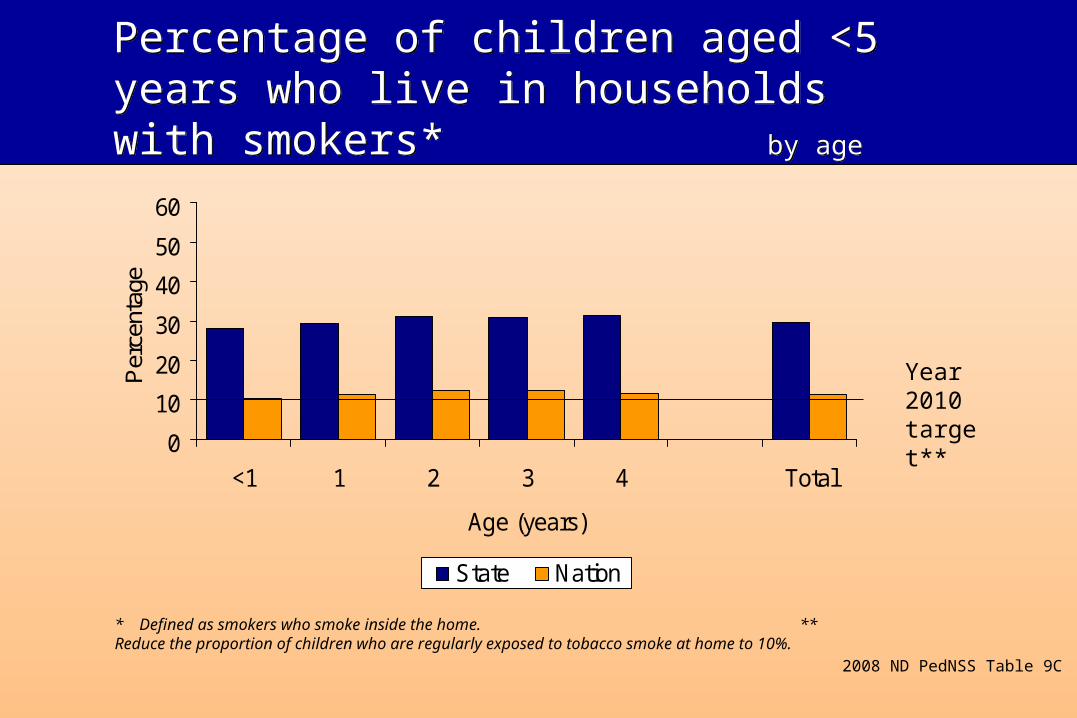
Percentage of children aged <5 years who live in households with smokers* by age
Percentage of children aged <5 years who live in households with smokers* by age
2008 ND PedNSS Table 9C
Year 2010 target**
* Defined as smokers who smoke inside the home. ** Reduce the proportion of children who are regularly exposed to tobacco smoke at home to 10%.
0
10
20
30
40
50
60
<1 1 2 3 4 Total
Age (years)
Per
cent
age
State Nation

GraphicsGraphics
Comparing Contributor and Local DataComparing Contributor and Local Data
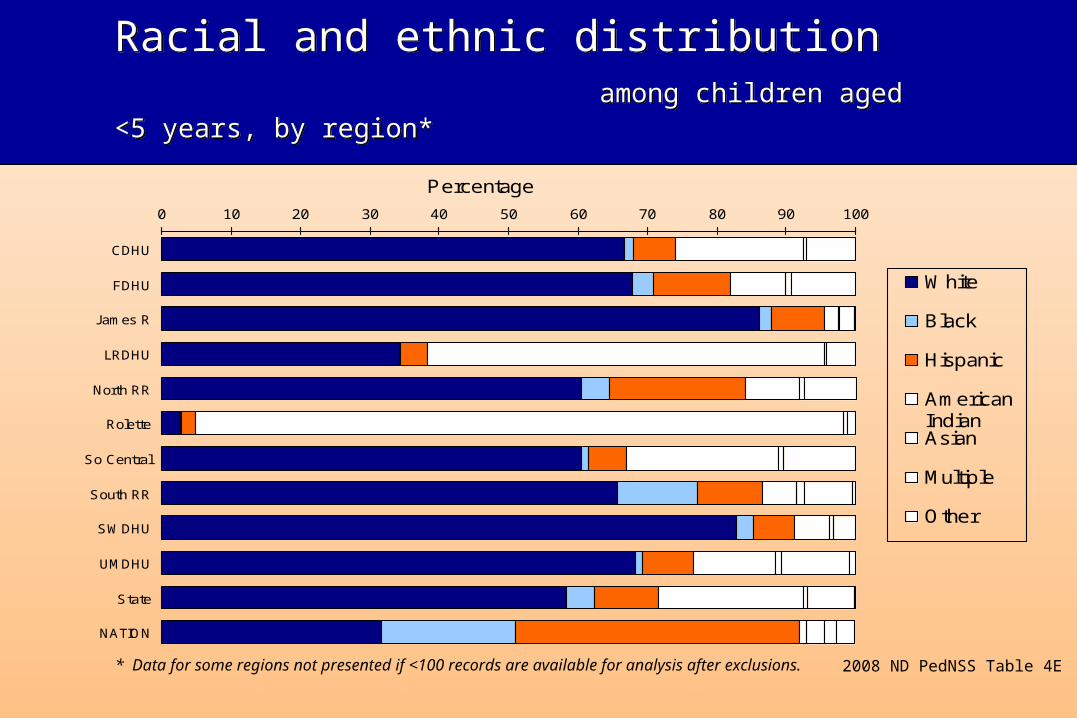
Racial and ethnic distribution among children aged <5 years, by region* Racial and ethnic distribution among children aged <5 years, by region*
2008 ND PedNSS Table 4E
0 10 20 30 40 50 60 70 80 90 100
CDHU
FDHU
James R
LRDHU
North RR
Rolette
So Central
South RR
SWDHU
UMDHU
State
NATION
Percentage
White
Black
Hispanic
AmericanIndianAsian
Multiple
Other
* Data for some regions not presented if <100 records are available for analysis after exclusions.
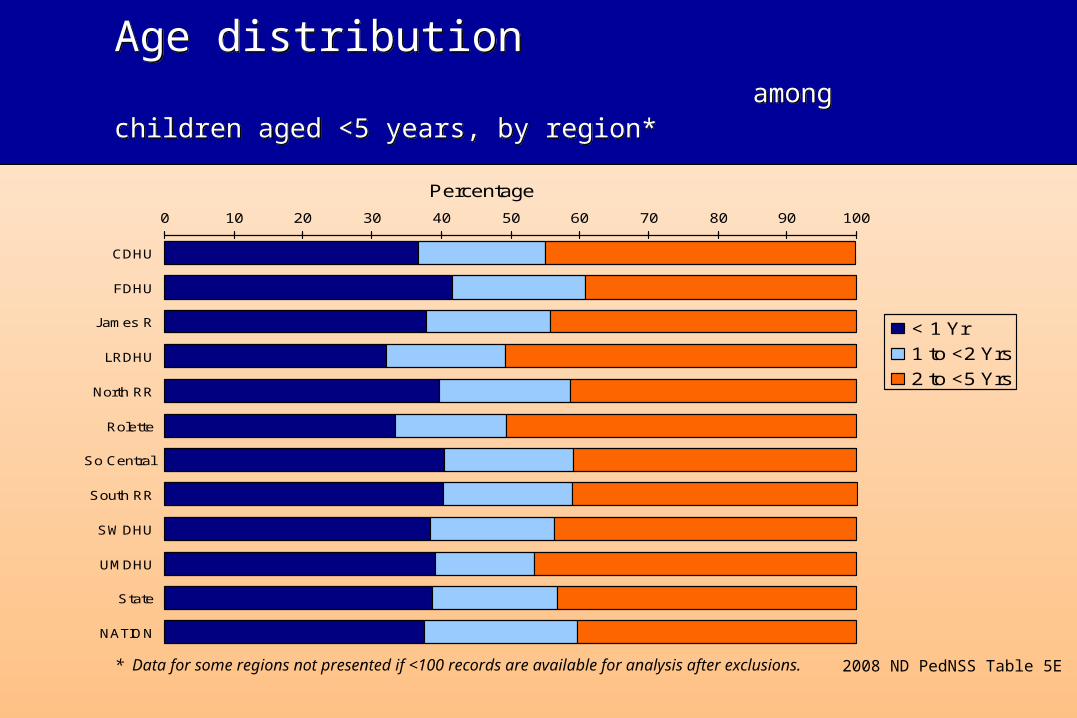
Age distribution among children aged <5 years, by region* Age distribution among children aged <5 years, by region*
2008 ND PedNSS Table 5E
0 10 20 30 40 50 60 70 80 90 100
CDHU
FDHU
James R
LRDHU
North RR
Rolette
So Central
South RR
SWDHU
UMDHU
State
NATION
Percentage
< 1 Yr
1 to <2 Yrs
2 to <5 Yrs
* Data for some regions not presented if <100 records are available for analysis after exclusions.
0
5
10
15C
DH
U
FD
HU
Jam
es R
LRD
HU
Nor
th R
R
Rol
ette
So
Cen
tral
Sou
th R
R
SW
DH
U
Sta
te
N
AT
ION
Per
cent
age
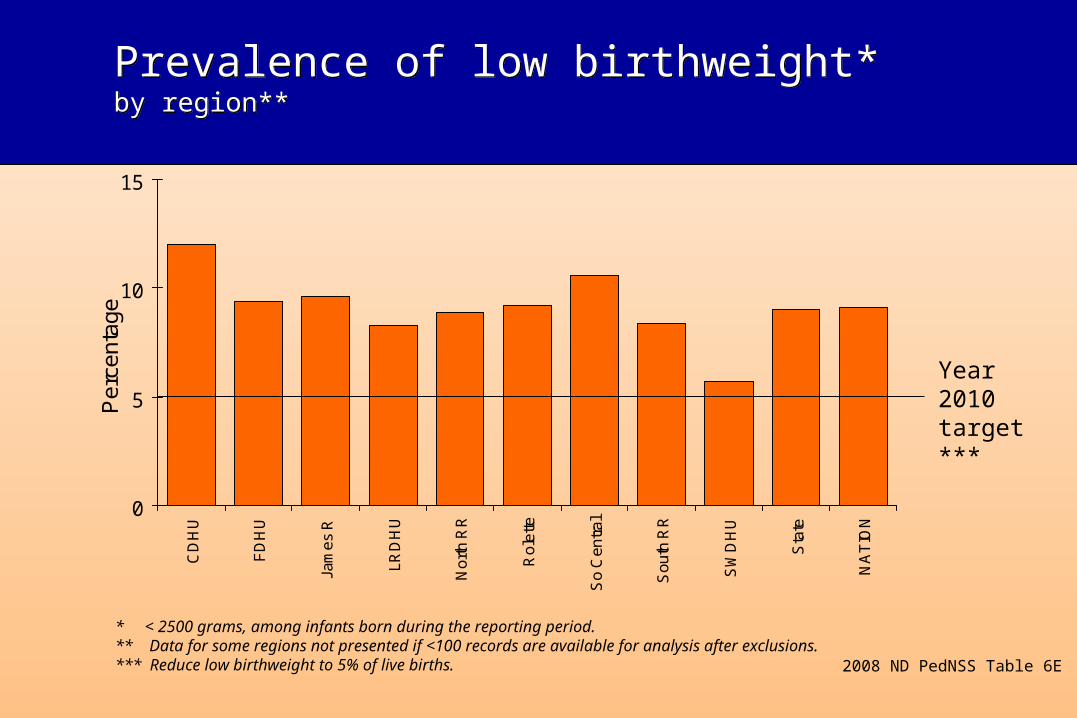
Prevalence of low birthweight*by region**Prevalence of low birthweight*by region**
2008 ND PedNSS Table 6E
Year 2010 target***
* < 2500 grams, among infants born during the reporting period. ** Data for some regions not presented if <100 records are available for analysis after exclusions. *** Reduce low birthweight to 5% of live births.
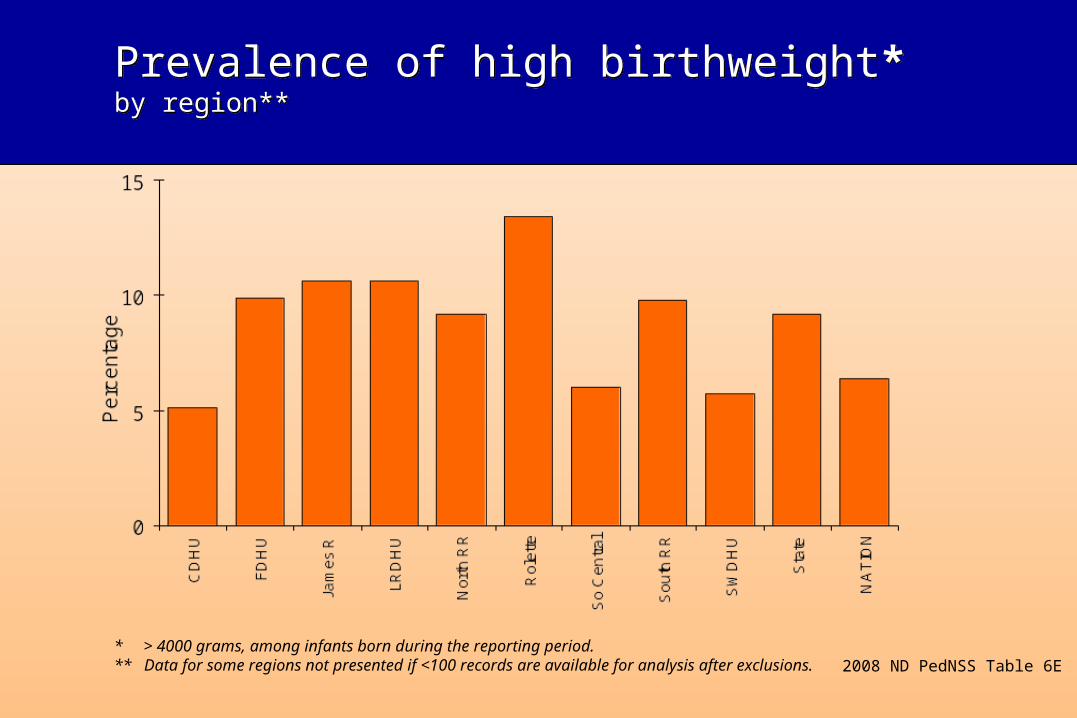
Prevalence of high birthweight*by region** Prevalence of high birthweight*by region**
* > 4000 grams, among infants born during the reporting period. ** Data for some regions not presented if <100 records are available for analysis after exclusions. 2008 ND PedNSS Table 6E
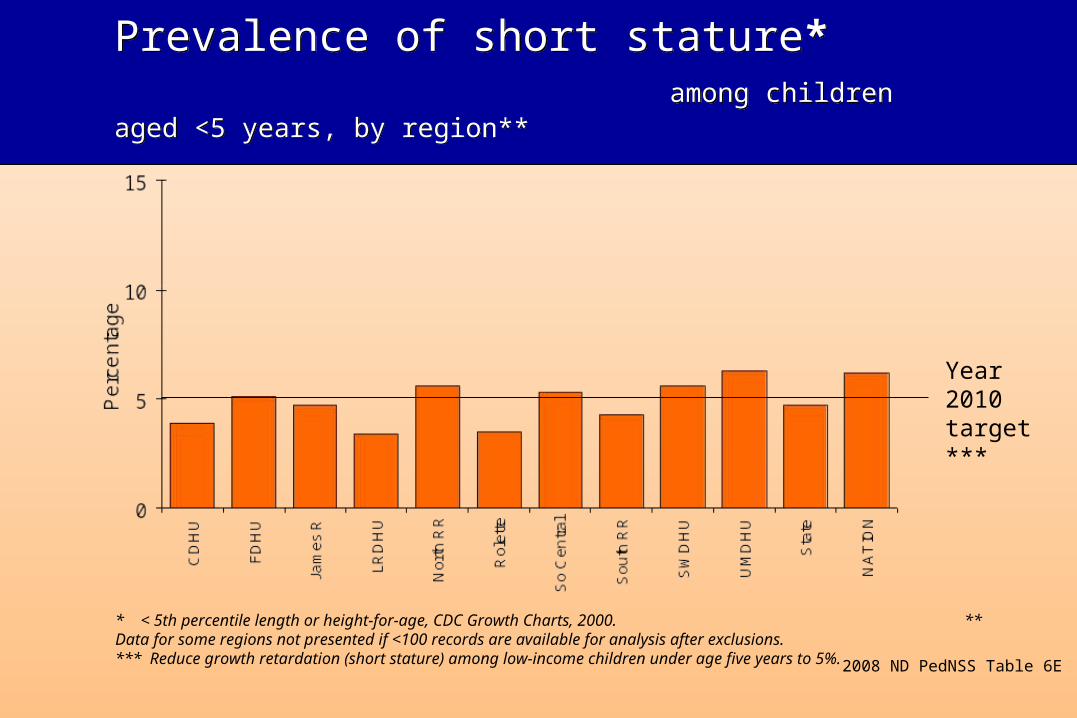
Prevalence of short stature* among children aged <5 years, by region**Prevalence of short stature* among children aged <5 years, by region**
2008 ND PedNSS Table 6E
* < 5th percentile length or height-for-age, CDC Growth Charts, 2000. ** Data for some regions not presented if <100 records are available for analysis after exclusions.*** Reduce growth retardation (short stature) among low-income children under age five years to 5%.
Year 2010 target***
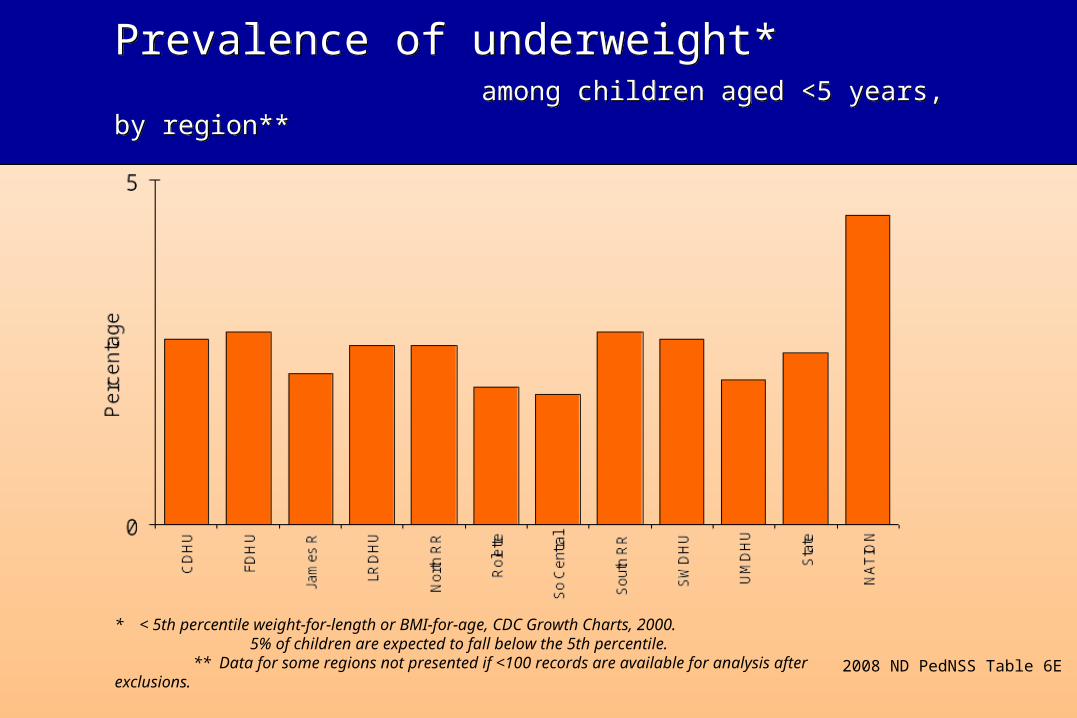
Prevalence of underweight* among children aged <5 years, by region** Prevalence of underweight* among children aged <5 years, by region**
2008 ND PedNSS Table 6E
* < 5th percentile weight-for-length or BMI-for-age, CDC Growth Charts, 2000. 5% of children are expected to fall below the 5th percentile. ** Data for some regions not presented if <100 records are available for analysis after exclusions.
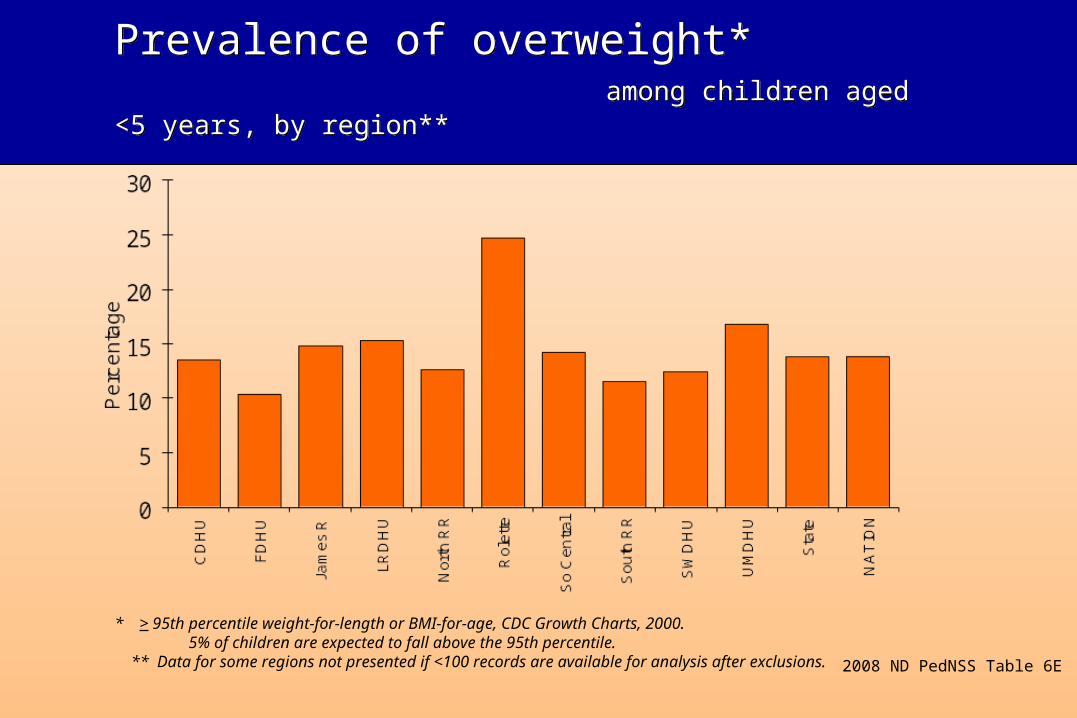
Prevalence of overweight* among children aged <5 years, by region** Prevalence of overweight* among children aged <5 years, by region**
2008 ND PedNSS Table 6E
* > 95th percentile weight-for-length or BMI-for-age, CDC Growth Charts, 2000. 5% of children are expected to fall above the 95th percentile. ** Data for some regions not presented if <100 records are available for analysis after exclusions.
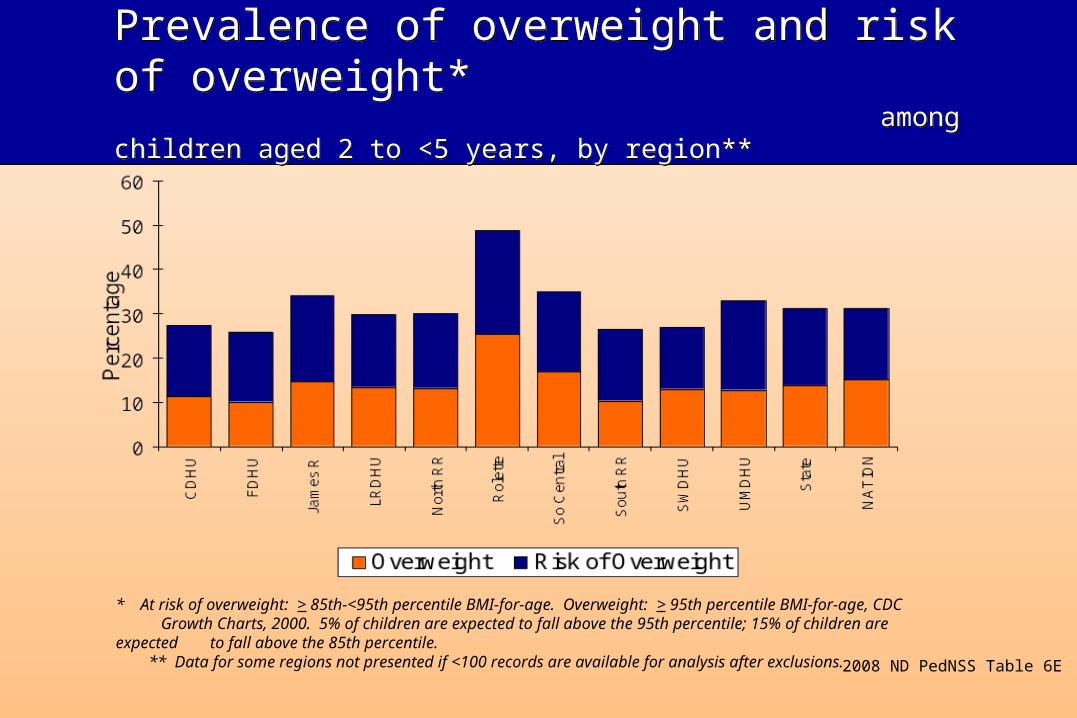
Prevalence of overweight and risk of overweight* among children aged 2 to <5 years, by region**
Prevalence of overweight and risk of overweight* among children aged 2 to <5 years, by region**
2008 ND PedNSS Table 6E
* At risk of overweight: > 85th-<95th percentile BMI-for-age. Overweight: > 95th percentile BMI-for-age, CDC Growth Charts, 2000. 5% of children are expected to fall above the 95th percentile; 15% of children are
expected to fall above the 85th percentile. ** Data for some regions not presented if <100 records are available for analysis after exclusions.
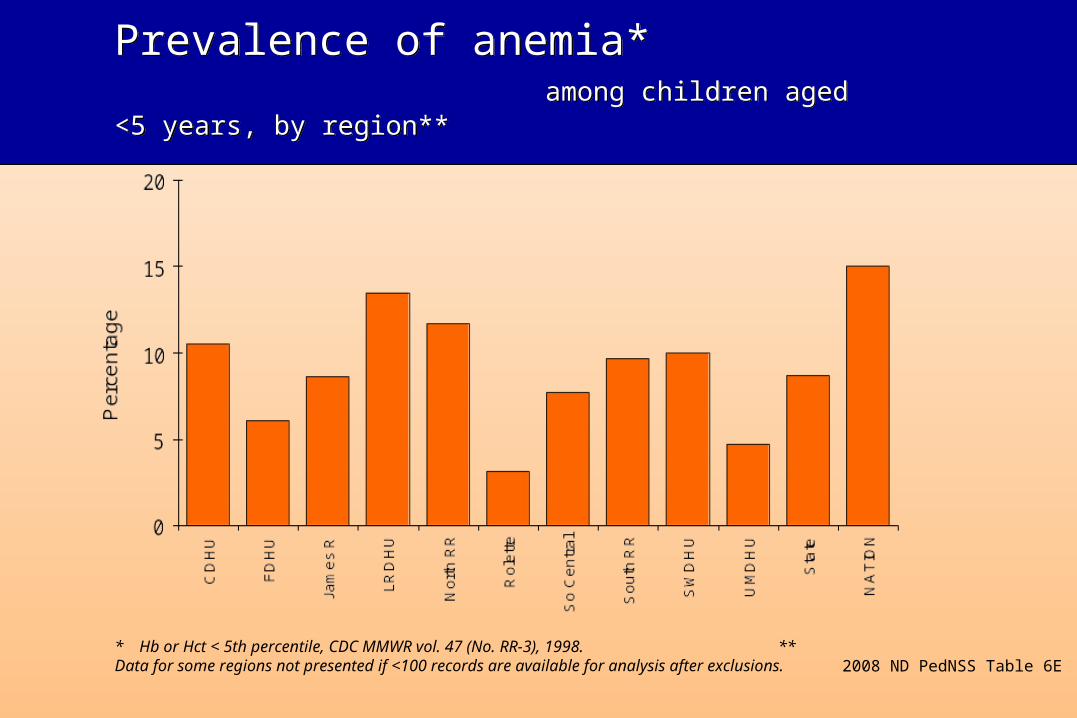
Prevalence of anemia* among children aged <5 years, by region** Prevalence of anemia* among children aged <5 years, by region**
* Hb or Hct < 5th percentile, CDC MMWR vol. 47 (No. RR-3), 1998. ** Data for some regions not presented if <100 records are available for analysis after exclusions. 2008 ND PedNSS Table 6E
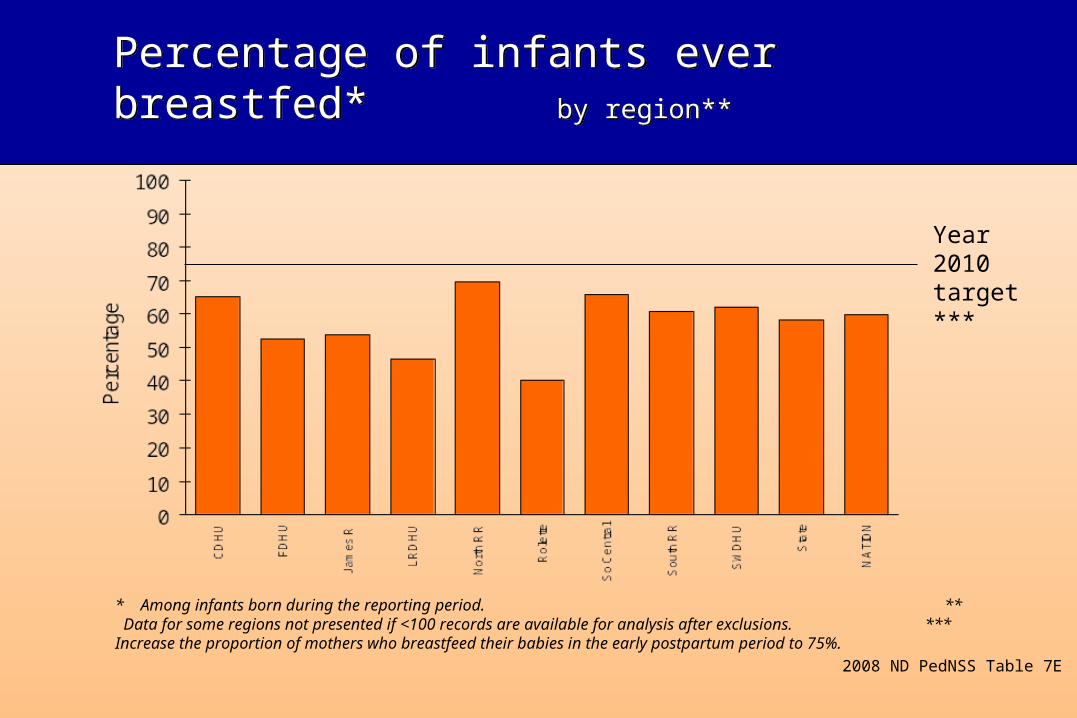
Percentage of infants ever breastfed* by region**Percentage of infants ever breastfed* by region**
* Among infants born during the reporting period. ** Data for some regions not presented if <100 records are available for analysis after exclusions. *** Increase the proportion of mothers who breastfeed their babies in the early postpartum period to 75%.
2008 ND PedNSS Table 7E
Year 2010 target***
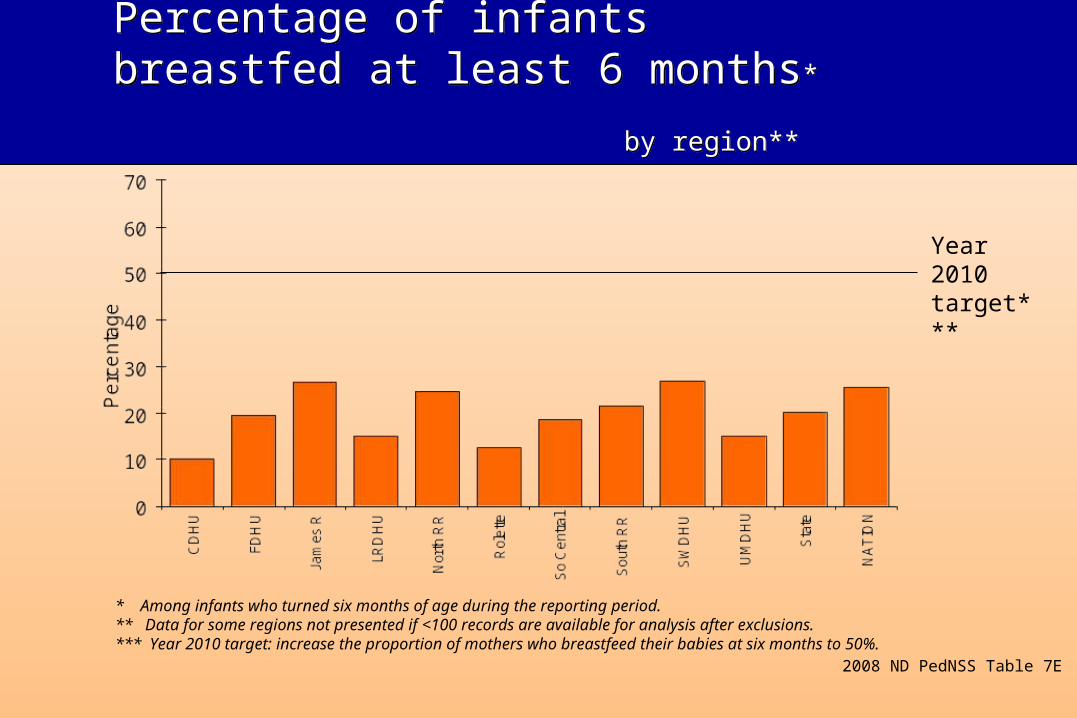
Percentage of infants breastfed at least 6 months* by region**
Percentage of infants breastfed at least 6 months* by region**
* Among infants who turned six months of age during the reporting period. ** Data for some regions not presented if <100 records are available for analysis after exclusions. *** Year 2010 target: increase the proportion of mothers who breastfeed their babies at six months to 50%.
Year 2010 target***
2008 ND PedNSS Table 7E
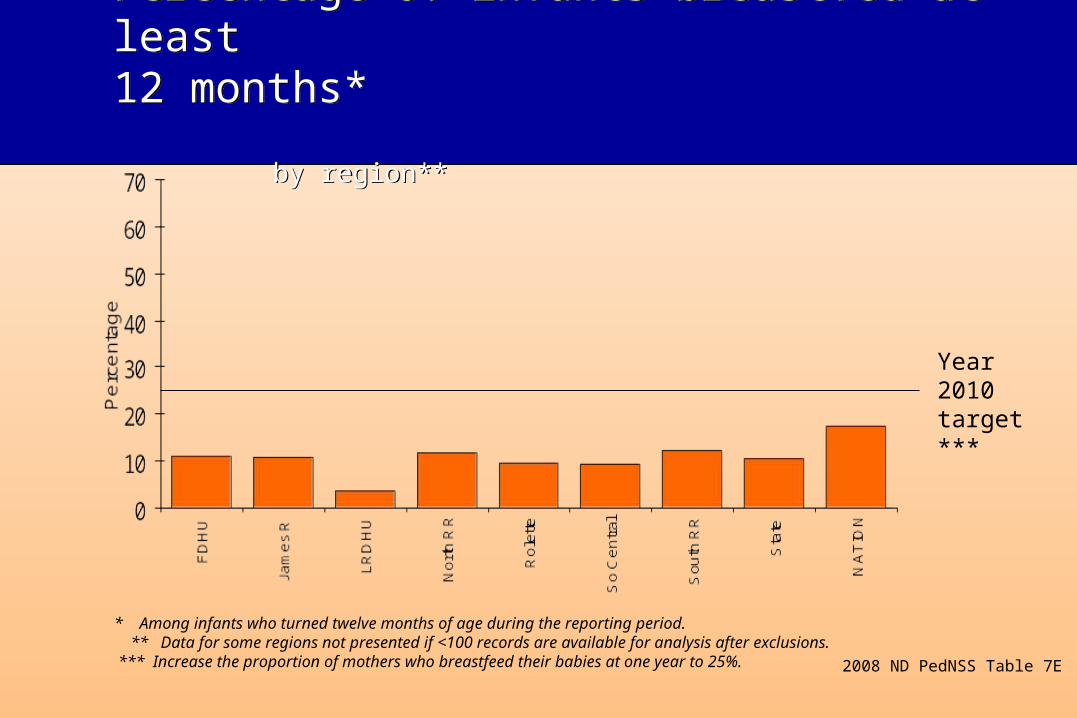
Percentage of infants breastfed at least 12 months* by region**
Percentage of infants breastfed at least 12 months* by region**
2008 ND PedNSS Table 7E
Year 2010 target***
* Among infants who turned twelve months of age during the reporting period. ** Data for some regions not presented if <100 records are available for analysis after exclusions. *** Increase the proportion of mothers who breastfeed their babies at one year to 25%.
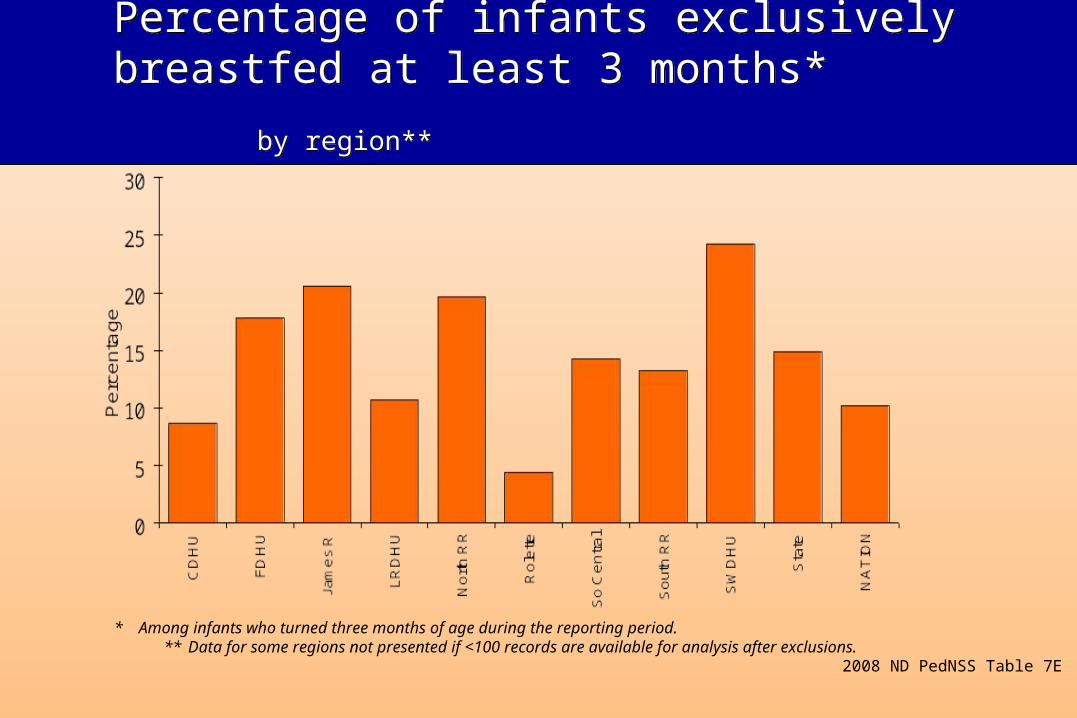
Percentage of infants exclusively breastfed at least 3 months* by region**
Percentage of infants exclusively breastfed at least 3 months* by region**
2008 ND PedNSS Table 7E
* Among infants who turned three months of age during the reporting period. ** Data for some regions not presented if <100 records are available for analysis after exclusions.
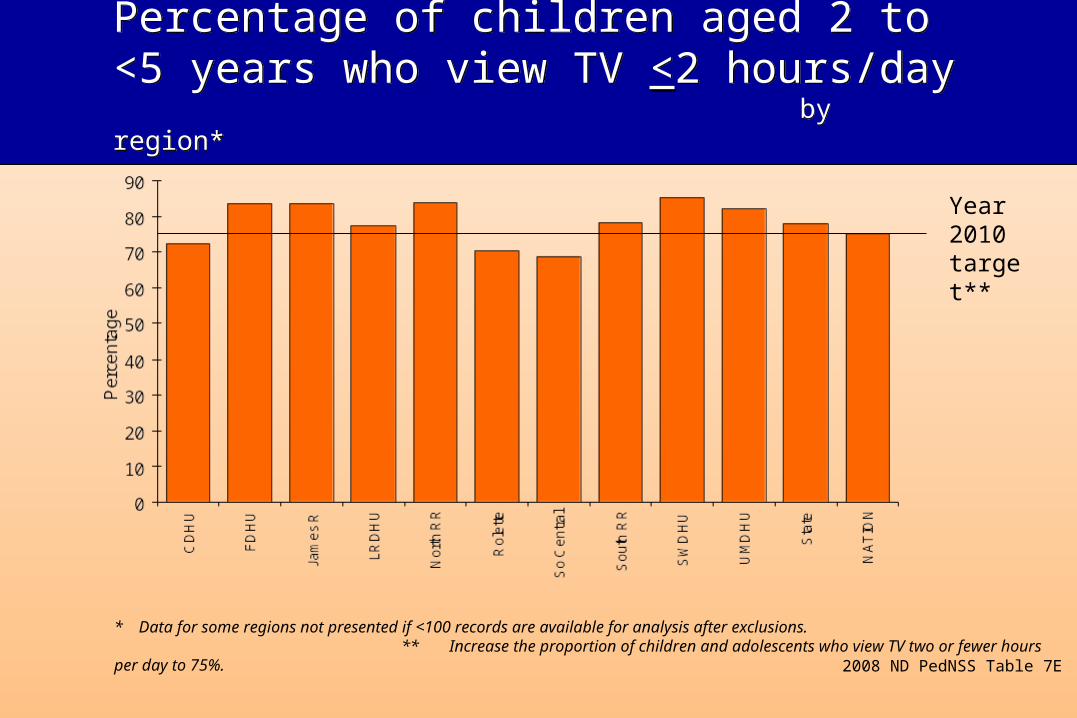
* Data for some regions not presented if <100 records are available for analysis after exclusions. ** Increase the proportion of children and adolescents who view TV two or fewer hours per day to 75%.
Percentage of children aged 2 to <5 years who view TV <2 hours/day by region*
Percentage of children aged 2 to <5 years who view TV <2 hours/day by region*
2008 ND PedNSS Table 7E
Year 2010 target**
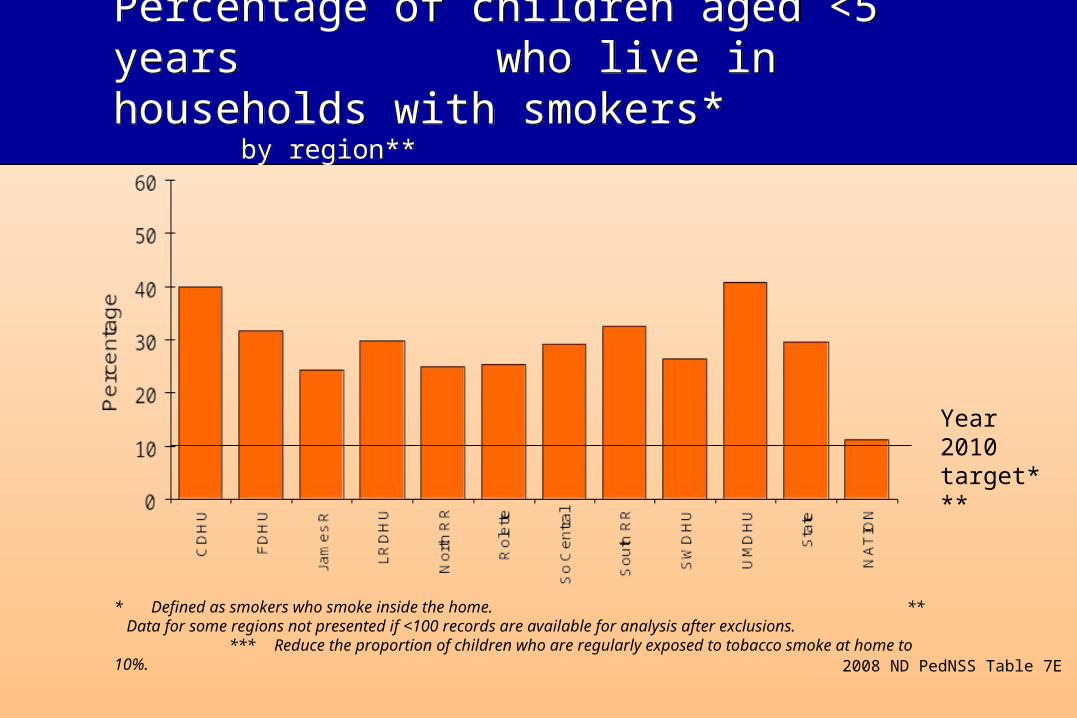
Percentage of children aged <5 years who live in households with smokers* by region**
Percentage of children aged <5 years who live in households with smokers* by region**
2008 ND PedNSS Table 7E
* Defined as smokers who smoke inside the home. ** Data for some regions not presented if <100 records are available for analysis after exclusions. *** Reduce the proportion of children who are regularly exposed to tobacco smoke at home to 10%.
Year 2010 target***
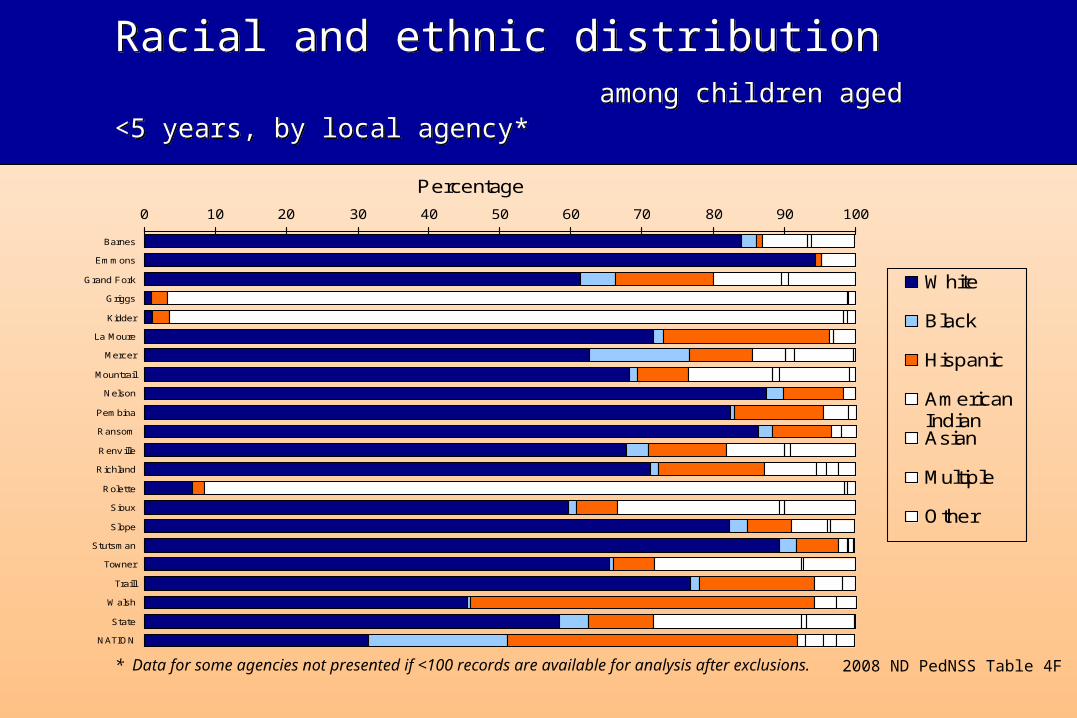
Racial and ethnic distribution among children aged <5 years, by local agency* Racial and ethnic distribution among children aged <5 years, by local agency*
2008 ND PedNSS Table 4F
0 10 20 30 40 50 60 70 80 90 100
Barnes
Emmons
Grand Fork
Griggs
Kidder
La Moure
Mercer
Mountrail
Nelson
Pembina
Ransom
Renv ille
Richland
Rolette
Sioux
Slope
Stutsman
Towner
Traill
Walsh
State
NATION
Percentage
White
Black
Hispanic
AmericanIndianAsian
Multiple
Other
* Data for some agencies not presented if <100 records are available for analysis after exclusions.
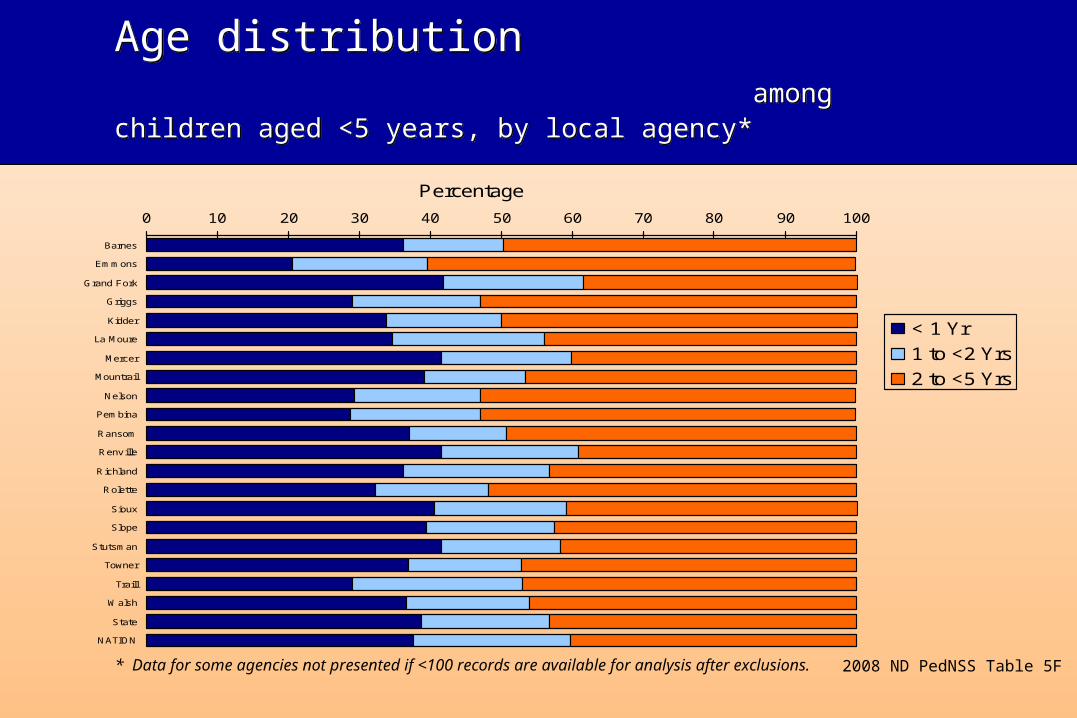
Age distribution among children aged <5 years, by local agency* Age distribution among children aged <5 years, by local agency*
2008 ND PedNSS Table 5F
0 10 20 30 40 50 60 70 80 90 100
Barnes
Emmons
Grand Fork
Griggs
Kidder
La Moure
Mercer
Mountrail
Nelson
Pembina
Ransom
Renv ille
Richland
Rolette
Sioux
Slope
Stutsman
Towner
Traill
Walsh
State
NATION
Percentage
< 1 Yr
1 to <2 Yrs
2 to <5 Yrs
* Data for some agencies not presented if <100 records are available for analysis after exclusions.
0
5
10
15G
rand
For
k
Grig
gs
Kid
der
Mer
cer
Ren
ville
Sio
ux
Slo
pe
Stu
tsm
an
Tow
ner
Sta
te
N
AT
ION
Per
cent
age
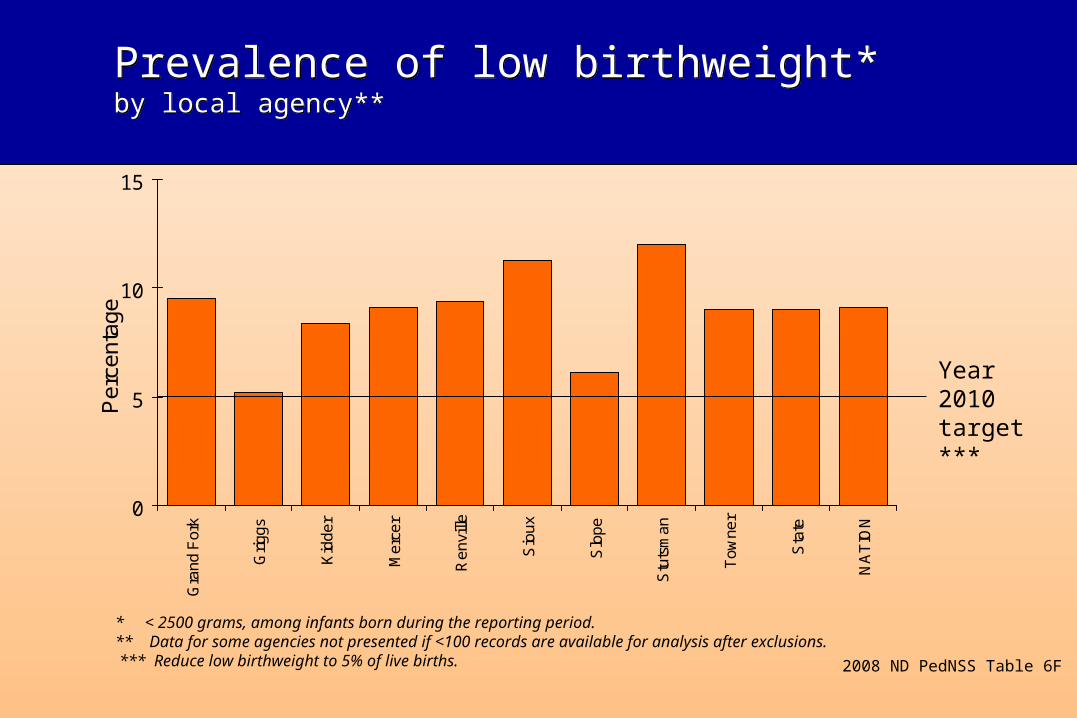
Prevalence of low birthweight*by local agency**Prevalence of low birthweight*by local agency**
2008 ND PedNSS Table 6F
Year 2010 target***
* < 2500 grams, among infants born during the reporting period. ** Data for some agencies not presented if <100 records are available for analysis after exclusions. *** Reduce low birthweight to 5% of live births.
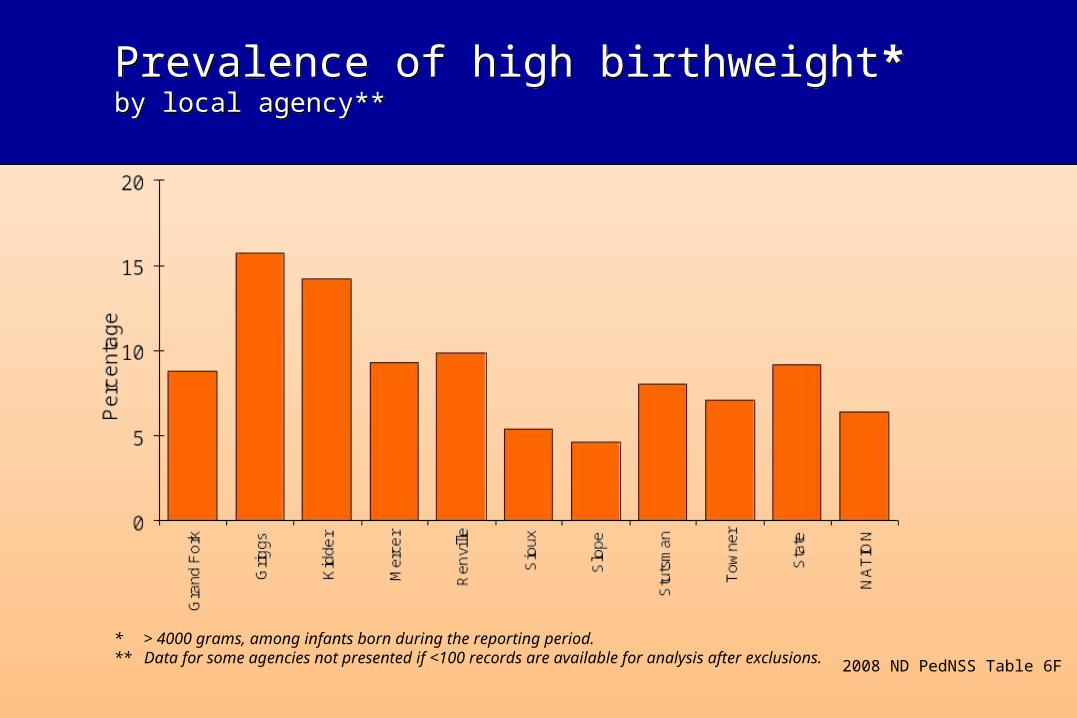
Prevalence of high birthweight*by local agency** Prevalence of high birthweight*by local agency**
* > 4000 grams, among infants born during the reporting period. ** Data for some agencies not presented if <100 records are available for analysis after exclusions. 2008 ND PedNSS Table 6F
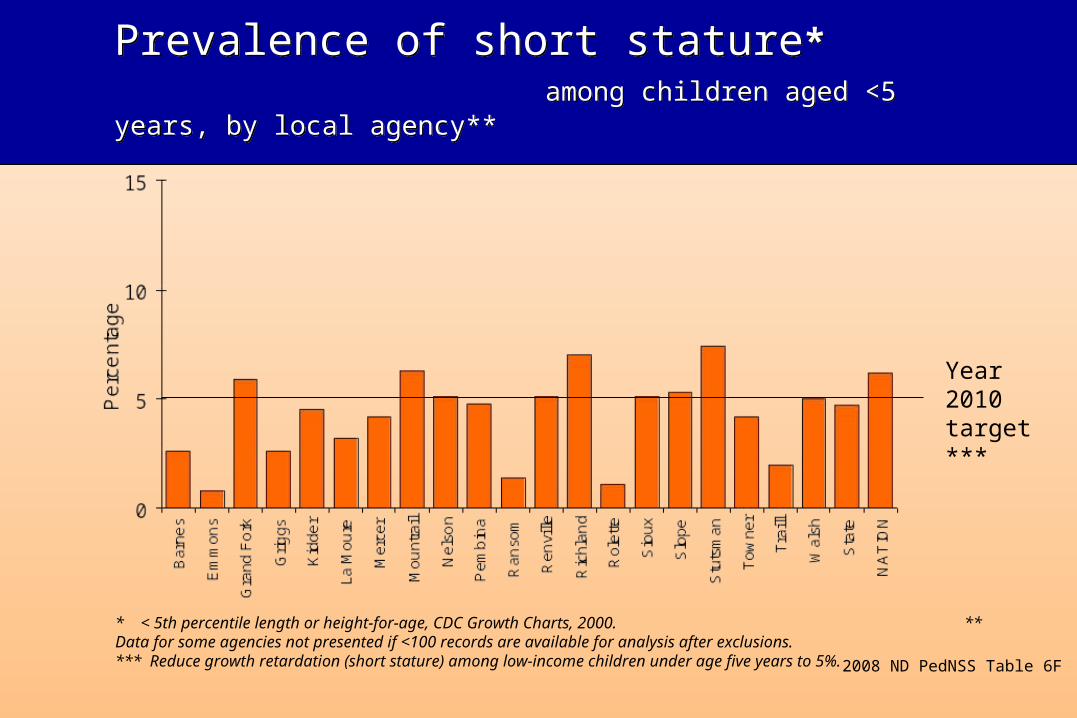
Prevalence of short stature* among children aged <5 years, by local agency**Prevalence of short stature* among children aged <5 years, by local agency**
2008 ND PedNSS Table 6F
* < 5th percentile length or height-for-age, CDC Growth Charts, 2000. ** Data for some agencies not presented if <100 records are available for analysis after exclusions.*** Reduce growth retardation (short stature) among low-income children under age five years to 5%.
Year 2010 target***
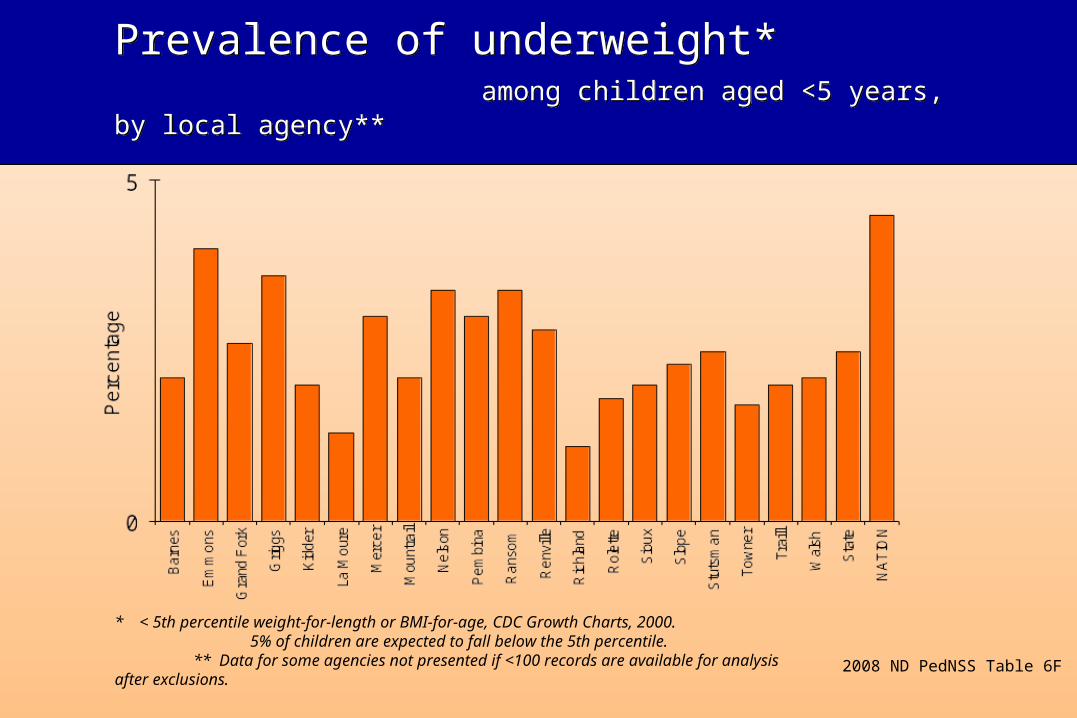
Prevalence of underweight* among children aged <5 years, by local agency** Prevalence of underweight* among children aged <5 years, by local agency**
2008 ND PedNSS Table 6F
* < 5th percentile weight-for-length or BMI-for-age, CDC Growth Charts, 2000. 5% of children are expected to fall below the 5th percentile. ** Data for some agencies not presented if <100 records are available for analysis after exclusions.
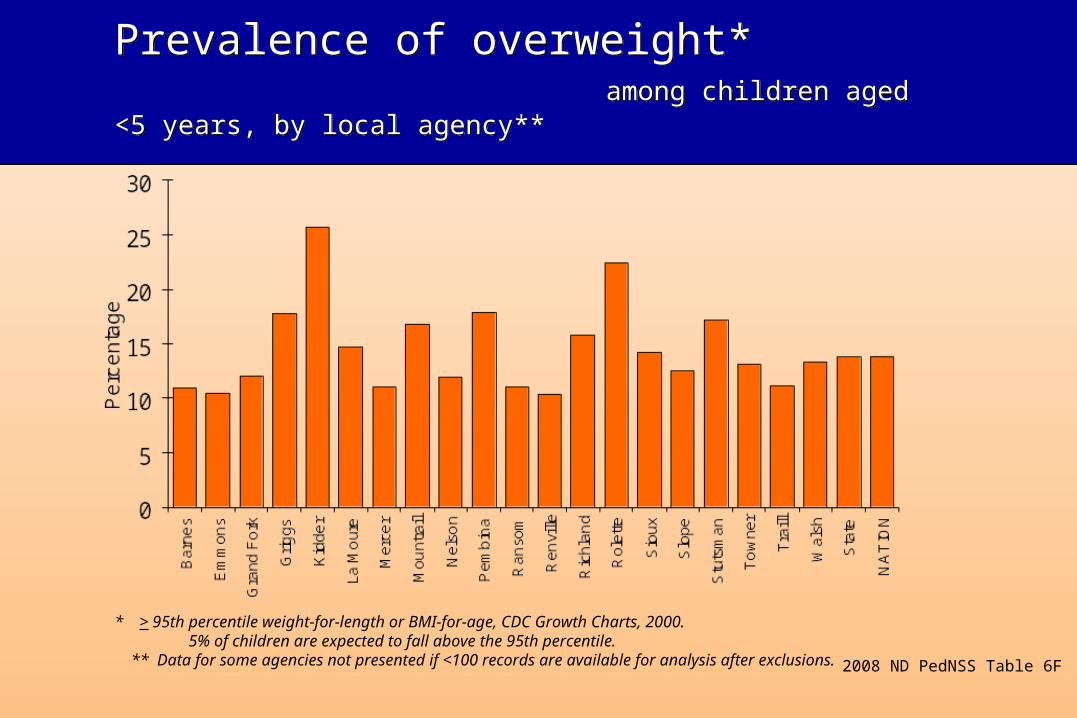
Prevalence of overweight* among children aged <5 years, by local agency** Prevalence of overweight* among children aged <5 years, by local agency**
2008 ND PedNSS Table 6F
* > 95th percentile weight-for-length or BMI-for-age, CDC Growth Charts, 2000. 5% of children are expected to fall above the 95th percentile. ** Data for some agencies not presented if <100 records are available for analysis after exclusions.
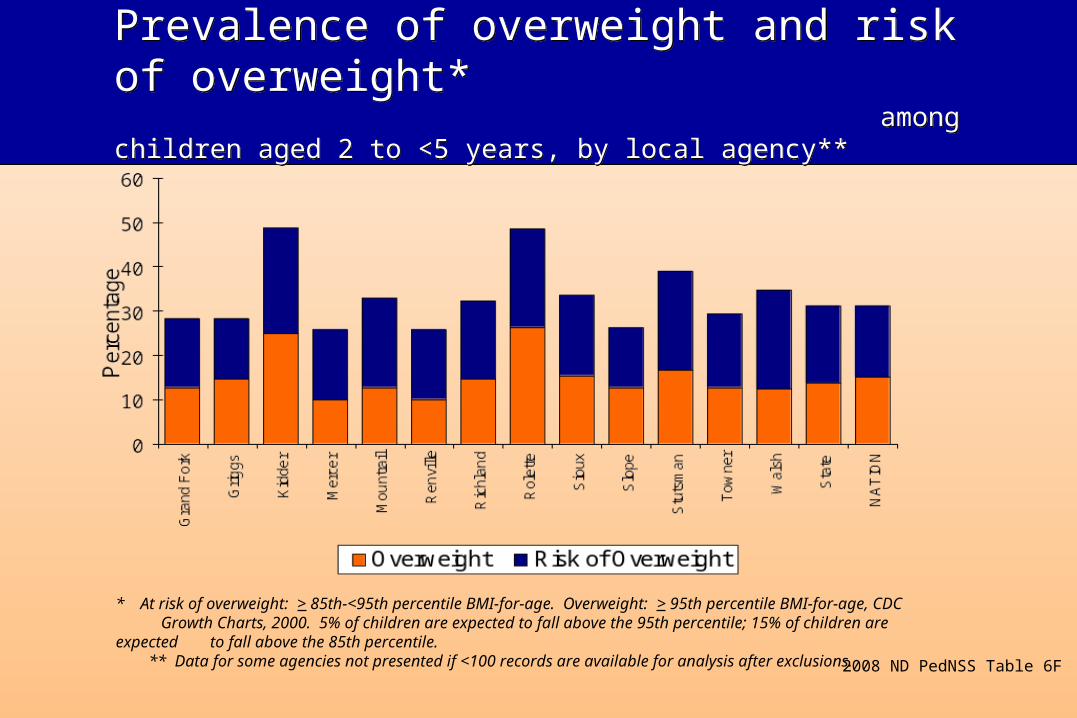
Prevalence of overweight and risk of overweight* among children aged 2 to <5 years, by local agency**
Prevalence of overweight and risk of overweight* among children aged 2 to <5 years, by local agency**
2008 ND PedNSS Table 6F
* At risk of overweight: > 85th-<95th percentile BMI-for-age. Overweight: > 95th percentile BMI-for-age, CDC Growth Charts, 2000. 5% of children are expected to fall above the 95th percentile; 15% of children are
expected to fall above the 85th percentile. ** Data for some agencies not presented if <100 records are available for analysis after exclusions.
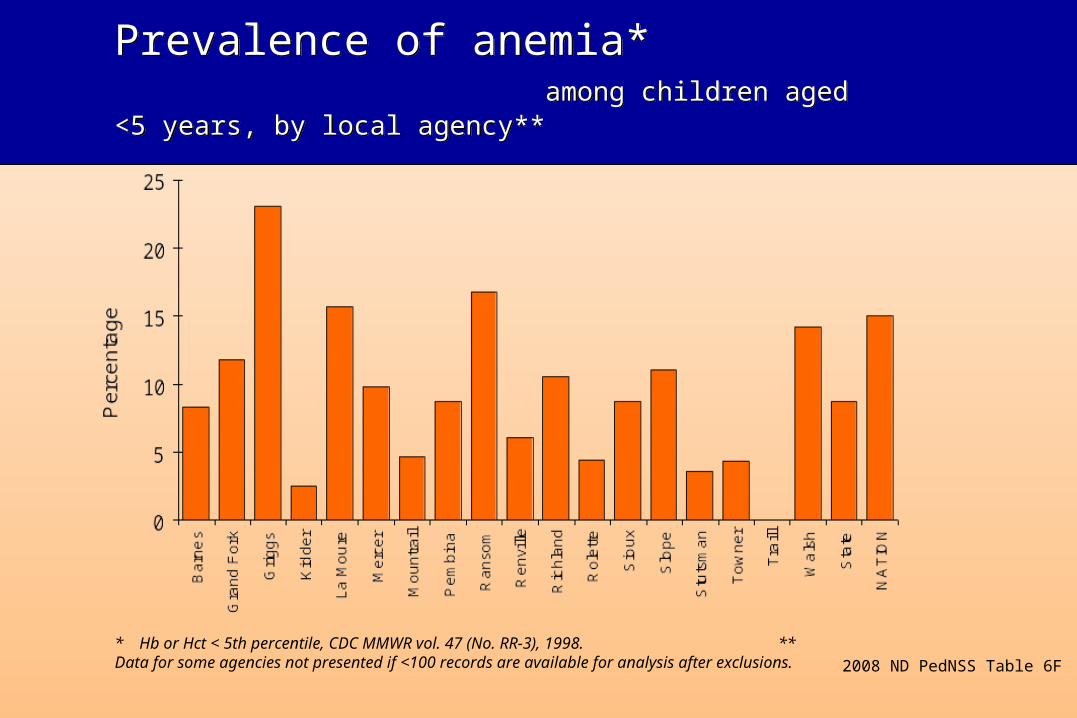
Prevalence of anemia* among children aged <5 years, by local agency** Prevalence of anemia* among children aged <5 years, by local agency**
* Hb or Hct < 5th percentile, CDC MMWR vol. 47 (No. RR-3), 1998. ** Data for some agencies not presented if <100 records are available for analysis after exclusions. 2008 ND PedNSS Table 6F
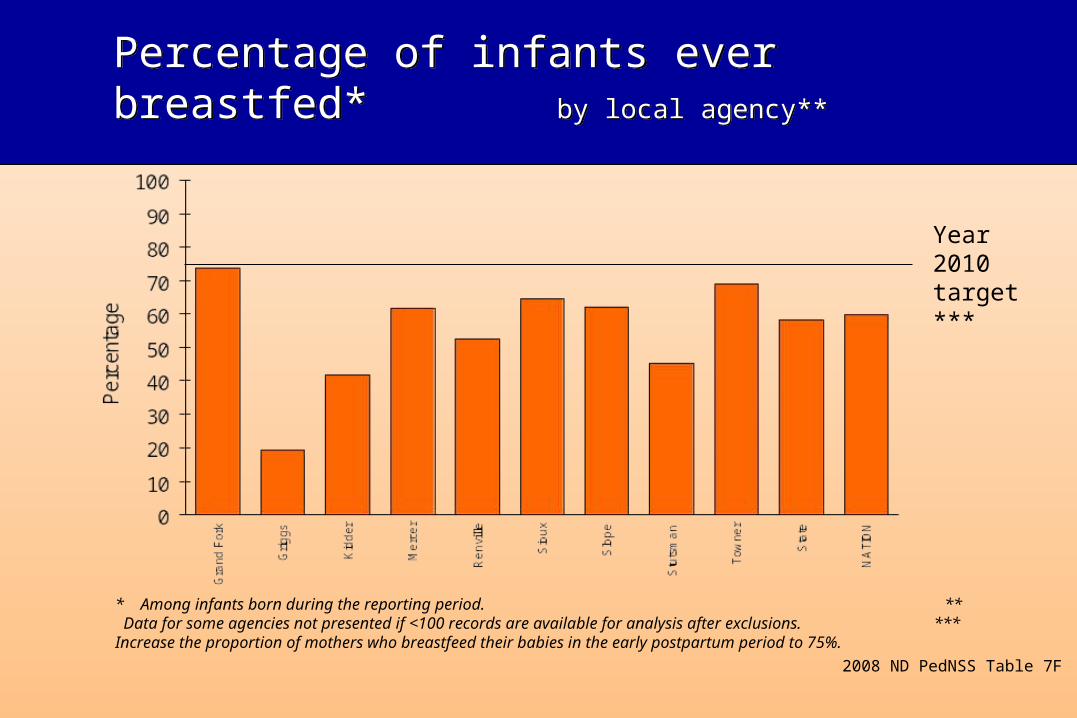
Percentage of infants ever breastfed* by local agency**Percentage of infants ever breastfed* by local agency**
* Among infants born during the reporting period. ** Data for some agencies not presented if <100 records are available for analysis after exclusions. *** Increase the proportion of mothers who breastfeed their babies in the early postpartum period to 75%.
2008 ND PedNSS Table 7F
Year 2010 target***
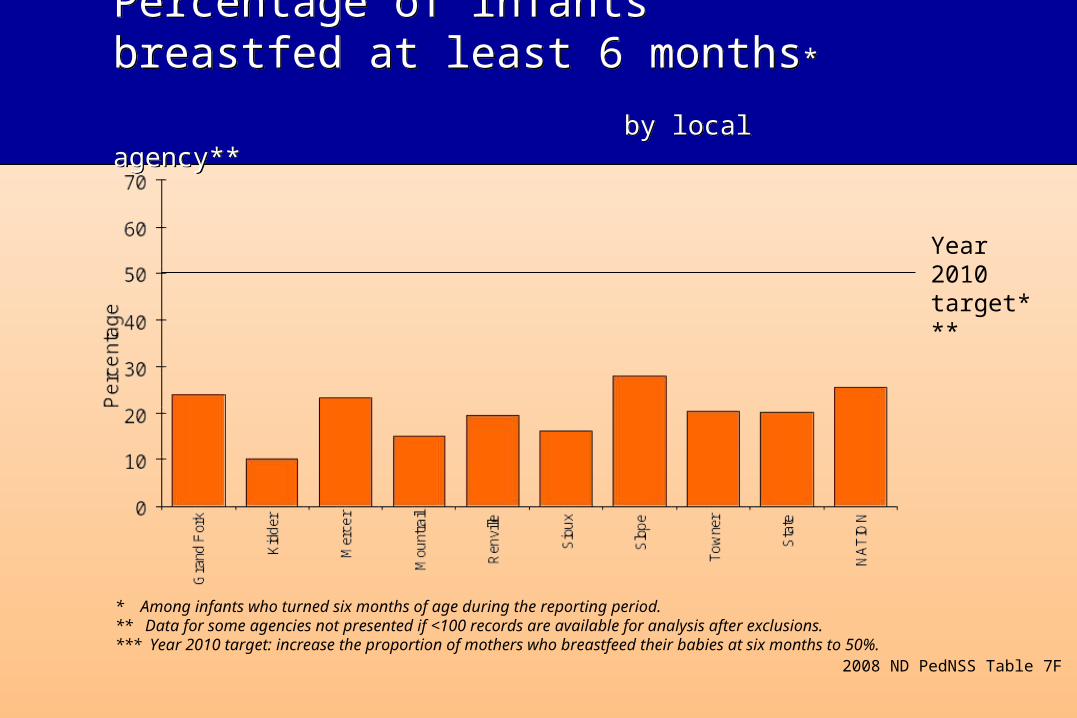
Percentage of infants breastfed at least 6 months* by local agency**
Percentage of infants breastfed at least 6 months* by local agency**
* Among infants who turned six months of age during the reporting period. ** Data for some agencies not presented if <100 records are available for analysis after exclusions. *** Year 2010 target: increase the proportion of mothers who breastfeed their babies at six months to 50%.
Year 2010 target***
2008 ND PedNSS Table 7F
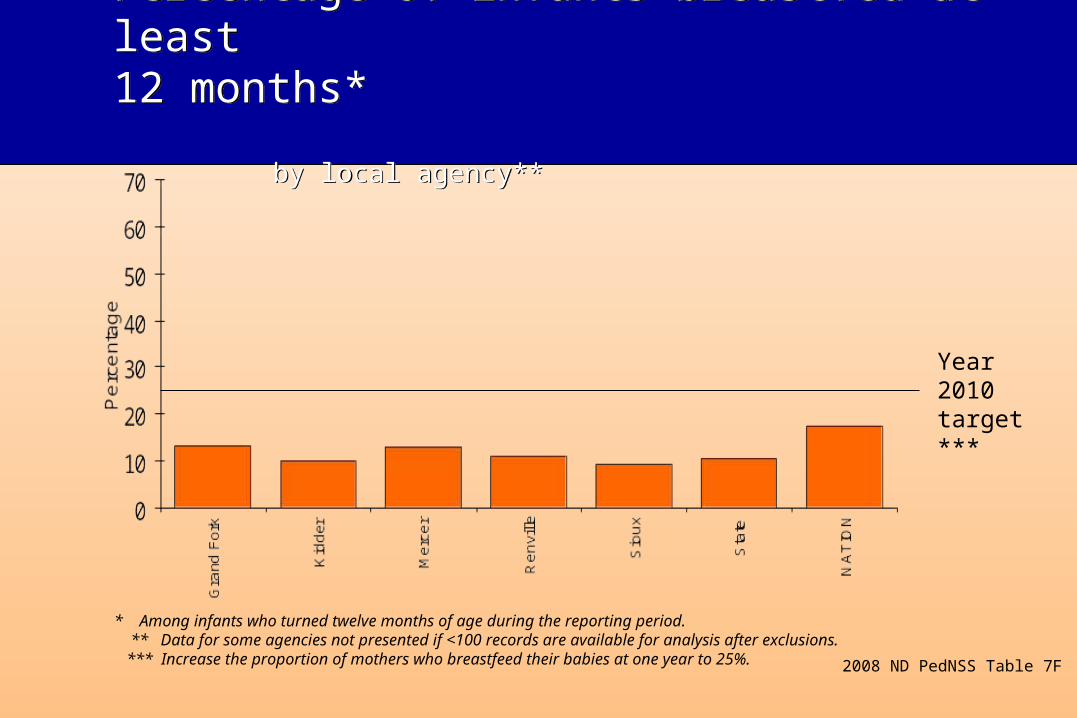
Percentage of infants breastfed at least 12 months* by local agency**
Percentage of infants breastfed at least 12 months* by local agency**
2008 ND PedNSS Table 7F
Year 2010 target***
* Among infants who turned twelve months of age during the reporting period. ** Data for some agencies not presented if <100 records are available for analysis after exclusions. *** Increase the proportion of mothers who breastfeed their babies at one year to 25%.
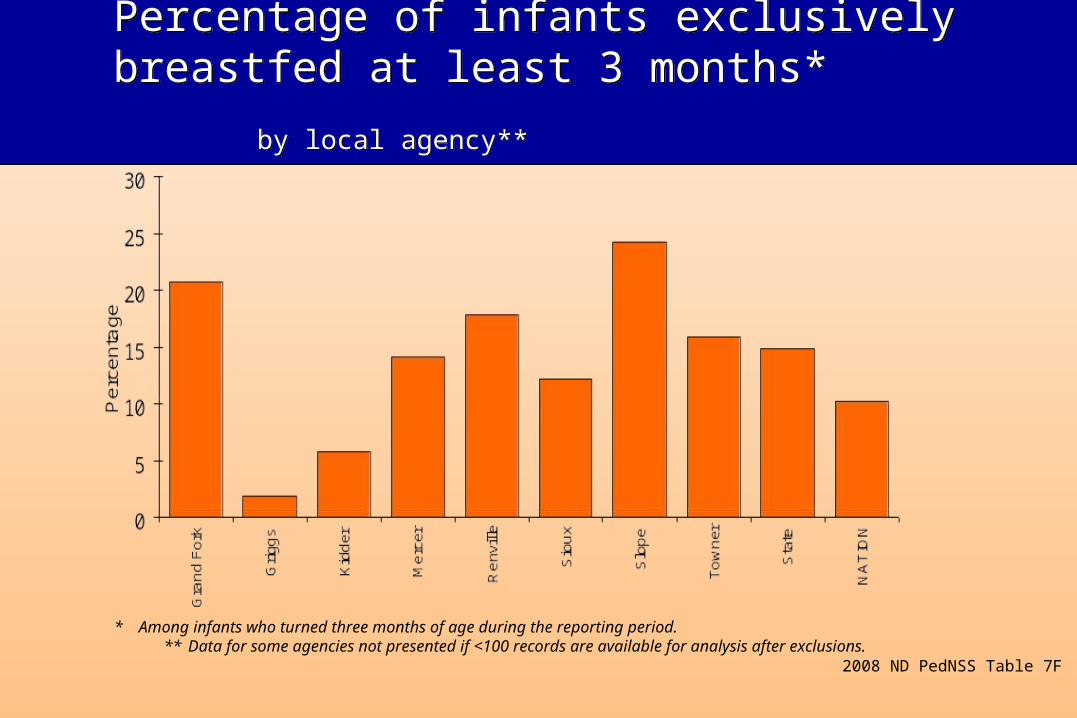
Percentage of infants exclusively breastfed at least 3 months* by local agency**
Percentage of infants exclusively breastfed at least 3 months* by local agency**
2008 ND PedNSS Table 7F
* Among infants who turned three months of age during the reporting period. ** Data for some agencies not presented if <100 records are available for analysis after exclusions.
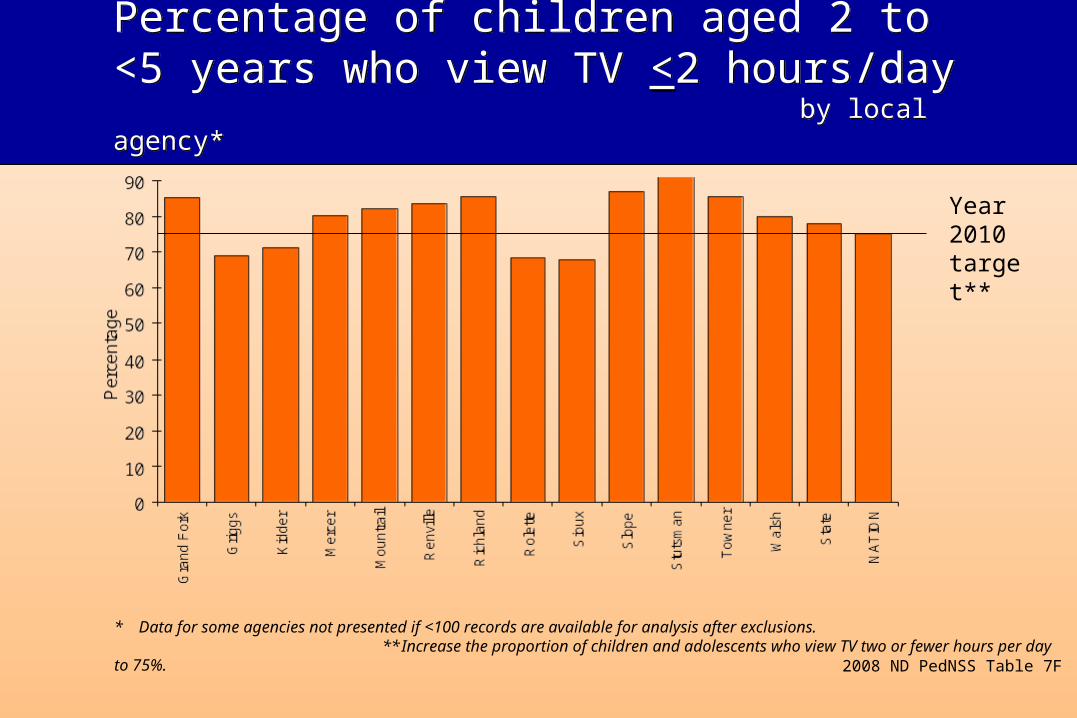
* Data for some agencies not presented if <100 records are available for analysis after exclusions. ** Increase the proportion of children and adolescents who view TV two or fewer hours per day to 75%.
Percentage of children aged 2 to <5 years who view TV <2 hours/day by local agency*
Percentage of children aged 2 to <5 years who view TV <2 hours/day by local agency*
2008 ND PedNSS Table 7F
Year 2010 target**
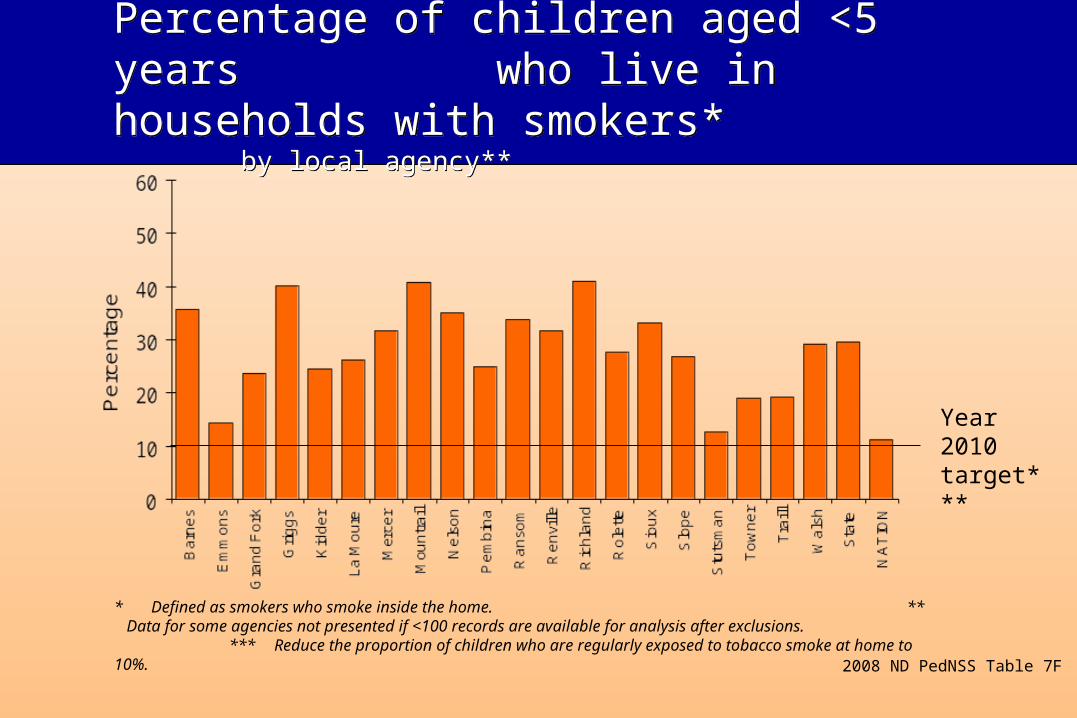
Percentage of children aged <5 years who live in households with smokers* by local agency**
Percentage of children aged <5 years who live in households with smokers* by local agency**
2008 ND PedNSS Table 7F
* Defined as smokers who smoke inside the home. ** Data for some agencies not presented if <100 records are available for analysis after exclusions. *** Reduce the proportion of children who are regularly exposed to tobacco smoke at home to 10%.
Year 2010 target***
