0356 demand data for the nts exit (flat) capacity charging … · gcm05. for more information see;...
TRANSCRIPT

What stage is
this document
in the process?
Modification 0356
07 January 2011
Version 1.0
Page 1 of 2423
© 2011 all rights reserved
Stage 01: Proposal
0356 Demand Data for the NTS Exit (Flat) Capacity Charging Methodology
Defines the demand flow data, used within the NTS Charging
Transportation Model for calculating NTS Exit (Flat) Capacity
charges from 1st October 2012, as the forecast undiversified 1-
in-20 peak day demand.
The Proposer recommends This Proposal is sent directly to Consultation
Medium Impact: All participants holding NTS Exit (Flat) Capacity affected
Low Impact:
UNC Panel, the Authority, Workstreams and Joint Office

Modification 0356
07 January 2011
Version 1.0
Page 2 of 2423
© 2011 all rights reserved
Contents
1 Summary 23
2 Why Change? 25
3 Solution 27
4 Relevant Objectives 210
5 Impacts and Costs 212
6 Implementation 215
7 The Case for Change 216
8 Recommendation 217
9 Further Information 218
About this document:
This document is a Proposal, which will be presented by the Proposer to the Panel on 20th January 2011. The Panel will consider the Proposer’s recommendation, and agree whether
this Proposal should proceed to consultation or be referred to a UNC Modification 0356 Workgroup for development.
Any questions?
Contact:
Richard Hounslea
grid.com
01926 65 5518
Proposer:
National Grid NTS
grid.com
01926 65 6022

Modification 0356
07 January 2011
Version 1.0
Page 3 of 2423
© 2011 all rights reserved
1 Summary
Why Change?
A supply and demand match is required within the NTS charging Transportation Model,
which is used for NTS capacity charge setting purposes. The data used for NTS Exit (Flat)
Capacity charge setting purposes from 1st October 2012 in accordance with the NTS
charging methodology, is as follows;
• The modelled demand flow is the obligated (baseline plus incremental) level of NTS
Exit (Flat) Capacity, other than at bi-directional sites with physical entry capability
(Storage, IUK, and BBL) where the modelled demand flow is zero.
• The modelled supply flow is derived from the supply/demand data set out in the most
recent Ten Year Statement for each year for which prices are being set.
Increases in the obligated level of NTS Exit (Flat) Capacity and reductions in the level of
NTS available supplies have resulted in an unworkable charging methodology as the
aggregate obligated NTS Exit (Flat) Capacity level (at non bi-directional sites) is greater
than the available NTS Supplies.
Solution
It is proposed that;
• For bi-directional sites the modelled demand will be the undiversified NTS forecast 1-in-
20 peak day demand.
• For bi-directional sites with physical entry capability (storage, IUK, and BBL) the
forecast is zero.
• For bi-directional sites with no physical entry capability (Moffat) the forecast is the
undiversified NTS forecast 1-in-20 peak day demand.
• For DN offtakes, the modelled demand will be the undiversified NTS forecast 1-in-20
peak day demand for the DN, and will be prorated to the relevant DN offtakes based on
the booked NTS Exit (Flat) Capacity.
• For other directly connected (DC) offtakes (NTS Power Generation & Industrials) the
modelled demand will be the undiversified NTS forecast 1-in-20 peak day demand.
forecast will be the obligated (baseline plus incremental) capacity level other than
where DC sites have not been commissioned or have been decommissioned.
The undiversified NTS forecast 1-in-20 peak day demand for the DN’s, Moffat, and other
directly connected (DC) offtakes will be capped at the obligated (baseline + incremental)
capacity level.
Estimates of 1-in-20 peak day demand data would be produced and published on an
individual NTS Exit Point basis in accordance with UNC TPD Section O for years “0 to 4”.
This would ensure that a supply and demand match could be achieved for charge setting
purposes. Subject to the approval of this Modification Proposal, National Grid would
publish an undiversified NTS forecast 1-in-20 peak day demand in the Ten Year Statement
from 2011, consistent with this proposal, to match the Charging Methodology.
What Supply Data is
used for NTS Capacity
Charge setting
purposes?
The nodal supply data for
the Transport Model is
derived from the supply
data set out in the most
recent Ten Year
Statement for each year
for which prices are being
set. The aggregate
storage and Interconnector flows will
be adjusted such that a
supply and demand balance is achieved. This
initial supply and demand
match is achieved by
reducing supplies in a
merit order to match the
forecast demand.

Modification 0356
07 January 2011
Version 1.0
Page 4 of 2423
© 2011 all rights reserved
Impacts and Costs
The proposal represents a change to NTS internal manual processes and hence there are
no systems impacts and no costs have been identified for Users.
Implementation
Implementation is required primarily such that prices can be set prior by 1st May 2012 such
that they become applicable from 1st October 2012. National Grid is also required to
produce indicative prices ahead of the annual NTS Exit (Flat) Capacity application windows
and the next window will be July 2011. National Grid NTS believes that ideally, indicative
charges should be based on an approved NTS Charging Methodology, and should at least
be based on a proposed Charging Methodology.
The Case for Change
The Proposal would result in a workable Charging Methodology for the derivation of NTS
Exit (Flat) Capacity Prices.
Using demand flow data within the NTS charge setting Transportation Model would better
reflect connected NTS load at peak conditions and would better reflect the data used
within the NTS planning and investment processes. As a consequence of using this data,
charges should better reflect the cost incurred in making NTS Exit (Flat) Capacity available.
Recommendations
The Proposer invites the Panel to:
• DETERMINE that Modification Proposal XXXX is referred to the NTS Charging
Methodology Forum for no more than two months.

Modification 0356
07 January 2011
Version 1.0
Page 5 of 2423
© 2011 all rights reserved
2 Why Change?
A supply and demand match is required within the NTS charging Transportation Model,
which is used for NTS capacity charge setting purposes. The data used for NTS Exit (Flat)
Capacity charge setting purposes from 1st October 2012 in accordance with the prevailing
NTS charging methodology, is as follows;
• The modelled demand flow is the obligated (baseline plus incremental) level of NTS
Exit (Flat) Capacity, other than at bi-directional sites with physical entry capability
(storage, IUK, and BBL) where the modelled demand flow is zero. This equates to a
level of 7800 GWh/day for 2012/13.
• The modelled supply flow is derived from the supply/demand data set out in the most
recent Ten Year Statement for each year for which prices are being set.
Through the Gas TCMF, issues associated with the NTS Exit (Flat) Capacity price setting
methodology, to be used from 1st October 2012, were raised;
Issue One - Demands vs. Supplies
The first issue identified was that using baseline plus incremental capacity, for the demand
flow data, could create a demand level so high that the modelled supplies would not be
able to achieve the required supply/demand balance, resulting in an unworkable
methodology. This has proved to be the case as a consequence of the updated 2010 Ten
Year Statement supply data. The modelled demand flow - the obligated (baseline plus
incremental) level of NTS Exit (Flat) Capacity, other than at bi-directional sites with
physical entry capability (storage, IUK, and BBL) where the modelled demand flow is zero,
equates to a level of 7800 GWh/day for 2012/13. The Ten Year Statement available
supplies for 2012/13, taking into account IUK capability, are 7718 GWh/day.
Issue Two - Price Variability
The second issue identified was the variability of NTS Exit Capacity prices at the southern
Scottish and Northern DN NTS Exit Points, and the Moffat NTS Exit Point.
This variability occurs when the modelled supplies at St. Fergus are insufficient to meet
the higher Scottish and Northern DN, and Moffat modelled demand flows. This is a
consequence of reduced St Fergus supplies and baselines plus incremental NTS Exit (Flat)
Capacity being used to model demand flows. As a result, a greater proportion of supply
flows are required from the south of the network to meet the demand further north,
leading to higher NTS Exit (Flat) Capacity prices.
Issue Three - Baseline may no longer be reflective of “connected
load”
In developing the enduring NTS Exit (Flat) Capacity charge setting arrangements, the
intention was to better reflect the “connected load”, recognising that the concepts of Firm
and Interruptible capacity were no longer applicable. The resultant move towards the use
of the baseline plus incremental capacity as the demand flow level may now no longer be
reflective of the “connected load”.
In respect of the DN’s, some offtakes are not booked up to the baseline level but other
offtake bookings have triggered incremental capacity, with the aggregate baseline plus
incremental level being in excess of the forecasted 1-in-20 peak day demand.
GCM05
The enduring NTS Exit
(Flat) Capacity charge
setting arrangements
were introduced via NTS
Gas Charging
Methodology proposal
GCM05.
For more information see;
http://www.nationalgrid.c
om/uk/Gas/Charges/cons
ultations/archive_consulta
tion_papers/

Modification 0356
07 January 2011
Version 1.0
Page 6 of 2423
© 2011 all rights reserved
For Moffat, the aggregate booking level has triggered a significant amount of incremental
capacity despite the capability of the downstream infrastructure being far less than the
amount of capacity booked.
Offtake Data (GWh/day) for 2012/13
Offtake Obligated Capacity Forecast Demand
Moffat 529 273
DN 5466 4344

Modification 0356
07 January 2011
Version 1.0
Page 7 of 2423
© 2011 all rights reserved
3 Solution
Gas TCMF Discussions and Options
Following discussions at the Gas Transmission Charging Methodologies Forum (TCMF)
between May and September 2010, discussion paper GCD09 was issued to seek views on
the merits of a number of alternative options for modelling supply and demand flows
within National Grid’s Transportation Model.
It is the modelled supply and demand flows, along with the network pipe distances, that
drive the calculation of the long run marginal costs (LRMCs) and hence the price
differences across the NTS.
For the avoidance of doubt, the options identified in GCD09 did not relate to the capacity
data used in the Tariff section of the Transportation Model, which uses Baseline (TO) NTS
Exit (Flat) Capacity data at all NTS Exit Points in order to ensure that prices are adjusted
so that the implied revenue level (price multiplied by the baseline (TO) NTS Exit (Flat)
Capacity quantity) equals National Grids target TO exit revenue. This ensures that if
baseline (TO) NTS Exit (Flat) Capacity is fully booked, the resulting capacity revenue would
equal National Grid’s target TO exit revenue. If baseline (TO) NTS Exit (Flat) Capacity is
not fully booked, revenue associated with unsold baseline capacity will be collected from a
TO Exit Commodity Charge.
In respect of demand flows, the options identified in GCD09 were;
• Baseline plus Incremental NTS Exit (Flat) Capacity
• Annual NTS Exit (Flat) Capacity Bookings
• Forecast
• Maximum Supply Point Offtake Rate (MSPOR)
• Capability of the downstream facility
• Zero (currently used for physically bi-directional sites with physical entry capability:
storage, IUK, and BBL)
It was anticipated that a combination of these options could be applied such that each
different offtake type might be modelled by a separate data source.
In respect of beach/UKCS supply flows, the options identified were;
• Ten Year Statement forecast supplies (no change from current method)
• Baseline supply data
• Average of Ten Year Statement forecast data
• Ten Year Statement Forecast Supplies (Data from Ten Year Statement before the first
Y+4 Enduring Annual NTS Exit (Flat) Capacity applications for the relevant Gas Year)
"1-in-20 peak day
demand"
2.6.4 For the purposes of
the Code, in relation to
the Total System, any part of the Total System,
a System or any part of a
System, and in respect of
any Gas Year:
"1-in-20 peak day
demand" is the peak day
demand that, in a long series of winters, with
connected load being held
at the levels appropriate
to the winter in question,
would be exceeded in one
out of 20 winters, each
winter being counted only
once;

Modification 0356
07 January 2011
Version 1.0
Page 8 of 2423
© 2011 all rights reserved
Respondents to NTS charging discussion paper GCD09 were asked for views on these
options, for the purposes of developing charging methodology proposals.
Feasibility of Demand Flow Options
Baseline plus Incremental NTS Exit (Flat)
Capacity
This is the prevailing methodology applicable from 1st October 2012 and is no
longer workable if used for all NTS Exit
Points.
Annual NTS Exit (Flat) Capacity Bookings Daily bookings and some annual bookings would not be available at the time of
setting charges. This option may result in
Users, relying on the daily and off-peak products, not appropriately contributing to
TO costs.
Forecast This option represents the most realistic
expectation of maximum flow.
Maximum Supply Point Offtake Rate
(MSPOR)
This option is not anticipated to result in a workable methodology due to the high
aggregate level of MSPOR.
Capability of the downstream facility No definitive value for capability, other than the obligated (baseline plus incremental) capacity level was identified
for offtakes other than interconnectors.
Zero (currently used for bi-directional sites
with physical entry capability: storage, BBL,
and IUK)
This option represents the prevailing peak forecast for storage offtakes, BBL and IUK.
Respondents to GCD09 suggested that there may be some benefit in waiting for the 2011
NTS Exit (Flat) Capacity reduction window before raising a charging methodology
proposal; however, the level of obligated (baseline plus incremental) capacity would not
be reduced as a result of capacity reductions.
Respondents to GCD09 suggested that there may be some benefit in waiting for the
impact of the application of NTS exit capacity substitution following the 2011 NTS Exit
(Flat) Capacity application window before raising a charging methodology proposal. The
level of obligated (baseline plus incremental) NTS Exit (Flat) Capacity would only reduce as
a result of unsold NTS Exit (Flat) Capacity being substituted for incremental NTS Exit (Flat)
Capacity with a high exchange rate. This seems unlikely to have a significant impact on
the level of obligated NTS Exit (Flat) Capacity given the level of unsold capacity and the
potential for incremental NTS Exit (Flat) Capacity. It should be noted that if NTS exit
capacity substitution occurred with a one to one ratio then there would be no change in
the obligated NTS Exit (Flat) Capacity level as a result of incremental capacity being met
through substitution.
Based on responses to the GCD09 discussion paper and from analysis of the options,
National Grid has concluded that modelling the demand flows as forecast demand would
be the most appropriate solution.

Modification 0356
07 January 2011
Version 1.0
Page 9 of 2423
© 2011 all rights reserved
Feasibility of Supply Flow Options
Ten Year Statement forecast supplies (no
change from current method)
This is the prevailing methodology applicable from 1st October 2012 and would
remain viable workable should demands be
modelled at the forecast level. This option
represents the most realistic expectation of maximum flow.
Baseline supply data
This option may allow for a supply demand
balance should demand flows continue to be modelled as the obligated (baseline plus
incremental) capacity. This option does not
represent a realistic expectation of
maximum flow.
Average of Ten Year Statement forecast
data
This option may have the potential to reduce price volatility but further analysis
has been requested.
Ten Year Statement Forecast Supplies
(Data from Ten Year Statement before the
first Y+4 Enduring Annual NTS Exit (Flat)
Capacity applications for the relevant gas
year)
This option may have the potential to reduce price volatility but further analysis has been requested. Using the data from
the time of the relevant investment
decisions relating to NTS Exit (Flat) Capacity may be more cost reflective.
Based on responses to the GCD09 discussion paper and from analysis of the options,
National Grid has concluded that making changes to the modelled supply flows would not
be appropriate at this time. National Grid will carry out further analysis, as requested, and
will consider the consistency of the data used for both NTS Entry and Exit capacity charge
setting purposes before bringing forward further proposals.
The Proposal
It is proposed that;
• For bi-directional sites the modelled demand will be the undiversified NTS forecast 1-in-
20 peak day demand.
• For bi-directional sites with physical entry capability (storage, IUK, and BBL) the
forecast is zero.
• For bi-directional sites with no physical entry capability (Moffat) the forecast is the
undiversified NTS forecast 1-in-20 peak day demand.
• For DN offtakes, the modelled demand will be the undiversified NTS forecast 1-in-20
peak day demand for the DN, and will be prorated to the relevant DN offtakes based on
the booked NTS Exit (Flat) Capacity.
• For other directly connected (DC) offtakes (NTS Power Generation & Industrials) the
modelled demand will be the undiversified NTS forecast 1-in-20 peak day demand.
forecast will be the obligated (baseline plus incremental) capacity level other than
where DC sites have not been commissioned or have been decommissioned.
The undiversified NTS forecast 1-in-20 peak day demand for the DN’s, Moffat, and other
directly connected (DC) offtakes will be capped at the obligated (baseline + incremental)
capacity level.
Estimates of 1-in-20 peak day demand data would be produced and published on an
individual NTS Exit Point basis in accordance with UNC TPD Section O for years “0 to 4”.

Modification 0356
07 January 2011
Version 1.0
Page 10 of 2423
© 2011 all rights reserved
This would ensure that a supply and demand match could be achieved for charge setting
purposes. Subject to the approval of this Modification Proposal, National Grid would
publish an undiversified NTS forecast 1-in-20 peak day demand in the Ten Year Statement
from 2011, consistent with this proposal, to match the Charging Methodology.

Modification 0356
07 January 2011
Version 1.0
Page 11 of 2423
© 2011 all rights reserved
4 Relevant Objectives
The Proposer believes that 0356 will better facilitate the achievement of Relevant
Objectives a, b and c
Proposer’s view of the benefits of 0356 against the Code Relevant Objectives
Description of Relevant Objective Identified
impact
(a) save in so far as paragraphs (aa) or (d) apply, that compliance with
the charging methodology results in charges which reflect the
costs incurred by the licensee in its transportation business;
See
explanation
below
(aa) that, in so far as prices in respect of transportation arrangements
are established by auction, either:
(i) no reserve price is applied, or
(ii) that reserve price is set at a level -
(I) best calculated to promote efficiency and avoid undue preference
in the supply of transportation services; and
(II) best calculated to promote competition between gas suppliers and
between gas shippers;
None
(b) that, so far as is consistent with sub-paragraph (a), the charging
methodology properly takes account of developments in the
transportation business;
See
explanation
below
(c) that, so far as is consistent with sub-paragraphs (a) and (b),
compliance with the charging methodology facilitates effective
competition between gas shippers and between gas suppliers; and
See
explanation
below
(d) that the charging methodology reflects any alternative arrangements
put in place in accordance with a determination made by the Secretary
of State under paragraph 2A(a) of Standard Special Condition A27
(Disposal of Assets).
None
Implementation would be expected to better facilitate the achievement of the Relevant
Objectives on the basis of Standard Special Condition A5 of the National Grid NTS Licence:
Reflecting the costs incurred by the licensee in its transportation
business
Using demand flow data within the NTS charge setting Transportation Model would better
reflect connected NTS load at peak conditions and would better reflect the data used
within the NTS planning and investment processes. As a consequence of using this data,
charges should better reflect the cost incurred in making NTS Exit (Flat) Capacity
available.
Charging Methodology Relevant Objectives
“relevant objectives”
means, in respect of the UNC charging
methodologies, only; in relation to the charging
methodology regulated by Standard Special Condition A5 the “relevant methodology objectives”
listed in paragraph 5 of that condition,

Modification 0356
07 January 2011
Version 1.0
Page 12 of 2423
© 2011 all rights reserved
Taking account of developments in the transportation business
The prevailing methodology for setting NTS Exit (Flat) Capacity charges from 1st October
2012 uses baseline plus incremental capacity (obligated capacity), for the demand flow
data. It was highlighted that this could create a demand level so high that the modelled
supplies would not be able to achieve the required supply/demand balance, resulting in an
unworkable NTS charging methodology. This has proved to be the case as a consequence
of the level of obligated capacity triggered and the updated 2010 Ten Year Statement
supply data.
Facilitating effective competition between gas shippers and
between gas suppliers
Basing the NTS charging methodology on data that will be published in the Ten Year
Statement from 2011 should ensure a transparent charging methodology such that Users
can replicate the charging setting process and forecast future charge levels. National Grid
believes that promoting transparency of the charging methodology is consistent with the
facilitation of competition between gas shippers. National Grid NTS will produce a version
of the charge setting Transportation Model which allows the application of the proposed
methodology in terms of the calculation of offtake demands to be replicated more easily.
Ensuring that the charging methodology is cost reflective should ensure that shippers face
the costs resulting from their connection decisions and hence cross subsidies are avoided.
National Grid believes that avoiding cross subsidies is consistent with the facilitation of
competition between gas shippers.
Licence Compliance
In the Proposer's opinion the Modification Proposal does not conflict with paragraphs 2, 2A
and 3 of Standard Special Condition A4 of the Transporter's Licence as the proposal is
consistent with setting NTS Exit (Flat) Capacity charges from 1st October 2012 and from
the 1st October in each subsequent year.

Panel paper number
Modification 0356
07 January 2011
Version 1.0
Page 13 of 2423
© 2011 all rights reserved
5 Impacts and Costs
This proposal represents a change to internal NTS manual processes.
Costs
Indicative industry costs
No industry implementation costs have been identified
Impacts
Impact on Transporters’ Systems and Process
Transporters’ System/Process Potential impact
UK Link • None
Operational Processes • Internal changes to manual price
setting processes
User Pays implications • None
Impact on Users
Area of Users’ business Potential impact
Administrative and operational • None
Development, capital and operating costs • None
Contractual risks • Implementation of this proposal would
impact on the setting of NTS Exit (Flat)
Capacity charges which Users will
attract as a result of previous
applications for NTS.
Legislative, regulatory and contractual
obligations and relationships
• None
Impact on Transporters
Area of Transporters’ business Potential impact
System operation • None
Development, capital and operating costs • None
Recovery of costs • The proposal would allow NTS to
recover transportation costs associated
with providing NTS Exit (Flat) Capacity
Price regulation • The proposal would allow NTS to
recover transportation costs associated
with providing NTS Exit (Flat) Capacity
Contractual risks • None
Legislative, regulatory and contractual
obligations and relationships
• Implementation of this proposal would
facilitate a cost reflective NTS pricing
Methodology in regard to NTS Exit
(Flat) Capacity Prices as required by the
NTS Licence.

Modification 0356
07 January 2011
Version 1.0
Page 14 of 2423
© 2011 all rights reserved
Impact on Transporters
Standards of service • The proposal would allow NTS to
provide timely notice of indicative and
actual NTS Exit (Flat) Capacity Prices
Impact on Code Administration
Area of Code Administration Potential impact
Modification Rules • None
UNC Committees • None
General administration • None
Impact on Code
Code section Potential impact
UNC TPD Section Y For NTS Exit (Flat) Capacity charge setting
from 1st October 2012, the definition of
nodal demand flow data, used within the
NTS charging Transportation Model, would
be redefined.
UNC TPD Section O, 4.1.2b(ii) In respect of the requirement to produce
estimates of 1-in-20 peak day demand data
on an individual exit point basis, the
definition would be redefined to include
years “0 to 4”.
Impact on UNC Related Documents and Other Referenced Documents
Related Document Potential impact
Network Entry Agreement (TPD I1.3) None
Network Exit Agreement (Including
Connected System Exit Points) (TPD J1.5.4)
None
Storage Connection Agreement (TPD
R1.3.1)
None
UK Link Manual (TPD U1.4) None
Network Code Operations Reporting
Manual (TPD V12)
None
Network Code Validation Rules (TPD V12) None
ECQ Methodology (TPD V12) None
Measurement Error Notification Guidelines
(TPD V12)
None
Energy Balancing Credit Rules (TPD X2.1) None
Uniform Network Code Standards of
Service (Various)
None
Impact on Core Industry Documents and other documents
Document Potential impact

Modification 0356
07 January 2011
Version 1.0
Page 15 of 2423
© 2011 all rights reserved
Impact on Core Industry Documents and other documents
Safety Case or other document under Gas
Safety (Management) Regulations
None
Gas Transporter Licence Implementation of this proposal would
facilitate a cost reflective NTS pricing
Methodology in regard to NTS Exit (Flat)
Capacity Prices.
Transportation Pricing Methodology
Statement
Implementation of this proposal would
facilitate a workable NTS pricing
Methodology in regard to NTS Exit (Flat)
Capacity Prices.
Other Impacts
Item impacted Potential impact
Security of Supply None
Operation of the Total System
Industry fragmentation None
Terminal operators, consumers, connected
system operators, suppliers, producers and
other non code parties
None

Modification 0356
07 January 2011
Version 1.0
Page 16 of 2423
© 2011 all rights reserved
6 Implementation
Actual Charges
Implementation is required primarily such that prices can be set and notified by 1st May
2012 such that they become applicable from 1st October 2012.
Indicative Charges
National Grid is required to produce indicative prices ahead of the annual NTS Exit (Flat)
Capacity application windows and the next window will be July 2011. Indicative charges
form part of the Enduring NTS Exit (Flat) Capacity User commitment process as Users are
committed to holding and paying for four years of capacity, or holding and paying for
capacity for a sufficient duration such that charges that will be paid are greater than or
equal to the User commitment value. The User commitment quantity is defined as an
amount equal to four years of charges based on the indicative charges applicable at the
time of user commitment.
National Grid has published indicative NTS Exit (Flat) Capacity charges two months ahead
of each of the 2009 and 2010 applications windows and intends to do so before the 2011
application window. If an approved workable methodology is not available, National Grid
will consider either delaying the publication of indicative charges or publishing indicative
charges based on the proposed methodology, based on a view that this might be the best
estimate of charges given available information. National Grid will seek industry views on
the appropriate method of setting indicative charges, should an approved methodology not
be available, by 1st May 2011.

Modification 0356
07 January 2011
Version 1.0
Page 17 of 2423
© 2011 all rights reserved
7 The Case for Change
In addition to that identified the above, the Proposer has identified the following:
Advantages
• The Proposal will lead to a workable methodology for calculating NTS Exit (Flat)
Capacity prices as supplies are forecast to be sufficient to meet forecast demand
• The modelled demand flows will more accurately reflect peak connected load. The
undiversified NTS forecast 1-in-20 peak day demand should reflect peak load for
storage and offtakes to connected systems. The obligated (baseline plus incremental)
NTS Exit (Flat) Capacity level should reflect the connected load at other NTS direct
connects.
• The Proposal will achieve the relevant charging methodology relevant objectives,
primarily generating prices which reflect the costs incurred
• The proposal is based on information which will be openly published in the Ten Year
Statement from 2011.
• Calculation of the charges will be replicable through publication of the Transportation
Model
• Charges will be less dependent on User capacity booking strategies at Moffat and DNO
offtakes.
Disadvantages
• It might be perceived that forecast demand levels will be more variable compared to
the obligated (baseline plus incremental) NTS Exit (Flat) Capacity level of NTS Exit
(Flat) Capacity; however, it is the changes in this level of capacity that have resulted in
this proposal being brought forward.
• It might be perceived that using different data sources for different classes of NTS Exit
Point is inappropriate; however, National Grid NTS believes that the proposal represents
the best estimate of connected load for all NTS Exit Points. Subject to the approval of
this Modification Proposal, National Grid would publish an undiversified NTS forecast 1-
in-20 peak day demand in the Ten Year Statement from 2011, consistent with this
proposal, to match the Charging Methodology.
GCD09
National Grid has
consulted on the options for the source of demand
flow data within the NTS
Charging Transportation Model via Gas Charging
Discussion paper GCD09.
Information can be found
at;
http://www.nationalgrid.c
om/uk/Gas/Charges/cons
ultations/CurrentPapers/
Modification 0356
07 January 2011
Version 1.0
Page 18 of 2423
© 2011 all rights reserved
8 Recommendation
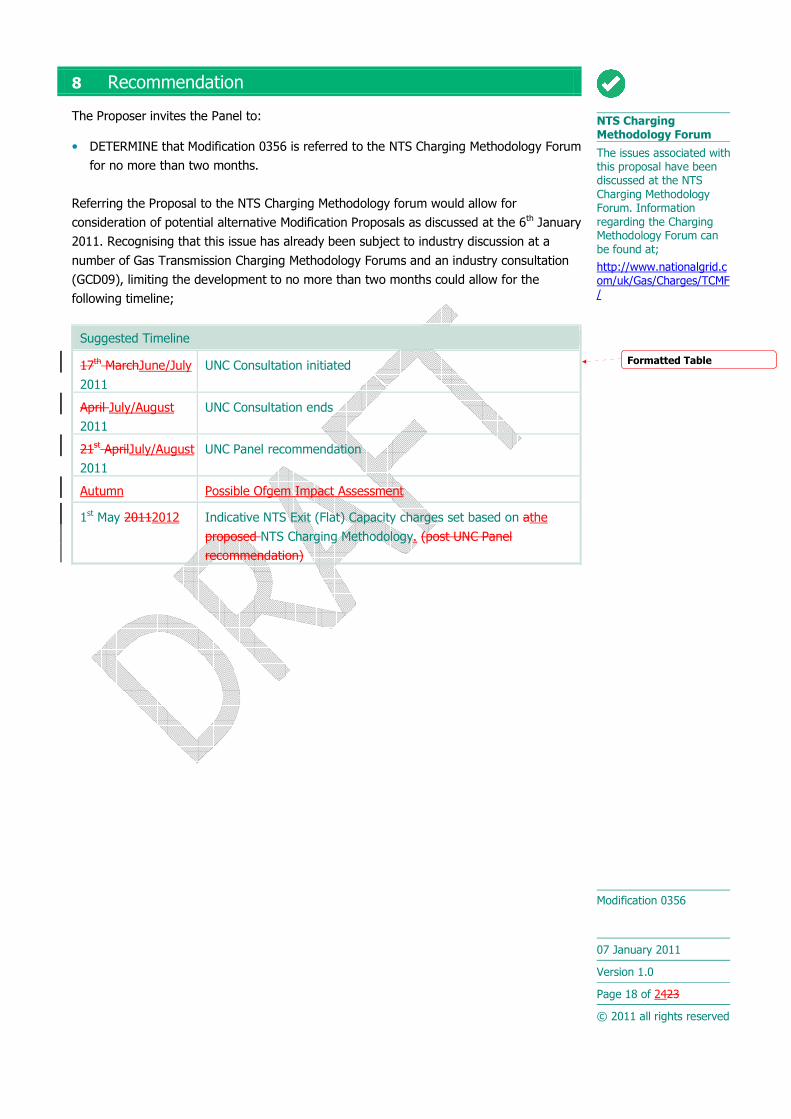
The Proposer invites the Panel to:
• DETERMINE that Modification 0356 is referred to the NTS Charging Methodology Forum
for no more than two months.
Referring the Proposal to the NTS Charging Methodology forum would allow for
consideration of potential alternative Modification Proposals as discussed at the 6th January
2011. Recognising that this issue has already been subject to industry discussion at a
number of Gas Transmission Charging Methodology Forums and an industry consultation
(GCD09), limiting the development to no more than two months could allow for the
following timeline;
Suggested Timeline
17th MarchJune/July
2011
UNC Consultation initiated
April July/August
2011
UNC Consultation ends
21st AprilJuly/August
2011
UNC Panel recommendation
Autumn Possible Ofgem Impact Assessment
1st May 20112012 Indicative NTS Exit (Flat) Capacity charges set based on athe
proposed NTS Charging Methodology. (post UNC Panel
recommendation)
NTS Charging Methodology Forum
The issues associated with this proposal have been discussed at the NTS
Charging Methodology Forum. Information
regarding the Charging Methodology Forum can
be found at;
http://www.nationalgrid.com/uk/Gas/Charges/TCMF/
Formatted Table

Modification 0356
07 January 2011
Version 1.0
Page 19 of 2423
© 2011 all rights reserved
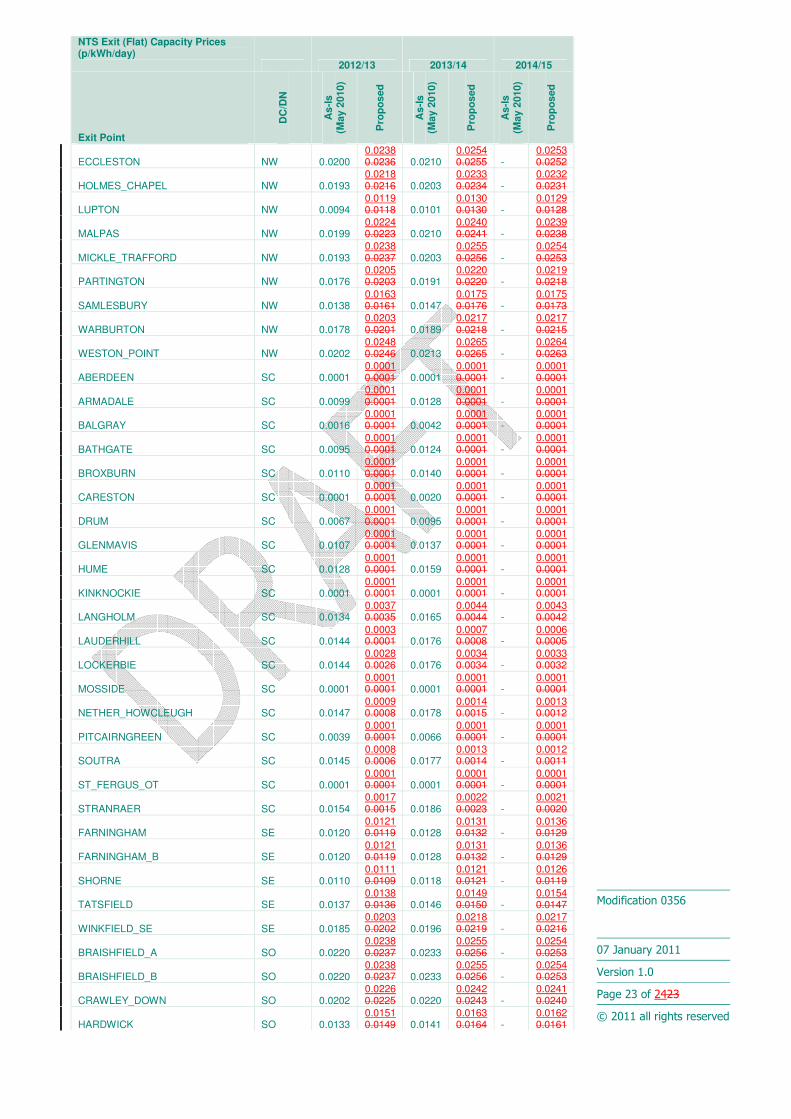
9 Further Information
The following tables shows the indicative NTS Exit (Flat) Capacity Prices compared with
the indicative prices calculated in accordance with the prevailing Charging Methodology
ahead of the 2010 application window;
NTS Exit (Flat) Capacity Prices (p/kWh/day) 2012/13 2013/14 2014/15
Exit Point D
C/D
N
As
-Is
(M
ay
2010
)
Pro
po
sed
As
-Is
(M
ay
2010
)
Pro
po
sed
As
-Is
(M
ay
2010
)
Pro
po
sed
AM_PAPER DC 0.0153 0.01780.0177 0.0163
0.01920.0192
-
0.01910.0190
AVONMOUTH_LNG DC 0.0090 0.01510.0149 0.0140
0.01680.0163
-
0.01670.0161
BACTON INTERCONNECTOR DC 0.0001 0.00010.0001 0.0001
0.00010.0001
-
0.00010.0001
BACTON_BAIRD DC 0.0001 0.00010.0001 0.0001
0.00010.0001
-
0.00010.0001
BAGLAN_BAY_PG DC 0.0001 0.00010.0001 0.0001
0.00010.0001
-
0.00010.0001
BARKING_PG DC 0.0101 0.01200.0118 0.0109
0.01300.0131
-
0.01290.0128
BARROW_BAINS DC 0.0059 0.00840.0083 0.0064
0.00930.0094
-
0.00920.0091
BARROW_BS DC 0.0059 0.00840.0083 0.0064
0.00930.0094
-
0.00920.0091
BARROW_GATEWAY DC 0.0059 0.00840.0083 0.0064
0.00930.0094
-
0.00920.0091
BARTON_STACEY_(MRS) DC 0.0205 0.02230.0222 0.0217
0.02390.0240
-
0.02380.0237
BILLINGHAM_ICI DC 0.0032 0.00550.0070 0.0058
0.00620.0080
-
0.00080.0016
BP_GRANGEMOUTH DC 0.0082 0.00010.0001 0.0110
0.00010.0001
-
0.00010.0001
BP_SALTEND_HP DC 0.0001 0.00010.0001 0.0001
0.00010.0001
-
0.00010.0001
BRIDGEWATER_PAPER DC 0.0201 0.02470.0245 0.0212
0.02640.0264
-
0.02630.0262
BRIGG_PG DC 0.0029 0.00540.0052 0.0033
0.00610.0062
-
0.00600.0059
BRIMSDOWN_PG DC 0.0106 0.01250.0123 0.0114
0.01350.0136
-
0.01350.0133
BRINE_FIELD_PS DC 0.0026 0.00480.0063 0.0051
0.00550.0073
-
0.00010.0009
BRUNNER_MOND DC 0.0171 0.02110.0209 0.0180
0.02260.0226
-
0.02250.0224
CARRINGTON_PS DC 0.0176 0.02050.0203 0.0191
0.02200.0220
-
0.02190.0218
CAYTHORPE_(MRS) DC 0.0001 0.00110.0009 0.0001
0.00160.0016
-
0.00150.0014
CENTRAX DC 0.0216 0.02420.0240 0.0236
0.02630.0259
-
0.02630.0256
CHESHIRE_(MRS) DC 0.0164 0.02110.0208 0.0173
0.02260.0226
-
0.02250.0224
CONNAHS_QUAY_PS DC 0.0205 0.02500.0249 0.0216
0.02670.0268
-
0.02670.0265
CORBY_PS DC 0.0079 0.01040.0102 0.0085
0.01140.0115
-
0.01130.0112
CORYTON_PG DC 0.0104 0.01170.0115 0.0111
0.01270.0128
-
0.01320.0125
CORYTON_PG_2 DC 0.0104 0.01170.0115 0.0111
0.01270.0128
-
0.01320.0125
COTTAM_PG DC 0.0019 0.00450.0043 0.0023
0.00510.0052
-
0.00500.0049
DAMHEAD_CREEK DC 0.0097 0.00970.0096 0.0104
0.01070.0107
-
0.01120.0105
DEESIDE_PS DC 0.0202 0.02470.0245 0.0212
0.02640.0264
-
0.02630.0262
DIDCOT_A DC 0.0168 0.01870.0185 0.0179
0.02010.0201
-
0.02000.0199
Indicative Charges
Indicative charges represent National Grid’s best estimate of potential
future charges based on
information available at the time that charges are set; however, these charges are subject to
change as updated data becomes available.

Modification 0356
07 January 2011
Version 1.0
Page 20 of 2423
© 2011 all rights reserved
NTS Exit (Flat) Capacity Prices (p/kWh/day) 2012/13 2013/14 2014/15
Exit Point
DC
/DN
As
-Is
(M
ay 2
010
)
Pro
po
sed
As
-Is
(M
ay 2
010
)
Pro
po
sed
As
-Is
(M
ay 2
010
)
Pro
po
sed
DIDCOT_PS DC 0.0168 0.01860.0184 0.0178
0.02000.0201
-
0.01990.0198
DRAKELOW_PS DC 0.0129 0.01540.0153 0.0138
0.01670.0167
-
0.01660.0165
DYNEVOR_ARMS_LNG DC 0.0001 0.00010.0001 0.0001
0.00040.0001
-
0.00030.0001
EASINGTON&ROUGH_TERMINAL DC 0.0001 0.00010.0001 0.0001
0.00010.0001
-
0.00010.0001
ENRON_(BILLINGHAM) DC 0.0032 0.00550.0070 0.0058
0.00620.0080
-
0.00080.0016
GARTON_(MRS) DC 0.0001 0.00010.0001 0.0001
0.00010.0001
-
0.00010.0001
GLENMAVIS_LNG DC 0.0107 0.00010.0001 0.0137
0.00010.0001
-
0.00010.0001
GOOLE_GLASS DC 0.0006 0.00320.0030 0.0009
0.00380.0038
-
0.00370.0036
GRAIN_GAS DC 0.0097 0.00970.0096 0.0104
0.01070.0107
-
0.01120.0105
GREAT_YARMOUTH DC 0.0001 0.00010.0001 0.0001
0.00010.0001
-
0.00010.0001
HATFIELD_MOOR_(MRS) DC 0.0011 0.00390.0035 0.0014
0.00450.0046
-
0.00450.0043
HAYS_CHEMICALS DC 0.0170 0.02160.0214 0.0180
0.02320.0232
-
0.02310.0230
HOLEHOUSE_FARM_(MRS) DC 0.0172 0.02180.0216 0.0182
0.02330.0234
-
0.02320.0231
HORNSEA_(MRS) DC 0.0001 0.00010.0001 0.0001
0.00030.0004
-
0.00020.0001
ICI_RUNCORN DC 0.0202 0.02480.0246 0.0213
0.02650.0265
-
0.02640.0263
IMMINGHAM_PG DC 0.0001 0.00010.0001 0.0001
0.00010.0001
-
0.00010.0001
KEADBY_BS DC 0.0018 0.00430.0041 0.0021
0.00490.0050
-
0.00490.0047
KEADBY_PS DC 0.0018 0.00430.0041 0.0021
0.00490.0050
-
0.00490.0047
KEMIRAINCE_CHP DC 0.0199 0.02440.0242 0.0209
0.02610.0262
-
0.02600.0259
KINGS_LYNN_PS DC 0.0029 0.00480.0046 0.0033
0.00550.0055
-
0.00540.0053
LANGAGE_PG DC 0.0246 0.02710.0269 0.0267
0.02940.0289
-
0.02930.0287
LITTLE_BARFORD_PS DC 0.0094 0.01130.0111 0.0101
0.01230.0123
-
0.01220.0121
LONGANNET DC 0.0075 0.00010.0001 0.0103
0.00010.0001
-
0.00010.0001
MARCHWOOD DC 0.0216 0.02410.0239 0.0236
0.02570.0258
-
0.02570.0256
MEDWAY_PS DC 0.0098 0.00980.0097 0.0105
0.01080.0108
-
0.01130.0106
MILFORD_HAVEN_REFINERY DC 0.0001 0.00010.0001 0.0001
0.00010.0001
-
0.00010.0001
MOFFAT DC 0.0154 0.00170.0015 0.0186
0.00220.0023
-
0.00210.0020
PARTINGTON_LNG DC 0.0176 0.02050.0203 0.0191
0.02190.0220
-
0.02190.0217
PEMBROKE_PG DC 0.0001 0.00010.0001 0.0001
0.00010.0001
-
0.00010.0001
PETERBOROUGH_PS DC 0.0060 0.00780.0076 0.0065
0.00860.0087
-
0.00850.0084
PETERHEAD_PG DC 0.0001 0.00010.0001 0.0001
0.00010.0001
-
0.00010.0001
PHILLIPS_SEAL_SANDS DC 0.0026 0.00480.0063 0.0051
0.00550.0073
-
0.00010.0009
ROCKSAVAGE_PG DC 0.0202 0.02480.0246 0.0213
0.02650.0265
-
0.02640.0263
ROOSECOTE_PS DC 0.0059 0.00840.0083 0.0064
0.00930.0094
-
0.00920.0091
RYE_HOUSE_PS DC 0.0111 0.01290.0127 0.0118
0.01400.0141
-
0.01390.0138
SALTEND DC 0.0001 0.00010.0001 0.0001
0.00010.0001
-
0.00010.0001
SAPPIPAPERMILLCHP DC 0.0142 0.01670.0165 0.0151
0.01800.0180
-
0.01790.0178

Modification 0356
07 January 2011
Version 1.0
Page 21 of 2423
© 2011 all rights reserved
NTS Exit (Flat) Capacity Prices (p/kWh/day) 2012/13 2013/14 2014/15
Exit Point
DC
/DN
As
-Is
(M
ay 2
010
)
Pro
po
sed
As
-Is
(M
ay 2
010
)
Pro
po
sed
As
-Is
(M
ay 2
010
)
Pro
po
sed
SEABANK_POWER_phase_II DC 0.0091 0.01510.0149 0.0141
0.01680.0164
-
0.01670.0161
SEABANK_POWER_phase1 DC 0.0108 0.01330.0131 0.0122
0.01490.0145
-
0.01490.0142
SELLAFIELD_PS DC 0.0099 0.01240.0123 0.0106
0.01350.0136
-
0.01340.0133
SEVERNSIDE_ICI DC 0.0091 0.01500.0148 0.0140
0.01670.0162
-
0.01660.0160
SHOTTON_PAPER DC 0.0204 0.02500.0248 0.0215
0.02670.0267
-
0.02660.0265
SPALDING_PG DC 0.0033 0.00590.0057 0.0037
0.00660.0067
-
0.00650.0064
SPALDING_PG_2 DC 0.0033 0.00590.0057 0.0037
0.00660.0067
-
0.00650.0064
ST_FERGUS_BS DC 0.0001 0.00010.0001 0.0001
0.00010.0001
-
0.00010.0001
STALLINGBOROUGH DC 0.0001 0.00030.0001 0.0001
0.00070.0008
-
0.00070.0006
STAYTHORPE DC 0.0049 0.00740.0072 0.0053
0.00820.0083
-
0.00810.0080
STUBLACH DC 0.0164 0.02110.0208 0.0173
0.02260.0226
-
0.02250.0224
SUTTON_BRIDGE_PS DC 0.0043 0.00610.0060 0.0047
0.00690.0069
-
0.00680.0067
TEESSIDE_BASF DC 0.0026 0.00480.0064 0.0051
0.00550.0073
-
0.00010.0009
TEESSIDE_HYDROGEN DC 0.0026 0.00490.0064 0.0052
0.00550.0073
-
0.00010.0009
THORNTON_CURTIS_(KILLINGHOLME) DC 0.0001
0.00010.0001 0.0001
0.00010.0001
-
0.00010.0001
WEST_BURTON_PS DC 0.0019 0.00440.0042 0.0022
0.00510.0051
-
0.00500.0049
WYRE_PS DC 0.0131 0.01560.0154 0.0139
0.01680.0169
-
0.01670.0166
ZENECA DC 0.0032 0.00550.0070 0.0058
0.00620.0080
-
0.00080.0016
BACTON_OT EA 0.0001 0.00010.0001 0.0001
0.00010.0001
-
0.00010.0001
BRISLEY EA 0.0003 0.00210.0020 0.0005
0.00270.0028
-
0.00260.0025
CAMBRIDGE EA 0.0066 0.00840.0082 0.0071
0.00930.0093
-
0.00920.0091
EYE EA 0.0056 0.00740.0073 0.0061
0.00830.0083
-
0.00820.0081
GREAT_WILBRAHAM EA 0.0056 0.00750.0073 0.0061
0.00830.0083
-
0.00820.0081
MATCHING_GREEN EA 0.0097 0.01150.0114 0.0104
0.01260.0126
-
0.01250.0124
ROUDHAM_HEATH EA 0.0019 0.00380.0036 0.0022
0.00440.0045
-
0.00430.0042
ROYSTON EA 0.0075 0.00930.0091 0.0080
0.01020.0103
-
0.01010.0100
WEST_WINCH EA 0.0027 0.00450.0043 0.0030
0.00520.0052
-
0.00510.0050
WHITWELL EA 0.0094 0.01120.0110 0.0101
0.01220.0123
-
0.01210.0120
YELVERTON EA 0.0001 0.00160.0015 0.0001
0.00220.0022
-
0.00210.0020
ALREWAS_EM EM 0.0134 0.01590.0158 0.0143
0.01720.0172
-
0.01710.0170
BLABY EM 0.0099 0.01240.0123 0.0106
0.01350.0136
-
0.01340.0133
BLYBOROUGH EM 0.0019 0.00450.0043 0.0023
0.00510.0052
-
0.00500.0049
CALDECOTT EM 0.0076 0.01010.0099 0.0081
0.01100.0111
-
0.01090.0108
DROINTON_OT EM 0.0145 0.01700.0169 0.0155
0.01830.0184
-
0.01830.0181
GOSBERTON EM 0.0030 0.00550.0053 0.0034
0.00620.0063
-
0.00620.0060
KIRKSTEAD EM 0.0010 0.00350.0033 0.0012
0.00410.0042
-
0.00400.0039
MARKET_HARBOROUGH EM 0.0087 0.01120.0110 0.0093
0.01220.0122
-
0.01210.0120

Modification 0356
07 January 2011
Version 1.0
Page 22 of 2423
© 2011 all rights reserved
NTS Exit (Flat) Capacity Prices (p/kWh/day) 2012/13 2013/14 2014/15
Exit Point
DC
/DN
As
-Is
(M
ay 2
010
)
Pro
po
sed
As
-Is
(M
ay 2
010
)
Pro
po
sed
As
-Is
(M
ay 2
010
)
Pro
po
sed
SILK_WILLOUGHBY EM 0.0022 0.00470.0045 0.0025
0.00540.0055
-
0.00530.0052
SUTTON_BRIDGE EM 0.0044 0.00630.0061 0.0049
0.00700.0071
-
0.00690.0068
THORNTON_CURTIS_LDZ EM 0.0001 0.00010.0001 0.0001
0.00010.0001
-
0.00010.0001
TUR_LANGTON EM 0.0089 0.01140.0112 0.0095
0.01240.0125
-
0.01230.0122
WALESBY EM 0.0001 0.00110.0009 0.0001
0.00160.0016
-
0.00150.0014
ASSELBY NE 0.0001 0.00260.0025 0.0003
0.00320.0033
-
0.00310.0030
BALDERSBY NE 0.0052 0.00780.0076 0.0057
0.00860.0087
-
0.00470.0055
BURLEY_BANK NE 0.0045 0.00700.0068 0.0049
0.00780.0078
-
0.00680.0076
GANSTEAD NE 0.0001 0.00010.0001 0.0001
0.00010.0001
-
0.00010.0001
PANNAL NE 0.0040 0.00650.0064 0.0044
0.00730.0074
-
0.00720.0071
PAULL NE 0.0001 0.00010.0001 0.0001
0.00010.0001
-
0.00010.0001
PICKERING NE 0.0001 0.00370.0036 0.0015
0.00440.0044
-
0.00430.0042
RAWCLIFFE NE 0.0003 0.00280.0026 0.0005
0.00340.0035
-
0.00330.0032
TOWTON NE 0.0023 0.00480.0046 0.0026
0.00550.0056
-
0.00540.0053
BISHOP_AUCKLAND NO 0.0050 0.00720.0071 0.0076
0.00800.0081
-
0.00260.0034
BISHOP_AUCKLAND_TEST_FACILITY NO 0.0050
0.00720.0071 0.0076
0.00800.0081
-
0.00260.0034
COLDSTREAM NO 0.0118 0.00010.0001 0.0149
0.00010.0001
-
0.00010.0001
CORBRIDGE NO 0.0094 0.00270.0026 0.0124
0.00330.0034
-
0.00320.0031
COWPEN_BEWLEY NO 0.0030 0.00530.0068 0.0056
0.00600.0078
-
0.00060.0014
ELTON NO 0.0034 0.00640.0079 0.0061
0.00720.0089
-
0.00180.0025
GUYZANCE NO 0.0120 0.00020.0001 0.0150
0.00070.0007
-
0.00060.0005
HUMBLETON NO 0.0113 0.00010.0001 0.0143
0.00010.0001
-
0.00010.0001
KELD NO 0.0120 0.00940.0092 0.0129
0.01030.0103
-
0.01020.0101
LITTLE_BURDON NO 0.0039 0.00680.0083 0.0065
0.00760.0094
-
0.00220.0030
MELKINTHORPE NO 0.0127 0.00860.0085 0.0136
0.00950.0096
-
0.00940.0093
SALTWICK_PC NO 0.0152 0.00150.0013 0.0184
0.00200.0021
-
0.00190.0018
SALTWICK_VC NO 0.0152 0.00150.0013 0.0184
0.00200.0021
-
0.00190.0018
THRINTOFT NO 0.0055 0.00850.0095 0.0077
0.00940.0107
-
0.00400.0047
TOW_LAW NO 0.0069 0.00920.0090 0.0097
0.01010.0102
-
0.00470.0055
WETHERAL NO 0.0135 0.00610.0059 0.0162
0.00690.0069
-
0.00680.0067
HORNDON NT 0.0101 0.01200.0118 0.0109
0.01300.0131
-
0.01290.0128
LUXBOROUGH_LANE NT 0.0104 0.01220.0120 0.0111
0.01320.0133
-
0.01320.0131
PETERS_GREEN NT 0.0098 0.01160.0115 0.0105
0.01270.0127
-
0.01260.0125
PETERS_GREEN_SOUTH_MIMMS NT 0.0098 0.01160.0115 0.0105
0.01270.0127
-
0.01260.0125
WINKFIELD_NT NT 0.0185 0.02030.0202 0.0196
0.02180.0219
-
0.02170.0216
AUDLEY_NW NW 0.0180 0.02050.0204 0.0190
0.02200.0221
-
0.02190.0218
BLACKROD NW 0.0152 0.01770.0175 0.0162
0.01900.0191
-
0.01900.0188
Modification 0356
07 January 2011
Version 1.0
Page 23 of 2423
© 2011 all rights reserved
NTS Exit (Flat) Capacity Prices (p/kWh/day) 2012/13 2013/14 2014/15
Exit Point
DC
/DN
As
-Is
(M
ay 2
010
)
Pro
po
sed
As
-Is
(M
ay 2
010
)
Pro
po
sed
As
-Is
(M
ay 2
010
)
Pro
po
sed
ECCLESTON NW 0.0200 0.02380.0236 0.0210
0.02540.0255
-
0.02530.0252
HOLMES_CHAPEL NW 0.0193 0.02180.0216 0.0203
0.02330.0234
-
0.02320.0231
LUPTON NW 0.0094 0.01190.0118 0.0101
0.01300.0130
-
0.01290.0128
MALPAS NW 0.0199 0.02240.0223 0.0210
0.02400.0241
-
0.02390.0238
MICKLE_TRAFFORD NW 0.0193 0.02380.0237 0.0203
0.02550.0256
-
0.02540.0253
PARTINGTON NW 0.0176 0.02050.0203 0.0191
0.02200.0220
-
0.02190.0218
SAMLESBURY NW 0.0138 0.01630.0161 0.0147
0.01750.0176
-
0.01750.0173
WARBURTON NW 0.0178 0.02030.0201 0.0189
0.02170.0218
-
0.02170.0215
WESTON_POINT NW 0.0202 0.02480.0246 0.0213
0.02650.0265
-
0.02640.0263
ABERDEEN SC 0.0001 0.00010.0001 0.0001
0.00010.0001
-
0.00010.0001
ARMADALE SC 0.0099 0.00010.0001 0.0128
0.00010.0001
-
0.00010.0001
BALGRAY SC 0.0016 0.00010.0001 0.0042
0.00010.0001
-
0.00010.0001
BATHGATE SC 0.0095 0.00010.0001 0.0124
0.00010.0001
-
0.00010.0001
BROXBURN SC 0.0110 0.00010.0001 0.0140
0.00010.0001
-
0.00010.0001
CARESTON SC 0.0001 0.00010.0001 0.0020
0.00010.0001
-
0.00010.0001
DRUM SC 0.0067 0.00010.0001 0.0095
0.00010.0001
-
0.00010.0001
GLENMAVIS SC 0.0107 0.00010.0001 0.0137
0.00010.0001
-
0.00010.0001
HUME SC 0.0128 0.00010.0001 0.0159
0.00010.0001
-
0.00010.0001
KINKNOCKIE SC 0.0001 0.00010.0001 0.0001
0.00010.0001
-
0.00010.0001
LANGHOLM SC 0.0134 0.00370.0035 0.0165
0.00440.0044
-
0.00430.0042
LAUDERHILL SC 0.0144 0.00030.0001 0.0176
0.00070.0008
-
0.00060.0005
LOCKERBIE SC 0.0144 0.00280.0026 0.0176
0.00340.0034
-
0.00330.0032
MOSSIDE SC 0.0001 0.00010.0001 0.0001
0.00010.0001
-
0.00010.0001
NETHER_HOWCLEUGH SC 0.0147 0.00090.0008 0.0178
0.00140.0015
-
0.00130.0012
PITCAIRNGREEN SC 0.0039 0.00010.0001 0.0066
0.00010.0001
-
0.00010.0001
SOUTRA SC 0.0145 0.00080.0006 0.0177
0.00130.0014
-
0.00120.0011
ST_FERGUS_OT SC 0.0001 0.00010.0001 0.0001
0.00010.0001
-
0.00010.0001
STRANRAER SC 0.0154 0.00170.0015 0.0186
0.00220.0023
-
0.00210.0020
FARNINGHAM SE 0.0120 0.01210.0119 0.0128
0.01310.0132
-
0.01360.0129
FARNINGHAM_B SE 0.0120 0.01210.0119 0.0128
0.01310.0132
-
0.01360.0129
SHORNE SE 0.0110 0.01110.0109 0.0118
0.01210.0121
-
0.01260.0119
TATSFIELD SE 0.0137 0.01380.0136 0.0146
0.01490.0150
-
0.01540.0147
WINKFIELD_SE SE 0.0185 0.02030.0202 0.0196
0.02180.0219
-
0.02170.0216
BRAISHFIELD_A SO 0.0220 0.02380.0237 0.0233
0.02550.0256
-
0.02540.0253
BRAISHFIELD_B SO 0.0220 0.02380.0237 0.0233
0.02550.0256
-
0.02540.0253
CRAWLEY_DOWN SO 0.0202 0.02260.0225 0.0220
0.02420.0243
-
0.02410.0240
HARDWICK SO 0.0133 0.01510.0149 0.0141
0.01630.0164
-
0.01620.0161

Modification 0356
07 January 2011
Version 1.0
Page 24 of 2423
© 2011 all rights reserved
NTS Exit (Flat) Capacity Prices (p/kWh/day) 2012/13 2013/14 2014/15
Exit Point
DC
/DN
As
-Is
(M
ay 2
010
)
Pro
po
sed
As
-Is
(M
ay 2
010
)
Pro
po
sed
As
-Is
(M
ay 2
010
)
Pro
po
sed
IPSDEN SO 0.0165 0.01830.0181 0.0175
0.01970.0197
-
0.01960.0195
IPSDEN_2 SO 0.0165 0.01830.0181 0.0175
0.01970.0197
-
0.01960.0195
MAPPOWDER SO 0.0170 0.01950.0194 0.0188
0.02150.0210
-
0.02140.0208
WINKFIELD_SO SO 0.0185 0.02030.0202 0.0196
0.02180.0219
-
0.02170.0216
AYLESBEARE SW 0.0192 0.02170.0215 0.0210
0.02380.0233
-
0.02370.0231
CHOAKFORD SW 0.0246 0.02710.0269 0.0267
0.02940.0289
-
0.02930.0287
CIRENCESTER SW 0.0086 0.01110.0109 0.0099
0.01260.0122
-
0.01260.0119
COFFINSWELL SW 0.0218 0.02440.0242 0.0238
0.02660.0261
-
0.02650.0258
EASTON_GREY SW 0.0091 0.01170.0115 0.0105
0.01320.0128
-
0.01310.0125
EVESHAM SW 0.0056 0.00810.0080 0.0068
0.00950.0091
-
0.00940.0088
FIDDINGTON SW 0.0044 0.00690.0067 0.0054
0.00820.0077
-
0.00810.0075
ILCHESTER SW 0.0149 0.01750.0173 0.0166
0.01930.0188
-
0.01920.0186
KENN_SOUTH SW 0.0203 0.02280.0226 0.0222
0.02490.0245
-
0.02480.0242
LITTLETON_DREW SW 0.0099 0.01240.0123 0.0113
0.01400.0136
-
0.01400.0133
PUCKLECHURCH SW 0.0108 0.01330.0131 0.0122
0.01490.0145
-
0.01490.0142
ROSS_SW SW 0.0016 0.00410.0039 0.0025
0.00530.0048
-
0.00520.0046
SEABANK_LDZ SW 0.0092 0.01520.0150 0.0142
0.01690.0165
-
0.01690.0162
ALREWAS_WM WM 0.0134 0.01590.0158 0.0143
0.01720.0172
-
0.01710.0170
ASPLEY WM 0.0164 0.01890.0187 0.0174
0.02030.0204
-
0.02020.0201
AUDLEY_WM WM 0.0180 0.02050.0204 0.0190
0.02200.0221
-
0.02190.0218
AUSTREY WM 0.0122 0.01470.0145 0.0135
0.01640.0159
-
0.01630.0157
LEAMINGTON_SPA WM 0.0082 0.01070.0105 0.0095
0.01220.0118
-
0.01210.0115
LOWER_QUINTON WM 0.0067 0.00920.0091 0.0079
0.01070.0102
-
0.01060.0099
MILWICH WM 0.0152 0.01770.0175 0.0161
0.01900.0191
-
0.01890.0188
ROSS_WM WM 0.0016 0.00410.0039 0.0025
0.00530.0048
-
0.00520.0046
RUGBY WM 0.0093 0.01180.0116 0.0106
0.01330.0129
-
0.01330.0126
SHUSTOKE WM 0.0134 0.01590.0157 0.0148
0.01760.0172
-
0.01760.0169
STRATFORD_UPON_AVON WM 0.0068 0.00940.0092 0.0081
0.01080.0103
-
0.01070.0101
MAELOR WN 0.0207 0.02320.0231 0.0218
0.02480.0249
-
0.02480.0247
DOWLAIS WS 0.0001 0.00010.0001 0.0001
0.00100.0005
-
0.00090.0003
DYFFRYN_CLYDACH WS 0.0001 0.00010.0001 0.0001
0.00010.0001
-
0.00010.0001
GILWERN WS 0.0001 0.00110.0010 0.0001
0.00220.0017
-
0.00210.0015