0000 006 0 653 9 - wur
TRANSCRIPT

Influence of external factors on growth and development of sugar-beet (Beta vulgaris L.)-
CENTRALE LANDBOUWCATALOGUS
0000 0060 6539

A.L. Smit Department of Field Crops and Grassland Science, Agricultural University, Wageningen.
Influence of external factors on growth and development of sugar-beet (Beta vulgaris L.)
Centre for Agricultural Publishing and Documentation
Wageningen - 1983
'2~& é>\\.~l

CIP-GEGEVENS
Smit, A.L.
Influence of external factors on growth and development of
sugar-beet (Beta vulgaris L.) / A.L. Smit. - Wageningen : Pudoc. - Fig., tab. - (Agricultural research reports ; 914) Met samenvatting in het Nederlands. - Ook verschenen als proefschrift Wageningen. - Met lit. opg. ISBN 90-220-0812-6 Siso 630 UDC 631/632 Trefw. : landbouw.
ISBN 90 220 0812 6
The author graduated on 18 February 1983 as Doctor in de Landbouwwetenschap
pen at the Agricultural University, Wageningen, the Netherlands, on a thesis
with the same title and contents.
©Centre for Agricultural Publishing and Documentation (Pudoc), Wageningen,
1983.
No part of this publication may be reproduced, stored in a retrieval system,
or transmitted in any form or by any means, mechanical, photocopying, recor
ding, or otherwise, without the prior written permission of the publisher
Pudoc, P.O. Box, 4, 6700 AA Wageningen, Netherlands.
Printed in the Netherlands.
Abstract
Smit, A.L. 1983. Influence of external factors on growth and development of sugar-beet (Beta vulgaris L.). Agric. Res. Rep. (Versl. landbk. Onderz.) 914, ISBN 90 220 0812 6, (xii) + 109 p., 28 tables, 36 figs. 103 refs. Eng. and Dutch summaries. Also: Doctoral thesis, Wageningen.
Several trials on the quantitative influence of photophase, chilling (vernalization) and high temperature (devernalization) on bolting of sugar-beet were analysed on the basis of a simple physiological model, in which bolting is considered as the final event of dynamic, momentary and quantitative processes in the plant. Trials in the field and in growth chambers examined factors in chilling and in light response. The inhibitory effect on bolting of high temperatures and the role of photophase in this process was investigated for several periods after vernalization.
Growth and bolting seem to be correlated, as plants with just visible bolting were usually heavier. A possible relation between bolting resistance and vigour was investigated. Also the influence of photophase and cold treatment on growth was measured in a trial.
Some ways are shown of using a climatic factor like temperature to predict bolting in the field. Finally some recommendations for sugar-beet breeders are drawn up.
Free descriptors: vernalization, photoperiod, bolting, daylength, temperature, chilling, model, flowering, generative, devernalization, regression, optimization, breeding.
Contents
Abbreviations and symbols
1 Introduction 1
1.1 Bolting in sugar-beet crops 1
1.2 Influence of agricultural practice 1
1.3 Breeding of cultivars resistant to bolting 2
1.4 Scope of the present study 3
2 Factors influencing bolting in sugar-beet 4
2.1 introduction 4
2.2 Temperature 4
2.3 Light phase 8
2.4 Interactions between light phase and temperature 9
2.5 Growth and bolting 10
3 Models for bolting 11
3.1 Models in literature based on (hypothetical) plant hormones 11
3.2 A mathematical model for bolting in sugar-beet 12
4 Materials and methods 16
4.1 Plant material 16
4.2 Field trials 16
4.3 Indoor trials 17
4.3.1 Growing rooms 17
4.3.2 Rooms for cold' treatment 18
4.3.3 Greenhouses 18
4.3.4 Small greenhouses 18
4.4 Light conditions 18
4.5 Raising and chilling of plants 18
4.6 Observations 20
4.7 Statistics 20
5 Results 21
5.1 The juvenile stage and vernalization 21
5.1.1 Effect of daylenght and covering with plastic 21
5.1.1.1 Introduction 21
5.1.1.2 Materials and methods 22
5.1.1.3 Results 22
5.1.2 Effect of germination temperature 24
5.1.2.1 Introduction 24
5.1.2.2 Materials and methods 24
5.1.2.3 Results 25
5.1.3 Effect of plant size on vernalization in the field 26
5.1.3.1 Materials and methods 26
5.1.3.2 Results 26
5.1.4 Effect of plant size on cold treatment 28
5.1.4.1 Materials and methods 28
5.1.4.2 Results 28
5.1.5 Conclusions 30
5.2 Temperature of cold treatment 30
5.2.1 Materials and methods 30
5.2.2 Results 31
5.2.3 Conclusions 33
5.3 Light phase and vernalization 33
5.3.1 Influence of light phase after vernalization 33
5.3.1.1 Materials and methods 33
5.3.1.2 Results 33
5.3.2 Effect of cultivar 35
5.3.2.1 Introduction 35
5.3.2.2 Materials and methods 35
5.3.2.3 Results 35
5.4 Devernalization 37
5.4.1 Materials and methods 37
5.4.2 Results 38
5.5 Temperature and light phase immediately after vernalization 39
5.5.1 Trial 1 39
5.5.1.1 Materials and methods 39
5.5.1.2 Results 40
5.5.2 Trial 2 43
5.5.2.1 Materials and methods 43
5.5.2.2 Results 44
5.6 Discussion 48
5.6.1 Introduction 48
5.6.2 Seedling stage 48
5.6.3 Vernalization 49
5.6.4 Post-vernalization 50
5.6.5 Physiological background of the model 51
Relation between growth and bolting of sugar-beet 55
6.1 Introduction 55
6.2 Influence of conditions of growth on bolting 56

6.2.1 Introduction 56
6.2.2 Materials and methods 56
6.2.3 Results 58
6.2.4 Plant weight of bolters and non-bolters 60
6.2.5 Conclusions 61
6.3 Influence of cold treatment and photophase on growth 63
6.3.1 Introduction 63
6.3.2 Materials and methods 64
6.3.3 Results 65
6.3.4 Discussion 77
6.4 Influence of selection towards bolting resistance 80
6.4.1 Introduction 80
6.4.2 Materials and methods 80
6.4.3 Results 80
6.4.4 Discussion 82
7 Temperature and bolting under field conditions 84
7.1 Introduction 84
7.2 The relation between bolting and sowing date 84
7.3 A regression approach 85
7.4 An optimization approach 92
8 Final remarks 97
Summary 100
Samenvatting 103
References 106

Abbreviations and symbols
* P< 0 .1
** P<0.05
*** P<0.01
**** P<0.001
ANOVA Analyses of variance
d.05 Studentized range, Tukey, at the 5 % level
F Hypothetical flower hormone 2
LA Leaf area per plant (cm ) 2 -1
LAR Leaf area ratio (cm g ) -2 -1
NAR Net assimilation rate (g cm d )
r Coefficient of correlation 2
r Coefficient of determination
RER Relative expansion rate (d )
RGR Relative growth rate (d ) 2 -1
SLA Specific leaf area (cm g )
W Dry weight per plant (g)
V Hypothetical substance thought to
accumulate during chilling

1 Introduction
1.1 BOLTING IN SUGAR-BEET CROPS
Usually sugar beet (Beta vulgaris L. ) behaves as a biennial. In the first
year of growth, the plant produces a rosette of leaves and a root. After
overwintering, in the second year of growth, dry matter distribution becomes
totally different. In May or June, the stem appears and then the plant flow
ers. In most years all overwintered plants may flower, although in certain
years some plants do not. Also in some years, some plants run to seed in
their first season, the beet production year, and do not behave as a bien
nial. These plants are called bolters. Bolters appear from the beginning of
July until the harvest of the crop in October. In general, plants whose stem
is visible in the Netherlands before 1 August are arbitrarily called early
bolters and after that date late bolters.
For several reasons bolters are not wanted in a root crop. Especially
early bolters, which do not have time to develop a normal root, reduce yield.
According to Longden et al. (1975), yield is reduced by about 1 % for every
4 % of plants showing signs of bolting. There is also an effect on sugar
content of roots; over a 0-50 % range in the frequency of bolters, a 1 %
increase causes a 0.05 % decline in sugar content (Longden et al., 1975).
The values vary according to whether bolters are removed in the field and
whether the remaining plants can compensate for the gaps. Other disadvan
tages are the woody texture of the root, especially of early bolters, so
that farmers have difficulty in topping their crop properly and sugar facto
ries have to sharpen their knives more often. Finally bolters give rise to
self-sown beet in following crops, especially if early bolters are not re
moved and are allowed to shed viable seeds (Van Steyvoort & Van Stallen,
1973). Whether bolters appear in the sugar-beet crop depend on the following
factors :
agricultural practice
choice of the cultivar
- environmental conditions (temperature, daylength)
1.2 INFLUENCE OF AGRICULTURAL PRACTICE
The farmer can alter the risk of bolting by shifting the sowing date.
However, extension of the growing season by aiming at an early closing of
the canopy has proved more advantageous for yield of sugar than avoidance
of bolting. So in recent years, there has been a shift towards earlier sow
ing dates, encouraged also by the improved quality of seed from more south
erly areas.
Some other influences on bolting have been reported. Nitrogen fertilizer
and lower plant density seem to promote bolting. It seems as though all fac
tors that enhance growth promote bolting. As there are several indications
to a relationship between bolting and rapid growth, growers are unlikely to
curb bolting by changing cultivation methods : the measures against bolting
could reduce yield. So to prevent excessive bolting in sugar-beet, cultivars
resistant to bolting must be developed.
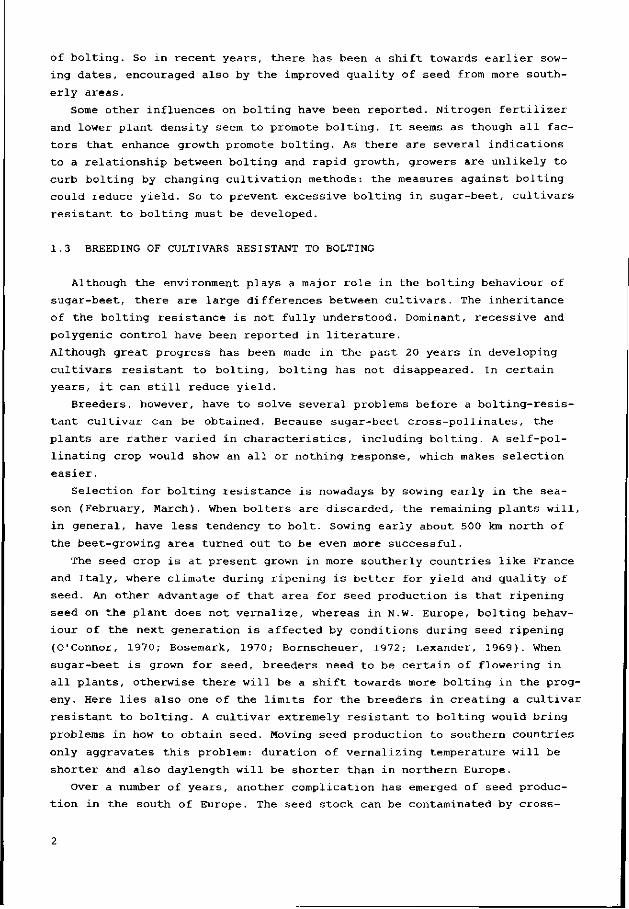
1.3 BREEDING OF CULTIVARS RESISTANT TO BOLTING
Although the environment plays a major role in the bolting behaviour of
sugar-beet, there are large differences between cultivars. The inheritance
of the bolting resistance is not fully understood. Dominant, recessive and
polygenic control have been reported in literature.
Although great progress has been made in the past 20 years in developing
cultivars resistant to bolting, bolting has not disappeared. In certain
years, it can still reduce yield.
Breeders, however, have to solve several problems before a bolting-resis
tant cultivar can be obtained. Because sugar-beet cross-pollinates, the
plants are rather varied in characteristics, including bolting. A self-pol
linating crop would show an all or nothing response, which makes selection
easier.
Selection for bolting resistance is nowadays by sowing early in the sea
son (February, March). When bolters are discarded, the remaining plants will,
in general, have less tendency to bolt. Sowing early about 500 km north of
the beet-growing area turned out to be even more successful.
The seed crop is at present grown in more southerly countries like France
and Italy, where climate during ripening is better for yield and quality of
seed. An other advantage of that area for seed production is that ripening
seed on the plant does not vernalize, whereas in N.W. Europe, bolting behav
iour of the next generation is affected by conditions during seed ripening
(O'Connor, 1970; Bosemark, 1970; Bornscheuer, 1972; Lexander, 1969). When
sugar-beet is grown for seed, breeders need to be certain of flowering in
all plants, otherwise there will be a shift towards more bolting in the prog
eny. Here lies also one of the limits for the breeders in creating a cultivar
resistant to bolting. A cultivar extremely resistant to bolting would bring
problems in how to obtain seed. Moving seed production to southern countries
only aggravates this problem: duration of vernalizing temperature will be
shorter and also daylength will be shorter than in northern Europe.
Over a number of years, another complication has emerged of seed produc
tion in the south of Europe. The seed stock can be contaminated by cross-
pollination with annual wild beets like Beta maritima and B. patellaris,
because the tetraploid pollinators used nowadays in modern breeding produce
less pollen and reach their daily pollen peak later than diploid wild beet
plants (Scott & Longden, 1970). However, breeders can test for contamination
with annual beets by growing seed stocks in long days above 20 °C.
This defect of hygiene during seed multiplication is outside the scope
of this report.
1.4 SCOPE OF THE PRESENT STUDY
Several research workers have studied the relationship of environmental
factors to bolting, including the extensive research by Chroboczek (1934)
on beetroot (red garden beet) and studies by Curth (1955; 1960; 1962; 1963).
Both workers, however, worked without growing rooms, which are essential to
quantitative measurements of influences of temperature and lightphase (day-
length ).
Chapter 2 describes, based on data from literature, the influence of light
and temperature on bolting and Chapter 5 presents trials on this matter with
four genotypes of different susceptibility to bolting. Such information
should help breeders in developing more specific selection methods to reduce
susceptibility to bolting, and to improve adaptation to local conditions.
Practical implications will probably also be found in this chapter, as breed
ers are interested in making their crosses in greenhouses to shorten the
growth cycle.
Chapter 6 analyses a relation between growth and appearance of bolters.
Chapter 7 describes techniques to relate a climatic factor like temperature
to proportion of bolters.
In recent years, bolters have not been such a severe problem in the
Netherlands. In surrounding countries, where beet can be sown very early in
the year on sandy soils, crops have bolted severely, forcing farmers to aban
don some fields for beet growing. If autumn sowing of sugar-beet should ever
become possible, extremely resistant cultivars will have to be bred, util
izing quantitative information about the bolting process.
2 Factors influencing bolting in sugar-beet
2.1 INTRODUCTION
Many extensive reviews of flowering physiology are available (Chouard,
I960; Lang, 1965; Napp Zinn, 1961, 1973; Naylor, 1961; Purvis, 1961; Zee
vaart, 1976). So only data will be reviewed here that is comparable with
the situation in beet.
Sugar-beet requires cold for flowering: a long interval of low tempera
ture for vernalization. Vernalization has two meanings: first, the physiolo
gical process in the plant; secondly, a treatment (in a cold room or in the
field) to hasten development. Vernalization induces to flower. The term 'rip
eness to flower' is used (Napp Zinn, 1973) because no external modification
can be seen at the end of the chilling period and the plant needs another
stimulus (daylength) before the apex starts to differentiate. Sugar-beet,
being a long-day plant, therefore needs chilling first, then a time with a
relatively long photoperiod at somewhat higher temperature (in the following
the words light phase or photophase will be used for daylength and photo-
period) .
Not only low temperature but also moderate or high temperature can in
fluence bolting. A relatively short time at high temperature can nullify or
moderate the effect of previous vernalizing temperatures. This phenomenon
is called devernalization.
In the normal 2-year cycle of sugar-beet, all prerequisites for flowering
are fulfilled in the second year. By overwintering, the plants have undergone
a long period of vernalizing temperatures and the plants all start bolting
when daylength gradually increases in May or June.
In the first season of growth, beets are fairly well protected against
undesired bolting. With a normal sowing date, long vernalization does not
usually occur. Moreover some authors report a juvenile phase, in which sugar-
beet in the germination or early-leaf stages is not very sensitive to low
temperature (Chroboczek, 1934).
The influence of environmental conditions will be considered in more de
tail in the following sections.
2.2 TEMPERATURE
Temperature influences many processes in the plant. Among the least under
stood is vernalization which induces the plant to flower. Although widely

used since Lyssenko introduced vernalization for germinating wheat seeds,
the mechanism of the paradoxal forcing effect of low temperature is unknown.
Chroboczek (1934) demonstrated that only part of the plant needs to be
exposed to low temperature. Winding a rubber tubing around the crown of beet
roots just below the petioles and running cold water through the coils, made
all plants flower, whereas control plants did not flower at all. Cooling
the lower part of the root caused only 10 % of the plants to flower. Also
for other rosette plants, chilling of only the apex was sufficient to obtain
flowering (Curtis & Chang, 1930). However, the influence of vernalizing tem
peratures is not restricted to apices alone, since Wellensiek (1964a) de
monstrated the possibility of vernalizing leaf cuttings of Lunaria biennis.
The earlier concept that dividing cells were a prerequisite for vernalization
was almost abandoned because, in some plants, vernalization took place under
conditions that practically excluded cell division. Instead it was thought
possible that also cells preparing themselves for division could perceive
the vernalizing action of low temperature. Likewise treatment of root seg
ments of Cichorium intybus, which are known for rapid regeneration, resulted
in flowering, although it was less effective than seed or plant vernaliza
tion (Wellensiek, 1964b).
As mitotic cells seem to play an important role in the vernalization pro
cess, some authors prefer to speak of a vernalized condition of the plant,
rather than to assume a diffusible substance accumulating during cold treat
ment. Grafting trials to transfer the vernalized condition of the donor to
the receptor almost always failed. If they were successful, photoperiod
played an important role, so it can be argued that not the immediate product
of vernalization is transmitted, but the flower-inducing end-product.
Barendse (1964) concluded from his trials with Cheiranthus allionii that
the direct vernalization effect was immobile and was translocated by cell
division only.
One way of studying vernalization is to measure organic substances in
vernalized and unvernalized plants. However one cannot be sure whether a
change in content of a substance is due to vernalization (the flower-inducing
process), to 'cold metabolism' or to other differences between vernalized
and unvernalized plants. Adequate tests must include also forms not requiring
cold. Carbohydrates, especially sucrose, were supposed to play an important
role in vernalization, since Gregory & Purvis (1938a,b) demonstrated that
vernalization of caryopses of Petkus winter rye failed in the absence of
oxygen and sufficient sugars.
Nowadays many authors try to relate the vernalization process with DNA
and RNA synthesis. According to Besnard-Wibaut (1977) induction at low tem
perature specifically acts on the axial cells of the shoot apex of Arabidop-
sis thaliana, where the DNA synthetic capacity was increased. Also Shiomi &
Hori (1973) observed an increase in DNA synthesis in vernalized barley seed
lings. In wheat embryos, Tateyama et al. (1978) found an increased content

of RNA and DNA during cold treatment compared to germination at a normal
temperature.
Numerous reports mention an increased or decreased content of several
growth substances in vernalized plants, especially the gibberellins are often
linked with the vernalization process. In sugar-beet, Margara (1967) showed
that application of GA to unvernalized plants could lead to stem elongation.
In fully vernalized plants, GA advanced the date of flowering and increased
the number of flower buds. After vernalization periods too short to obtain
total flowering, GA application was effective to complete the vernalization
process (Margara, 1960; Gaskill, 1957). Although gibberellin could be in
volved in the vernalization process, Margara (1960) did not detect differ
ences in gibberellin content between vernalized and unvernalized plants by
several biological tests. Suge (1970) measured a doubled content of gibberel
lins in response to vernalization of radish seeds or seedlings. This may,
however, have been an indirect effect of vernalization. Accumulation of gib
berellins may also occur as a consequence of vernalization, when precursors
of the gibberellins are produced during the vernalization treatment, or it
might even be a direct consequence of the flower initiation process itself.
Moreover, gibberellins cannot be considered as real flowering hormones, their
main effect being stem elongation, even in unvernalized plants under non-
inductive conditions. In Hyoscyamus ni ger, gibberellin participates in the
mechanism of flowering only by its indirect effect on stem elongation and
does not act directly on flower formation itself, according to Mugnier
(1977). In sugar-beet, content of gibberellin in apices increased sharply
just before or after visible bolting (Lenton et al., 1975), suggesting that
gibberellins are somehow involved in the expression of the vernalization
stimulus.
A different approach to vernalization is to reveal more of the kinetics
of the process by studying different conditions before, during and after
cold treatment. The effectiveness of a certain environmental condition to
induce 'ripeness to flower' can be measured as the number of leaves produced
before flowering, as the proportion of plants flowering or bolting or as
the time from chilling to first visible symptoms of flowering. In sugar-beet,
the proportion of plants flowering is often used but can depend also on tem
perature and light phase (photoperiod) after vernalization. If there is an
interaction between effectiveness of cold treatment and climatic conditions
after vernalization, the proportion of plants flowering will not be a good
measure of the effectiveness of the applied cold treatment.
The effect of cold treatment can depend on the presence of a juvenile
stage, temperature, duration of cold treatment, and on temperature after
vernalization.
A juvenile stage, in which sugar-beet is less responsive to low tempera
ture was reported by Chroboczek (1934), who found that the younger the plants

at the beginning of cold treatment, the lower the proportion of seed stalks.
He also suggested that low temperature might have no less effect at that
stage but that subsequent devernalizing temperatures were more effective in
young plants. Margara (1960) found no flowering when plants were vernalized
at the cotyledonary stage, not even under subsequent continuous illumination.
However in his trial temperatures after vernalization were rather high
(18-22 °C), so devernalization may have played a role. Gaskill (1963) and
Curth (1955), the latter with Steckling beet, observed that age of plants
at the time of cold treatment was positively correlated with the proportion
of bolters.
In beetroot, Junges (1959), also observed that older plants could be ver
nalized more readily. In his trial, there could, however, have been some
induction of older plants before vernalization, as temperature during raising
was rather low, 10-15 °C. The same holds for Voss (1936) for fodder beet.
Wood & Scott (1975) sowed sugar-beet in autumn but encountered excessive
bolting in the following spring, except for plots sown late in autumn, per
haps because of a juvenile stage.
By contrast, Heide (1973) showed that beetroots were responsive to low
temperature at any age, though the sensitivity to chilling increased some
what with age. Kloen (1952) and Wiebosch (1965) indeed found that even seed
of sugar-beet could be vernalized. Even in immature seed on the mother plant,
vernalization seems possible (Lexander, 1969; O'Connor, 1970; Scott &
Jaggard, 1978; Bosemark, 1970).
The literature does not agree on optimum temperature of vernalization,
of which several have been reported. Curth (1960) states 3 °C for Steckling
beets, Fife & Price (1953) 6 °C, Bachmann et al. (1963) 8 °C, Stout (1946)
6-9 °C, Curth (1962) normally 4 °C and with a 'photothermic' treatment (si
multaneous low temperature and long light phase) 8 °C and Lasa & Silvan
(1976) with 'photothermal' treatment also 8 °C.
The duration of vernalization influences proportion of plants flowering.
Plants longer exposed to low temperature, more bolt and the first bolters
appear sooner after cold treatment (Curth, 1955; Heide, 1973; Wellensiek &
Verkerk, 1950). The minimum duration of the cold period depends on cultivar,
since unsusceptible cultivars require far stronger induction than suscept
ible ones.
Chroboczek (1934 ) was probably the first research worker who did systema
tic research with beetroot on the influence of temperature after vernaliza
tion. High temperature (21-27 °C) tended to reverse the effects of previous
cold treatment. But this reversal could be counteracted by extending cold
treatment and also by extending the light phase up to continuous illumina
tion. Heide (1973) also mentions interactions between daylength and deverna-
lizing temperatures in beetroot: shorter light phase allowed reversal at
lower temperature (18 °C or more) than did a longer light phase (24 °C or
more). Apart from the influence of high temperature as such, duration of
the warm period is decisive: Curth (1960) found complete reversal with 25
days at 30 °C. Curth also found that the region of the growing point is the
receptor of temperature, as for vernalization.
In crops like wheat or rye, devernalization occurs especially when plants
are exposed to high temperature immediately after vernalization (Purvis &
Gregory, 1952). After a long cold treatment or when vernalization is followed
by a rather short period of intermediate temperature (12-15 °C), the process
of vernalization was assumed to be fixed and high temperature could not exert
a devernalizing influence anymore. This fixation is often called stabiliza
tion. In Arabidopsis thaliana, however, devernalization can occur irrespec
tive of the length of the vernalization period (Napp Zinn, 1957). But Napp
Zinn showed that also in A. thaliana the devernalizing action of high temper
ature strongly depends on the time elapsed after the end of the cold treat
ment, immediately after vernalization being the most effective.
For beet, there is little evidence whether a stage or condition is ever
reached where vernalization is fixed or 'stabilized': in certain other
plants, certain treatments result in fixation and reversal is no longer pos
sible.
2.3 LIGHT PHASE
Photoperiodism is a response to the phase and period of light and dark
ness. Incident radiant energy above a certain threshold is of secondary im
portance. When sugar-beet is vernalized, it behaves as a long-day plant:
stem elongation and subsequent flowering is advanced and accelerated in pro
portion to light phase. Response depends largely on duration of previous
cold treatment. Usually there is no response without cold treatment.
According to Schneider (1960), the apex of sugar-beet starts to differ
entiate only after cold treatment. During cold treatment lasting 84 days,
he observed no changes in the structure of the growing point. Obviously,
after chilling, a certain time with suitable light phase and good growing
conditions were required for actual stem and flower formation.
Curth (1960) measured the influence óf daylength. In sugar-beet chilled
for a given time, continuous illumination was slightly superior to a light
phase of 21 h. With shorter light phase, response decreased sharply until
with 8 h stems did not elongate and no plants flowered. Also after the stem
started elongating, a long photophase was still required. Margara (1960)
reported a standstill of stem elongation and a delay in flowering after
transfer from long to short photophase. Usually the plants start to form a
rosette of leaves again and even the root starts to swell again at the top.
Margara observed that transfer back to long photophase after protracted shoi

photophase no longer provoked flowering. This phenomenon is often called
'SD devernalization' but I restrict the words vernalization and reversal
(devernalization) to temperature-dependent processes.
Research workers usually study light phase with incandescent tungsten
lamps to extend natural daylight. For sugar-beet Curth (1960) found low lu
minous flux densities (areic luminous flux) to be sufficient. Above 100-200
lx, an increase in flux from tungsten lamps did not advance bolting. During
that extension of daylight, such a flux allows negligible photosynthesis
and avoids differences in growth rate.
Curth (1960) also studied the influence of spectral distribution of sever
al light sources used for daylength extension. Most effective for photoperi-
odical responses were sources with a peak of luminous flux density in the
blue or orange-red regions. Sources with a peak in the green region were
less effective.
Lane et al. (1965) compared red light (wavelength 600-700 nm) with far-
red light (700-770 nm) for daylength extension. In an annual sugar-beet
strain, far-red extension was more effective to obtain flowering plants than
red light. In other plants, however, like henbane and petunia, a mixture of
red and far-red was superior. Of the luminous flux from incandescent lamps
in the waveband 600-770 nm, half is red and half far-red.
In floral initiation, plants perceive photoperiod by the leaves (Withrow
et al., 1943; Naylor, 1961; Lang, 1952). The pigment phytochrome is likely
to be involved as the receptor of the daylength stimulus, considering the
red and far-red action spectra.
For phytochrome, there are two types of reactions: induction-reversion
reactions and 'high-irradiance' reactions. Involvement of phytochrome in a
ligth mediated response requires that an induction effect by a pulse of red
light can be fully reversed by a subsequent pulse of far-red light. With an
exposure time of less than 5 min, the action spectrum for the induction of
a light-mediated response shows a peak at wavelength 660 nm and reflects
the absorption spectrum of the red-absorbing form of phytochrome (P_).
The high-irradiance reaction occurs with prolonged irradiation (e.g. day-
length extension). Its action spectrum is completely different from the in
duction spectrum: always a peak in the far-red region of the spectrum (wave
length 700-730 nm) and several peaks in the blue region of the spectrum
(Schäfer, 1976). Curth (1960) and Lane et al. (1965) reported peaks of the
action spectra in the blue and red to far-red regions for beet, suggestive
of the high-irradiance reaction.
2.4 INTERACTIONS BETWEEN LIGHT PHASE AND TEMPERATURE
The most common interaction between the effects of daylength and temper
ature is that unvernalized plants fail to respond to light phase. The 'cri-

tical photophase1 seems to shift with the degree of vernalization. For un-
vernalized plants, the threshold is apparently so high that the stem does
not elongate with long photophases. In other words, the vernalized condition
seems to lower the critical photoperiod: sufficiently vernalized plants do
not need an extremely long photophase to bolt. Fife & Price (1953) showed
complete substitution of vernalization and light phase for sugar-beet. When
Steckling beets were vernalized at 4 °C for extremely long (100-300 d),
plants bolted and flowered at 21 °C, even in complete darkness.
For beetroot, Heide (1973) reported bolting and flowering in continuous
light, without any cold treatment at temperatures usually considered as 'ver
nalizing', but temperature in his trial was not above 18 °C.
2.5 GROWTH AND BOLTING
Several research workers have pointed out a connexion between growth and
bolting in sugar-beet. Usually a vigorous early growth leads to more bolters ;
inhibiting circumstances on the other hand reduce bolting. According to
Röstel (1968) there is a positive correlation between the proportion of bol
ters and soil fertility. Röstel also reported a positive influence of irri
gation on bolting. He stated that bolting resistance was more needed when
growth-stimulating cultural practices were successful. Many reports deal
with the influence of nutrient supply, especially nitrogen,-on the proportion
of bolters (Mann, 1951; Gorodnii & Sereda, 1975; Hoekstra, 1960; Lüdecke,
1938; Schneider, 1960; Lysgaard, 1978).
Also an influence has been reported of plant density, which affects in
dividual plant growth, (Jorritsma, 1978), lower plant densities causing more
plants to run to seed. Warne (1949) observed in an experiment that border
row plants had a greater tendency to bolt. Dowker & Jackson (1975) observed
the same phenomena in carrots.
Good growing conditions clearly promote the tendency to run to seed for
these species.
10

3 Models for bolting
Several models have been elaborated for the flower-promoting action of
low temperature and of subsequent light phase.
3.1 MODELS IN LITERATURE BASED ON (HYPOTHETICAL) PLANT HORMONES
Lang & Melchers (1947) and Purvis & Gregory (1952) conceived of two reac
tions within the plant: synthesis of a flower-promoting substance B and des
truction of this substance (Figure 1).
Reaction 1 was thought to proceed even at low temperatures, but the rate
of Reaction 2 is low at low temperatures and increases with temperature much
more rapidly than for Reaction 1. At low temperature, substance B would ac
cumulate and at higher temperature destroyed (converted to C, or perhaps
back to A). At moderate temperature, B was thought to be converted by Reac
tion 3 to D, which was not destroyed by high temperature. So after a few
days at these moderate temperature reversal was no longer possible. Reaction
3 might be governed by light phase, whereas Reaction 1 and 2 might be inde
pendent of daylength. Substance B might be identical with the hypothetical
substance vernalin, considered to build up during vernalization (Melchers,
1939), and D might be the final flowering substance florigen. In this model
'vernalin' is a precursor of florigen.
Another model to explain experimental results was that of Napp Zinn (1957).
He assumed the more complicated system of several 'labile' and 'stable' stages
in vernalization, some of which, however, could be bypassed.
As Chouard (1960) states: 'these formulations are handy to memorize and
they stimulate further investigations on hypothetical substances, but they
provide no more clarification than the authors' description of their own
results. Further they may require adjustment for each new discovery and they
also change for each plant type that behaves in a particular way and does
not fit the particular representation'.
B
Fig. 1. Reactions in induction of flowering (Lang & Melchers, 1947). Reaction 1, synthesis of a flower-promoting substance B; Reaction 2, destruction of the substance.
11

A major assumption of the models is build-up of a substance, usually call
ed vernalin, during vernalization. This substance could be a precursor of
florigen or could, together with light phase, regulate florigen formation.
However there is no experimental evidence for 'vernalin', in contrast to
the final flowering hormone(s).
3.2 A MATHEMATICAL MODEL FOR BOLTING IN SUGAR-BEET
To account for the experimental results for sugar-beet of Chapter 5, a
different approach was necessary: as it is likely that the flowering process
as a whole is a dynamic, continuous and quantitative process, a relational
diagram was drawn with the conventions of Forrester (1961), like models used
in simulation studies (Figure 2 ) .
The rectangles in the model represent a quantity of specific substances.
Such a quantity is subject to change, the rates of which are indicated with
valve symbols. Factors influencing the rate of these changes are drawn with
dotted arrows. Flow of material (substance) is drawn with solid arrows. The
model assumes two substances:
V: A substance resulting from vernalization.
F: A final flowering substance. The term flowering substance needs explana
tion as this publication reports only 'bolting'. In the trials, bolting was
always followed by flowering. According to Heide (1973) the period between
visible bolting and flowering is almost constant. Stem elongation and flower
ing may, however, differ in physiological mechanism. An illustration was
given by Curtis (1964), who showed in a grafting experiment that flowering
could occur without previous stem elongation. Under normal circumstances,
however, it may be assumed that conditions favouring the synthesis of sub
stances involved in stem elongation also favour the synthesis of the flower
ing substance.
The model distinguishes the following processes.
Process I (vernalization) is the synthesis of a substance V at a rate that
is positively temperature-dependent but still proceeds at low temperature.
Process II (devernalization) is the breakdown of V at a rate that is also
temperature-dependent. At low temperature, Process II is slower than Process
I . So after a long time in the cold, a considerable amount of substance V
is available, because Process II is practically still.
Process III is the synthesis of a final flowering substance F. After vernali
zation, synthesis of F starts, if temperature is raised and light phase (pho-
toperiod) is long. The rate of synthesis of F is (in this quantitative model)
determined by three conditions.
12

PROPORTION
BOLTING
Fig. 2. Relational diagram of a simple model for the bolting process in sugar-beet. Substance V i s hypothetical and is involved in vernalization. Substance F i s thought to be associated with one or more flowering hormones. Solid lines mean flow of substance. Dotted lines are transfer of information: e.g. dotted line e means that the amount of V, together with photophase (f) and temperature (g), regulates the rate of synthesis of F.
- The l i g h t phase i n f l u e n c e s t h e r a t e of s y n t h e s i s of F, l o nge r l i g h t p h a s e
s peed ing up t h i s r a t e ( r e l a t i o n f i n t h e mode l ) .
- A f t e r l onge r c o l d t r e a t m e n t s , b o l t e r s appear sooner and i n l a r g e r number.
So t h e r e must be a r e l a t i o n between t h e amount of V and t h e r a t e of s y n t h e
s i s of F ( F i gu r e 2 , r e l a t i o n e ) : t h e l a r g e r t h e amount of V, t h e h i g h e r t h e
r a t e of s y n t h e s i s of F .
- Tempera ture must a l s o i n f l u e n c e s y n t h e s i s of F, s i n c e most b i ochemica l
r e a c t i o n s a r e t empe r a t u r e - d ependen t , h i g h e r t e m p e r a t u r e s a c c e l e r a t i n g s yn -
13
thesis and since synthesis also might uepend on the growth rate of the.
plants, which is itself a temperature-dependent process. Rapid expansion of
leaf area or leaf number accelerates reception of the light phase. Favour
able conditions of growth have increased the number of bolting plants in
some cases (relation g in the model).
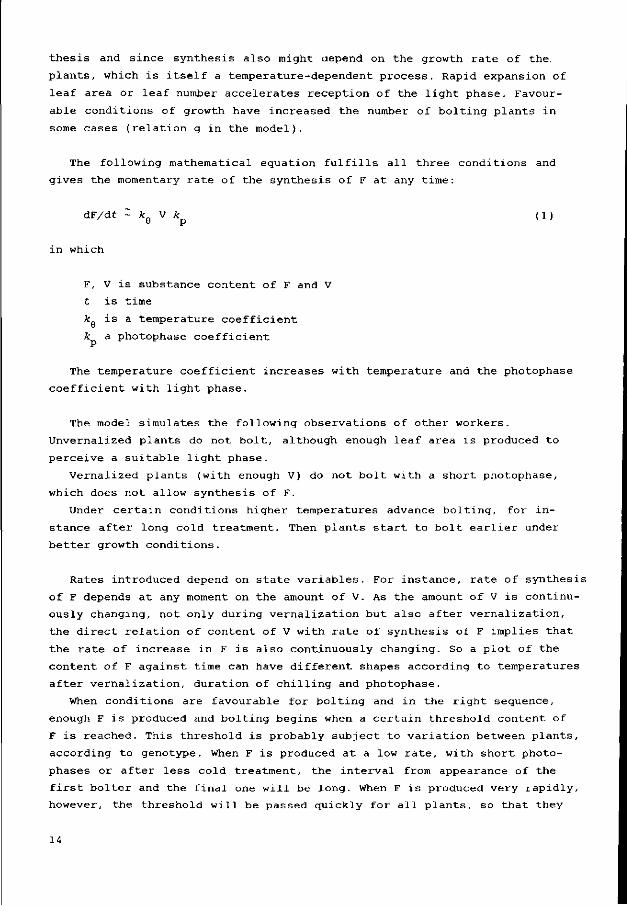
The following mathematical eguation fulfills all three conditions and
gives the momentary rate of the synthesis of F at any time:
dF/dt ~ kQ V * p (1)
in which
F, V is substance content of F and V
t is time
k is a temperature coefficient
k a photophase coefficient
The temperature coefficient increases with temperature and the photophase
coefficient with light phase.
The model simulates the following observations of other workers.
Unvernalized plants do not bolt, although enough leaf area is produced to
perceive a suitable light phase.
Vernalized plants (with enough V) do not bolt with a short photophase,
which does not allow synthesis of F.
Under certain conditions higher temperatures advance bolting, for in
stance after long cold treatment. Then plants start to bolt earlier under
better growth conditions.
Rates introduced depend on state variables. For instance, rate of synthesis
of F depends at any moment on the amount of V. As the amount of V is continu
ously changing, not only during vernalization but also after vernalization,
the direct relation of content of V with rate of synthesis of F implies that
the rate of increase in F is also continuously changing. So a plot of the
content of F against time can have different shapes according to temperatures
after vernalization, duration of chilling and photophase.
When conditions are favourable for bolting and in the right sequence,
enough F is produced and bolting begins when a certain threshold content of
F is reached. This threshold is probably subject to variation between plants,
according to genotype. When F is produced at a low rate, with short photo-
phases or after less cold treatment, the interval from appearance of the
first bolter and the final one will be long. When F is produced very rapidly,
however, the threshold will be passed quickly for all plants, so that they
14

will bolt in a few days. For example, wnen sugar-beet is grown for seed,
plants vernalized during the winter have produced a considerable amount of
V; in May or June when the light phase is adequate and the raised temperature
has allowed formation of several leaves, synthesis of F is unlimited.
Although the model is probably much too simple, it accounts for most of
the observations reported in the literature. Its framework can be extended
and modified to results reported in Chapter 5. The model can serve as an
aid in quantitative interpretation of these results. Although the proposed
model is based on the experimental results, it is presented already at this
point of the manuscript to make it easy for the reader to instantly compare
the results of the experiments with the model.
15

4 Materials and methods
4.1 PLANT MATERIAL
The cultivars used in growing rooms, greenhouses and in the field differed
widely in susceptibility to bolting (Table 1 ) . Because sugar-beet is cross-
pollinated, each cultivar, even a single cross, would include different geno
types. Most trials were with four single crosses (G1-G4) supplied by the
breeding firm D.J. van der Have B.V. (Kapelle). Commercial cultivars were
sometimes included. For most indoor trials, each treatment consisted of 20
plants in two replicates of 10 placed randomly. Trials were of factorial
design.
4.2 FIELD TRIALS
Triald fields were at three sites near Wageningen in the years 1975-1978:
- Wageningen-Hoog on a coarse-sand soil with a low content of organic matter.
- Wageningen (Haarweg, on the western outskirt of Wageningen) on a heavy-clay
soil.
- Achterberg (near Rhenen to the west of Wageningen) on a black peat soil.
The experimental design was randomized blocks or split plots. In 1975 and
1976, daylength was extended in the field with incandescent light from bulbs
of 100 W at a height of 1.5 m above the ground and with 1 bulb for every 2
5 m . At plant height this resulted in an areic luminous flux of 50-110 lx,
according to distance from the bulb. For technical reasons, the assigned
subblocks could not all be lit at the same time. So, some were lit from sun-
Table 1. Cultivars used in the project.
Code
Gl G2 G3 G4 G5 G6 G7 G8 G9 G10 Gil
Cultivar
P2272 35848-74 35872-74 P6672 Donor Kawepoly Monohil Monokuhn Polykuhn Zwaanpoly MK711
Type
singl singl singl singl comm. comm. comm. comm. comm. comm. test
s cross s cross s cross s cross cultivar cultivar cultivar cultivar cultivar cultivar
cultivar
Bolting resistance
strong rather stro low very low strong rather low rather stro rather low rather low
ng
ng
rather strong low
Breeder
D.J. van der Have D.J. van der Have D.J. van der Have D.J. van der Have Hilleshög Fro Kleinwanzleben Hilleshög Fro Kuhn & Co Kuhn & Co Zwaanesse Kuhn & Co
16

Light phase(h)
21
daylength • extension
natural daylength N • civil twilight
natural daylength 52° N
April May June July Aug. Sept.
Fig. 3. Daylength in the Netherlands in the period April-September (LI) and light phase in field trials at Wageningen extended with incandescent bulbs (L2).
set till 00h30, the rest from OlhOO till sunrise. At Wageningen, astronomical
midnight is 00h45. The sequence was reversed every week. The control sub-
blocks were protected from illumination by their distance from the light
source (at least 3 m for the nearest plots) and by plastic shades. The day-
length (light phase) so obtained is shown in Figure 3. For the unlit plots,
the graph of daylength + civil twilight probably reflects the effective day-
length.
4.3 INDOOR TRIALS
The Department of Field Crops & Grassland Science of the Agricultural
University at Wageningen provided growing rooms for raising plants, cold
treatment and subsequent treatments as follows.
4.3.1 Growing rooms
Six growing rooms 4.5 m x 3.2 m x 2.2 m, regulated in temperature, humid
ity and partial pressure of carbondioxide, were used. Areic radiant power 2
in the waveband 400-10.000 nm was 125 W/m and in the waveband 400-700 nm
80 W/m2 from 187 'TL' MF 140 W/33 + 17 'TL'M 140 W/33 fluorescent tubes,
together with 18 incandescent bulbs of electrical power 150 W and 18 incan
descent bulbs of 100 W. That areic radiant power in the visible spectrum
corresponded to an areic luminous flux of about 20 klx, according to data
of Gaastra (1959). In the middle of these cells temperature could be kept
constant to within about 0.4 °C. Near the cell walls, however, temperature
could deviate about 1 °C from the desired value. By moving the plants, placed
on carts, at least twice a week around the cells, differences due to position
were reduced. These cells were used mainly for raising plants and for treat
ments after chilling.
17
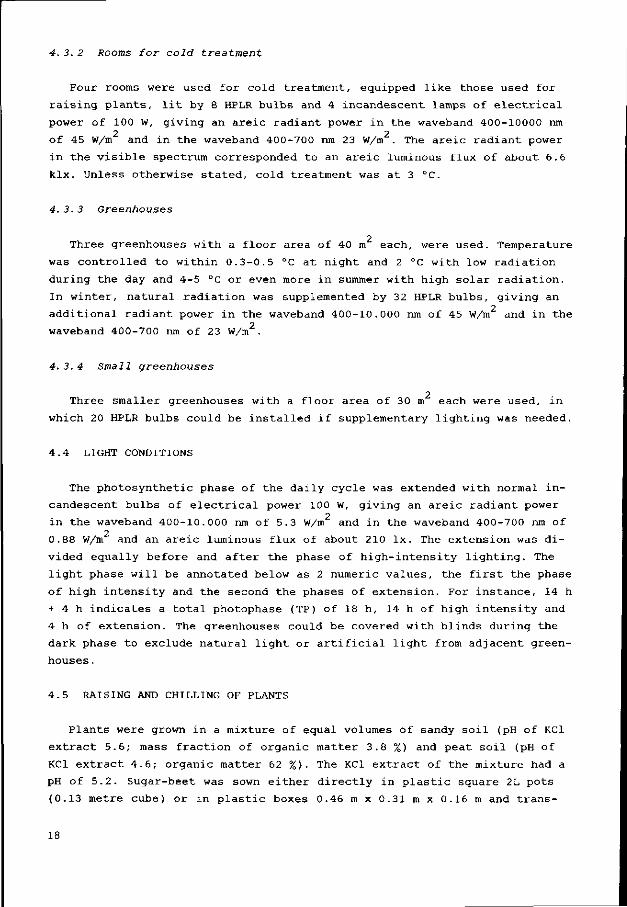
4. 3. 2 Rooms for cold treatment
Four rooms were used for cold treatment, equipped like those used for
raising plants, lit by 8 HPLR bulbs and 4 incandescent lamps of electrical
power of 100 W, giving an areic radiant power in the waveband 400-10000 ran 2 2
of 45 W/m and in the waveband 400-700 nm 23 W/m . The areic radiant power
in the visible spectrum corresponded to an areic luminous flux of about 6.6
klx. Unless otherwise stated, cold treatment was at 3 °C.
4. 3. 3 Greenhouses
2 Three greenhouses with a floor area of 40 m each, were used. Temperature
was controlled to within 0.3-0.5 °C at night and 2 °C with low radiation
during the day and 4-5 °C or even more in summer with high solar radiation.
In winter, natural radiation was supplemented by 32 HPLR bulbs, giving an
;he 2
2 additional radiant power in the waveband 400-10.000 nm of 45 W/m and in the
waveband 400-700 nm of 23 W/m
4. 3. 4 Small greenhouses
2 Three smaller greenhouses with a floor area of 30 m each were used, in
which 20 HPLR bulbs could be installed if supplementary lighting was needed.
4.4 LIGHT CONDITIONS
The photosynthetic phase of the daily cycle was extended with normal in
candescent bulbs of electrical power 100 W, giving an areic radiant power 2
in the waveband 400-10.000 nm of 5.3 W/m and in the waveband 400-700 nm of
2
0.88 W/m and an areic luminous flux of about 210 lx. The extension was di
vided equally before and after the phase of high-intensity lighting. The
light phase will be annotated below as 2 numeric values, the first the phase
of high intensity and the second the phases of extension. For instance, 14 h
+ 4 h indicates a total photophase (TP) of 18 h, 14 h of high intensity and
4 h of extension. The greenhouses could be covered with blinds during the
dark phase to exclude natural light or artificial light from adjacent green
houses .
4.5 RAISING AND CHILLING OF PLANTS
Plants were grown in a mixture of equal volumes of sandy soil (pH of KCl
extract 5.6; mass fraction of organic matter 3.8 %) and peat soil (pH of
KCl extract 4.6; organic matter 62 % ) . The KCl extract of the mixture had a
pH of 5.2. Sugar-beet was sown either directly in plastic square 2L pots
(0.13 metre cube) or in plastic boxes 0.46 m x 0.31 m x 0.16 m and trans-

planted into the square pots after chilling. When seed was sown in boxes,
heat-sterilized soil was used to prevent infection by soil pathogens. Ten
rows were sown in each box and after emergence thinned in the row to a dis
tance of 2 cm between seedlings. Usually the plants were grown in the six
raising rooms (Section 4.3.1) with a light phase 14 h + 0 h and temperature
15 °C until the first true leaves were about 2-3 cm. Boxes or pots were then
transferred to the cold rooms. When chilling or light phase was not under
test, a temperature of 3 °C and a light phase of 14 h + 0 h was used.
When the duration of chilling or plant age before chilling was a factor
in the experiment, sowing and chilling were started on such dates that the
cold treatments could be finished on the same date, so that all plants were
under identical conditions from then on. When the plants were sown in boxes,
they were usually kept a week at 10 °C after the cold treatment before trans
planting into the square 2L pots and transferred to either growing rooms or
greenhouses, where light phase or temperature were varied, 15 °C and a phase
of high-intensity of 14 h being the basic conditions. Immediately after the
transfer, however, the plants were usually kept yet another week at 10 °C
to acclimatize after transplanting. The plants received 100 ml of a nutri
tion solution at least once a week according to growth stage (Table 2).
Although the plants were grown in small pots to save floor space and would
lose some nutrients by percolation, they grew vigorously in all trials.
Times of changes in conditions during growth are expressed as far as possi
ble with respect to the date of sowing until cold treatment and with respect
to ending of cold treatment thereafter.
Table 2. Composition of the nutrient solution for sugar-beet grown indoors.
8
8
5
3
ml
ml
ml
ml
2
3
Ca (N03)2 (1 mol/1)
KNO (2 mol/1)
KH^PO, (1 mol/1) 2 4
of a solution containing:
g MnCl2.4H20/l
g H3BO3/I
0.5 g ZnSO .7H 0/1
0.1 g CuSO4-5H20/l
0.1 g Mo03/1
2 ml of a solution containing 35 g FeEDTA/1
5 ml MgS04 (1 mol/1)
69 ml HO
100 ml
19
4.6 OBSERVATIONS
In the field and indoors number of beet bolting was recorded regularly,
sometimes twice a week. A plant was considered a bolter when the stem had
elongated by at least 5 cm. When batches were harvested periodically, plants
were separated in leaf blades, petioles and beet root. Leaf area of young
plants was measured with an electronic device and of older plants by matching
the leaves against photocopies of leaves of known area. Yield of dry matter
was estimated by drying at 105 °C for at least 18 h.
4.7 STATISTICS
Data were processed on the DEC-10 computer of the Agricultural Universi
ty, either with Fortran programs or with SPSS (Statistical Package of the
Social Sciences). Data on the proportion of bolters were transformated (arc-
sine-method) for statistical analyses to obtain a more normal distribution
(Bliss, 1937).
20

5 Results
5.1 THE JUVENILE STAGE AND VERNALIZATION
The possibility of a juvenile stage in sugar-beet is of considerable re
levance to undesired bolting. Figure 4 shows the average course of tempera
ture during spring in the Netherlands. If temperatures below about 11 °C
vernalize, the process can continue for the whole day until about 10 April.
By then, plants in the Netherlands are usually germinating or in the cotyle-
donary stage. The following trials were designed to test for vernalization
in these early stages.
5. 1. 1 Effect of daylength and covering with plastic
5.1.1.1 Introduction
In 1976 at Wageningen-Hoog, emergence was accelerated by covering the
seed-bed with a perforated polyethene sheeting. If a juvenile stage exists,
such a treatment should increase proportion of bolters because it would
shorten this stage. The light phase was also extended with artificial light
(Section 4.2).
Temperature CO 26 f
22
18
14
10
6
2 0
-2
/
-—.
maximum temperature
f. / _ ,•"" minimum
' / • "" temperature
* MARCH APRIL MAY JUNE JULY AUG.
Fig. 4. Average course of temperature (minimum and maximum) from March to September in the Netherlands (data for De Bilt near Utrecht).
21
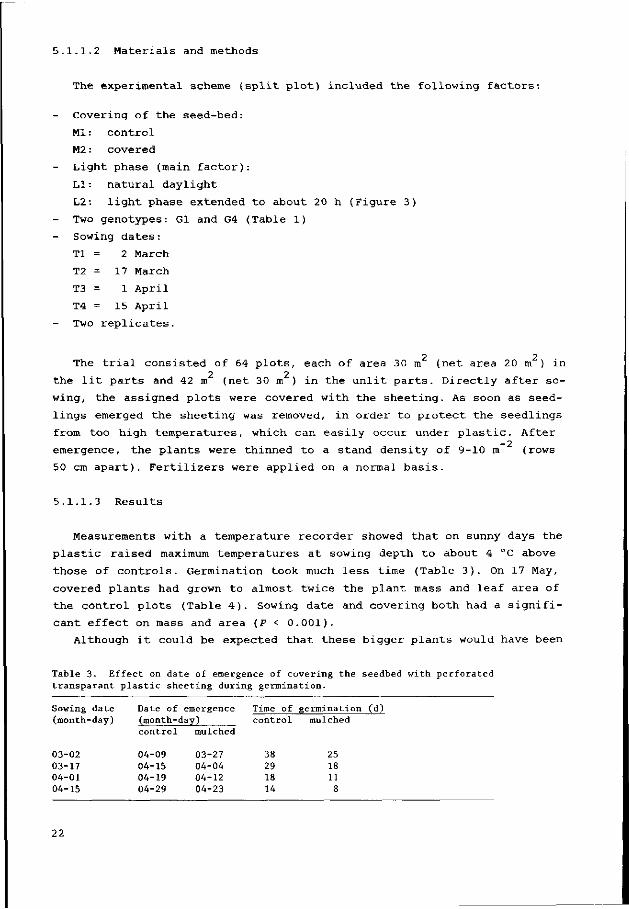
5.1.1.2 Materials and methods
The experimental scheme (split plot) included the following factors:
Covering of the seed-bed:
Ml : control
M2: covered
Light phase (main factor):
LI: natural daylight
L2: light phase extended to about 20 h (Figure 3)
Two genotypes: Gl and G4 (Table 1)
Sowing dates:
Tl = 2 March
T2 = 17 March
T3 = 1 April
T4 = 15 April
Two replicates.
2 2 The trial consisted of 64 plots, each of area 30 m (net area 20 m ) in
2 2
the lit parts and 42 m (net 30 m ) in the unlit parts. Directly after so
wing, the assigned plots were covered with the sheeting. As soon as seed
lings emerged the sheeting was removed, in order to protect the seedlings
from too high temperatures, which can easily occur under plastic. After -2
emergence, the plants were thinned to a stand density of 9-10 m (rows 50 cm apart). Fertilizers were applied on a normal basis.
5.1.1.3 Results
Measurements with a temperature recorder showed that on sunny days the
plastic raised maximum temperatures at sowing depth to about 4 °C above
those of controls. Germination took much less time (Table 3 ) . On 17 May,
covered plants had grown to almost twice the plant mass and leaf area of
the control plots (Table 4 ) . Sowing date and covering both had a signifi
cant effect on mass and area (P < 0.001).
Although it could be expected that these bigger plants would have been
Table 3. Effect on date of emergence of covering the seedbed with perforated transparant plastic sheeting during germination.
Sowing (month-
03-02 03-17 04-01 04-15
date •day)
Date of emergence (month-day) control
04-09 04-15 04-19 04-29
mulched
03-27 04-04 04-12 04-23
Time of control
38 29 18 14
Re rmination (d) mulched
25 18 11
8
22
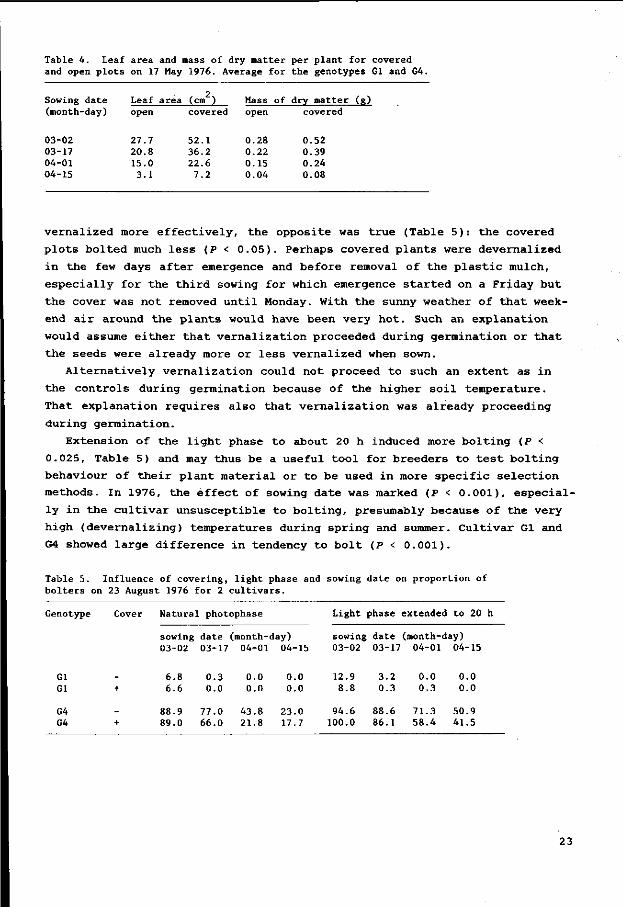
Table 4. Leaf area and mass of dry matter per plant for covered and open plots on 17 May 1976. Average for the genotypes Gl and G4.
Sowing date (month-day)
03-02 03-17 04-01 04-15
Leaf open
27.7 20.8 15.0 3.1
area ( 2, (cm ) covered
52.1 36.2 22.6 7.2
Mass o open
0.28 0.22 0.15 0.04
f dry matter (g) covered
0.52 0.39 0.24 0.08
v e r n a l i z e d more e f f e c t i v e l y , t h e o p p o s i t e was t r u e (Table 5 ) : t h e covered
p l o t s b o l t e d much l e s s (P < 0 . 0 5 ) . Pe rhaps covered p l a n t s were d e v e r n a l i z e d
i n t h e few days a f t e r emergence and b e f o r e removal of t h e p l a s t i c mulch,
e s p e c i a l l y f o r t h e t h i r d sowing fo r which emergence s t a r t e d on a F r i d ay b u t
t h e cover was n o t removed u n t i l Monday. With t h e sunny wea the r of t h a t week
end a i r a round t h e p l a n t s would have been v e r y h o t . Such an e x p l a n a t i o n
would assume e i t h e r t h a t v e r n a l i z a t i o n p roceeded d u r i ng g e rm ina t i on o r t h a t
t h e s e eds were a l r e a d y more or l e s s v e r n a l i z e d when sown.
A l t e r n a t i v e l y v e r n a l i z a t i o n cou ld no t p roceed t o such an e x t e n t a s i n
t h e c o n t r o l s d u r i ng g e rm ina t i on because of t h e h i g h e r s o i l t e m p e r a t u r e .
That e x p l a n a t i o n r e q u i r e s a l s o t h a t v e r n a l i z a t i o n was a l r e a d y p r o c e ed i ng
d u r i ng g e rm in a t i o n .
Ex t en s i on of t h e l i g h t phase t o abou t 20 h i nduced more b o l t i n g (P <
0 . 025 , Tab le 5) and may t h u s be a u s e f u l t o o l f o r b r e e d e r s t o t e s t b o l t i n g
b ehav iou r of t h e i r p l a n t m a t e r i a l o r t o be u sed i n more s p e c i f i c s e l e c t i o n
methods . In 1976, t h e e f f e c t of sowing d a t e was marked (P < 0 . 0 0 1 ) , e s p e c i a l
l y i n t h e c u l t i v a r u n s u s c e p t i b l e t o b o l t i n g , p resumably b ecause of t h e v e r y
h i gh ( d e v e r n a l i z i n g ) t empe r a t u r e s d u r i ng s p r i n g and summer. C u l t i v a r Gl and
G4 showed l a r g e d i f f e r e n c e i n t endency t o b o l t (P < 0 . 0 0 1 ) .
Table 5. Influence of covering, l ight phase and sowing date on proportion of bolters on 23 August 1976 for 2 cul t ivars .
Genotype Cover Natural photophase
sowing date (month-day) 03-02 03-17 04-01 04-15
Light phase extended to 20 h
sowing date (month-day) 03-02 03-17 04-01 04-15
Gl Gl
G4 G4
6.8 6.6
88.9 89.0
0.3 0.0
77.0 66.0
0.0 0.0
43.8 21.8
0.0 0.0
23.0 17.7
12.9 8.8
94.6 100.0
3.2 0.3
88.6 86.1
0.0 0.3
71.3 58.4
0.0 0.0
50.9 41.5
23

5.1.2 Effect of germination temperature
5.1.2.1 Introduction
In 1977, temperature of soil at germination depth was kept down by cover
ing field plots with plates of polystyrene insulating material 2 cm thick.
This was very effective in keeping the soil temperature low at sowing depth.
5.1.2.2 Materials and methods
The experimental field at Wageningen-Hoog was laid out in a factorial
block design with plots 4 m x 2.5 m including the following factors:
Three sowing dates: 3 and 15 March and 5 April; only cultivar Gl (unsus
ceptible to bolting) was sown.
Some plots were covered with 3 polystyrene plates (1.22 m x 2.44 m x
0.02 m) as soon as possible after sowing. Immediately after emergence of
the first plants in a plot, the plates were removed.
Sowing of ready germinated seed. Seed was soaked for 2 h in running water
at 25 °C, and allowed to germinate for 20 h between two layers of filter pa
per at a temperature of 20/30 °C (day/night cycle) in an incubator. At sow
ing, almost all seeds were visibly germinated.
Four replicates.
All combinations were included, so that the trial consisted of 48 plots.
Temperature was recorded with a Flat-Bat 24-points recorder in covered and
Maximum daily temperature at sowing depth (°C)
20
16
12
y » D O : contro l plots ( )
^S-.̂ "~ .£-o' ; A » » : plots with polystyrene cover ( )
4 -
oU 1- MARCH APRIL MAY
Fig. 5. Maximum soil temperatures at sowing depth as influenced by covering (filled symbols) with polystyrene plates in 1977. AA, sown 3 March; DB, sown 15 March, 0*, sown 5 April.
24

Table 6. Influence of covering the seedbed with polystyrene plates during germination on the date of emergence, areic number of plants (stand density) and proportion of bolters on 4 October 1977 for ready germinated and control seed.
Date of (month-day)
sowing covering removal
03-03 03-03
Mean
03-03 03-03
Mean
03-15 03-15
Mean
03-15 03-15
Mean
04-05 04-05
Mean
04-05 04-05
Mean
control control
03-07 03-22 03-07 03-22
control control
03-15 04-18 03-15 04-06
control control
04-06 05-02 04-06 05-02
Ready germinated
+
+
+
+
+
+
Date of emergence (month-day)
03-23 03-20
03-27 03-25
04-10 04-04
04-30 04-20
04-30 04-30
05-04 05-04
Areic Proportion number of bolters (%) (m^)
9.3 8.1
(8.7)
3.9 4.1
(4.0)
10.3 10.0
(10.1)
5.0 3.7
(4.3)
11.1 10.3
(10.7)
5.9 5.2
(5.6)
(P < 0 (P < 3 (P < 0
6.5 4.6
(5.5)
13.8 13.7
(13.8)
1.7 1.7
(1.7)
8.2 5.6
(6.9)
0.3 0.0
(0.1)
0.9 2.0
(1.4)
1%) (P < 0.1%) 9%) ( n.s.) 1%) (P < 0.1%)
Significance of the effects of: Sowing date Imbibition e tc . Polystyrene plates
open p l o t s a t sowing d ep t h . A f t e r comple te emergence, p l a n t s were t h i n n e d _2
t o o b t a i n , i f p o s s i b l e , a s t a nd d e n s i t y of 10 m
5 . 1 . 2 . 3 R e s u l t s
With polystyrene plates, the seed-bed was 4-6 °C cooler, somewhat differ
ent for each sowing date (Figure 5). However, the plates also hindered ger
mination, possibly because of saturation of the seed-bed with condensation
water from the plates in combination with the lower temperature during ger--2
mination. Only an irregular stand with a density of about 4 m was achieved
in the covered plots.
Covering delayed emergence and considerably increased bolting (Table 6).
The effect on bolting could be due either to germination temperature or to
stand density, since Jorritsma (1978) reported 2.4, 3.1 and 3.5 % bolters _2
for respective stand densities of 12.6, 6.9 and 3.4 m . The effects I observed were, however, more pronounced than those reported by Jorritsma. So
25

very probably, bolting is enhanced mainly by the lower germination tempera
ture in the covered plots. Covered plots of the second sowing gave even more
bolters than the control plots of the first sowing, as might be expected
from the different temperatures (Figure 5). Sowing of ready germinated seed
had no significant influence on bolting. Despite the disturbing effect of
different plant densities, this experiment provided another indication that,
already during germination, temperature may play an important role in achiev
ing a vernalized condition.
5.1.3 Effect of plant size on vernalization in the field
5.1.3.1 Materials and methods
In 1976, single cross G4 was transplanted into the field at different
stages. The trial (block design with 4 replicates and with plots of area 2
20 m ) consisted of the following treatments.
A. Sown normally outdoors on 18 March and emerging on 21 April.
B. Sown in paper pots (Nippon Tensai Seito Kabushiki Kaisha) of diameter
1.9 cm and a height 13 cm on 12 April in a greenhouse with respective day
and night temperatures of 18 and 15 °C. On 21 April, plants were as large
as those sown in the field on 18 March (Treatment A) and were transplanted
to the field.
C. Sown in 16 March and transplanted outdoors on 18 March, being for two
days in the greenhouse at day and night temperatures of 18 and 15 °C.
D. Sown in the greenhouse in paper pots on 25 February and transplanted to
the field on 18 March when two true leaves had developed. In the week
after transplanting, severe frost damage occurred and transplanting was
repeated (with spare plants) at 25 March.
E. Sown in the greenhouse in paper pots on 12 February and transplanted out
doors on 18 March in the 4-leaf stage. Also in this treatment, because
of the frost damage, a new batch was transplanted on 25 March.
The plants were transplanted or, for direct sowing, were thinned to a stand density of 12 m .
5.1.3.2 Results
Although on 21 April, outdoor-sown (Treatment A) and later indoor-sown
plants (Treatment B) were at the same stage of growth, the outdoor-sown beet
were heavier on 1 June, probably because of an initial inhibition by the
paper pot. At the end of the season, plants of Treatment B, without a 'cold'
germination period, had bolted significantly less than the outdoor sown
plants of Treatment A (Table 7). Temperature during the spring of 1976 is
shown in Figure 6. The timing of the different treatments is presented at
the bottom of this graph.
26

Table 7. Effect of transplanting at several stages of growth on the mass of dry matter per plant on 1 June 1976 and bolting on 22 September.
Treatment
A 6 C D E
Site
Outdoors Indoors Indoors Indoors Indoors
Sowing date
03-18 04-12 03-16 02-25 02-12
Stage on 21 April
cotyledonary cotyledonary 2-4 leaf 4-leaf 6-leaf
Mass of matter
4.2 1.3 2.1
10.3 14.7
dry (g)
Proportion of bolters (%)
47.3 3.0
57.0 26.4 69.5
Significance of treatment effect (P < 0.01) (P < 0.01)
Again results indicate that vernalization proceeds very early in growth,
considering the difference in bolting between Treatment A and B. Beet sown
indoors in March and transplanted outdoors two days later bolted more than
beet sown directly outdoors (Treatment C and A ) . Beet sown early February
and planted out late in March (Treatment E) bolted severely, indicating easy
vernalization of that older plants, but those sown later in February and
planted out at the same time (Treatment D) bolted less than treatment C.
Proper comparisons with Treatment A, B and C cannot, however, be made be
cause of the delayed planting of treatments D and E.
Temperature C O 30 r-
25
20 -
15
10
.'Maximum
,• Average
Treatment A \ emergence / \
I ; V
Treatment A sowing A/A--/ / oMinimum
... y , S '
, o - - ° 'J I *"
M a r c h Apr i l May Treatment
• A - * B
IHIIIIIIIIItllllllllllllll
lllllllllllllllllllllllllllllllllllllll
• = Field iiiiiiii = Greenhouse
Fig. 6. Course of maximum, minimum and average temperature in spring 1976. Timing of the treatments A, B, C, D and E is indicated below the graph. Treatment A is field sown. Treatment B, C and D: plants were raised in the greenhouse at 18/15 °C for various durations and afterwards transplanted to the field.
27

5.1.4 Effect of plant size on cold treatment
5.1.4.1 Materials and methods
In the raising rooms, plants of cultivars Gl, G2 and G3 (Table 1) were
raised to different ages before cold treatment. They were sown in 2L pots
and raised at 20 °C with a light phase of 14 h during raising and cold treat
ment. Sowing dates were so organized that plants were of 5 ages at the be
ginning of cold treatment and that both cold treatments of 49 and 28 days
at 4 °C were completed simultaneously:
51 = Immediately chilled. Sown and immediately transferred to the cold rooms.
52 = Chilled after 2 days. Sown 2 days before transfer to the cold treatment.
53 = Chilled after 14 days.
54 = Chilled after 28 days.
55 = Chilled after 42 days.
After cold treatment, the plants were transferred to a greenhouse where
the temperature was kept at 10 °C for 1 week and then raised to 15 °C, which
could be rigidly maintained. Only towards the end of the trial (90 days after
cold treatment) did the sun cause temperature to rise to a maximum of 18 °C
during some days. In the greenhouse, the total light phase was 14 h + 10 h =
24 h.
5.1.4.2 Results
At the beginning and end of cold treatment, number of leaves per plant
was counted for each treatment (Table 8 ) . Despite the low temperature, treat
ments SI and S2 emerged during the cold treatment. Germination may have been
stimulated by use of sprinkling water of 10-15 °C. At the end of cold treat
ment for 49 days, S2 seedlings already had stretched cotyledons, whereas
those of SI were just visible.
Although plants were genetically as uniform as possible, Figure 7 indi-
Table 8. Number of true leaves per plant (mean for 3 cultivars) for up to 42 days at 20 °C before cold treatment for 28 or 49 days at 4 °C.
Stage of treatment
Start of
End of ch
chilling
illing
Number of leaves for plants
chilled for 28 d
time of raising at 20 °C
0 2 14 28 42
2 9 12
* * 2 10 14
chilled
time of
0 2
for 49 d
raising at
14 28
2 6
3 10
20 °C
42
11
15
no emergence visible cotyledons were visible
28

Proportion bolting (%) 100 100
80 100 120 80 100 120
100 100 r
2 0 - ~ ^ 120 60 80 100 120 Time after cold treatment (d)
Fig . 7. Bol t ing as inf luenced by p l a n t age a t begin of cold t r e a tmen t . A. Cu l t i va r s Gl and G2 with cold t r ea tment of 28 days. B. Cu l t i va r s Gl and G2 with cold t r ea tment of 49 days. C. Cu l t iva r G3 with cold t rea tment of 28 days. D. Cultivar G3 with cold treatment of 49 days. Age at s t a r t of cold treatment 0, 0 days; A, 2 days; V, 14 days; • , 28 days; », 42 days.
c a t e s t h e g r e a t v a r i a b i l i t y i n b o l t i n g d a t e . Longer c o l d t r e a t m e n t and ( i n
o t h e r t r i a l s ) l o nge r pho tophases seemed t o r educe t h a t v a r i a b i l i t y , a s a l l
p l a n t s t h e n b o l t e d w i t h i n a s h o r t e r t ime i n t e r v a l . The r e s u l t s do n o t i n d i c a t e
how much of t h e v a r i a b i l i t y was g eno typ i c o r p h e n o t y p i c . In some t r e a t m e n t s ,
b o l t i n g and n o n - b o l t i n g p l a n t s can be d i s t i n g u i s h e d , b u t t h e d i f f e r e n c e c ou ld
be caused by r a t h e r sma l l g eno typ i c o r p h eno typ i c d i f f e r e n c e s . Pe rhaps t h e
n o n - b o l t i n g p l a n t s were n e a r t h e t h r e s h o l d f o r b o l t i n g .
In F i gu re 7A and 7B, t h e mean i s t a k en f o r t h e two c u l t i v a r s , a s no d i f
f e r ence s i n r e a c t i o n were ob se rved . Aga in s t e x p e c t a t i o n , t h e p l a n t s c h i l l e d
a t a younger s t a g e showed t h e e a r l i e s t b o l t e r s , 30 days a f t e r c o l d t r e a t m e n t
( F i gu r e 7A). At t h e f i n a l coun t however, t h o s e t r e a t m e n t s r e s u l t e d i n s i g n i -
29

ficantly fewer bolters. In plants chilled for 7 weeks, the differences are
less pronounced (Figure 7B), although even there the plants chilled at the
youngest stages started bolting first.
The more susceptible cultivar G3 reacted differently (Figures 7C and 7D).
The quicker onset of bolting with direct chilling was similar to all culti-
vars but all plants of cv. G3 had bolted with that treatment within 60 days,
before the other treatments. With plants chilled at increasing stages, a de
pression in sensitivity to cold seems to be followed by an increase. Also
against expectation, plants chilled after germination for 2 days bolted less
than those directly chilled.
Longer cold treatment leads to more bolters and a faster onset of bolting,
especially in the more resistant genotypes.
5.1.5 Conclusions
Whether younger plants can be vernalized is pertinent to commercial beet
growing and to breeders wanting to vernalize plants in a controlled room.
If young plants can be vernalized, space, labour and time can be saved.
The results (Section 5.1) indicate that a true juvenile stage does not
exist in sugar-beet, although chilling during germination induces somewhat
less bolting than during later stages of growth.
5.2 TEMPERATURE OF COLD TREATMENT
5.2.1 Materials and methods
Several values for the optimum temperature of vernalization have been
reported in literature (Section 2.2). Four cultivars were therefore chilled
to four temperatures in an indoor trial. To separate effects of light phase
from those of low temperature, a rather short photophase of 14 h was main
tained during raising and chilling. All four single crosses Gl, G2, G3 and
G4 were directly sown in 2L pots and kept in a room at 20 °C until two true
leaves were formed after 14 days. The plants were then transferred to 4 cold
rooms with temperatures of 3, 7, 11 and 15 °C respectively for 55 days.
After chilling, all plants were transferred to a greenhouse where tempera
ture was kept at 12 °C for the first 8 days. The temperature was then main
tained at 15 °C and the light phase was altered to 14 h + 10 h = 24 h. Tem
perature was reasonably well regulated, rising to 18 °C on only 7 days in
the interval 15-40 days after chilling.
Unchilled plants of cultivars G3 and G4, sown 3 weeks before the end of
the cold treatment, raised at 20 °C and a total light phase of 14 h, were
transferred on the same day to the greenhouse as the chilled plants.
30
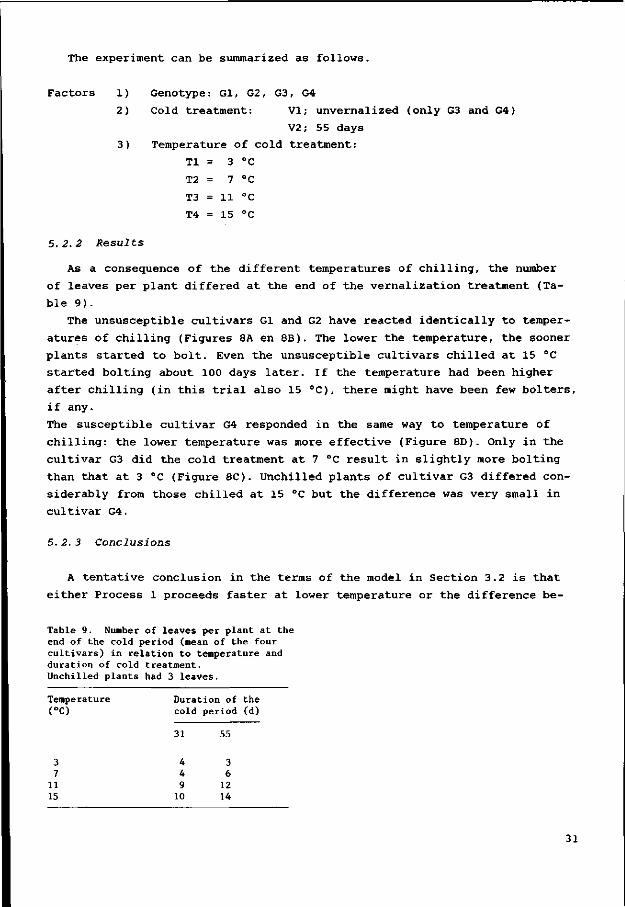
The experiment can be summarized as follows.
Factors 1) Genotype : Gl, G2, G3, G4
2) Cold treatment: VI; unvernalized (only G3 and G4)
V2; 55 days
3) Temperature of cold treatment:
Tl = 3 °C
T2 = 7 °C
T3 = 11 °C
T4 = 15 °C
5.2.2 Results
As a consequence of the different temperatures of chilling, the number
of leaves per plant differed at the end of the vernalization treatment (Ta
ble 9).
The unsusceptible cultivars Gl and G2 have reacted identically to temper
atures of chilling (Figures 8A en 8B). The lower the temperature, the sooner
plants started to bolt. Even the unsusceptible cultivars chilled at 15 °C
started bolting about 100 days later. If the temperature had been higher
after chilling (in this trial also 15 °C), there might have been few bolters,
if any.
The susceptible cultivar G4 responded in the same way to temperature of
chilling: the lower temperature was more effective (Figure 8D). Only in the
cultivar G3 did the cold treatment at 7 °C result in slightly more bolting
than that at 3 °C (Figure 8C). Unchilled plants of cultivar G3 differed con
siderably from those chilled at 15 °C but the difference was very small in
cultivar G4.
5.2.3 Conclusions
A tentative conclusion in the terms of the model in Section 3.2 is that
either Process 1 proceeds faster at lower temperature or the difference be-
Table 9. Number of leaves per plant at the end of the cold period (mean of the four cultivars) in relation to temperature and duration of cold treatment. Unchilled plants had 3 leaves.
Temperature (°C)
3 7
11 15
Duration of cold
31
4 4 9
10
period
55
3 6
12 14
the (d)
31

Proportion bolting (%) 100
A /a-d , / , v -w-v /
0 0
8 0
6 0
40
20
. B
-
i „
O-O- O—O - O— O— D— •—Q A/ikV-A-A-A-A/^-A'
t I /
20 40 60 80 100 120 140 160 20 40 60 80 100 120 140 160
100
80
60 h
40
20
0 20 40 60 80 100 120 140 160 0 20 40 60 80 100 120 140 160 Time after cold treatment (d) Time after cold treatment/raising (d)
Fig. 8. Bolting as influenced by temperature of cold treatment 0, 3 °C; A, 7 °C; V, 11 °C; • , 15 °C; •, unchilled. A. Cultivar Gl; b. Cultivar G2; C. Cultivar G3; D. Cultivar G4.
tween the rates of Processes 1 and 2 is greatest at temperatures as low as
3 °C. But even at 15 °C V accumulates continuously, though very slowly.
Although the trial suggests chilling at the lowest temperature to obtain
earliest flowering, this might be wrong (especially for susceptible culti-
vars), since there is a second temperature-dependent step in the model, the
synthesis of F. Synthesis of F during chilling was probably slow, because
of the short photophase and, in some treatments, the low temperature. Had
the light phase during chilling been 24 h, the outcome would have been com
pletely different. For example, in unchilled plants of cultivar G4, bolting
started in continuous light 55 days after raising, whereas plants chilled
at 3 °C with a light phase of 14 h for 55 days required already 55 + 24 =
80 days (Figure 8D). So, for several cultivars vernalization could be most
effective at intermediate temperatures like 8-10 °C with long photophases,
because V could accumulate and also synthesis of F could start. The optimum
temperature for vernalization was found indeed higher if the light phase
during chilling was longer (Section 2.2). In a trial reported below (Section
5.4), however, light phase during chilling at 3 °C had no significant effect
on subsequent bolting, whereas in another (unpublished) trial at 8 °C, light
32

phase had a slight influence. Thus the action of light phase seems to be
limited by lower temperatures, as has been assumed in the model.
5.3 LIGHT PHASE AND VERNALIZATION
5.3.2 Influence of light phase after vernalization
5.3.1.1 Materials and methods
The response of bolting to light phase after different duration of cold
treatment was estimated in the four single crosses (G1-G4). Plants were
raised in plastic boxes (Section 4.5) in a greenhouse at 15 °C, the first
true leaves appearing after 14-15 days. They were then transferred to a cold
room at 3 °C with a light phase of 14 h for 0, 14, 28 and 42 days. Afterwards
they were transferred to a greenhouse at 15 °C, still with light phase 14 h,
and after 4 days transplanted into 2L pots. The plants were then divided
between 3 greenhouses at the same temperature but after another 3 days the
light phase was either unchanged or supplemented for 4 or 10 h. Temperature
in the greenhouses could not be regulated as accurately as in previous trials.
On sunny days, the temperature rose 4-5 °C above the intended 15 °C, though
to almost the same degree in the three greenhouses. However, in the green
house with a photophase of 14 h, a technical failure caused a rise to 28 °C
for a few hours 23 days after cold treatment. The consequent devernalization
was probably not too disastrous but could not be assessed quantitatively.
A comprehension of the experimental treatments:
- Genotypes : Gl, G2, G3 and G4
Duration of the cold period:
VI, 0 weeks
ase:
V2,
V3,
V4,
PI,
P2,
P3,
2 weeks
4 weeks
6 weeks
14 + 0 =
14 + 4 =
14 + 10 =
14
18
24
h
h
h
5.3.1.2 Results
To some degree, induction by cold and subsequent light phase were inter
changeable in a susceptible cultivar (Figure 9B). With continuous light,
shorter chilling retarded appearance of the first bolters and new bolters
appeared slower, but even in unchilled plants 80 % of the plants finally
bolted. With a subsequent light phase of 18 h the effect of chilling was
more pronounced but even of unchilled plants, 5 % bolted. With the shortest
33

Proport ion bolting (%)
UU
80
60
4 0
20
_ A
•—• /
J ,
. • m"
J 1
/ 1
• /
• •
: i
1001-
20 40 60 80 100 40 60 80 100 Time after chilling (d)
Fig. 9. Bolting without chilling (•) or after chilling for 14 (X), 28 (A) or 42 days (•) and with subsequent light phase of 14 (-.-.-), 18 ( ) or 24 h ( ). A. Cultivar G2; B. Cultivar G4.
light phase of 14 h, bolters appeared only after chilling for 42 or 28 days.
However, for the more resistant cultivar (Figure 9A), no beet bolted with
a light phase of 14 h and even under continuous light the plants only bolted
if they had been chilled for 28 to 42 days. A certain proportion of bolters,
for instance 50 %, after a certain time after cold treatment can be obtained
in different ways: longer chilling and shorter light phase or shorter chill
ing and longer light phase (Figure 10A and 10B). Low temperature and subse
quent long light phase are complementary.
Proportion bolting (%) f-100
41 27 13 0 Time of chilling (d)
Fig. 10. Proportion of bolters after 100 days as a function of duration of chilling and of subsequent light phase. A. Culti-i' G2; B. Cultivar G4.
34

The other cultivars G3 and Gl reacted similarly to cultivars G4 and G2.
Interpretation in terms of the model suggests that during vernalization,
only Process 1 proceeds. The light phase during vernalization (14 h) was
not appropriate for Process 3; also because of the low temperature (3 °C)
probably no F would be synthesized. After vernalization, different amounts
of V would be present in the plants according to the duration of chilling.
With temperature raised to 15 °C under different light phases, differences
in synthesis of F depend on the amount of V and on light phase in this trial.
In Figure 9B, the combination with 6 weeks chilled and then 14 h light phase
obviously results in the same pattern of synthesis of F as unchilled and 24 h
photophase, as is possible when assuming a relation between synthesis of F
and temperature, light phase and amount of V as in Section 3.2
5.3.2 Effect of cultivar
5.3.2.1 Introduction
In a similar trial to the previous one and in a field trial, all 10 cul
tivars of Table 1 were tested to find out whether the four single crosses
were in a similar range of susceptibility to commercial cultivars of sugar-
beet used in the Netherlands.
5.3.2.2 Materials and methods
At Achterberg, the ten cultivars were sown on 2 and 29 March and 12 April 2
1978 in plots of 15 m in 4 replicates. After emergence, the plants were _2
thinned to a stand density of 10 m . Indoors, the cultivars were raised for 6 days at 20 °C, then 5 days at 15 °C with a light phase of 14 h and 3
days at 10 °C. Afterwards they were chilled for either 31 or 49 days at 3 °C,
switched to 10 °C for 3 days, transplanted and transferred to greenhouses
with the following light phases:
PI
P2
P3
14 h + 0 h for 56 days, afterwards 14 h + 4 h = 18 h.
14 h + 4 = 18 h until the end of the trial.
14 h + 10 h = 24 h until the end of the trial.
After chilling, temperature was kept at 13 °C for the first 4 days and sub
sequently at 15 °C.
5.3.2.3 Results
The results (Table 10) were comparable with those in the previous trial.
The proportion of bolters for the first sowing date in the field trial are
shown at the bottom of the table for 2 dates, 3 August (early bolters) and
35

Table 10. Propor t ion of b o l t e r s for the c u l t i v a r s G1-G10 (defined in Table 1) in a greenhouse a t 5 i n t e r v a l s (30, 44, 74, 102, 125 days) a f t e r c h i l l i n g and in a f i e l d t r i a l (on 2 d a t e s ) . Treatment VI, c h i l l ed for 31 days; V2, c h i l l e d for 49 days; P I , l i g h t phase of 14 h for 56 days and l a t e r 14 h + 4 h; P2, 14 h + 4 h; P3, continuous l i g h t (14 h + 10 h ) .
Time after chil ling (d)
30
44
74
102
125
Date
08-03 09-21
1. *, P <0.
Treat-
ment
V1P1 V2P1 V1P2 V2P2 V1P3 V2P3
V1P1 V2P1 V1P2 V2P2 V1P3 V2P3
V1P1 V2P1 V1P2 V2P2 V1P3 V2P3
V1P1 V2P1 V1P2 V2P2 V1P3 V2P3
V1P1 V2P1 V1P2 V2P2 V1P3 V2P3
10 ; **
Prop
Gl
0 0 0
10 0
60
0 0 0
55 20 65
0 0 5
70 45 70
0 10 5
85 50 70
10 20 15 95 55 95
Pro
Gl
1.4 2.1
P <0
ortion of
G2
0 0 0 0 0
55
0 0 0
25 5
90
0 10 0
55 20
100
0 20
5 80 30
100
0 35 20 90 40
100
G3
0 0 0
25 0
90
0 0 0
75 45
100
0 5
10 100 70
100
10 60 30
100 85
100
25 70 35
100 90
100
bolters (%)
G4 G5
0 0
55 84
100 95
5 50 90
100 100 100
45 85 95
100 100 100
75 90
100 100 100 100
90 90
100 100 100 100
0 0 0 0 0
30
0 0 0 5 5
65
0 0 0
20 10 75
0 5 5
55 25 90
0 20 20 80 35 90
portion of bolting
G2 G3
4 9
.05;
5 29.1 8 42.1
***, p
G4
85.5 89.5
<0.01
G6
0 0 0
20 18 60
0 0 0
35 59 80
0 5 0
55 59 85
5 40 10 85 69 85
10 50 20 90 74 90
(%) in
G5
4.1 13.5
)
G7
0 0 0 5 5
50
0 0 0 5
25 60
0 0 0
10 45 75
0 45 10 35 60 90
0 55 25 65 65 95
G8
0 0 0
10 10 75
0 0
10 31 44 80
0 5
10 48 50 85
5 30 25 58 78 90
15 65 40 73 84 90
G9
0 0 0
20 20 70
0 0 0
45 30 95
5 0
10 60 58
100
5 20 25 70 79
100
5 45 45 80 84
100
field trial
G6
4.3 10.8
**, P
G7
4. 15.
<0.
GS
1 4. 4 15.
001
G10
0 0 0 5 0
75
0 0 6
25 5
85
0 5
11 30 35 90
0 20 11 50 40
100
5 35 23 75 60
100
G9
8 3.1 7 11.2
Spearman's r with *-.- i — it-.- —
p i UJJUI L
in the
08-03
-
0.52*1
0.39 0.26 0.48*
0.52* 0.52* 0.44 0.31 0.58** 0.52*
0.16 0.77*** 0.22 0.32 0.50* 0.51*
0.66** 0.73*** 0.54* 0.47* 0.49* 0.35
0.53* 0.77*** 0.47* 0.36 0.55** 0.10
G10
4.0 10.5
i.UII UUlLlllg
field trial on:
09-21
--
0.52* 0.52* 0.46* 0.48*
0.52* 0.52* 0.44 0.27 0.64** 0.35*
0.39 0.25 0.39 0.17 0.59** 0.30
0.72** 0.72** 0.76*** 0.19 0.68** 0.30
0.51* 0.84**** 0.78***
0.08 0.73*** 0.02
21 September ( t o t a l b o l t e r s ) .
S i ng l e c r o s s e s Gl and G2 were l e s s s u s c e p t i b l e and G3 and G4 were more
and f a r more s u s c e p t i b l e , r e s p e c t i v e l y , t h an commercial c u l t i v a r s .
For b r e e d e r s u s i ng r e g u l a t e d growing c o n d i t i o n s , t h e s e c o n d i t i o n s shou ld
be such t h a t g eno typ i c d i f f e r e n c e s i n b o l t i n g b ehav iou r , a s obse rved i n t h e
36
field, could be reproduced. If the differences are large enough, there is no
problem. However, small but significant differences in bolting are difficult
to distinguish indoors. Although it was not the purpose of these trials and
the number of plants was small, the problem might be solved as indicated in
the last two columns of Table 10. To compare ranking orders of the genotypes
in the field and greenhouse, non-parametric Spearman correlation coefficients
were calculated for the proportion of bolters in the field at 2 dates with
those in each treatment at the 5 intervals after cold treatment.
Chilling for 49 days and continuous light did not reveal differences in
bolting found in the field. Chilling for 49 days and a light phase of 14 h
and later 18 h, which is closer to natural circumstances, gave better cor
relation. Curth & Fiirste (1960) state, however, that continuous illumination
improves the accordance between field and greenhouse bolting trials.
Cultivars could differ in rate of devernalization (Process 2), sensitivi
ty to light phase (Process 3), cold requirement (Process 1) and the value
of the threshold for bolting (Process 4 ) . Because of the interdependence of
these processes, it would be difficult to distinguish these characteristics
for the cultivars. If genotypes mainly differed in the rate of devernaliza
tion, the method could be improved by a high temperature for a short time
after chilling instead of a constant temperature of 15 °C. If, however, the
difference were in sensitivity to light phase, temperature after chilling
should not be too high. Instead the light phase should be that which gives
best indication of sensitivity towards light phase. It is unlikely that dif
ferences in bolting are due to a single characteristic. So to test for bol
ting resistance the conditions should imitate those of early spring (with
the same sequence of low temperature and high temperature, and a rather short
light phase. If, however, the breeder would like to select for a particular
characteristic, the conditions can be chosen accordingly.
Probably every climatic region where beet is grown has specific condi
tions for bolting. Dutch experience is that plant material from elsewhere,
for instance Poland and North America, tends to bolt more than the Dutch
commercial cultivars. Temperature conditions in spring in those countries
are quite different and may allow more devernalization, or less vernaliza
tion, or both.
5 .4 DEVERNALIZATION
5.4.1 Materials and methods
To find the effect of high temperature after vernalization, the four
single crosses (Table 1) were vernalized and then kept at two constant tem
peratures 15 and 25 °C. They were raised at 15 °C in plastic boxes in a
greenhouse for 14 days with light phase 14 h and then kept cold at 3 °C for
0, 14, 28 and 42 days. Besides chilling, the effect of light phase during
37
cold treatment was tested with 14 + 0 = 14 or 14 + 10 = 24 h. After cold
treatment, the temperature was raised to 10 °C, and the plants were trans
planted into 2L pots 2 days later. The plants were divided between 2 green
houses with a light phase of 14 h + 10 h = 24 h and, in contrast to other
trials, immediately kept at 15 °C. One week after transplanting, the tempera
ture in one greenhouse was raised to 25 °C and the other maintained at 15 °C.
Temperature could not be regulated very rigidly in the cooler greenhouse.
On several sunny days, temperature rose to 18-20 °C. The warmer house became
infested with aphids and mites, despite precautions, and that part of the
trial had to be terminated earlier than planned. The experimental treatments
can be summarized as follows:
1. Single crosses: Gl, G2, G3 and G4
2. Duration of cold treatment:
VI; 0 weeks
V2; 2 weeks
V3 ; 4 weeks
V4; 6 weeks
3. Photophase during cold treatment:
PI; 14 h + 0 h = 14 h
P2; 14 h + 10 h = 24 h
4. Temperature after cold treatment:
Tl; 15 °C and photophase 14 + 10 h = 24 h
T2; 25 °C and photophase 14 + 10 h = 24 h
5.4.2 Results
Light phase during vernalization had no significant influence on bolting,
possibly because of the low temperature during vernalization. With a tempera
ture of 15 °C after vernalization, the 4 cultivars bolted in the same way
as in the trials on light phase (section 5.3). At 25 °C, however, only the
most susceptible cultivar bolted. So apparently devernalization in the less
susceptible cultivars was sufficient to prevent all the plants from bolting.
Bolting of cultivar G4 was reduced by high temperature after all times of
cold treatment, although the difference between 15 °C and 25 °C was more
pronounced after shorter chilling or no chilling (Figure 11). Unchilled
plants did not bolt at 25 °C, but had almost all bolted within 90 days after
raising at 15 °C.
According to the time of chilling, different amounts of V would be present
in the plants. Plants chilled for 42 days would bolt first: after vernaliza
tion, F would be rapidly synthesized at 15 °C, also because the amount of V
was not destroyed at that temperature and positively influences this syn
thesis. Shorter chilling would result in less V and reduce, but still allow,
synthesis of F. Plants would reach the threshold for bolting later.
38
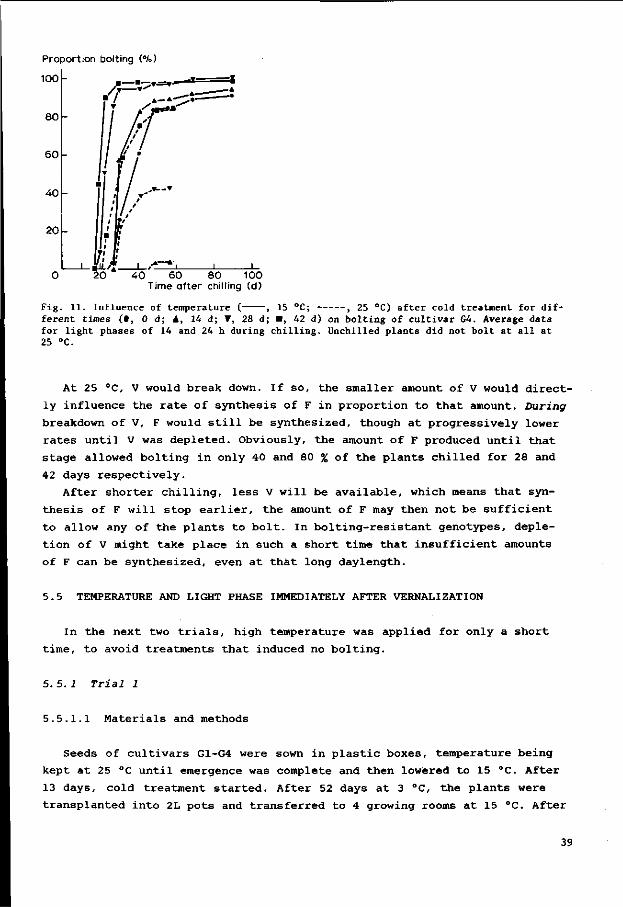
O 20 40 60 80 100 Time after chilling (d)
Fig. 11. Influence of temperature ( , 15 °C; , 25 °C) after cold treatment for different times (•, 0 d; A, 14 d; T, 28 d; •, 42 d) on bolting of cultivar G4. Average data for light phases of 14 and 24 h during chilling. Unchilled plants did not bolt at all at 25 °C.
At 25 °C, V would break down. If so, the smaller amount of V would direct
ly influence the rate of synthesis of F in proportion to that amount. During
breakdown of V, F would still be synthesized, though at progressively lower
rates until V was depleted. Obviously, the amount of F produced until that
stage allowed bolting in only 40 and 80 % of the plants chilled for 28 and
42 days respectively.
After shorter chilling, less V will be available, which means that syn
thesis of F will stop earlier, the amount of F may then not be sufficient
to allow any of the plants to bolt. In bolting-resistant genotypes, deple
tion of V might take place in such a short time that insufficient amounts
of F can be synthesized, even at that long daylength.
5.5 TEMPERATURE AND LIGHT PHASE IMMEDIATELY AFTER VERNALIZATION
In the next two trials, high temperature was applied for only a short
time, to avoid treatments that induced no bolting.
5. 5. 1 Trial 1
5.5.1.1 Materials and methods
Seeds of cultivars G1-G4 were sown in plastic boxes, temperature being
kept at 25 °C until emergence was complete and then lowered to 15 °C. After
13 days, cold treatment started. After 52 days at 3 °C, the plants were
transplanted into 2L pots and transferred to 4 growing rooms at 15 °C. After
39

Table 11. Temperature and light phase from the time of ending of cold treatment in Trial 1.
Treatment
1 Temp. Phase
2 Temp. Phase
3 Temp. Phase
4 Temp. Phase
5 Temp. Phase
6 Temp. Phase
(°C) (h)
(°C) (h)
(°C) (h)
(°C) (h)
(°C) (h)
(°C) (h)
Time
17-28
interva
(Period
15 18
15 24
25 18
25 24
15 24
15 18
I)
1 (d)
29-41 (Period
15 18
15 24
15 18
15 24
25 24
25 24
II) 41-end (Period III)
15 18
15 24
15 18
15 24
15 24
15 24
8 days, the light phase was increased from 14 + 0 = 14 h to 14 + 4 = 18 h
and, after 17 days, the plants were subjected to 6 combinations of tempera
ture and lighting (Table 11).
Besides the chilled plants, unchilled plants of cultivars G3 and G4 were
included in the trial. They were sown 16 days before the end of chilling in
the same way as the chilled plants and allowed to germinate at 25 °C. Three
days before chilling of the other plants ended, they were cooled to 11 °C.
They were transplanted at the same time as chilled plants and further treated
identically.
5.5.1.2 Results
In Gl and G3, high temperature in the early interval (Period I) reduced
bolting considerably (Treatment 3), even with continuous light (Treatment 4,
Figure 12A and 12B). In unchilled plants of the most susceptible cv. G4
(Figure 12C) with continuous light bolting was delayed rather than reduced.
At a photophase of 18 h, no bolting took place. In the vernalized plants of
G4, devernalization seemed to have less influence, probably the applied cold
treatment of 52 days had induced this susceptible genotype so much that other
factors did not have much influence any more (Figure 12D).
With continuous light in the unsusceptible cultivar Gl, warmth was more
effective in preventing bolting if it was earlier (Treatment 4) than if it
was later (Treatment 5, Figure 13A). However, a later interval of warmth
also reduced bolting, if the light phase in the earlier interval was shorter
40

Prop 00
80
60
40
20
ortion bolting (%)
A
-
i
1 1
I
1 n-oo-DO-o
frA-O-ûi ff o-oooo
20
Period: I
4 0 i_
m
60" " 8 0 100 120
Time after chilling(d)
tOOr
—1 [>g-»oiOO-0-S*^wl W M P ^ ^ W -
20 40 60 80 100 120 Period: I Time after chilling(d)
100
80
60
40
20
0 20 i
Period: I
-a'_ 40
m
6(5" 80 100 120
Time after raising(d)
100 r
8 0
60
40
20
temperature/photophase in Per iod: 1 n HI
15/18 15/18 15/18
15/24 15/24 15/24
25/18 15/18 15/18
25/24 15/24 15/24
_ i i I 40
Period: I IL
60 80 100 120
IE Time after chilling(d)
Fig. 12. Bolting in Treatment 1 (0), 2 (A), 3 (V) and 4 (D) of Trial 1 (Table 11). A. Cultivar Gl; B. Cultivar G3; C. Cultivar G4, unchilled; D. Cultivar G4, chilled.
(Treatment 5 and 6).
In the more susceptible genotype G3 (Figure 13B), later warmth did not
reduce bolting at all (Treatment 5), except if the early light phase was
short (Treatment 6).
Unchilled plants of the most susceptible cultivar (Figure 13C) reacted
towards warmth like chilled plants of the moderately susceptible cultivar
(Figure 13B). However, devernalization shifted the bolting to a later date
and did not prevent ultimate bolting of all plants. Probably this effect
was associated with a better 'vernalizability' than G3 under the cool con
ditions of Period III. After some time under the conditions of that period
(15 °C, 24 h total light phase) the plants can be considered as vernalized.
Bolting is then rapidly complete. For this cultivar intervals of high tem
perature retard this date of being vernalized.
41
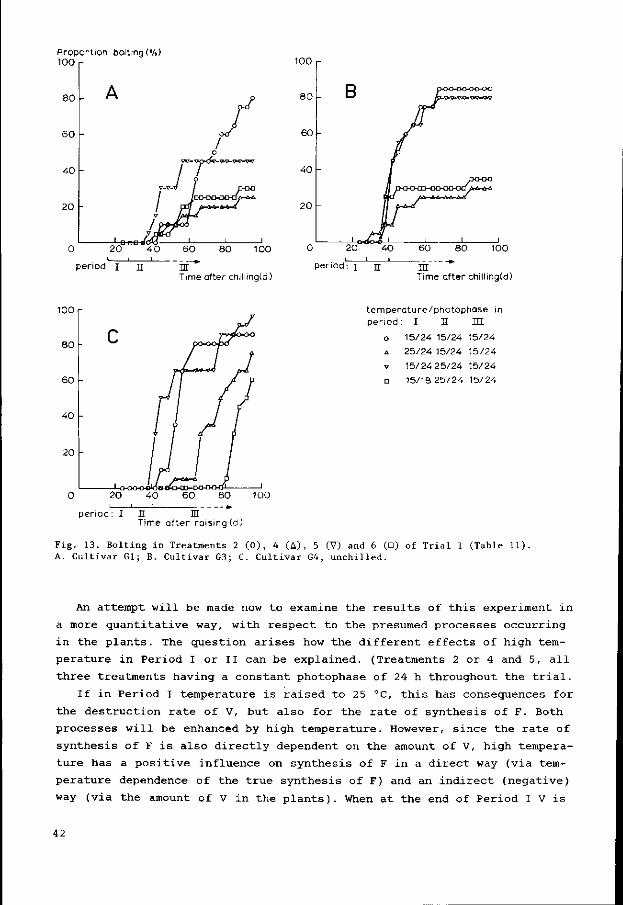
Proportion bolting (%) 100
period: I u
uu
80
60
40
20
. B
i -JTJ I
h-'v-'v-v-w- w * - w
^ ^ o o W ^ S
1 1 1 0 20 40 60 80 100
Time after chilling(d) period-. J u
Time after chilling(d)
uo
80
60
40
20
c
-
1 -
temperature/photophase in per iod : I H U I
o 15/24 15/24 15/24
A 25/24 15/24 15/24
v 15/24 25/24 15/24
• 15/18 25/24 15/24
100 ».
per iod: I H UI Time af ter raising (d)
Fig. 13. Bolting in Treatments 2 (0), 4 (A), 5 (V) and 6 (•) of Trial 1 (Table 11). A. Cultivar Gl; B. Cultivar G3; C. Cultivar G4, unchilled.
An attempt will be made now to examine the results of this experiment in
a more quantitative way, with respect to the presumed processes occurring
in the plants. The question arises how the different effects of high tem
perature in Period I or II can be explained. (Treatments 2 or 4 and 5, all
three treatments having a constant photophase of 24 h throughout the trial.
If in Period I temperature is raised to 25 °C, this has consequences for
the destruction rate of V, but also for the rate of synthesis of F. Both
processes will be enhanced by high temperature. However, since the rate of
synthesis of F is also directly dependent on the amount of V, high tempera
ture has a positive influence on synthesis of F in a direct way (via tem
perature dependence of the true synthesis of F) and an indirect (negative)
way (via the amount of V in the plants). When at the end of Period I V is
42

depleted totally and not enough V can be produced any more in following pe
riods, no further synthesis of F takes place in succeeding periods. This
explains the curves for Treatment 4: not enough F has been produced at the
end of Period I to allow complete bolting in cultivars Gl and G3.
When the devernalizing temperatures act upon the plants in the second
period, the amount of F produced in the previous period governs how far bol
ting is reduced. For genotype G3 this amount was clearly sufficient to in
duce bolting. Probably also in this genotype, V is destroyed in the second
period, but this will have less effect, because enough F has already been
synthesized in the previous period to surpass the bolting threshold for 80 %
of the plants. In such a way, one can also explain why high temperatures
some time after vernalization can still reduce bolting, as long as shorter
photophases prevail in the previous period.
Comparing Treatment 5 with 6 and remembering that Process 3 proceeds at a
much slower rate in Treatment 6, one can see the consequences for the amount
of F at the end of Period I. In the plants of Treatment 6, the destruction
by high temperature in Period II does have an effect, because the level of
already synthesized F is still too low for many of the plants. In this treat
ment, synthesis of additional F will also be reduced because of the lower
amount of V. The final amount of F is clearly then too low to allow bolting
to a level comparable to Treatments 5 or 2.
So stabilization of the vernalized condition in sugar-beet, if any, de
pends not on time, but especially on photophase.
5. 5. 2 Trial 2
5.5.2.1 Materials and methods
Plants of cv. Gl and G2 were raised as in Trial 1 but at 20 °C initially.
Six days after sowing the temperature was lowered to 15 °C for 8 days, then
plants were chilled to 10 °C for 4 days, 6 °C for 2 days and 3 °C for 54
days. The temperature was then raised to 10 °C; after 2 days, the plants
were transplanted and transferred to growing rooms; and after another 8 days
the temperature was raised to 15 °C and chilling ended. The cold induction
was thus probably stronger than in the previous trial. After 12 days (photo-
phase 14 h + 0 h = 14 h), treatments for time intervals of 8 days began (in
contrast to 12 days in the previous trial) (Table 12). As before, unchilled
plants of Gl and G2 were included in Treatments 2, 4 and 6, but none of the
plants bolted during the experimental period. Unchilled plants of G4 were
present in all treatments. After the first interval, all plants except.of
Treatments 7 and 8 were subject to the same temperature of 15 °C and to con
tinuous light. Treatments 7 and 8 measured the effect of a later interval
of warmth after different light phases in the first interval.
43

Table 12. Temperature and light phase from the time of ending of cold treatment in Trial 2.
Treatment
1 Temp. Phase
2 Temp. Phase
3 Temp. Phase
4 Temp. Phase
5 Temp. Phase
6 Temp. Phase
7 Temp. Phase
8 Temp. Phase
:°c) :io
:°o :h)
°c) th)
:°o :h)
°C) h)
:°o :h)
:°o rh)
°C) rh)
Time interval
12-19 (Period
10 14
10 24
15 14
15 24
25 14
25 24
15 14
15 24
I)
(d)
20-27 (Period II)
15 24
15 24
15 24
15 24
15 24
15 24
25 24
25 24
28-end (Period III)
15 24
15 24
15 24
15 24
15 24
15 24
15 24
15 24
5.5.2.2 Results
As expected, the lower the temperature in the first interval, the more
and the sooner bolting appeared (Figure 14A, Treatment 1, 3 and 5). High
temperatures later (Treatment 7) had far less effect than earlier (Treatment
5). By contrast, with continuous light during the first interval, the higher
the temperature in Period I, the sooner bolters appeared (Figure 14B). With
continuous light in Period I, high temperature (Figure 14B, Treatment 6)
did not reduce early bolting although later a lower final value was reached
than with the lower temperature treatments. That picture was common to the
two unsusceptible cultivars (Figures 14A, B, C, D ) .
The unchilled plants of G4 in the sequence of light phases 14 h, 24 h,
24 h (Figure 14E) behaved like chilled plants of Gl and G2. In continuous
light (Figure 14F) the pattern was somewhat different, in that Treatment 4
and not one of the high temperature treatments gave (as in Figures 14B, 14D)
the earliest bolters.
An interpretation in terms of the model would assume that when plants
were subjected to a photophase sequence of 14 h, 24 h, 24 h (Figures 14A,
C), synthesis of F in Period I would be low because of the rather short day-
44

Proport ion bolting (%)
1 0 0 | - ÎEMP./PHOTOPHASE IN PERIOD:
J IL JIL • '10/14 15/24 15/24 •" »15/14 15/24 15/24
»25/14 15/24 15/24 •15/14 25/24 15/24
60
40
20
/ / '
- i = i
20 1 1 ' II ' I f f " '
4 0 60 80 100 120 Time after chilling (d)
Proportion bolting (%) 1 0 0 1 " TEMP./PHOIOPHASE
INPERIOO:
80
60
40
20
. / " / '
• 10/14 15/24 15/24 / . - . _ . / » 15/14 15/24 15/24 / . _ . / ~ » 25/14 15/24 15/24 / ^ ' « - /
I II
40 60 80 100 120 _^ Time after chilling (d)
100
80
60
40
20
100
8 0
60
40
20
: / '
M . . ^ A » X
IEMP./PHOIOPHASE IN PERIOD: I
• 10/24 * 15/24 * 25/24 • 15/24
II 15/24 15/24 15/24 25/24
III 15/24 15/24 15/24 15/24
_l_ 20 40 60 80
_l 100 120
I II III
' T * - * - * - * - * - *
JI_ JIL • 10/24 15/24 15/24 « 15/24 15/24 15/24 * 25/24 15/24 15/24 • 15/24 25/24 15/24
20 40
III I II III
6 0 8 0 100 120 > Time after chilling (d)
100
20
i n
40
....... 60 80 100 120
Time after raising(d)
loo r
80
60
4 0 -
20
0 20
. X — X — X — X — X — X — X -
sf / y ~-'7 y ' ^ A ~ » - A ' . /
TEMP./PHOTOPHASE IN PERIOD:
4 0
I II III 10/24 15/24 15/24
- x - 15/24 15/24 15/24 - » - 25/24 15/24 15/24 - • - 15/24 25/24 15/24
_L
III
6 0 8 0 100 120 Time after raising (d)
I II
Fig. 14. Bolting in the cultivars Gl, G2 and G4 as influenced by temperature and light phase after chilling (Gl and G2) and after raising (G4). A. Cultivar Gl, Treatments 1 (•), 3 (X), 5 (A) and 7 (•) B. Cultivar Gl, Treatments 2 (•), 4 (X), 6 (A) and 8 (•) C. Cultivar G2, Treatments 1 (•), 3 (X), 5 (A) and 7 (•) D. Cultivar G2, Treatments 2 (•), 4 (X), 6 (A) and 8 (•) E. Cultivar G4, unchilled; Treatments 1 (•), 3 (X), 5 (A) F. Cultivar G4, unchilled; Treatments 2 (•), 4 (X), 6 (A) Treatments are defined in Table 12. 45
and and
7 (•) 8 (•)
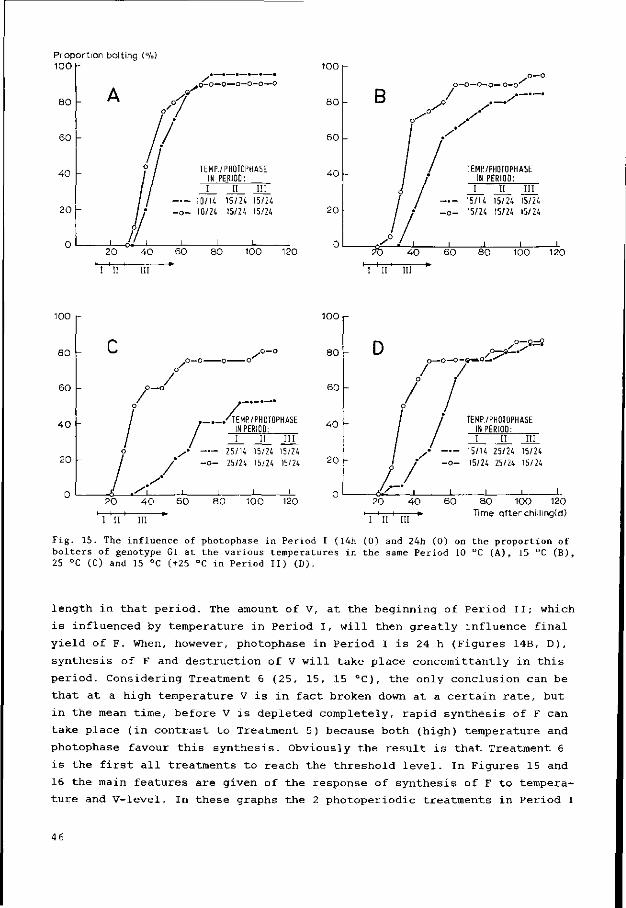
Proportion bolting (%) 100 h
80
60
40
20
.o-o—o—o—o-o—o
TEMP./PHOIOPHASE IK PERIOD: I II I II
10/K 15/24 15/24 - o - 10/24 15/24 15/24
20 40 60 80 100 120
100
80
60
40
20 -
-
-
B
1 1
Jl
o - o o-o—o-o— O-O
\ 1
/ -°-1
1 1
1EMR/PH0T0PHASE IN PERIOD:
I II I I I 15/14 15/24 15/24 15/24 15/24 15/24
I i i
20 40 60 80 100 120
I II III I II III
100
80 -
60
4 0 -
20
„ /
/ /
/
._._/TEMR/PH0TOPHASE / IN PERIOD:
/ I II I I I / • 25/14 15/24 15/24
- o - 25/24 15/24 15/24
. /L /
20 4 0 60 80 100 120
I II III
100
80
60
40 -
20
- D
-
I - I
o I-
o-
/
/ o
/ ,
1
_ 0 - 0 - 9 — O l . ^
/
/ / IEMP./PHOIOPHASE / IN PERIOD:
I I I I I I 15/14 25/24 15/24
- o - 15/24 25/24 15/24
1 I I 1
20 40 60 80 100 120 —>—i »• Time afterchilling(d)
I II III a
Fig. 15. The influence of photophase in Period I (lAh (0) and 24h (0) on the proportion of bolters of genotype Gl at the various temperatures in the same Period 10 °C (A), 15 °C (B), 25 °C (C) and 15 °C (+25 °C in Period II) (D).
length in that period. The amount of V, at the beginning of Period II; which
is influenced by temperature in Period I, will then greatly influence final
yield of F. When, however, photophase in Period I is 24 h (Figures 14B, D ) ,
synthesis of F and destruction of V will take place concomittantly in this
period. Considering Treatment 6 (25, 15, 15 °C), the only conclusion can be
that at a high temperature V is in fact broken down at a certain rate, but
in the mean time, before V is depleted completely, rapid synthesis of F can
take place (in contrast to Treatment 5) because both (high) temperature and
photophase favour this synthesis. Obviously the result is that Treatment 6
is the first all treatments to reach the threshold level. In Figures 15 and
16 the main features are given of the response of synthesis of F to tempera
ture and V-level. In these graphs the 2 photoperiodic treatments in Period I
46

Proport ion bolting (%) 100 t-
80
60
40
20 -
o—o-o—o—o—oVó—o
/ /
TEMP./PHOTOPHASE IN PERIOD: I II I I I
- . - 10/14 15/24 15/24 - o - 10/24 15/24 15/24
_ l _ _L
I . i . . i 80 100 120
100 r-
80
60
40
20
- B
-
i /
o'°" o ' /
/ -
f 1 -7' ~
1 rf^J L
-o—o—o-o—o-- 0
, ./* . /
TEMP/PHOIOPHASE IN PERIOD: I II
15/14 15/24 15/24 15/24
i 1
I I I 15/24 15/24
i 20 40 60 80 100 120
I II III I II III
100
80
60
4 0
20
-
-
n
; /
0
/
/ -J
o—o— o—o—o—o—o
y / /
/ . sJ y TEMP/PHOTOPHASE
/ IN PERIOD; / I I I I I I
y/ — 25/14 15/24 15/24
S* - o - 25/24 15/24 15/24 ,-—^i i i i i
20 40 60 80 100 120 i . i „ I I II III
F ig . 16. Like Fig . 15, now for genotype G2.
0 0
80
60
40
20
/ /
" / /
" / /
J A ,
o-o-o—o—o j - O - O
^—y
IEMP./PHOTOPHASE IN PERIOD: I I I I II
— 15/14 25/24 15/24 - o - 15/24 25/24 15/24
i i i 20 4 0
I II III
60 80 100 120 — • Time after chilling
are drawn for each temperature sequence. When in Period I temperature is
low (10 °C) (Figures 15A, 16A) little difference in reaction between 14 and
24 h is observed. Obviously in both treatments synthesis of F is almost at
the same level, despite the difference in photophase: the low temperature
reduces synthesis of F in this period. When temperature in Period I is higher
(Figure 15B, 16B) the effect of the difference in photophase in Period I be
comes more pronounced, which is in agreement with the assumed temperature
dependence of synthesis of F. At still higher temperatures in Period I (Fi
gure 15C, 15D, 16C, 16D) not only temperature dependence of synthesis of F
is involved, also the dependence on the amount of V accounts for the differ
ence in the ultimate amounts of F synthesized and the corresponding number
of bolting plants.
In unchilled plants of G4 a somewhat different situation will occur. One
47

may assume that at day O no V is present. Then high temperature in Period I
will only delay V-synthesis, because in this genotype it may be assumed that
afterwards at 15 °C V-synthesis will still take place. As can be seen in
Figure 14F, 15 °C is optimal for rapid bolting, possibly because both syn
thesis of F and V proceed at this temperature, while at 10 °C though synthe
sis of V may be faster, synthesis of F is slower. Higher temperatures cause
these plants, in contrast to chilled plants of Gl and G2, to bolt later in
continuous light.
The difference may be explained by assuming that the amount of V is still
rather low at the beginning of the high temperature interval, whereas in Gl
and G2, the high amount of V at the start of 25 °C already allows synthesis
of F right from the beginning and so induces bolting more rapidly.
5.6 DISCUSSION
5. 6. 1 Introduction
This section summarizes the main effects before, during and after ver
nalization, and discusses their physiology in the light of the model.
5.6.2 Seedling stage
Is there a minimal size sugar-beet plants must reach before vernalization
can take place? The trials suggested no true juvenile stage, though vernal
ization seemed less effective in very young plants. This lowered effective-
nes is less pronounced than stated by Margara (1960; 1968) who did not suc
ceed in bringing sugar-beet plants to flower, when vernalized in the cotyle-
donary stage. Also Junges (1959) and Chroboczek (1934) detected such a juve
nile stage in red garden beet. Both authors, however, could not avoid high
temperatures after vernalization. Especially the early vernalized plants can
also perhaps be devernalized more easily. Heide (1973) on the other hand
showed results in beetroot that were similar to the effects described in
Section 5.1. Despite a somewhat lower vernalizability in the germination
stage, a great part of the vernalization process in practical sugar-beet
growing should take place before emergence, as judged by the temperature
course in most years.
The depressed vernalizability of germinating seeds may be due to shortage
of carbohydrates. These are, according to Purvis (1944), essential for ver
nalization. Figure 7A, B, C, D showed that pre-germinated seeds kept for 2
days at 20 °C were slightly inferior in bolting than unpre-germinated seeds.
Especially this pre-germination at a rather high temperature may have resul
ted in a low carbohydrate content, with consequences for the final propor
tion of bolters in this treatment. Also Wellensiek (1964b), who vernalized
roots of Cichorium intybus, found negative effects of previous exposure to
48

20 °C, and thought it might have diminished the substratum for the vernali
zation process. Highkin (1956) reports a retarding effect of a pre-treatment
at 20 °C or 26 °C for up to 5 days before the optimum cold treatment for
peas. This treatment resulted in a progressive loss of the ability to be
vernalized.
Besides causing a shortage of carbohydrate, high temperatures before ver
nalization could also have an effect similar to devernalization, assuming
that plants have an 'initial degree of vernalization'. Raising at rather
warm temperatures determines then:
loss of the initial degree of vernalization
increase in vernalizability (because of the larger plants)
In that way it is more understandable that the first appearing bolters were
observed in treatments vernalized at the youngest stage (Section 5.1.4) (the
plants kept their initial "degree of vernalization") but the highest final
proportion of bolters were found when vernalized as larger plant sizes (be
cause they could be vernalized easier).
5. 6. 3 Vernalization
Vernalization (accumulation of V in the model) was faster, the lower the
temperature (Figure 8), even to 3 °C. There was no interaction between cul-
tivars and vernalization temperature.
In this trial a long-day influence during vernalization was precluded.
A longer photophase during vernalization would have favoured especially the
treatments at 7 °C and 11 °C, because according to the model such tempera
tures allow both vernalization and synthesis of F. This explains the shift
towards higher optimum temperatures of vernalization, as found by Curth
(1962) when a photothermal treatment was applied (simultaneous action of
low temperature and long photophase). Gaskill (1952) mentions an optimum
temperature of vernalization of 9 °C, but in fact he too applied a 24 h pho
tophase during chilling. Recently Lasa & Silvan (1976) reported 8 °C as op
timum, also with a photophase of 24 h. It explains further also why Heide
(1973) found that a long photophase during vernalization prevented subse
quent devernalization to some extent.
The question arises whether a constant temperature during vernalization,
as is usual maintained in trials, is the most effective procedure. In bol
ting-resistant cultivars, it might be useful first to create a high amount
of V at 3 °C (the duration of this period could be adjusted according to
the susceptibility of the cultivar) and to 'convert' it cautiously in the
second part of the cold treatment, at somewhat higher temperatures and with
long days, to the more stable substance F (without destroying V by a too
high temperature). Even daily fluctuations in temperature might be more ef-
49
ficient. Wellensiek (1979) reported that vernalization of Silene armeria L.
during only the dark period was even more effective than vernalization dur
ing the whole day.
Without cold-treatment and at temperatures as high as 15 °C but under
continuous light, bolting is bound to start after a long period, also in
the most bolting-resistant single-cross. Obviously some vernalization pro
ceeds at these high temperatures, but at such a low rate that bolting only
starts at extremely long photophases and not before 6 months after sowing.
Vernalization does not seem to be a process restricted to the low tempera
ture, as is usually thought, but proceeds slowly, even at 15 °C. It might
be a common process also in plants without a quantitative or qualitative
cold requirement. Heide (1973) also mentions that in beetroot, though gener
ally more liable to bolt than sugar-beet, a constant temperature of even
18 °C under continuous illumination triggered flowering.
5.6.4 Post-vernalization
According to the proposed model, the synthesis of the final flowering
substance in the post-vernalization period is dependent on several factors,
which also interact. This makes it almost impossible to discuss the differ
ent processes like devernalization, stabilization and photoperiodical in
fluences separately. When only length of cold treatment and light phase after
vernalization were varied, these two factors were more or less interchange
able (Figures 9 and 10). According to Fife & Price (1953), these factors
can even be interchanged completely, as extremely long chilling periods of
100-300 days could provoke flowering in complete darkness. The reverse seems
to be possible also (unchilled plants flowering under continuous light, e.g.
Figures 8 and 9). According to the results shown in Section 5.5, temperature
conditions immediately after vernalization were crucial for final proportion
of bolting plants. High temperatures immediately after cold treatment strong
ly inhibit flowering. Yet there is an important interaction with photophase
as in Trial 1 (Section 5.5.1). Also after a period of neutral (stabilizing
in the literature) temperatures, devernalization remains possible, provided
the plants received a shorter light phase in the neutral period. For practi
cal sugar-beet growing, this would mean that especially in early spring with
a daylength of only 14-15 h as in the Netherlands, days with a high maximum
temperature would thus be highly effective in preventing bolting.
If thermostable end-products of the vernalization process do exist, as
proposed by Napp Zinn (1957) for Arabidopsis and Devay et al. (1976) for
winter wheat, their rate of synthesis should depend not only on temperature
but also on photophase. For sugar-beet, within the quantitative and momen
tary approach of the model, there seems to be no necessity to assume other
intermediate substances than the final flowering substance.
One of the properties of the presented model is the positive temperature
50

dependence of photoperiodic action, which means that photophase is of less
or no influence at very low temperatures. In practice, this would mean that
photophase during vernalization was of minor importance because of the usu
ally low temperatures in this process. When vernalized at 3 °C the plants
showed no significant difference between light phases of 14 and 24 h during
cold treatment (Section 5.4). Voss (1940) also reported that photophase du
ring chilling had no influence on bolting. Heide (1973) on the other hand,
mentions that in beetroot, already at 5 °C a 24 h photophase prevented de-
vernalization slightly in the post-vernalization period. Hence photophase
plays a major role at moderate temperatures after vernalization (Figure 9B).
In the described trials the difference between 18 and 24 h seems to be more
pronounced than indicated by Curth (1960).
5. 6. 5 Physiological background of the model
It is worthwhile to recall some recent physiological results, that sup
port the validity of the model. It must, however, be borne in mind that many
remarks or assumptions have not been tested experimentally directly and are
only suggestions.
Why does the model assume 2 substances to be active? Could not low tem
perature and a long photophase influence the synthesis of only one substan
ce, because photophase and temperature are more or less complementary? Ar
guments against such a concept are the different sites of perception (apex
and leaves) and the existence of a major interaction between vernalization
and photophase. Vernalization plus photophase are much more effective than
vernalization or a long photophase alone. The fact that long light phases
after vernalization have far more effect than before vernalization suggests
that cold treatment influences subsequent reaction towards photophase. Al
though it is suggested in the proposed model that V is a specific substance
that accumulates during vernalization, there is hardly any evidence for such
a substance, as many grafting experiments have failed. Schneider (1960) found
that partial plant vernalization (bud vernalization) in sugar-beet did not
lead to flowering in unvernalized buds, which shows the untransferability
of vernalization.
Therefore it has been thought that vernalization, rather than producing
a substance, brings forth a certain condition, which is transmissable by
cell division only (Barendse, 1964). If the plant is in a different condi
tion after vernalization, what would be the effect? One possibility is to
assume that the apex region has obtained an increased sensitivity towards
flowering hormone(s). In this view the growing point would react (by dif
ferentiation into stem and flower buds) only after vernalization to substan
ces exported by leaves in long-day conditions. This idea is, however, un
likely since the grafting experiments of Curtis & Hornsey (1964) and Margara
(1960) showed that unvernalized growing points could be brought into flower,
51

provided they were grafted on a flowering plant, which indicates that also
unvernalized apices can be brought into differentiation. Instead it is more
likely that vernalization is a process necessary for subsequent synthesis
of the final flowering hormone in leaves grown out of such a vernalized
growing point. The rate of this synthesis, moreover, seems to depend on the
length of the photophase. The existence of transmissable hormones exported
by leaves is, in contrast to the vernalization substance, beyond doubt (Lang,
1965).
So the amount of V in the model could quantitatively represent a certain
condition of the plants, rather than a substance, as has been suggested un
til now, mainly for simplicity. What could be the nature of such a plant
condition? Wellensiek (1977) discussed the principles of flower formation
in general and distinguished between the following groups of genes.
Flower-forming genes: a collective name for all genes influencing flower
formation in some way.
Flower-hormone-forming genes: those genes that are mainly active in the
leaves by production of floral hormone.
Floral genes: genes which act in the apex and determine, for instance,
shape and colour of the flowers and shape of the inflorescence.
Wellensiek discussed the possibility that certain groups of genes are
blocked, repressed or inhibited: 'this blocking is immobile, in the sence of
not-translocated, and it may occur in different quantities, in different in
tensities, at different levels'. Vegetative plants presumably produce leaves
in which the genes that produce flower hormone are inactive by a blocking.
This blocking can be prevented, however, by a period of low temperature.
Leaves growing out of a vernalized growing point, carry the genes forming
flower hormone in a more or less deblocked state. The longer the cold treat
ment lasts the more the flower-hormone-forming genes of the subsequently
appearing leaves are deblocked. The deblocked state is maintained by cell
division, unless reblocking takes place at high temperature, which corres
ponds to the devernalizing action of high temperatures. In agreement with
this is the conclusion of Curth (1960) that the site of perception of dever
nalizing temperatures also lies in the apex.
Assuming that blocking of such specific genes can occur at different in
tensities, it would not lead to an elementary change in the model if sub
stance V in the model were replaced by a variable V indicating the intensity
of deblocking (of flower-hormone-forming genes). Should this intensity refer
to the cellular or the plant level? Looking at a cellular level, the flower-
hormone- forming genes themselves might then be blocked in different intensi
ties. If it would turn out that only two states of blocking exist, blocked
and unblocked, the intensity of deblocking might be considered at plant lev
el, where it might represent the ratio between the number of blocked and un-
52

Rate of increase of substance F dF/dt
NON-BLOCKED
HALF "-BLOCKED
TOTALLY BLOCKED
24 Photophase (h)
Fig. 17. The hypothetical relation between the intensity of blocking of flower-hormone-forming genes, photophase and the rate of synthesis of the hypothetical flower hormone(s).
blocked, cells. One may assume that the ratio of unblocked to blocked cells
would shift if vernalization were longer. Wellensiek (1964a) also mentioned
competition between the number of vernalized and unvernalized cells.
Without the occurrence of devernalizing temperatures, leaves grown from
a vernalized growing point can then export final flowering substances to
the apex, where they play a role in the differentiation into stem or flower
buds. Whether these deblocked leaves would export these final flower promo
ting substances or not is, however highly dependent on photophase. The fol
lowing scheme could elucidate the relation between blocking and photophase
(Figure 17). Such a relation could account for the complementary action of
low temperature and photophase. As can be seen, photophase determines the
rate of synthesis of F in dependence on the intensity of blocking of the
flower-hormone-forming genes.
The model also assumes that true synthesis of F is dependent on tempera
ture. Salisbury (1963, p. 163) described the 'photoperiodical' process as
being temperature sensitive. Not only the synthesis of the flower hormone,
but also sensitivity to the hormone might be temperature-dependent. Stoddart
et al. (1978) for example found in lettuce hypocotyls a sharp decrease in
the response to gibberellic acid at temperatures lower than 13 °C. This po
sitive temperature-dependence is usually masked in plants with a cold re
quirement. In these plants, high temperatures have a twofold effect after
vernalization: more rapid initial synthesis of F and enhancement of the re-
blocking of the flower-hormone-forming genes (devernalization).
The model further assumes that the flower hormone F accumulates until a
certain level is reached, after which differentiation of the apex starts.
The validity of this assumption is supported by Zeevaart (1976) who inter-
53

preted grafting experiments in Perilla by King & Zeevaart (1973) to mean
that the stimulus has to accumulate to a threshold in the apex before flower
formation can take place. The flower hormone will act in the apex where a
possible deblocking of the floral genes will take place, resulting in dif
ferentiation into stem and flower buds.
It remains to be seen whether only one substance is involved. Bernier
(1976) offers a plausible picture, showing the existence of at least two
components in the floral hormone in Sinapis alba, one of them being cyto-
kinin. In sugar-beet, it could be imagined that one of the components is a
gibberellin-like substance mainly active in stem elongation.
More attention should be given to the consideration that flowering is
the final result of a strictly quantitative process. This might connect va
rious response types (e.g SD plants, LD plants, with or without a cold re
quirement) to the same basic principles.
54

6 Relation between growth and bolting of sugar-beet
6 .1 INTRODUCTION
External factors that encouraged growth also enhanced bolting, for in
stance low plant density (Jorritsma, 1978; Warne, 1949), heavy nitrogen
dressing (Gorodnii & Sereda, 1975; Mann, 1951; Hoekstra, 1960; Ludecke,
1938; Lysgaard, 1978) and irrigation (Röstel, 1968).
Generalizing, one could assume that almost any external factor, that sti
mulates growth after vernalization could lead to more bolters. This would
also imply that plants in a field crop with locally better growing conditions
(e.g. more nitrogen, more space or early emergence) run a greater risk of
bolting. Such a relation could well account for the greater plant weight of
bolting plants, as found by Lysgaard & Holm (1962) who showed that late bol
ters had considerably higher root and top weights than vegetative plants.
The smaller root weight at the final harvest, observed for early bolters no
doubt has been caused by the changed dry-matter distribution after onset of
stem elongation. One could imagine that early bolters also show a higher
plant weight, when measured immediately after visible stem formation. In
the following some data will be given on this subject.
More rapid growth of bolting plants before visible stem elongation need
not result only from better external growing conditions but also from quite
different factors. In the literature, some evidence can be found that plants
that have advanced more towards flowering show an increased growth. Behaeghe
(1975) observed growth differences between vernalized and unvernalized Lolium
perenne and Dactylis glomerata. Vernalized plants showed an increased top
growth, their specific leaf area was considerably greater and net photosyn
thesis per unit leaf area was higher. Davies (1971) reported similar results
in perennial ryegrass. Relative growth rates in swards of vernalized plants
were 50 % greater than in swards of comparable unvernalized material. Davies
attributed this effect to a changed distribution of the products of photo
synthesis and to differences in the rate of losses of dead matter. Junes et
al. (1975) reported that vernalization of a winter wheat cultivar increased
the photosynthetic rate by 16 %, in contrast to a spring wheat where no such
increase was measured.
Such observations could indicate that the advanced state of flower in
duction itself or other circumstances leading to flowering also promote
growth of the plants. Such a relation would also lead to higher weights of
bolting plants, assuming that especially those plants more sensitive to low
55
temperature and photophase and therefore further advanced to flowering would
show a more vigorous growth. So one may suspect that selection for bolting
resistance by breeders could have a negative effect on vigour. Selecting
for vigorous growth would, inversely, increase bolting susceptibility. If
such a relation should exist, breeders of sugar-beet are caught in a vicious
circle.
For carrots, with a similar relation between bolting and growth, Dowker
& Jackson (1975) suggested that a check was necessary whether a selection
for reduced bolting does not lead to an undesirable reduction in growth rate
in the selected lines. A very clear example was given by Parlevliet (1967)
in spinach cultivars. Parlevliet determined the growth rate of five groups
of spinach cultivars, differing in earliness. Earliness in spinach can be
taken to be similar to bolting susceptibility in sugar-beet. He found that
after equal growing periods, the later the cultivar (more bolting-resistant),
the lower its yield. Parlevliet also reported that selection for late bolting
in a population of mainly fast-growing plants almost inevitably leads to
slower growth. If, however, selection for fast-growing plants was carried
out in a population of mainly late-bolting plants, the population will become
earlier.
However, the literature provides no clear evidence that such a relation
also holds for sugar-beet. This chapter reports some trials on the influence
of external growth stimulating factors, such as additional nutrients and
irrigation.
6.2 INFLUENCE OF CONDITIONS OF GROWTH ON BOLTING
6.2.1 Introduction
Considering the positive effect of extra mineral nitrogen on bolting, a
first question was whether this effect was associated with the sluggish res
ponse to the vernalizing action of low temperature during the early stages
of growth. Nitrogen could play a role by accelerating progress towards the
stage that is more sensitive to cold. However, differences in growth caused
by nitrogen usually appear after the periods of vernalizing temperatures.
Therefore the influence of nitrogen on bolting might be mainly active after
vernalization.
6.2.2 Materials and methods
In 1976 and 1977 trials were done to study the relation between growth
and bolting. In 1976 a trial of factorial design (split plot) was set out
at Wageningen (Haarweg) in three replicates, being sown on 25 February with
cultivar Gl with a Stanhay precision drill, with rows 50 cm apart and seeds
5 cm apart in the row. After emergence on 8 April the plants were thinned
56

— 2
to a stand density of 10 m . In the trial the following factors were in
vestigated:
1 Irrigation (main factor):
R0 = control
Rl = irrigated
The crop was regularly irrigated from 5 May to 1 July. In total, the ir
rigated plots received 145 mm of water. After 1 July, all plots were ir
rigated as necessary.
2 Rate of N:
Nl = 25 kg/ha
N2 = 100 kg/ha
N3 = 175 kg/ha
N4 = 250 kg/ha
Nl + T = 25 + 75 = 100 kg/ha (T = second time of application)
N2 + T = 100 + 75 = 175 kg/ha.
On 15 March the whole field was dressed with 250 kg of 43 % superphos
phate and 500 kg of K-40. On 31 March, before emergence, nitrogen was
applied at 25 (Nl) and 100 kg/ha (N2, N3 and N4). Some plots given 100
kg/ha were given a further 75 or 150 kg/ha after emergence on 29 April
(N3 and N4). For the top-dressing treatments, Nl + T and N2 + T, the first
dressing of 25 and 100 kg/ha, respectively, was given on 31 March, to
gether with the N1-N4 treatments, the remainder of 75 kg/ha was given
on 15 June.
3 N source. The nitrogen was supplied as either
51 = Ca(N03)2 or
52 = (NH4)2S04
To avoid any differences in pH, an additional dressing of 0.61 kg of
acid-binding material was given for each kilogram of ammonium sulphate.
The trial consisted of 72 field plots, each of 6 m x 7 m. Each plot was
divided into two parts, one half used for periodical harvests of vegetative
plants on the following dates: 19 May, 24 June, 21 July, 25 August and 14
September. On these dates samples of 10, 20, 20, 20 and 40 plants, respect
ively, were taken from each plot.
In the other half of each plot with about 150 plants, bolting plants were
harvested almost weekly on the following dates: 14 June, 24 June, 1 July,
9 July, 15 July, 22 July, 29 July, 5 August, 12 August, 25 August and 14
September. On each side of the plot, 2 rows were left as border rows, to
avoid interferences between plots. For the same reason plants were left un-
harvested between successive gaps resulting from harvesting.
57

Also in the following year (1977) dry weights of bolting plants were com
pared with those of vegetative plants. For this purpose the two single-
crosses Gl and G2 were sown on 16 March at Achterberg. For each cultivar
four plots of 9 m x 14 m were sown, which were thinned on 25 and 26 May to _2
a stand of 10 m . During the growing season 25 vegetative plants per plot
were harvested at regular intervals together with bolting plants, which had
started bolting since the previous harvest. From both groups of plants, dry
weights were calculated.
6.2.3 Results
Effects on plant growth were as follows. Due to the low temperature in
the month of March 1976, field emergence did not take place before 8 April.
During this period, vernalization of the germinating seeds was probably
strong. After emergence, however, an unusually dry and warm summer ensued
which no doubt reduced the potential number of bolting plants by devernali-
zation. Especially in the first week of May, when the plants had reached
the two-leaf stage, there were several days with high maximum temperatures.
Irrigation until July encouraged growth early in the season (Table 13).
Afterwards the irrigated plots did not maintain their lead and ultimately
there was no significant influence of irrigation. Especially with little N,
growth was even retarded, perhaps because of poor rooting in the irrigated
plots, which would have had influence in the following dry and warm summer.
Table 13. Mass of dry matter per plant at successive harvest dates as influenced by irrigation, form and rate of nitrogen dressing.
Treatment
Irrigation Unirrigated Irrigated effect
Form of N Ca (NO ) (NH4) J 0 4 effect
Mass (g) on: (month-day)
5-19
0.47
°;55
0.57 0.48
Rate of N (kg/ha) 25
100 175 250 25 + 75
100 + 75 effect
0.44 0.55 0.60 0.57 0.45 0.54
6-24
38.4 39.2 -
42.3 35.4
32.3 38.3 44.1 47.5 30.3 40.5
7-21
105.5 108.6
-
109.8 104.3
100.2 103.3 112.5 115.7 103.6 107.2
8-25
193.8 183.9
190.5 187.2
185.1 180.2 191.1 204.3 181.0 191.4
9-14
206.8 198.9
-
202.2 203.5
192.9 209.9 209.6 215.1 198.7 199.7
1) *, P < 0.10; **, P < 0.05; ***, P < 0.01; ****, P_ < 0.001
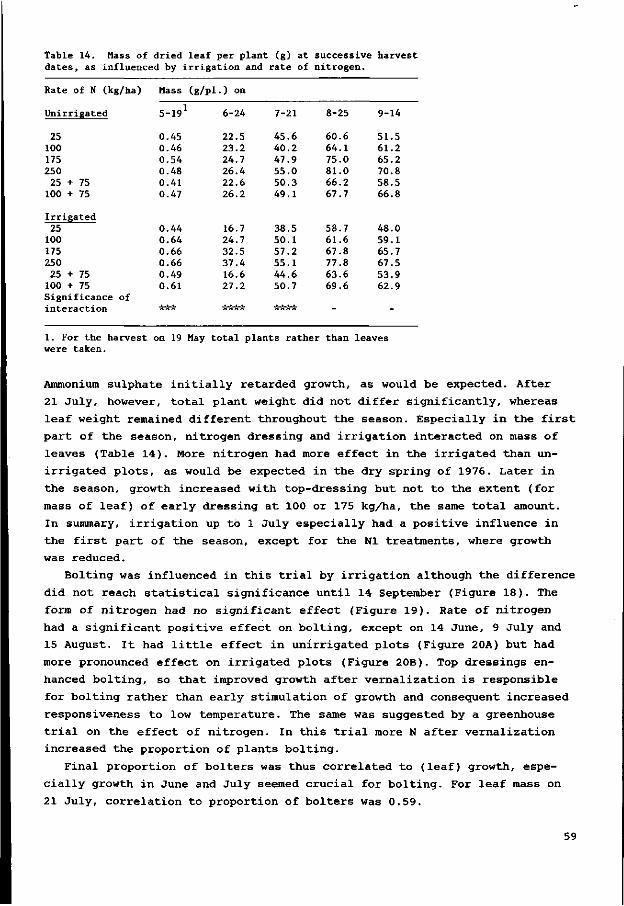
Table 14. Mass of dried leaf per plant (g) at successive harvest dates, as influenced by irrigation and rate of nitrogen.
Rate of N (kj
Unirrigated
25 100 175 250
25 + 75 100 + 75
Irrigated 25
100 175 250
25 + 75 100 + 75 Significance interaction
5/ha)
of
Mass (g/pl
5-191
0.45 0.46 0.54 0.48 0.41 0.47
0.44 0.64 0.66 0.66 0.49 0.61
***
. ) on
6-24
22.5 23.2 24.7 26.4 22.6 26.2
16.7 24.7 32.5 37.4 16.6 27.2
""""
7-21
45.6 40.2 47.9 55.0 50.3 49.1
38.5 50.1 57.2 55.1 44.6 50.7
****
8-25
60.6 64.1 75.0 81.0 66.2 67.7
58.7 61.6 67.8 77.8 63.6 69.6
-
9-14
51.5 61.2 65.2 70.8 58.5 66.8
48.0 59.1 65.7 67.5 53.9 62.9
*
1. For the harvest on 19 May total plants rather than leaves were taken.
Ammonium sulphate initially retarded growth, as would be expected. After
21 July, however, total plant weight did not differ significantly, whereas
leaf weight remained different throughout the season. Especially in the first
part of the season, nitrogen dressing and irrigation interacted on mass of
leaves (Table 14). More nitrogen had more effect in the irrigated than un-
irrigated plots, as would be expected in the dry spring of 1976. Later in
the season, growth increased with top-dressing but not to the extent (for
mass of leaf) of early dressing at 100 or 175 kg/ha, the same total amount.
In summary, irrigation up to 1 July especially had a positive influence in
the first part of the season, except for the Nl treatments, where growth
was reduced.
Bolting was influenced in this trial by irrigation although the difference
did not reach statistical significance until 14 September (Figure 18). The
form of nitrogen had no significant effect (Figure 19). Rate of nitrogen
had a significant positive effect on bolting, except on 14 June, 9 July and
15 August. It had little effect in unirrigated plots (Figure 20A) but had
more pronounced effect on irrigated plots (Figure 20B). Top dressings en
hanced bolting, so that improved growth after vernalization is responsible
for bolting rather than early stimulation of growth and consequent increased
responsiveness to low temperature. The same was suggested by a greenhouse
trial on the effect of nitrogen. In this trial more N after vernalization
increased the proportion of plants bolting.
Final proportion of bolters was thus correlated to (leaf) growth, espe
cially growth in June and July seemed crucial for bolting. For leaf mass on
21 July, correlation to proportion of bolters was 0.59.
59

Proportion bolting (%) 4 r
/
irrigated \
unirrigated
/ -+
•' ,+ ' + ' . /
/
'/
_1 I U I 1_ H 24 1 9 15 22 29 5 12 25 14 June I Ju ly | Aug. I Sept.
date
Fig. 18. Bolting as influenced by regular irrigation.
Proportion bolting (%) 4 r
Ca(N03) ,
_ ^ (NHt)2SOt
j r
?7
s/ •V
// X- 1 I 1 1 1 L, I 1 L K 24 1 9 15 22 2 3 5 1 2 25 | 14 | 12
I Auç June I July Sept. date
Fig. 19. Influence of two nitrogen sources (NH ) SO and Ca(NO ) on bolting.
6.2.4 Plant weights of bolters and non-bolters
The mass ratio of incipiantly bolting plants to vegetative plants on the
same date for each treatment (Figure 21) was usually more than 1. The weight
of vegetative plants at a date between two harvests was estimated with a
60

Proportion bolting (%) 4
Unirrigated
H 24 1 9 15 21 291 5 12 June I July I
Fig. 20. Influence of rate (areic mass) of nitrogen dressing bolting. A. Unirrigated plots. B. Irrigated plots. Labels of lines are rates of nitrogen in kg/ha either as base dressing up to 250 kg/ha or with top-dressing of 75 kg/ha (indicated by +).
regression equation (weight against time) for each of the 24 treatments in 2 this trial. Coefficient of determination (r ) was between 0.940 and 0.996,
with an average of 0.977. Calculating the ratios for each treatment separate
ly avoided bias from treatments, in which bolting as well as growth was in
creased, which would lead to an overestimate of the differences in plant
weights between bolting and vegetative plants. In general, bolters were heav
ier than vegetative plants in the corresponding treatments. That relation
held for early or late bolters. The difference was due to leaf more than to
root.
The number of harvested bolting plants for each genotype in the 1977 trial
can be found in Table 15, which also shows the significance of the differ
ences in plant weight. Bolting plants turned out to have a distinct lead in
plant weight throughout the season, as in the 1976 trial (Figure 22A, B).
6.2. 5 Conclusions
The results presented in this section show that plants that run to seed
have a larger plant weight throughout the growing season, if harvested when
their dry matter distribution is still comparable with vegetative plants.
The irrigation and fertilization experiment showed, however, that stimula-
61

T2.9 2.6 r M A S S RATIO
2.4
2.2
2.0
1.6
1.4
1.2
1.0
0.8
0.6
0.4 -
..«•-
0.2 = median
0.0 LA, _i_ 6-24 7-1 7-9 7-15 7-22 7-29 8-5 8-12 8-259-14
date
Fig. 21. Mass ratio of dry matter per beet plant with just visible bolting and vegetative plants at the same date. The median on a date is indicated by .
tion of growth by external factors enhanced bolting, so this larger p l a n t
w e i g h t m i g h t b e largely explained by b e t t e r local circumstances of g r o w t h
(e.g. p l a n t s p a c e ) w h i c h would favour g r o w t h and enhance undesirable b o l t
ing. The mechanism of how growth stimulation influences b o l t i n g remains u n
certain. The explanation m i g h t b e that in the faster growing p l a n t s the d e -
v e r n a l i z i n g temperatures have a smaller influence b e c a u s e the threshold for
b o l t i n g is reached earlier in the season. The period in w h i c h devernalizing
temperatures can have their effect is then shortened.
62

Table 15. Number of bolters and non-bolters harvested on different dates in the 1977 trial
Cultiva
Gl Gl
G2 G2
r Type
bolters non-bolters
bolters non-bolters
Significance of difference in plant weight between bolters and non-bolters
Harvest
06-16
5 101
2 100
-
date
06-27
6 100
4 100
***
(month
07-06
26 100
39 100
"fc*T
-year)
07-13
8 100
37 100
-
07-26
22 100
67 100
***
08-09
16 101
53 100
08-22
16 102
58 101
• * *
09-14
14 100
42 100
**
6.3 INFLUENCE OF COLD TREATMENT AND PHOTOPHASE ON GROWTH
6.3.1 Introduction
The observed larger plant weights of bolting plants could also be ex
plained by assuming that especially those plants more responsive to low tem
perature or light phase reacted with an improved growth. To study the in
fluence of vernalization and photophase on growth, sugar-beet plants were
subjected to various conditions in growth chambers, with extreme differences
in time of chilling and in photophase.
Mass per plant (g) 2601-
240 -
220
200
180
160
140
120
100
80
60
40
20
+ bolters non bolters
: /
f
v V
240
220
200
180
160
140
120 -
100
80
60 h
40
20
B
: /
y y
^
June July August ' Sept. June July August Sept. date
Fig. 22. Mass of dry matter per plant of just visibly bolting beet plants and (at that moment) vegetative plants. A. Cultivar Gl; B. Cultivar G2.
63
6.3.2 Materials and methods
The influence was investigated of two factors on growth, each in three 2
levels (3 factorial).
1 Time of chilling:
VI, unchilled
V2, 27 days at 3 °C
V3, 55 days at 3 °C
2 Photophase after vernalization:
P I , 9 h + 0 h = 9 h
P 2 , 9 h + 6 h = 1 5 h
P 3 , 9 h + 15 h = 24 h
All possible 9 combinations were included in the trial.
Raising the plants. Seeds of cultivar Gl were sown in paper pots and were
placed in a glasshouse at 25 °C for 8 days, after which emergence was com
plete. The temperature was then lowered to 15 °C until two leaves developed
three weeks after sowing.
Vernalization. Plants were chilled in growth chambers (Section 4.3.1) at
a temperature of 3 °C, total photophase 15 h + 0 h, rel. humidity 0.7. Ver
nalization took 0, 27 and 55 days for the three experimental groups. Sowing
dates were so organized that the cold treatments ended on the same day.
Post-vernalization. After vernalization the plants were transplanted in
to white plastic 6L pots, and kept at a temperature of 10 °C for three days.
Before transplanting 2 x 10 plants per cold treatment were sampled and mass
of dry matter and leaf area per plant were measured. Next, the plants for
each vernalization group were split up into three subgroups, each henceforth
receiving one of the following photophases: 9 h + 0 h = 9 h , 9 h + 6 h =
15 h, and 9 h + 15 h = 24 h at a temperature of 15 °C and a rel. humidity
of about 0.80. The photophase was extended in the way described in Section
4.4. The 9 treatments consisted of 18 plants.
From these 18 plants, 16 plants were harvested on three successive harvest
dates: three weeks after vernalization (4 plants), 5 weeks after vernaliza
tion (4 plants) and finally 8 weeks after vernalization (8 plants). The
plants were taken at random from each group. To exclude variation within
the growth chambers, the plants were placed on carts and were switched about
twice per week. Differences between the growth rooms were prevented as far
as possible by exchanging the plants at regular intervals between the cham
bers, thereby, of course, also changing the assigned photophase. This resis
tant genotype bolted in the V3P3 treatment after the 3rd harvest (1 plant,
which was not harvested). At the 4th harvest, 3 plants showed visible bolt-
64

Table 16A. Mass of dry mat te r per p l a n t and l eaf area per p l a n t a t t = 0 for t he t h r e e cold t r e a tmen t s .
Treatment
VI V2 V3 d .05 1
Dry mat te r (mg) 13.7 31.4 92.3 20.0
Leaf area (cm ) 1.52 2.42 6.12 1.98
1. d.05 = s tuden t ized range, (Tukey) a t t he 5 % - l e v e l . VI, unch i l l ed ; V2, 27 days a t 3 °C; V3, 55 days a t 3 °C
ing . As these p lan ts were then s t i l l comparable with vegeta t ive p l an t s , they
were included to obtain an orthogonal scheme, which f a c i l i t a t e d the s t a t i s
t i c a l procedures. At each harvest da te , the following measures of dry matter
were ca lcu la ted : b ee t - roo t per p l an t , p e t i o l e s per p l an t and leafblades per
p l an t . Also leaf area per p l an t was recorded with e i t h e r an e l e c t ron i c de
vice a t the f i r s t 2 harvests or l a t e r by sca l ing to photocopies of leafblades
of known area .
6 .3. 3 Results
At the end of cold treatment (t = 0) and before submitting the plants to
different photophases, dry matter and leaf area were first measured. Table
16A shows that longer chilling resulted in more dry matter and larger leaf
area, because plant growth did not stop entirely at 3 °C. The differences
in dry matter at t = 0 between the chilling treatments may make a later com
parison spurious. For example, even when assuming exactly the same (exponen
tial) growth for the three chilling treatments, differences in dry matter
would become even greater at following dates. To overcome this problem and
still to investigate the possible positive effect of cold treatment on sub
sequent growth, a procedure was devised for comparisons within each vernal
ization level, i.e. between the three light phases. Such comparisons can be
made at each moment after vernalization without objection, as the (average)
start position at t = 0 is the same for those treatments.
In Tables 16B, C and D, the first three lines present the main effect of
chilling (averaged over the three light phases). The fourth line indicates
the significance of the vernalization effect and also gives the Studentized
Range (Tukey) at 5 %, for comparisons between two means. The next four lines
indicate the main effect of light in the same way. The following lines of
the tables show the mean for each of the nine combinations. The significance
of an interaction can be read in the last line, together with the Student
ized Range for comparisons between any two means.
65

Table
Treatment
VI V2 V3 d.05
PI P2 P3 d.05
V1P1 V1P2 V1P3
V2P1 V2P2 V2P3
V3P1 V3P2 V3P3 d.05
16B. Harvest 3 wee
Leaf blade
(g)
0.21 0.32 0.57 0.09
0.41 0.40 0.30 0.09
0.24 0.19 0.20
0.31 0.44 0.22
0.68 0.56 0.47 0.21
Petioles
(g)
0.07 0.10 0.21 0.04
0.09 0.14 0.15 0.04
0.05 0.07 0.10
0.07 0.13 0.11
0.16 0.23 0.23
--
ks (t =
Beet root
(g)
16 46 86 24
49 58 43
-
22 14 13
38 68 33
86 91 81
--
3) after end
Total dry matter
(g)
0.30 0.47 0.86 0.14
0.55 0.60 0.49
-
0.30 0.28 0.31
0.41 0.64 0.37
0.92 0.88 0.78
--
of chi
Leaf area (cm )
73 94
164 26
106 123 103
-
69 68 83
79 129 76
170 174 149 60
Hing.
T2 -h (cm g )
349 296 299
30
265 323 356
30
288 351 408
256 295 337
250 322 324
--
T2 -̂ (cm g )
243 200 193
17
200 216 221
17
224 244 262
191 203 206
184 201 195
--
Petiole fraction of sprout
(%)
25.1 24.8 27.2
_
17.7 26.4 33.0
3.4
16.2 26.4 32.7
18.1 23.4 32.8
18.6 29.5 33.4
--
Number of leaves
7.3 7.4 9.2 1.1
7.8 8.3 7.8
~
7.0 7.8 7.0
7.0 7.8 7.5
9.5 9.3 8.8
--
VI, unchilled; V2, 27 days; V3, 55 days at 3 °C PI = total light phase 9 h; P2 = 15 h; P3 = 24 h d.05 = Studentized range at the 5 % level for comparisons between means. SLA = specific leaf area LAR = leaf area ratio.
Influence of photophase Light phase had great influence, even though all
plants received the same amount of photosynthetically active radiation. (The
light was varied with incandescent bulbs of low radiant flux density, which
had negligible effect on photosynthesis). Yet the different photophases had
a pronounced influence on dry matter production. The crop at t = 3 (3 weeks
after chilling. Table 16B) showed that sprout growth was especially influen
ced. Lengthening the light phase from 9 h (PI) to 15 h (P2) increased total 2
leaf area, though not yet significantly, and Specific Leaf Area (SLA = cm
leaf area per g dry matter of leaf laminae).
There was also a marked influence of light on petiole lenght and on pe
tiole dry matter. With longer light the mass fraction of dry matter of pe
tiole to total sprout was significantly larger.
A still longer light phase (24 h) did not further increase dry matter
production. On the contrary, a slightly inhibitory effect could be observed
with respect to 9 h. The plants under continuous light developed narrower
and yellower leaves. Petiole growth was however not inhibited to such an
extent, so that the proportion of petiole dry matter increased even further.
66

Table 16C. Harvest 5 weeks (t = 5) after chilling.
Treatment
VI V2 V3 d.05
PI P2 P3 d.05
V1P1 V1P2 V1P3
V2P1 V2P2 V2P3
V3P1 V3P2 V3P3 d.05
Leaf blade (g)
1.42 1.87 2.58 0.61 ****
2.03 2.27 1.58 0.61
**
1.31 1.65 1.32
1.81 2.33 1.47
2.97 2.84 1.94
--
Petioles (g)
0.59 0.86 1.34 0.38 * • * * *
0.71 1.13 0.95 0.38
•ÄrÄr
0.41 0.71 0.64
0.61 1.11
.87
1.11 1.57 1.34
--
Beet root (g)
0.39 0.38 0.49 --
0.51 0.44 0.30 0.20
"n
0.20 0.59 0.37
.55
.33
.26
.79
.40
.26
.47 ***
Total dry matter (g)
2.40 3.11 4.41 1.02 ****
3.25 3.85 2.82 1.02
*
1.92 2.95 2.33
2.96 3.77 2.60
4.88 4.81 3.54
--
Leaf area (cm2)
378 475 621 158 ***
434 636 404 158 ***
311 480 342
376 673 376
616 754 494
--
(cm g )
265 254 242
19 **
220 281 259
19 ****
244 292 259
208 290 263
208 261 256
--
(cm g )
158 152 141 18
•k
141 165 145
18 ***
166 159 148
127 180 147
129 154 140 42 **
Petiole fraction of sprout
(%)
28.9 31.4 34.3 3.5 ***
25.4 32.4 36.9
3.5 ****
24.1 30.4 32.3
25.4 31.6 37.2
26.6 35.3 41.1
--
Number of leaves
10.2 10.2 11.2 1.3
*
10.8 10.9 9.8 1.3
«:
10.0 10.8 9.8
10.5 10.8 9.3
11.8 11.3 10.5
--
At the third harvest (Table 16C), a similar phenomenon was observed.
Lengthening photophase from 9 to 15 h increased leaf area per plant from 434 2
to 636 cm . The increase was not due to an increase in number of leaves, but
to a higher massic area of leaves (SLA). The photophase induced faster ex
pansion of leaf area, resulted in an increase in dry matter of all plant
parts at the final harvest for the P2 plants (Table 16D). At that time the
P3 plants had practically caught up with the P2 group, so that a positive
influence of this photophase on root dry matter was observed. The negative
influence on laminae growth however remained, but together with the posi
tive effect on petiole growth, P3 plants were significantly heavier than PI
plants. Of the three photophases, 15 h was optimal for dry matter production
per plant. An increase of 42 % was observed: from 13.91 g to 19.76 g!
Influence of cold treatment Throughout the trial the chilled plants (V2
and V3) were heavier and had larger leaf area than unchilled plants. The
tables do not indicate how much of the increase should be attributed to a
positive effect of chilling on subsequent growth and how much to the natural
consequence of the different start of the three treatments. To overcome this
difficulty and to investigate the chilling effect in more detail, the foll
owing procedure was developed.
67

Table 16D. Harvest 8 weeks (t = 8) after chilling.
T r e a t ment
VI V2 V3 d . 0 5
P I P2 P3 d . 0 5
V1P1 V1P2 V1P3
V2P1 V2P2 V2P3
V3P1 V3P2 V3P3 d . 0 5
Lea f b l a d e
( g )
5 . 6 1 6 . 7 1 8 . 2 3 1.26 •îrk-lcîc
7 . 0 5 7 . 90 5 . 60 1 .26
• JWWVÏV
5 . 4 6 6 . 8 4 4 . 5 4
7 . 2 3 7 . 7 4 5 . 1 6
8 . 47 9 . 1 1 7 . 1 1
--
P e t i o l e s
( g )
3 . 5 6 4 . 7 4 6 . 4 8 1.12
iVVwWfc
4 . 0 2 5 .89 4 . 8 7 1 .12
Vw'w'C
2 . 9 1 4 . 4 6 3 . 30
4 . 0 7 6 . 0 0 4 . 1 5
5 . 0 8 7 . 21 7 . 14
--
B e e t r o o t
( g )
2 . 9 0 4 . 7 7 6 . 0 4 0 . 9 3
2 . 8 4 5 . 9 8 4 . 8 9 0 . 9 3 I 'wWwV
1.98 3 . 6 5 3 . 08
2 . 8 6 6 . 8 0 4 . 6 6
3 . 6 8 7 . 4 8 6 . 9 5 2 . 1 6
T o t a l d r y m a t t e r
( g )
12 .07 16 . 22 2 0 . 7 4
2 . 6 4 •irk-kic
1 3 . 9 1 1 9 . 76 15 . 36 2 . 6 4
****
10 . 35 1 4 . 95 1 0 . 91
1 4 . 15 2 0 . 5 4 13 .97
1 7 . 2 2 2 3 . 8 1 2 1 . 2 0
--
Leaf a r e a (cm )
1156 1315 1569 233
ArrtWr
1387 1510 1143 233 Vw'wV
1147 1403 919
1396 1480 1069
1619 1647 1441
--
(cm g )
2 0 9 . 3 1 9 8 . 6 1 92 . 4
1 5 . 6 •k-k
1 9 8 . 6 1 94 . 4 2 0 7 . 3
--
2 1 0 . 4 2 1 1 . 1 2 0 6 . 4
193 .7 1 9 1 . 3 2 1 0 . 6
1 9 1 . 6 180 .7 2 0 5 . 0
--
(cm g )
9 7 . 2 8 2 . 8 7 7 . 2
7 . 4 •&"iWc>V
101 . 2 7 8 . 6 7 7 . 3
7 . 4 ;'wWrtr
1 1 1 . 5 9 4 . 0 8 6 . 1
9 7 . 8 7 2 . 9 7 7 . 6
9 4 . 4 6 8 . 8 6 8 . 4
--
P e t i o l e f r a c t i o n of s p r o u t
(%)
3 9 . 2 4 1 . 1 4 3 . 6
4 . 2
**
3 6 . 3 4 2 . 4 4 5 . 2
4 . 2 - W - V *
3 4 . 8 4 0 . 7 4 2 . 0
3 6 . 5 4 2 . 6 4 4 . 2
3 7 . 7 4 3 . 9 4 9 . 3
--
Number of l e a v e s
1 3 . 6 1 5 . 5 1 6 . 3
1.6
1 8 . 3 1 3 . 6 1 3 . 5 1.6
ï'wWwV
1 6 . 6 1 2 . 9 1 1 . 3
18 .9 1 3 . 4 1 4 . 1
1 9 . 3 14 . 5 1 5 . 1
--
Standard deviations of plant dry matter and leaf area increased with time.
To render the variability more homogeneous with time, values to total dry
matter per plant (W) and leaf areas per plant (LA) were transformed to na
tural logarithms (Hunt & Parsons, 1974).
For each of the 9 VP combinations, a 2nd-degree polynomial was then fit
ted to the transformed data, according to the following regression model:
l n ( x . . 7 ( t ) ) = a . + ß..t + y..t 2 + e..,(t) (2) x i]k ' ' l H2j ' ij i j k
[e (t) = v(0,o)] ijk
in which In (x... (t)) refers to the natural logarithm of either mass (W) ijk
or leaf area (LA) of plants submitted to the ith chilling treatment (i = 1,
2, 3) and afterwards growing under the j'th light regime (j = 1, 2, 3). The
subscript k refers to the ordinal number of the harvested plant (k = 1, 2,
3, 4 or k = 1, 2 ....8) within a ViPj combination at time t after vernali
zation (t = 0, 3, 5, 8 weeks). The model required that all observations with
the same degree of vernalization were fitted with equations with the same
constant a.. Such a regression model was chosen because all plants with the
same cold treatment Vi had had the same treatment until t - 0. Hunt & Parsons
68

Table 17. Analysis of variance for mass of dry matter and leaf area per plant.
Plant parameter
Dry matter (W)
Source of variation
c.f' 2 3
linear quadratic error
Sum of squares
40.02 77.73
137.10
254.85
425.26 8.14
10.28
Degrees of freedom
1 1 1
(3)
9 9
129
Mean square
47.25 0.91 0.08
F
593.01 11.35
P
<0.001 <0.01
total 698.53 150
Leaf area (LA) c f .
1 1683.98 2 1803.47 3 2016.05
5503.50
linear 288.95 quadratic 30.90 error 8.75
total 5832.09
1 1 1
(3)
9 9
129
150
32.11 3.43 0.07
473.18 50.60
<0.001 <0.001
1. cf. correction factor.
(1974) and Nicholls & Calder (1973) have warned against overfitting, meaning
that quadratic or cubic terms should not be included in the regression model
if insignificant. The ANOVA tables for W and LA (Table 17) show that also
the quadratic term is significant for both plant parameters. So a 2nd-degree
polynomial was fitted to the transformed data.
The estimated regression coefficients for W and LA are presented in Ta
bles 18 and 19. They allow estimates to be made of W and LA throughout the
trial without any awkward interpolation. Figures 23 and 24 show the resul
ting curves for dry mass and area for each of the combinations.
Relative growth rates (RGR) can easily be computed, as:
RGR(t) = 1/W x dW/dt = d[ln (W(t))]/dt (3)
in which In W(t) represents the estimate of the logarithm of mass at time t
weeks after vernalization.
Differentiation of Equation 2 allows the RGR to be expressed as a func
tion of time:
RGR(t) = ß + 2yt (week-1) (4)
Figures 25 A, B, C shows the calculated course of the relative growth
69

Table 18. Regression coefficients for mass total dry matter per plant as a function of time:
In (W... (t)) = a. + ß.. t + v.. t2
ijk y-JJ -i EM - *ij_ -
Treatment
c h i l l i n g (V VI VI VI
V2 V2 V2
V3 V3 V3
photophase (Pl)
PI P2 P3
PI P2 P3
P I P2 P3
Regression c oe f f i c i en t s
a. l
-4 .52 -A. 52 -4 .52
-3 .68 -3 .68 -3 .68
-2 .55 -2 .55 -2 .55
ß ü
1.275 1.309 1.338
1.116 1.232 1.029
0.987 0.920 0.831
Yii
-0.0526 -0.0505 -0.0599
-0.0409 -0.0497 -0.0299
-0.0390 -0.0256 -0.0163
For explanation of treatment codes see Table 16B.
rate for each of the 9 combinations. For each of the three chilling treat
ments, P2 plants had a higher RGR than the corresponding PI plants during
the greater part of the trial. Continuous light (P3) reduced the RGR in un-
chilled plants.
Chilled P3 plants initially grew slower too but later grew faster than PI
and P2 plants.
Figure 25 also shows that the RGR decreased with advancing stage of de
velopment, hampering direct comparison of relative growth rates between dif
ferent chilling treatments, because of the different plant weights at time
t = 0. Rather than to compare the RGR at a given moment of time, a compari
son at the same growth stage would be a better approach. Although rather ar-
Table 19. Regression coefficients for leaf area per plant as a function of time.
Treatment
c h i l l (V VI VI VI
V2 V2 V2
V3 V3 V3
i n g photophase
PI P2 P3
PI P2 P3
P I P2 P3
Regression
a. l
0.44 0.44 0.44
0.85 0.85 0.85
1.86 1.86 1.86
coef f ic ien
ß M
1.471 1.544 1.585
1.386 1.653 1.392
1.303 1.347 1.228
t
YM
-0.0814 -0.0868 -0.0993
-0.0743 -0.1062 -0.0784
-0.0769 -0.0822 -0.0692
For explanation of treatment codes see Table 16B.
70

Total mass per plant (g) 20
0LV>
1 r 2
1 r3
3 4 5 6 7 8 Time from end of chilling (weeks)
Fig. 23. Mass of total dry matter per plant as a function of time with different periods of chilling (VI, unchilled; V2, 27 days and V3, 55 days chilled) and different photophases after chilling (PI, 9 h; P2, 15 h and P3, 24 h).
71

Leaf area per plant (cm2) 20O0 r
1500
1000
1500
1000
500
0L*
V, : chilled 55 days
3 4 5 6 7 8 Time from end of chilling (weeks)
Fig. 24. Leaf area per pLant as a function of time in the various combinations of chiliing and photophase (as in Figure 23).
72

RGR (week"1) 1.2
1.0
.8
.6
.4
.2
1.2
1.0-
V, :unchilled V2: chilled 27 days
1.2
1.0
.8
.6
.4
.2
J i_
" V3: chilled 55 days
i 0 2 4 6 8 Time a f te r chilling (weeks)
Fig. 25. Relative growth rates (RGR) after cold treatment as influenced by length of the chill ing period and subsequent photophase.
b i t r a r i l y , i n t h e f o l l owing p r o c e d u r e , t o t a l d r y we igh t p e r p l a n t i s chosen
as a y a r d s t i c k f o r deve lopment .
At t ime t a f t e r v e r n a l i z a t i o n (Equa t ion 2 ) , mass of d ry m a t t e r W w i l l be
.2 I n (W) = a + ß t + v t o r
( a - l n (W)) + ß t + yt2 = 0
A common type of equation.
= -ß + h 2 -4(g - in (W))Y 2Y
can be converted to
ß + 2yt = Vl ß" - 4(a - ln(W))v
(5)
(6)
(7)
(8)
Comparison with Equation 4 shows that the left term represents relative
growth rates which can be calculated from the right side when plant mass
equals W. Relative growth rate is then a function of a, ß, Y and W, rather
than a function of ß, Y and t as in Equation 4:
RGR(W) = Vß 2 - 4(ot - In (W))Y (week ) (9)
This equation allows comparison between cold treatments at a given plant
mass rather than at a certain moment, thereby preventing differences in
growth parameters arising from differences in development.
In Figure 26, the RGR is plotted against plant mass. The natural decrease
73

RGR (week"1) 1.0 h
Photophase
1.0
.8
.6
.4
.2
0
Photophase : 15 h
V,P2 t V,R 2 r 2
1.0
.8
.6
4
.2
-
Photoph
i i
nse : 24 h
= = — v -V P
^ V P
I I
3r3
12 16 0 4 8 12 16 Mass per plant (g)
Fig. 26. Relative growth rates as function of mass of dry matter per plant for various combinations of chilling and photophase (as in Figure 23).
in relative growth rate with advancing stage was less marked in chilled
plants.
At a plant mass of 16 g, V3 and/or V2 plants grew faster with each light
phase. Immediately after chilling, the contrary seems to be true, perhaps
because cold-treatment plants had more acclimatization problems in resump
tion of growth than unchilled plants.
In the same way as relative growth rate based on plant mass, a growth
parameter can be based on leaf area, the relative expansion rate (RER).
Normally the formule is:
RER (t) = l/LA(t) dLA/dt (week -1, (10)
To make RER a function of leaf area rather than time, the same procedure
can be followed as for the RGR:
RER(LA) = r 4(a - In (LA))y (ID
in which a, ß and y are the regression coefficients for the estimate of leaf
area per plant. In Figure 27, RER is plotted against leaf area per plant.
At each leaf area, P2 leaves expanded faster than PI. Those of P3, however,
expanded slower in all chilling treatments. In Figure 28, the effect of a
previous cold treatment on expansion of leaf area can be read for each light
phase, again at a particular leaf area. The impression is obtained that cold
treatment affects this rate too. Especially the plants with 9 and 24 h light
phase had a gradually increasing advantage with increasing cold period.
Yet another growth parameter, net assimilation rate (NAR), can easily be
computed with the calculated regression coefficients:
74

Relative expansion rate (week ) 1.0 h
V, : unchilled
.4 -
.2 -
V3 : chilled 55 days
_l_ _L _l_
^V3P2
VV3P,
_L 0 200 400 600 800 1000
Leaf area per plant (cm2)
Fig. 27. Influence of photophase on relative rate of increase in leaf area (as a function of leaf area) after chilling for 0, 27 and 55 days.
75

Relative expansion rate ( week"1 ) 1.0 -
.8
2 -
0
1.0
0
1.0
Photophase : 9 h
Photophase : 15 h
B
j i_
Photophase : 24 h
V9P7
-V,P,
0 200 400 600 800 1000 Leaf area per plant (cm2)
Fig. 28. Influence of time of chilling (VI, 0; V2, 27 and V3, 55 days) on the relative rate of increase in leaf area (as a function of leaf area) with photophases of 9 h (A), 15 h (B) and 24 h (C) after chilling.
76
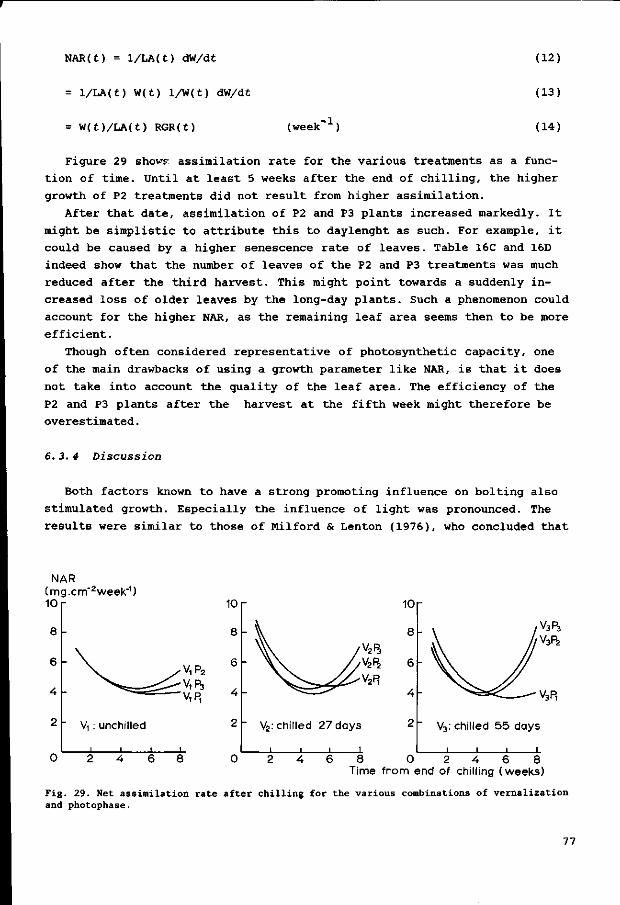
NAR(t) = l/LA(t) dW/dt (12)
l/LA(t) W(t) 1/W(t) dW/dt
W(t)/LA(t) RGR(t) (week- 1)
(13)
(14)
Figure 29 showp assimilation rate for the various treatments as a func
tion of time. Until at least 5 weeks after the end of chilling, the higher
growth of P2 treatments did not result from higher assimilation.
After that date, assimilation of P2 and P3 plants increased markedly. It
might be simplistic to attribute this to daylenght as such. For example, it
could be caused by a higher senescence rate of leaves. Table 16C and 16D
indeed show that the number of leaves of the P2 and P3 treatments was much
reduced after the third harvest. This might point towards a suddenly in
creased loss of older leaves by the long-day plants. Such a phenomenon could
account for the higher NAR, as the remaining leaf area seems then to be more
efficient.
Though often considered representative of photosynthetic capacity, one
of the main drawbacks of using a growth parameter like NAR, is that it does
not take into account the quality of the leaf area. The efficiency of the
P2 and P3 plants after the harvest at the fifth week might therefore be
overestimated.
6.3.4 Discussion
Both factors known to have a strong promoting influence on bolting also
stimulated growth. Especially the influence of light was pronounced. The
results were similar to those of Milford & Lenton (1976), who concluded that
NAR (m g. cm"2 week"1) 10r
V! : unchilled
10
8
6
4h
2
V2P3
V2P2
V2R
V2: chilled 27 days
10
8
6
A
2
0
V3P3 V3P2
V3P,
V3: chilled 55 days
6 8 0 2 4 6 8 Time from end of chilling (weeks)
Fig. 29. Net assimilation rate after chilling for the various combinations of vernalization and photophase.
77

the increased growth at the longer photoperiod (light phases of 12 h and
12 h + 4 h) was effectuated by a change in leaf area ratio and specific leaf
area and not by an increase in the photosynthetic activity of the leaf sur
face.
Until the 5th week, Figure 29 supports that view. As has already been
mentioned, the rapid increase of the NAR after the 5th week for P2 and P3
plants may be unreliable.
The observed negative effect of continuous light was also observed in
spinach by van Oorschot (1960), who found an optimum curve for dry matter
production. An optimum for fresh and dry matter was with a photophase of
21 h.
The extension of the light phase with incandescent lamps brought about
morphogenetic effects, which resemble the effects when gibberellin is ap
plied to sugar-beet plants. Especially the marked effect on petiole length
and leaf shape was very similar. The same effect of long photophase and gib
berellin was observed in spinach by Zeevaart (1971), who suggested that long
days promote a higher rate of gibberellin biosynthesis and increased sensi
tivity to gibberellin to cause the observed growth responses. Probably this
is a phytochrome-mediated response, induced by red or far red light emitted
by the incandescent lamps.
Milford & Lenton (1976) mentioned that also growth in the field may be
influenced by the spectral radiant energy of natural daylight. According to
Smith (1975, p. 151), a shift towards far red can occur within the canopy
of the sugar-beet crop. The field observation that petiole length and weight
increased at high plant densities might also be connected with the change
in the spectrum in such a canopy.
This morphogenetic behaviour (faster expansion of the leaf area) might
help to achieve a closed canopy earlier in the season. Therefore, possible
genotypic differences in reaction towards photophase or differences in re
action to particular wavelengths should perhaps receive more attention by
breeders (or growers of indoor vegetables to save energy).
Also previous cold treatment had a positive effect on growth of the plants.
RGR decreased at a slower rate in chilled plants than in unchilled ones and
leaf area expanded faster.
Are these effects, if caused by the cold treatment, related to vernaliza
tion (the flower-inducing process)? Or does the low temperature cause some
changes independent of vernalization? Behaeghe (1978), for grasses, consid
ered the positive effect of low temperature on growth completely independent
of vernalization and so coined the name 'hibernation' (Figure 30).
Yet, for my trial and that of Behaeghe stimulation of growth should per
haps not be ascribed mainly to the differences in previous treatment but
rather as a side effect of low temperature. For example, during cold treat
ment, root development might be relatively favoured, which could have a po
sitive influence in the following period.
78

COLD TREATMENT
HIBERNATION VERNALIZATION
GROWTH STIMULATION FLOWER INDUCTION
Fig. 30. Hypothetical relation between cold treatment, growth stimulation and flower induction (after Behaeghe, 1978).
Considering the positive effect on productivity resulting from photophase
and from low temperature one must ask also whether there is a definite rela
tion with the usual larger plant weight of just visibly bolting plants. Just
as Behaeghe (1978) believed that the growth-stimulating effect of low tem
perature could be independent of the flower-inducing effect, the same could
apply for photophase. Figure 31 represents such a relation.
Arguments for such an independent action of photophase on growth and on
flower induction are:
Only chilled plants respond to photophase in flowering, whereas both
chilled and unchilled plants respond to the morphogenetic action of photo-
phase.
- The photophase causing the most rapid flowering seems to be 24 h (Chapter
2; Curth, 1960), whereas for growth a shorter photophase was optimum.
Despite these discrepancies, there were similarities. Gibberellin may be
one of the components of the flowering hormone or may play some role in the
stem-formation process. The enhanced biosynthesis of gibberellin with longer
PHOTOPHASE
PHOTOMORPHOGENESISy .PHOTOPERIODISM
GROWTH STIMULATION FLOWER INDUCTION
FLOWERING
Fig. 31. Hypothetical relation between photophase, flower induction and growth stimulation.
79

photophases (Zeevaart, 1971) could have two effects, one on stem formation
and one on increasing leaf expansion. These processes may have a different
optimum concentration of gibberellin.
6.4 INFLUENCE OF SELECTION TOWARDS BOLTING RESISTANCE
6.4.1 Introduction
In the schemes describing the influence of photophase and cold treatment,
an arrow was drawn with a question mark. (Figures 30 and 31), since evidence
was required whether plants induced to flower (or more liable to flower)
had an increased growth rate. If so, selection by breeders to improve bol
ting resistance could mean a loss in growth rate. To answer this question,
the plant breeders van der Have B.V. supplied several genotypes in which a
possible negative influence on productivity of such a selection could be
tested.
6. 4. 2 Materials and methods
Most modern cultivars are triploids (3n) obtained by crosses between a
tetraploid (4n) and a diploid (2n) monogerm malesterile (HoMs) genotype.
Selection towards bolting resistance in three tetraploids (Tl, T2 and T3 )
was carried out by van der Have in 1975 by sowing early. From the non-bol
ting plants, seed was grown in the year 1976: TS1, TS2 and TS3. Crosses were
made between the selected tetraploids and one diploid monogerm male-sterile
genotype and also between the original populations and the same diploid ge
notype. The resulting 6 triploid single crosses were sown out, together with
the 6 tetraploid genotypes (Table 20) at 5 sites in 1977: at Wageningen,
Frederika Polder and Zimmerman Polder, being sown on 20, 27 and 21 April,
respectively, and in Germany at Coverden and Sollingen on 21 March and 26
April, respectively. Except at Wageningen, the trials were supervised by
van der Have, as part of their varietal trials.
6.4.3 Results
In the early-sown trial at Coverden, many beet bolted. Comparison of Se
lection 1 with 2, 3 with 4, and so on, showed that selection had been effec
tive both for tetraploids and triploids (Table 20).
To investigate the influence of selection on productivity, periodical
harvests were carried out at Wageningen. Table 21 shows the relevant figures
of the first and second harvest. The data of the first harvest indeed sug
gest a slight reduction in dry matter and leaf area per plant. Analysis of
variance showed, however, that this was not significant. (P < 0.143) and (P
< 0.151), respectively. For the second harvest on 29 June especially root
80
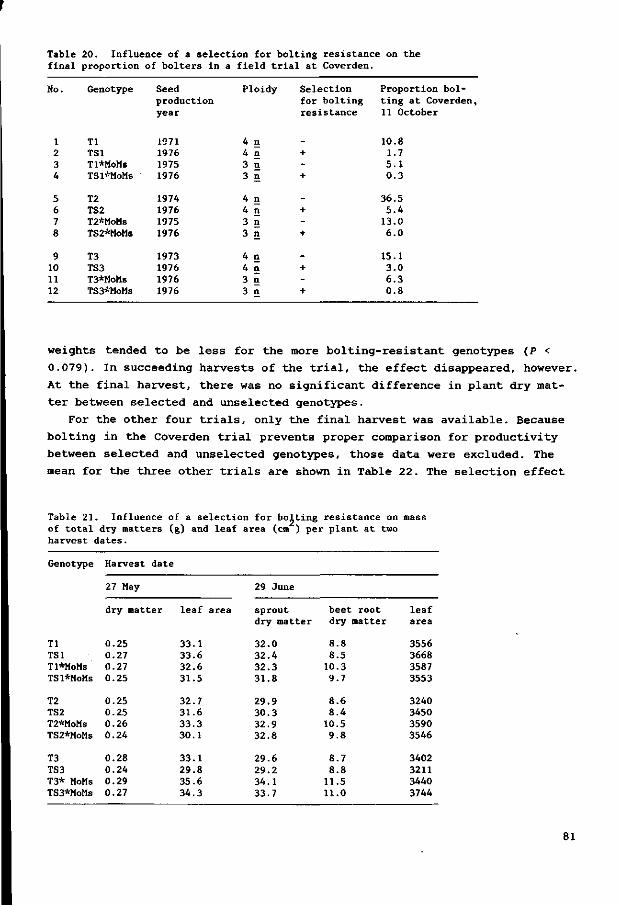
Table 20. Influence of a selection for bolting resistance on the final proportion of bolters in a field t r i a l at Coverden.
No.
1 2 3 4
5 6 7 8
9 10 11 12
Genotype
Tl TS1 Tl*MoMs TSl*MoMs
T2 TS2 T2*MoMs TS2*MoMs
T3 TS3 T3*MoMs TS3*MoMs
Seed production year
1071 1976 1975 1976
1974 1976 1975 1976
1973 1976 1976 1976
Ploidy
4 4 3 3
4 4 3 3
4 4 3 3
n n n n
n n n n
n n n n
Selection for res
_ + -+
-+ -+
-+ -+
bolting istance
Proportion bolting at Coverden, 11 October
10.8 1.7 5.1 0.3
36.5 5.4
13.0 6.0
15.1 3.0 6.3 0.8
weights tended to be l e s s for the more b o l t i n g - r e s i s t a n t genotypes (P < 0.079). In succeeding harvests of the t r i a l , the e f fec t disappeared, however. At the f ina l harvest , there was no s i gn i f i can t d ifference in p l an t dry matt e r between se lec ted and unselected genotypes.
For the other four t r i a l s , only the f ina l harves t was ava i l ab le . Because bo l t ing in the Coverden t r i a l prevents proper comparison for p roduct iv i ty between se lec ted and unselected genotypes, those data were excluded. The mean for the three other t r i a l s are shown in Table 22. The s e l ec t ion e f fec t
Table 21. Influence of a selection for bolting resistance on mass of t o ta l dry matters (g) and leaf area (cm ) per plant a t two harvest dates.
Genotype
Tl TS1 Tl*MoMs TSl*MoMs
T2 TS2 T2*MoMs TS2*MoMs
T3 TS3 T3* MoMs TS3*MoMs
Harvest date
27 May
dry matter
0.25 0.27 0.27 0.25
0.25 0.25 0.26 0.24
0.28 0.24 0.29 0.27
leaf area
33.1 33.6 32.6 31.5
32.7 31.6 33.3 30.1
33.1 29.8 35.6 34.3
29 June
sprout dry matter
32.0 32.4 32.3 31.8
29.9 30.3 32.9 32.8
29.6 29.2 34.1 33.7
beet root dry matter
8.8 8.5
10.3 9.7
8.6 8.4
10.5 9.8
8.7 8.8
11.5 11.0
leaf area
3556 3668 3587 3553
3240 3450 3590 3546
3402 3211 3440 3744
81

Table 22. Influence of a selection for bolting resistance on final root yield and sugar content.
Genotype
Tl TS1 Tl*MoMs TSl*MoMs
T2 TS2 T2*MoMs TS2-MoMs
T3 TS3 T3-MoMs TS3*MoMs
Average of
root yield (t/ha)
51.97 52.03 54.53 55.27
45.97 46.10 51.83 49.80
53.37 52.03 57.13 54.83
three trials
sugar con
(g/kg)
173.9 175.1 179.3 178.8
189.1 189.7 186.6 189.1
177.6 178.8 181.8 182.4
(withe
tent
ut Coverden):
white sugar (g/kg)
150.7 151.8 154.9 154.9
165.9 166.4 162.7 166.4
151.4 152.9 157.1 157.6
was insignificant (P < 0.19). Surprising was that the selected genotypes
showed a consistently higher content of sugar and of white sugar (P < 0.017)
and (P < 0.015) .
6.4.4 Discussion
The possible negative effect on productivity of previous selection against
bolting could not be detected. Only the second harvest in the Wageningen
trial showed less root but at a low significance. The influence of selection
might, however, be confounded with differences in seed age (Table 20).
Further the question arises whether these trials were sufficiently discrimi
native to detect possible small effects of selection. The question also ar
ises whether there had been only a selection against bolting or that, unwit
tingly, also other selection criteria had played a role. Of the non-bolting
plants in the selection year, only the most vigorous plants might perhaps
have been chosen for production of the improved tetraploids. Such a selec
tion would counteract possible negative effects of selection only against
bolting.
For the positive effect on sugar content, no explanation is available.
According to the breeder, selection was only against bolting and not for
sugar content.
Lysgaard (1978) investigated the effect of selection against bolting on
yield in fodder-sugar-beet. His trials, in which none of the plants bolted,
showed that selection against bolting did not reduce dry matter productivi
ty. In two of the cultivars even an increase was found. Also Yusubov (1977)
stated that elimination of bolting biotypes from tetraploid sugar-beet popu
lations did not reduce yield.
82

So there is no strong relation of bolting resistance with productivity,
in contrast to spinach where selection inevitably leads to reduced growth
(Parlevliet, 1967). In spinach, however, the difference between early and
late cultivars might be larger than in sugar-beet cultivars, which already
possess an acceptable resistance to bolting (biennial character). In geno
types with more extreme differences in bolting, a relation might come to
light.
83

7 Temperature and bolting under field conditions
7.1 INTRODUCTION
In certain years, bolting in sugar-beet occurs to such an extent that
yield is reduced. In the Netherlands the years 1972 and 1973 were known as
such "bolter years". Often it is not known why such years deviate.
It might be due to early sowing, which lengthens the subsequent period of
low temperature. Further the temperature in corresponding periods between
the years might be below average. Furthermore in some years, the absence of
high (devernalizing) temperatures might increase the risk of bolting.
This chapter correlates the course of temperature after sowing to the
observed final percentage of bolters in the field. Data were kindly supplied
by the 'Instituut voor Rationele Suikerproduktie' (1RS) at Bergen op Zoom
and also by the 'Rijksinstituut voor Rassenonderzoek' (RIVRO) at Wageningen.
These institutes arrange annual trials on sowing date for several cultivars
at sites throughout the country. Sowing and emergence dates, and final pro
portion of bolters were recorded.
Data were from trials with cvs. Monohil and Polykuhn. For the period
1966-1976, 53 sowing dates (further indicated with cases) were available
for Monohil and 60 sowing dates for Polykuhn. The final percentage of bol
ters was transformed to arcsines: angle (%) = arcsine (4 %/Ï00 ). In the
trials, true 'annual' plants (caused by 'contamination' with annual beet
types) were not included in the final proportion of bolters.
7.2 THE RELATION BETWEEN BOLTING AND SOWING DATE
A first impression of the data is given by Figure 32, which shows the
transformed percentages in the different years for cv. Monohil and suggests
rather good relation with the sowing date, as expected. A 2nd-degree poly
nomial against time from 1 March to the sowing date had a coefficient of 2 determination (r ) of 0.508. Figure 33 shows the same angles against date
2 of emergence. The relation was poorer: r - 0.282. In cv. Polykuhn, the respective coefficients were 0.620 and 0.412. The better relation with sowing date than date of emergence supports remarks made in Section 5.1 about the absence of a true juvenile phase. If vernalization took place only after emergence, the relation with date of emergence would be at least as good.
Figure 32 already allows satisfactory prediction of the proportion of
bolters (r = 0.7!). However, the course of temperature after sowing or after
84

! of bo l te rs
r' =50.8%
a =1966 à. =1967 * = 1968 • = 1969 v = 1970 « = 1971 • =1972 • = 1973 + = 1974 0 = 1 9 7 5 • = 1976
4 May
Sowing date
Fig. 32. Relation between sowing date and the proportion of bolters (transformed into angles) under field conditions for cultivar Monohil.
emergence for each case may give a still better relation, which would also
be more causal than the indirect relation with the sowing date. Certain
years showed a systematic deviation from the proportion of bolters predicted
(Figure 32). In 1969, 1972, and 1973, more bolters appeared, whereas in 1971,
1974 and 1976 fewer bolters developed than would be expected from the sowing
date. An abnormal course of temperature was probably responsible for those
deviations. Although 1976 had a cold spring, probably the proportion of bol
ters was reduced by the high temperatures in late spring and in summer.
7.3 A REGRESSION APPROACH
How can the relation temperature and proportion of bolters be analysed?
Several choices have to be made.
In what period should the temperature be considered: after emergence or
after sowing, and how long should this period be?
Should daily, weekly or monthly temperatures be used?
Which temperatures should be used, maxima, minima or average temperatures?
First it was decided to use only the temperature data of the Meteorologi-
85

Angle of bolters 16
a = 1966 ^=1967 *=1968 • = 1969 v=1970 »=1971 •=1972 •=1973 +=1974 0 = 1975 •=1976
20 30 10 20 30 April | May
Date of emergence
Fig. 33. Relation between date of emergence and the final proportion of bolters (angles) under field conditions for cultivar Monohil.
cal Station De Bilt near Utrecht. Of course the most accurate procedure
would have been to use the temperature of the nearest station to each of the
trials. Inspection of the bolting data, however, revealed no consistent re
gional deviation. There are no extreme temperature differences between the
different parts of the Netherlands.
As the final proportion of bolters is related to the number of 'vernal
izing' days after sowing or emergence, one must decide what should be con
sidered as a 'vernalizing' day. Therefore, for each case (observation, sow
ing date) the days were counted with a temperature of up to 0, 2, 4, 6, 8,
10, 12, 14 and 16 °C, giving 9 numbers per case. These counts were made for
the period between sowing date and 1 July, for minima, maxima and average
daily temperatures. With each of the counts, a simple correlation coeffi
cient was computed with the angle (arcsine) of the final proportion of bol
ters (Table 23). For both cultivars the closest correlation (0.76 and 0.83)
was with number of days with a maximum temperature up to 12 °C. The same
procedure was followed for number of days from emergence rather than sowing
(Table 24). On average, the correlation coefficients were smaller, as one
would expect by comparison between Figures 32 and 33. The relevant period
should therefore begin at sowing.
86

Table 23. Simple correlation between the angle of bolters and the number of days from sowing date until 1 July with a (minimum, average or maximum) temperature 40, 2, 4 16 °C.
Variety
Monohil
Polykuhn
Temperature
minimum average maximum
minimum average maximum
Tempe
\<0
0.52 0.06 -
0.53 0.02 -
rature
42
0.50 0.14 -
0.68 0.03 -
(°C)
<<4
0.54 0.37 0.02
0.66 0.23 0.06
«6
0.64 0.49 0.09
0.76 0.63 0.06
v<8
0.67 0.75 0.43
0.75 0.78 0.35
410
0.67 0.73 0.72
0.71 0.79 0.76
s<12
0.69 0.73 0.76
0.72 0.78 0.83
.<14
0.68 0.68 0.76
0.72 0.76 0.79
N<16°C
0.68 0.70 0.74
0.72 0.73 0.81
n=53 n=53 n=53
n=60 n=60 n=60
- : correlation coefficient cannot be computed.
Daily maxima gave the best co r re la t ion with bo l t ing . Daily minima are
probably l ess indica t ive of a r e a l l y vernal izing day. In the climate of the
Netherlands, days in May or June with a low minimum temperature can be ab
normally warm during dayl ight . Further s tudies revealed t ha t a lso for the
r e l a t ion with a devernalizing day the bes t r e l a t ion was found when dai ly
maxima were used. Daily maxima were therefore used.
The following question had to be answered now: in what period should tem
perature be considered? A choice had to be made between two opt ions:
a fixed period from sowing, e .g . 8 weeks a f te r sowing
a period from sowing to a fixed date, e .g . from sowing un t i l 1 July
A fixed period has the advantage t ha t time i s equal for each case but
the disadvantage t ha t an ear ly sowing date gives qui te a d i f ferent i n te rva l
from a l a t e r sowing date and r e su l t s in a d i f ferent photophase.
An i n te rva l to a fixed date means t h a t a t l e a s t the l a s t p a r t of the i n
t e rva l i s equal for each case. The beginning wi l l d i f fe r for each sowing
Table 24. Simple correlation between the angle of bolters and the number of days from emergence until 1 July with a (minimum, average or maximum) temperature 40, 2, 4 16 °C.
Variety Temperature Temperature (°C)
40 42 4U S6 4& N<10 <U2 ^<14 v<16 °C
Monohil minimum 0.25 0.24 0.32 0.50 0.58 0.57 0.58 0.55 0.55 n=53 average - - 0.24 0.15 0.60 0.58 0.59 0.60 0.59 n=53 maximum - - - - 0.39 0.50 0.50 0.62 0.56 n=53
Polykuhn minimum 0.48 0.53 average maximum
0.57 0.23 -
0.64 0.54 -
0.68 0.63 0.29
0.64 0.63 0.60
0.64 0.63 0.61
0.61 0.70 0.66
0.61 0.64 0.69
n=60 n=60 n=60
-: correlation coefficient cannot be computed.
87
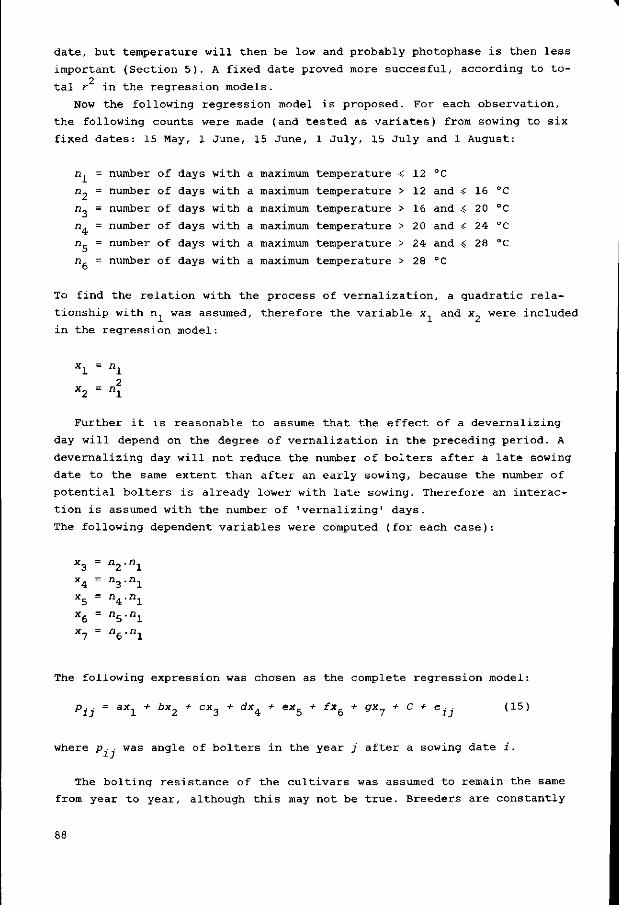
date, but temperature will then be low and probably photophase is then less
important (Section 5). A fixed date proved more succesful, according to to-2 . tal r in the regression models.
Now the following regression model is proposed. For each observation,
the following counts were made (and tested as variâtes) from sowing to six
fixed dates: 15 May, 1 June, 15 June, 1 July, 15 July and 1 August:
n. = number of days with a maximum temperature ̂ 12 °C
n_ = number of days with a maximum temperature > 12 and -S 16 °C
n, = number of days with a maximum temperature > 16 and -S 20 °C
n. = number of days with a maximum temperature > 20 and « 24 °C
n. = number of days with a maximum temperature > 24 and ̂ 28 °C
n, = number of days with a maximum temperature > 28 °C
To find the relation with the process of vernalization, a quadratic rela
tionship with n was assumed, therefore the variable x and x_ were included
in the regression model:
x2 = n\
Further it is reasonable to assume that the effect of a devernalizing
day will depend on the degree of vernalization in the preceding period. A
devernalizing day will not reduce the number of bolters after a late sowing
date to the same extent than after an early sowing, because the number of
potential bolters is already lower with late sowing. Therefore an interac
tion is assumed with the number of 'vernalizing' days.
The following dependent variables were computed (for each case):
X 3 X 4 X 5 X 6 X 7
-= = = =
B2 n3
n 4 n5 ne
n i n i n i n i
• n i
The following expression was chosen as the complete regression model:
p. . = ax.. + bx7 + ex. + dx„ + ex. + fxfi + gx„ + C + e . . (15)
where p . . was angle of bolters in the year j after a sowing date i .
The bolting resistance of the cultivars was assumed to remain the same
from year to year, although this may not be true. Breeders are constantly

selecting in their families and lines. It could only be hoped that this
would not be too disturbing a factor. Regression analysis was with the com
puter package SPSS (SPSS manual, 1975). Stepwise inclusion was combined with
hierarchical inclusion. The variables x. and x, (vernalization) were entered
together in the first step, the variables x, to x„ were entered in a step
wise inclusion, provided they met the statistical criteria. The statistical
criteria for these variables were the F value, and a parameter called toler
ance. The tolerance of an independent variable being considered for inclusion
is the proportion of its variance not explained by the independent variables
already in the regression equation. The tolerance (a variable between 0 and
1) was set at 0.3, which means that 30 % of the variance of a potential in
dependent variable is unexplained by predictors already entered. The model
as a whole has the advantage of a limited number of regression variables
(at most 7). Especially in a small population a large number of regression
variables leads to spurious results. Hanus & Aimiller (1978) have discussed
this problem predicting cereal yields in Germany from weather data. A further
advantage of the model is that it is based on physiological processes in
the plants.
To assess in what period temperature exerts the largest influence on bol
ting, the regression was analysed for 6 intervals up to 1 August, at the
most.
Table 25 shows the proportion of variance explained by each variable in-
eluded in the regression equation. For all variables, total r (coefficient
of determination) is presented in the last column. The contribution to total 2
r can be read for each of the variables in the model, and it gives there-
Table 25. Attributed proportion of variance to each of the regression variables in data of the years 1966-1976.
Time from sowing date until
Monohil 15 May 1 June
15 June 1 July
15 July 1 August
Polykuhn 15 May 1 June
15 June 1 July
15 July 1 August
'Cold'
<:12 °C (Xj)
59.1 61.3 59.3 58.3 58.3 58.3
74.5 69.6 69.3 68.4 68.4 68.4
(«12 °C)2
(x2)
1.1 1.6 1.2 1.3 1.3 1.3
9.7 11.4 11.5 11.7 11.7 11.7
SUM
60.2 62.9 60.5 59.6 59.6 59.6
84.2 81.0 80.8 80.1 80.1 80.1
Intera
12-16 °C (x3)
------
------
ctions
16-20 °C (x4)
5.3 -----
3.6 -----
20-24 °C (x5)
3.0 4.3 ----
4.0 9.6 7.2 ---
24-28 °C (x6)
-1.6
15.7 12.6 17.3 12.5
1.2 --
5.1 4.5 2.1
>28 °C (x7)
8.0 6.3 1.7 5.9 4.0 2.6
1.6 1.0 1.0 -
0.4 0.6
Total 2
-
76.5% 75.1% 77.9% 78.1% 80.8% 74.7%
94.5% 91.6% 89.0% 85.2% 85.1% 82.8%
-: regression variable is not included in the equation.
89
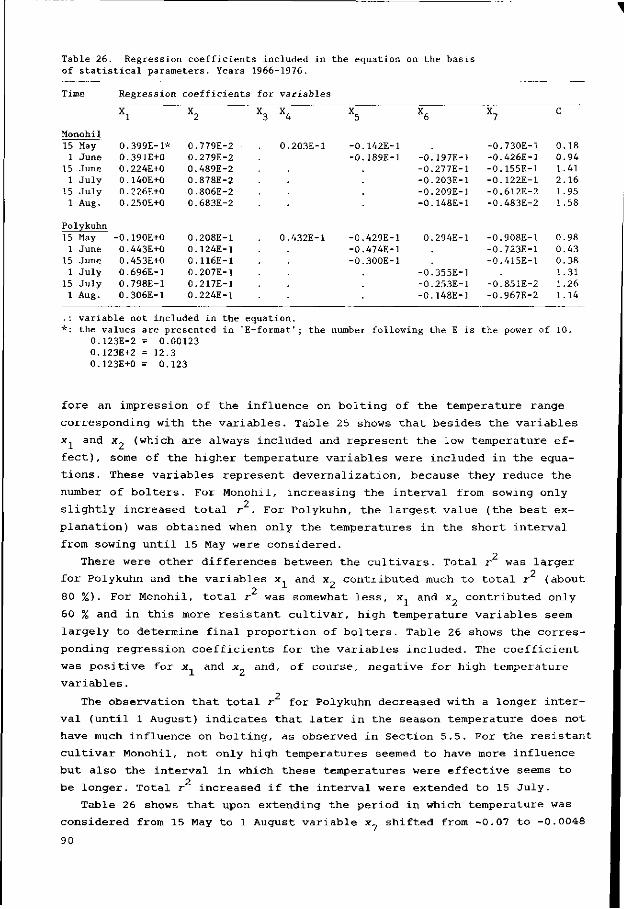
Table 26. Regression coefficients included in the equation on the basis of statistical parameters. Years 1966-1976.
Time
Monohil 15 May 1 June
15 June 1 July
15 July 1 Aug.
Polykuhn 15 May 1 June
15 June 1 July
15 July 1 Aug.
Regression
Xl
0.399E-1* 0.391E+0 0.224E+0 0.140E+0 0.226E+0 0.250E+0
-0.190E+0 0.443E+0 0.453E+0 0.696E-1 0.798E-1 0.306E-1
coefficients
X2
0.779E-2 0.279E-2 0.489E-2 0.878E-2 0.806E-2 0.683E-2
0.208E-1 0.124E-1 0.116E-1 0.207E-1 0.217E-1 0.224E-1
for
X3
variables
X4
0.203E-1
0.432E-1
X5
-0 -0
-0 -0 -0
142E-1 189E-1
429E-1 474E-1 300E-1
X6
-0.197E-1 -0.277E-1 -0.203E-1 -0.209E-1 -0.148E-1
0.294E-1
-0.355E-1 -0.253E-1 -0.148E-1
X7
-0.730E-1 -0.426E-1 -0.155E-1 -0.122E-1 -0.612E-2 -0.483E-2
-0.908E-1 -0.723E-1 -0.415E-1
-0.851E-2 -0.967E-2
C
0.18 0.94 1.41 2.16 1.95 1.58
0.98 0.43 0.38 1.31 1.26 1.14
.: variable not included in the equation. ~: the values are presented in 'E-format'; the number following the E is the power of 10.
0.123E-2 = 0.00123 0.123E+2 =12.3 0.123E+0 = 0.123
fore an impression of the influence on bolting of the temperature range
corresponding with the variables. Table 25 shows that besides the variables
x and x_ (which are always included and represent the low temperature ef
fect), some of the higher temperature variables were included in the equa
tions. These variables represent devernalization, because they reduce the
number of bolters. For Monohil, increasing the interval from sowing only 2
slightly increased total r . For Polykuhn, the largest value (the best explanation) was obtained when only the temperatures in the short interval
from sowing until 15 May were considered. 2
There were other differences between the cultivars. Total r was larger 2
for Polykuhn and the variables x and x_ contributed much to total r (about 2
80 %) . For Monohil, total r was somewhat less, x.. and x ? contributed only
60 % and in this more resistant cultivar, high temperature variables seem
largely to determine final proportion of bolters. Table 26 shows the corres
ponding regression coefficients for the variables included. The coefficient
was positive for x. and x and, of course, negative for high temperature
variables.
2
The observation that total r for Polykuhn decreased with a longer inter
val (until 1 August) indicates that later in the season temperature does not
have much influence on bolting, as observed in Section 5.5. For the resistant
cultivar Monohil, not only high temperatures seemed to have more influence but also the interval in which these temperatures were effective seems to
2 be longer. Total r increased if the interval were extended to 15 July.
Table 26 shows that upon extending the period in which temperature was
considered from 15 May to 1 August variable x shifted from -0.07 to -0.0048
90

Table 27. Attributed proportion of explained variance to each of the regression variables. Data from the years 1967-1975 (without 1966 and 1976).
Time from sowing date until
Monohil 15 May 1 June
15 June 1 July
15 July 1 August
Polykuhn 15 May 1 June
15 June 1 July
15 July 1 August
'Cold'
<12 °C (Xj)
64.7 65.4 64.5 63.1 63.1 63.1
73.5 69.4 70.3 69.1 69.1 69.1
(<12 °C)2
(x2)
2.0 2.1 1.8 2.0 2.0 2.0
9.8 11.1 10.0 10.5 10.5 10.5
SUM
66.7 67.5 66.3 65.1 65.1 65.1
83.3 80.5 80.3 79.6 79.6 79.6
Interactions
12-16 °C (x3)
------
------
16-20 °C (x4)
7.8
-----
3.7 -----
20-24 °C (x5)
4.8 7.3 2.7 ---
5.7 11.3 9.0 ---
24-<28 °C (x6)
-1.4 9.7
13.1 14.5 8.3
1.4 0.4 0.5 9.0 6.5 2.5
>28 °C (x7)
2.8 3.2 ----
--
2.9 1.5 3.1 3.0
Total 2
-
82.0% 79.5% 78.6% 78.2% 79.6% 73.4%
94.1% 92.2% 92.7% 90.1% 89.2% 85.2%
-: regression variable not included in the equation.
for Monohil and from -0.0908 to -0.00967 for Polykuhn, in line with an ob
servation in Trial 1 and 2 (Section 5.5) that warm days later after vernali
zation had less influence on the final proportion of bolters.
To investigate the effect of discarding some years from the data collec
tion, the regression procedures were repeated without the years 1966 and
1976. The results are presented in Table 27 and 28. Some differences can be
observed between Tables 25 and 26. Variables x_ was less often included in
the equations. Discarding a year like 1976 altered the significance of this
variable. This illustrates the importance of having a sufficiently large
and representative population in order to prevent irrelevant variables from
being included by coincidence or important variables from being left out.
In Table 27 (in contrast to Table 25), the largest r (Monohil) was for tem
perature from sowing until 15 May. However, this equation does not seem very
reliable, considering the positive regression coefficients for x and x_.
Days with a maximum temperature above 28 °C would hardly increase the pro
portion of bolting plants. So, it is still possible that high temperature
has a stronger influence, which remains active for a longer period, in bol
ting-resistant cultivars. o
The larger proportion of low temperatures in r does not necessarily mean
that Polykuhn would be more sensitive to low temperature. If devernalizing
temperatures less influenced the proportion of bolters in this cultivar,
bolting would mainly be determined by low temperatures and would be easier 2
to predict (higher r ) than if bolting were dependent on two processes. Similar studies on the relation of temperature to bolting were made by
91

Table 28. Regression coefficients included in the equation on the basis of statistical parameters. Years 1967-1975.
Time
Monohil 15 May 1 July
15 June 1 July
15 July 1 Aug.
Polykuhn
Regression coefficients for variables
X, X3 X4
-0.528E+1 0.465E+0 0.496E+0 0.944E-1 0.194E+0 0.219E+0
0.112E-1 0.271E-2 0.119E-3 0.103E-1 0.895E-2 0.729E-2
0.213E-1 -0.220E-1 -0.296E-1 -0.104E-1
-0.178E-1 -0.252E-1 -0.213E-1 -0.221E-1 -0.142E-1
125E+0 113E+0
2.26 0.64 0.13 2.47 2.07 1.55
15 May 1 June
15 June 1 July
15 July 1 Aug.
. : variab]
-0.267E+0 0.454E+0 0.323E+0
-0.380E+0 -0.321E+0 -0.161E+0
e not incl
0.229E-1 0.136E-1 0.153E-1 0.320E-1 0.327E-1 0.312E-1
uded in the
0.410E-1 -0 -0 -0
regression equation
468E-535E-251E-
1 1 1
0.291E-1 -0.141E-1 -0.139E-1 -0.324E-1 -0.229E-1 -0.181E-1
-0.112E+0 -0.592E-1 -0.424E-1 -0.464E-1
1.92 0.57 1.06 4.89 4.49 3.34
Wood & Scott (1975). They, however, studied temperatures in the period 4-6
weeks after emergence, in contrast to the foregoing approach with tempera
ture from sowing. Also Lasa (1977), in correlation studies in Spain found
it was best to start the interval at emergence or even 30 days after emer
gence. Spanish conditions are, however, quite different from the Netherlands,
as the crop is sown in dry soil and the seed does not germinate until the
soil is wetted. According to Lasa, emergence is much delayed in some years,
which explains why the best relation is found with temperatures from emer
gence rather than sowing. Lasa (1977) also stated that devernalizing tem
peratures did not have a great role in the field. However, with the approach
of the regression model (inclusion of higher temperatures with an interac
tion term), high temperatures still seem to reduce the proportion of bolters
in the field (at least for Dutch conditions). A further difference is that
Lasa used average and minimum temperatures instead of maximum temperatures,
which gave best correlation in my study.
7.4 AN OPTIMIZATION APPROACH
The regression method of Section 7.3 has shown that proportion of bolting
can be predicted from a few weather data, especially low and high tempera
tures. Some objections can be raised to this method:
In most of the resulting models, only days with a maximum temperature
above 28 °C influence the final proportion of bolters. It is reasonable,
however, to assume that days with a somewhat lower maximum temperature also
have an effect, though less.
92

Relative rate of change of substance
V
(m+A)
Fig. 34. Hypothetical relation between relative rate of change of substance V and temperature.
Because of the small sample, some spurious correlations were probably
picked up.
A different approach would be to regard the process of flowering more in
terms of the model (Figure 2). The final amount of F synthesized in the
plants will, of course, show a perfect relation with the final proportion
of bolters. Presumably the amount of V at a specific date also shows a good
relation with the proportion of bolting plants. Suppose the relative rate
of increase and decrease of substance V as a function of daily temperature
is known. Probably a function like the one in Figure 34 would result. At
lower temperatures, V is synthesized and at higher temperatures V is deple
ted. The following function is used to describe the relative rate of increase
and decrease in substance V:
f (T) = - A. + m + \
{ ^ ) 2 * 1. (16)
in which T = daily maximum temperature, K = lower asymptotic value of the
daily rate of change, m maximal daily rate of change at T = (j and a devia
tion round T = u.
Use was made below of data for Monohil (p., j = 1, 2, 52, 53).
It was assumed that at the sowing date the amount of V was 1 (in arbitrary
units) and that the amount of V on 15 July would show a good (linear) rela
tion with the final angle of bolters. For each case, p., the rate of change
i days after sowing will be:
Fij = - * + m + k
T . . + 1. (17)
93

The amount of V on 15 July (n days after sowing) for a case p. will then be:
Vj = l(rl7. + 1.) (r2j. + 1.) (ri;j + 1) {rnj + 1) (18)
where V . is final content of V on 15 July and r. • rate of change on day i
after sowing for case j .
To predict the final angle of bolters p., the following relation with
the content of V . was assumed: J
b . = aV . (19)
J J
With the least-square method, the following function F was defined:
j'=53
F = I (Pj. - Pj)2 (20)
J'=l
It is a function of the temperature course after sowing in each case and of
the parameters k, m, a, \i and a. It was minimized with the non-linear opti
misation package OPTPAC3, (van Kilsdonk, Philips, Eindhoven, 1977) using
the zero-order method of Hooke & Jeeves. For those values of the parameters
that minimized function F, predictions of the proportion of bolters should
be good.
To simplify the problem and to reduce the number of parameters, it was
assumed that p = 5 "C. Although the problem required a large core-memory
and a long computer run, a minimum of F was found at the following values
of the parameters:
A = 0.052
m = 0.062
a = 10.5 °C
a = 4.7
Figure 35 gives the corresponding function of the daily relative change
in the content of V in the plants. With such a relation to predict p., 76.2%
of the variance in angles of bolters could be accounted for. Figure 36 shows
the prediction for the years 1976, 1977 and 1978 as a function of tempera
ture after sowing. The year 1976 cannot be considered a true prediction,
because the data of 1976 were part of the data the model was based on. The
curves for 1977 and 1978 are on the other hand true predictions, because
these observations are additional data, made available by the two research
institutes at a more recent date. The number of additional observations was,
however, too small to decide whether the approach was valid. The method was
probably less dependent on occasional deviations in temperature, because
94

-0.04
Fig. 35. Relation between rate of change of substance V and temperature with optimization.
every day between sowing and 15 July was included in the calculations. This
is in contrast with the regression method where in some models only days
with a maximum temperature -$12 and >28 °C. were used to predict the final 2
angle of bolters. Despite this more realistic approach, total r was not
higher than in the regression method. However, temperature of every day from
sowing date was used. This is much more 'difficult' for prediction than in
the regression method, which easily could give coefficients of determination
over 90 %, for a larger number of x-variables and without restricted inclu
sions.
This optimization method will certainly require further research and
perhaps a modified physiological basis. Its principles, however, seem to be
useful and could also be applied for other temperature-dependent processes
like growth, for example. An optimized temperature function instead of tem-
Ane 28"
24
20
16
12
8
4
n
j le of bo l ters
1976
-
\ - \ s«
1 1 1 • 1
1
MARCH APRIL Sowing
I MAY
date
An 28
24
20
16
12
8
4
0
g leof bo l te rs
1977
s s *\"
s ~ x **
X
I I MARCH APRIL MAV
Sowing date
An 32
28
24
20
16
12
8
4
0
gle of bol ters
i A x
\ 1978 " \
\ \ \ \ \ \ \ \
X
1 1 I — « - ' . .
MARCH APRIL Sowing
-\ l
MAV date
Fig. 36. Prediction of bolting angles for the years 1976, 1977 and 1978. The data for 1977 and 1978 were not part of the data on which the model was based.
95

perature sums, time-temperature product of growth (in °C.d) might be a bet
ter physiological basis for prediction. A disadvantage is that it is still
not a dynamic approach. Equation 18 to calculate the final amount of V shows
that in this method a warm day in June will have the same effect on the pre
dicted proportion of bolting than a warm day in May. In the dynamic approach
of the model (Figure 2), however, this certainly makes difference. Early
destruction of V hinders F synthesis more than destruction later in the sea
son (Trials 1 and 2).
A simulation approach is then the solution. The estimation of the relevant
parameters is for the moment, however, impossible as only the final result
(bolting) is known and not the intermediate steps in the process of bolting
and flowering.
96

8 Final remarks
Let us first consider bolting in sugar-beet from the point of view of
breeders. To reduce bolting in their plant material, breeders as a rule sow
early and discard bolting plants. In certain years, however, such a selec
tion is hardly possible, because one cannot sow early or because the weather
is not cold after sowing. The degree of flower induction will therefore vary
from year to year. Not only the total strength of the induction can be dif
ferent between years, also the pattern of flower-inducing factors may be
quite different in some years from others. In certain years, a cold spring
is followed by a period of high temperatures; in others, a shorter period
of vernalizing temperatures is followed by a period of 'neutral' tempera
tures. So the nature of the selection is dependent on the weather. To put
it in physiological terms: some years, readily devernalizing plants will
remain in the population; in other years, plants will be retained that have
a high cold requirement. It would be interesting to find out whether such
differences exist and whether more specific selection is possible.
Which components of the flowering process are relevant for breeders when
selecting for a bolting resistant cultivar? It is possible that differences
in bolting resistance of cultivars is due to differences in:
juvenility
cold requirement
maximum temperature for vernalization or minimum temperature for dever-
nalization
sensitivity to long days
sensitivity to devernalization.
If possible, which component should be chosen by breeders to achieve bolting
resistance? My trials indicated that bolting resistance is due to several
components, because of the observed interaction between the several factors
involved.
However, it may still be possible and useful in a selection programm to
emphasize a single component of the bolting process. If so, photophase
should be a selecting tool. A smaller sensitivity to long photophase will
have a direct effect, because the synthesis of flowering substances will
slow down and the final proportion of bolters will be reduced. It will also
have an indirect effect: a lowered synthesis of F (in terms of the model)
would postpone reaching the threshold level of flowering to a later date in
97
the season. This delay, will give devernalizing temperatures longer the op
portunity to reduce the potential number of bolters. Therefore, especially
photophase should be a tool to reduce the tendency for bolting to acceptable
levels in plant populations.
To detect specific genotypic differences, breeders will have to do their
selections under conditioned circumstances, which will make them less depen
dent on the weather conditions. Moreover, the breeder will then be able to
choose climatic conditions which result into optimum adaptation to the cli
mate of a given beet-growing area.
To select for bolting resistance, long induction by low temperature gives
opportunity to discard easily bolting plants. The breeder does not necessa
rily need to select for strictly non-bolting plants. When the low tempera
ture induction is so strong that all plants bolt in due time, probably a
very good selection will be made by selecting the late flowering plants.
Selecting for the latest 10 % of flowering plants would probably faster lead
to a bolting-resistant population than discarding of the earliest 10 % of
flowering plants.
If one attempts to select for fast devernalization, periods of higher
temperature should be applied to follow the low temperature period. In such
a way also, plants insensitive to devernalizing temperatures (if any) can
be removed.
Longden & Scott (1979) mentioned also that seed-testing institutes have
reason to be interested in comparing cultivars under conditioned circumstan
ces. But also with this technique of testing, the problem arises what kind
of 'climate' should be applied. When specific differences in separate com
ponents of the bolting resistance exist, one must expect that a specific
testing climate overestimates the resistance of one variety and underesti
mates that of another. Temperature should then be similar to that of the
beet-growing area. Moreover the assessment of bolting resistance is valid
only for that area.
Although a relation certainly exists between growth and bolting (Chapter
6), there is not enough convincing evidence to state that selection towards
bolting resistance will have a negative influence on growth rate. Such dif
ferences in growth rate between selected and unselected genotypes may only
be detectable when the plants have been submitted to a cold period. This
could be one of the reasons why no such differences were found in the trial
described in Section 6.4. Sowing early, however, introduces the problem that
comparisons are obscured because of the differences in bolting. Measurements
should be made then before the plants start bolting. If, however, further
trials prove such a relation, breeders should be reluctant to discard bol
ting plants that otherwise grow vigorously. Bolting plants that show a smal
ler than average plant weight should always be removed from the plant popula
tion, but later bolting plants having a distinct lead could be of advantage
in maintaining productivity.
98
Besides the use of bolting-resistant cultivars, bolting in early sowings
also could be reduced if chemicals were available to inhibit bolting. Cau
tion should be taken that such substances do not reduce growth. Because of
the relation between growth and bolting, a screening of chemicals might show
up some that inhibit bolting but by means of reduced growth. In the litera
ture, bolting-inhibiting chemicals like maleic hydrazide also inhibited
growth (Lasa & Silvan, 1976).
99

Summary
Bolting of sugar-beet (Beta vulgaris L.) was studied in a number of
trials. In general, the beet plant is fairly well protected from premature
bolting: at first, the plant has to be vernalized by means of a period with
relative low temperature and further the plants have a long-day requirement
(the longer the day after chilling, the sooner plants start bolting and the
higher the proportion of bolting plants).
The purpose of the study was to clarify the quantitative effects of tem
perature and daylength on bolting of sugar-beet in its first growing season.
A relative simple quantitative and dynamic model was developed based on
trials in growth rooms. The model assumed a hypothetical substance V, which
accumulated during vernalization and a final substance F, whose rate of syn
thesis was influenced by amount of V, temperature and daylength. The final
amount of F determines when and how many of the plants would become genera
tive.
Some aspects of the bolting process in trials were as follows. In growth
rooms and in the field, plants in the very early stages could be vernalized
somewhat less efficiently, but no true juvenile stage was detected in con
trast to published observations. Therefore, the course of temperature in
the Netherlands after sowing in most years suggests that flower induction
by low temperature occurs mainly before emergence.
In a trial with several temperatures during chilling, the lowest tempera
ture in the trial (3 °C) was also most effective. The true vernalization
process probably proceeds fast at that temperature, although the processes
following vernalization will perhaps start earlier with a higher temperature.
Vernalization proceeded also at temperatures as high as 15 °C; when daylength
is then extremely long, all plants will finally bolt. There were no reasons
to assume an interaction between degree of bolting resistance and optimum
vernalization temperature.
The duration of cold and daylength after chilling strongly influenced
final proportion of bolters. A certain exchange between cold period and day-
length became apparent: longer cold period and shorter daylength could give
the same proportion of bolting plants as shorter chilling and longer day-
length afterwards.
High temperatures (25 °C) after chilling reduced bolting considerably
(devernalization), especially immediately after chilling. Yet an important
interaction with daylength became visible because high temperature could
100

still devernalize later after chilling, provided that in the period between
chilling and high temperature a shorter daylength were applied. So there
seems to be no fixation of the vernalized condition under moderate tempera
tures in contrast to reports for other plant species.
A reasonable interpretation of the model is that the hypothetical sub
stance V, accumulating during chilling, represents a certain condition of
the plant: the intensity of deblocking of flower-hormone-forming genes in
leaves, originating from a vernalized growing point. This intensity of de
blocking together with the daylength determine whether and how much of the
final flowering hormone is translocated to the growing point, where differ
entiation in stem and flower buds can follow.
Another aspect investigated was possible physiological and genetic cou
pling between growth and bolting. For other plant species (e.g. spinach),
fast-growing cultivars tend to bolt earlier than slow-growing cultivars. If
such a relation applies also for sugar-beet, breeders have a serious diffi
culty in creating higher-yielding cultivars: selecting for bolting resis
tance would mean loss of productivity and selecting for productivity would
mean an increase in susceptibility to bolting.
Incipiently bolting plants indeed had a larger plant weight than (still)
vegetative ones. Further, growth-stimulating factors (like nitrogen fertil
izer and irrigation) increased bolting. So the larger weight of bolting
plants could be caused by locally better conditions of growth e.g. more
space and N of some plants in the population of a field. With such an expla
nation, it is not necessary to assume genetic coupling between fast growth
and bolting. Although chilling and long days as such also stimulated growth
in a trial in a conditioned room, the conclusion was drawn that these ef
fects were almost independent of the flower(-inducing) process and were pho-
tomorphogenetic effects. Also a decreased productivity of a number of geno
types after selection for bolting resistance did not show up in three field
trials.
From the point of view of breeders, the suggestion was given to let day-
length play a role in the selection procedures for bolting resistance. If
cultivars are possible that react slowly to daylength, a twofold aim can be
reached. A slower daylength reaction will directly prevent some plants from
reaching the threshold for bolting but will also extend the period in which
devernalizing temperatures can be active, so strongly reducing the propor
tion of bolting plants.
A last aspect of the study was to account for the variation in proportion
of bolting plants within and between years (1966-1979), based on the course
of temperature after sowing. A regression approach showed that temperature
immediately after sowing already influences bolting, in agreement with the
trials in which no true juvenile phase was found. Maximum daily temperature
was a particularly good predictive variable. For the cultivars used (Monohil
101

ind Polykuhn), induction by cold could be fairly well estimated by counting
the number of days with a maximum temperature up to 12 °C. With this number,
60 % (Monohil) to 80 % (Polykuhn) of the variation in bolting could be ac
counted for. When temperature above 20 °C was also taken into consideration
from sowing to 15 July (Monohil) and from sowing to 15 May (Polykuhn), this
percentage was raised to 80 % (Monohil) and 95 % (Polykuhn). In a second
method, based on an optimization procedure, about 76 % of the variation in
bolting for Monohil could be accounted for. With this method, the complete
course of temperature from sowing to mid June was included in the calcula
tions .
102
Samenvatting
Hoewel de suikerbiet (Beta vulgaris L.) tot de tweejarige planten gere
kend wordt, kunnen in bepaalde jaren bij de teelt veel schieters optreden,
planten die reeds in het eerste groeiseizoen generatief worden. De plant is
tamelijk goed beschermd tegen voortijdig schieten. Voorwaarde voor schieten
is een gevernalizeerde toestand, die tot stand komt in een periode met be
trekkelijk lage temperatuur, vervolgens moet nog aan de zogenaamde lange-
dagbehoefte worden voldaan. Hoe groter de daglengte is na de koudeperiode,
hoe sneller en hoe meer planten er schieten. Normaal gesproken zal alleen
na overwintering van de planten aan beide voorwaarden voldaan worden. Toch
kan ook na vroege zaai een aanzienlijk aantal planten in bloei komen. Dit
kan tot moeilijkheden bij de oogst en volgteelten leiden.
Deze studie beoogt vooral de kwantitatieve effecten van temperatuur en
daglengte op het schieten van de planten (speciaal in het eerste groei-jaar)
duidelijker te maken.
Nadat het merendeel van de experimenten was uitgevoerd, werd een kwanti
tatief relatiemodel ontwikkeld wat de gevonden resultaten kon verklaren. In
het model werd voorlopig aangenomen, dat er een hypothetische substantie V
onder invloed van lage temperatuur gevormd wordt tijdens het vernalizatie-
proces. In het model werd verder aangenomen dat de synthesesnelheid van het
uiteindelijke bloeihormoon F positief beïnvloed wordt door de aanwezige hoe
veelheid V, de temperatuur en de daglengte. De hoeveelheid F die gevormd
wordt, bepaalt of, en hoeveel, planten uiteindelijk generatief worden.
In klimaatkamers en in het veld bleek, dat planten iets minder effectief
in jonge stadia gevernalizeerd konden worden. Uit deze proeven bleek dus
niet dat de bietenplanten in de jonge stadia ongevoelig zijn voor de verna-
lizerende werking van lagere temperaturen (juveniele fase), zoals dat in de
literatuur wordt vermeld. Verwacht mag worden dat onder Nederlandse omstan
digheden, gezien ook het temperatuurverloop in de meeste jaren, de bloei-
inductie door deze lage temperaturen vooral in de tijd voor opkomst plaats
zal vinden.
In een proef met verschillende temperaturen tijdens de koudebehandeling,
bleek de laagste temperatuur (3 °C) het meest effectief. De indruk werd ver
kregen dat weliswaar het vernalizatieproces bij deze lage temperatuur opti
maal plaats vindt, maar dat bij vernalizatie bij iets hogere temperaturen,
processen die gewoonlijk op de vernalizatie volgen (daglengtereactie) reeds
op gang kunnen komen, wat uiteindelijk positief kan werken. Het vernaliza
tieproces bleek, indien tegelijkertijd een extreem lange daglengte heerste,
103
zich zelfs af te kunnen spelen bij temperaturen van 15 °C. Er werden geen
aanwijzingen verkregen, dat rassen die verschillen in schietergevoeligheid,
interacties vertonen voor wat betreft de optimale vernalizatietemperatuur.
De lengte van de koudebehandeling en de daglengte na de koudebehandeling,
bleken beide het percentage schieters sterk te beïnvloeden. Een zekere uit
wisselbaarheid tussen koudeperiode en daglengte kwam naar voren: een langere
koudeperiode en kortere daglengte kon een zelfde percentage schieters geven
als een kortere koudeperiode en een langere daglengte.
Hogere temperaturen (25 °C) na de koudeperiode beperkten het percentage
schieters aanzienlijk (de zgn. devernalizatie), vooral vlak na de koudepe
riode. Toch bleek een belangrijke interactie met de daglengte, omdat ook
geruime tijd na de koude periode de hoge temperaturen nog effectief konden
zijn, mits in de periode tussen lage en hoge temperatuur een korte daglengte
werd toegepast. Bij bieten lijkt er dus geen sprake te zijn van een fixatie
van de gevernalizeerde toestand onder gematigde temperaturen, zoals van an
dere gewassen gemeld is.
Bij herinterpretatie van het model werd het aannemelijker geacht, dat de
hypothetische stof V, die zich op zou hopen tijdens het vernalizatieproces,
meer een bepaalde toestand representeert van de plant; een toestand die door
middel van celdeling kan blijven bestaan. Omdat de lage temperatuur speci
fiek op het groeipunt werkt en het verder aannemelijk is, dat bladeren die
uit een gevernalizeerd groeipunt komen verantwoordelijk zijn voor de synthe
se van het bloeihormoon, werd verondersteld dat deze toestand de mate van
deblokkering van de genen die het bloeihormoon vormen, representeert. Of,
en in welke hoeveelheid, bladeren uit een gevernalizeerd groeipunt inderdaad
bloeihormonen exporteren, hangt dan af van de daglengte. Indien het bloei
hormoon in het groeipunt aankomt, volgt differentiatie in stengel en bloem
knoppen.
Een ander onderzocht aspect was de mogelijke genetische fysiologische
koppeling van groei en schieten. Bij andere gewassen (bv. spinazie) hebben
snelgroeiende rassen een sterkere neiging tot schieten dan traag groeiende
rassen. Indien dit verband ook bij bieten bestaat, zou dit voor kwekers een
ernstige handicap betekenen om tot produktievere rassen te komen: selectie
op produktie zou leiden tot schietergevoeligheid en selectie op schieterre
sistentie tot verminderde produktiviteit.
Uit veldwaarnemingen bleek inderdaad dat juist schietende planten veelal
aanzienlijk zwaarder zijn dan (nog) vegetatieve planten. Verder bleek echter
dat ook groeibevorderende maatregelen zoals stikstof (over)bemesting en be
regening tot meer schieters leidde. Het overgewicht van schietende planten
zou dus veroorzaakt kunnen zijn door toevallig betere groei-omstandigheden
van deze planten (bv. meer ruimte, stikstof, enz.). Zowel de groei als het
schieten wordt dan bevorderd.
104

In deze verklaring is het niet nodig een genetische koppeling van snelle
groei en schietneiging aan te nemen. Wel bleek, dat een koudeperiode en lan
ge dagen op zich groeibevorderend kunnen werken, maar op grond van de proe
ven werd geconcludeerd, dat dit effect min of meer los staat van het proces
van (bloei) inductie en meer te maken heeft met fotomorfogenetische effec
ten. Ook een verminderde produktiviteit van een aantal genotypen geselec
teerd op schieterresistentie, kon in een drietal proeven niet significant
aangetoond worden.
Vanuit het gezichtspunt van de plantenveredelaar, dient overwogen te wor
den of de daglengte niet een rol kan spelen in de selectie op schieterresis
tentie. Indien een genotype mogelijk is dat traag op lange dagen reageert,
kan een tweeledig doel bereikt worden. Door deze trage daglengtereactie zul
len minder planten de drempelwaarde voor schieten overschrijden, anderzijds
zal de periode voor het bereiken van deze drempelwaarde langer worden, zodat
devernalizerende temperaturen een grotere kans krijgen om het potentiële
aantal schieters terug te dringen.
Het laatste aspect in deze studie was om de variatie in schieterpercenta
ges tussen en binnen de jaren 1966 tot en met 1979 te verklaren met behulp
van het temperatuurverloop na zaai. Met behulp van regressieberekeningen
bleek, dat de temperatuur onmiddelijk na zaai al invloed heeft, hetgeen in
overeenstemming is met de in proeven gevonden afwezigheid van de juveniele
fase. Speciaal de dagelijkse maximumtemperatuur kon goed als verklarende
variabele gebruikt worden. Voor de twee gebruikte rassen (Monohil en Poly-
kuhn) kon het effect van koude-inductie goed worden benaderd door na zaai
het aantal dagen te tellen met een maximumtemperatuur kleiner dan 12 °C.
Hiermee kon 60 % (Monohil) tot 80 % (Polykuhn) van de variatie in schieter
percentages verklaard worden.
Als het aantal dagen met een maximumtemperatuur van meer dan 20 °C in de
periode van zaai tot bv. 15 juli (Monohil) of tot 15 mei (Polykuhn) in de
berekeningen werd opgenomen, kon het percentage verhoogd worden tot 80 %
(Monohil) en 95 % (Polykuhn).
Een andere methode, m.b.v. een optimaliseringsprocedure leverde voor Mo
nohil een percentage van ca. 76 % op. Hierbij werden dagelijkse temperatuur-
waarnemingen gebruikt over de gehele periode van zaai tot half juli.
105

References
Bachmann, L., P. Curth & H.J. Rö'stel, 1963. Untersuchungen über Gibberellin-Verabreichung in verschiedenen Wachstumsphasen der Beta-Rüben. Züchter 33 (1): 50-58.
Barendse, G.W.M., 1964. Vernalization in Cheiranthus allionii Hort. Meded. Landbouwhogesch., Wageningen, 64-14.
Behaeghe, T.J., 1975. Eco-fysiologische grondslagen van de grasgroei. Agricultura 23 (4): 19-46.
Behaeghe, T.J., 1978. The seasonal discrepancies between potential and actual grass growth. An essay of explanation by eco-physiological constraints. Repr. 7th Gen. Meeting Eur. Grassl. Fed., Gent.
Bernier, G., 1976. La nature complexe du stimulus floral et des facteurs de floraison. In: R. Jacques (Ed.): Etudes de Biol, végétale. Hommage au prof. Chouard. Paris.
Besnard-Wibaut, C , 1977. Histoautoradiographic analysis of the thermoinductive processes in the shoot apex of (swedish variety) of Arabidopsis thaliana L. Heynh, vernalized at different stages of development. Plant Cell Physiol. 18 (5): 949-962.
Bhargava, S.C., 1964. Photoperiodism, floral induction and floral inhibition in Salvia occidentalis. Meded. Landbouwhogesch., Wageningen, 64-12: 1-70.
Bliss, C.I., 1973. Plant Protection no. 12, Leningrad. Bornscheuer, E., 1972. Influence of different production regions in sugar-beet seed. 35th
I.I.R.B. Winter Congress 10/11 Febr. 1972 session II. Report no. 2.1. Bosemark, N.O., 1970. Influence of seed crop environment on root crop characteristics.
J.I.I.R.B. (4): 193-206. Chouard, P., 1960. Vernalization and its relation to dormancy. Annu. Rev. Plant Physiol.
11: 191-238. Chroboczek, E., 1934. A study of some ecological factors influencing seed stalk development
in beets (Beta vulgaris, L.) Mem. Cornell Univ. Agric. Exp. Stat. 154, 84 p. Curth, P., 1955. Temperatur und Licht als blühinduzierende Faktoren bei der Zuckerrübe I.
Zuchter 25: 14-17. Curth, P., I960. Der Übergang in die reproduktieve Phase bei der Zuckerrübe in Abhängigkeit
von verschiedenen Umweltfaktoren. Wiss. Abh. Dtsch. Akad. Landwirtschaftswissensch. Berlin, nr. 46. (Beitr. Z. Rübenforsch, nr. 4 ) .
Curth, P., 1962. Spezielle Untersuchungen zu Vernalization und Photoperiodismus der Zuckerrübe. Z. Pflanzenzucht. 47: 254-276.
Curth, P. , 1963. Über die photoperiodische SummationsWirkung intermittierend gebotener nächtlicher Zusatzlichtes unterschiedlicher Periodenlänge bei Zuckerrüben. Biol. Zen-tralbl. 82: 485-487.
Curth, P. & K. Fürste, I960. Eine neue Prüfungssmethode für Schoszresistentz bei Zuckerrüben. Wiss. Abh. Dtsch. Akad. Landwirtschaftswiss., 48: 29-37.
Curtis, G.J. & K.G. Hornsey, 1964. Graft-transmissible induction of elongation and flowering in scions of sugar-beet bred for resistance to bolting. Nature 202 (4938): 1238.
Curtis, G.J., 1964. Graft transmission of the flowering stimulus from a wild Beta species to a line of beet selected for resistance to bolting. Nature 203: 201-202.
Curtis, O.F. & H.T. Chang, 1930. The relative effectiveness of the temperature of the crown as contrasted with that of the rest of the plant upon flowering of celery plants. Am. J. Bot. 17: 1047-1048.
Davies, A., 1971. Growth rates and crop morphology in vernalized and non-vernalized swards of perennial ryegrass in spring. J. Agric. Sei. (London) 77(2): 273-282.
Devay, M. , E. Paldi & I. Kovacs, 1976. Thermolabile and thermostable interphases in the vernalization of winter wheat. (Triticum aestivum var. bankuti 1201). Acta Bot. Acad. Sei. Hung. Tomus 22(1-2): 9-16.
Dowker, B.D. & J.C. Jackson, 1975. Bolting in some carrot populations. Ann. Appl. Biol. 79: 361-365.
Fife, J.M. & C. Price, 1953. Bolting and flowering of sugar-beet in continuous darkness. Plant. Physiol. 28: 475-480.
Forrester, J.W., 1961. Industrial dynamics. MIT-press, Boston.
106

Gaastra, P., 1959. Photosynthesis of crop plants as influenced by light, carbon dioxide, temperature, and stomatal diffusion resistance. Meded. Landbouwhogesch., Wageningen, 59 (13): 1-68.
Gaskill, J.0., 1952. Induction of reproductive development in sugar-beet seedlings by photothermal treatment of young seedlings. Proc. Am. Soc. Sug. Beet Techn. 7: 112-120.
Gaskill, J.0., 1957. A preliminary report on the use of gibberelline acid to hasten reproductive development in sugar-beet seedlings. J. Am. Soc. Sug. Beet Techn. IX(6): 521-528.
Gaskill, J.0., 1963. Influence of age and supplemental light on flowering of photothermally-induced sugar-beet seedlings. J.Am. Soc. Sug. Beet Techn. 12 (6): 530-537.
Gorodnii, N.G. 5. E.P. Sereda, 1975. Bolting in different forms of sugar-beet in relation to climatic conditions and nutrition level. Nauchn. Tr. Ukr. Skh. Akad. 146: 65-69 [Rum].
Gregory. F.G. & O.N. Purvis, 1938a. Studies in vernalization of cereals. II. The vernalization of excised mature embryos, and of developing ears. Ann. Bot. N.S. 2: 237-251.
Gregory, F.G. & O.N. Purvis, 1938b. Studies in vernalization of cereals. III. The use of anearobic conditions in the analysis of the vernalizing effect of low temperature during germination. Ann. Bot. N.S. 2: 753-764.
Hanus, H. & 0. Aimiller, 1978. Ertragsvorhersage aus Witterungsdaten. Fortschr. Acker- und Pflanzenbau 5.
Heide, O.M., 1973. Environmental control of bolting and flowering in red garden beets. Meld. Nor. Landbrukshoegsk. 52: (15) 17p.
Highkin, H.R., 1956. Vernalization in peas. Plant Physiol. 31: 399-403. Hoekstra, 0., 1960. De werking van nitraat- en ammoniumstikstof op aardappelen en suiker
bieten. Landbouwk. Tijdschr. 72(10): 403-410. Hunt, R. & I.T. Parsons, 1974. A computer program for deriving growth-functions in plant
growth-analyses. J. Appl. Ecol. 11: 297-307. Jones, H.G., M.A. Ford & R. Plumley, 1975. The effect of vernalization on photosynthesis
in wheat. Photosynthetica 9 (1): 24-30. Jorritsma, J., 1978. Kwaliteit van suikerbieten. Uitgave Instituut voor Rationele Suiker-
produktie, Bergen op Zoom. Junges, W., 1959. Abhängigkeit des Schossens bienner Gemüsepflanzen von ihrem Alter und
von der Dauer der Einwirkung niedriger Temperaturen. Arch. Gartenb. 7: 485-504. Kilsdonk, A.C.M., 1977. Non-linear optimisation package 0PTPAC3. Program description and
reference manual. ISA-DSA Scientific Computer Applications. Kinet, J.M., M. Bodson, A. Jacqmard & G. Bernier, 1975. The inhibition of flowering by ab-
scisic acid in Sinapis alba L. Z. Pflanzenphysiol. 77: 70-74. King, R.W. & J.A.D. Zeevaart, 1973. Floral stimulus movement in Perilla and flower inhibi
tion caused by noninduced leaves. Plant Physiol. 51: 727-738. Kloen, D., 1952. Jarowisatie van bietenzaad. Zaadbelangen 6 (15): 177-178. Lane, H.C., H.M. Cathey & L.T. Evans, 1965. The dependance of flowering in several long
day plants on the spectral composition of light extending the photoperiod. Am. J. Bot. 52 (10): 1006-1014.
Lang, A-, 1952. Physiology of flowering. Annu. Rev. Plant Physiol. 3: 265-306. Lang, A., 1965. Physiology of flower initiation: In: W. Ruhland (Ed.): Handb. der Pflanzen
physiol. Bd. XV/1. p. 1300-1536. Berlin- Heidelberg- New York. Lang, A. & G. Melchers, 1947. Vernalization und Devernalization bei einer zweijährigen
Pflanze. Z. Naturforsch. B2: 444-449. Lasa, J.M., 1977. Sugar-beet bolting in the root crop. J. Agric. Sei 89 (1): 223-228. Lasa, J.M. & A. Silvan, 1976. Factores que influyen en el espigado de la remolacha azucare-
ra, Beta vulgaris L. Fundacion Juan March. Convocatoris Espana -1.974. Ciencias agrarias. Lenton, J.R., T.0. Podock & M.E. Radley, 1975. Roth. Exp. Station. Report for 1975. Part
I, p. 45. Lexander, K., 1969. Increase in bolting as an effect of low temperature on unripe sugar-beet
seed. 32nd Winter Congress of the I.I.R.B., Paper no. 1.8. Longden, P.C. & R.K. Scott, 1979. Effects of sowing date on sugar-beet seedling emergence,
sugar production, bolting and subsequent seed production. Int. note Broom's Barn Exp. Stat.
Longden, P.C., R.K. Scott & J.B. Tylderley, 1975. Bolting of sugar-beet grown in England. Outlook Agric. 8(4): 188-193.
Lüdecke, H., 1938. Einfluss der Ernährung auf das Schossen der Zuckerrübe. Dtsch. Land-wirtsch. Presse 65: 115-116.
Lysgaard, C.P. & S.V. N0rgaard H0lm, 1962. The effect of bolting on the quantity and quality of swede and fodder sugar-beet. Arsskr. K. Vet.-Landbohoejsk., Copenhagen, p. 94-123.
Lysgaard, C.P., 1978. Selection for reduced bolting susceptibility in beet and swedes, and the influence of environmental factors on bolting. Arsskr. K. Vet.-Landbohoejsk., p. 138-158. Part of a collective document.
107

Mann, H.H., 1951. The effect of manures on the bolting of the beet plant. Ann. Appl. Biol. 38: 435-443.
Margara, J., 1960. Recherche sur le determinisme de l'élongation et de la floraison dans le genre Beta. Ann. Inst. Natl. Rech. Agron., Serie B. Ann. Amélior. Plantes 10: 361-471.
Margara, J., 1967. Recherches sur les gibberellins et le developement floral chez la betterave. J.I.I.R.B. 2 (4): 242-254.
Margara, J., 1968. Physiologie de l'induction florale chez la betterave. J.I.I.R.B. 3 (1):
17-28. Melchers, G., 1939. Die Blühhormone. Ber. Dtsch. Bot. Ges. 37: 29-48. Milford, G.F.J. & J.R. Lenton, 1976. Effect of photoperiod on growth of sugar-beet. Ann.
Bot. 40: 1309-1315. Mugnier, C , 1977. An attempt to replace vernalization by application of gibberellic acid
in biennal Hyoscyamus niger L. Biol. Plant. 19 (1): 40-47. Napp Zinn, K., 1957. Untersuchungen über das Vernalizationsverhalten einer winterannuellen
Rasse von Arabidopsis thaliana. Planta 50: 177-210. Napp Zinn. K., 1961. In: W. Ruhland (Ed): Handb. Der Pflanzenphysiologie Bd. XVI (1961).
Springer Verlag, Berlin, p. 24-75. Napp Zinn, K., 1973. Low temperature effect on flower formation: Vernalization. In: H.
Precht (Ed): Temperature and life. Springer Verlag, Berlin, p. 175-194. Naylor, A.W. , 1961. The photoperiodic control of plant behaviour. In: W. Ruhland (Ed):
Handb. der Pflanzenphys. B. 16. p. 331-389. Nicholls, A.0. & D.M. Calder, 1973. Comments on the use of regression analysis for the study
of plant growth. New Phytol. 72: 571-581. O'Connor, L.J., 1970. Environmental influence during beet seed production in bolting and
quality characteristics of the subsequent root crop. J. Int. Inst. Sugar Beet Res. 4 (4): 207-216.
Oorschot, J.L.P., 1960. Effects of daylength upon growth and development of spinach (Spi-nacea oleracea L.) Meded. Landbouwhogesch., Wageningen, 60 (18): 1-10.
Parlevliet, J.E., 1966. The influence of external factors on the growth and development of spinach cultivars (Spinacia oleracea L.). Meded. Landbouwhogesch., Wageningen, 67-2.
Purvis, O.N., 1944. Studies in vernalization of cereals XIII. The role of carbohydrate and nitrogen supply in the vernalization of excised embryo's of Petkus winter rye. Ann. Bot. 8: 285-314.
Purvis, O.N. & F.G. Gregory, 1952. Studies in vernalization XII. The reversibility by high temperature of the vernalized condition in Petkus winter rye. Ann. Bot. 16: 1-21.
Purvis, O.N., 1961. In: W. Ruhland (Ed): Handb. der Pflanzenphysiol, 16. Springer, Berlin-Gottingen- Heidelberg, p. 76-122.
Röstel, H.J. ,1968. Probleme und Ergebnisse der Züchtung auf Schossresistenz bei monokarpen Zuckerrüben in Kleinwanzleben. Bull. Res. Inst. Agric. Plant Breed. Plant Prod., Sopron-horpacs, nr. 4, p. 3-17.
Salisbury, F.B., 1963. The flowering process. Pergamon Press, Oxford, London, New York, Paris.
Schäfer, E., 1976. The high-irradiance reaction. In: H. Smith (Ed): Light and plant development, p. 45-59.
Schneider, G., 1960. Biochemische und entwicklungsphysiologische Untersuchung zur Frage des Schossens und der Blütenbildung der Zuckerrübe. I. Planta 55: 669-685.
Scott, R.K. & K.W. Jaggard, 1978. Theoretical for maximum yield. Proc. 41st Winter Congress of the I.I.R.B.
Scott, R.K. & P.C. Longden, 1970. Pollen release by diploid and tetraploid sugar-beet plants. Ann. appl. Biol. 66: 129.
Shiomi, N. & S. Hori, 1973. Changes in some enzyme activities and the nicotinamide nucleotide coenzymes in barley seedlings during vernalization. Soil Sei. Plant Nutr. (Tokyo) 19 (2): 132-138.
Smith, H., 1975. In: Phytochrome and photomorphogenesis. McGraw Hill, New York. SPSS-manual, 1975. Statistical package for the social sciences. 2nd Edition by N.H. Nie et
al., McGraw-Hill, New York. Steyvoort, L. van & R. van Stallen, 1973. Het probleem van de wilde bieten. Publikatie
HI/1973. Belg. Inst, tot verbetering van de biet. Tienen. Stoddart, J.L., S.M. Tapster & T.W.A. Jones, 1978. Temperature dependance of the gibberellin
response in lettuce hypocotyls. Planta 141 (3): 283-288. Stout, M., 1946. Relation of temperature to reproduction in sugar-beet. J. Agric. Res. 72:
49. Suge, H., 1970. Changes of endogenous gibberelling in vernalized radish plants. Plant Cell
Physiol. 11 (5): 729-735.
10?

Tateyama, M., H.A. Ishikawa & K. Ishikawa, 1978. Nucleic acid contents and polyribosome formation in wheat embryos during germination and vernalization. Plant Cell Physiol. 19 (3): 411-418.
Voss, J., 1936. Experimentelle Auslösung des Schossens und Prüfung der Schossneigung der Rübensorten (Beta vulg. L.) Angew. Bot. XVIII: 370-408.
Voss, J., 1940. Zur Schossauslösung und Prüfung der Schossneigung von Rübensorten (Beta vulg. L.) und Brassica napus L. var. Napobrassicca [L.] Reichenb. Zuchter 12: 34-44, 73-77.
Warne, L.G.G., 1949. Spacing and bolting of vegetables. Nature 164: 969-70. Wellensiek, S.J.; 1964a. Dividing cells as the prerequisite for vernalization. Plant Physiol.
39: 832-835. Wellensiek, S.J., 1964b. Root vernalization of Cichorium intybus L. Repr. K. Ned. Akad.
Wetensch. C67 (5): 307-312. Wellensiek, S.J., 1977. Principles of flower formation. Acta Hortic. 68: 17-27. Wellensiek, S.J., 1979. The mechanism of vernalization in Silene armeria L. Z. Pflanzen-
physiol. 94 (3): 263-265. Wellensiek, S.J. & K. Verkerk, 1950. Vernalizatie en photoperiodiciteit van bieten. Meded.
Dir. Tuinbouw 13 (6): 341-357. Wiebosch, W.A., 1965. Jarowisatie bij enige groente- en aanverwante gewassen. Thesis,
Wageningen. Withrow, A.P., R.B. Withrow & J.P. Biebel, 1943. Inhibiting influence of the leaves on the
photoperiodical response of Nobel spinach. Plant Physiol. 18: 294-299. Wood, D.W. & R.K. Scott, 1975. Sowing sugar-beet in autumn in England. J. Agric. Sei. 84:
97-108. Yusubov, A.M., 1977. Bolting and the improvement of tetraploid sugar-beet in this respect.
SB. Nauch. Fr. Vseros Nil. Sakhar Svekly I Sakhara: 7 (2): 124-134. Zeevaart, J.A.D., 1971. Effects of photoperiod on growth rate and endogenous gibberellins
in the long-day rosette plant spinach. Plant Physiol. 47: 821-827. Zeevaart, J.A.D., 1976. Physiology of flower formation. Annu. Rev. Plant Physiol. 27:
321-348.
109